電気自動車充電インフラ市場レポート:2023-2033
Electric Vehicle Charging Infrastructure Market Report 2023-2033
レポート詳細
電気自動車充電インフラ市場レポート 2023-2033 :本レポートは、新たな収益の柱を目指す大手企業にとって、業界とその根底にある力学をより深く理解する上で貴重なものとなろう。異業種... もっと見る
※上記価格は部署ライセンス(Departmental licence)価格です。
その他の価格についてはデータリソースまでお問合せください。
日本語のページは自動翻訳を利用し作成しています。
実際のレポートは英文のみでご納品いたします。
サマリー
レポート詳細
電気自動車充電インフラ市場レポート 2023-2033:本レポートは、新たな収益の柱を目指す大手企業にとって、業界とその根底にある力学をより深く理解する上で貴重なものとなろう。異業種への進出や、新たな地域での既存事業の拡大を希望する企業にとっても有用であろう。
電気自動車普及の高まりが市場成長を牽引
電気自動車の人気の高まりが、電気自動車充電インフラの成長の主な原動力となっている。世界中の政府、企業、個人は、気候変動と闘い、化石燃料への依存を減らすために、持続可能な交通手段への移行の重要性を認識している。電気自動車を導入する消費者が増えるにつれ、信頼性が高く簡単に利用できる充電ステーションの需要が急増している。この需要を満たすため、政府や民間団体は電気自動車の普及を促進する充電ネットワークの拡大に投資している。
高い初期インフラコスト
EV充電インフラ市場における重要な課題の一つは、充電ステーションの設置や必要なインフラの構築に伴う初期コストの高さである。このコストには、機器の調達、設置、電気設備のアップグレード、グリッド接続などが含まれる。これらの費用は、特に充電インフラへの投資を検討している中小企業や組織にとって障壁となる可能性がある。しかし、市場が成長し規模が拡大し続ければ、規模の経済と技術の進歩により、これらのコストは時間の経過とともに削減されると予想される。さらに、官民間の協力やパートナーシップは、財政負担を分担し、充電インフラの展開を加速させるのに役立つ。
市場調査レポートを購入する前にすべき質問とは?
- 電気自動車充電インフラ市場はどのように進化しているのか?
- 電気自動車充電インフラ市場の推進要因と阻害要因は何か?
- 各電気自動車充電インフラサブマーケットセグメントは予測期間中にどのように成長し、2033年にどれくらいの売上を占めるのか?
- 2023年から2033年にかけて、各電気自動車充電インフラサブマーケットの市場シェアはどのように推移するのか?
- 2023年から2033年にかけての市場全体の主な牽引役は何か?
- 主要な電気自動車充電インフラ市場はマクロ経済の動きに大枠で追随するのか、それとも個々の国内市場が他を凌駕するのか。
- 2033年までに各国市場のシェアはどのように変化し、2033年に市場をリードするのはどの地域か?
- 主要プレーヤーは誰で、予測期間中の見通しは?
- 主要企業の電気自動車充電インフラ・プロジェクトとは?
- 2023年から2033年の間に、業界はどのように発展していくのか?現在および今後10年間に実施される電気自動車充電インフラプロジェクトにはどのような意味があるのか?
- 電気自動車充電インフラ市場をさらに拡大するために、製品の商業化の必要性は高まっているか?
- 電気自動車充電インフラ市場はどこに向かっているのか、そしてどのようにすれば市場の最前線に立つことができるのか?
- 新製品やサービスラインに対する最適な投資オプションは何か?
- 企業を新たな成長軌道に乗せ、C-suiteに移行させるための重要な展望とは?
電気自動車充電インフラ市場に現在、そして今後10年間、どのような影響を与えるかを見極める必要がある:
- 400ページにわたる本レポートでは、143の表と203の図表を掲載しています。
- 本レポートでは、業界における主要な有利分野をハイライトしているため、今すぐターゲットを絞ることができます。
- 世界、地域、国の売上と成長に関する詳細な分析が含まれています。
- 競合他社が成功した主なトレンド、変化、収益予測をハイライトしています。
本レポートは、電気自動車充電インフラ市場が今後10年間でどのように発展するか、またCOVID-19の景気後退と好転の変動に合わせてどのように発展するかをお伝えします。この市場は、過去10年間のどの時点よりも今が重要である。
2033年までの予測やその他の分析から、商業的な展望が明らかになる
- 2033年までの収益予測に加え、直近の業績、成長率、市場シェアもご覧いただけます。
- ビジネスの展望と展開に関する独自の分析をご覧いただけます。
- 定性的分析(市場ダイナミクス、促進要因、機会、阻害要因、課題を含む)、コスト構造、電気自動車充電インフラ価格上昇の影響、最近の動向をご覧いただけます。
本レポートには、COVID-19が業界と貴社にどのような影響を与えるかについてのデータ分析と貴重な洞察が含まれている。本レポートでは、COVID-19の4つの回収パターンとその影響、すなわち「V」、「L」、「W」、「U」について論じている。
レポート対象セグメント
サービス別市場セグメント
- EV充電サービス
- バッテリー交換サービス
充電レベル別市場セグメント
- レベル1
- レベル2
- レベル3
用途別市場セグメント
- プライベート
- セミパブリック
- 公共
- 商用
充電タイプ別市場セグメント
- 低速DC(49kW未満)
- 急速DC(50~149キロワット)
- レベル1超高速DC(150~349 kW)
- レベル2超高速DC(349 kW超)
- その他の充電タイプ
インフラタイプ別市場セグメント
- 普通充電
- タイプ2
- CCS
- CHAdeMO
- テスラSC
- GB/T 急速
世界市場全体とセグメント別の収益予測に加え、4つの地域と20の主要国市場の収益予測も掲載しています:
北米
- アメリカ
- カナダ
欧州
- ドイツ
- ノルウェー
- イギリス
- フランス
- オランダ
- その他の欧州
アジア太平洋
- 中国
- 日本
- インド
- オーストラリア
- 韓国
- その他のアジア太平洋地域
ラテンアメリカ
- ブラジル
- メキシコ
- その他のラテンアメリカ
中東・アフリカ
- GCC
- 南アフリカ
- その他の中東・アフリカ
本レポートには、電気自動車充電インフラ市場の2023年から2033年にかけての主要企業のプロファイルも含まれており、これらの企業の事業のこのセグメントに焦点を当てている。
本レポートに掲載されている主要企業
・ ABB Ltd.
・ AeroVironment, Inc.
・ Chargemaster Limited
・ ChargePoint, Inc.
・ ClipperCreek
・ Delta Electronics
・ Eaton Corporation plc
・ General Electric Company (GE)
・ Leviton Manufacturing Company, Inc.
・ Schneider Electric SE
・ SemaConnect
・ Siemens AG
・ Tesla, Inc.
・ Webasto SE
2023年から2033年までの電気自動車充電インフラ市場全体の世界売上高(金額ベース)は、2023年に268億米ドルを突破する。2033年まで力強い収益成長を予測。当調査では、最も大きな可能性を秘めた組織を特定しています。彼らの能力、進歩、商業的展望を発見し、一歩先を行くお手伝いをします。
電気自動車充電インフラ市場、2023-2033年レポートはどのようにお役に立つでしょうか?
要約すると、400ページに及ぶこのレポートは、以下のような知識を提供する:
- 電気自動車充電インフラ市場の2023年から2033年までの収益予測 充電タイプ、インフラタイプ、サービス、充電レベル、アプリケーションの各予測を世界および地域レベルで掲載 - 業界の将来性を発見し、投資と収益に最も有利な場所を見つけます。
- 4つの地域と20の主要国市場の2033年までの収益予測 - 北米、欧州、アジア太平洋、中南米、中東・アフリカの電気自動車充電インフラ市場の2023年から2033年までの予測をご覧ください。また、米国、カナダ、ブラジル、ドイツ、フランス、英国、ノルウェー、中国、インド、日本、オーストラリアなどの主要国の市場も予測しています。
- 既存企業および市場参入を目指す企業の展望 - 電気自動車充電インフラ市場に関わる主要企業15社の企業プロファイルを含む、2023年から2033年までの展望。
独自の予測による定量的・定性的分析をご覧ください。私たちのレポートだけに含まれる情報を入手し、貴重なビジネスインテリジェンスで情報を得ることができます。
他にはない情報
私たちの新しいレポートがあれば、知識に遅れをとったり、チャンスを逃したりする可能性が低くなります。弊社の調査レポートが貴社の調査、分析、意思決定にどのように役立つかをご覧ください。Visiongainの調査は、電気自動車充電インフラ市場、2023年から2033年、市場をリードする企業の商業分析を必要とするすべての人のためのものです。データ、トレンド、予測をご覧いただけます。
ページTOPに戻る
目次
目次
1 レポート概要
1.1 調査の目的
1.2 電気自動車充電インフラ市場の紹介
1.3 本レポートの内容
1.4 本レポートを読むべき理由
1.5 本分析レポートが回答する主な質問
1.6 本レポートの対象者
1.7 調査方法
1.7.1 市場の定義
1.7.2 市場評価・予測手法
1.7.3 データ検証
1.7.3.1 一次調査
1.7.3.2 セカンダリーリサーチ
1.8 よくある質問(FAQ)
1.9 Visiongainの関連レポート
1.10 Visiongainについて
2 エグゼクティブ・サマリー
2.1 セグメント分析
2.1.1 サービスセグメント市場魅力度指数
2.1.2 充電レベルセグメント市場魅力度指数
2.1.3 アプリケーションセグメント市場魅力度指数
2.1.4 充電タイプセグメント市場魅力度指数市場魅力度指数
2.1.5 インフラタイプセグメント市場魅力度指数市場魅力度指数
2.2 地域別分析
3 市場概要
3.1 主要な調査結果
3.2 市場ダイナミクス
3.2.1 市場促進要因
3.2.1.1 政府の取り組みと奨励金
3.2.1.2 電気自動車販売の成長
3.2.1.3 技術進歩が市場形成に重要な役割を果たす
3.2.2 市場の阻害要因
3.2.2.1 高い初期インフラコスト
3.2.2.2 電力需要の増加に対応できない限られた送電網容量
3.2.2.3 航続距離への不安と充電時間
3.2.3 市場機会
3.2.3.1 再生可能エネルギー源の統合
3.2.3.2 急速充電ネットワークの拡大
3.2.3.3 スマートグリッドの統合とデマンドレスポンス
3.3 COVID-19の影響分析
3.3.1 V字型回復
3.3.2 W字型回復
3.3.3 U字型回復
3.3.4 L字型回復
3.4 ポーターのファイブフォース分析
3.4.1 サプライヤーの交渉力(高)
3.4.2 買い手の交渉力(中〜高)
3.4.3 競争力(高)
3.4.4 代替品による脅威(低)
3.4.5 新規参入企業の脅威(中)
3.5 PEST分析
3.5.1 政治的要因
3.5.2 経済的要因
3.5.3 社会的/文化的要因
3.5.4 技術的要因
4 電気自動車充電インフラ市場分析:サービス別
4.1 主要調査結果
4.2 サービスセグメント 市場魅力度指数
4.3 電気自動車充電インフラのサービス別市場規模推定と予測
4.4 EV充電
4.4.1 2023〜2033年の地域別市場規模(US$ Billion)
4.4.2 地域別市場シェア、2023年・2033年(%)
4.5 バッテリースワップ
4.5.1 2023~2033年の地域別市場規模(US$ Billion)
4.5.2 地域別市場シェア、2023年・2033年(%)
5 電気自動車充電インフラ市場分析:充電レベル別
5.1 主要調査結果
5.2 充電レベル別セグメント市場魅力度指数
5.3 充電レベル別電気自動車充電インフラ市場規模の推定と予測
5.4 レベル1
5.4.1 2023〜2033年の地域別市場規模(US$ Billion)
5.4.2 地域別市場シェア、2023年・2033年(%)
5.5 レベル2
5.5.1 2023〜2033年の地域別市場規模(US$ Billion)
5.5.2 地域別市場シェア、2023年・2033年(%)
5.6 レベル3
5.6.1 2023〜2033年の地域別市場規模(US$ Billion)
5.6.2 地域別市場シェア、2023年・2033年(%)
6 電気自動車充電インフラ市場分析:用途別
6.1 主要調査結果
6.2 アプリケーションセグメント 市場魅力度指数
6.3 電気自動車充電インフラの用途別市場規模推定と予測
6.4 プライベート
6.4.1 2023〜2033年の地域別市場規模(US$ Billion)
6.4.2 地域別市場シェア、2023年・2033年(%)
6.5 セミパブリック
6.5.1 2023~2033年の地域別市場規模(US$ Billion)
6.5.2 地域別市場シェア、2023年・2033年(%)
6.6 公共
6.6.1 2023〜2033年の地域別市場規模(US$ Billion)
6.6.2 地域別市場シェア、2023年・2033年(%)
6.7 商業
6.7.1 2023〜2033年の地域別市場規模(US$ Billion)
6.7.2 地域別市場シェア、2023年・2033年(%)
7 電気自動車充電インフラ市場分析:充電タイプ別
7.1 主要調査結果
7.2 充電タイプセグメント 市場魅力度指数
7.3 充電タイプ別電気自動車充電インフラ市場規模の推定と予測
7.4 低速DC
7.4.1 2023〜2033年の地域別市場規模(US$ Billion)
7.4.2 地域別市場シェア、2023年・2033年(%)
7.5 高速DC
7.5.1 2023~2033年の地域別市場規模(US$ Billion)
7.5.2 地域別市場シェア、2023年・2033年(%)
7.6 レベル1超高速DC
7.6.1 2023~2033年の地域別市場規模(US$ Billion)
7.6.2 地域別市場シェア、2023年・2033年(%)
7.7 レベル2超高速DC
7.7.1 2023~2033年の地域別市場規模(US$ Billion)
7.7.2 地域別市場シェア、2023年・2033年(%)
7.8 その他の充電タイプ
7.8.1 2023〜2033年の地域別市場規模(US$ Billion)
7.8.2 地域別市場シェア、2023年・2033年(%)
8 電気自動車充電インフラ市場分析:インフラタイプ別
8.1 主要調査結果
8.2 インフラタイプ別セグメント 市場魅力度指数
8.3 電気自動車充電インフラのインフラタイプ別市場規模推定と予測
8.4 通常充電
8.4.1 2023〜2033年の地域別市場規模(US$ Billion)
8.4.2 地域別市場シェア、2023年・2033年(%)
8.5 タイプ2
8.5.1 2023~2033年の地域別市場規模(US$ Billion)
8.5.2 地域別市場シェア、2023年・2033年(%)
8.6 CSS
8.6.1 2023〜2033年の地域別市場規模(US$ Billion)
8.6.2 地域別市場シェア、2023年・2033年(%)
8.7 CHAdeMO
8.7.1 2023年~2033年の地域別市場規模(US$ Billion)
8.7.2 地域別市場シェア、2023年・2033年(%)
8.8 テスラSC
8.8.1 2023~2033年の地域別市場規模(US$ Billion)
8.8.2 地域別市場シェア、2023年・2033年(%)
8.9 GB/T
8.9.1 2023~2033年の地域別市場規模(US$ Billion)
8.10 地域別市場シェア、2023年・2033年(%)
9 電気自動車充電インフラ市場分析:地域別
9.1 主要な調査結果
9.2 地域別市場規模の推定と予測
10 北米の電気自動車充電インフラ市場分析
10.1 主要調査結果
10.2 北米の電気自動車充電インフラ市場魅力度指数
10.3 北米の電気自動車充電インフラ市場:国別、2023年、2028年、2033年(US$ Billion)
10.4 北米の電気自動車充電インフラ市場規模推定と予測:金額ベース
10.5 北米の電気自動車充電インフラ市場規模推定と予測:国別
10.6 北米の電気自動車充電インフラ市場規模推定と予測:サービス別
10.7 北米の電気自動車充電インフラ市場規模推定と予測:充電レベル別
10.8 北米の電気自動車充電インフラ市場規模推定と予測:用途別
10.9 北米の電気自動車充電インフラ市場規模推定と予測:充電タイプ別
10.10 北米の電気自動車充電インフラ市場規模推定と予測:インフラタイプ別
10.11 米国の電気自動車充電インフラ市場
10.12 カナダの電気自動車充電インフラ市場
11 欧州の電気自動車充電インフラ市場分析
11.1 主要な調査結果
11.2 欧州電気自動車充電インフラ市場魅力度指数
11.3 欧州の電気自動車充電インフラ市場:国別、2023年、2028年、2033年(US$ Billion)
11.4 欧州の電気自動車充電インフラ市場規模推定と予測:金額ベース
11.5 欧州の電気自動車充電インフラ市場:国別
11.6 欧州の電気自動車充電インフラ市場:サービス別
11.7 欧州の電気自動車充電インフラ市場:充電レベル別
11.8 欧州の電気自動車充電インフラ市場:用途別
11.9 欧州の電気自動車充電インフラ市場:充電タイプ別
11.10 欧州の電気自動車充電インフラ市場:インフラタイプ別
11.11 ドイツの電気自動車充電インフラ市場
11.12 英国の電気自動車充電インフラ市場
11.13 フランスの電気自動車充電インフラ市場
11.14 ノルウェーの電気自動車充電インフラ市場
11.15 オランダの電気自動車充電インフラ市場
11.16 その他の欧州電気自動車充電インフラ市場
12 アジア太平洋地域の電気自動車充電インフラ市場分析
12.1 主要な調査結果
12.2 アジア太平洋地域の電気自動車充電インフラ市場魅力度指数
12.3 アジア太平洋地域の電気自動車充電インフラ市場:国別、2023年、2028年、2033年(US$ Billion)
12.4 アジア太平洋地域の電気自動車充電インフラ市場規模推定と予測:金額ベース
12.5 アジア太平洋地域の電気自動車充電インフラ市場:国別
12.6 アジア太平洋地域の電気自動車充電インフラ市場:サービス別
12.7 アジア太平洋地域の電気自動車充電インフラ市場:充電レベル別
12.8 アジア太平洋地域の電気自動車充電インフラ市場:用途別
12.9 アジア太平洋地域の電気自動車充電インフラ市場:充電タイプ別
12.10 アジア太平洋地域の電気自動車充電インフラ市場:インフラタイプ別
12.11 中国の電気自動車充電インフラ市場
12.12 インドの電気自動車充電インフラ市場
12.13 日本の電気自動車充電インフラ市場
12.14 韓国の電気自動車充電インフラ市場
12.15 オーストラリアの電気自動車充電インフラ市場
12.16 その他のアジア太平洋地域の電気自動車充電インフラ市場
13 中東・アフリカの電気自動車充電インフラ市場分析
13.1 主要な調査結果
13.2 中東・アフリカの電気自動車充電インフラ市場魅力度指数
13.3 中東・アフリカの電気自動車充電インフラ市場:国別、2023年、2028年、2033年(US$ Billion)
13.4 中東・アフリカの電気自動車充電インフラ市場規模推定と予測:金額ベース
13.5 中東・アフリカの電気自動車充電インフラ市場:国別
13.6 中東・アフリカの電気自動車充電インフラ市場:サービス別
13.7 中東・アフリカの電気自動車充電インフラ市場:充電レベル別
13.8 中東・アフリカの電気自動車充電インフラ市場:用途別
13.9 中東・アフリカの電気自動車充電インフラ市場:充電タイプ別
13.10 中東・アフリカの電気自動車充電インフラ市場:インフラタイプ別
13.11 GCCの電気自動車充電インフラ市場
13.12 南アフリカの電気自動車充電インフラ市場
13.13 その他の中東・アフリカの電気自動車充電インフラ市場
14 ラテンアメリカの電気自動車充電インフラ市場分析
14.1 主要調査結果
14.2 ラテンアメリカの電気自動車充電インフラ市場魅力度指数
14.3 ラテンアメリカの電気自動車充電インフラ市場:国別、2023年、2028年、2033年(US$ Billion)
14.4 ラテンアメリカの電気自動車充電インフラ市場規模推定と予測:金額ベース
14.5 ラテンアメリカの電気自動車充電インフラ市場:国別
14.6 ラテンアメリカの電気自動車充電インフラ市場:サービス別
14.7 ラテンアメリカの電気自動車充電インフラ市場:充電レベル別
14.8 ラテンアメリカの電気自動車充電インフラ市場:用途別
14.9 ラテンアメリカの電気自動車充電インフラ市場:充電タイプ別
14.10 ラテンアメリカの電気自動車充電インフラ市場:インフラタイプ別
14.11 ブラジルの電気自動車充電インフラ市場
14.12 メキシコの電気自動車充電インフラ市場
14.13 その他のラテンアメリカの電気自動車充電インフラ市場
15 会社概要
15.1 競争環境、2022年
15.2 戦略的展望
15.3 Electrify America LLC
15.4 会社概要
15.4.1 会社概要
15.4.2 製品ベンチマーク
15.4.3 戦略的展望
15.5 Delta Electronics
15.5.1 会社概要
15.5.2 会社概要
15.5.3 製品ベンチマーク
15.5.4 戦略的展望
15.6 Webasto SE
15.6.1 会社概要
15.6.2 会社概要
15.6.3 製品ベンチマーク
15.6.4 戦略的展望
15.7 Tesla, Inc
15.7.1 会社概要
15.7.2 会社概要
15.7.3 財務分析
15.7.3.1 純収入、2018-2022年
15.7.3.2 R&D、2018年~2022年
15.7.3.3 地域別収益シェア、2022年(%)
15.7.3.4 事業セグメント収益シェア、2022年(%)
15.7.4 製品ベンチマーク
15.7.5 戦略的展望
15.8 Siemens AG
15.8.1 会社概要
15.8.2 会社概要
15.8.3 財務分析
15.8.3.1 純収入、2018-2022年
15.8.3.2 R&D、2018年~2022年
15.8.3.3 地域別収益シェア、2022年(%)
15.8.3.4 事業セグメント収益シェア、2022年(%)
15.8.4 製品ベンチマーク
15.8.5 戦略的展望
15.9 Schneider Electric SE
15.9.1 会社概要
15.9.2 会社概要
15.9.3 財務分析
15.9.3.1 純収入、2018-2022年
15.9.3.2 R&D、2018年~2022年
15.9.3.3 地域別収益シェア、2022年(%)
15.9.3.4 事業セグメント収益シェア、2022年(%)
15.9.4 製品ベンチマーク
15.9.5 戦略的展望
15.10 ABB Ltd
15.10.1 会社概要
15.10.2 会社概要
15.10.3 財務分析
15.10.3.1 純収入、2018年~2022年
15.10.3.2 R&D、2018年~2022年
15.10.3.3 事業セグメント収益シェア、2022年(%)
15.10.4 製品ベンチマーク
15.10.5 戦略的展望
15.11 AeroVironment, Inc.
15.11.1 会社概要
15.11.2 会社概要
15.11.3 財務分析
15.11.3.1 純収入、2018-2022年
15.11.3.2 R&D、2018年〜2022年
15.11.3.3 地域別収益シェア、2022年(%)
15.11.3.4 事業セグメント収益シェア、2022年(%)
15.11.4 製品ベンチマーク
15.12 Eaton Corporation plc
15.12.1 会社概要
15.12.2 会社概要
15.12.3 財務分析
15.12.3.1 純収入、2018-2022年
15.12.3.2 R&D、2018-2022年
15.12.3.3 地域別収入シェア、2022年(%)
15.12.3.4 事業セグメント収益シェア、2022年(%)
15.12.4 製品ベンチマーク
15.12.5 戦略的展望
15.13 General Electric Company
15.13.1 会社概要
15.13.2 会社概要
15.13.3 財務分析
15.13.3.1 純収入、2018-2022年
15.13.3.2 R&D、2018年~2022年
15.13.3.3 地域別収益シェア、2022年(%)
15.13.3.4 事業セグメント収益シェア、2022年(%)
15.13.4 製品ベンチマーク
15.13.5 戦略的展望
15.14 Leviton Manufacturing Company, Inc.
15.14.1 会社概要
15.14.2 会社概要
15.14.3 製品ベンチマーク
15.14.4 戦略的展望
15.15Chargemaster Limited
15.15.1 会社概要
15.15.2 会社概要
15.15.3 製品ベンチマーク
15.15.4 戦略的展望
15.16 Enphase Energy, Inc.
15.16.1 会社概要
15.16.2 会社概要
15.16.3 製品ベンチマーク
15.16.4 戦略的展望
15.17 ChargePoint Holdings, Inc.
15.17.1 会社概要
15.17.2 会社概要
15.17.3 財務分析
15.17.3.1 純収入、2018-2022年
15.17.3.2 R&D(2018年~2022年
15.17.3.3 事業セグメント収益シェア、2022年(%)
15.17.4 製品ベンチマーク
15.17.5 戦略的展望
15.18 SemaConnect
15.18.1 会社概要
15.18.2 会社概要
15.18.3 製品ベンチマーク
15.18.4 戦略的展望
16 結論と提言
16.1 Visiongainからの結びの言葉
16.2 市場プレイヤーへの提言
ページTOPに戻る
図表リスト
表の一覧
Table 1 Electric Vehicle Charging Infrastructure Market Snapshot, 2023 & 2033 (US$ Billion, CAGR %)
Table 2 Global Electric Vehicle Sales, 2022
Table 3 EV Charging Station Infrastructure Cost Analysis, 2022
Table 4 Global Electric Vehicle Charging Infrastructure Market Forecast, 2023-2033 (US$ Bn, AGR (%), CAGR (%)) (V-Shaped Recovery Scenario)
Table 5 Global Electric Vehicle Charging Infrastructure Market by Region, 2023-2033 (US$ Bn, AGR (%), CAGR (%)) (V-Shaped Recovery Scenario)
Table 6 Global Electric Vehicle Charging Infrastructure Market Forecast, 2023-2033 (US$ Bn, AGR (%), CAGR (%)) (W-Shaped Recovery Scenario)
Table 7 Global Electric Vehicle Charging Infrastructure Market by Region, 2023-2033 (US$ Bn, AGR (%), CAGR (%)) (W-Shaped Recovery Scenario)
Table 8 Global Electric Vehicle Charging Infrastructure Market Forecast, 2023-2033 (US$ Bn, AGR (%), CAGR (%)) (U-Shaped Recovery Scenario)
Table 9 Global Electric Vehicle Charging Infrastructure Market by Region, 2023-2033 (US$ Bn, AGR (%), CAGR (%)) (U-Shaped Recovery Scenario)
Table 10 Global Electric Vehicle Charging Infrastructure Market Forecast, 2023-2033 (US$ Bn, AGR (%), CAGR (%)) (L-Shaped Recovery Scenario)
Table 11 Global Electric Vehicle Charging Infrastructure Market by Region, 2023-2033 (US$ Bn, AGR (%), CAGR (%)) (L-Shaped Recovery Scenario)
Table 12 Global Electric Vehicle Charging Infrastructure Market by Service, 2023-2033 (US$ Bn, AGR (%), CAGR (%))
Table 13 EV Charging Service Market by Region, 2023-2033 (US$ Bn, AGR (%), CAGR (%))
Table 14 Battery Swapping Service Market by Region, 2023-2033 (US$ Bn, AGR (%), CAGR (%))
Table 15 Global Electric Vehicle Charging Infrastructure Market by Level of Charging, 2023-2033 (US$ Bn, AGR (%), CAGR (%))
Table 16 Level 1 Market by Region, 2023-2033 (US$ Bn, AGR (%), CAGR (%))
Table 17 Level 2 Market by Region, 2023-2033 (US$ Bn, AGR (%), CAGR (%))
Table 18 Level 3 Market by Region, 2023-2033 (US$ Bn, AGR (%), CAGR (%))
Table 19 Global Electric Vehicle Charging Infrastructure Market by Application, 2023-2033 (US$ Bn, AGR (%), CAGR (%))
Table 20 Private Market by Region, 2023-2033 (US$ Bn, AGR (%), CAGR (%))
Table 21 Semi-Public Market by Region, 2023-2033 (US$ Bn, AGR (%), CAGR (%))
Table 22 Public Market by Region, 2023-2033 (US$ Bn, AGR (%), CAGR (%))
Table 23 Commercial Market by Region, 2023-2033 (US$ Bn, AGR (%), CAGR (%))
Table 24 Global Electric Vehicle Charging Infrastructure Market by Charging Type, 2023-2033 (US$ Bn, AGR (%), CAGR (%))
Table 25 Slow DC (349 kW) Market by Region, 2023-2033 (US$ Bn, AGR (%), CAGR (%))
Table 29 Other Charging Type Market by Region, 2023-2033 (US$ Bn, AGR (%), CAGR (%))
Table 30 Global Electric Vehicle Charging Infrastructure Market by Infrastructure Type, 2023-2033 (US$ Bn, AGR (%), CAGR (%))
Table 31 Normal Charging Market by Region, 2023-2033 (US$ Bn, AGR (%), CAGR (%))
Table 32 Type 2 Market by Region, 2023-2033 (US$ Bn, AGR (%), CAGR (%))
Table 33 CCS Market by Region, 2023-2033 (US$ Bn, AGR (%), CAGR (%))
Table 34 CHAdeMO Market by Region, 2023-2033 (US$ Bn, AGR (%), CAGR (%))
Table 35 Tesla SC Market by Region, 2023-2033 (US$ Bn, AGR (%), CAGR (%))
Table 36 GB/T Fast Market by Region, 2023-2033 (US$ Bn, AGR (%), CAGR (%))
Table 37 Global Electric Vehicle Charging Infrastructure Market Forecast, 2023-2033 (US$ Bn, AGR (%), CAGR (%))
Table 38 Global Electric Vehicle Charging Infrastructure Market by Region, 2023-2033 (US$ Bn, AGR (%), CAGR (%))
Table 39 Global Electric Vehicle Charging Infrastructure Market by Service, 2023-2033 (US$ Bn, AGR (%), CAGR (%))
Table 40 Global Electric Vehicle Charging Infrastructure Market by Level of Charging, 2023-2033 (US$ Bn, AGR (%), CAGR (%))
Table 41 Global Electric Vehicle Charging Infrastructure Market by Application, 2023-2033 (US$ Bn, AGR (%), CAGR (%))
Table 42 Global Electric Vehicle Charging Infrastructure Market by Charging Type, 2023-2033 (US$ Bn, AGR (%), CAGR (%))
Table 43 Global Electric Vehicle Charging Infrastructure Market by Infrastructure Type, 2023-2033 (US$ Bn, AGR (%), CAGR (%))
Table 44 North America Electric Vehicle Charging Infrastructure Market by Value, 2023-2033 (US$ Bn, AGR (%), CAGR (%))
Table 45 North America Electric Vehicle Charging Infrastructure Market by Country, 2023-2033 (US$ Bn, AGR (%), CAGR (%))
Table 46 North America Electric Vehicle Charging Infrastructure Market by Service, 2023-2033 (US$ Bn, AGR (%), CAGR (%))
Table 47 North America Electric Vehicle Charging Infrastructure Market by Level of Charging, 2023-2033 (US$ Bn, AGR (%), CAGR (%))
Table 48 North America Electric Vehicle Charging Infrastructure Market by Application, 2023-2033 (US$ Bn, AGR (%), CAGR (%))
Table 49 North America Electric Vehicle Charging Infrastructure Market by Charging Type, 2023-2033 (US$ Bn, AGR (%), CAGR (%))
Table 50 North America Electric Vehicle Charging Infrastructure Market by Infrastructure Type, 2023-2033 (US$ Bn, AGR (%), CAGR (%))
Table 51 US Electric Vehicle Charging Infrastructure Market by Value, 2023-2033 (US$ Bn, AGR (%), CAGR (%))
Table 52 Canada Electric Vehicle Charging Infrastructure Market by Value, 2023-2033 (US$ Bn, AGR (%), CAGR (%))
Table 53 Europe Electric Vehicle Charging Infrastructure Market by Value, 2023-2033 (US$ Bn, AGR (%), CAGR (%))
Table 54 Europe Electric Vehicle Charging Infrastructure Market by Country, 2023-2033 (US$ Bn, AGR (%), CAGR (%))
Table 55 Europe Electric Vehicle Charging Infrastructure Market by Service, 2023-2033 (US$ Bn, AGR (%), CAGR (%))
Table 56 Europe Electric Vehicle Charging Infrastructure Market by Level of Charging, 2023-2033 (US$ Bn, AGR (%), CAGR (%))
Table 57 Europe Electric Vehicle Charging Infrastructure Market by Application, 2023-2033 (US$ Bn, AGR (%), CAGR (%))
Table 58 Europe Electric Vehicle Charging Infrastructure Market by Charging Type, 2023-2033 (US$ Bn, AGR (%), CAGR (%))
Table 59 Europe Electric Vehicle Charging Infrastructure Market by Infrastructure Type, 2023-2033 (US$ Bn, AGR (%), CAGR (%))
Table 60 Germany Electric Vehicle Charging Infrastructure Market by Value, 2023-2033 (US$ Bn, AGR (%), CAGR (%))
Table 61 UK Electric Vehicle Charging Infrastructure Market by Value, 2023-2033 (US$ Bn, AGR (%), CAGR (%))
Table 62 France Electric Vehicle Charging Infrastructure Market by Value, 2023-2033 (US$ Bn, AGR (%), CAGR (%))
Table 63 Norway Electric Vehicle Charging Infrastructure Market by Value, 2023-2033 (US$ Bn, AGR (%), CAGR (%))
Table 64 Netherlands Electric Vehicle Charging Infrastructure Market by Value, 2023-2033 (US$ Bn, AGR (%), CAGR (%))
Table 65 Rest of Europe Electric Vehicle Charging Infrastructure Market by Value, 2023-2033 (US$ Bn, AGR (%), CAGR (%))
Table 66 Asia-Pacific Electric Vehicle Charging Infrastructure Market by Value, 2023-2033 (US$ Bn, AGR (%), CAGR (%))
Table 67 Asia-Pacific Electric Vehicle Charging Infrastructure Market by Country, 2023-2033 (US$ Bn, AGR (%), CAGR (%))
Table 68 Asia-Pacific Electric Vehicle Charging Infrastructure Market by Service, 2023-2033 (US$ Bn, AGR (%), CAGR (%))
Table 69 Asia-Pacific Electric Vehicle Charging Infrastructure Market by Level of Charging, 2023-2033 (US$ Bn, AGR (%), CAGR (%))
Table 70 Asia-Pacific Electric Vehicle Charging Infrastructure Market by Application, 2023-2033 (US$ Bn, AGR (%), CAGR (%))
Table 71 Asia-Pacific Electric Vehicle Charging Infrastructure Market by Charging Type, 2023-2033 (US$ Bn, AGR (%), CAGR (%))
Table 72 Asia-Pacific Electric Vehicle Charging Infrastructure Market by Infrastructure Type, 2023-2033 (US$ Bn, AGR (%), CAGR (%))
Table 73 China Electric Vehicle Charging Infrastructure Market by Value, 2023-2033 (US$ Bn, AGR (%), CAGR (%))
Table 74 India Electric Vehicle Charging Infrastructure Market by Value, 2023-2033 (US$ Bn, AGR (%), CAGR (%))
Table 75 Japan Electric Vehicle Charging Infrastructure Market by Value, 2023-2033 (US$ Bn, AGR (%), CAGR (%))
Table 76 South Korea Electric Vehicle Charging Infrastructure Market by Value, 2023-2033 (US$ Bn, AGR (%), CAGR (%))
Table 77 Australia Electric Vehicle Charging Infrastructure Market by Value, 2023-2033 (US$ Bn, AGR (%), CAGR (%))
Table 78 Rest of Asia-Pacific Electric Vehicle Charging Infrastructure Market by Value, 2023-2033 (US$ Bn, AGR (%), CAGR (%))
Table 79 Middle East & Africa Electric Vehicle Charging Infrastructure Market by Value, 2023-2033 (US$ Bn, AGR (%), CAGR (%))
Table 80 Middle East & Africa Electric Vehicle Charging Infrastructure Market by Country, 2023-2033 (US$ Bn, AGR (%), CAGR (%))
Table 81 Middle East & Africa Electric Vehicle Charging Infrastructure Market by Service, 2023-2033 (US$ Bn, AGR (%), CAGR (%))
Table 82 Middle East & Africa Electric Vehicle Charging Infrastructure Market by Level of Charging, 2023-2033 (US$ Bn, AGR (%), CAGR (%))
Table 83 Middle East & Africa Electric Vehicle Charging Infrastructure Market by Application, 2023-2033 (US$ Bn, AGR (%), CAGR (%))
Table 84 Middle East & Africa Electric Vehicle Charging Infrastructure Market by Charging Type, 2023-2033 (US$ Bn, AGR (%), CAGR (%))
Table 85 Middle East & Africa Electric Vehicle Charging Infrastructure Market by Infrastructure Type, 2023-2033 (US$ Bn, AGR (%), CAGR (%))
Table 86 GCC Electric Vehicle Charging Infrastructure Market by Value, 2023-2033 (US$ Bn, AGR (%), CAGR (%))
Table 87 South Africa Electric Vehicle Charging Infrastructure Market by Value, 2023-2033 (US$ Bn, AGR (%), CAGR (%))
Table 88 Rest of Middle East & Africa Electric Vehicle Charging Infrastructure Market by Value, 2023-2033 (US$ Bn, AGR (%), CAGR (%))
Table 89 Latin America Electric Vehicle Charging Infrastructure Market by Value, 2023-2033 (US$ Bn, AGR (%), CAGR (%))
Table 90 Latin America Electric Vehicle Charging Infrastructure Market by Country, 2023-2033 (US$ Bn, AGR (%), CAGR (%))
Table 91 Latin America Electric Vehicle Charging Infrastructure Market by Service, 2023-2033 (US$ Bn, AGR (%), CAGR (%))
Table 92 Latin America Electric Vehicle Charging Infrastructure Market by Level of Charging, 2023-2033 (US$ Bn, AGR (%), CAGR (%))
Table 93 Latin America Electric Vehicle Charging Infrastructure Market by Application, 2023-2033 (US$ Bn, AGR (%), CAGR (%))
Table 94 Latin America Electric Vehicle Charging Infrastructure Market by Charging Type, 2023-2033 (US$ Bn, AGR (%), CAGR (%))
Table 95 Latin America Electric Vehicle Charging Infrastructure Market by Infrastructure Type, 2023-2033 (US$ Bn, AGR (%), CAGR (%))
Table 96 Brazil Electric Vehicle Charging Infrastructure Market by Value, 2023-2033 (US$ Bn, AGR (%), CAGR (%))
Table 97 Mexico Electric Vehicle Charging Infrastructure Market by Value, 2023-2033 (US$ Bn, AGR (%), CAGR (%))
Table 98 Rest of Latin America Electric Vehicle Charging Infrastructure Market by Value, 2023-2033 (US$ Bn, AGR (%), CAGR (%))
Table 99 Strategic Outlook
Table 100 Electrify America LLC Key Details, (CEO, HQ, Revenue, Founded, No. of Employees, Company Type, Website, Business Segment)
Table 101 Electrify America LLC: Product Benchmarking
Table 102 Electrify America LLC: Strategic Outlook
Table 103 Delta Electronics Key Details, (CEO, HQ, Revenue, Founded, No. of Employees, Company Type, Website, Business Segment)
Table 104 Delta Electronics: Product Benchmarking
Table 105 Delta Electronics: Strategic Outlook
Table 106 Webasto SE Key Details, (CEO, HQ, Revenue, Founded, No. of Employees, Company Type, Website, Business Segment)
Table 107 Webasto SE : Product Benchmarking
Table 108 Webasto SE :Strategic Outlook
Table 109 Tesla, Inc Key Details, (CEO, HQ, Revenue, Founded, No. of Employees, Company Type, Website, Business Segment)
Table 110 Tesla, Inc: Product Benchmarking
Table 111 Tesla, Inc: Strategic Outlook
Table 112 Siemens AG Key Details, (CEO, HQ, Revenue, Founded, No. of Employees, Company Type, Website, Business Segment)
Table 113 Siemens AG: Product Benchmarking
Table 114 Siemens AG: Strategic Outlook
Table 115 Schneider Electric SE Key Details, (CEO, HQ, Revenue, Founded, No. of Employees, Company Type, Website, Business Segment)
Table 116 Schneider Electric SE: Product Benchmarking
Table 117 Schneider Electric SE: Strategic Outlook
Table 118 ABB Ltd Key Details, (CEO, HQ, Revenue, Founded, No. of Employees, Company Type, Website, Business Segment)
Table 119 ABB Ltd: Product Benchmarking
Table 120 ABB Ltd: Strategic Outlook
Table 121 AeroVironment, Inc Key Details, (CEO, HQ, Revenue, Founded, No. of Employees, Company Type, Website, Business Segment)
Table 122 AeroVironment, Inc: Product Benchmarking
Table 123 Eaton Corporation plc Key Details, (CEO, HQ, Revenue, Founded, No. of Employees, Company Type, Website, Business Segment)
Table 124 Eaton Corporation plc: Product Benchmarking
Table 125 Eaton Corporation plc: Strategic Outlook
Table 126 General Electric Company Key Details, (CEO, HQ, Revenue, Founded, No. of Employees, Company Type, Website, Business Segment)
Table 127 General Electric Company: Product Benchmarking
Table 128 General Electric Company: Strategic Outlook
Table 129 Leviton Manufacturing Company, Inc. Key Details, (CEO, HQ, Revenue, Founded, No. of Employees, Company Type, Website, Business Segment)
Table 130 Leviton Manufacturing Company, Inc.: Product Benchmarking
Table 131 Leviton Manufacturing Company, Inc.: Strategic Outlook
Table 132 Chargemaster Limited Key Details, (CEO, HQ, Revenue, Founded, No. of Employees, Company Type, Website, Business Segment)
Table 133 Chargemaster Limited: Product Benchmarking
Table 134 Chargemaster Limited: Strategic Outlook
Table 135 Enphase Energy, Inc. Key Details, (CEO, HQ, Revenue, Founded, No. of Employees, Company Type, Website, Business Segment)
Table 136 Enphase Energy, Inc.: Product Benchmarking
Table 137 Enphase Energy, Inc.: Strategic Outlook
Table 138 ChargePoint Holdings, Inc. Key Details, (CEO, HQ, Revenue, Founded, No. of Employees, Company Type, Website, Business Segment)
Table 139 ChargePoint Holdings, Inc.: Product Benchmarking
Table 140 ChargePoint Holdings, Inc.: Strategic Outlook
Table 141 SemaConnect Key Details, (CEO, HQ, Revenue, Founded, No. of Employees, Company Type, Website, Business Segment)
Table 142 SemaConnect: Product Benchmarking
Table 143 SemaConnect: Strategic Outlook
図の一覧
Figure 1 Electric Vehicle Charging Infrastructure Market Segmentation
Figure 2 Electric Vehicle Charging Infrastructure Market by Service: Market Attractiveness Index
Figure 3 Electric Vehicle Charging Infrastructure Market by Level of Charging: Market Attractiveness Index
Figure 4 Electric Vehicle Charging Infrastructure Market by Application: Market Attractiveness Index
Figure 5 Electric Vehicle Charging Infrastructure Market by Charging Type: Market Attractiveness Index
Figure 6 Electric Vehicle Charging Infrastructure Market by Infrastructure Type: Market Attractiveness Index
Figure 7 Electric Vehicle Charging Infrastructure Market Attractiveness Index by Region
Figure 8 Electric Vehicle Charging Infrastructure Market: Market Dynamics
Figure 9 Global Electric Vehicle Charging Infrastructure Market Share Forecast by COVID, 2023-2033 (%)
Figure 10 Global Electric Vehicle Charging Infrastructure Market Forecast, 2023-2033 (US$ Bn, AGR (%)) (V-Shaped Recovery Scenario)
Figure 11 Global Electric Vehicle Charging Infrastructure Market by Region, 2023-2033 (US$ Bn, AGR (%)) (V-Shaped Recovery Scenario)
Figure 12 Global Electric Vehicle Charging Infrastructure Market Forecast, 2023-2033 (US$ Bn, AGR (%)) (W-Shaped Recovery Scenario)
Figure 13 Global Electric Vehicle Charging Infrastructure Market by Region, 2023-2033 (US$ Bn, AGR (%)) (W-Shaped Recovery Scenario)
Figure 14 Global Electric Vehicle Charging Infrastructure Market Forecast, 2023-2033 (US$ Bn, AGR (%)) (U-Shaped Recovery Scenario)
Figure 15 Global Electric Vehicle Charging Infrastructure Market by Region, 2023-2033 (US$ Bn, AGR (%)) (U-Shaped Recovery Scenario)
Figure 16 Global Electric Vehicle Charging Infrastructure Market Forecast, 2023-2033 (US$ Bn, AGR (%)) (L-Shaped Recovery Scenario)
Figure 17 Global Electric Vehicle Charging Infrastructure Market by Region, 2023-2033 (US$ Bn, AGR (%)) (L-Shaped Recovery Scenario)
Figure 18 Electric Vehicle Charging Infrastructure Market: Porter’s Five Forces Analysis
Figure 19 Electric Vehicle Charging Infrastructure Market: PEST Analysis
Figure 20 Electric Vehicle Charging Infrastructure Market by Service: Market Attractiveness Index
Figure 21 Global Electric Vehicle Charging Infrastructure Market by Service, 2023-2033 (US$ Bn, AGR (%))
Figure 22 EV Charging Service Market by Region, 2023-2033 (US$ Bn, AGR (%))
Figure 23 Service Segment Market Share Forecast by Region, 2023 & 2033 (%)
Figure 24 Battery Swapping Service Market by Region, 2023-2033 (US$ Bn, AGR (%))
Figure 25 Service Segment Market Share Forecast by Region, 2023 & 2033 (%)
Figure 26 Electric Vehicle Charging Infrastructure Market by Level of Charging: Market Attractiveness Index
Figure 27 Global Electric Vehicle Charging Infrastructure Market by Level of Charging, 2023-2033 (US$ Bn, AGR (%))
Figure 28 Level 1 Market by Region, 2023-2033 (US$ Bn, AGR (%))
Figure 29 Level of Charging Segment Market Share Forecast by Region, 2023 & 2033 (%)
Figure 30 Level 2 Market by Region, 2023-2033 (US$ Bn, AGR (%))
Figure 31 Level of Charging Segment Market Share Forecast by Region, 2023 & 2033 (%)
Figure 32 Level 3 Market by Region, 2023-2033 (US$ Bn, AGR (%))
Figure 33 Level of Charging Segment Market Share Forecast by Region, 2023 & 2033 (%)
Figure 34 Electric Vehicle Charging Infrastructure Market by Application: Market Attractiveness Index
Figure 35 Global Electric Vehicle Charging Infrastructure Market by Application, 2023-2033 (US$ Bn, AGR (%))
Figure 36 Private Market by Region, 2023-2033 (US$ Bn, AGR (%))
Figure 37 Application Segment Market Share Forecast by Region, 2023 & 2033 (%)
Figure 38 Semi-Public Market by Region, 2023-2033 (US$ Bn, AGR (%))
Figure 39 Application Segment Market Share Forecast by Region, 2023 & 2033 (%)
Figure 40 Public Market by Region, 2023-2033 (US$ Bn, AGR (%))
Figure 41 Application Segment Market Share Forecast by Region, 2023 & 2033 (%)
Figure 42 Commercial Market by Region, 2023-2033 (US$ Bn, AGR (%))
Figure 43 Application Segment Market Share Forecast by Region, 2023 & 2033 (%)
Figure 44 Electric Vehicle Charging Infrastructure Market by Charging Type: Market Attractiveness Index
Figure 45 Global Electric Vehicle Charging Infrastructure Market by Charging Type, 2023-2033 (US$ Bn, AGR (%))
Figure 46 Slow DC (349 kW) Market by Region, 2023-2033 (US$ Bn, AGR (%))
Figure 53 Charging Type Segment Market Share Forecast by Region, 2023 & 2033 (%)
Figure 54 Other Charging Type Market by Region, 2023-2033 (US$ Bn, AGR (%))
Figure 55 Charging Type Segment Market Share Forecast by Region, 2023 & 2033 (%)
Figure 56 Electric Vehicle Charging Infrastructure Market by Infrastructure Type: Market Attractiveness Index
Figure 57 Global Electric Vehicle Charging Infrastructure Market by Infrastructure Type, 2023-2033 (US$ Bn, AGR (%))
Figure 58 Normal Charging Market by Region, 2023-2033 (US$ Bn, AGR (%), CAGR (%))
Figure 59 Charging Type Segment Market Share Forecast by Region, 2023 & 2033 (%)
Figure 60 Type 2 Market by Region, 2023-2033 (US$ Bn, AGR (%))
Figure 61 Charging Type Segment Market Share Forecast by Region, 2023 & 2033 (%)
Figure 62 CCS Market by Region, 2023-2033 (US$ Bn, AGR (%))
Figure 63 Charging Type Segment Market Share Forecast by Region, 2023 & 2033 (%)
Figure 64 CHAdeMO Market by Region, 2023-2033 (US$ Bn, AGR (%))
Figure 65 Charging Type Segment Market Share Forecast by Region, 2023 & 2033 (%)
Figure 66 Tesla SC Market by Region, 2023-2033 (US$ Bn, AGR (%))
Figure 67 Charging Type Segment Market Share Forecast by Region, 2023 & 2033 (%)
Figure 68 GB/T Fast Market by Region, 2023-2033 (US$ Bn, AGR (%))
Figure 69 Charging Type Segment Market Share Forecast by Region, 2023 & 2033 (%)
Figure 70 Electric Vehicle Charging Infrastructure Market Forecast by Region 2023 and 2033 (Revenue, CAGR%)
Figure 71 Global Electric Vehicle Charging Infrastructure Market Forecast, 2023-2033 (US$ Bn, AGR (%))
Figure 72 Global Electric Vehicle Charging Infrastructure Market by Region, 2023-2033 (US$ Bn, AGR (%))
Figure 73 Global Electric Vehicle Charging Infrastructure Market by Service, 2023-2033 (US$ Bn, AGR (%))
Figure 74 Global Electric Vehicle Charging Infrastructure Market by Level of Charging, 2023-2033 (US$ Bn, AGR (%))
Figure 75 Global Electric Vehicle Charging Infrastructure Market by Application, 2023-2033 (US$ Bn, AGR (%))
Figure 76 Global Electric Vehicle Charging Infrastructure Market by Charging Type, 2023-2033 (US$ Bn, AGR (%))
Figure 77 Global Electric Vehicle Charging Infrastructure Market by Infrastructure Type, 2023-2033 (US$ Bn, AGR (%))
Figure 78 North America Electric Vehicle Charging Infrastructure Market Attractiveness Index
Figure 79 North America Electric Vehicle Charging Infrastructure Market by Region, 2023, 2028 & 2033 (US$ Billion)
Figure 80 North America Electric Vehicle Charging Infrastructure Market by Value, 2023-2033 (US$ Bn, AGR (%))
Figure 81 North America Electric Vehicle Charging Infrastructure Market by Country, 2023-2033 (US$ Bn, AGR (%))
Figure 82 North America Electric Vehicle Charging Infrastructure Market Share Forecast by Country, 2023 & 2033 (%)
Figure 83 North America Electric Vehicle Charging Infrastructure Market by Service, 2023-2033 (US$ Bn, AGR (%))
Figure 84 North America Electric Vehicle Charging Infrastructure Market Share Forecast by Service, 2023-2033 (%)
Figure 85 North America Electric Vehicle Charging Infrastructure Market by Level of Charging, 2023-2033 (US$ Bn, AGR (%))
Figure 86 North America Electric Vehicle Charging Infrastructure Market Share Forecast by Level of Charging, 2023-2033 (%)
Figure 87 North America Electric Vehicle Charging Infrastructure Market by Application, 2023-2033 (US$ Bn, AGR (%))
Figure 88 North America Electric Vehicle Charging Infrastructure Market Share Forecast by Application, 2023-2033 (%)
Figure 89 North America Electric Vehicle Charging Infrastructure Market by Charging Type, 2023-2033 (US$ Bn, AGR (%))
Figure 90 North America Electric Vehicle Charging Infrastructure Market Share Forecast by Charging Type, 2023-2033 (%)
Figure 91 North America Electric Vehicle Charging Infrastructure Market by Infrastructure Type, 2023-2033 (US$ Bn, AGR (%))
Figure 92 North America Electric Vehicle Charging Infrastructure Market Share Forecast by Infrastructure Type, 2023-2033 (%)
Figure 93 US Electric Vehicle Charging Infrastructure Market by Value, 2023-2033 (US$ Bn, AGR (%))
Figure 94 Canada Electric Vehicle Charging Infrastructure Market by Value, 2023-2033 (US$ Bn, AGR (%))
Figure 95 Europe Electric Vehicle Charging Infrastructure Market Attractiveness Index
Figure 96 Europe Electric Vehicle Charging Infrastructure Market by Region, 2023, 2028 & 2033 (US$ Billion)
Figure 97 Europe Electric Vehicle Charging Infrastructure Market by Value, 2023-2033 (US$ Bn, AGR (%))
Figure 98 Europe Electric Vehicle Charging Infrastructure Market by Country, 2023-2033 (US$ Bn, AGR (%))
Figure 99 Europe Electric Vehicle Charging Infrastructure Market Share Forecast by Country, 2023 & 2033 (%)
Figure 100 Europe Electric Vehicle Charging Infrastructure Market by Service, 2023-2033 (US$ Bn, AGR (%))
Figure 101 Europe Electric Vehicle Charging Infrastructure Market Share Forecast by Service, 2023-2033 (%)
Figure 102 Europe Electric Vehicle Charging Infrastructure Market by Level of Charging, 2023-2033 (US$ Bn, AGR (%))
Figure 103 Europe Electric Vehicle Charging Infrastructure Market Share Forecast by Level of Charging, 2023-2033 (%)
Figure 104 Europe Electric Vehicle Charging Infrastructure Market by Application, 2023-2033 (US$ Bn, AGR (%))
Figure 105 Europe Electric Vehicle Charging Infrastructure Market Share Forecast by Application, 2023-2033 (%)
Figure 106 Europe Electric Vehicle Charging Infrastructure Market by Charging Type, 2023-2033 (US$ Bn, AGR (%))
Figure 107 Europe Electric Vehicle Charging Infrastructure Market Share Forecast by Charging Type, 2023-2033 (%)
Figure 108 Europe Electric Vehicle Charging Infrastructure Market by Infrastructure Type, 2023-2033 (US$ Bn, AGR (%))
Figure 109 Europe Electric Vehicle Charging Infrastructure Market Share Forecast by Infrastructure Type, 2023-2033 (%)
Figure 110 Germany Electric Vehicle Charging Infrastructure Market by Value, 2023-2033 (US$ Bn, AGR (%))
Figure 111 UK Electric Vehicle Charging Infrastructure Market by Value, 2023-2033 (US$ Bn, AGR (%))
Figure 112 France Electric Vehicle Charging Infrastructure Market by Value, 2023-2033 (US$ Bn, AGR (%))
Figure 113 Norway Electric Vehicle Charging Infrastructure Market by Value, 2023-2033 (US$ Bn, AGR (%))
Figure 114 Netherlands Electric Vehicle Charging Infrastructure Market by Value, 2023-2033 (US$ Bn, AGR (%))
Figure 115 Rest of Europe Electric Vehicle Charging Infrastructure Market by Value, 2023-2033 (US$ Bn, AGR (%))
Figure 116 Asia-Pacific Electric Vehicle Charging Infrastructure Market Attractiveness Index
Figure 117 Asia-Pacific Electric Vehicle Charging Infrastructure Market by Region, 2023, 2028 & 2033 (US$ Billion)
Figure 118 Asia-Pacific Electric Vehicle Charging Infrastructure Market by Value, 2023-2033 (US$ Bn, AGR (%))
Figure 119 Asia-Pacific Electric Vehicle Charging Infrastructure Market by Country, 2023-2033 (US$ Bn, AGR (%))
Figure 120 Asia-Pacific Electric Vehicle Charging Infrastructure Market Share Forecast by Country, 2023 & 2033 (%)
Figure 121 Asia-Pacific Electric Vehicle Charging Infrastructure Market by Service, 2023-2033 (US$ Bn, AGR (%))
Figure 122 Asia-Pacific Electric Vehicle Charging Infrastructure Market Share Forecast by Service, 2023-2033 (%)
Figure 123 Asia-Pacific Electric Vehicle Charging Infrastructure Market by Level of Charging, 2023-2033 (US$ Bn, AGR (%))
Figure 124 Asia-Pacific Electric Vehicle Charging Infrastructure Market Share Forecast by Level of Charging, 2023-2033 (%)
Figure 125 Asia-Pacific Electric Vehicle Charging Infrastructure Market by Application, 2023-2033 (US$ Bn, AGR (%))
Figure 126 Asia-Pacific Electric Vehicle Charging Infrastructure Market Share Forecast by Application, 2023-2033 (%)
Figure 127 Asia-Pacific Electric Vehicle Charging Infrastructure Market by Charging Type, 2023-2033 (US$ Bn, AGR (%))
Figure 128 Asia-Pacific Electric Vehicle Charging Infrastructure Market Share Forecast by Charging Type, 2023-2033 (%)
Figure 129 Asia-Pacific Electric Vehicle Charging Infrastructure Market by Infrastructure Type, 2023-2033 (US$ Bn, AGR (%))
Figure 130 Asia-Pacific Electric Vehicle Charging Infrastructure Market Share Forecast by Infrastructure Type, 2023-2033 (%)
Figure 131 China Electric Vehicle Charging Infrastructure Market by Value, 2023-2033 (US$ Bn, AGR (%))
Figure 132 India Electric Vehicle Charging Infrastructure Market by Value, 2023-2033 (US$ Bn, AGR (%))
Figure 133 Japan Electric Vehicle Charging Infrastructure Market by Value, 2023-2033 (US$ Bn, AGR (%))
Figure 134 South Korea Electric Vehicle Charging Infrastructure Market by Value, 2023-2033 (US$ Bn, AGR (%))
Figure 135 Australia Electric Vehicle Charging Infrastructure Market by Value, 2023-2033 (US$ Bn, AGR (%))
Figure 136 Rest of Asia-Pacific Electric Vehicle Charging Infrastructure Market by Value, 2023-2033 (US$ Bn, AGR (%))
Figure 137 Middle East & Africa Electric Vehicle Charging Infrastructure Market Attractiveness Index
Figure 138 Middle East & Africa Electric Vehicle Charging Infrastructure Market by Region, 2023, 2028 & 2033 (US$ Billion)
Figure 139 Middle East & Africa Electric Vehicle Charging Infrastructure Market by Value, 2023-2033 (US$ Bn, AGR (%))
Figure 140 Middle East & Africa Electric Vehicle Charging Infrastructure Market by Country, 2023-2033 (US$ Bn, AGR (%))
Figure 141 Middle East & Africa Electric Vehicle Charging Infrastructure Market Share Forecast by Country, 2023 & 2033 (%)
Figure 142 Middle East & Africa Electric Vehicle Charging Infrastructure Market by Service, 2023-2033 (US$ Bn, AGR (%))
Figure 143 Middle East & Africa Electric Vehicle Charging Infrastructure Market Share Forecast by Service, 2023-2033 (%)
Figure 144 Middle East & Africa Electric Vehicle Charging Infrastructure Market by Level of Charging, 2023-2033 (US$ Bn, AGR (%))
Figure 145 Middle East & Africa Electric Vehicle Charging Infrastructure Market Share Forecast by Level of Charging, 2023-2033 (%)
Figure 146 Middle East & Africa Electric Vehicle Charging Infrastructure Market by Application, 2023-2033 (US$ Bn, AGR (%))
Figure 147 Middle East & Africa Electric Vehicle Charging Infrastructure Market Share Forecast by Application, 2023-2033 (%)
Figure 148 Middle East & Africa Electric Vehicle Charging Infrastructure Market by Charging Type, 2023-2033 (US$ Bn, AGR (%))
Figure 149 Middle East & Africa Electric Vehicle Charging Infrastructure Market Share Forecast by Charging Type, 2023-2033 (%)
Figure 150 Middle East & Africa Electric Vehicle Charging Infrastructure Market by Infrastructure Type, 2023-2033 (US$ Bn, AGR (%))
Figure 151 Middle East & Africa Electric Vehicle Charging Infrastructure Market Share Forecast by Infrastructure Type, 2023-2033 (%)
Figure 152 GCC Electric Vehicle Charging Infrastructure Market by Value, 2023-2033 (US$ Bn, AGR (%))
Figure 153 South Africa Electric Vehicle Charging Infrastructure Market by Value, 2023-2033 (US$ Bn, AGR (%))
Figure 154 Rest of Middle East & Africa Electric Vehicle Charging Infrastructure Market by Value, 2023-2033 (US$ Bn, AGR (%))
Figure 155 Latin America Electric Vehicle Charging Infrastructure Market Attractiveness Index
Figure 156 Latin America Electric Vehicle Charging Infrastructure Market by Region, 2023, 2028 & 2033 (US$ Billion)
Figure 157 Latin America Electric Vehicle Charging Infrastructure Market by Value, 2023-2033 (US$ Bn, AGR (%))
Figure 158 Latin America Electric Vehicle Charging Infrastructure Market by Country, 2023-2033 (US$ Bn, AGR (%))
Figure 159 Latin America Electric Vehicle Charging Infrastructure Market Share Forecast by Country, 2023 & 2033 (%)
Figure 160 Latin America Electric Vehicle Charging Infrastructure Market by Service, 2023-2033 (US$ Bn, AGR (%))
Figure 161 Latin America Electric Vehicle Charging Infrastructure Market Share Forecast by Service, 2023-2033 (%)
Figure 162 Latin America Electric Vehicle Charging Infrastructure Market by Level of Charging, 2023-2033 (US$ Bn, AGR (%))
Figure 163 Latin America Electric Vehicle Charging Infrastructure Market Share Forecast by Level of Charging, 2023-2033 (%)
Figure 164 Latin America Electric Vehicle Charging Infrastructure Market by Application, 2023-2033 (US$ Bn, AGR (%))
Figure 165 Latin America Electric Vehicle Charging Infrastructure Market Share Forecast by Application, 2023-2033 (%)
Figure 166 Latin America Electric Vehicle Charging Infrastructure Market by Charging Type, 2023-2033 (US$ Bn, AGR (%))
Figure 167 Latin America Electric Vehicle Charging Infrastructure Market Share Forecast by Charging Type, 2023-2033 (%)
Figure 168 Latin America Electric Vehicle Charging Infrastructure Market by Infrastructure Type, 2023-2033 (US$ Bn, AGR (%))
Figure 169 Latin America Electric Vehicle Charging Infrastructure Market Share Forecast by Infrastructure Type, 2023-2033 (%)
Figure 170 Brazil Electric Vehicle Charging Infrastructure Market by Value, 2023-2033 (US$ Bn, AGR (%))
Figure 171 Mexico Electric Vehicle Charging Infrastructure Market by Value, 2023-2033 (US$ Bn, AGR (%))
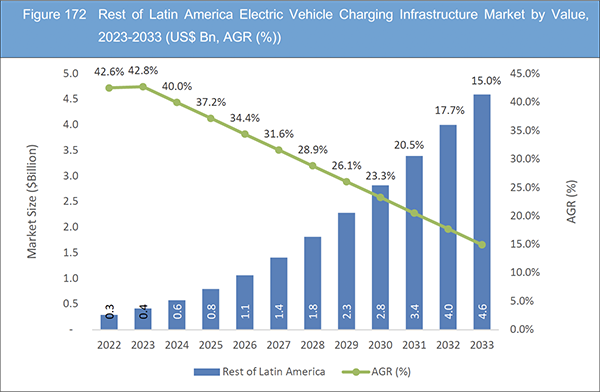
Figure 172 Rest of Latin America Electric Vehicle Charging Infrastructure Market by Value, 2023-2033 (US$ Bn, AGR (%))
Figure 173 Electric Vehicle Charging Infrastructure Market: Company Share, 2022
Figure 174 Tesla, Inc: Net Revenue, 2018-2022 (US$ Million, AGR%)
Figure 175 Tesla, Inc: R&D, 2018-2022 (US$ Million, AGR%)
Figure 176 Tesla, Inc: Regional Revenue Share, 2022 (%)
Figure 177 Tesla, Inc: Business Segment Revenue Share, 2022 (%)
Figure 178 Siemens AG: Net Revenue, 2018-2022 (US$ Million, AGR%)
Figure 179 Siemens AG: R&D, 2018-2022 (US$ Million, AGR%)
Figure 180 Siemens AG: Regional Revenue Share, 2022 (%)
Figure 181 Siemens AG: Business Segment Revenue Share, 2022 (%)
Figure 182 Schneider Electric SE: Net Revenue, 2018-2022 (US$ Million, AGR%)
Figure 183 Schneider Electric SE: R&D, 2018-2022 (US$ Million, AGR%)
Figure 184 Schneider Electric SE: Regional Revenue Share, 2022 (%)
Figure 185 Schneider Electric SE: Business Segment Revenue Share, 2022 (%)
Figure 186 ABB Ltd: Net Revenue, 2018-2022 (US$ Million, AGR%)
Figure 187 ABB Ltd: R&D, 2018-2022 (US$ Million, AGR%)
Figure 188 ABB Ltd: Business Segment Revenue Share, 2022 (%)
Figure 189 AeroVironment, Inc: Net Revenue, 2018-2022 (US$ Million, AGR%)
Figure 190 AeroVironment, Inc: R&D, 2018-2022 (US$ Million, AGR%)
Figure 191 AeroVironment, Inc: Regional Revenue Share, 2022 (%)
Figure 192 AeroVironment, Inc: Business Segment Revenue Share, 2022 (%)
Figure 193 Eaton Corporation plc: Net Revenue, 2018-2022 (US$ Million, AGR%)
Figure 194 Eaton Corporation plc: R&D, 2018-2022 (US$ Million, AGR%)
Figure 195 Eaton Corporation plc: Regional Revenue Share, 2022 (%)
Figure 196 Eaton Corporation plc: Business Segment Revenue Share, 2022 (%)
Figure 197 General Electric Company: Net Revenue, 2018-2022 (US$ Million, AGR%)
Figure 198 General Electric Company: R&D, 2018-2022 (US$ Million, AGR%)
Figure 199 General Electric Company: Regional Revenue Share, 2022 (%)
Figure 200 General Electric Company: Business Segment Revenue Share, 2022 (%)
Figure 201 ChargePoint Holdings, Inc.: Net Revenue, 2020-2023 (US$ Million, AGR%)
Figure 202 ChargePoint Holdings, Inc.: R&D, 2020-2023 (US$ Million, AGR%)
Figure 203 ChargePoint Holdings, Inc.: Business Segment Revenue Share, 2022 (%)
ページTOPに戻る
Summary
Report Details
The Electric Vehicle Charging Infrastructure Market Report 2023-2033: This report will prove invaluable to leading firms striving for new revenue pockets if they wish to better understand the industry and its underlying dynamics. It will be useful for companies that would like to expand into different industries or to expand their existing operations in a new region.
Rising Electric Vehicle Adoption Is Driving the Market Growth
The increasing popularity of electric vehicles is a primary driver for the growth of electric vehicle charging infrastructure. Governments, businesses, and individuals worldwide are recognizing the importance of transitioning to sustainable transportation options to combat climate change and reduce dependence on fossil fuels. As more consumers embrace electric cars, the demand for reliable and easily accessible charging stations surges. To meet this demand, governments and private entities are investing in the expansion of charging networks to facilitate the widespread adoption of electric vehicles.
High Initial Infrastructure Costs
One of the significant challenges in the EV Charging Infrastructure market is the high initial costs associated with installing charging stations and building the necessary infrastructure. The costs include equipment procurement, installation, electrical upgrades, and grid connection. These expenses can be a barrier, particularly for small businesses and organizations looking to invest in charging infrastructure. However, as the market continues to grow and scale, economies of scale and advancements in technology are expected to help reduce these costs over time. Additionally, collaborations and partnerships between public and private entities can help share the financial burden and accelerate the deployment of charging infrastructure.
What Questions Should You Ask before Buying a Market Research Report?
• How is the electric vehicle charging infrastructure market evolving?
• What is driving and restraining the electric vehicle charging infrastructure market?
• How will each electric vehicle charging infrastructure submarket segment grow over the forecast period and how much revenue will these submarkets account for in 2033?
• How will the market shares for each electric vehicle charging infrastructure submarket develop from 2023 to 2033?
• What will be the main driver for the overall market from 2023 to 2033?
• Will leading electric vehicle charging infrastructure markets broadly follow the macroeconomic dynamics, or will individual national markets outperform others?
• How will the market shares of the national markets change by 2033 and which geographical region will lead the market in 2033?
• Who are the leading players and what are their prospects over the forecast period?
• What are the electric vehicle charging infrastructure projects for these leading companies?
• How will the industry evolve during the period between 2023 and 2033? What are the implications of electric vehicle charging infrastructure projects taking place now and over the next 10 years?
• Is there a greater need for product commercialisation to further scale the electric vehicle charging infrastructure market?
• Where is the electric vehicle charging infrastructure market heading and how can you ensure you are at the forefront of the market?
• What are the best investment options for new product and service lines?
• What are the key prospects for moving companies into a new growth path and C-suite?
You need to discover how this will impact the electric vehicle charging infrastructure market today, and over the next 10 years:
• Our 400-page report provides 143 tables and 203 charts/graphs exclusively to you.
• The report highlights key lucrative areas in the industry so you can target them – NOW.
• It contains in-depth analysis of global, regional and national sales and growth.
• It highlights for you the key successful trends, changes and revenue projections made by your competitors.
This report tells you TODAY how the electric vehicle charging infrastructure market will develop in the next 10 years, and in line with the variations in COVID-19 economic recession and bounce. This market is more critical now than at any point over the last 10 years.
Forecasts to 2033 and other analyses reveal commercial prospects
• In addition to revenue forecasting to 2033, our new study provides you with recent results, growth rates, and market shares.
• You will find original analyses, with business outlooks and developments.
• Discover qualitative analyses (including market dynamics, drivers, opportunities, restraints and challenges), cost structure, impact of rising electric vehicle charging infrastructure prices and recent developments.
This report includes data analysis and invaluable insight into how COVID-19 will affect the industry and your company. Four COVID-19 recovery patterns and their impact, namely, “V”, “L”, “W” and “U” are discussed in this report.
Segments Covered in the Report
Market Segment by Service
• EV Charging Service
• Battery Swapping Service
Market Segment by Level of Charging
• Level 1
• Level 2
• Level 3
Market Segment by Application
• Private
• Semi-Public
• Public
• Commercial
Market Segment by Charging Type
• Slow DC (<49 kW)
• Fast DC (50-149 kW)
• Level 1 Ultra-Fast DC (150-349 KW)
• Level 2 Ultra-Fast DC (>349 kW)
• Other Charging Type
Market Segment by Infrastructure Type
• Normal Charging
• Type 2
• CCS
• CHAdeMO
• Tesla SC
• GB/T Fast
In addition to the revenue predictions for the overall world market and segments, you will also find revenue forecasts for four regional and 20 leading national markets:
North America
• U.S.
• Canada
Europe
• Germany
• Norway
• United Kingdom
• France
• Netherlands
• Rest of Europe
Asia Pacific
• China
• Japan
• India
• Australia
• South Korea
• Rest of Asia Pacific
Latin America
• Brazil
• Mexico
• Rest of Latin America
Middle East & Africa
• GCC
• South Africa
• Rest of Middle East & Africa
The report also includes profiles and for some of the leading companies in the Electric Vehicle Charging Infrastructure Market, 2023 to 2033, with a focus on this segment of these companies’ operations.
Leading companies profiled in the report
• ABB Ltd.
• AeroVironment, Inc.
• Chargemaster Limited
• ChargePoint, Inc.
• ClipperCreek
• Delta Electronics
• Eaton Corporation plc
• General Electric Company (GE)
• Leviton Manufacturing Company, Inc.
• Schneider Electric SE
• SemaConnect
• Siemens AG
• Tesla, Inc.
• Webasto SE
Overall world revenue for Electric Vehicle Charging Infrastructure Market, 2023 to 2033 in terms of value the market will surpass US$26.8 billion in 2023, our work calculates. We predict strong revenue growth through to 2033. Our work identifies which organizations hold the greatest potential. Discover their capabilities, progress, and commercial prospects, helping you stay ahead.
How will the Electric Vehicle Charging Infrastructure Market, 2023 to 2033 report help you?
In summary, our 400-page report provides you with the following knowledge:
• Revenue forecasts to 2033 for Electric Vehicle Charging Infrastructure Market, 2023 to 2033 Market, with forecasts for charging type, infrastructure type, service, level of charging and application, each forecast at a global and regional level – discover the industry’s prospects, finding the most lucrative places for investments and revenues.
• Revenue forecasts to 2033 for four regional and 20 key national markets – See forecasts for the Electric Vehicle Charging Infrastructure Market, 2023 to 2033 market in North America, Europe, Asia-Pacific, Latin America and Middle East & Africa. Also forecasted is the market in the US, Canada, Brazil, Germany, France, UK, Norway, China, India, Japan, and Australia among other prominent economies.
• Prospects for established firms and those seeking to enter the market – including company profiles for 15 of the major companies involved in the Electric Vehicle Charging Infrastructure Market, 2023 to 2033.
Find quantitative and qualitative analyses with independent predictions. Receive information that only our report contains, staying informed with invaluable business intelligence.
Information found nowhere else
With our new report, you are less likely to fall behind in knowledge or miss out on opportunities. See how our work could benefit your research, analyses, and decisions. Visiongain’s study is for everybody needing commercial analyses for the Electric Vehicle Charging Infrastructure Market, 2023 to 2033, market-leading companies. You will find data, trends and predictions.
ページTOPに戻る
Table of Contents
Table of Contents
1 Report Overview
1.1 Objectives of the Study
1.2 Introduction to Electric Vehicle Charging Infrastructure Market
1.3 What This Report Delivers
1.4 Why You Should Read This Report
1.5 Key Questions Answered by This Analytical Report
1.6 Who Is This Report for?
1.7 Research Methodology
1.7.1 Market Definitions
1.7.2 Market Evaluation & Forecasting Methodology
1.7.3 Data Validation
1.7.3.1 Primary Research
1.7.3.2 Secondary Research
1.8 Frequently Asked Questions (FAQs)
1.9 Associated Visiongain Reports
1.10 About Visiongain
2 Executive Summary
2.1 Segment Analysis
2.1.1 Service Segment: Market Attractiveness Index
2.1.2 Level of Charging Segment: Market Attractiveness Index
2.1.3 Application Segment: Market Attractiveness Index
2.1.4 Charging Type Segment: Market Attractiveness Index
2.1.5 Infrastructure Type Segment: Market Attractiveness Index
2.2 Regional Analysis
3 Market Overview
3.1 Key Findings
3.2 Market Dynamics
3.2.1 Market Driving Factors
3.2.1.1 Government Initiatives and Incentives
3.2.1.2 Growing Electric Vehicle Sales
3.2.1.3 Technological Advancements Play a Significant Role in Shaping Market
3.2.2 Market Restraints
3.2.2.1 High Initial Infrastructure Costs
3.2.2.2 Limited Grid Capacity Unable to Meet Increased Electricity Demand
3.2.2.3 Range Anxiety and Charging Time
3.2.3 Market Opportunities
3.2.3.1 Integration of Renewable Energy Sources
3.2.3.2 Expansion of Fast Charging Networks
3.2.3.3 Smart Grid Integration and Demand Response
3.3 COVID-19 Impact Analysis
3.3.1 V-Shaped Recovery
3.3.2 W-Shaped Recovery
3.3.3 U-Shaped Recovery
3.3.4 L-Shaped Recovery
3.4 Porter’s Five Forces Analysis
3.4.1 Bargaining Power of Suppliers (High)
3.4.2 Bargaining Power of Buyers (Moderate to High)
3.4.3 Competitive Rivalry (High)
3.4.4 Threat from Substitutes (Low)
3.4.5 Threat of New Entrants (Moderate)
3.5 PEST Analysis
3.5.1 Political Factors:
3.5.2 Economic Factors:
3.5.3 Social/Cultural Factors:
3.5.4 Technological Factors
4 Electric Vehicle Charging Infrastructure Market Analysis by Service
4.1 Key Findings
4.2 Service Segment: Market Attractiveness Index
4.3 Electric Vehicle Charging Infrastructure Market Size Estimation and Forecast by Service
4.4 EV Charging
4.4.1 Market Size by Region, 2023-2033 (US$ Billion)
4.4.2 Market Share by Region, 2023 & 2033 (%)
4.5 Battery Swapping
4.5.1 Market Size by Region, 2023-2033 (US$ Billion)
4.5.2 Market Share by Region, 2023 & 2033 (%)
5 Electric Vehicle Charging Infrastructure Market Analysis by Level of Charging
5.1 Key Findings
5.2 Level of Charging Segment: Market Attractiveness Index
5.3 Electric Vehicle Charging Infrastructure Market Size Estimation and Forecast by Level of Charging
5.4 Level 1
5.4.1 Market Size by Region, 2023-2033 (US$ Billion)
5.4.2 Market Share by Region, 2023 & 2033 (%)
5.5 Level 2
5.5.1 Market Size by Region, 2023-2033 (US$ Billion)
5.5.2 Market Share by Region, 2023 & 2033 (%)
5.6 Level 3
5.6.1 Market Size by Region, 2023-2033 (US$ Billion)
5.6.2 Market Share by Region, 2023 & 2033 (%)
6 Electric Vehicle Charging Infrastructure Market Analysis by Application
6.1 Key Findings
6.2 Application Segment: Market Attractiveness Index
6.3 Electric Vehicle Charging Infrastructure Market Size Estimation and Forecast by Application
6.4 Private
6.4.1 Market Size by Region, 2023-2033 (US$ Billion)
6.4.2 Market Share by Region, 2023 & 2033 (%)
6.5 Semi-Public
6.5.1 Market Size by Region, 2023-2033 (US$ Billion)
6.5.2 Market Share by Region, 2023 & 2033 (%)
6.6 Public
6.6.1 Market Size by Region, 2023-2033 (US$ Billion)
6.6.2 Market Share by Region, 2023 & 2033 (%)
6.7 Commercial
6.7.1 Market Size by Region, 2023-2033 (US$ Billion)
6.7.2 Market Share by Region, 2023 & 2033 (%)
7 Electric Vehicle Charging Infrastructure Market Analysis by Charging Type
7.1 Key Findings
7.2 Charging Type Segment: Market Attractiveness Index
7.3 Electric Vehicle Charging Infrastructure Market Size Estimation and Forecast by Charging Type
7.4 Slow DC
7.4.1 Market Size by Region, 2023-2033 (US$ Billion)
7.4.2 Market Share by Region, 2023 & 2033 (%)
7.5 Fast DC
7.5.1 Market Size by Region, 2023-2033 (US$ Billion)
7.5.2 Market Share by Region, 2023 & 2033 (%)
7.6 Level 1 Ultra-Fast DC
7.6.1 Market Size by Region, 2023-2033 (US$ Billion)
7.6.2 Market Share by Region, 2023 & 2033 (%)
7.7 Level 2 Ultra-Fast DC
7.7.1 Market Size by Region, 2023-2033 (US$ Billion)
7.7.2 Market Share by Region, 2023 & 2033 (%)
7.8 Other Charging Type
7.8.1 Market Size by Region, 2023-2033 (US$ Billion)
7.8.2 Market Share by Region, 2023 & 2033 (%)
8 Electric Vehicle Charging Infrastructure Market Analysis by Infrastructure Type
8.1 Key Findings
8.2 Infrastructure Type Segment: Market Attractiveness Index
8.3 Electric Vehicle Charging Infrastructure Market Size Estimation and Forecast by Infrastructure Type
8.4 Normal Charging
8.4.1 Market Size by Region, 2023-2033 (US$ Billion)
8.4.2 Market Share by Region, 2023 & 2033 (%)
8.5 Type 2
8.5.1 Market Size by Region, 2023-2033 (US$ Billion)
8.5.2 Market Share by Region, 2023 & 2033 (%)
8.6 CSS
8.6.1 Market Size by Region, 2023-2033 (US$ Billion)
8.6.2 Market Share by Region, 2023 & 2033 (%)
8.7 CHAdeMO
8.7.1 Market Size by Region, 2023-2033 (US$ Billion)
8.7.2 Market Share by Region, 2023 & 2033 (%)
8.8 Tesla SC
8.8.1 Market Size by Region, 2023-2033 (US$ Billion)
8.8.2 Market Share by Region, 2023 & 2033 (%)
8.9 GB/T
8.9.1 Market Size by Region, 2023-2033 (US$ Billion)
8.10 Market Share by Region, 2023 & 2033 (%)
9 Electric Vehicle Charging Infrastructure Market Analysis by Region
9.1 Key Findings
9.2 Regional Market Size Estimation and Forecast
10 North America Electric Vehicle Charging Infrastructure Market Analysis
10.1 Key Findings
10.2 North America Electric Vehicle Charging Infrastructure Market Attractiveness Index
10.3 North America Electric Vehicle Charging Infrastructure Market by Country, 2023, 2028 & 2033 (US$ Billion)
10.4 North America Electric Vehicle Charging Infrastructure Market Size Estimation and Forecast by Value
10.5 North America Electric Vehicle Charging Infrastructure Market Size Estimation and Forecast by Country
10.6 North America Electric Vehicle Charging Infrastructure Market Size Estimation and Forecast by Service
10.7 North America Electric Vehicle Charging Infrastructure Market Size Estimation and Forecast by Level of Charging
10.8 North America Electric Vehicle Charging Infrastructure Market Size Estimation and Forecast by Application
10.9 North America Electric Vehicle Charging Infrastructure Market Size Estimation and Forecast by Charging Type
10.10 North America Electric Vehicle Charging Infrastructure Market Size Estimation and Forecast by Infrastructure Type
10.11 US Electric Vehicle Charging Infrastructure Market
10.12 Canada Electric Vehicle Charging Infrastructure Market
11 Europe Electric Vehicle Charging Infrastructure Market Analysis
11.1 Key Findings
11.2 Europe Electric Vehicle Charging Infrastructure Market Attractiveness Index
11.3 Europe Electric Vehicle Charging Infrastructure Market by Country, 2023, 2028 & 2033 (US$ Billion)
11.4 Europe Electric Vehicle Charging Infrastructure Market Size Estimation and Forecast by Value
11.5 Europe Electric Vehicle Charging Infrastructure Market by Country
11.6 Europe Electric Vehicle Charging Infrastructure Market by Service
11.7 Europe Electric Vehicle Charging Infrastructure Market by Level of Charging
11.8 Europe Electric Vehicle Charging Infrastructure Market by Application
11.9 Europe Electric Vehicle Charging Infrastructure Market by Charging Type
11.10 Europe Electric Vehicle Charging Infrastructure Market by Infrastructure Type
11.11 Germany Electric Vehicle Charging Infrastructure Market
11.12 UK Electric Vehicle Charging Infrastructure Market
11.13 France Electric Vehicle Charging Infrastructure Market
11.14 Norway Electric Vehicle Charging Infrastructure Market
11.15 Netherlands Electric Vehicle Charging Infrastructure Market
11.16 Rest of Europe Electric Vehicle Charging Infrastructure Market
12 Asia-Pacific Electric Vehicle Charging Infrastructure Market Analysis
12.1 Key Findings
12.2 Asia-Pacific Electric Vehicle Charging Infrastructure Market Attractiveness Index
12.3 Asia-Pacific Electric Vehicle Charging Infrastructure Market by Country, 2023, 2028 & 2033 (US$ Billion)
12.4 Asia-Pacific Electric Vehicle Charging Infrastructure Market Size Estimation and Forecast by Value
12.5 Asia-Pacific Electric Vehicle Charging Infrastructure Market by Country
12.6 Asia-Pacific Electric Vehicle Charging Infrastructure Market by Service
12.7 Asia-Pacific Electric Vehicle Charging Infrastructure Market by Level of Charging
12.8 Asia-Pacific Electric Vehicle Charging Infrastructure Market by Application
12.9 Asia-Pacific Electric Vehicle Charging Infrastructure Market by Charging Type
12.10 Asia-Pacific Electric Vehicle Charging Infrastructure Market by Infrastructure Type
12.11 China Electric Vehicle Charging Infrastructure Market
12.12 India Electric Vehicle Charging Infrastructure Market
12.13 Japan Electric Vehicle Charging Infrastructure Market
12.14 South Korea Electric Vehicle Charging Infrastructure Market
12.15 Australia Electric Vehicle Charging Infrastructure Market
12.16 Rest of Asia-Pacific Electric Vehicle Charging Infrastructure Market
13 Middle East & Africa Electric Vehicle Charging Infrastructure Market Analysis
13.1 Key Findings
13.2 Middle East & Africa Electric Vehicle Charging Infrastructure Market Attractiveness Index
13.3 Middle East & Africa Electric Vehicle Charging Infrastructure Market by Country, 2023, 2028 & 2033 (US$ Billion)
13.4 Middle East & Africa Electric Vehicle Charging Infrastructure Market Size Estimation and Forecast by Value
13.5 Middle East & Africa Electric Vehicle Charging Infrastructure Market by Country
13.6 Middle East & Africa Electric Vehicle Charging Infrastructure Market by Service
13.7 Middle East & Africa Electric Vehicle Charging Infrastructure Market by Level of Charging
13.8 Middle East & Africa Electric Vehicle Charging Infrastructure Market by Application
13.9 Middle East & Africa Electric Vehicle Charging Infrastructure Market by Charging Type
13.10 Middle East & Africa Electric Vehicle Charging Infrastructure Market by Infrastructure Type
13.11 GCC Electric Vehicle Charging Infrastructure Market
13.12 South Africa Electric Vehicle Charging Infrastructure Market
13.13 Rest of Middle East & Africa Electric Vehicle Charging Infrastructure Market
14 Latin America Electric Vehicle Charging Infrastructure Market Analysis
14.1 Key Findings
14.2 Latin America Electric Vehicle Charging Infrastructure Market Attractiveness Index
14.3 Latin America Electric Vehicle Charging Infrastructure Market by Country, 2023, 2028 & 2033 (US$ Billion)
14.4 Latin America Electric Vehicle Charging Infrastructure Market Size Estimation and Forecast by Value
14.5 Latin America Electric Vehicle Charging Infrastructure Market by Country
14.6 Latin America Electric Vehicle Charging Infrastructure Market by Service
14.7 Latin America Electric Vehicle Charging Infrastructure Market by Level of Charging
14.8 Latin America Electric Vehicle Charging Infrastructure Market by Application
14.9 Latin America Electric Vehicle Charging Infrastructure Market by Charging Type
14.10 Latin America Electric Vehicle Charging Infrastructure Market by Infrastructure Type
14.11 Brazil Electric Vehicle Charging Infrastructure Market
14.12 Mexico Electric Vehicle Charging Infrastructure Market
14.13 Rest of Latin America Electric Vehicle Charging Infrastructure Market
15 Company Profiles
15.1 Competitive Landscape, 2022
15.2 Strategic Outlook
15.3 Electrify America LLC
15.4 Company Snapshot
15.4.1 Company Overview
15.4.2 Product Benchmarking
15.4.3 Strategic Outlook
15.5 Delta Electronics
15.5.1 Company Snapshot
15.5.2 Company Overview
15.5.3 Product Benchmarking
15.5.4 Strategic Outlook
15.6 Webasto SE
15.6.1 Company Snapshot
15.6.2 Company Overview
15.6.3 Product Benchmarking
15.6.4 Strategic Outlook
15.7 Tesla, Inc
15.7.1 Company Snapshot
15.7.2 Company Overview
15.7.3 Financial Analysis
15.7.3.1 Net Revenue, 2018-2022
15.7.3.2 R&D, 2018-2022
15.7.3.3 Regional Revenue Share, 2022 (%)
15.7.3.4 Business Segment Revenue Share, 2022 (%)
15.7.4 Product Benchmarking
15.7.5 Strategic Outlook
15.8 Siemens AG
15.8.1 Company Snapshot
15.8.2 Company Overview
15.8.3 Financial Analysis
15.8.3.1 Net Revenue, 2018-2022
15.8.3.2 R&D, 2018-2022
15.8.3.3 Regional Revenue Share, 2022 (%)
15.8.3.4 Business Segment Revenue Share, 2022 (%)
15.8.4 Product Benchmarking
15.8.5 Strategic Outlook
15.9 Schneider Electric SE
15.9.1 Company Snapshot
15.9.2 Company Overview
15.9.3 Financial Analysis
15.9.3.1 Net Revenue, 2018-2022
15.9.3.2 R&D, 2018-2022
15.9.3.3 Regional Revenue Share, 2022 (%)
15.9.3.4 Business Segment Revenue Share, 2022 (%)
15.9.4 Product Benchmarking
15.9.5 Strategic Outlook
15.10 ABB Ltd
15.10.1 Company Snapshot
15.10.2 Company Overview
15.10.3 Financial Analysis
15.10.3.1 Net Revenue, 2018-2022
15.10.3.2 R&D, 2018-2022
15.10.3.3 Business Segment Revenue Share, 2022 (%)
15.10.4 Product Benchmarking
15.10.5 Strategic Outlook
15.11 AeroVironment, Inc.
15.11.1 Company Snapshot
15.11.2 Company Overview
15.11.3 Financial Analysis
15.11.3.1 Net Revenue, 2018-2022
15.11.3.2 R&D, 2018-2022
15.11.3.3 Regional Revenue Share, 2022 (%)
15.11.3.4 Business Segment Revenue Share, 2022 (%)
15.11.4 Product Benchmarking
15.12 Eaton Corporation plc
15.12.1 Company Snapshot
15.12.2 Company Overview
15.12.3 Financial Analysis
15.12.3.1 Net Revenue, 2018-2022
15.12.3.2 R&D, 2018-2022
15.12.3.3 Regional Revenue Share, 2022 (%)
15.12.3.4 Business Segment Revenue Share, 2022 (%)
15.12.4 Product Benchmarking
15.12.5 Strategic Outlook
15.13 General Electric Company
15.13.1 Company Snapshot
15.13.2 Company Overview
15.13.3 Financial Analysis
15.13.3.1 Net Revenue, 2018-2022
15.13.3.2 R&D, 2018-2022
15.13.3.3 Regional Revenue Share, 2022 (%)
15.13.3.4 Business Segment Revenue Share, 2022 (%)
15.13.4 Product Benchmarking
15.13.5 Strategic Outlook
15.14 Leviton Manufacturing Company, Inc.
15.14.1 Company Snapshot
15.14.2 Company Overview
15.14.3 Product Benchmarking
15.14.4 Strategic Outlook
15.15 Chargemaster Limited
15.15.1 Company Snapshot
15.15.2 Company Overview
15.15.3 Product Benchmarking
15.15.4 Strategic Outlook
15.16 Enphase Energy, Inc.
15.16.1 Company Snapshot
15.16.2 Company Overview
15.16.3 Product Benchmarking
15.16.4 Strategic Outlook
15.17 ChargePoint Holdings, Inc.
15.17.1 Company Snapshot
15.17.2 Company Overview
15.17.3 Financial Analysis
15.17.3.1 Net Revenue, 2018-2022
15.17.3.2 R&D, 2018-2022
15.17.3.3 Business Segment Revenue Share, 2022 (%)
15.17.4 Product Benchmarking
15.17.5 Strategic Outlook
15.18 SemaConnect
15.18.1 Company Snapshot
15.18.2 Company Overview
15.18.3 Product Benchmarking
15.18.4 Strategic Outlook
16 Conclusion and Recommendations
16.1 Concluding Remarks from Visiongain
16.2 Recommendations for Market Players
ページTOPに戻る
List of Tables/Graphs
List of Tables
Table 1 Electric Vehicle Charging Infrastructure Market Snapshot, 2023 & 2033 (US$ Billion, CAGR %)
Table 2 Global Electric Vehicle Sales, 2022
Table 3 EV Charging Station Infrastructure Cost Analysis, 2022
Table 4 Global Electric Vehicle Charging Infrastructure Market Forecast, 2023-2033 (US$ Bn, AGR (%), CAGR (%)) (V-Shaped Recovery Scenario)
Table 5 Global Electric Vehicle Charging Infrastructure Market by Region, 2023-2033 (US$ Bn, AGR (%), CAGR (%)) (V-Shaped Recovery Scenario)
Table 6 Global Electric Vehicle Charging Infrastructure Market Forecast, 2023-2033 (US$ Bn, AGR (%), CAGR (%)) (W-Shaped Recovery Scenario)
Table 7 Global Electric Vehicle Charging Infrastructure Market by Region, 2023-2033 (US$ Bn, AGR (%), CAGR (%)) (W-Shaped Recovery Scenario)
Table 8 Global Electric Vehicle Charging Infrastructure Market Forecast, 2023-2033 (US$ Bn, AGR (%), CAGR (%)) (U-Shaped Recovery Scenario)
Table 9 Global Electric Vehicle Charging Infrastructure Market by Region, 2023-2033 (US$ Bn, AGR (%), CAGR (%)) (U-Shaped Recovery Scenario)
Table 10 Global Electric Vehicle Charging Infrastructure Market Forecast, 2023-2033 (US$ Bn, AGR (%), CAGR (%)) (L-Shaped Recovery Scenario)
Table 11 Global Electric Vehicle Charging Infrastructure Market by Region, 2023-2033 (US$ Bn, AGR (%), CAGR (%)) (L-Shaped Recovery Scenario)
Table 12 Global Electric Vehicle Charging Infrastructure Market by Service, 2023-2033 (US$ Bn, AGR (%), CAGR (%))
Table 13 EV Charging Service Market by Region, 2023-2033 (US$ Bn, AGR (%), CAGR (%))
Table 14 Battery Swapping Service Market by Region, 2023-2033 (US$ Bn, AGR (%), CAGR (%))
Table 15 Global Electric Vehicle Charging Infrastructure Market by Level of Charging, 2023-2033 (US$ Bn, AGR (%), CAGR (%))
Table 16 Level 1 Market by Region, 2023-2033 (US$ Bn, AGR (%), CAGR (%))
Table 17 Level 2 Market by Region, 2023-2033 (US$ Bn, AGR (%), CAGR (%))
Table 18 Level 3 Market by Region, 2023-2033 (US$ Bn, AGR (%), CAGR (%))
Table 19 Global Electric Vehicle Charging Infrastructure Market by Application, 2023-2033 (US$ Bn, AGR (%), CAGR (%))
Table 20 Private Market by Region, 2023-2033 (US$ Bn, AGR (%), CAGR (%))
Table 21 Semi-Public Market by Region, 2023-2033 (US$ Bn, AGR (%), CAGR (%))
Table 22 Public Market by Region, 2023-2033 (US$ Bn, AGR (%), CAGR (%))
Table 23 Commercial Market by Region, 2023-2033 (US$ Bn, AGR (%), CAGR (%))
Table 24 Global Electric Vehicle Charging Infrastructure Market by Charging Type, 2023-2033 (US$ Bn, AGR (%), CAGR (%))
Table 25 Slow DC (349 kW) Market by Region, 2023-2033 (US$ Bn, AGR (%), CAGR (%))
Table 29 Other Charging Type Market by Region, 2023-2033 (US$ Bn, AGR (%), CAGR (%))
Table 30 Global Electric Vehicle Charging Infrastructure Market by Infrastructure Type, 2023-2033 (US$ Bn, AGR (%), CAGR (%))
Table 31 Normal Charging Market by Region, 2023-2033 (US$ Bn, AGR (%), CAGR (%))
Table 32 Type 2 Market by Region, 2023-2033 (US$ Bn, AGR (%), CAGR (%))
Table 33 CCS Market by Region, 2023-2033 (US$ Bn, AGR (%), CAGR (%))
Table 34 CHAdeMO Market by Region, 2023-2033 (US$ Bn, AGR (%), CAGR (%))
Table 35 Tesla SC Market by Region, 2023-2033 (US$ Bn, AGR (%), CAGR (%))
Table 36 GB/T Fast Market by Region, 2023-2033 (US$ Bn, AGR (%), CAGR (%))
Table 37 Global Electric Vehicle Charging Infrastructure Market Forecast, 2023-2033 (US$ Bn, AGR (%), CAGR (%))
Table 38 Global Electric Vehicle Charging Infrastructure Market by Region, 2023-2033 (US$ Bn, AGR (%), CAGR (%))
Table 39 Global Electric Vehicle Charging Infrastructure Market by Service, 2023-2033 (US$ Bn, AGR (%), CAGR (%))
Table 40 Global Electric Vehicle Charging Infrastructure Market by Level of Charging, 2023-2033 (US$ Bn, AGR (%), CAGR (%))
Table 41 Global Electric Vehicle Charging Infrastructure Market by Application, 2023-2033 (US$ Bn, AGR (%), CAGR (%))
Table 42 Global Electric Vehicle Charging Infrastructure Market by Charging Type, 2023-2033 (US$ Bn, AGR (%), CAGR (%))
Table 43 Global Electric Vehicle Charging Infrastructure Market by Infrastructure Type, 2023-2033 (US$ Bn, AGR (%), CAGR (%))
Table 44 North America Electric Vehicle Charging Infrastructure Market by Value, 2023-2033 (US$ Bn, AGR (%), CAGR (%))
Table 45 North America Electric Vehicle Charging Infrastructure Market by Country, 2023-2033 (US$ Bn, AGR (%), CAGR (%))
Table 46 North America Electric Vehicle Charging Infrastructure Market by Service, 2023-2033 (US$ Bn, AGR (%), CAGR (%))
Table 47 North America Electric Vehicle Charging Infrastructure Market by Level of Charging, 2023-2033 (US$ Bn, AGR (%), CAGR (%))
Table 48 North America Electric Vehicle Charging Infrastructure Market by Application, 2023-2033 (US$ Bn, AGR (%), CAGR (%))
Table 49 North America Electric Vehicle Charging Infrastructure Market by Charging Type, 2023-2033 (US$ Bn, AGR (%), CAGR (%))
Table 50 North America Electric Vehicle Charging Infrastructure Market by Infrastructure Type, 2023-2033 (US$ Bn, AGR (%), CAGR (%))
Table 51 US Electric Vehicle Charging Infrastructure Market by Value, 2023-2033 (US$ Bn, AGR (%), CAGR (%))
Table 52 Canada Electric Vehicle Charging Infrastructure Market by Value, 2023-2033 (US$ Bn, AGR (%), CAGR (%))
Table 53 Europe Electric Vehicle Charging Infrastructure Market by Value, 2023-2033 (US$ Bn, AGR (%), CAGR (%))
Table 54 Europe Electric Vehicle Charging Infrastructure Market by Country, 2023-2033 (US$ Bn, AGR (%), CAGR (%))
Table 55 Europe Electric Vehicle Charging Infrastructure Market by Service, 2023-2033 (US$ Bn, AGR (%), CAGR (%))
Table 56 Europe Electric Vehicle Charging Infrastructure Market by Level of Charging, 2023-2033 (US$ Bn, AGR (%), CAGR (%))
Table 57 Europe Electric Vehicle Charging Infrastructure Market by Application, 2023-2033 (US$ Bn, AGR (%), CAGR (%))
Table 58 Europe Electric Vehicle Charging Infrastructure Market by Charging Type, 2023-2033 (US$ Bn, AGR (%), CAGR (%))
Table 59 Europe Electric Vehicle Charging Infrastructure Market by Infrastructure Type, 2023-2033 (US$ Bn, AGR (%), CAGR (%))
Table 60 Germany Electric Vehicle Charging Infrastructure Market by Value, 2023-2033 (US$ Bn, AGR (%), CAGR (%))
Table 61 UK Electric Vehicle Charging Infrastructure Market by Value, 2023-2033 (US$ Bn, AGR (%), CAGR (%))
Table 62 France Electric Vehicle Charging Infrastructure Market by Value, 2023-2033 (US$ Bn, AGR (%), CAGR (%))
Table 63 Norway Electric Vehicle Charging Infrastructure Market by Value, 2023-2033 (US$ Bn, AGR (%), CAGR (%))
Table 64 Netherlands Electric Vehicle Charging Infrastructure Market by Value, 2023-2033 (US$ Bn, AGR (%), CAGR (%))
Table 65 Rest of Europe Electric Vehicle Charging Infrastructure Market by Value, 2023-2033 (US$ Bn, AGR (%), CAGR (%))
Table 66 Asia-Pacific Electric Vehicle Charging Infrastructure Market by Value, 2023-2033 (US$ Bn, AGR (%), CAGR (%))
Table 67 Asia-Pacific Electric Vehicle Charging Infrastructure Market by Country, 2023-2033 (US$ Bn, AGR (%), CAGR (%))
Table 68 Asia-Pacific Electric Vehicle Charging Infrastructure Market by Service, 2023-2033 (US$ Bn, AGR (%), CAGR (%))
Table 69 Asia-Pacific Electric Vehicle Charging Infrastructure Market by Level of Charging, 2023-2033 (US$ Bn, AGR (%), CAGR (%))
Table 70 Asia-Pacific Electric Vehicle Charging Infrastructure Market by Application, 2023-2033 (US$ Bn, AGR (%), CAGR (%))
Table 71 Asia-Pacific Electric Vehicle Charging Infrastructure Market by Charging Type, 2023-2033 (US$ Bn, AGR (%), CAGR (%))
Table 72 Asia-Pacific Electric Vehicle Charging Infrastructure Market by Infrastructure Type, 2023-2033 (US$ Bn, AGR (%), CAGR (%))
Table 73 China Electric Vehicle Charging Infrastructure Market by Value, 2023-2033 (US$ Bn, AGR (%), CAGR (%))
Table 74 India Electric Vehicle Charging Infrastructure Market by Value, 2023-2033 (US$ Bn, AGR (%), CAGR (%))
Table 75 Japan Electric Vehicle Charging Infrastructure Market by Value, 2023-2033 (US$ Bn, AGR (%), CAGR (%))
Table 76 South Korea Electric Vehicle Charging Infrastructure Market by Value, 2023-2033 (US$ Bn, AGR (%), CAGR (%))
Table 77 Australia Electric Vehicle Charging Infrastructure Market by Value, 2023-2033 (US$ Bn, AGR (%), CAGR (%))
Table 78 Rest of Asia-Pacific Electric Vehicle Charging Infrastructure Market by Value, 2023-2033 (US$ Bn, AGR (%), CAGR (%))
Table 79 Middle East & Africa Electric Vehicle Charging Infrastructure Market by Value, 2023-2033 (US$ Bn, AGR (%), CAGR (%))
Table 80 Middle East & Africa Electric Vehicle Charging Infrastructure Market by Country, 2023-2033 (US$ Bn, AGR (%), CAGR (%))
Table 81 Middle East & Africa Electric Vehicle Charging Infrastructure Market by Service, 2023-2033 (US$ Bn, AGR (%), CAGR (%))
Table 82 Middle East & Africa Electric Vehicle Charging Infrastructure Market by Level of Charging, 2023-2033 (US$ Bn, AGR (%), CAGR (%))
Table 83 Middle East & Africa Electric Vehicle Charging Infrastructure Market by Application, 2023-2033 (US$ Bn, AGR (%), CAGR (%))
Table 84 Middle East & Africa Electric Vehicle Charging Infrastructure Market by Charging Type, 2023-2033 (US$ Bn, AGR (%), CAGR (%))
Table 85 Middle East & Africa Electric Vehicle Charging Infrastructure Market by Infrastructure Type, 2023-2033 (US$ Bn, AGR (%), CAGR (%))
Table 86 GCC Electric Vehicle Charging Infrastructure Market by Value, 2023-2033 (US$ Bn, AGR (%), CAGR (%))
Table 87 South Africa Electric Vehicle Charging Infrastructure Market by Value, 2023-2033 (US$ Bn, AGR (%), CAGR (%))
Table 88 Rest of Middle East & Africa Electric Vehicle Charging Infrastructure Market by Value, 2023-2033 (US$ Bn, AGR (%), CAGR (%))
Table 89 Latin America Electric Vehicle Charging Infrastructure Market by Value, 2023-2033 (US$ Bn, AGR (%), CAGR (%))
Table 90 Latin America Electric Vehicle Charging Infrastructure Market by Country, 2023-2033 (US$ Bn, AGR (%), CAGR (%))
Table 91 Latin America Electric Vehicle Charging Infrastructure Market by Service, 2023-2033 (US$ Bn, AGR (%), CAGR (%))
Table 92 Latin America Electric Vehicle Charging Infrastructure Market by Level of Charging, 2023-2033 (US$ Bn, AGR (%), CAGR (%))
Table 93 Latin America Electric Vehicle Charging Infrastructure Market by Application, 2023-2033 (US$ Bn, AGR (%), CAGR (%))
Table 94 Latin America Electric Vehicle Charging Infrastructure Market by Charging Type, 2023-2033 (US$ Bn, AGR (%), CAGR (%))
Table 95 Latin America Electric Vehicle Charging Infrastructure Market by Infrastructure Type, 2023-2033 (US$ Bn, AGR (%), CAGR (%))
Table 96 Brazil Electric Vehicle Charging Infrastructure Market by Value, 2023-2033 (US$ Bn, AGR (%), CAGR (%))
Table 97 Mexico Electric Vehicle Charging Infrastructure Market by Value, 2023-2033 (US$ Bn, AGR (%), CAGR (%))
Table 98 Rest of Latin America Electric Vehicle Charging Infrastructure Market by Value, 2023-2033 (US$ Bn, AGR (%), CAGR (%))
Table 99 Strategic Outlook
Table 100 Electrify America LLC Key Details, (CEO, HQ, Revenue, Founded, No. of Employees, Company Type, Website, Business Segment)
Table 101 Electrify America LLC: Product Benchmarking
Table 102 Electrify America LLC: Strategic Outlook
Table 103 Delta Electronics Key Details, (CEO, HQ, Revenue, Founded, No. of Employees, Company Type, Website, Business Segment)
Table 104 Delta Electronics: Product Benchmarking
Table 105 Delta Electronics: Strategic Outlook
Table 106 Webasto SE Key Details, (CEO, HQ, Revenue, Founded, No. of Employees, Company Type, Website, Business Segment)
Table 107 Webasto SE : Product Benchmarking
Table 108 Webasto SE :Strategic Outlook
Table 109 Tesla, Inc Key Details, (CEO, HQ, Revenue, Founded, No. of Employees, Company Type, Website, Business Segment)
Table 110 Tesla, Inc: Product Benchmarking
Table 111 Tesla, Inc: Strategic Outlook
Table 112 Siemens AG Key Details, (CEO, HQ, Revenue, Founded, No. of Employees, Company Type, Website, Business Segment)
Table 113 Siemens AG: Product Benchmarking
Table 114 Siemens AG: Strategic Outlook
Table 115 Schneider Electric SE Key Details, (CEO, HQ, Revenue, Founded, No. of Employees, Company Type, Website, Business Segment)
Table 116 Schneider Electric SE: Product Benchmarking
Table 117 Schneider Electric SE: Strategic Outlook
Table 118 ABB Ltd Key Details, (CEO, HQ, Revenue, Founded, No. of Employees, Company Type, Website, Business Segment)
Table 119 ABB Ltd: Product Benchmarking
Table 120 ABB Ltd: Strategic Outlook
Table 121 AeroVironment, Inc Key Details, (CEO, HQ, Revenue, Founded, No. of Employees, Company Type, Website, Business Segment)
Table 122 AeroVironment, Inc: Product Benchmarking
Table 123 Eaton Corporation plc Key Details, (CEO, HQ, Revenue, Founded, No. of Employees, Company Type, Website, Business Segment)
Table 124 Eaton Corporation plc: Product Benchmarking
Table 125 Eaton Corporation plc: Strategic Outlook
Table 126 General Electric Company Key Details, (CEO, HQ, Revenue, Founded, No. of Employees, Company Type, Website, Business Segment)
Table 127 General Electric Company: Product Benchmarking
Table 128 General Electric Company: Strategic Outlook
Table 129 Leviton Manufacturing Company, Inc. Key Details, (CEO, HQ, Revenue, Founded, No. of Employees, Company Type, Website, Business Segment)
Table 130 Leviton Manufacturing Company, Inc.: Product Benchmarking
Table 131 Leviton Manufacturing Company, Inc.: Strategic Outlook
Table 132 Chargemaster Limited Key Details, (CEO, HQ, Revenue, Founded, No. of Employees, Company Type, Website, Business Segment)
Table 133 Chargemaster Limited: Product Benchmarking
Table 134 Chargemaster Limited: Strategic Outlook
Table 135 Enphase Energy, Inc. Key Details, (CEO, HQ, Revenue, Founded, No. of Employees, Company Type, Website, Business Segment)
Table 136 Enphase Energy, Inc.: Product Benchmarking
Table 137 Enphase Energy, Inc.: Strategic Outlook
Table 138 ChargePoint Holdings, Inc. Key Details, (CEO, HQ, Revenue, Founded, No. of Employees, Company Type, Website, Business Segment)
Table 139 ChargePoint Holdings, Inc.: Product Benchmarking
Table 140 ChargePoint Holdings, Inc.: Strategic Outlook
Table 141 SemaConnect Key Details, (CEO, HQ, Revenue, Founded, No. of Employees, Company Type, Website, Business Segment)
Table 142 SemaConnect: Product Benchmarking
Table 143 SemaConnect: Strategic Outlook
List of Figures
Figure 1 Electric Vehicle Charging Infrastructure Market Segmentation
Figure 2 Electric Vehicle Charging Infrastructure Market by Service: Market Attractiveness Index
Figure 3 Electric Vehicle Charging Infrastructure Market by Level of Charging: Market Attractiveness Index
Figure 4 Electric Vehicle Charging Infrastructure Market by Application: Market Attractiveness Index
Figure 5 Electric Vehicle Charging Infrastructure Market by Charging Type: Market Attractiveness Index
Figure 6 Electric Vehicle Charging Infrastructure Market by Infrastructure Type: Market Attractiveness Index
Figure 7 Electric Vehicle Charging Infrastructure Market Attractiveness Index by Region
Figure 8 Electric Vehicle Charging Infrastructure Market: Market Dynamics
Figure 9 Global Electric Vehicle Charging Infrastructure Market Share Forecast by COVID, 2023-2033 (%)
Figure 10 Global Electric Vehicle Charging Infrastructure Market Forecast, 2023-2033 (US$ Bn, AGR (%)) (V-Shaped Recovery Scenario)
Figure 11 Global Electric Vehicle Charging Infrastructure Market by Region, 2023-2033 (US$ Bn, AGR (%)) (V-Shaped Recovery Scenario)
Figure 12 Global Electric Vehicle Charging Infrastructure Market Forecast, 2023-2033 (US$ Bn, AGR (%)) (W-Shaped Recovery Scenario)
Figure 13 Global Electric Vehicle Charging Infrastructure Market by Region, 2023-2033 (US$ Bn, AGR (%)) (W-Shaped Recovery Scenario)
Figure 14 Global Electric Vehicle Charging Infrastructure Market Forecast, 2023-2033 (US$ Bn, AGR (%)) (U-Shaped Recovery Scenario)
Figure 15 Global Electric Vehicle Charging Infrastructure Market by Region, 2023-2033 (US$ Bn, AGR (%)) (U-Shaped Recovery Scenario)
Figure 16 Global Electric Vehicle Charging Infrastructure Market Forecast, 2023-2033 (US$ Bn, AGR (%)) (L-Shaped Recovery Scenario)
Figure 17 Global Electric Vehicle Charging Infrastructure Market by Region, 2023-2033 (US$ Bn, AGR (%)) (L-Shaped Recovery Scenario)
Figure 18 Electric Vehicle Charging Infrastructure Market: Porter’s Five Forces Analysis
Figure 19 Electric Vehicle Charging Infrastructure Market: PEST Analysis
Figure 20 Electric Vehicle Charging Infrastructure Market by Service: Market Attractiveness Index
Figure 21 Global Electric Vehicle Charging Infrastructure Market by Service, 2023-2033 (US$ Bn, AGR (%))
Figure 22 EV Charging Service Market by Region, 2023-2033 (US$ Bn, AGR (%))
Figure 23 Service Segment Market Share Forecast by Region, 2023 & 2033 (%)
Figure 24 Battery Swapping Service Market by Region, 2023-2033 (US$ Bn, AGR (%))
Figure 25 Service Segment Market Share Forecast by Region, 2023 & 2033 (%)
Figure 26 Electric Vehicle Charging Infrastructure Market by Level of Charging: Market Attractiveness Index
Figure 27 Global Electric Vehicle Charging Infrastructure Market by Level of Charging, 2023-2033 (US$ Bn, AGR (%))
Figure 28 Level 1 Market by Region, 2023-2033 (US$ Bn, AGR (%))
Figure 29 Level of Charging Segment Market Share Forecast by Region, 2023 & 2033 (%)
Figure 30 Level 2 Market by Region, 2023-2033 (US$ Bn, AGR (%))
Figure 31 Level of Charging Segment Market Share Forecast by Region, 2023 & 2033 (%)
Figure 32 Level 3 Market by Region, 2023-2033 (US$ Bn, AGR (%))
Figure 33 Level of Charging Segment Market Share Forecast by Region, 2023 & 2033 (%)
Figure 34 Electric Vehicle Charging Infrastructure Market by Application: Market Attractiveness Index
Figure 35 Global Electric Vehicle Charging Infrastructure Market by Application, 2023-2033 (US$ Bn, AGR (%))
Figure 36 Private Market by Region, 2023-2033 (US$ Bn, AGR (%))
Figure 37 Application Segment Market Share Forecast by Region, 2023 & 2033 (%)
Figure 38 Semi-Public Market by Region, 2023-2033 (US$ Bn, AGR (%))
Figure 39 Application Segment Market Share Forecast by Region, 2023 & 2033 (%)
Figure 40 Public Market by Region, 2023-2033 (US$ Bn, AGR (%))
Figure 41 Application Segment Market Share Forecast by Region, 2023 & 2033 (%)
Figure 42 Commercial Market by Region, 2023-2033 (US$ Bn, AGR (%))
Figure 43 Application Segment Market Share Forecast by Region, 2023 & 2033 (%)
Figure 44 Electric Vehicle Charging Infrastructure Market by Charging Type: Market Attractiveness Index
Figure 45 Global Electric Vehicle Charging Infrastructure Market by Charging Type, 2023-2033 (US$ Bn, AGR (%))
Figure 46 Slow DC (349 kW) Market by Region, 2023-2033 (US$ Bn, AGR (%))
Figure 53 Charging Type Segment Market Share Forecast by Region, 2023 & 2033 (%)
Figure 54 Other Charging Type Market by Region, 2023-2033 (US$ Bn, AGR (%))
Figure 55 Charging Type Segment Market Share Forecast by Region, 2023 & 2033 (%)
Figure 56 Electric Vehicle Charging Infrastructure Market by Infrastructure Type: Market Attractiveness Index
Figure 57 Global Electric Vehicle Charging Infrastructure Market by Infrastructure Type, 2023-2033 (US$ Bn, AGR (%))
Figure 58 Normal Charging Market by Region, 2023-2033 (US$ Bn, AGR (%), CAGR (%))
Figure 59 Charging Type Segment Market Share Forecast by Region, 2023 & 2033 (%)
Figure 60 Type 2 Market by Region, 2023-2033 (US$ Bn, AGR (%))
Figure 61 Charging Type Segment Market Share Forecast by Region, 2023 & 2033 (%)
Figure 62 CCS Market by Region, 2023-2033 (US$ Bn, AGR (%))
Figure 63 Charging Type Segment Market Share Forecast by Region, 2023 & 2033 (%)
Figure 64 CHAdeMO Market by Region, 2023-2033 (US$ Bn, AGR (%))
Figure 65 Charging Type Segment Market Share Forecast by Region, 2023 & 2033 (%)
Figure 66 Tesla SC Market by Region, 2023-2033 (US$ Bn, AGR (%))
Figure 67 Charging Type Segment Market Share Forecast by Region, 2023 & 2033 (%)
Figure 68 GB/T Fast Market by Region, 2023-2033 (US$ Bn, AGR (%))
Figure 69 Charging Type Segment Market Share Forecast by Region, 2023 & 2033 (%)
Figure 70 Electric Vehicle Charging Infrastructure Market Forecast by Region 2023 and 2033 (Revenue, CAGR%)
Figure 71 Global Electric Vehicle Charging Infrastructure Market Forecast, 2023-2033 (US$ Bn, AGR (%))
Figure 72 Global Electric Vehicle Charging Infrastructure Market by Region, 2023-2033 (US$ Bn, AGR (%))
Figure 73 Global Electric Vehicle Charging Infrastructure Market by Service, 2023-2033 (US$ Bn, AGR (%))
Figure 74 Global Electric Vehicle Charging Infrastructure Market by Level of Charging, 2023-2033 (US$ Bn, AGR (%))
Figure 75 Global Electric Vehicle Charging Infrastructure Market by Application, 2023-2033 (US$ Bn, AGR (%))
Figure 76 Global Electric Vehicle Charging Infrastructure Market by Charging Type, 2023-2033 (US$ Bn, AGR (%))
Figure 77 Global Electric Vehicle Charging Infrastructure Market by Infrastructure Type, 2023-2033 (US$ Bn, AGR (%))
Figure 78 North America Electric Vehicle Charging Infrastructure Market Attractiveness Index
Figure 79 North America Electric Vehicle Charging Infrastructure Market by Region, 2023, 2028 & 2033 (US$ Billion)
Figure 80 North America Electric Vehicle Charging Infrastructure Market by Value, 2023-2033 (US$ Bn, AGR (%))
Figure 81 North America Electric Vehicle Charging Infrastructure Market by Country, 2023-2033 (US$ Bn, AGR (%))
Figure 82 North America Electric Vehicle Charging Infrastructure Market Share Forecast by Country, 2023 & 2033 (%)
Figure 83 North America Electric Vehicle Charging Infrastructure Market by Service, 2023-2033 (US$ Bn, AGR (%))
Figure 84 North America Electric Vehicle Charging Infrastructure Market Share Forecast by Service, 2023-2033 (%)
Figure 85 North America Electric Vehicle Charging Infrastructure Market by Level of Charging, 2023-2033 (US$ Bn, AGR (%))
Figure 86 North America Electric Vehicle Charging Infrastructure Market Share Forecast by Level of Charging, 2023-2033 (%)
Figure 87 North America Electric Vehicle Charging Infrastructure Market by Application, 2023-2033 (US$ Bn, AGR (%))
Figure 88 North America Electric Vehicle Charging Infrastructure Market Share Forecast by Application, 2023-2033 (%)
Figure 89 North America Electric Vehicle Charging Infrastructure Market by Charging Type, 2023-2033 (US$ Bn, AGR (%))
Figure 90 North America Electric Vehicle Charging Infrastructure Market Share Forecast by Charging Type, 2023-2033 (%)
Figure 91 North America Electric Vehicle Charging Infrastructure Market by Infrastructure Type, 2023-2033 (US$ Bn, AGR (%))
Figure 92 North America Electric Vehicle Charging Infrastructure Market Share Forecast by Infrastructure Type, 2023-2033 (%)
Figure 93 US Electric Vehicle Charging Infrastructure Market by Value, 2023-2033 (US$ Bn, AGR (%))
Figure 94 Canada Electric Vehicle Charging Infrastructure Market by Value, 2023-2033 (US$ Bn, AGR (%))
Figure 95 Europe Electric Vehicle Charging Infrastructure Market Attractiveness Index
Figure 96 Europe Electric Vehicle Charging Infrastructure Market by Region, 2023, 2028 & 2033 (US$ Billion)
Figure 97 Europe Electric Vehicle Charging Infrastructure Market by Value, 2023-2033 (US$ Bn, AGR (%))
Figure 98 Europe Electric Vehicle Charging Infrastructure Market by Country, 2023-2033 (US$ Bn, AGR (%))
Figure 99 Europe Electric Vehicle Charging Infrastructure Market Share Forecast by Country, 2023 & 2033 (%)
Figure 100 Europe Electric Vehicle Charging Infrastructure Market by Service, 2023-2033 (US$ Bn, AGR (%))
Figure 101 Europe Electric Vehicle Charging Infrastructure Market Share Forecast by Service, 2023-2033 (%)
Figure 102 Europe Electric Vehicle Charging Infrastructure Market by Level of Charging, 2023-2033 (US$ Bn, AGR (%))
Figure 103 Europe Electric Vehicle Charging Infrastructure Market Share Forecast by Level of Charging, 2023-2033 (%)
Figure 104 Europe Electric Vehicle Charging Infrastructure Market by Application, 2023-2033 (US$ Bn, AGR (%))
Figure 105 Europe Electric Vehicle Charging Infrastructure Market Share Forecast by Application, 2023-2033 (%)
Figure 106 Europe Electric Vehicle Charging Infrastructure Market by Charging Type, 2023-2033 (US$ Bn, AGR (%))
Figure 107 Europe Electric Vehicle Charging Infrastructure Market Share Forecast by Charging Type, 2023-2033 (%)
Figure 108 Europe Electric Vehicle Charging Infrastructure Market by Infrastructure Type, 2023-2033 (US$ Bn, AGR (%))
Figure 109 Europe Electric Vehicle Charging Infrastructure Market Share Forecast by Infrastructure Type, 2023-2033 (%)
Figure 110 Germany Electric Vehicle Charging Infrastructure Market by Value, 2023-2033 (US$ Bn, AGR (%))
Figure 111 UK Electric Vehicle Charging Infrastructure Market by Value, 2023-2033 (US$ Bn, AGR (%))
Figure 112 France Electric Vehicle Charging Infrastructure Market by Value, 2023-2033 (US$ Bn, AGR (%))
Figure 113 Norway Electric Vehicle Charging Infrastructure Market by Value, 2023-2033 (US$ Bn, AGR (%))
Figure 114 Netherlands Electric Vehicle Charging Infrastructure Market by Value, 2023-2033 (US$ Bn, AGR (%))
Figure 115 Rest of Europe Electric Vehicle Charging Infrastructure Market by Value, 2023-2033 (US$ Bn, AGR (%))
Figure 116 Asia-Pacific Electric Vehicle Charging Infrastructure Market Attractiveness Index
Figure 117 Asia-Pacific Electric Vehicle Charging Infrastructure Market by Region, 2023, 2028 & 2033 (US$ Billion)
Figure 118 Asia-Pacific Electric Vehicle Charging Infrastructure Market by Value, 2023-2033 (US$ Bn, AGR (%))
Figure 119 Asia-Pacific Electric Vehicle Charging Infrastructure Market by Country, 2023-2033 (US$ Bn, AGR (%))
Figure 120 Asia-Pacific Electric Vehicle Charging Infrastructure Market Share Forecast by Country, 2023 & 2033 (%)
Figure 121 Asia-Pacific Electric Vehicle Charging Infrastructure Market by Service, 2023-2033 (US$ Bn, AGR (%))
Figure 122 Asia-Pacific Electric Vehicle Charging Infrastructure Market Share Forecast by Service, 2023-2033 (%)
Figure 123 Asia-Pacific Electric Vehicle Charging Infrastructure Market by Level of Charging, 2023-2033 (US$ Bn, AGR (%))
Figure 124 Asia-Pacific Electric Vehicle Charging Infrastructure Market Share Forecast by Level of Charging, 2023-2033 (%)
Figure 125 Asia-Pacific Electric Vehicle Charging Infrastructure Market by Application, 2023-2033 (US$ Bn, AGR (%))
Figure 126 Asia-Pacific Electric Vehicle Charging Infrastructure Market Share Forecast by Application, 2023-2033 (%)
Figure 127 Asia-Pacific Electric Vehicle Charging Infrastructure Market by Charging Type, 2023-2033 (US$ Bn, AGR (%))
Figure 128 Asia-Pacific Electric Vehicle Charging Infrastructure Market Share Forecast by Charging Type, 2023-2033 (%)
Figure 129 Asia-Pacific Electric Vehicle Charging Infrastructure Market by Infrastructure Type, 2023-2033 (US$ Bn, AGR (%))
Figure 130 Asia-Pacific Electric Vehicle Charging Infrastructure Market Share Forecast by Infrastructure Type, 2023-2033 (%)
Figure 131 China Electric Vehicle Charging Infrastructure Market by Value, 2023-2033 (US$ Bn, AGR (%))
Figure 132 India Electric Vehicle Charging Infrastructure Market by Value, 2023-2033 (US$ Bn, AGR (%))
Figure 133 Japan Electric Vehicle Charging Infrastructure Market by Value, 2023-2033 (US$ Bn, AGR (%))
Figure 134 South Korea Electric Vehicle Charging Infrastructure Market by Value, 2023-2033 (US$ Bn, AGR (%))
Figure 135 Australia Electric Vehicle Charging Infrastructure Market by Value, 2023-2033 (US$ Bn, AGR (%))
Figure 136 Rest of Asia-Pacific Electric Vehicle Charging Infrastructure Market by Value, 2023-2033 (US$ Bn, AGR (%))
Figure 137 Middle East & Africa Electric Vehicle Charging Infrastructure Market Attractiveness Index
Figure 138 Middle East & Africa Electric Vehicle Charging Infrastructure Market by Region, 2023, 2028 & 2033 (US$ Billion)
Figure 139 Middle East & Africa Electric Vehicle Charging Infrastructure Market by Value, 2023-2033 (US$ Bn, AGR (%))
Figure 140 Middle East & Africa Electric Vehicle Charging Infrastructure Market by Country, 2023-2033 (US$ Bn, AGR (%))
Figure 141 Middle East & Africa Electric Vehicle Charging Infrastructure Market Share Forecast by Country, 2023 & 2033 (%)
Figure 142 Middle East & Africa Electric Vehicle Charging Infrastructure Market by Service, 2023-2033 (US$ Bn, AGR (%))
Figure 143 Middle East & Africa Electric Vehicle Charging Infrastructure Market Share Forecast by Service, 2023-2033 (%)
Figure 144 Middle East & Africa Electric Vehicle Charging Infrastructure Market by Level of Charging, 2023-2033 (US$ Bn, AGR (%))
Figure 145 Middle East & Africa Electric Vehicle Charging Infrastructure Market Share Forecast by Level of Charging, 2023-2033 (%)
Figure 146 Middle East & Africa Electric Vehicle Charging Infrastructure Market by Application, 2023-2033 (US$ Bn, AGR (%))
Figure 147 Middle East & Africa Electric Vehicle Charging Infrastructure Market Share Forecast by Application, 2023-2033 (%)
Figure 148 Middle East & Africa Electric Vehicle Charging Infrastructure Market by Charging Type, 2023-2033 (US$ Bn, AGR (%))
Figure 149 Middle East & Africa Electric Vehicle Charging Infrastructure Market Share Forecast by Charging Type, 2023-2033 (%)
Figure 150 Middle East & Africa Electric Vehicle Charging Infrastructure Market by Infrastructure Type, 2023-2033 (US$ Bn, AGR (%))
Figure 151 Middle East & Africa Electric Vehicle Charging Infrastructure Market Share Forecast by Infrastructure Type, 2023-2033 (%)
Figure 152 GCC Electric Vehicle Charging Infrastructure Market by Value, 2023-2033 (US$ Bn, AGR (%))
Figure 153 South Africa Electric Vehicle Charging Infrastructure Market by Value, 2023-2033 (US$ Bn, AGR (%))
Figure 154 Rest of Middle East & Africa Electric Vehicle Charging Infrastructure Market by Value, 2023-2033 (US$ Bn, AGR (%))
Figure 155 Latin America Electric Vehicle Charging Infrastructure Market Attractiveness Index
Figure 156 Latin America Electric Vehicle Charging Infrastructure Market by Region, 2023, 2028 & 2033 (US$ Billion)
Figure 157 Latin America Electric Vehicle Charging Infrastructure Market by Value, 2023-2033 (US$ Bn, AGR (%))
Figure 158 Latin America Electric Vehicle Charging Infrastructure Market by Country, 2023-2033 (US$ Bn, AGR (%))
Figure 159 Latin America Electric Vehicle Charging Infrastructure Market Share Forecast by Country, 2023 & 2033 (%)
Figure 160 Latin America Electric Vehicle Charging Infrastructure Market by Service, 2023-2033 (US$ Bn, AGR (%))
Figure 161 Latin America Electric Vehicle Charging Infrastructure Market Share Forecast by Service, 2023-2033 (%)
Figure 162 Latin America Electric Vehicle Charging Infrastructure Market by Level of Charging, 2023-2033 (US$ Bn, AGR (%))
Figure 163 Latin America Electric Vehicle Charging Infrastructure Market Share Forecast by Level of Charging, 2023-2033 (%)
Figure 164 Latin America Electric Vehicle Charging Infrastructure Market by Application, 2023-2033 (US$ Bn, AGR (%))
Figure 165 Latin America Electric Vehicle Charging Infrastructure Market Share Forecast by Application, 2023-2033 (%)
Figure 166 Latin America Electric Vehicle Charging Infrastructure Market by Charging Type, 2023-2033 (US$ Bn, AGR (%))
Figure 167 Latin America Electric Vehicle Charging Infrastructure Market Share Forecast by Charging Type, 2023-2033 (%)
Figure 168 Latin America Electric Vehicle Charging Infrastructure Market by Infrastructure Type, 2023-2033 (US$ Bn, AGR (%))
Figure 169 Latin America Electric Vehicle Charging Infrastructure Market Share Forecast by Infrastructure Type, 2023-2033 (%)
Figure 170 Brazil Electric Vehicle Charging Infrastructure Market by Value, 2023-2033 (US$ Bn, AGR (%))
Figure 171 Mexico Electric Vehicle Charging Infrastructure Market by Value, 2023-2033 (US$ Bn, AGR (%))
Figure 172 Rest of Latin America Electric Vehicle Charging Infrastructure Market by Value, 2023-2033 (US$ Bn, AGR (%))
Figure 173 Electric Vehicle Charging Infrastructure Market: Company Share, 2022
Figure 174 Tesla, Inc: Net Revenue, 2018-2022 (US$ Million, AGR%)
Figure 175 Tesla, Inc: R&D, 2018-2022 (US$ Million, AGR%)
Figure 176 Tesla, Inc: Regional Revenue Share, 2022 (%)
Figure 177 Tesla, Inc: Business Segment Revenue Share, 2022 (%)
Figure 178 Siemens AG: Net Revenue, 2018-2022 (US$ Million, AGR%)
Figure 179 Siemens AG: R&D, 2018-2022 (US$ Million, AGR%)
Figure 180 Siemens AG: Regional Revenue Share, 2022 (%)
Figure 181 Siemens AG: Business Segment Revenue Share, 2022 (%)
Figure 182 Schneider Electric SE: Net Revenue, 2018-2022 (US$ Million, AGR%)
Figure 183 Schneider Electric SE: R&D, 2018-2022 (US$ Million, AGR%)
Figure 184 Schneider Electric SE: Regional Revenue Share, 2022 (%)
Figure 185 Schneider Electric SE: Business Segment Revenue Share, 2022 (%)
Figure 186 ABB Ltd: Net Revenue, 2018-2022 (US$ Million, AGR%)
Figure 187 ABB Ltd: R&D, 2018-2022 (US$ Million, AGR%)
Figure 188 ABB Ltd: Business Segment Revenue Share, 2022 (%)
Figure 189 AeroVironment, Inc: Net Revenue, 2018-2022 (US$ Million, AGR%)
Figure 190 AeroVironment, Inc: R&D, 2018-2022 (US$ Million, AGR%)
Figure 191 AeroVironment, Inc: Regional Revenue Share, 2022 (%)
Figure 192 AeroVironment, Inc: Business Segment Revenue Share, 2022 (%)
Figure 193 Eaton Corporation plc: Net Revenue, 2018-2022 (US$ Million, AGR%)
Figure 194 Eaton Corporation plc: R&D, 2018-2022 (US$ Million, AGR%)
Figure 195 Eaton Corporation plc: Regional Revenue Share, 2022 (%)
Figure 196 Eaton Corporation plc: Business Segment Revenue Share, 2022 (%)
Figure 197 General Electric Company: Net Revenue, 2018-2022 (US$ Million, AGR%)
Figure 198 General Electric Company: R&D, 2018-2022 (US$ Million, AGR%)
Figure 199 General Electric Company: Regional Revenue Share, 2022 (%)
Figure 200 General Electric Company: Business Segment Revenue Share, 2022 (%)
Figure 201 ChargePoint Holdings, Inc.: Net Revenue, 2020-2023 (US$ Million, AGR%)
Figure 202 ChargePoint Holdings, Inc.: R&D, 2020-2023 (US$ Million, AGR%)
Figure 203 ChargePoint Holdings, Inc.: Business Segment Revenue Share, 2022 (%)
ページTOPに戻る
Visiongain社の自動車・輸送分野での最新刊レポート
本レポートと同じKEY WORD(electric vehicle)の最新刊レポート
-
電気自動車テレマティクス市場 - 世界の電気自動車テレマティクス産業分析、規模、シェア、成長、動向、2023-2030年予測 - (技術別カバー率、車両タイプ別カバー率、用途別カバー率、地域別カバー率、企業別カバー率)
-
電気自動車用コネクターの世界市場 - 2023-2030
-
E-SUVの世界市場規模調査&予測:推進方式別(バッテリー電気自動車、ハイブリッド自動車)、タイプ別(コンパクトクロスオーバー、クロスオーバー、ミドルサイズ、フルサイズ)、座席数別(5シーター、6シーター、以上)、地域分析、2022-2029年
-
電気自動車用スケートボードプラットフォームの世界市場に関する洞察、2028年までの予測
-
電気自動車(EV)用充電器の世界市場調査レポート2022年版
-
India Electric Vehicle Market, By Vehicle Type (Passenger Car, LCV, M&HCV, Two-Wheeler, Three-Wheeler), By Propulsion (BEV, HEV, PHEV, FCEV), By Range (0-100 Km, 101-200 Km, Above 200 Km), By Charging Time (<5 Hr, 5-10 Hr, Above 10 Hr), By Region, By Top 10 States, By Competition Forecast & Opportunities, 2018- 2028F
-
電気自動車用ファスナーの世界市場に関する洞察、2028年までの予測
-
電気自動車ワイヤレス充電の世界市場:充電タイプ別(静的・動的)、電力供給範囲別(3〜11kW、12〜50kW、50kW以上)、充電システム別(磁気力伝達、誘導力伝達、容量力伝達)、車両タイプ別(電気乗用車、電気商用車)、地域別、競争、予測、機会、2025年
-
電気自動車(EV)用充電器の世界市場調査レポート2022年版
-
電気自動車用モーターコントローラの世界市場調査レポート2022年版
よくあるご質問
Visiongain社はどのような調査会社ですか?
英国の調査会社ヴィジョンゲイン社(Visiongain)は、通信とエネルギーのほか、自動車や化学・医薬品、金属など、広範な市場を対象に調査を行っています。自動車市場については、市場全般に関する調査のほ... もっと見る
調査レポートの納品までの日数はどの程度ですか?
在庫のあるものは速納となりますが、平均的には 3-4日と見て下さい。
但し、一部の調査レポートでは、発注を受けた段階で内容更新をして納品をする場合もあります。
発注をする前のお問合せをお願いします。
注文の手続きはどのようになっていますか?
1)お客様からの御問い合わせをいただきます。
2)見積書やサンプルの提示をいたします。
3)お客様指定、もしくは弊社の発注書をメール添付にて発送してください。
4)データリソース社からレポート発行元の調査会社へ納品手配します。
5) 調査会社からお客様へ納品されます。最近は、pdfにてのメール納品が大半です。
お支払方法の方法はどのようになっていますか?
納品と同時にデータリソース社よりお客様へ請求書(必要に応じて納品書も)を発送いたします。
お客様よりデータリソース社へ(通常は円払い)の御振り込みをお願いします。
請求書は、納品日の日付で発行しますので、翌月最終営業日までの当社指定口座への振込みをお願いします。振込み手数料は御社負担にてお願いします。
お客様の御支払い条件が60日以上の場合は御相談ください。
尚、初めてのお取引先や個人の場合、前払いをお願いすることもあります。ご了承のほど、お願いします。
データリソース社はどのような会社ですか?
当社は、世界各国の主要調査会社・レポート出版社と提携し、世界各国の市場調査レポートや技術動向レポートなどを日本国内の企業・公官庁及び教育研究機関に提供しております。
世界各国の「市場・技術・法規制などの」実情を調査・収集される時には、データリソース社にご相談ください。
お客様の御要望にあったデータや情報を抽出する為のレポート紹介や調査のアドバイスも致します。
|
|

