自律走行車市場レポート:2024-2034
Autonomous Vehicle Market Report 2024-2034
レポート詳細
自律走行車市場レポート 2024-2034年 :本レポートは、業界とその基礎となるダイナミクスをより良く理解したい場合、新たな収益ポケットを目指す大手企業にとって貴重なものとなる。ま... もっと見る
※上記価格は部署ライセンス(Departmental licence)価格です。
その他の価格についてはデータリソースまでお問合せください。
日本語のページは自動翻訳を利用し作成しています。
実際のレポートは英文のみでご納品いたします。

|

|
サマリー
レポート詳細
自律走行車市場レポート 2024-2034年:本レポートは、業界とその基礎となるダイナミクスをより良く理解したい場合、新たな収益ポケットを目指す大手企業にとって貴重なものとなる。また、異業種への進出や新規地域での既存事業の拡大を目指す企業にも有用です。
自律走行車市場を推進する主な要因のひとつは、安全性と効率性の絶え間ない追求である。
自律走行車市場は、技術の進歩、消費者の嗜好の変化、既存の自動車メーカーとハイテク大手の両方からの投資の増加に牽引され、急速な成長を続けている。より安全で効率的な輸送が約束される自律走行車は、人とモノの世界的な移動方法に革命を起こす態勢を整えている。
高度なセンサーと人工知能を搭載した自律走行車によって、ヒューマンエラーによる事故を減らせる可能性は大きい。さらに、高齢者や身体障害者のモビリティが向上するという見通しは、社会的に大きな利益をもたらす。さらに、ライドシェアリングやモビリティ・アズ・ア・サービス(MaaS)プラットフォームに対する需要の高まりが、自律走行車の採用をさらに後押ししている。
自律走行車市場は、技術革新とコラボレーションの機会を数多く提供している。センサー技術、機械学習アルゴリズム、接続ソリューションの進歩は、車両の自律性とインテリジェンスを強化する道を提示する。さらに、自律走行車をスマートシティのインフラに統合することで、シームレスな交通システムと最適化された交通の流れへの扉が開かれる。さらに、自動車メーカー、テクノロジー企業、政府機関がパートナーシップを結ぶことで、規制の枠組みやインフラ整備が促進され、普及が促進される。
新興国におけるインフラ不足が市場成長の妨げに
自律走行車市場の成長に影響を与える重大な阻害要因の1つは、新興国における必要なインフラの不足である。先進国では自律走行車に対応するためのインフラ整備が進んでいるが、新興国の多くはこの点で出遅れている。新興国では、高度な道路網、インテリジェント交通システム、堅牢な通信ネットワークなど、自律走行車をサポートするために必要なインフラが不十分であったり、未整備であったりすることが多い。このインフラ不足は、自律走行車の普及にいくつかの課題をもたらしている。
市場調査レポートを購入する前にすべき質問とは?
-
自律走行車市場はどのように進化しているのか?
-
何が自律走行車市場を牽引し、抑制しているのか?
-
予測期間中、自律走行車の各サブマーケット分野はどのように成長し、2034年にこれらのサブマーケットが占める売上はいくらになるのか?
-
2024年から2034年にかけて、自律走行車の各サブマーケットの市場シェアはどのように推移するか?
-
2024年から2034年にかけて、市場全体を牽引する主な要因は何か?
-
主要な自律走行車市場はマクロ経済のダイナミクスに幅広く追随するのだろうか、それとも個々の国の市場が他を凌駕するのだろうか。
-
2034年までに各国市場のシェアはどのように変化し、どの地域が2034年の市場をリードするのか。
-
主要プレーヤーと予測期間中の見通しは?
-
これらの大手企業の自律走行車プロジェクトとは?
-
2024年から2034年の間に、業界はどのように進化するのか?現在、そして今後10年間に行われる自律走行車プロジェクトにはどのような影響があるのか?
-
自律走行車市場をさらに拡大するためには、製品の商業化がより必要なのだろうか?
-
自律走行車市場はどこに向かっているのか、そしてどのようにすれば市場の最前線に立てるのか。
-
新商品や新サービスに最適な投資方法とは?
-
企業を新たな成長軌道に乗せ、C-suiteに移行させるための重要な展望とは?
このことが自律走行車市場に現在、そして今後10年間でどのような影響を与えるかを見極める必要がある:
-
414ページに及ぶレポートには、127の表と211の図表が掲載されている。
-
について本レポートでは、業界の主要な有利分野を取り上げている
-
世界、地域、国の売上高と成長に関する詳細な分析が含まれている。
-
競合他社が成功した主なトレンド、変化、収益予測をハイライトします。
本レポートは、今後10年間に自律走行車市場がどのように発展するか、またCOVID-19の景気後退と好転の変動に合わせてTODAYをお伝えする。この市場は、過去10年間のどの時点よりも今が重要である。
2034年までの予測やその他の分析から、商業的な展望が明らかになる
-
2034年までの収益予測に加え、最近の実績、成長率、市場シェアも提供している。
-
ビジネスの展望や展開など、独自の分析が掲載されている。
-
質的分析(市場力学、促進要因、機会、阻害要因、課題を含む)、コスト構造、自律走行車価格上昇の影響、最近の動向をご覧ください。
本レポートには、COVID-19が業界と貴社にどのような影響を与えるかについてのデータ分析と貴重な洞察が含まれている。本レポートでは、COVID-19の4つの回収パターンとその影響、すなわち「V」、「L」、「W」、「U」について論じている。
レポート対象セグメント
コンポーネント別市場セグメント
車両タイプ別市場セグメント
技術別市場セグメント
-
センサーと知覚システム
-
コンピューティング&プロセッシング・ユニット
-
コネクティビティ・ソリューション
-
ソフトウェアプラットフォーム
自律性のレベルによる市場セグメント
-
レベル1:ドライバー・アシスト
-
レベル2:部分的自動化
-
レベル3:条件付きオートメーション
-
レベル4:高度な自動化
-
レベル5:完全自動化
システム別市場セグメント
-
アダプティブ・クルーズ・コントロール(ACC)
-
ドライバー・モニタリング・システム(DMS)
-
前方衝突警告(FCW)
-
車線逸脱警報(LDW)
-
歩行者検知システム(PDS)
-
その他のシステム
世界市場全体とセグメント別の収益予測に加え、4つの地域と20の主要国市場の収益予測も掲載しています:
北米
欧州
-
ドイツ
-
スペイン
-
イギリス
-
フランス
-
イタリア
-
その他の欧州地域
アジア太平洋
-
中国
-
日本
-
インド
-
オーストラリア
-
韓国
-
その他のアジア太平洋地域
ラテンアメリカ
中東・アフリカ
本レポートでは、自律走行車市場の2024年から2034年にかけての主要企業のプロファイルも掲載している。
主要企業と市場成長の可能性
-
アイシンコーポレーション
-
オートエックス・テクノロジーズ
-
株式会社デンソー
-
アインライドAB
-
フォード・モーター・カンパニー
-
ゼネラルモーターズ社
-
ヒュンダイ・モービス
-
インフィニオン・テクノロジーズAG
-
メルセデス・ベンツ・グループAG
-
モービルアイ・グローバル社
-
株式会社ニューロ
-
エヌビディア・コーポレーション
-
テスラ社
-
トヨタ自動車株式会社
-
フォルクスワーゲンAG
2024年から2034年までの自律走行車市場全体の世界売上高(金額ベース)は、2024年に432.7億米ドルを突破する。2034年まで力強い収益成長を予測。当調査では、最も大きな可能性を秘めた企業を特定しています。彼らの能力、進歩、商業的展望を発見し、あなたが一歩先を行くのを支援します。
自律走行車市場、2024-2034年レポートはどのように役立つのか?
要約すると、410ページを超えるこのレポートは、以下の知識を提供する:
-
自律走行車市場の2024年から2034年までの収益予測 コンポーネント、車両タイプ、技術、自律走行レベル、システムの各予測を、世界レベルと地域レベルで掲載 ? 業界の展望を発見し、投資と収益に最も有利な場所を見つけます。
-
Revenue forecasts to 2034 for four regional and 20 key national markets ? See forecasts for the Autonomous Vehicle Market, 2024 to 2034 market in 北米, ヨーロッパ, Asia-Pacific, ラテンアメリカ and 中東・アフリカ. Also forecasted is the market in the US,カナダ,ブラジル,ドイツ,フランス, UK,イタリア,中国,インド,日本, andオーストラリア among other prominent economies.
-
2024年から2034年までの自律走行車市場に関わる主要企業15社の企業プロファイルを含む。
独自の予測による定量的・定性的分析をご覧ください。私たちのレポートだけに含まれる情報を入手し、貴重なビジネスインテリジェンスで情報を得ることができます。
他にはない情報
私たちの新しいレポートがあれば、知識に遅れをとったり、チャンスを逃したりする可能性が低くなります。弊社のレポートが貴社の調査、分析、意思決定にどのように役立つかをご覧ください。Visiongainの調査は、自律走行車市場、2024年から2034年、市場をリードする企業の商業分析を必要とするすべての人のためのものです。データ、トレンド、予測をご覧いただけます。
ページTOPに戻る
目次
1 レポート概要
1.1 研究の目的
1.2 自律走行車市場の紹介
1.3 本レポートの特徴
1.4 本レポートを読むべき理由
1.5 本分析レポートが回答する主な質問
1.6 本レポートは誰のためのものか?
1.7 方法論
1.7.1 市場の定義
1.7.2 市場評価・予測手法
1.7.3 データの検証
1.7.3.1 一次調査
1.7.3.2 セカンダリーリサーチ
1.8 よくある質問(FAQ)
1.9 Visiongainの関連レポート
1.10 Visiongainについて
2 エグゼクティブ・サマリー
3 市場概要
3.1 主要な調査結果
3.2 市場ダイナミクス
3.2.1 市場牽引要因
3.2.1.1 市場成長を牽引する自律走行車の適応
3.2.1.2 コネクテッド・ビークル技術とダイナミクス・モビリティ・アプリケーションの成長
3.2.1.3 運転支援システムの需要拡大が市場成長を牽引
3.2.2 市場抑制要因
3.2.2.1 新興国におけるインフラ不足が市場成長の阻害要因
3.2.2.2 自動運転車の消費者受容が市場成長を妨げる
3.2.2.3 高いシステムコストと部品コストが市場成長を妨げる
3.2.3 市場機会
3.2.3.1 自律走行車における新技術の採用拡大が市場にとっての機会
3.2.3.2 ビジネスチャンスの拡大
3.2.3.3 市場プレイヤー間のコラボレーションとパートナーシップ 市場成長の機会
3.3 ポーターのファイブフォース分析
3.3.1 サプライヤーの交渉力(低~中)
3.3.2 買い手の交渉力(高)
3.3.3 競争力(中〜高)
3.3.4 代替品による脅威(低)
3.3.5 新規参入企業の脅威(高)
3.4 COVID-19の影響分析
3.4.1 "V字型回復"
3.4.2 "U字型回復"
3.4.3 "W字型回復"
3.4.4 "L字型回復"
3.5 PEST分析
4 自律走行車市場分析:コンポーネント別
4.1 主な調査結果
4.2 コンポーネントセグメント 市場魅力度指数
4.3 コンポーネント別自律走行車市場規模推定と予測
4.4 ハードウェア
4.4.1 2024〜2034年の地域別市場規模(US$ Billion)
4.4.2 地域別市場シェア、2024年・2034年(%)
4.5 ソフトウェア
4.5.1 2024〜2034年の地域別市場規模(US$ Billion)
4.5.2 地域別市場シェア、2024年・2034年(%)
5 自律走行車市場分析:車両タイプ別
5.1 主な調査結果
5.2 車両タイプ別セグメント 市場魅力度指数
5.3 車両タイプ別自律走行車市場規模推定と予測
5.4 乗用車
5.4.1 2024〜2034年の地域別市場規模(US$ Billion)
5.4.2 地域別市場シェア、2024年・2034年(%)
5.5 商用車
5.5.1 2024〜2034年の地域別市場規模(US$ Billion)
5.5.2 地域別市場シェア、2024年・2034年(%)
5.6 特殊用途車両(配送ロボット、農業用自律走行車など)
5.6.1 2024〜2034年の地域別市場規模(US$ Billion)
5.6.2 地域別市場シェア、2024年・2034年(%)
6 自律走行車市場分析:技術別
6.1 主な調査結果
6.2 技術セグメント 市場魅力度指数
6.3 技術別の自律走行車市場規模推定と予測
6.4 センサーと知覚システム
6.4.1 2024〜2034年の地域別市場規模(US$ Billion)
6.4.2 地域別市場シェア、2024年・2034年(%)
6.5 コンピューティング・処理ユニット
6.5.1 2024〜2034年の地域別市場規模(US$ Billion)
6.5.2 地域別市場シェア、2024年・2034年(%)
6.6 コネクティビティ・ソリューション
6.6.1 2024〜2034年の地域別市場規模(US$ Billion)
6.6.2 地域別市場シェア、2024年・2034年(%)
6.7 ソフトウェアプラットフォーム
6.7.1 2024〜2034年の地域別市場規模(US$ Billion)
6.7.2 地域別市場シェア、2024年・2034年(%)
7 自律走行車市場分析:自律性レベル別
7.1 主な調査結果
7.2 自律走行レベルセグメント: 市場魅力度指数
7.3 自律走行レベル別の市場規模推定と予測
7.4 レベル1:ドライバー支援
7.4.1 2024〜2034年の地域別市場規模(US$ Billion)
7.4.2 地域別市場シェア、2024年・2034年(%)
7.5 レベル2:部分自動化
7.5.1 2024〜2034年の地域別市場規模(US$ Billion)
7.5.2 地域別市場シェア、2024年・2034年(%)
7.6 レベル3:条件付き自動化
7.6.1 2024〜2034年の地域別市場規模(US$ Billion)
7.6.2 地域別市場シェア、2024年・2034年(%)
7.7 レベル4:高度自動化
7.7.1 2024〜2034年の地域別市場規模(US$ Billion)
7.7.2 地域別市場シェア、2024年・2034年(%)
7.8 レベル5:完全自動化
7.8.1 2024〜2034年の地域別市場規模(US$ Billion)
7.8.2 地域別市場シェア、2024年・2034年(%)
8 自律走行車市場分析:システム別
8.1 主な調査結果
8.2 システムセグメント 市場魅力度指数
8.3 システム別自律走行車市場規模推定と予測
8.4 アダプティブクルーズコントロール(ACC)
8.4.1 2024〜2034年の地域別市場規模(US$ Million)
8.4.2 地域別市場シェア、2024年・2034年(%)
8.5 ドライバーモニタリングシステム(DMS)
8.5.1 2024~2034年の地域別市場規模(US$ Million)
8.5.2 地域別市場シェア、2024年・2034年(%)
8.6 前方衝突警報(FCW)
8.6.1 2024~2034年の地域別市場規模(US$ Million)
8.6.2 地域別市場シェア、2024年・2034年(%)
8.7 車線逸脱警報(LDW)
8.7.1 2024〜2034年の地域別市場規模(US$ Million)
8.7.2 地域別市場シェア、2024年・2034年(%)
8.8 歩行者検知システム(PDS)
8.8.1 2024~2034年の地域別市場規模(US$ Million)
8.8.2 地域別市場シェア、2024年・2034年(%)
8.9 その他のシステム
8.9.1 2024~2034年の地域別市場規模(US$ Million)
8.9.2 地域別市場シェア、2024年・2034年(%)
9 自律走行車市場分析:地域別
9.1 主要な調査結果
9.2 地域別市場規模の推定と予測
10 北米の自律走行車市場の分析
10.1 主要な調査結果
10.2 北米の自律走行車市場魅力度指数
10.3 北米の自律走行車市場の国別市場規模、2024年、2029年、2034年(US$ Billion)
10.4 北米の自律走行車市場規模推定と予測
10.5 北米の自律走行車市場規模推定と予測:国別
10.6 北米の自律走行車市場規模推定と予測:コンポーネント別
10.7 北米の自律走行車市場規模推定と予測:車両タイプ別
10.8 北米自律走行車の市場規模推定と予測:技術別
10.9 北米の自律走行車市場規模推定と予測:自律走行レベル別
10.10 北米の自律走行車市場規模推定と予測:システム別
10.11 アメリカの自律走行車市場分析
10.12 カナダの自律走行車市場分析
11 欧州の自律走行車市場分析
11.1 主要な調査結果
11.2 欧州自律走行車市場魅力度指数
11.3 欧州の自律走行車国別市場、2024年・2029年・2034年(US$ Billion)
11.4 欧州の自律走行車市場規模推定と予測
11.5 欧州の自律走行車市場規模推定と予測:国別
11.6 欧州の自律走行車市場規模推定と予測:コンポーネント別
11.7 欧州の自律走行車市場規模推定と予測:車両タイプ別
11.8 欧州の自律走行車市場規模推定と予測:技術別
11.9 欧州の自律走行車市場規模推定と予測:自律走行レベル別
11.10 欧州の自律走行車市場規模推定と予測:システム別
11.11 ドイツの自律走行車市場分析
11.12 イギリスの自律走行車市場分析
11.13 フランスの自律走行車市場分析
11.14 イタリアの自律走行車市場分析
11.15 スペインの自律走行車市場分析
11.16 その他の欧州の自律走行車市場分析
12 アジア太平洋地域の自律走行車市場分析
12.1 主要な調査結果
12.2 アジア太平洋地域の自律走行車市場魅力度指数
12.3 アジア太平洋地域の自律走行車市場の国別市場規模、2024年、2029年、2034年(US$ Billion)
12.4 アジア太平洋地域の自律走行車市場規模推定と予測
12.5 アジア太平洋地域の自律走行車市場規模推定と予測:国別
12.6 アジア太平洋地域の自律走行車市場規模推定と予測:コンポーネント別
12.7 アジア太平洋地域の自律走行車市場規模推定と予測:車両タイプ別
12.8 アジア太平洋地域の自律走行車市場規模推定と予測:技術別
12.9 アジア太平洋地域の自律走行車市場規模推定と予測:自律性のレベル別
12.10 アジア太平洋地域の自律走行車市場規模推定と予測:システム別
12.11 中国の自律走行車市場分析
12.12 インドの自律走行車市場分析
12.13 日本の自律走行車市場分析
12.14 韓国の自律走行車市場分析
12.15 オーストラリアの自律走行車市場分析
12.16 その他のアジア太平洋地域の自律走行車市場分析
13 中東・アフリカの自律走行車市場分析
13.1 主要な調査結果
13.2 中東・アフリカの自律走行車市場魅力度指数
13.3 中東・アフリカの自律走行車国別市場、2024年・2029年・2034年(US$ Billion)
13.4 中東・アフリカの自律走行車市場規模推定と予測
13.5 中東・アフリカの自律走行車市場規模推定と予測:国別
13.6 中東・アフリカの自律走行車市場規模推定と予測:コンポーネント別
13.7 中東・アフリカの自律走行車市場規模推定と予測:車両タイプ別
13.8 中東・アフリカの自律走行車市場規模推定と予測:技術別
13.9 中東・アフリカの自律走行車市場規模推定と予測:自律走行レベル別
13.10 中東・アフリカの自律走行車市場規模推定と予測:システム別
13.11 GCCの自律走行車市場分析
13.12 南アフリカの自律走行車市場分析
13.13 その他の中東・アフリカ地域の自律走行車市場分析
14 ラテンアメリカの自律走行車市場分析
14.1 主要な調査結果
14.2 ラテンアメリカの自律走行車市場魅力度指数
14.3 ラテンアメリカの自律走行車国別市場、2024年・2029年・2034年(US$ Billion)
14.4 ラテンアメリカの自律走行車市場規模推定と予測
14.5 ラテンアメリカの自律走行車市場規模推定と予測:国別
14.6 ラテンアメリカの自律走行車市場規模推定と予測:コンポーネント別
14.7 ラテンアメリカの自律走行車市場規模推定と予測:車両タイプ別
14.8 ラテンアメリカの自律走行車市場規模推定と予測:技術別
14.9 ラテンアメリカの自律走行車市場規模推定と予測:自律走行レベル別
14.10 ラテンアメリカの自律走行車市場規模推定と予測:システム別
14.11 ブラジルの自律走行車市場分析
14.12 メキシコの自律走行車市場分析
14.13 その他のラテンアメリカの自律走行車市場分析
15 会社概要
15.1 競争環境、2022年
15.2 戦略的展望
15.3 General Motors Company
15.3.1 会社概要
15.3.2 会社概要
15.3.3 財務分析
15.3.3.1 純収入、2019-2023年
15.3.3.2 R&D、2019-2023年
15.3.3.3 地域別収益シェア、2023年(%)
15.3.3.4 事業セグメント収益シェア、2023年(%)
15.3.4 製品ベンチマーク
15.3.5 戦略的展望
15.4 Mercedes-Benz Group AG
15.4.1 会社概要
15.4.2 会社概要
15.4.3 財務分析
15.4.3.1 純収入、2019-2023年
15.4.3.2 R&D、2019-2023年
15.4.3.3 地域別収益シェア、2023年(%)
15.4.3.4 事業セグメント収益シェア、2023年(%)
15.4.4 製品ベンチマーク
15.4.5 戦略的展望
15.5 Ford Motor Company
15.5.1 会社概要
15.5.2 会社概要
15.5.3 財務分析
15.5.3.1 純収入、2019-2023年
15.5.3.2 R&D、2019-2023年
15.5.3.3 地域別収益シェア、2023年(%)
15.5.3.4 事業セグメント収益シェア、2023年(%)
15.5.4 製品ベンチマーク
15.5.5 戦略的展望
15.6 NVIDIA Corporation
15.6.1 会社概要
15.6.2 会社概要
15.6.3 財務分析
15.6.3.1 純収入、2020-2024年
15.6.3.2 R&D、2020-2024年
15.6.3.3 地域別売上シェア、2023年(%)
15.6.3.4 事業セグメント別売上シェア、2023年(%)
15.6.4 製品ベンチマーク
15.6.5 戦略的展望
15.7 Volkswagen AG
15.7.1 会社概要
15.7.2 会社概要
15.7.3 財務分析
15.7.3.1 純収入、2019-2023年
15.7.3.2 R&D、2019-2023年
15.7.3.3 事業セグメント別売上高シェア、2022年(%)
15.7.4 製品ベンチマーク
15.7.5 戦略的展望
15.8 Toyota Motor Corporation
15.8.1 会社概要
15.8.2 会社概要
15.8.3 財務分析
15.8.3.1 純収入、2019-2023年
15.8.3.2 R&D、2019-2023年
15.8.3.3 地域別収益シェア、2022年(%)
15.8.3.4 事業セグメント収益シェア、2022年(%)
15.8.4 製品ベンチマーク
15.8.5 戦略的展望
15.9 Mobileye Global Inc.
15.9.1 会社概要
15.9.2 会社概要
15.9.3 財務分析
15.9.3.1 純収入、2019-2023年
15.9.3.2 R&D、2019年~2023年
15.9.3.3 事業セグメント収益シェア、2023年(%)
15.9.4 製品ベンチマーク
15.9.5 戦略的展望
15.10 Denso Corporation
15.10.1 会社概要
15.10.2 会社概要
15.10.3 財務分析
15.10.3.1 純収入、2019-2023年
15.10.4 製品ベンチマーク
15.11 Nuro, Inc.
15.11.1 会社概要
15.11.2 会社概要
15.11.3 製品ベンチマーク
15.11.4 戦略的展望
15.12 Tesla, Inc
15.12.1 会社概要
15.12.2 会社概要
15.12.3 財務分析
15.12.3.1 純収入、2019-2023年
15.12.3.2 R&D、2019-2023年
15.12.3.3 地域別収益シェア、2022年(%)
15.12.3.4 事業セグメント収益シェア、2022年(%)
15.12.4 製品ベンチマーク
15.13 Aisin Corporation
15.13.1 会社概要
15.13.2 会社概要
15.13.3 財務分析
15.13.3.1 純収入、2019-2023年
15.13.3.2 売上高、2019-2023年
15.13.4 製品ベンチマーク
15.14 Infineon Technologies AG
15.14.1 会社概要
15.14.2 会社概要
15.14.3 財務分析
15.14.3.1 純収入、2019-2023年
15.14.3.2 R&D、2019-2023年
15.14.3.3 地域別売上高シェア(2023年)
15.14.3.4 事業セグメント収益シェア、2023年(%)
15.14.4 製品ベンチマーク
15.14.5 戦略的展望
15.15 Hyundai Mobis
15.15.1 会社概要
15.15.2 会社概要
15.15.3 財務分析
15.15.3.1 純収入、2019-2023年
15.15.3.2 R&D、2019-2023年
15.15.3.3 地域別売上高シェア、2022年(%)
15.15.3.4 事業セグメント収益シェア、2022年(%)
15.15.4 製品ベンチマーク
15.15.5 戦略的展望
15.16 AutoX Technologies Inc
15.16.1 会社概要
15.16.2 会社概要
15.16.3 製品ベンチマーク
15.17 アインライドAB
15.17.1 会社概要
15.17.2 会社概要
15.17.3 製品ベンチマーク
16 結論と提言
16.1 Visiongainからの結びの言葉
16.2 市場プレイヤーへの提言
ページTOPに戻る
図表リスト
表の一覧
表1 自律走行車市場のスナップショット、2024年~2034年(10億米ドル、CAGR %)
表2 2024~2034年自律走行車の世界地域別市場規模(億米ドル、AGR(%)、CAGR(%))(V字回復シナリオ)
表3 自律走行車の世界地域別市場:2024年~2034年(億米ドル、AGR(%)、CAGR(%))(U字回復シナリオ)
表4 自律走行車の世界地域別市場:2024~2034年(億米ドル、AGR(%)、CAGR(%))(W字型回復シナリオ)
表5 自律走行車の世界地域別市場:2024年~2034年(億米ドル、AGR(%)、CAGR(%))(L字型回復シナリオ)
表6 自律走行車の世界市場:コンポーネント別、2024年~2034年(億米ドル、AGR (%)、CAGR (%)
表7 地域別ハードウェア市場:2024年~2034年(億米ドル、AGR (%)、CAGR (%)
表8 地域別ソフトウェア市場、2024年~2034年(億米ドル、AGR (%)、CAGR (%)
表9 自律走行車の世界市場:自動車タイプ別、2024年~2034年(億米ドル、AGR (%)、CAGR (%)
表10 乗用車の地域別市場:2024年~2034年(億米ドル、AGR (%)、CAGR (%)
表11 商用車の地域別市場:2024-2034年(億米ドル、AGR (%)、CAGR (%)
表12 特殊用途自動車の地域別市場:2024年~2034年(億米ドル、AGR (%)、CAGR (%)
表13 自律走行車の世界市場:技術別、2024-2034年(億米ドル、AGR (%)、CAGR (%)
表14 センサーと知覚システムの地域別市場:2024-2034年(億米ドル、AGR (%)、CAGR (%)
表15 コンピューティング・処理ユニット市場:地域別 2024-2034年 (億米ドル、AGR (%)、CAGR (%)
表16 コネクティビティ・ソリューションの地域別市場:2024-2034年(億米ドル、AGR (%)、CAGR (%)
表17 ソフトウェアプラットフォーム市場:地域別、2024年~2034年(億米ドル、AGR (%)、CAGR (%)
表18 自律走行車のレベル別世界市場:2024年~2034年(億米ドル、AGR (%)、CAGR (%)
表19 レベル1:地域別運転支援市場、2024年~2034年(億米ドル、AGR (%)、CAGR (%)
表20 レベル2:部分自動化市場の地域別推移(2024~2034年、10億米ドル、AGR (%)、CAGR (%)
表21 レベル3:条件付き自動化市場の地域別推移(2024~2034年、10億米ドル、AGR (%)、CAGR (%)
表22 レベル4:地域別高度自動化市場:2024-2034年(億米ドル、AGR (%)、CAGR (%)
表23 レベル5:地域別完全自動化市場、2024年~2034年(億米ドル、AGR (%)、CAGR (%)
表24 自律走行車の世界市場:システム別、2024-2034年(億米ドル、AGR (%)、CAGR (%)
表25 アダプティブクルーズコントロール(ACC)の地域別市場、2024年~2034年(億米ドル、AGR (%)、CAGR (%)
表26 ドライバーモニタリングシステム(DMS)地域別市場:2024〜2034年(億米ドル、AGR (%)、CAGR (%)
表27 前方衝突警報(FCW)の地域別市場:2024〜2034年(億米ドル、AGR (%)、CAGR (%)
表28 車線逸脱警報(LDW)の地域別市場:2024〜2034年(億米ドル、AGR (%)、CAGR (%)
表29 歩行者検知システム(PDS)の地域別市場:2024〜2034年(億米ドル、AGR (%)、CAGR (%)
表30 その他のシステムの地域別市場:2024-2034年(億米ドル、AGR (%)、CAGR (%)
表31 自律走行車の世界地域別市場:2024-2034年(億米ドル、AGR (%)、CAGR (%)
表32 北米の自律走行車市場:金額ベース、2024年~2034年(億米ドル、AGR (%)、CAGR (%)
表33 北米の自律走行車市場:国別(2024-2034年、億米ドル、AGR (%)、CAGR (%)
表34 北米の自律走行車市場:コンポーネント別(2024-2034年:億米ドル、AGR (%)、CAGR (%)
表35 北米の自律走行車市場:車両タイプ別(2024-2034年:億米ドル、AGR (%)、CAGR (%)
表36 北米の自律走行車市場:技術別、2024-2034年(億米ドル、AGR (%)、CAGR (%)
表37 北米の自律走行車市場:自律性のレベル別、2024-2034年(億米ドル、AGR (%)、CAGR (%)
表38 北米の自律走行車市場:システム別、2024-2034年(億米ドル、AGR (%)、CAGR (%)
表39 米国の自律走行車市場:金額ベース、2024-2034年(億米ドル、AGR (%)、CAGR (%)
表40 カナダの自律走行車市場:金額ベース、2024-2034年(億米ドル、AGR (%)、CAGR (%)
表41 欧州の自律走行車市場:金額ベース、2024~2034年(億米ドル、AGR (%)、CAGR (%)
表42 欧州の自律走行車市場:国別、2024-2034年(億米ドル、AGR (%)、CAGR (%)
表43 欧州の自律走行車市場:コンポーネント別、2024-2034年(億米ドル、AGR (%)、CAGR (%)
表44 欧州の自律走行車市場:車両タイプ別(2024-2034年:億米ドル、AGR (%)、CAGR (%)
表45 欧州の自律走行車市場:技術別、2024-2034年(億米ドル、AGR (%)、CAGR (%)
表46 欧州の自律走行車市場:自律性のレベル別、2024-2034年(億米ドル、AGR (%)、CAGR (%)
表47 欧州の自律走行車市場:システム別、2024-2034年(億米ドル、AGR (%)、CAGR (%)
表48 ドイツの自律走行車市場:金額ベース、2024-2034年(億米ドル、AGR (%)、CAGR (%)
表49 イギリスの自律走行車市場:金額ベース、2024~2034年(億米ドル、AGR (%)、CAGR (%)
表50 フランスの自律走行車市場:金額 2024-2034 (億米ドル、AGR (%)、CAGR (%))
表51 イタリアの自律走行車市場:金額:2024-2034年(億米ドル、AGR (%)、CAGR (%)
表52 スペインの自律走行車市場:金額:2024-2034年(億米ドル、AGR (%)、CAGR (%)
表53 その他のヨーロッパの自律走行車市場:金額ベース、2024-2034年(億米ドル、AGR (%)、CAGR (%)
表54 アジア太平洋地域の自律走行車市場:金額ベース、2024年~2034年(億米ドル、AGR (%)、CAGR (%)
表55 アジア太平洋地域の自律走行車市場:国別(2024-2034年、億米ドル、AGR (%)、CAGR (%)
表56 アジア太平洋地域の自律走行車市場:コンポーネント別(2024-2034年:億米ドル、AGR (%)、CAGR (%)
表57 アジア太平洋地域の自律走行車市場:車両タイプ別(2024-2034年:億米ドル、AGR (%)、CAGR (%)
表58 アジア太平洋地域の自律走行車市場:技術別、2024年~2034年(億米ドル、AGR (%)、CAGR (%)
表59 アジア太平洋地域の自律走行車市場:自律性のレベル別、2024-2034年(億米ドル、AGR (%)、CAGR (%)
表60 アジア太平洋地域の自律走行車市場:システム別(2024-2034年、10億米ドル、AGR (%)、CAGR (%)
表61 中国の自律走行車市場:金額ベース、2024年~2034年(億米ドル、AGR (%)、CAGR (%)
表62 インドの自律走行車市場:金額ベース、2024-2034年(億米ドル、AGR (%)、CAGR (%)
表63 日本の自律走行車市場:金額ベース、2024-2034年(億米ドル、AGR (%)、CAGR (%)
表64 韓国の自律走行車市場:金額ベース、2024-2034年(億米ドル、AGR (%)、CAGR (%)
表65 オーストラリアの自律走行車市場:金額(億米ドル、AGR (%)、CAGR (%)
表66 その他のアジア太平洋地域の自律走行車市場:金額ベース、2024-2034年(億米ドル、AGR (%)、CAGR (%)
表67 中東・アフリカの自律走行車市場:2024-2034年(億米ドル、AGR (%)、CAGR (%)
表68 中東・アフリカの自律走行車市場:国別(2024-2034年:億米ドル、AGR (%)、CAGR (%)
表69 中東・アフリカの自律走行車市場:コンポーネント別(2024-2034年:億米ドル、AGR (%)、CAGR (%)
表70 中東・アフリカの自律走行車市場:車両タイプ別(2024-2034年:億米ドル、AGR (%)、CAGR (%)
表71 中東・アフリカの自律走行車市場:技術別(2024-2034年:億米ドル、AGR (%)、CAGR (%)
表72 中東・アフリカの自律走行車市場:自律走行レベル別(2024-2034年:億米ドル、AGR (%)、CAGR (%)
表73 中東・アフリカの自律走行車市場:システム別(2024-2034年:億米ドル、AGR (%)、CAGR (%)
表74 GCCの自律走行車市場:金額ベース、2024-2034年(億米ドル、AGR (%)、CAGR (%)
表75 南アフリカの自律走行車市場:金額 2024-2034 (億米ドル、AGR (%)、CAGR (%))
表76 中東・アフリカの残りの地域の自律走行車市場:金額 2024-2034 (億米ドル、AGR (%)、CAGR (%))
表77 ラテンアメリカの自律走行車市場:2024-2034年(億米ドル、AGR (%)、CAGR (%)
表78 ラテンアメリカの自律走行車市場:国別(2024-2034年:億米ドル、AGR (%)、CAGR (%)
表79 ラテンアメリカの自律走行車市場:コンポーネント別(2024-2034年:億米ドル、AGR (%)、CAGR (%)
表80 ラテンアメリカの自律走行車市場:車両タイプ別(2024-2034年:億米ドル、AGR (%)、CAGR (%)
表81 ラテンアメリカの自律走行車市場:技術別(2024-2034年:億米ドル、AGR (%)、CAGR (%)
表82 ラテンアメリカの自律走行車市場:自律走行レベル別(2024-2034年:億米ドル、AGR (%)、CAGR (%)
表83 ラテンアメリカの自律走行車市場:システム別(2024-2034年:億米ドル、AGR (%)、CAGR (%)
表84 ブラジルの自律走行車市場:金額ベース、2024-2034年(億米ドル、AGR (%)、CAGR (%)
表85 メキシコの自律走行車市場:金額ベース、2024-2034年(億米ドル、AGR (%)、CAGR (%)
表86 その他のラテンアメリカの自律走行車市場:金額(億米ドル、AGR (%)、CAGR (%)
表87 戦略的展望 - 契約
表88 ゼネラルモーターズ・カンパニー主な詳細(CEO, 本社, 売上高, 設立, 従業員数, 企業タイプ, ウェブサイト, 事業セグメント)
表 89 ゼネラルモーターズ製品ベンチマーク
表 90 ゼネラルモーターズ社戦略的展望
表91 メルセデス・ベンツグループAG:主要業績(CEO、本社所在地、売上高、設立、従業員数、企業タイプ、ウェブサイト、事業セグメント)
表92 メルセデス・ベンツグループAG:製品ベンチマーク
表93 メルセデス・ベンツグループAG:戦略的展望
表94 フォードモーター主な詳細(CEO、本社所在地、売上高、設立、従業員数、企業タイプ、ウェブサイト、事業セグメント)
表 95 フォード・モーター・カンパニー製品ベンチマーク
表96 フォードモーター戦略的展望
表97 エヌビディア・コーポレーション主な詳細(CEO, 本社, 売上高, 設立, 従業員数, 企業タイプ, ウェブサイト, 事業セグメント)
表 98 エヌビディア・コーポレーション製品ベンチマーク
表 99 エヌビディアコーポレーション戦略的展望
表100 フォルクスワーゲンAG: 主要詳細(CEO, 本社, 売上高, 設立, 従業員数, 企業タイプ, ウェブサイト, 事業セグメント)
表101 フォルクスワーゲンAG: 製品ベンチマーク
表102 フォルクスワーゲンAG:戦略的展望
表103 トヨタ自動車主な詳細(CEO, 本社, 売上高, 設立, 従業員数, 企業タイプ, ウェブサイト, 事業セグメント)
表 104 トヨタ自動車製品ベンチマーク
表105 トヨタ自動車:戦略的展望
表106 モービルアイ・グローバル主な詳細(CEO, 本社, 売上高, 設立, 従業員数, 企業タイプ, ウェブサイト, 事業セグメント)
表 107 Mobileye Global Inc:製品ベンチマーク
表 108 モービルアイ・グローバル:戦略的展望
表 109 株式会社デンソー主な詳細(CEO, 本社, 売上高, 設立, 従業員数, 企業タイプ, ウェブサイト, 事業セグメント)
表 110 株式会社デンソー製品ベンチマーク
表111 ヌーロ社主な詳細(CEO, 本社, 売上高, 設立, 従業員数, 企業タイプ, ウェブサイト, 事業セグメント)
表112 Nuro, Inc:製品ベンチマーク
表113 ヌーロ社戦略的展望
表114 テスラ主な詳細(CEO, 本社, 売上高, 設立, 従業員数, 企業タイプ, ウェブサイト, 事業セグメント)
表115 テスラ, Inc:製品ベンチマーク
表116 アイシンコーポレーション主な詳細(CEO, 本社, 売上高, 設立, 従業員数, 企業タイプ, ウェブサイト, 事業セグメント)
表117 アイシン株式会社製品ベンチマーク
表118 インフィニオン・テクノロジーズAG:主な詳細(CEO, 本社, 売上高, 設立, 従業員数, 企業タイプ, ウェブサイト, 事業セグメント)
表 119 インフィニオンテクノロジーズAG:製品ベンチマーク
表120 インフィニオンテクノロジーズAG:戦略的展望
表121 現代モービス:主要詳細(CEO, 本社, 売上高, 設立, 従業員数, 企業タイプ, ウェブサイト, 事業セグメント)
表122 現代モービス:製品ベンチマーク
表123 現代モービス:戦略的展望
表124 オートエックス・テクノロジーズ主な詳細、(CEO、本社、売上高、設立、従業員数、会社タイプ、ウェブサイト、事業セグメント)
表 125 オートエックス・テクノロジーズ製品ベンチマーク
表126 Einride AB: 主要詳細(CEO, 本社, 売上高, 設立, 従業員数, 企業タイプ, ウェブサイト, 事業セグメント)
表127 Einride AB: 製品ベンチマーク
アインライドAB:製品ベンチマーク
図の一覧
図1 自律走行車市場のセグメンテーション
図2 コンポーネント別自律走行車市場:市場魅力度指数
図3 自律走行車市場:車両タイプ別:市場魅力度指数
図4 自律走行車市場:技術別市場魅力度指数
図5 自律走行車市場:自律走行レベル別:市場魅力度指数市場魅力度指数
図6 自律走行車のシステム別市場:市場魅力度指数市場魅力度指数
図7 自律走行車市場:地域別市場魅力度指数
図8 自律走行車市場市場ダイナミクス
図9 自律走行車の販売台数
図10 自律走行車市場ポーターのファイブフォース分析
図11 自律走行車の世界市場:COVID別シェア予測(2024年~2034年)
図12 自律走行車の世界市場(地域別)、2024年~2034年(10億米ドル、AGR(%))(V字回復シナリオ
図13 自律走行車の世界地域別市場:2024年~2034年(億米ドル、AGR (%))(U字回復シナリオ)
図14 自律走行車の世界地域別市場:2024年~2034年(億米ドル、AGR (%))(W字型回復シナリオ)
図15 自律走行車の世界地域別市場:2024年~2034年(億米ドル、AGR (%))(L字型回復シナリオ)
図16 自律走行車市場PEST分析
図17 自律走行車市場:コンポーネント別:市場魅力度指数
図18 自律走行車の世界市場(コンポーネント別):2024年~2034年(億米ドル、AGR (%)
図19 自律走行車のコンポーネント別市場シェア予測、2024年、2029年、2034年(%)
図20 地域別ハードウェア市場、2024年~2034年(億米ドル、AGR (%)
図21 地域別ハードウェア市場シェア予測、2024年&2034年(%)
図 22 2024-2034 年地域別ソフトウェア市場予測(億米ドル、AGR (%)
図23 地域別ソフトウェア市場シェア予測、2024年~2034年(%)
図24 車両タイプ別自律走行車市場市場魅力度指数
図25 自律走行車の世界市場:車両タイプ別、2024年~2034年(億米ドル、AGR (%)
図26 自律走行車市場:車両タイプ別シェア予測(2024年、2029年、2034年)
図27 乗用車の地域別市場規模予測(2024~2034年、10億米ドル、AGR (%)
図 28 乗用車の地域別市場シェア予測、2024年&2034年(%)
図29 2024~2034年商用車地域別市場規模予測(億米ドル、AGR (%)
図30 2024年~2034年の商用車地域別市場シェア予測 (%)
図31 特殊用途自動車の地域別市場規模予測(2024~2034年、10億米ドル、AGR (%)
図32 特殊用途車両(配送ロボット、農業用自律走行車など)の地域別市場シェア予測、2024年~2034年 (%)
図33 技術別自律走行車市場:市場魅力度指数
図34 自律走行車の世界市場:技術別、2024年~2034年(億米ドル、AGR (%)
図35 技術別自律走行車市場シェア予測:2024年、2029年、2034年(%)
図36 センサーと知覚システム市場:地域別(2024~2034年、10億米ドル、AGR (%)
図 37 センサーと知覚システムの地域別市場シェア予測、2024 年~2034 年(%)
図 38 コンピューティング・処理ユニット市場:地域別 2024-2034 (億米ドル、AGR (%)
図 39 コンピューティング・処理ユニット市場の地域別シェア予測、2024~2034 年 (%)
図40 接続性ソリューションの地域別市場規模予測(2024~2034年、10億米ドル、AGR (%)
図 41 接続性ソリューションの地域別市場シェア予測、2024 年~2034 年 (%)
図 42 2024-2034 年ソフトウェアプラットフォーム地域別市場予測(億米ドル、AGR (%)
図43 地域別ソフトウェアプラットフォーム市場シェア予測、2024年&2034年(%)
図44 自律走行車市場:自律走行レベル別:市場魅力度指数
図45 自律走行車の世界市場:自律走行レベル別、2024年〜2034年(億米ドル、AGR (%)
図46 自律走行車のレベル別市場シェア予測(2024年、2029年、2034年)
図47 レベル1:運転支援市場の地域別予測(2024~2034年、10億米ドル、AGR (%)
図48 レベル1:地域別ドライバーアシスト市場シェア予測、2024年&2034年(%)
図49 レベル2:部分自動化市場の地域別予測(2024~2034年、10億米ドル、AGR (%)
図50 レベル2:部分自動化の地域別市場シェア予測、2024年~2034年(%)
図51 レベル3:条件付き自動化市場の地域別推移(2024~2034年、10億米ドル、AGR (%)
図 52 レベル 3:コンディショナルオートメーション市場の地域別シェア予測、2024~2034 年 (%)
図53 レベル4:高度自動化市場の地域別予測(2024~2034年、10億米ドル、AGR (%)
図54 レベル4:高度自動化の地域別市場シェア予測、2024年~2034年 (%)
図55 レベル5:全自動化市場の地域別推移(2024~2034年、10億米ドル、AGR (%)
図56 レベル5:フルオートメーションの地域別市場シェア予測、2024年~2034年(%)
図57 システム別自律走行車市場市場魅力度指数
図58 自律走行車の世界市場(システム別):2024年~2034年(億米ドル、AGR (%)
図59 自律走行車のシステム別市場シェア予測(2024年、2029年、2034年)
図60 アダプティブ・クルーズ・コントロール(ACC)地域別市場:2024~2034年(億米ドル、AGR (%)
図 61 アダプティブ・クルーズ・コントロール(ACC)の地域別市場シェア予測、2024 年 & 2034 年 (%)
図62 ドライバモニタリングシステム(DMS)地域別市場:2024~2034年(億米ドル、AGR (%)
図 63 ドライバモニタリングシステム(DMS)地域別市場シェア予測、2024 年~2034 年 (%)
図 64 前方衝突警報(FCW)の地域別市場規模予測(2024~2034年、10億米ドル、AGR (%)
図 65 前方衝突警告(FCW)の地域別市場シェア予測、2024~2034 年 (%)
図 66 車線逸脱警報(LDW)の地域別市場規模予測(2024~2034年、10億米ドル、AGR (%)
図 67 車線逸脱警報(LDW)の地域別市場シェア予測、2024~2034 年 (%)
図 68 歩行者検知システム(PDS)の地域別市場規模予測:2024~2034年 (億米ドル、AGR (%)
図 69 歩行者検知システム(PDS)の地域別市場シェア予測、2024年~2034年 (%)
図 70 その他のシステムの地域別市場予測:2024~2034年(億米ドル、AGR (%)
図71 その他のシステムの地域別市場シェア予測、2024年~2034年 (%)
図72 2024年および2034年の自律走行車地域別市場予測(売上高、CAGR)
図73 2024年、2029年、2034年の地域別自律走行車市場シェア予測(%)
図74 自律走行車の世界地域別市場予測、2024年~2034年(億米ドル、AGR (%)
図75 北米自律走行車市場魅力度指数
図76 北米の自律走行車地域別市場(2024年、2029年&2034年)(億米ドル
図77 北米の自律走行車市場:金額ベース(2024年~2034年、10億米ドル、AGR (%)
図78 北米の自律走行車市場:国別(2024年~2034年、億米ドル、AGR (%)
図79 北米の自律走行車市場の国別シェア予測、2024年&2034年(%)
図80 北米の自律走行車市場:コンポーネント別(2024年~2034年、10億米ドル、AGR (%)
図81 北米自律走行車市場:コンポーネント別シェア予測、2024年~2034年(%)
図82 北米の自律走行車市場:車両タイプ別(2024年~2034年、10億米ドル、AGR (%)
図83 北米の自律走行車市場:車両タイプ別シェア予測、2024年&2034年(%)
図84 北米の自律走行車市場:技術別予測(2024年~2034年、10億米ドル、AGR (%)
図85 北米の自律走行車市場技術別シェア予測、2024年&2034年(%)
図86 北米の自律走行車市場:自律走行レベル別、2024年~2034年(億米ドル、AGR (%)
図87 北米の自律走行車市場:自律走行レベル別シェア予測、2024年~2034年(%)
図88 北米の自律走行車市場:システム別(2024年~2034年、10億米ドル、AGR (%)
図89 北米の自律走行車市場システム別シェア予測、2024年~2034年(%)
図90 米国の自律走行車市場:金額ベース(2024年~2034年、10億米ドル、AGR (%)
図91 カナダの自律走行車市場:金額ベース、2024年~2034年(億米ドル、AGR (%)
図92 欧州自律走行車市場魅力度指数
図93 欧州の自律走行車市場(地域別):2024年、2029年&2034年(10億米ドル
図94 欧州自律走行車市場:金額ベース(2024年~2034年、10億米ドル、AGR (%)
図95 欧州自律走行車市場:国別(2024年~2034年、10億米ドル、AGR (%)
図96 欧州自律走行車市場の国別シェア予測、2024年&2034年(%)
図97 欧州の自律走行車市場:コンポーネント別予測(2024年~2034年、10億米ドル、AGR (%)
図98 欧州自律走行車市場:コンポーネント別シェア予測、2024年~2034年(%)
図99 欧州自律走行車市場:車両タイプ別、2024年~2034年(億米ドル、AGR (%)
図100 欧州自律走行車市場の車両タイプ別シェア予測、2024年&2034年(%)
図101 欧州自律走行車市場:技術別予測(2024年~2034年、10億米ドル、AGR (%)
図102 欧州自律走行車市場技術別シェア予測、2024年&2034年(%)
図103 欧州自律走行車市場:自律走行レベル別予測(2024年~2034年、10億米ドル、AGR (%)
図104 欧州自律走行車市場:自律走行レベル別シェア予測、2024年~2034年(%)
図105 欧州自律走行車市場:システム別予測(2024~2034年、10億米ドル、AGR (%)
図106 欧州自律走行車市場システム別シェア予測、2024年~2034年(%)
図107 ドイツ自律走行車市場:金額ベース(2024年~2034年、10億米ドル、AGR (%)
図108 イギリスの自律走行車市場:金額ベース、2024年~2034年(億米ドル、AGR (%)
図109 フランスの自律走行車市場:金額 2024-2034 (億米ドル、AGR (%))
図110 イタリアの自律走行車市場:2024年~2034年(億米ドル、AGR (%)
図111 スペインの自律走行車市場:金額(億米ドル、AGR (%)
図112 その他のヨーロッパの自律走行車市場:金額ベース、2024年~2034年(億米ドル、AGR (%)
図113 アジア太平洋地域の自律走行車市場魅力度指数
図114 アジア太平洋地域の自律走行車市場(地域別)(2024年、2029年&2034年)(億米ドル
図115 アジア太平洋地域の自律走行車市場(金額ベース)(2024年~2034年、10億米ドル、AGR (%)
図116 アジア太平洋地域の自律走行車市場:国別(2024年~2034年、10億米ドル、AGR (%)
図117 アジア太平洋地域の自律走行車市場の国別シェア予測、2024年&2034年(%)
図118 アジア太平洋地域の自律走行車市場:コンポーネント別(2024年~2034年、10億米ドル、AGR (%)
図119 アジア太平洋地域の自律走行車市場:コンポーネント別シェア予測、2024年~2034年(%)
図120 アジア太平洋地域の自律走行車市場:車両タイプ別(2024年~2034年、10億米ドル、AGR (%)
図121 アジア太平洋地域の自律走行車市場:車両タイプ別シェア予測、2024年~2034年(%)
図122 アジア太平洋地域の自律走行車市場:技術別予測(2024~2034年、10億米ドル、AGR (%)
図123 アジア太平洋地域の自律走行車市場:技術別シェア予測、2024年~2034年(%)
図124 アジア太平洋地域の自律走行車市場:自律走行レベル別(2024年~2034年、10億米ドル、AGR (%)
図125 アジア太平洋地域の自律走行車市場:自律走行レベル別シェア予測、2024年~2034年(%)
図126 アジア太平洋地域の自律走行車市場:システム別予測(2024年~2034年、10億米ドル、AGR (%)
図127 アジア太平洋地域の自律走行車市場システム別シェア予測、2024年~2034年 (%)
図128 中国の自律走行車市場:金額ベース(2024年~2034年、10億米ドル、AGR (%)
図129 インドの自律走行車市場:金額ベース、2024年~2034年(億米ドル、AGR (%)
図130 日本の自律走行車市場:金額ベース、2024年~2034年(億米ドル、AGR (%)
図131 韓国の自律走行車市場:金額ベース、2024年~2034年(億米ドル、AGR (%)
図132 オーストラリアの自律走行車市場:金額ベース(2024年~2034年、10億米ドル、AGR (%)
図 133 アジア太平洋地域以外の自律走行車市場:金額ベース(2024年~2034年、10億米ドル、AGR (%)
図 134 中東・アフリカ自律走行車市場魅力度指数
図135 中東・アフリカ地域別自律走行車市場(2024年、2029年&2034年)(億米ドル
図136 中東・アフリカの自律走行車市場:金額ベース(2024年~2034年、10億米ドル、AGR (%)
図 137 中東・アフリカの自律走行車市場:国別(2024年~2034年、億米ドル、AGR (%)
図138 中東・アフリカの自律走行車市場:国別シェア予測(2024年~2034年)
図139 中東・アフリカの自律走行車市場:コンポーネント別予測(2024年~2034年、10億米ドル、AGR (%)
図140 中東・アフリカの自律走行車市場:コンポーネント別シェア予測、2024年~2034年(%)
図141 中東・アフリカの自律走行車市場:車両タイプ別、2024年~2034年(億米ドル、AGR (%)
図142 中東・アフリカの自律走行車市場:車両タイプ別シェア予測、2024年~2034年(%)
図143 中東・アフリカの自律走行車市場:技術別予測(2024年~2034年、億米ドル、AGR (%)
図144 中東・アフリカの自律走行車市場:技術別シェア予測、2024年~2034年(%)
図145 中東・アフリカの自律走行車市場:自律走行レベル別予測(2024~2034年、10億米ドル、AGR (%)
図 146 中東・アフリカの自律走行車市場:自律走行レベル別シェア予測(2024年~2034年)
図147 中東・アフリカの自律走行車市場:システム別予測(2024年~2034年、10億米ドル、AGR (%)
図148 中東・アフリカの自律走行車市場システム別シェア予測、2024年~2034年 (%)
図149 GCCの自律走行車市場規模別予測(2024~2034年:億米ドル、AGR (%)
図150 南アフリカの自律走行車市場:金額(億米ドル、AGR (%)
図151 中東・アフリカの残りの地域の自律走行車市場:金額(億米ドル、AGR (%)
図152 中南米の自律走行車市場魅力度指数
図153 中南米の自律走行車市場:地域別(2024年、2029年、2034年)(億米ドル
図154 ラテンアメリカの自律走行車市場:金額ベース(2024年~2034年、10億米ドル、AGR (%)
図155 ラテンアメリカの自律走行車市場:国別(2024年~2034年、億米ドル、AGR (%)
図156 中南米の自律走行車市場:国別シェア予測(2024年~2034年)
図157 ラテンアメリカの自律走行車市場:コンポーネント別(2024年~2034年、10億米ドル、AGR (%)
図158 ラテンアメリカの自律走行車市場:コンポーネント別シェア予測、2024年・2034年(%)
図159 ラテンアメリカの自律走行車市場:車両タイプ別(2024年~2034年、億米ドル、AGR (%)
図160 ラテンアメリカの自律走行車市場:車両タイプ別シェア予測、2024年&2034年(%)
図161 ラテンアメリカの自律走行車市場:技術別予測(2024~2034年:億米ドル、AGR (%)
図162 ラテンアメリカの自律走行車市場技術別シェア予測、2024年&2034年(%)
図163 ラテンアメリカの自律走行車市場:自律走行レベル別(2024~2034年、10億米ドル、AGR (%)
図164 ラテンアメリカの自律走行車市場:自律走行レベル別シェア予測、2024年〜2034年(%)
図165 ラテンアメリカの自律走行車市場:システム別(2024年~2034年、億米ドル、AGR (%)
図166 ラテンアメリカの自律走行車市場システム別シェア予測、2024年&2034年(%)
図167 ブラジル自律走行車市場:金額ベース(2024年~2034年、10億米ドル、AGR (%)
図168 メキシコの自律走行車市場:金額ベース、2024年~2034年(億米ドル、AGR (%)
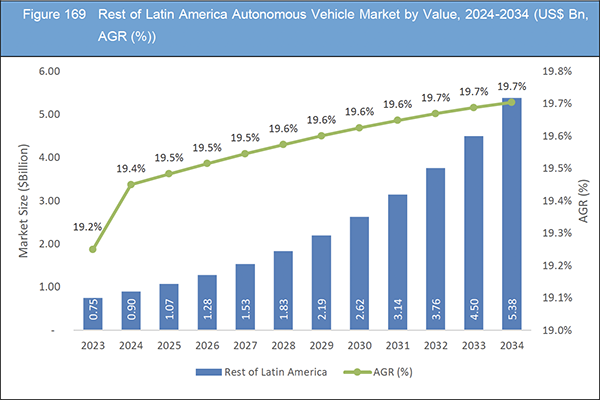
図169 その他のラテンアメリカの自律走行車市場:金額ベース(2024年~2034年、10億米ドル、AGR (%)
図170 自律走行車市場企業シェア、2022年
図 171 General Motors Company:純収入、2019年~2023年(百万米ドル、AGR)
図 172 ゼネラルモーターズ社R&D、2019年-2023年(百万米ドル、AGR)
図 173 ゼネラルモーターズ・カンパニー:地域別売上高シェア(%)
図 174 ゼネラルモーターズ・カンパニー:事業セグメント別売上高シェア、2022年(%)
図 175 メルセデス・ベンツ・グループ AG.:純収入、2019-2023 年(百万米ドル、AGR)
図176 メルセデス・ベンツグループAG.:R&D、2019-2023年(百万米ドル、AGR)
図 177 メルセデス・ベンツグループ AG.:地域別収益シェア(%)(2023 年
図 178 メルセデス・ベンツグループ AG.:事業別売上高シェア、2023 年 (%)
図 179 フォード・モーター・カンパニー純収入, 2019-2023 (百万米ドル, AGR%)
図 180 フォード・モーター・カンパニー:R&D, 2019-2023 (百万米ドル, AGR%)
図 181 フォードモーターカンパニー:地域別売上高シェア(%)
図 182 フォードモーターカンパニー:事業セグメント別売上高シェア、2023 年 (%)
図 183 エヌビディア純収入, 2020-2024 (US$ Million, AGR%)
図 184 NVIDIA Corporation:R&D, 2020-2024 (US$ Million, AGR%)
図 185 NVIDIA Corporation:地域別収益シェア、2023 年
図 186 NVIDIA Corporation:事業セグメント別売上高シェア、2023 年 (%)
図 187 フォルクスワーゲン AG.:純収益、2019 年~2023 年(百万米ドル、AGR)
図 188 フォルクスワーゲン AG.:R&D、2019年~2023年(百万米ドル、AGR)
図 189 フォルクスワーゲン AG.:事業セグメント別収益シェア、2022 年 (%)
図 190 トヨタ自動車純収入、2019-2023 (百万米ドル、AGR%)
図 191 トヨタ自動車R&D、2019-2023年(百万米ドル、AGR)
図 192 トヨタ自動車(株):地域別売上高シェア、2022年
図 193 トヨタ自動車:事業セグメント別売上高シェア、2022年(%)
図 194 Mobileye Global Inc.:純収入、2019年~2023年(百万米ドル、AGR)
図 195 Mobileye Global Inc:R&D、2019年~2023年(百万米ドル、AGR)
図 196 Mobileye Global Inc.:事業セグメントの収益シェア、2023 年 (%)
図 197 株式会社デンソー純収入, 2019-2023 (百万米ドル, AGR%)
図 198 Tesla, Inc:純収入、2019-2023 年(百万米ドル、AGR)
図 199 Tesla, Inc:R&D, 2019-2023 (百万米ドル, AGR%)
図 200 Tesla, Inc:地域別売上高シェア(%)
図 201 Tesla, Inc:事業セグメント別売上高シェア, 2022 (%)
図 202 アイシン株式会社純収入、2019年~2023年(百万米ドル、AGR)
図 203 アイシン株式会社:R&D, 2019-2023 (百万米ドル, AGR%)
図204 インフィニオンテクノロジーズAG.:純収入、2019-2023年(百万米ドル、AGR)
図 205 インフィニオンテクノロジーズAG.:R&D、2019-2023年(百万米ドル、AGR)
図 206 インフィニオン・テクノロジーズ AG.:地域別収益シェア、2023 年 (%)
図 207 Infineon Technologies AG.:事業別売上高シェア、2023 年(%)
図 208 現代モービス:純収入、2019年~2023年(百万米ドル、AGR)
図 209 現代モービスR&D、2019年~2023年(百万米ドル、AGR)
図 210 現代モービス:地域別売上シェア(%)
図 211 現代モービス:事業別収益シェア、2022年(%)
ページTOPに戻る
Summary
Report Details
The Autonomous Vehicle Market Report 2024-2034: This report will prove invaluable to leading firms striving for new revenue pockets if they wish to better understand the industry and its underlying dynamics. It will be useful for companies that would like to expand into different industries or to expand their existing operations in a new region.
One of the Primary Drivers Propelling the Autonomous Vehicle Market Is the Relentless Pursuit of Safety and Efficiency.
The autonomous vehicle market continues to experience rapid growth driven by advancements in technology, shifting consumer preferences, and increasing investments from both established automotive manufacturers and tech giants. With the promise of safer, more efficient transportation, autonomous vehicles are poised to revolutionize the way people and goods move globally.
With autonomous vehicles equipped with advanced sensors and artificial intelligence, the potential to reduce accidents caused by human error is substantial. Additionally, the prospect of increased mobility for the elderly and disabled populations presents a significant societal benefit. Moreover, the growing demand for ride-sharing and mobility-as-a-service (MaaS) platforms further fuels the adoption of autonomous vehicles.
The autonomous vehicle market offers numerous opportunities for innovation and collaboration. Advancements in sensor technology, machine learning algorithms, and connectivity solutions present avenues for enhancing vehicle autonomy and intelligence. Furthermore, the integration of autonomous vehicles into smart city infrastructures opens doors for seamless transportation systems and optimized traffic flow. Additionally, partnerships between automotive manufacturers, technology companies, and government entities can drive regulatory frameworks and infrastructure development conducive to widespread adoption.
Lack of Required Infrastructure in Emerging Countries Hinder the Market Growth
One significant restraining factor impacting the growth of the autonomous vehicle market is the lack of required infrastructure in emerging countries. While developed nations have been making strides in upgrading their infrastructure to accommodate autonomous vehicles, many emerging economies are lagging behind in this regard. In emerging countries, the infrastructure necessary to support autonomous vehicles, such as advanced road networks, intelligent transportation systems, and robust communication networks, is often inadequate or underdeveloped. This infrastructure deficit poses several challenges for the widespread adoption of autonomous vehicles.
What Questions Should You Ask before Buying a Market Research Report?
-
How is the autonomous vehicle market evolving?
-
What is driving and restraining the autonomous vehicle market?
-
How will each autonomous vehicle submarket segment grow over the forecast period and how much revenue will these submarkets account for in 2034?
-
How will the market shares for each autonomous vehicle submarket develop from 2024 to 2034?
-
What will be the main driver for the overall market from 2024 to 2034?
-
Will leading autonomous vehicle markets broadly follow the macroeconomic dynamics, or will individual national markets outperform others?
-
How will the market shares of the national markets change by 2034 and which geographical region will lead the market in 2034?
-
Who are the leading players and what are their prospects over the forecast period?
-
What are the autonomous vehicle projects for these leading companies?
-
How will the industry evolve during the period between 2024 and 2034? What are the implications of autonomous vehicle projects taking place now and over the next 10 years?
-
Is there a greater need for product commercialisation to further scale the autonomous vehicle market?
-
Where is the autonomous vehicle market heading and how can you ensure you are at the forefront of the market?
-
What are the best investment options for new product and service lines?
-
What are the key prospects for moving companies into a new growth path and C-suite?
You need to discover how this will impact the autonomous vehicle market today, and over the next 10 years:
-
Our 414-page report provides 127 tables and 211 charts/graphs exclusively to you.
-
The report highlights key lucrative areas in the industry so you can target them – NOW.
-
It contains in-depth analysis of global, regional and national sales and growth.
-
It highlights for you the key successful trends, changes and revenue projections made by your competitors.
This report tells you TODAY how the autonomous vehicle market will develop in the next 10 years, and in line with the variations in COVID-19 economic recession and bounce. This market is more critical now than at any point over the last 10 years.
Forecasts to 2034 and other analyses reveal commercial prospects
-
In addition to revenue forecasting to 2034, our new study provides you with recent results, growth rates, and market shares.
-
You will find original analyses, with business outlooks and developments.
-
Discover qualitative analyses (including market dynamics, drivers, opportunities, restraints and challenges), cost structure, impact of rising autonomous vehicle prices and recent developments.
This report includes data analysis and invaluable insight into how COVID-19 will affect the industry and your company. Four COVID-19 recovery patterns and their impact, namely, “V”, “L”, “W” and “U” are discussed in this report.
Segments Covered in the Report
Market Segment by Component
Market Segment by Vehicle Type
-
Passenger Vehicles
-
Commercial Vehicles
-
Special Purpose Vehicles
Market Segment by Technology
-
Sensors and Perception Systems
-
Computing and Processing Units
-
Connectivity Solutions
-
Software Platforms
Market Segment by Level of Autonomy
-
Level 1: Driver Assistance
-
Level 2: Partial Automation
-
Level 3: Conditional Automation
-
Level 4: High Automation
-
Level 5: Full Automation
Market Segment by System
-
Adaptive Cruise Control (ACC)
-
Driver Monitoring System (DMS)
-
Forward Collision Warning (FCW)
-
Lane Departure Warning (LDW)
-
Pedestrian Detection System (PDS)
-
Other Systems
In addition to the revenue predictions for the overall world market and segments, you will also find revenue forecasts for four regional and 20 leading national markets:
North America
Europe
-
Germany
-
Spain
-
United Kingdom
-
France
-
Italy
-
Rest of Europe
Asia Pacific
-
China
-
Japan
-
India
-
Australia
-
South Korea
-
Rest of Asia Pacific
Latin America
-
Brazil
-
Mexico
-
Rest of Latin America
Middle East & Africa
-
GCC
-
South Africa
-
Rest of Middle East & Africa
The report also includes profiles and for some of the leading companies in the Autonomous Vehicle Market, 2024 to 2034, with a focus on this segment of these companies’ operations.
Leading companies and the potential for market growth
-
Aisin Corporation
-
AutoX Technologies Inc
-
Denso Corporation
-
Einride AB
-
Ford Motor Company
-
General Motors Company
-
Hyundai Mobis
-
Infineon Technologies AG
-
Mercedes-Benz Group AG
-
Mobileye Global Inc.
-
Nuro, Inc.
-
NVIDIA Corporation
-
Tesla, Inc
-
Toyota Motor Corporation
-
Volkswagen AG
Overall world revenue for Autonomous Vehicle Market, 2024 to 2034 in terms of value the market will surpass US$43.27 billion in 2024, our work calculates. We predict strong revenue growth through to 2034. Our work identifies which organizations hold the greatest potential. Discover their capabilities, progress, and commercial prospects, helping you stay ahead.
How will the Autonomous Vehicle Market, 2024 to 2034 report help you?
In summary, our 410+ page report provides you with the following knowledge:
-
Revenue forecasts to 2034 for Autonomous Vehicle Market, 2024 to 2034 Market, with forecasts for component, vehicle type, technology, level of autonomy, and system, each forecast at a global and regional level – discover the industry’s prospects, finding the most lucrative places for investments and revenues.
-
Revenue forecasts to 2034 for four regional and 20 key national markets – See forecasts for the Autonomous Vehicle Market, 2024 to 2034 market in North America, Europe, Asia-Pacific, Latin America and Middle East & Africa. Also forecasted is the market in the US, Canada, Brazil, Germany, France, UK, Italy, China, India, Japan, and Australia among other prominent economies.
-
Prospects for established firms and those seeking to enter the market – including company profiles for 15 of the major companies involved in the Autonomous Vehicle Market, 2024 to 2034.
Find quantitative and qualitative analyses with independent predictions. Receive information that only our report contains, staying informed with invaluable business intelligence.
Information found nowhere else
With our new report, you are less likely to fall behind in knowledge or miss out on opportunities. See how our work could benefit your research, analyses, and decisions. Visiongain’s study is for everybody needing commercial analyses for the Autonomous Vehicle Market, 2024 to 2034, market-leading companies. You will find data, trends and predictions.
ページTOPに戻る
Table of Contents
1 Report Overview
1.1 Objectives of the Study
1.2 Introduction to Autonomous Vehicle Market
1.3 What This Report Delivers
1.4 Why You Should Read This Report
1.5 Key Questions Answered by This Analytical Report
1.6 Who Is This Report for?
1.7 Methodology
1.7.1 Market Definitions
1.7.2 Market Evaluation & Forecasting Methodology
1.7.3 Data Validation
1.7.3.1 Primary Research
1.7.3.2 Secondary Research
1.8 Frequently Asked Questions (FAQs)
1.9 Associated Visiongain Reports
1.10 About Visiongain
2 Executive Summary
3 Market Overview
3.1 Key Findings
3.2 Market Dynamics
3.2.1 Market Driving Factors
3.2.1.1 Adaptation of Autonomous Vehicles Driving the Market Growth
3.2.1.2 Growth in Connected Vehicle Technology and Dynamics Mobility Application
3.2.1.3 Growing Demand for Driving Assistance System Driving the Market Growth
3.2.2 Market Restraining Factors
3.2.2.1 Lack of Required Infrastructure in Emerging Countries Hinder the Market Growth
3.2.2.2 Consumer Acceptance of Self-Driving Cars Hinder the Market Growth
3.2.2.3 High System and Component Cost Hinder the Market Growth
3.2.3 Market Opportunities
3.2.3.1 Increasing Adaption of New Technology in Autonomous Vehicles Opportunity for the Market
3.2.3.2 Expansion of Businesses Opportunities for the Market
3.2.3.3 Collaboration and Partnership Between Market Players Opportunities for the Market Growth
3.3 Porter’s Five Forces Analysis
3.3.1 Bargaining Power of Suppliers (Low to Medium)
3.3.2 Bargaining Power of Buyers (High)
3.3.3 Competitive Rivalry (Medium to High)
3.3.4 Threat from Substitutes (Low)
3.3.5 Threat of New Entrants (High)
3.4 COVID-19 Impact Analysis
3.4.1 “V-Shaped Recovery”
3.4.2 “U-Shaped Recovery”
3.4.3 “W-Shaped Recovery”
3.4.4 “L-Shaped Recovery”
3.5 PEST Analysis
4 Autonomous Vehicle Market Analysis by Component
4.1 Key Findings
4.2 Component Segment: Market Attractiveness Index
4.3 Autonomous Vehicle Market Size Estimation and Forecast by Component
4.4 Hardware
4.4.1 Market Size by Region, 2024-2034 (US$ Billion)
4.4.2 Market Share by Region, 2024 & 2034 (%)
4.5 Software
4.5.1 Market Size by Region, 2024-2034 (US$ Billion)
4.5.2 Market Share by Region, 2024 & 2034 (%)
5 Autonomous Vehicle Market Analysis by Vehicle Type
5.1 Key Findings
5.2 Vehicle Type Segment: Market Attractiveness Index
5.3 Autonomous Vehicle Market Size Estimation and Forecast by Vehicle Type
5.4 Passenger Vehicles
5.4.1 Market Size by Region, 2024-2034 (US$ Billion)
5.4.2 Market Share by Region, 2024 & 2034 (%)
5.5 Commercial Vehicles
5.5.1 Market Size by Region, 2024-2034 (US$ Billion)
5.5.2 Market Share by Region, 2024 & 2034 (%)
5.6 Special Purpose Vehicles (e.g., delivery robots, agricultural autonomous vehicles)
5.6.1 Market Size by Region, 2024-2034 (US$ Billion)
5.6.2 Market Share by Region, 2024 & 2034 (%)
6 Autonomous Vehicle Market Analysis by Technology
6.1 Key Findings
6.2 Technology Segment: Market Attractiveness Index
6.3 Autonomous Vehicle Market Size Estimation and Forecast by Technology
6.4 Sensors and Perception Systems
6.4.1 Market Size by Region, 2024-2034 (US$ Billion)
6.4.2 Market Share by Region, 2024 & 2034 (%)
6.5 Computing and Processing Units
6.5.1 Market Size by Region, 2024-2034 (US$ Billion)
6.5.2 Market Share by Region, 2024 & 2034 (%)
6.6 Connectivity Solutions
6.6.1 Market Size by Region, 2024-2034 (US$ Billion)
6.6.2 Market Share by Region, 2024 & 2034 (%)
6.7 Software Platforms
6.7.1 Market Size by Region, 2024-2034 (US$ Billion)
6.7.2 Market Share by Region, 2024 & 2034 (%)
7 Autonomous Vehicle Market Analysis by Level of Autonomy
7.1 Key Findings
7.2 Level of Autonomy Segment: Market Attractiveness Index
7.3 Autonomous Vehicle Market Size Estimation and Forecast by Level of Autonomy
7.4 Level 1: Driver Assistance
7.4.1 Market Size by Region, 2024-2034 (US$ Billion)
7.4.2 Market Share by Region, 2024 & 2034 (%)
7.5 Level 2: Partial Automation
7.5.1 Market Size by Region, 2024-2034 (US$ Billion)
7.5.2 Market Share by Region, 2024 & 2034 (%)
7.6 Level 3: Conditional Automation
7.6.1 Market Size by Region, 2024-2034 (US$ Billion)
7.6.2 Market Share by Region, 2024 & 2034 (%)
7.7 Level 4: High Automation
7.7.1 Market Size by Region, 2024-2034 (US$ Billion)
7.7.2 Market Share by Region, 2024 & 2034 (%)
7.8 Level 5: Full Automation
7.8.1 Market Size by Region, 2024-2034 (US$ Billion)
7.8.2 Market Share by Region, 2024 & 2034 (%)
8 Autonomous Vehicle Market Analysis by System
8.1 Key Findings
8.2 System Segment: Market Attractiveness Index
8.3 Autonomous Vehicle Market Size Estimation and Forecast by System
8.4 Adaptive Cruise Control (ACC)
8.4.1 Market Size by Region, 2024-2034 (US$ Million)
8.4.2 Market Share by Region, 2024 & 2034 (%)
8.5 Driver Monitoring System (DMS)
8.5.1 Market Size by Region, 2024-2034 (US$ Million)
8.5.2 Market Share by Region, 2024 & 2034 (%)
8.6 Forward Collision Warning (FCW)
8.6.1 Market Size by Region, 2024-2034 (US$ Million)
8.6.2 Market Share by Region, 2024 & 2034 (%)
8.7 Lane Departure Warning (LDW)
8.7.1 Market Size by Region, 2024-2034 (US$ Million)
8.7.2 Market Share by Region, 2024 & 2034 (%)
8.8 Pedestrian Detection System (PDS)
8.8.1 Market Size by Region, 2024-2034 (US$ Million)
8.8.2 Market Share by Region, 2024 & 2034 (%)
8.9 Other Systems
8.9.1 Market Size by Region, 2024-2034 (US$ Million)
8.9.2 Market Share by Region, 2024 & 2034 (%)
9 Autonomous Vehicle Market Analysis by Region
9.1 Key Findings
9.2 Regional Market Size Estimation and Forecast
10 North America Autonomous Vehicle Market Analysis
10.1 Key Findings
10.2 North America Autonomous Vehicle Market Attractiveness Index
10.3 North America Autonomous Vehicle Market by Country, 2024, 2029 & 2034 (US$ Billion)
10.4 North America Autonomous Vehicle Market Size Estimation and Forecast
10.5 North America Autonomous Vehicle Market Size Estimation and Forecast by Country
10.6 North America Autonomous Vehicle Market Size Estimation and Forecast by Component
10.7 North America Autonomous Vehicle Market Size Estimation and Forecast by Vehicle Type
10.8 North America Autonomous Vehicle Market Size Estimation and Forecast by Technology
10.9 North America Autonomous Vehicle Market Size Estimation and Forecast by Level of Autonomy
10.10 North America Autonomous Vehicle Market Size Estimation and Forecast by System
10.11 U.S. Autonomous Vehicle Market Analysis
10.12 Canada Autonomous Vehicle Market Analysis
11 Europe Autonomous Vehicle Market Analysis
11.1 Key Findings
11.2 Europe Autonomous Vehicle Market Attractiveness Index
11.3 Europe Autonomous Vehicle Market by Country, 2024, 2029 & 2034 (US$ Billion)
11.4 Europe Autonomous Vehicle Market Size Estimation and Forecast
11.5 Europe Autonomous Vehicle Market Size Estimation and Forecast by Country
11.6 Europe Autonomous Vehicle Market Size Estimation and Forecast by Component
11.7 Europe Autonomous Vehicle Market Size Estimation and Forecast by Vehicle Type
11.8 Europe Autonomous Vehicle Market Size Estimation and Forecast by Technology
11.9 Europe Autonomous Vehicle Market Size Estimation and Forecast by Level of Autonomy
11.10 Europe Autonomous Vehicle Market Size Estimation and Forecast by System
11.11 Germany Autonomous Vehicle Market Analysis
11.12 UK Autonomous Vehicle Market Analysis
11.13 France Autonomous Vehicle Market Analysis
11.14 Italy Autonomous Vehicle Market Analysis
11.15 Spain Autonomous Vehicle Market Analysis
11.16 Rest of Europe Autonomous Vehicle Market Analysis
12 Asia-Pacific Autonomous Vehicle Market Analysis
12.1 Key Findings
12.2 Asia-Pacific Autonomous Vehicle Market Attractiveness Index
12.3 Asia-Pacific Autonomous Vehicle Market by Country, 2024, 2029 & 2034 (US$ Billion)
12.4 Asia-Pacific Autonomous Vehicle Market Size Estimation and Forecast
12.5 Asia-Pacific Autonomous Vehicle Market Size Estimation and Forecast by Country
12.6 Asia-Pacific Autonomous Vehicle Market Size Estimation and Forecast by Component
12.7 Asia-Pacific Autonomous Vehicle Market Size Estimation and Forecast by Vehicle Type
12.8 Asia-Pacific Autonomous Vehicle Market Size Estimation and Forecast by Technology
12.9 Asia-Pacific Autonomous Vehicle Market Size Estimation and Forecast by Level of Autonomy
12.10 Asia-Pacific Autonomous Vehicle Market Size Estimation and Forecast by System
12.11 China Autonomous Vehicle Market Analysis
12.12 India Autonomous Vehicle Market Analysis
12.13 Japan Autonomous Vehicle Market Analysis
12.14 South Korea Autonomous Vehicle Market Analysis
12.15 Australia Autonomous Vehicle Market Analysis
12.16 Rest of Asia-Pacific Autonomous Vehicle Market Analysis
13 Middle East and Africa Autonomous Vehicle Market Analysis
13.1 Key Findings
13.2 Middle East and Africa Autonomous Vehicle Market Attractiveness Index
13.3 Middle East and Africa Autonomous Vehicle Market by Country, 2024, 2029 & 2034 (US$ Billion)
13.4 Middle East and Africa Autonomous Vehicle Market Size Estimation and Forecast
13.5 Middle East and Africa Autonomous Vehicle Market Size Estimation and Forecast by Country
13.6 Middle East and Africa Autonomous Vehicle Market Size Estimation and Forecast by Component
13.7 Middle East and Africa Autonomous Vehicle Market Size Estimation and Forecast by Vehicle Type
13.8 Middle East and Africa Autonomous Vehicle Market Size Estimation and Forecast by Technology
13.9 Middle East and Africa Autonomous Vehicle Market Size Estimation and Forecast by Level of Autonomy
13.10 Middle East and Africa Autonomous Vehicle Market Size Estimation and Forecast by System
13.11 GCC Autonomous Vehicle Market Analysis
13.12 South Africa Autonomous Vehicle Market Analysis
13.13 Rest of Middle East & Africa Autonomous Vehicle Market Analysis
14 Latin America Autonomous Vehicle Market Analysis
14.1 Key Findings
14.2 Latin America Autonomous Vehicle Market Attractiveness Index
14.3 Latin America Autonomous Vehicle Market by Country, 2024, 2029 & 2034 (US$ Billion)
14.4 Latin America Autonomous Vehicle Market Size Estimation and Forecast
14.5 Latin America Autonomous Vehicle Market Size Estimation and Forecast by Country
14.6 Latin America Autonomous Vehicle Market Size Estimation and Forecast by Component
14.7 Latin America Autonomous Vehicle Market Size Estimation and Forecast by Vehicle Type
14.8 Latin America Autonomous Vehicle Market Size Estimation and Forecast by Technology
14.9 Latin America Autonomous Vehicle Market Size Estimation and Forecast by Level of Autonomy
14.10 Latin America Autonomous Vehicle Market Size Estimation and Forecast by System
14.11 Brazil Autonomous Vehicle Market Analysis
14.12 Mexico Autonomous Vehicle Market Analysis
14.13 Rest of Latin America Autonomous Vehicle Market Analysis
15 Company Profiles
15.1 Competitive Landscape, 2022
15.2 Strategic Outlook
15.3 General Motors Company
15.3.1 Company Snapshot
15.3.2 Company Overview
15.3.3 Financial Analysis
15.3.3.1 Net Revenue, 2019-2023
15.3.3.2 R&D, 2019-2023
15.3.3.3 Regional Revenue Share, 2023(%)
15.3.3.4 Business Segment Revenue Share, 2023 (%)
15.3.4 Product Benchmarking
15.3.5 Strategic Outlook
15.4 Mercedes-Benz Group AG
15.4.1 Company Snapshot
15.4.2 Company Overview
15.4.3 Financial Analysis
15.4.3.1 Net Revenue, 2019-2023
15.4.3.2 R&D, 2019-2023
15.4.3.3 Regional Revenue Share, 2023 (%)
15.4.3.4 Business Segment Revenue Share, 2023 (%)
15.4.4 Product Benchmarking
15.4.5 Strategic Outlook
15.5 Ford Motor Company
15.5.1 Company Snapshot
15.5.2 Company Overview
15.5.3 Financial Analysis
15.5.3.1 Net Revenue, 2019-2023
15.5.3.2 R&D, 2019-2023
15.5.3.3 Regional Revenue Share, 2023 (%)
15.5.3.4 Business Segment Revenue Share, 2023 (%)
15.5.4 Product Benchmarking
15.5.5 Strategic Outlook
15.6 NVIDIA Corporation
15.6.1 Company Snapshot
15.6.2 Company Overview
15.6.3 Financial Analysis
15.6.3.1 Net Revenue, 2020-2024
15.6.3.2 R&D, 2020-2024
15.6.3.3 Regional Revenue Share, 2023 (%)
15.6.3.4 Business Segment Revenue Share, 2023 (%)
15.6.4 Product Benchmarking
15.6.5 Strategic Outlook
15.7 Volkswagen AG
15.7.1 Company Snapshot
15.7.2 Company Overview
15.7.3 Financial Analysis
15.7.3.1 Net Revenue, 2019-2023
15.7.3.2 R&D, 2019-2023
15.7.3.3 Business Segment Revenue Share, 2022 (%)
15.7.4 Product Benchmarking
15.7.5 Strategic Outlook
15.8 Toyota Motor Corporation
15.8.1 Company Snapshot
15.8.2 Company Overview
15.8.3 Financial Analysis
15.8.3.1 Net Revenue, 2019-2023
15.8.3.2 R&D, 2019-2023
15.8.3.3 Regional Revenue Share, 2022 (%)
15.8.3.4 Business Segment Revenue Share, 2022 (%)
15.8.4 Product Benchmarking
15.8.5 Strategic Outlook
15.9 Mobileye Global Inc.
15.9.1 Company Snapshot
15.9.2 Company Overview
15.9.3 Financial Analysis
15.9.3.1 Net Revenue, 2019-2023
15.9.3.2 R&D, 2019-2023
15.9.3.3 Business Segment Revenue Share, 2023 (%)
15.9.4 Product Benchmarking
15.9.5 Strategic Outlook
15.10 Denso Corporation
15.10.1 Company Snapshot
15.10.2 Company Overview
15.10.3 Financial Analysis
15.10.3.1 Net Revenue, 2019-2023
15.10.4 Product Benchmarking
15.11 Nuro, Inc.
15.11.1 Company Snapshot
15.11.2 Company Overview
15.11.3 Product Benchmarking
15.11.4 Strategic Outlook
15.12 Tesla, Inc
15.12.1 Company Snapshot
15.12.2 Company Overview
15.12.3 Financial Analysis
15.12.3.1 Net Revenue, 2019-2023
15.12.3.2 R&D, 2019-2023
15.12.3.3 Regional Revenue Share, 2022 (%)
15.12.3.4 Business Segment Revenue Share, 2022 (%)
15.12.4 Product Benchmarking
15.13 Aisin Corporation
15.13.1 Company Snapshot
15.13.2 Company Overview
15.13.3 Financial Analysis
15.13.3.1 Net Revenue, 2019-2023
15.13.3.2 R&D, 2019-2023
15.13.4 Product Benchmarking
15.14 Infineon Technologies AG
15.14.1 Company Snapshot
15.14.2 Company Overview
15.14.3 Financial Analysis
15.14.3.1 Net Revenue, 2019-2023
15.14.3.2 R&D, 2019-2023
15.14.3.3 Regional Revenue Share, 2023 (%)
15.14.3.4 Business Segment Revenue Share, 2023 (%)
15.14.4 Product Benchmarking
15.14.5 Strategic Outlook
15.15 Hyundai Mobis
15.15.1 Company Snapshot
15.15.2 Company Overview
15.15.3 Financial Analysis
15.15.3.1 Net Revenue, 2019-2023
15.15.3.2 R&D, 2019-2023
15.15.3.3 Regional Revenue Share, 2022 (%)
15.15.3.4 Business Segment Revenue Share, 2022 (%)
15.15.4 Product Benchmarking
15.15.5 Strategic Outlook
15.16 AutoX Technologies Inc
15.16.1 Company Snapshot
15.16.2 Company Overview
15.16.3 Product Benchmarking
15.17 Einride AB
15.17.1 Company Snapshot
15.17.2 Company Overview
15.17.3 Product Benchmarking
16 Conclusion and Recommendations
16.1 Concluding Remarks from Visiongain
16.2 Recommendations for Market Players
ページTOPに戻る
List of Tables/Graphs
List of Tables
Table 1 Autonomous Vehicle Market Snapshot, 2024 & 2034 (US$ Billion, CAGR %)
Table 2 Global Autonomous Vehicle Market by Region, 2024-2034 (US$ Bn, AGR (%), CAGR (%)) (V-Shaped Recovery Scenario)
Table 3 Global Autonomous Vehicle Market by Region, 2024-2034 (US$ Bn, AGR (%), CAGR (%)) (U-Shaped Recovery Scenario)
Table 4 Global Autonomous Vehicle Market by Region, 2024-2034 (US$ Bn, AGR (%), CAGR (%)) (W-Shaped Recovery Scenario)
Table 5 Global Autonomous Vehicle Market by Region, 2024-2034 (US$ Bn, AGR (%), CAGR (%)) (L-Shaped Recovery Scenario)
Table 6 Global Autonomous Vehicle Market by Component, 2024-2034 (US$ Bn, AGR (%), CAGR (%))
Table 7 Hardware Market by Region, 2024-2034 (US$ Bn, AGR (%), CAGR (%))
Table 8 Software Market by Region, 2024-2034 (US$ Bn, AGR (%), CAGR (%))
Table 9 Global Autonomous Vehicle Market by Vehicle Type, 2024-2034 (US$ Bn, AGR (%), CAGR (%))
Table 10 Passenger Vehicles Market by Region, 2024-2034 (US$ Bn, AGR (%), CAGR (%))
Table 11 Commercial Vehicles Market by Region, 2024-2034 (US$ Bn, AGR (%), CAGR (%))
Table 12 Special Purpose Vehicles Market by Region, 2024-2034 (US$ Bn, AGR (%), CAGR (%))
Table 13 Global Autonomous Vehicle Market by Technology, 2024-2034 (US$ Bn, AGR (%), CAGR (%))
Table 14 Sensors and Perception Systems Market by Region, 2024-2034 (US$ Bn, AGR (%), CAGR (%))
Table 15 Computing and Processing Units Market by Region, 2024-2034 (US$ Bn, AGR (%), CAGR (%))
Table 16 Connectivity Solutions Market by Region, 2024-2034 (US$ Bn, AGR (%), CAGR (%))
Table 17 Software Platforms Market by Region, 2024-2034 (US$ Bn, AGR (%), CAGR (%))
Table 18 Global Autonomous Vehicle Market by Level of Autonomy, 2024-2034 (US$ Bn, AGR (%), CAGR (%))
Table 19 Level 1: Driver Assistance Market by Region, 2024-2034 (US$ Bn, AGR (%), CAGR (%))
Table 20 Level 2: Partial Automation Market by Region, 2024-2034 (US$ Bn, AGR (%), CAGR (%))
Table 21 Level 3: Conditional Automation Market by Region, 2024-2034 (US$ Bn, AGR (%), CAGR (%))
Table 22 Level 4: High Automation Market by Region, 2024-2034 (US$ Bn, AGR (%), CAGR (%))
Table 23 Level 5: Full Automation Market by Region, 2024-2034 (US$ Bn, AGR (%), CAGR (%))
Table 24 Global Autonomous Vehicle Market by System, 2024-2034 (US$ Bn, AGR (%), CAGR (%))
Table 25 Adaptive Cruise Control (ACC) Market by Region, 2024-2034 (US$ Bn, AGR (%), CAGR (%))
Table 26 Driver Monitoring System (DMS) Market by Region, 2024-2034 (US$ Bn, AGR (%), CAGR (%))
Table 27 Forward Collision Warning (FCW) Market by Region, 2024-2034 (US$ Bn, AGR (%), CAGR (%))
Table 28 Lane Departure Warning (LDW) Market by Region, 2024-2034 (US$ Bn, AGR (%), CAGR (%))
Table 29 Pedestrian Detection System (PDS) Market by Region, 2024-2034 (US$ Bn, AGR (%), CAGR (%))
Table 30 Other Systems Market by Region, 2024-2034 (US$ Bn, AGR (%), CAGR (%))
Table 31 Global Autonomous Vehicle Market by Region, 2024-2034 (US$ Bn, AGR (%), CAGR (%))
Table 32 North America Autonomous Vehicle Market by Value, 2024-2034 (US$ Bn, AGR (%), CAGR (%))
Table 33 North America Autonomous Vehicle Market by Country, 2024-2034 (US$ Bn, AGR (%), CAGR (%))
Table 34 North America Autonomous Vehicle Market by Component, 2024-2034 (US$ Bn, AGR (%), CAGR (%))
Table 35 North America Autonomous Vehicle Market by Vehicle Type, 2024-2034 (US$ Bn, AGR (%), CAGR (%))
Table 36 North America Autonomous Vehicle Market by Technology, 2024-2034 (US$ Bn, AGR (%), CAGR (%))
Table 37 North America Autonomous Vehicle Market by Level of Autonomy, 2024-2034 (US$ Bn, AGR (%), CAGR (%))
Table 38 North America Autonomous Vehicle Market by System, 2024-2034 (US$ Bn, AGR (%), CAGR (%))
Table 39 US Autonomous Vehicle Market by Value, 2024-2034 (US$ Bn, AGR (%), CAGR (%))
Table 40 Canada Autonomous Vehicle Market by Value, 2024-2034 (US$ Bn, AGR (%), CAGR (%))
Table 41 Europe Autonomous Vehicle Market by Value, 2024-2034 (US$ Bn, AGR (%), CAGR (%))
Table 42 Europe Autonomous Vehicle Market by Country, 2024-2034 (US$ Bn, AGR (%), CAGR (%))
Table 43 Europe Autonomous Vehicle Market by Component, 2024-2034 (US$ Bn, AGR (%), CAGR (%))
Table 44 Europe Autonomous Vehicle Market by Vehicle Type, 2024-2034 (US$ Bn, AGR (%), CAGR (%))
Table 45 Europe Autonomous Vehicle Market by Technology, 2024-2034 (US$ Bn, AGR (%), CAGR (%))
Table 46 Europe Autonomous Vehicle Market by Level of Autonomy, 2024-2034 (US$ Bn, AGR (%), CAGR (%))
Table 47 Europe Autonomous Vehicle Market by System, 2024-2034 (US$ Bn, AGR (%), CAGR (%))
Table 48 Germany Autonomous Vehicle Market by Value, 2024-2034 (US$ Bn, AGR (%), CAGR (%))
Table 49 UK Autonomous Vehicle Market by Value, 2024-2034 (US$ Bn, AGR (%), CAGR (%))
Table 50 France Autonomous Vehicle Market by Value, 2024-2034 (US$ Bn, AGR (%), CAGR (%))
Table 51 Italy Autonomous Vehicle Market by Value, 2024-2034 (US$ Bn, AGR (%), CAGR (%))
Table 52 Spain Autonomous Vehicle Market by Value, 2024-2034 (US$ Bn, AGR (%), CAGR (%))
Table 53 Rest of Europe Autonomous Vehicle Market by Value, 2024-2034 (US$ Bn, AGR (%), CAGR (%))
Table 54 Asia-Pacific Autonomous Vehicle Market by Value, 2024-2034 (US$ Bn, AGR (%), CAGR (%))
Table 55 Asia-Pacific Autonomous Vehicle Market by Country, 2024-2034 (US$ Bn, AGR (%), CAGR (%))
Table 56 Asia-Pacific Autonomous Vehicle Market by Component, 2024-2034 (US$ Bn, AGR (%), CAGR (%))
Table 57 Asia-Pacific Autonomous Vehicle Market by Vehicle Type, 2024-2034 (US$ Bn, AGR (%), CAGR (%))
Table 58 Asia-Pacific Autonomous Vehicle Market by Technology, 2024-2034 (US$ Bn, AGR (%), CAGR (%))
Table 59 Asia-Pacific Autonomous Vehicle Market by Level of Autonomy, 2024-2034 (US$ Bn, AGR (%), CAGR (%))
Table 60 Asia-Pacific Autonomous Vehicle Market by System, 2024-2034 (US$ Bn, AGR (%), CAGR (%))
Table 61 China Autonomous Vehicle Market by Value, 2024-2034 (US$ Bn, AGR (%), CAGR (%))
Table 62 India Autonomous Vehicle Market by Value, 2024-2034 (US$ Bn, AGR (%), CAGR (%))
Table 63 Japan Autonomous Vehicle Market by Value, 2024-2034 (US$ Bn, AGR (%), CAGR (%))
Table 64 South Korea Autonomous Vehicle Market by Value, 2024-2034 (US$ Bn, AGR (%), CAGR (%))
Table 65 Australia Autonomous Vehicle Market by Value, 2024-2034 (US$ Bn, AGR (%), CAGR (%))
Table 66 Rest of Asia-Pacific Autonomous Vehicle Market by Value, 2024-2034 (US$ Bn, AGR (%), CAGR (%))
Table 67 Middle East & Africa Autonomous Vehicle Market by Value, 2024-2034 (US$ Bn, AGR (%), CAGR (%))
Table 68 Middle East & Africa Autonomous Vehicle Market by Country, 2024-2034 (US$ Bn, AGR (%), CAGR (%))
Table 69 Middle East & Africa Autonomous Vehicle Market by Component, 2024-2034 (US$ Bn, AGR (%), CAGR (%))
Table 70 Middle East & Africa Autonomous Vehicle Market by Vehicle Type, 2024-2034 (US$ Bn, AGR (%), CAGR (%))
Table 71 Middle East & Africa Autonomous Vehicle Market by Technology, 2024-2034 (US$ Bn, AGR (%), CAGR (%))
Table 72 Middle East & Africa Autonomous Vehicle Market by Level of Autonomy, 2024-2034 (US$ Bn, AGR (%), CAGR (%))
Table 73 Middle East & Africa Autonomous Vehicle Market by System, 2024-2034 (US$ Bn, AGR (%), CAGR (%))
Table 74 GCC Autonomous Vehicle Market by Value, 2024-2034 (US$ Bn, AGR (%), CAGR (%))
Table 75 South Africa Autonomous Vehicle Market by Value, 2024-2034 (US$ Bn, AGR (%), CAGR (%))
Table 76 Rest of Middle East & Africa Autonomous Vehicle Market by Value, 2024-2034 (US$ Bn, AGR (%), CAGR (%))
Table 77 Latin America Autonomous Vehicle Market by Value, 2024-2034 (US$ Bn, AGR (%), CAGR (%))
Table 78 Latin America Autonomous Vehicle Market by Country, 2024-2034 (US$ Bn, AGR (%), CAGR (%))
Table 79 Latin America Autonomous Vehicle Market by Component, 2024-2034 (US$ Bn, AGR (%), CAGR (%))
Table 80 Latin America Autonomous Vehicle Market by Vehicle Type, 2024-2034 (US$ Bn, AGR (%), CAGR (%))
Table 81 Latin America Autonomous Vehicle Market by Technology, 2024-2034 (US$ Bn, AGR (%), CAGR (%))
Table 82 Latin America Autonomous Vehicle Market by Level of Autonomy, 2024-2034 (US$ Bn, AGR (%), CAGR (%))
Table 83 Latin America Autonomous Vehicle Market by System, 2024-2034 (US$ Bn, AGR (%), CAGR (%))
Table 84 Brazil Autonomous Vehicle Market by Value, 2024-2034 (US$ Bn, AGR (%), CAGR (%))
Table 85 Mexico Autonomous Vehicle Market by Value, 2024-2034 (US$ Bn, AGR (%), CAGR (%))
Table 86 Rest of Latin America Autonomous Vehicle Market by Value, 2024-2034 (US$ Bn, AGR (%), CAGR (%))
Table 87 Strategic Outlook - Contract
Table 88 General Motors Company: Key Details, (CEO, HQ, Revenue, Founded, No. of Employees, Company Type, Website, Business Segment)
Table 89 General Motors Company: Product Benchmarking
Table 90 General Motors Company: Strategic Outlook
Table 91 Mercedes-Benz Group AG: Key Details, (CEO, HQ, Revenue, Founded, No. of Employees, Company Type, Website, Business Segment)
Table 92 Mercedes-Benz Group AG: Product Benchmarking
Table 93 Mercedes-Benz Group AG: Strategic Outlook
Table 94 Ford Motor Company: Key Details, (CEO, HQ, Revenue, Founded, No. of Employees, Company Type, Website, Business Segment)
Table 95 Ford Motor Company: Product Benchmarking
Table 96 Ford Motor Company: Strategic Outlook
Table 97 NVIDIA Corporation: Key Details, (CEO, HQ, Revenue, Founded, No. of Employees, Company Type, Website, Business Segment)
Table 98 NVIDIA Corporation: Product Benchmarking
Table 99 NVIDIA Corporation: Strategic Outlook
Table 100 Volkswagen AG: Key Details, (CEO, HQ, Revenue, Founded, No. of Employees, Company Type, Website, Business Segment)
Table 101 Volkswagen AG: Product Benchmarking
Table 102 Volkswagen AG: Strategic Outlook
Table 103 Toyota Motor Corporation: Key Details, (CEO, HQ, Revenue, Founded, No. of Employees, Company Type, Website, Business Segment)
Table 104 Toyota Motor Corporation: Product Benchmarking
Table 105 Toyota Motor Corporation: Strategic Outlook
Table 106 Mobileye Global Inc.: Key Details, (CEO, HQ, Revenue, Founded, No. of Employees, Company Type, Website, Business Segment)
Table 107 Mobileye Global Inc.: Product Benchmarking
Table 108 Mobileye Global Inc.: Strategic Outlook
Table 109 Denso Corporation: Key Details, (CEO, HQ, Revenue, Founded, No. of Employees, Company Type, Website, Business Segment)
Table 110 Denso Corporation: Product Benchmarking
Table 111 Nuro, Inc.: Key Details, (CEO, HQ, Revenue, Founded, No. of Employees, Company Type, Website, Business Segment)
Table 112 Nuro, Inc.: Product Benchmarking
Table 113 Nuro, Inc.: Strategic Outlook
Table 114 Tesla, Inc: Key Details, (CEO, HQ, Revenue, Founded, No. of Employees, Company Type, Website, Business Segment)
Table 115 Tesla, Inc: Product Benchmarking
Table 116 Aisin Corporation: Key Details, (CEO, HQ, Revenue, Founded, No. of Employees, Company Type, Website, Business Segment)
Table 117 Aisin Corporation: Product Benchmarking
Table 118 Infineon Technologies AG: Key Details, (CEO, HQ, Revenue, Founded, No. of Employees, Company Type, Website, Business Segment)
Table 119 Infineon Technologies AG: Product Benchmarking
Table 120 Infineon Technologies AG: Strategic Outlook
Table 121 Hyundai Mobis: Key Details, (CEO, HQ, Revenue, Founded, No. of Employees, Company Type, Website, Business Segment)
Table 122 Hyundai Mobis: Product Benchmarking
Table 123 Hyundai Mobis: Strategic Outlook
Table 124 AutoX Technologies Inc: Key Details, (CEO, HQ, Revenue, Founded, No. of Employees, Company Type, Website, Business Segment)
Table 125 AutoX Technologies Inc: Product Benchmarking
Table 126 Einride AB: Key Details, (CEO, HQ, Revenue, Founded, No. of Employees, Company Type, Website, Business Segment)
Table 127 Einride AB: Product Benchmarking
List of Figures
Figure 1 Autonomous Vehicle Market Segmentation
Figure 2 Autonomous Vehicle Market by Component: Market Attractiveness Index
Figure 3 Autonomous Vehicle Market by Vehicle Type: Market Attractiveness Index
Figure 4 Autonomous Vehicle Market by Technology: Market Attractiveness Index
Figure 5 Autonomous Vehicle Market by Level of Autonomy: Market Attractiveness Index
Figure 6 Autonomous Vehicle Market by System: Market Attractiveness Index
Figure 7 Autonomous Vehicle Market Attractiveness Index by Region
Figure 8 Autonomous Vehicle Market: Market Dynamics
Figure 9 Sales of Autonomous Vehicles
Figure 10 Autonomous Vehicle Market: Porter’s Five Forces Analysis
Figure 11 Global Autonomous Vehicle Market Share Forecast by COVID, 2024-2034 (%)
Figure 12 Global Autonomous Vehicle Market by Region, 2024-2034 (US$ Bn, AGR (%)) (V-Shaped Recovery Scenario)
Figure 13 Global Autonomous Vehicle Market by Region, 2024-2034 (US$ Bn, AGR (%)) (U-Shaped Recovery Scenario)
Figure 14 Global Autonomous Vehicle Market by Region, 2024-2034 (US$ Bn, AGR (%)) (W-Shaped Recovery Scenario)
Figure 15 Global Autonomous Vehicle Market by Region, 2024-2034 (US$ Bn, AGR (%)) (L-Shaped Recovery Scenario)
Figure 16 Autonomous Vehicle Market: PEST Analysis
Figure 17 Autonomous Vehicle Market by Component: Market Attractiveness Index
Figure 18 Global Autonomous Vehicle Market by Component, 2024-2034 (US$ Bn, AGR (%))
Figure 19 Autonomous Vehicle Market Share Forecast by Component, 2024, 2029, 2034 (%)
Figure 20 Hardware Market by Region, 2024-2034 (US$ Bn, AGR (%))
Figure 21 Hardware Market Share Forecast by Region, 2024 & 2034 (%)
Figure 22 Software Market by Region, 2024-2034 (US$ Bn, AGR (%))
Figure 23 Software Market Share Forecast by Region, 2024 & 2034 (%)
Figure 24 Autonomous Vehicle Market by Vehicle Type: Market Attractiveness Index
Figure 25 Global Autonomous Vehicle Market by Vehicle Type, 2024-2034 (US$ Bn, AGR (%))
Figure 26 Autonomous Vehicle Market Share Forecast by Vehicle Type, 2024, 2029, 2034 (%)
Figure 27 Passenger Vehicles Market by Region, 2024-2034 (US$ Bn, AGR (%))
Figure 28 Passenger Vehicles Market Share Forecast by Region, 2024 & 2034 (%)
Figure 29 Commercial Vehicles Market by Region, 2024-2034 (US$ Bn, AGR (%))
Figure 30 Commercial Vehicles Market Share Forecast by Region, 2024 & 2034 (%)
Figure 31 Special Purpose Vehicles Market by Region, 2024-2034 (US$ Bn, AGR (%))
Figure 32 Special Purpose Vehicles (e.g., delivery robots, agricultural autonomous vehicles) Market Share Forecast by Region, 2024 & 2034 (%)
Figure 33 Autonomous Vehicle Market by Technology: Market Attractiveness Index
Figure 34 Global Autonomous Vehicle Market by Technology, 2024-2034 (US$ Bn, AGR (%))
Figure 35 Autonomous Vehicle Market Share Forecast by Technology, 2024, 2029, 2034 (%)
Figure 36 Sensors and Perception Systems Market by Region, 2024-2034 (US$ Bn, AGR (%))
Figure 37 Sensors and Perception Systems Market Share Forecast by Region, 2024 & 2034 (%)
Figure 38 Computing and Processing Units Market by Region, 2024-2034 (US$ Bn, AGR (%))
Figure 39 Computing and Processing Units Market Share Forecast by Region, 2024 & 2034 (%)
Figure 40 Connectivity Solutions Market by Region, 2024-2034 (US$ Bn, AGR (%))
Figure 41 Connectivity Solutions Market Share Forecast by Region, 2024 & 2034 (%)
Figure 42 Software Platforms Market by Region, 2024-2034 (US$ Bn, AGR (%))
Figure 43 Software Platforms Market Share Forecast by Region, 2024 & 2034 (%)
Figure 44 Autonomous Vehicle Market by Level of Autonomy: Market Attractiveness Index
Figure 45 Global Autonomous Vehicle Market by Level of Autonomy, 2024-2034 (US$ Bn, AGR (%))
Figure 46 Autonomous Vehicle Market Share Forecast by Level of Autonomy, 2024, 2029, 2034 (%)
Figure 47 Level 1: Driver Assistance Market by Region, 2024-2034 (US$ Bn, AGR (%))
Figure 48 Level 1: Driver Assistance Market Share Forecast by Region, 2024 & 2034 (%)
Figure 49 Level 2: Partial Automation Market by Region, 2024-2034 (US$ Bn, AGR (%))
Figure 50 Level 2: Partial Automation Market Share Forecast by Region, 2024 & 2034 (%)
Figure 51 Level 3: Conditional Automation Market by Region, 2024-2034 (US$ Bn, AGR (%))
Figure 52 Level 3: Conditional Automation Market Share Forecast by Region, 2024 & 2034 (%)
Figure 53 Level 4: High Automation Market by Region, 2024-2034 (US$ Bn, AGR (%))
Figure 54 Level 4: High Automation Market Share Forecast by Region, 2024 & 2034 (%)
Figure 55 Level 5: Full Automation Market by Region, 2024-2034 (US$ Bn, AGR (%))
Figure 56 Level 5: Full Automation Market Share Forecast by Region, 2024 & 2034 (%)
Figure 57 Autonomous Vehicle Market by System: Market Attractiveness Index
Figure 58 Global Autonomous Vehicle Market by System, 2024-2034 (US$ Bn, AGR (%))
Figure 59 Autonomous Vehicle Market Share Forecast by System, 2024, 2029, 2034 (%)
Figure 60 Adaptive Cruise Control (ACC) Market by Region, 2024-2034 (US$ Bn, AGR (%))
Figure 61 Adaptive Cruise Control (ACC) Market Share Forecast by Region, 2024 & 2034 (%)
Figure 62 Driver Monitoring System (DMS) Market by Region, 2024-2034 (US$ Bn, AGR (%))
Figure 63 Driver Monitoring System (DMS) Market Share Forecast by Region, 2024 & 2034 (%)
Figure 64 Forward Collision Warning (FCW) Market by Region, 2024-2034 (US$ Bn, AGR (%))
Figure 65 Forward Collision Warning (FCW) Market Share Forecast by Region, 2024 & 2034 (%)
Figure 66 Lane Departure Warning (LDW) Market by Region, 2024-2034 (US$ Bn, AGR (%))
Figure 67 Lane Departure Warning (LDW) Market Share Forecast by Region, 2024 & 2034 (%)
Figure 68 Pedestrian Detection System (PDS) Market by Region, 2024-2034 (US$ Bn, AGR (%))
Figure 69 Pedestrian Detection System (PDS) Market Share Forecast by Region, 2024 & 2034 (%)
Figure 70 Other Systems Market by Region, 2024-2034 (US$ Bn, AGR (%))
Figure 71 Other Systems Market Share Forecast by Region, 2024 & 2034 (%)
Figure 72 Autonomous Vehicle Market Forecast by Region 2024 and 2034 (Revenue, CAGR%)
Figure 73 Autonomous Vehicle Market Share Forecast by Region 2024, 2029, 2034 (%)
Figure 74 Global Autonomous Vehicle Market by Region, 2024-2034 (US$ Bn, AGR (%))
Figure 75 North America Autonomous Vehicle Market Attractiveness Index
Figure 76 North America Autonomous Vehicle Market by Region, 2024, 2029 & 2034 (US$ Billion)
Figure 77 North America Autonomous Vehicle Market by Value, 2024-2034 (US$ Bn, AGR (%))
Figure 78 North America Autonomous Vehicle Market by Country, 2024-2034 (US$ Bn, AGR (%))
Figure 79 North America Autonomous Vehicle Market Share Forecast by Country, 2024 & 2034 (%)
Figure 80 North America Autonomous Vehicle Market by Component, 2024-2034 (US$ Bn, AGR (%))
Figure 81 North America Autonomous Vehicle Market Share Forecast Component, 2024 & 2034 (%)
Figure 82 North America Autonomous Vehicle Market by Vehicle Type, 2024-2034 (US$ Bn, AGR (%))
Figure 83 North America Autonomous Vehicle Market Share Forecast by Vehicle Type, 2024 & 2034 (%)
Figure 84 North America Autonomous Vehicle Market by Technology, 2024-2034 (US$ Bn, AGR (%))
Figure 85 North America Autonomous Vehicle Market Share Forecast by Technology, 2024 & 2034 (%)
Figure 86 North America Autonomous Vehicle Market by Level of Autonomy, 2024-2034 (US$ Bn, AGR (%))
Figure 87 North America Autonomous Vehicle Market Share Forecast by Level of Autonomy, 2024 & 2034 (%)
Figure 88 North America Autonomous Vehicle Market by System, 2024-2034 (US$ Bn, AGR (%))
Figure 89 North America Autonomous Vehicle Market Share Forecast by System, 2024 & 2034 (%)
Figure 90 US Autonomous Vehicle Market by Value, 2024-2034 (US$ Bn, AGR (%))
Figure 91 Canada Autonomous Vehicle Market by Value, 2024-2034 (US$ Bn, AGR (%))
Figure 92 Europe Autonomous Vehicle Market Attractiveness Index
Figure 93 Europe Autonomous Vehicle Market by Region, 2024, 2029 & 2034 (US$ Billion)
Figure 94 Europe Autonomous Vehicle Market by Value, 2024-2034 (US$ Bn, AGR (%))
Figure 95 Europe Autonomous Vehicle Market by Country, 2024-2034 (US$ Bn, AGR (%))
Figure 96 Europe Autonomous Vehicle Market Share Forecast by Country, 2024 & 2034 (%)
Figure 97 Europe Autonomous Vehicle Market by Component, 2024-2034 (US$ Bn, AGR (%))
Figure 98 Europe Autonomous Vehicle Market Share Forecast Component, 2024 & 2034 (%)
Figure 99 Europe Autonomous Vehicle Market by Vehicle Type, 2024-2034 (US$ Bn, AGR (%))
Figure 100 Europe Autonomous Vehicle Market Share Forecast by Vehicle Type, 2024 & 2034 (%)
Figure 101 Europe Autonomous Vehicle Market by Technology, 2024-2034 (US$ Bn, AGR (%))
Figure 102 Europe Autonomous Vehicle Market Share Forecast by Technology, 2024 & 2034 (%)
Figure 103 Europe Autonomous Vehicle Market by Level of Autonomy, 2024-2034 (US$ Bn, AGR (%))
Figure 104 Europe Autonomous Vehicle Market Share Forecast by Level of Autonomy, 2024 & 2034 (%)
Figure 105 Europe Autonomous Vehicle Market by System, 2024-2034 (US$ Bn, AGR (%))
Figure 106 Europe Autonomous Vehicle Market Share Forecast by System, 2024 & 2034 (%)
Figure 107 Germany Autonomous Vehicle Market by Value, 2024-2034 (US$ Bn, AGR (%))
Figure 108 UK Autonomous Vehicle Market by Value, 2024-2034 (US$ Bn, AGR (%))
Figure 109 France Autonomous Vehicle Market by Value, 2024-2034 (US$ Bn, AGR (%))
Figure 110 Italy Autonomous Vehicle Market by Value, 2024-2034 (US$ Bn, AGR (%))
Figure 111 Spain Autonomous Vehicle Market by Value, 2024-2034 (US$ Bn, AGR (%))
Figure 112 Rest of Europe Autonomous Vehicle Market by Value, 2024-2034 (US$ Bn, AGR (%))
Figure 113 Asia-Pacific Autonomous Vehicle Market Attractiveness Index
Figure 114 Asia-Pacific Autonomous Vehicle Market by Region, 2024, 2029 & 2034 (US$ Billion)
Figure 115 Asia-Pacific Autonomous Vehicle Market by Value, 2024-2034 (US$ Bn, AGR (%))
Figure 116 Asia-Pacific Autonomous Vehicle Market by Country, 2024-2034 (US$ Bn, AGR (%))
Figure 117 Asia-Pacific Autonomous Vehicle Market Share Forecast by Country, 2024 & 2034 (%)
Figure 118 Asia-Pacific Autonomous Vehicle Market by Component, 2024-2034 (US$ Bn, AGR (%))
Figure 119 Asia-Pacific Autonomous Vehicle Market Share Forecast Component, 2024 & 2034 (%)
Figure 120 Asia-Pacific Autonomous Vehicle Market by Vehicle Type, 2024-2034 (US$ Bn, AGR (%))
Figure 121 Asia-Pacific Autonomous Vehicle Market Share Forecast by Vehicle Type, 2024 & 2034 (%)
Figure 122 Asia-Pacific Autonomous Vehicle Market by Technology, 2024-2034 (US$ Bn, AGR (%))
Figure 123 Asia-Pacific Autonomous Vehicle Market Share Forecast by Technology, 2024 & 2034 (%)
Figure 124 Asia-Pacific Autonomous Vehicle Market by Level of Autonomy, 2024-2034 (US$ Bn, AGR (%))
Figure 125 Asia-Pacific Autonomous Vehicle Market Share Forecast by Level of Autonomy, 2024 & 2034 (%)
Figure 126 Asia-Pacific Autonomous Vehicle Market by System, 2024-2034 (US$ Bn, AGR (%))
Figure 127 Asia-Pacific Autonomous Vehicle Market Share Forecast by System, 2024 & 2034 (%)
Figure 128 China Autonomous Vehicle Market by Value, 2024-2034 (US$ Bn, AGR (%))
Figure 129 India Autonomous Vehicle Market by Value, 2024-2034 (US$ Bn, AGR (%))
Figure 130 Japan Autonomous Vehicle Market by Value, 2024-2034 (US$ Bn, AGR (%))
Figure 131 South Korea Autonomous Vehicle Market by Value, 2024-2034 (US$ Bn, AGR (%))
Figure 132 Australia Autonomous Vehicle Market by Value, 2024-2034 (US$ Bn, AGR (%))
Figure 133 Rest of Asia-Pacific Autonomous Vehicle Market by Value, 2024-2034 (US$ Bn, AGR (%))
Figure 134 Middle East and Africa Autonomous Vehicle Market Attractiveness Index
Figure 135 Middle East and Africa Autonomous Vehicle Market by Region, 2024, 2029 & 2034 (US$ Billion)
Figure 136 Middle East & Africa Autonomous Vehicle Market by Value, 2024-2034 (US$ Bn, AGR (%))
Figure 137 Middle East & Africa Autonomous Vehicle Market by Country, 2024-2034 (US$ Bn, AGR (%))
Figure 138 Middle East and Africa Autonomous Vehicle Market Share Forecast by Country, 2024 & 2034 (%)
Figure 139 Middle East & Africa Autonomous Vehicle Market by Component, 2024-2034 (US$ Bn, AGR (%))
Figure 140 Middle East and Africa Autonomous Vehicle Market Share Forecast Component, 2024 & 2034 (%)
Figure 141 Middle East & Africa Autonomous Vehicle Market by Vehicle Type, 2024-2034 (US$ Bn, AGR (%))
Figure 142 Middle East and Africa Autonomous Vehicle Market Share Forecast by Vehicle Type, 2024 & 2034 (%)
Figure 143 Middle East & Africa Autonomous Vehicle Market by Technology, 2024-2034 (US$ Bn, AGR (%))
Figure 144 Middle East and Africa Autonomous Vehicle Market Share Forecast by Technology, 2024 & 2034 (%)
Figure 145 Middle East & Africa Autonomous Vehicle Market by Level of Autonomy, 2024-2034 (US$ Bn, AGR (%))
Figure 146 Middle East and Africa Autonomous Vehicle Market Share Forecast by Level of Autonomy, 2024 & 2034 (%)
Figure 147 Middle East & Africa Autonomous Vehicle Market by System, 2024-2034 (US$ Bn, AGR (%))
Figure 148 Middle East and Africa Autonomous Vehicle Market Share Forecast by System, 2024 & 2034 (%)
Figure 149 GCC Autonomous Vehicle Market by Value, 2024-2034 (US$ Bn, AGR (%))
Figure 150 South Africa Autonomous Vehicle Market by Value, 2024-2034 (US$ Bn, AGR (%))
Figure 151 Rest of Middle East & Africa Autonomous Vehicle Market by Value, 2024-2034 (US$ Bn, AGR (%))
Figure 152 Latin America Autonomous Vehicle Market Attractiveness Index
Figure 153 Latin America Autonomous Vehicle Market by Region, 2024, 2029 & 2034 (US$ Billion)
Figure 154 Latin America Autonomous Vehicle Market by Value, 2024-2034 (US$ Bn, AGR (%))
Figure 155 Latin America Autonomous Vehicle Market by Country, 2024-2034 (US$ Bn, AGR (%))
Figure 156 Latin America Autonomous Vehicle Market Share Forecast by Country, 2024 & 2034 (%)
Figure 157 Latin America Autonomous Vehicle Market by Component, 2024-2034 (US$ Bn, AGR (%))
Figure 158 Latin America Autonomous Vehicle Market Share Forecast Component, 2024 & 2034 (%)
Figure 159 Latin America Autonomous Vehicle Market by Vehicle Type, 2024-2034 (US$ Bn, AGR (%))
Figure 160 Latin America Autonomous Vehicle Market Share Forecast by Vehicle Type, 2024 & 2034 (%)
Figure 161 Latin America Autonomous Vehicle Market by Technology, 2024-2034 (US$ Bn, AGR (%))
Figure 162 Latin America Autonomous Vehicle Market Share Forecast by Technology, 2024 & 2034 (%)
Figure 163 Latin America Autonomous Vehicle Market by Level of Autonomy, 2024-2034 (US$ Bn, AGR (%))
Figure 164 Latin America Autonomous Vehicle Market Share Forecast by Level of Autonomy, 2024 & 2034 (%)
Figure 165 Latin America Autonomous Vehicle Market by System, 2024-2034 (US$ Bn, AGR (%))
Figure 166 Latin America Autonomous Vehicle Market Share Forecast by System, 2024 & 2034 (%)
Figure 167 Brazil Autonomous Vehicle Market by Value, 2024-2034 (US$ Bn, AGR (%))
Figure 168 Mexico Autonomous Vehicle Market by Value, 2024-2034 (US$ Bn, AGR (%))
Figure 169 Rest of Latin America Autonomous Vehicle Market by Value, 2024-2034 (US$ Bn, AGR (%))
Figure 170 Autonomous Vehicle Market: Company Share, 2022
Figure 171 General Motors Company.: Net Revenue, 2019-2023 (US$ Million, AGR%)
Figure 172 General Motors Company.: R&D, 2019-2023 (US$ Million, AGR%)
Figure 173 General Motors Company.: Regional Revenue Share, 2023 (%)
Figure 174 General Motors Company.: Business Segment Revenue Share, 2022 (%)
Figure 175 Mercedes-Benz Group AG.: Net Revenue, 2019-2023 (US$ Million, AGR%)
Figure 176 Mercedes-Benz Group AG.: R&D, 2019-2023 (US$ Million, AGR%)
Figure 177 Mercedes-Benz Group AG.: Regional Revenue Share, 2023 (%)
Figure 178 Mercedes-Benz Group AG.: Business Segment Revenue Share, 2023 (%)
Figure 179 Ford Motor Company.: Net Revenue, 2019-2023 (US$ Million, AGR%)
Figure 180 Ford Motor Company.: R&D, 2019-2023 (US$ Million, AGR%)
Figure 181 Ford Motor Company.: Regional Revenue Share, 2023 (%)
Figure 182 Ford Motor Company.: Business Segment Revenue Share, 2023 (%)
Figure 183 NVIDIA Corporation.: Net Revenue, 2020-2024 (US$ Million, AGR%)
Figure 184 NVIDIA Corporation.: R&D, 2020-2024 (US$ Million, AGR%)
Figure 185 NVIDIA Corporation.: Regional Revenue Share, 2023 (%)
Figure 186 NVIDIA Corporation.: Business Segment Revenue Share, 2023 (%)
Figure 187 Volkswagen AG.: Net Revenue, 2019-2023 (US$ Million, AGR%)
Figure 188 Volkswagen AG.: R&D, 2019-2023 (US$ Million, AGR%)
Figure 189 Volkswagen AG.: Business Segment Revenue Share, 2022 (%)
Figure 190 Toyota Motor Corporation.: Net Revenue, 2019-2023 (US$ Million, AGR%)
Figure 191 Toyota Motor Corporation.: R&D, 2019-2023 (US$ Million, AGR%)
Figure 192 Toyota Motor Corporation.: Regional Revenue Share, 2022 (%)
Figure 193 Toyota Motor Corporation.: Business Segment Revenue Share, 2022 (%)
Figure 194 Mobileye Global Inc..: Net Revenue, 2019-2023 (US$ Million, AGR%)
Figure 195 Mobileye Global Inc..: R&D, 2019-2023 (US$ Million, AGR%)
Figure 196 Mobileye Global Inc..: Business Segment Revenue Share, 2023 (%)
Figure 197 Denso Corporation.: Net Revenue, 2019-2023 (US$ Million, AGR%)
Figure 198 Tesla, Inc.: Net Revenue, 2019-2023 (US$ Million, AGR%)
Figure 199 Tesla, Inc.: R&D, 2019-2023 (US$ Million, AGR%)
Figure 200 Tesla, Inc.: Regional Revenue Share, 2022 (%)
Figure 201 Tesla, Inc.: Business Segment Revenue Share, 2022 (%)
Figure 202 Aisin Corporation.: Net Revenue, 2019-2023 (US$ Million, AGR%)
Figure 203 Aisin Corporation.: R&D, 2019-2023 (US$ Million, AGR%)
Figure 204 Infineon Technologies AG.: Net Revenue, 2019-2023 (US$ Million, AGR%)
Figure 205 Infineon Technologies AG.: R&D, 2019-2023 (US$ Million, AGR%)
Figure 206 Infineon Technologies AG.: Regional Revenue Share, 2023 (%)
Figure 207 Infineon Technologies AG.: Business Segment Revenue Share, 2023 (%)
Figure 208 Hyundai Mobis.: Net Revenue, 2019-2023 (US$ Million, AGR%)
Figure 209 Hyundai Mobis.: R&D, 2019-2023 (US$ Million, AGR%)
Figure 210 Hyundai Mobis.: Regional Revenue Share, 2022 (%)
Figure 211 Hyundai Mobis.: Business Segment Revenue Share, 2022 (%)
ページTOPに戻る
よくあるご質問
Visiongain社はどのような調査会社ですか?
英国の調査会社ヴィジョンゲイン社(Visiongain)は、通信とエネルギーのほか、自動車や化学・医薬品、金属など、広範な市場を対象に調査を行っています。自動車市場については、市場全般に関する調査のほ... もっと見る
調査レポートの納品までの日数はどの程度ですか?
在庫のあるものは速納となりますが、平均的には 3-4日と見て下さい。
但し、一部の調査レポートでは、発注を受けた段階で内容更新をして納品をする場合もあります。
発注をする前のお問合せをお願いします。
注文の手続きはどのようになっていますか?
1)お客様からの御問い合わせをいただきます。
2)見積書やサンプルの提示をいたします。
3)お客様指定、もしくは弊社の発注書をメール添付にて発送してください。
4)データリソース社からレポート発行元の調査会社へ納品手配します。
5) 調査会社からお客様へ納品されます。最近は、pdfにてのメール納品が大半です。
お支払方法の方法はどのようになっていますか?
納品と同時にデータリソース社よりお客様へ請求書(必要に応じて納品書も)を発送いたします。
お客様よりデータリソース社へ(通常は円払い)の御振り込みをお願いします。
請求書は、納品日の日付で発行しますので、翌月最終営業日までの当社指定口座への振込みをお願いします。振込み手数料は御社負担にてお願いします。
お客様の御支払い条件が60日以上の場合は御相談ください。
尚、初めてのお取引先や個人の場合、前払いをお願いすることもあります。ご了承のほど、お願いします。
データリソース社はどのような会社ですか?
当社は、世界各国の主要調査会社・レポート出版社と提携し、世界各国の市場調査レポートや技術動向レポートなどを日本国内の企業・公官庁及び教育研究機関に提供しております。
世界各国の「市場・技術・法規制などの」実情を調査・収集される時には、データリソース社にご相談ください。
お客様の御要望にあったデータや情報を抽出する為のレポート紹介や調査のアドバイスも致します。
|
|

