Vehicle to Grid (V2G)市場レポート:2024-2034
Vehicle to Grid (V2G) Market Report 2024-2034
レポート詳細
Vehicle to Grid (V2G)市場レポート 2024-2034年 :この調査レポートは、業界とその基礎となるダイナミクスをより良く理解することを望むなら、新たな収益ポケットを目指す大手企業にと... もっと見る
※上記価格は部署ライセンス(Departmental licence)価格です。
その他の価格についてはデータリソースまでお問合せください。
日本語のページは自動翻訳を利用し作成しています。
実際のレポートは英文のみでご納品いたします。
サマリー
レポート詳細
Vehicle to Grid (V2G)市場レポート 2024-2034年:この調査レポートは、業界とその基礎となるダイナミクスをより良く理解することを望むなら、新たな収益ポケットを目指す大手企業にとって貴重なものとなるでしょう。異業種への進出や新規地域での既存事業の拡大を目指す企業にも有用です。
化石燃料への依存を減らすという世界的なコミットメントと相まって高まる電力需要、電気自動車の導入急増をもたらす
Vehicle-to-grid(V2G)市場は、持続可能な輸送と電力管理の未来を形作る様々な要因が重なり、かつてない成長を遂げている。主な原動力には、電力需要の増大と化石燃料への依存を減らすという世界的なコミットメントがあり、その結果、電気自動車(EV)の採用が急増している。この市場の特徴は、エネルギー需要を満たすために太陽光や風力などの再生可能エネルギー源を統合する機会にある一方、これらのエネルギー源の可変性に関連する課題にも対処していることである。
V2G市場の主な原動力は、世界的に高まる電力需要である。政府や産業界は持続可能な低排出ソリューションの必要性をますます認識し、EVの普及を後押ししている。輸送部門の電化は、環境問題に対処するだけでなく、EVが移動可能なエネルギー貯蔵ユニットとして機能するまたとない機会を提供する。EVがエネルギーを取り込み、グリッドに供給するという双方向の電力の流れは、V2G市場を前進させる重要な原動力となっている。
V2G市場には、特に再生可能エネルギーとの統合において、豊富なビジネスチャンスがある。各国が野心的な再生可能エネルギー目標を達成しようと努力する中、V2G技術は、太陽光発電や風力発電の断続的な性質を管理するためのイネーブラーとなる。これにより、スマートグリッド・ソリューションや高度なエネルギー貯蔵システムの機会が生まれる。さらに、駐車中のEVのアイドル時間は、オフピーク時のエネルギー利用を最適化し、ピーク時の送電網をサポートする双方向電力フローの未開発の機会を提供する。
既存の充電インフラのアップグレードに伴う高コスト
Vehicle to Grid(V2G)市場のシームレスな進展を妨げる重要な課題は、既存の充電インフラのアップグレードに伴う多額のコストである。V2G技術の需要が増加するにつれ、既存の充電ステーションは、グリッドと電気自動車(EV)間の双方向の電力フローに対応するための改造や拡張を行う必要がある。この改造プロセスには、双方向のエネルギー伝送が可能な高度な充電器と、必要な通信・制御システムの設置が含まれる。こうしたアップグレードに必要な高額な先行投資は、充電インフラ・プロバイダーやV2Gエコシステムで事業を展開する企業にとって財政的なハードルとなる。
市場調査レポートを購入する前にすべき質問とは?
-
Vehicle to Grid(V2G)市場はどのように進化しているのか?
-
Vehicle to Grid(V2G)市場の推進要因と抑制要因は何か?
-
予測期間中、各Vehicle to Grid (V2G)サブ市場セグメントはどのように成長し、2034年にはどれくらいの売上を占めるようになるのか?
-
2024年から2034年にかけて、各Vehicle to Grid(V2G)サブマーケットの市場シェアはどのように推移するのか?
-
2024年から2034年にかけて、市場全体の主な牽引役となるのは何か?
-
主要なVehicle to Grid(V2G)市場はマクロ経済の動きに概ね追随するのか、それとも個々の国市場が他を凌駕するのか?
-
2034年までに各国市場のシェアはどのように変化し、2034年に市場をリードするのはどの地域か?
-
主要プレーヤーは誰で、予測期間中の見通しは?
-
これら主要企業のVehicle to Grid(V2G)プロジェクトとは?
-
2024年から2034年の間に、業界はどのように発展していくのか?現在および今後10年間に実施されるVehicle to Grid(V2G)プロジェクトにはどのような意味があるのか?
-
Vehicle-to-grid(V2G)市場をさらに拡大するために、製品の商業化の必要性は高まっているか?
-
Vehicle-to-grid(V2G)市場はどこへ向かっているのか?
-
新しい製品・サービスラインへの最適な投資方法とは?
-
企業を新たな成長軌道に乗せ、C-suiteに移行させるための重要な展望とは?
このことが、現在、そして今後10年にわたって、Vehicle-to-grid(V2G)市場にどのような影響を与えるかを見極める必要がある:
-
414ページに及ぶレポートには、127の表と195の図表が掲載されている。
-
本レポートでは、業界における主要な有利分野を取り上げているため、今すぐターゲットを絞ることができる。
-
世界、地域、国の売上高と成長に関する詳細な分析が含まれている。
-
競合他社が成功した主なトレンド、変化、収益予測をハイライトします。
本レポートは、Vehicle-to-grid(V2G)市場が今後10年間、COVID-19の景気後退と好転の変動に合わせてどのように発展していくかをTODAYでお伝えするものです。この市場は、過去10年間のどの時点よりも今が重要である。
2034年までの予測やその他の分析から、商業的な展望が明らかになる
-
2034年までの収益予測に加え、最近の実績、成長率、市場シェアも提供している。
-
ビジネスの展望や展開など、独自の分析が掲載されている。
-
定性的分析(市場ダイナミクス、促進要因、機会、阻害要因、課題など)、コスト構造、ビークル・ツー・グリッド(V2G)価格上昇の影響、最新動向をご覧いただけます。
本レポートには、COVID-19が業界と貴社にどのような影響を与えるかについてのデータ分析と貴重な洞察が含まれている。本レポートでは、COVID-19の4つの回収パターンとその影響、すなわち「V」、「L」、「W」、「U」について論じている。
レポート対象セグメント
充電器タイプ別市場セグメント
電力容量別市場セグメント
-
低出力(<10 kW)
-
中出力(10 kW~50 kW)
-
高出力(>50 kW)
コンポーネント別市場セグメント
-
電気自動車供給設備(EVSE)
-
スマートメーター
-
ホーム・エネルギー・マネジメント(HEM)
-
その他のコンポーネント
車両タイプ別市場セグメント
-
電気自動車
-
プラグインハイブリッド車(PHEV)
-
電気バス
-
電気トラック
-
その他の車種
技術別市場セグメント
-
充電インフラ
-
通信機器
-
グリッド管理ソフトウェア
-
エネルギー管理ソフトウェア
-
スマートグリッド統合ソリューション
-
その他の技術
世界市場全体とセグメント別の収益予測に加え、4つの地域と20の主要国市場の収益予測も掲載しています:
北米
欧州
-
ドイツ
-
スペイン
-
イギリス
-
フランス
-
イタリア
-
その他の欧州
アジア太平洋
-
中国
-
日本
-
インド
-
オーストラリア
-
韓国
-
その他のアジア太平洋
ラテンアメリカ
中東・アフリカ
また、Vehicle-to-Grid (V2G)市場の2024年から2034年までの主要企業のプロファイルも掲載している。
報告書に掲載されている主要企業
-
ABB Limited
-
AC Propulsion
-
Denso Corporation
-
Edison International
-
EV Grid, Inc
-
Fermata Energy
-
Hitachi, Ltd
-
Honda Motor Co., Ltd
-
Indra Sistemas, S.A
-
Nissan Motor Co., Ltd.
-
NRG Energy, Inc.
-
NUVVE Holding Corp
-
OVO Energy
-
Toyota Industries Corporation
-
Wallbox
2024年から2034年にかけてのVehicle-to-Grid(V2G)市場全体の世界売上高は、金額ベースで2024年に43億1,220万米ドルを突破する。また、2034年まで堅調な売上成長を予測している。当調査では、最も大きな可能性を秘めた組織を特定しています。彼らの能力、進歩、商業的展望を発見し、一歩先を行くお手伝いをします。
このレポートはVehicle-to-Grid (V2G) Market, 2024 to 2034をどのようにご活用いただく予定ですか?
要約すると、410ページを超えるこのレポートは、以下の知識を提供する:
-
2024年から2034年までのVehicle-to-Grid (V2G)市場の収益予測 - 充電器タイプ、電力容量、コンポーネント、車両タイプ、技術の各予測を世界および地域レベルで掲載。
-
4つの地域と20の主要国市場の2034年までの収益予測 - Vehicle-to-Grid(V2G)市場、北米、欧州、アジア太平洋、中南米、中東&アフリカの2024年から2034年までの市場予測をご覧ください。また、米国、カナダ、ブラジル、ドイツ、フランス、英国、イタリア、中国、インド、日本、オーストラリアなどの著名経済圏の市場も予測しています。
-
2024年から2034年までのVehicle-to-Grid(V2G)市場に関与する主要企業15社の企業プロファイルを含む。
独自の予測による定量的・定性的分析をご覧ください。私たちのレポートだけに含まれる情報を入手し、貴重なビジネスインテリジェンスで情報を得ることができます。
他にはない情報
私たちの新しいレポートがあれば、知識に遅れをとったり、チャンスを逃したりする可能性が低くなります。Visiongainのレポートが貴社の調査、分析、意思決定にどのように役立つかをご覧ください。Visiongainのこの調査レポートは、Vehicle-to-Grid (V2G)市場(2024年~2034年)の商業分析を必要とするすべての人、市場をリードする企業を対象としています。データ、トレンド、予測をご覧いただけます。
ページTOPに戻る
目次
目次
1 レポート概要
1.1 研究の目的
1.2 Vehicle to Grid(V2G)市場の紹介
1.3 本レポートの内容
1.4 本レポートを読むべき理由
1.5 本分析レポートが回答する主な質問
1.6 本レポートの対象者
1.7 方法論
1.7.1 市場の定義
1.7.2 市場評価・予測手法
1.7.3 データの検証
1.7.3.1 一次調査
1.7.3.2 セカンダリーリサーチ
1.8 よくある質問(FAQ)
1.9 Visiongainの関連レポート
1.10 Visiongainについて
2 エグゼクティブ・サマリー
3 市場概要
3.1 主要な調査結果
3.2 市場ダイナミクス
3.2.1 市場促進要因
3.2.1.1 V2G導入に対する政府の支援的規制と財政的インセンティブ
3.2.1.2 世界的な電気自動車普及の拡大が市場成長を促進
3.2.1.3 都市化と工業化の進展が市場成長を促進
3.2.2 市場抑制要因
3.2.2.1 既存の充電インフラのアップグレードに伴う高コスト
3.2.2.2 標準化された充電インフラの欠如が市場成長を妨げる
3.2.2.3 送電網の制限とアップグレードが市場成長の阻害要因
3.2.3 市場機会
3.2.3.1 V2G技術における継続的な技術進歩が市場機会をもたらす
3.2.3.2 市場プレイヤーにとってのコラボレーションとパートナーシップの機会
3.2.3.3 新たなエネルギー管理技術の市場機会
3.3 ポーターのファイブフォース分析
3.3.1 サプライヤーの交渉力(中)
3.3.2 買い手の交渉力(高)
3.3.3 競争力(高)
3.3.4 代替品による脅威(低)
3.3.5 新規参入の脅威(低~中)
3.4 COVID-19の影響分析
3.4.1 "V字型回復"
3.4.2 "U字型回復"
3.4.3 "W字型回復"
3.4.4 "L字型回復"
3.5 PEST分析
4 Vehicle to Grid(V2G)市場分析:充電器タイプ別
4.1 主要調査結果
4.2 充電器タイプセグメント市場魅力度指数
4.3 充電器タイプ別Vehicle to Grid(V2G)市場規模の推定と予測
4.4 双方向充電器
4.4.1 2024〜2034年の地域別市場規模(US$ Million)
4.4.2 地域別市場シェア、2024年・2034年(%)
4.5 一方向充電器
4.5.1 2024~2034年の地域別市場規模(US$ Million)
4.5.2 地域別市場シェア、2024年および2034年 (%)
5 Vehicle to Grid(V2G)市場分析:電力容量別
5.1 主要調査結果
5.2 電力容量セグメント市場魅力度指数
5.3 電力容量別Vehicle to Grid(V2G)市場規模の推定と予測
5.4 低出力(50kW)
5.6.1 2024年~2034年の地域別市場規模(US$ Million)
5.6.2 地域別市場シェア、2024年・2034年 (%)
6 Vehicle to Grid(V2G)市場分析:コンポーネント別
6.1 主要調査結果
6.2 コンポーネントセグメント市場魅力度指数
6.3 コンポーネント別Vehicle to Grid(V2G)市場規模推定と予測
6.4 電気自動車供給設備(EVSE)
6.4.1 2024〜2034年の地域別市場規模(US$ Million)
6.4.2 地域別市場シェア、2024年・2034年 (%)
6.5 スマートメーター
6.5.1 2024〜2034年の地域別市場規模(US$ Million)
6.5.2 地域別市場シェア、2024年・2034年 (%)
6.6 ホームエネルギー管理(HEM)
6.6.1 2024~2034年の地域別市場規模(US$ Million)
6.6.2 地域別市場シェア、2024年・2034年 (%)
6.7 その他のコンポーネント
6.7.1 2024〜2034年の地域別市場規模(US$ Million)
6.7.2 地域別市場シェア、2024年・2034年 (%)
7 Vehicle to Grid(V2G)市場分析:車両タイプ別
7.1 主要調査結果
7.2 車両タイプ別セグメント市場魅力度指数
7.3 Vehicle to Grid(V2G)市場規模車両タイプ別推定と予測
7.4 電気自動車
7.4.1 2024〜2034年の地域別市場規模(US$ Million)
7.4.2 地域別市場シェア、2024年・2034年(%)
7.5 プラグインハイブリッド電気自動車(PHEV)
7.5.1 2024~2034年地域別市場規模(US$ Million)
7.5.2 地域別市場シェア、2024年・2034年(%)
7.6 電気バス
7.6.1 2024~2034年の地域別市場規模(US$ Million)
7.6.2 地域別市場シェア、2024年・2034年(%)
7.7 電気トラック
7.7.1 2024〜2034年の地域別市場規模(US$ Million)
7.7.2 地域別市場シェア、2024年・2034年(%)
7.8 その他の車両タイプ
7.8.1 2024〜2034年の地域別市場規模(US$ Million)
7.8.2 地域別市場シェア、2024年・2034年(%)
8 Vehicle to Grid(V2G)市場分析:技術別
8.1 主要調査結果
8.2 技術セグメント 市場魅力度指数
8.3 Vehicle to Grid(V2G)の技術別市場規模推定と予測
8.4 充電インフラ
8.4.1 2024〜2034年の地域別市場規模(US$ Million)
8.4.2 地域別市場シェア、2024年・2034年(%)
8.5 通信機器
8.5.1 2024~2034年の地域別市場規模(US$ Million)
8.5.2 地域別市場シェア、2024年・2034年(%)
8.6 グリッド管理ソフトウェア
8.6.1 2024~2034年の地域別市場規模(US$ Million)
8.6.2 地域別市場シェア、2024年・2034年(%)
8.7 エネルギー管理ソフトウェア
8.7.1 2024~2034年の地域別市場規模(US$ Million)
8.7.2 地域別市場シェア、2024年・2034年(%)
8.8 スマートグリッド統合ソリューション
8.8.1 2024~2034年の地域別市場規模(US$ Million)
8.8.2 地域別市場シェア、2024年・2034年(%)
8.9 その他の技術
8.9.1 2024年~2034年の地域別市場規模(US$ Million)
8.9.2 地域別市場シェア、2024年・2034年(%)
9 Vehicle to Grid(V2G)市場分析:地域別
9.1 主要な調査結果
9.2 地域別市場規模の推定と予測
10 北米のVehicle to Grid(V2G)市場分析
10.1 主要な調査結果
10.2 北米のVehicle to Grid(V2G)市場魅力度指数
10.3 北米のVehicle to Grid(V2G)市場国別、2024年、2029年、2034年(US$ Million)
10.4 北米のVehicle to Grid(V2G)市場規模の推定と予測
10.5 北米のVehicle to Grid(V2G)市場規模推定と予測:国別
10.6 北米のVehicle to Grid(V2G)市場規模推定と予測:充電器タイプ別
10.7 北米のVehicle to Grid(V2G)市場規模推定と予測:電力容量別
10.8 北米のVehicle to Grid (V2G)市場規模推定と予測:コンポーネント別
10.9 北米のVehicle to Grid(V2G)市場規模推定と予測:車両タイプ別
10.10 北米のVehicle to Grid(V2G)市場規模推定と予測:技術別
10.11 米国のVehicle to Grid (V2G)市場分析
10.12 カナダのVehicle to Grid (V2G)市場分析
11 欧州のVehicle to Grid(V2G)市場分析
11.1 主要な調査結果
11.2 欧州のVehicle to Grid(V2G)市場魅力度指数
11.3 欧州のVehicle to Grid(V2G)国別市場、2024年、2029年、2034年(US$ Million)
11.4 欧州のVehicle to Grid(V2G)市場規模の推定と予測
11.5 欧州のVehicle to Grid(V2G)市場規模推定と予測:国別
11.6 欧州のVehicle to Grid(V2G)市場規模推定と予測:充電器タイプ別
11.7 欧州のVehicle to Grid(V2G)市場規模推定と予測:電力容量別
11.8 欧州のVehicle to Grid(V2G)市場規模推定と予測:コンポーネント別
11.9 欧州のVehicle to Grid(V2G)市場規模推定と予測:車両タイプ別
11.10 欧州のVehicle to Grid(V2G)市場規模推定と予測:技術別
11.11 ドイツのVehicle to Grid (V2G)市場分析
11.12 イギリスのVehicle to Grid (V2G)市場分析
11.13 フランスのVehicle to Grid (V2G)市場分析
11.14 イタリアのVehicle to Grid (V2G)市場分析
11.15 スペインのVehicle to Grid (V2G)市場分析
11.16 その他の欧州のVehicle to Grid (V2G)市場分析
12 アジア太平洋地域のVehicle to Grid(V2G)市場分析
12.1 主要な調査結果
12.2 アジア太平洋地域のVehicle to Grid(V2G)市場魅力度指数
12.3 アジア太平洋地域のVehicle to Grid(V2G)国別市場、2024年、2029年、2034年(US$ Million)
12.4 アジア太平洋地域のVehicle to Grid(V2G)市場規模推定と予測
12.5 アジア太平洋地域のVehicle to Grid(V2G)市場規模推定と予測:国別
12.6 アジア太平洋地域のVehicle to Grid(V2G)市場規模推定と予測:充電器タイプ別
12.7 アジア太平洋地域のVehicle to Grid(V2G)市場規模推定と予測:電力容量別
12.8 アジア太平洋地域のVehicle to Grid(V2G)市場規模推定と予測:コンポーネント別
12.9 アジア太平洋地域のVehicle to Grid(V2G)市場規模推定と予測:車両タイプ別
12.10 アジア太平洋地域のVehicle to Grid(V2G)市場規模推定と予測:技術別
12.11 中国のVehicle to Grid(V2G)市場分析
12.12 インドのVehicle to Grid (V2G)市場分析
12.13 日本のVehicle to Grid (V2G)市場分析
12.14 韓国のVehicle to Grid (V2G)市場分析
12.15 オーストラリアのVehicle to Grid (V2G)市場分析
12.16 その他のアジア太平洋地域のVehicle to Grid (V2G)市場分析
13 中東・アフリカのVehicle to Grid(V2G)市場分析
13.1 主要な調査結果
13.2 中東・アフリカのVehicle to Grid(V2G)市場魅力度指数
13.3 中東・アフリカのVehicle to Grid(V2G)国別市場、2024年、2029年、2034年(US$ Million)
13.4 中東・アフリカのVehicle to Grid(V2G)市場規模の推定と予測
13.5 中東・アフリカのVehicle to Grid(V2G)市場規模推定と予測:国別
13.6 中東・アフリカのVehicle to Grid(V2G)市場規模推定と予測:充電器タイプ別
13.7 中東・アフリカのVehicle to Grid(V2G)市場規模推定と予測:電力容量別
13.8 中東・アフリカのVehicle to Grid(V2G)市場規模推定と予測:コンポーネント別
13.9 中東・アフリカのVehicle to Grid(V2G)市場規模推定と予測:車両タイプ別
13.10 中東・アフリカのVehicle to Grid(V2G)市場規模推定と予測:技術別
13.11 GCCのVehicle to Grid (V2G)市場分析
13.12 南アフリカのVehicle to Grid (V2G)市場分析
13.13 その他の中東・アフリカのVehicle to Grid (V2G)市場分析
14 ラテンアメリカのVehicle to Grid(V2G)市場分析
14.1 主要な調査結果
14.2 ラテンアメリカのVehicle to Grid(V2G)市場魅力度指数
14.3 ラテンアメリカのVehicle to Grid(V2G)市場国別、2024年、2029年、2034年(US$ Million)
14.4 ラテンアメリカのVehicle to Grid(V2G)市場規模推定と予測
14.5 ラテンアメリカのVehicle to Grid(V2G)市場規模推定と予測:国別
14.6 ラテンアメリカのVehicle to Grid(V2G)市場規模推定と予測:充電器タイプ別
14.7 ラテンアメリカのVehicle to Grid(V2G)市場規模推定と予測:電力容量別
14.8 ラテンアメリカのVehicle to Grid(V2G)市場規模推定と予測:コンポーネント別
14.9 ラテンアメリカのVehicle to Grid(V2G)市場規模推定と予測:車両タイプ別
14.10 ラテンアメリカのVehicle to Grid(V2G)市場規模推定と予測:技術別
14.11 ブラジルのVehicle to Grid (V2G)市場分析
14.12 メキシコのVehicle to Grid (V2G)市場分析
14.13 その他のラテンアメリカのVehicle to Grid (V2G)市場分析
15 会社概要
15.1 競争環境、2022年
15.2 戦略的展望
15.3 Denso Corporation
15.3.1 会社概要
15.3.2 会社概要
15.3.3 財務分析
15.3.3.1 純収入、2019-2023年
15.3.4 製品ベンチマーク
15.3.5 戦略的展望
15.4 AC Propulsion
15.4.1 会社概要
15.4.2 会社概要
15.4.3 製品ベンチマーク
15.5 NRG Energy, Inc.
15.5.1 会社概要
15.5.2 会社概要
15.5.3 財務分析
15.5.3.1 純収入、2018-2022年
15.5.3.2 事業セグメント収益シェア、2022年(%)
15.5.4 製品ベンチマーク
15.6 Honda Motor Co., Ltd
15.6.1 会社概要
15.6.2 会社概要
15.6.3 財務分析
15.6.3.1 純収入、2019-2023年
15.6.3.2 R&D、2019-2023年
15.6.3.3 地域別収益シェア、2022年(%)
15.6.4 製品ベンチマーク
15.6.5 戦略的展望
15.7 OVO Energy
15.7.1 会社概要
15.7.2 会社概要
15.7.3 製品ベンチマーク
15.7.4 戦略的展望
15.8 Fermata Energy
15.8.1 会社概要
15.8.2 会社概要
15.8.3 製品ベンチマーク
15.8.4 戦略的展望
15.9 Toyota Industries Corporation
15.9.1 会社概要
15.9.2 会社概要
15.9.3 財務分析
15.9.3.1 純収入(2019-2023年
15.9.3.2 R&D、2019-2023年
15.9.3.3 地域別収益シェア、2023年(%)
15.9.3.4 事業セグメント収益シェア、2023年(%)
15.9.4 製品ベンチマーク
15.9.5 戦略的展望
15.10 Hitachi, Ltd
15.10.1 会社概要
15.10.2 会社概要
15.10.3 財務分析
15.10.3.1 純売上高、2019年~2023年
15.10.3.2 地域別売上高シェア、2023年(%)
15.10.3.3 事業セグメント収益シェア、2023年(%)
15.10.4 製品ベンチマーク
15.10.5 戦略的展望
15.11 ABB Limited
15.11.1 会社概要
15.11.2 会社概要
15.11.3 財務分析
15.11.3.1 純収入、2018年~2022年
15.11.3.2 R&D、2018年~2022年
15.11.3.3 事業セグメント収益シェア、2022年(%)
15.11.4 製品ベンチマーク
15.11.5 戦略的展望
15.12 Edison International
15.12.1 会社概要
15.12.2 会社概要
15.12.3 財務分析
15.12.3.1 純収入、2018-2022年
15.12.4 製品ベンチマーク
15.13 EV Grid, Inc
15.13.1 会社概要
15.13.2 会社概要
15.13.3 製品ベンチマーク
15.14 Nissan Motor Co., Ltd.
15.14.1 企業スナップショット
15.14.2 会社概要
15.14.3 財務分析
15.14.3.1 純収入、2018-2022年
15.14.3.2 地域別売上高シェア、2022年(%)
15.14.3.3 事業セグメント別売上シェア、2022年(%)
15.14.4 製品ベンチマーク
15.15 Indra Sistemas, S.A
15.15.1 会社概要
15.15.2 会社概要
15.15.3 財務分析
15.15.3.1 純収入、2018-2022年
15.15.4 製品ベンチマーク
15.15.5 戦略的展望
15.16 NUVVE Holding Corp
15.16.1 会社概要
15.16.2 会社概要
15.16.3 財務分析
15.16.3.1 純収入、2020-2022年
15.16.3.2 R&D、2020-2022年
15.16.3.3 地域別売上シェア、2022年(%)
15.16.4 製品ベンチマーク
15.16.5 戦略的展望
15.17 Wallbox
15.17.1 会社概要
15.17.2 会社概要
15.17.3 財務分析
15.17.3.1 純収入、2019-2022年
15.17.4 製品のベンチマーク
15.17.5 戦略的展望
16 結論と提言
16.1 Visiongainからの結びの言葉
16.2 市場プレイヤーへの提言
ページTOPに戻る
図表リスト
表の一覧
Table 1 Vehicle to Grid (V2G) Market Snapshot, 2024 & 2034 (US$ Million, CAGR %)
Table 2 Global Vehicle to Grid (V2G) Market by Region, 2024-2034 (US$ Mn, AGR (%), CAGR (%)) (V-Shaped Recovery Scenario)
Table 3 Global Vehicle to Grid (V2G) Market by Region, 2024-2034 (US$ Mn, AGR (%), CAGR (%)) (U-Shaped Recovery Scenario)
Table 4 Global Vehicle to Grid (V2G) Market by Region, 2024-2034 (US$ Mn, AGR (%), CAGR (%)) (W-Shaped Recovery Scenario)
Table 5 Global Vehicle to Grid (V2G) Market by Region, 2024-2034 (US$ Mn, AGR (%), CAGR (%)) (L-Shaped Recovery Scenario)
Table 6 Global Vehicle to Grid (V2G) Market by Charger Type, 2024-2034 (US$ Mn, AGR (%), CAGR (%))
Table 7 Bi-Directional Chargers Market by Region, 2024-2034 (US$ Mn, AGR (%), CAGR (%))
Table 8 Uni-Directional Chargers Market by Region, 2024-2034 (US$ Mn, AGR (%), CAGR (%))
Table 9 Global Vehicle to Grid (V2G) Market by Power Capacity, 2024-2034 (US$ Mn, AGR (%), CAGR (%))
Table 10 Low Power (50 kW) Market by Region, 2024-2034 (US$ Mn, AGR (%), CAGR (%))
Table 13 Global Vehicle to Grid (V2G) Market by Components, 2024-2034 (US$ Mn, AGR (%), CAGR (%))
Table 14 Electric Vehicle Supply Equipment (EVSE) Market by Region, 2024-2034 (US$ Mn, AGR (%), CAGR (%))
Table 15 Smart Meters Market by Region, 2024-2034 (US$ Mn, AGR (%), CAGR (%))
Table 16 Home Energy Management (HEM) Market by Region, 2024-2034 (US$ Mn, AGR (%), CAGR (%))
Table 17 Other Components Market by Region, 2024-2034 (US$ Mn, AGR (%), CAGR (%))
Table 18 Global Vehicle to Grid (V2G) Market by Vehicle Type, 2024-2034 (US$ Mn, AGR (%), CAGR (%))
Table 19 Electric Cars Market by Region, 2024-2034 (US$ Mn, AGR (%), CAGR (%))
Table 20 Plug-in Hybrid Electric Vehicles (PHEVs) Market by Region, 2024-2034 (US$ Mn, AGR (%), CAGR (%))
Table 21 Electric Buses Market by Region, 2024-2034 (US$ Mn, AGR (%), CAGR (%))
Table 22 Electric Trucks Market by Region, 2024-2034 (US$ Mn, AGR (%), CAGR (%))
Table 23 Other Vehicle Types Market by Region, 2024-2034 (US$ Mn, AGR (%), CAGR (%))
Table 24 Global Vehicle to Grid (V2G) Market by Technology, 2024-2034 (US$ Mn, AGR (%), CAGR (%))
Table 25 Charging Infrastructure Market by Region, 2024-2034 (US$ Mn, AGR (%), CAGR (%))
Table 26 Communication Equipment Market by Region, 2024-2034 (US$ Mn, AGR (%), CAGR (%))
Table 27 Grid Management Software Market by Region, 2024-2034 (US$ Mn, AGR (%), CAGR (%))
Table 28 Energy Management Software Market by Region, 2024-2034 (US$ Mn, AGR (%), CAGR (%))
Table 29 Smart Grid Integration Solutions Market by Region, 2024-2034 (US$ Mn, AGR (%), CAGR (%))
Table 30 Other Technology Market by Region, 2024-2034 (US$ Mn, AGR (%), CAGR (%))
Table 31 Global Vehicle to Grid (V2G) Market by Region, 2024-2034 (US$ Mn, AGR (%), CAGR (%))
Table 32 North America Vehicle to Grid (V2G) Market by Value, 2024-2034 (US$ Mn, AGR (%), CAGR (%))
Table 33 North America Vehicle to Grid (V2G) Market by Country, 2024-2034 (US$ Mn, AGR (%), CAGR (%))
Table 34 North America Vehicle to Grid (V2G) Market by Charger Type, 2024-2034 (US$ Mn, AGR (%), CAGR (%))
Table 35 North America Vehicle to Grid (V2G) Market by Power Capacity, 2024-2034 (US$ Mn, AGR (%), CAGR (%))
Table 36 North America Vehicle to Grid (V2G) Market by Components, 2024-2034 (US$ Mn, AGR (%), CAGR (%))
Table 37 North America Vehicle to Grid (V2G) Market by Vehicle Type, 2024-2034 (US$ Mn, AGR (%), CAGR (%))
Table 38 North America Vehicle to Grid (V2G) Market by Technology, 2024-2034 (US$ Mn, AGR (%), CAGR (%))
Table 39 US Vehicle to Grid (V2G) Market by Value, 2024-2034 (US$ Mn, AGR (%), CAGR (%))
Table 40 Canada Vehicle to Grid (V2G) Market by Value, 2024-2034 (US$ Mn, AGR (%), CAGR (%))
Table 41 Europe Vehicle to Grid (V2G) Market by Value, 2024-2034 (US$ Mn, AGR (%), CAGR (%))
Table 42 Europe Vehicle to Grid (V2G) Market by Country, 2024-2034 (US$ Mn, AGR (%), CAGR (%))
Table 43 Europe Vehicle to Grid (V2G) Market by Charger Type, 2024-2034 (US$ Mn, AGR (%), CAGR (%))
Table 44 Europe Vehicle to Grid (V2G) Market by Power Capacity, 2024-2034 (US$ Mn, AGR (%), CAGR (%))
Table 45 Europe Vehicle to Grid (V2G) Market by Components, 2024-2034 (US$ Mn, AGR (%), CAGR (%))
Table 46 Europe Vehicle to Grid (V2G) Market by Vehicle Type, 2024-2034 (US$ Mn, AGR (%), CAGR (%))
Table 47 Europe Vehicle to Grid (V2G) Market by Technology, 2024-2034 (US$ Mn, AGR (%), CAGR (%))
Table 48 Germany Vehicle to Grid (V2G) Market by Value, 2024-2034 (US$ Mn, AGR (%), CAGR (%))
Table 49 UK Vehicle to Grid (V2G) Market by Value, 2024-2034 (US$ Mn, AGR (%), CAGR (%))
Table 50 France Vehicle to Grid (V2G) Market by Value, 2024-2034 (US$ Mn, AGR (%), CAGR (%))
Table 51 Italy Vehicle to Grid (V2G) Market by Value, 2024-2034 (US$ Mn, AGR (%), CAGR (%))
Table 52 Spain Vehicle to Grid (V2G) Market by Value, 2024-2034 (US$ Mn, AGR (%), CAGR (%))
Table 53 Rest of Europe Vehicle to Grid (V2G) Market by Value, 2024-2034 (US$ Mn, AGR (%), CAGR (%))
Table 54 Asia-Pacific Vehicle to Grid (V2G) Market by Value, 2024-2034 (US$ Mn, AGR (%), CAGR (%))
Table 55 Asia-Pacific Vehicle to Grid (V2G) Market by Country, 2024-2034 (US$ Mn, AGR (%), CAGR (%))
Table 56 Asia-Pacific Vehicle to Grid (V2G) Market by Charger Type, 2024-2034 (US$ Mn, AGR (%), CAGR (%))
Table 57 Asia-Pacific Vehicle to Grid (V2G) Market by Power Capacity, 2024-2034 (US$ Mn, AGR (%), CAGR (%))
Table 58 Asia-Pacific Vehicle to Grid (V2G) Market by Components, 2024-2034 (US$ Mn, AGR (%), CAGR (%))
Table 59 Asia-Pacific Vehicle to Grid (V2G) Market by Vehicle Type, 2024-2034 (US$ Mn, AGR (%), CAGR (%))
Table 60 Asia-Pacific Vehicle to Grid (V2G) Market by Technology, 2024-2034 (US$ Mn, AGR (%), CAGR (%))
Table 61 China Vehicle to Grid (V2G) Market by Value, 2024-2034 (US$ Mn, AGR (%), CAGR (%))
Table 62 India Vehicle to Grid (V2G) Market by Value, 2024-2034 (US$ Mn, AGR (%), CAGR (%))
Table 63 Japan Vehicle to Grid (V2G) Market by Value, 2024-2034 (US$ Mn, AGR (%), CAGR (%))
Table 64 South Korea Vehicle to Grid (V2G) Market by Value, 2024-2034 (US$ Mn, AGR (%), CAGR (%))
Table 65 Australia Vehicle to Grid (V2G) Market by Value, 2024-2034 (US$ Mn, AGR (%), CAGR (%))
Table 66 Rest of Asia-Pacific Vehicle to Grid (V2G) Market by Value, 2024-2034 (US$ Mn, AGR (%), CAGR (%))
Table 67 Middle East & Africa Vehicle to Grid (V2G) Market by Value, 2024-2034 (US$ Mn, AGR (%), CAGR (%))
Table 68 Middle East & Africa Vehicle to Grid (V2G) Market by Country, 2024-2034 (US$ Mn, AGR (%), CAGR (%))
Table 69 Middle East & Africa Vehicle to Grid (V2G) Market by Charger Type, 2024-2034 (US$ Mn, AGR (%), CAGR (%))
Table 70 Middle East & Africa Vehicle to Grid (V2G) Market by Power Capacity, 2024-2034 (US$ Mn, AGR (%), CAGR (%))
Table 71 Middle East & Africa Vehicle to Grid (V2G) Market by Components, 2024-2034 (US$ Mn, AGR (%), CAGR (%))
Table 72 Middle East & Africa Vehicle to Grid (V2G) Market by Vehicle Type, 2024-2034 (US$ Mn, AGR (%), CAGR (%))
Table 73 Middle East & Africa Vehicle to Grid (V2G) Market by Technology, 2024-2034 (US$ Mn, AGR (%), CAGR (%))
Table 74 GCC Vehicle to Grid (V2G) Market by Value, 2024-2034 (US$ Mn, AGR (%), CAGR (%))
Table 75 South Africa Vehicle to Grid (V2G) Market by Value, 2024-2034 (US$ Mn, AGR (%), CAGR (%))
Table 76 Rest of Middle East & Africa Vehicle to Grid (V2G) Market by Value, 2024-2034 (US$ Mn, AGR (%), CAGR (%))
Table 77 Latin America Vehicle to Grid (V2G) Market by Value, 2024-2034 (US$ Mn, AGR (%), CAGR (%))
Table 78 Latin America Vehicle to Grid (V2G) Market by Country, 2024-2034 (US$ Mn, AGR (%), CAGR (%))
Table 79 Latin America Vehicle to Grid (V2G) Market by Charger Type, 2024-2034 (US$ Mn, AGR (%), CAGR (%))
Table 80 Latin America Vehicle to Grid (V2G) Market by Power Capacity, 2024-2034 (US$ Mn, AGR (%), CAGR (%))
Table 81 Latin America Vehicle to Grid (V2G) Market by Components, 2024-2034 (US$ Mn, AGR (%), CAGR (%))
Table 82 Latin America Vehicle to Grid (V2G) Market by Vehicle Type, 2024-2034 (US$ Mn, AGR (%), CAGR (%))
Table 83 Latin America Vehicle to Grid (V2G) Market by Technology, 2024-2034 (US$ Mn, AGR (%), CAGR (%))
Table 84 Brazil Vehicle to Grid (V2G) Market by Value, 2024-2034 (US$ Mn, AGR (%), CAGR (%))
Table 85 Mexico Vehicle to Grid (V2G) Market by Value, 2024-2034 (US$ Mn, AGR (%), CAGR (%))
Table 86 Rest of Latin America Vehicle to Grid (V2G) Market by Value, 2024-2034 (US$ Mn, AGR (%), CAGR (%))
Table 87 Strategic Outlook - Contract
Table 88 Denso Corporation: Key Details, (CEO, HQ, Revenue, Founded, No. of Employees, Company Type, Website, Business Segment)
Table 89 Denso Corporation: Product Benchmarking
Table 90 Denso Corporation: Strategic Outlook
Table 91 AC Propulsion: Key Details, (CEO, HQ, Revenue, Founded, No. of Employees, Company Type, Website, Business Segment)
Table 92 AC Propulsion: Product Benchmarking
Table 93 Vehicle to Grid (V2G).: Key Details, (CEO, HQ, Revenue, Founded, No. of Employees, Company Type, Website, Business Segment)
Table 94 NRG Energy, Inc.: Product Benchmarking
Table 95 Honda Motor Co., Ltd: Key Details, (CEO, HQ, Revenue, Founded, No. of Employees, Company Type, Website, Business Segment)
Table 96 Honda Motor Co., Ltd: Product Benchmarking
Table 97 Honda Motor Co., Ltd: Strategic Outlook
Table 98 OVO Energy: Key Details, (CEO, HQ, Revenue, Founded, No. of Employees, Company Type, Website, Business Segment)
Table 99 OVO Energy: Product Benchmarking
Table 100 OVO Energy: Strategic Outlook
Table 101 Fermata Energy: Key Details, (CEO, HQ, Revenue, Founded, No. of Employees, Company Type, Website, Business Segment)
Table 102 Fermata Energy: Product Benchmarking
Table 103 Fermata Energy: Strategic Outlook
Table 104 Toyota Industries Corporation: Key Details, (CEO, HQ, Revenue, Founded, No. of Employees, Company Type, Website, Business Segment)
Table 105 Toyota Industries Corporation: Product Benchmarking
Table 106 Toyota Industries Corporation: Strategic Outlook
Table 107 Hitachi, Ltd: Key Details, (CEO, HQ, Revenue, Founded, No. of Employees, Company Type, Website, Business Segment)
Table 108 Hitachi, Ltd: Product Benchmarking
Table 109 Hitachi, Ltd: Strategic Outlook
Table 110 ABB Limited: Key Details, (CEO, HQ, Revenue, Founded, No. of Employees, Company Type, Website, Business Segment)
Table 111 ABB Limited: Product Benchmarking
Table 112 ABB Limited: Strategic Outlook
Table 113 Edison International: Key Details, (CEO, HQ, Revenue, Founded, No. of Employees, Company Type, Website, Business Segment)
Table 114 Edison International: Product Benchmarking
Table 115 EV Grid, Inc: Key Details, (CEO, HQ, Revenue, Founded, No. of Employees, Company Type, Website, Business Segment)
Table 116 EV Grid, Inc: Product Benchmarking
Table 117 Nissan Motor Co., Ltd.: Key Details, (CEO, HQ, Revenue, Founded, No. of Employees, Company Type, Website, Business Segment)
Table 118 Nissan Motor Co., Ltd.: Product Benchmarking
Table 119 Indra Sistemas, S.A: Key Details, (CEO, HQ, Revenue, Founded, No. of Employees, Company Type, Website, Business Segment)
Table 120 Indra Sistemas, S.A: Product Benchmarking
Table 121 Indra Sistemas, S.A: Strategic Outlook
Table 122 NUVVE Holding Corp: Key Details, (CEO, HQ, Revenue, Founded, No. of Employees, Company Type, Website, Business Segment)
Table 123 NUVVE Holding Corp: Product Benchmarking
Table 124 NUVVE Holding Corp: Strategic Outlook
Table 125 Wallbox: Key Details, (CEO, HQ, Revenue, Founded, No. of Employees, Company Type, Website, Business Segment)
Table 126 Wallbox: Product Benchmarking
Table 127 Wallbox: Strategic Outlook
図の一覧
Figure 1 Vehicle to Grid (V2G) Market Segmentation
Figure 2 Vehicle to Grid (V2G) Market by Charger Type: Market Attractiveness Index
Figure 3 Vehicle to Grid (V2G) Market by Power Capacity: Market Attractiveness Index
Figure 4 Vehicle to Grid (V2G) Market by Components: Market Attractiveness Index
Figure 5 Vehicle to Grid (V2G) Market by Vehicle Type: Market Attractiveness Index
Figure 6 Vehicle to Grid (V2G) Market by Technology: Market Attractiveness Index
Figure 7 Vehicle to Grid (V2G) Market Attractiveness Index by Region
Figure 8 Vehicle to Grid (V2G) Market: Market Dynamics
Figure 9 Electric Car Sales, 2019-2023
Figure 10 Vehicle to Grid (V2G) Market: Porter’s Five Forces Analysis
Figure 11 Global Vehicle to Grid (V2G) Market Share Forecast by COVID, 2024-2034 (%)
Figure 12 Global Vehicle to Grid (V2G) Market by Region, 2024-2034 (US$ Mn, AGR (%)) (V-Shaped Recovery Scenario)
Figure 13 Global Vehicle to Grid (V2G) Market by Region, 2024-2034 (US$ Mn, AGR (%)) (U-Shaped Recovery Scenario)
Figure 14 Global Vehicle to Grid (V2G) Market by Region, 2024-2034 (US$ Mn, AGR (%)) (W-Shaped Recovery Scenario)
Figure 15 Global Vehicle to Grid (V2G) Market by Region, 2024-2034 (US$ Mn, AGR (%)) (L-Shaped Recovery Scenario)
Figure 16 Vehicle to Grid (V2G) Market: PEST Analysis
Figure 17 Vehicle to Grid (V2G) Market by Charger Type: Market Attractiveness Index
Figure 18 Global Vehicle to Grid (V2G) Market by Charger Type, 2024-2034 (US$ Mn, AGR (%))
Figure 19 Vehicle to Grid (V2G) Market Share Forecast by Charger Type, 2024, 2029, 2034 (%)
Figure 20 Bi-Directional Chargers Market by Region, 2024-2034 (US$ Mn, AGR (%))
Figure 21 Bi-Directional Chargers Market Share Forecast by Region, 2024 & 2034 (%)
Figure 22 Uni-Directional Chargers Market by Region, 2024-2034 (US$ Mn, AGR (%))
Figure 23 Uni-Directional Chargers Market Share Forecast by Region, 2024 & 2034 (%)
Figure 24 Vehicle to Grid (V2G) Market by Power Capacity: Market Attractiveness Index
Figure 25 Global Vehicle to Grid (V2G) Market by Power Capacity, 2024-2034 (US$ Mn, AGR (%))
Figure 26 Vehicle to Grid (V2G) Market Share Forecast by Power Capacity, 2024, 2029, 2034 (%)
Figure 27 Low Power (<10 kW) Market by Region, 2024-2034 (US$ Mn, AGR (%))
Figure 28 Low Power (50 kW) Market by Region, 2024-2034 (US$ Mn, AGR (%))
Figure 32 High Power (>50 kW) Market Share Forecast by Region, 2024 & 2034 (%)
Figure 33 Vehicle to Grid (V2G) Market by Components: Market Attractiveness Index
Figure 34 Global Vehicle to Grid (V2G) Market by Components, 2024-2034 (US$ Mn, AGR (%))
Figure 35 Vehicle to Grid (V2G) Market Share Forecast by Components, 2024, 2029, 2034 (%)
Figure 36 Electric Vehicle Supply Equipment (EVSE) Market by Region, 2024-2034 (US$ Mn, AGR (%))
Figure 37 Electric Vehicle Supply Equipment (EVSE) Market Share Forecast by Region, 2024 & 2034 (%)
Figure 38 Smart Meters Market by Region, 2024-2034 (US$ Mn, AGR (%))
Figure 39 Smart Meters Market Share Forecast by Region, 2024 & 2034 (%)
Figure 40 Home Energy Management (HEM) Market by Region, 2024-2034 (US$ Mn, AGR (%))
Figure 41 Home Energy Management (HEM) Market Share Forecast by Region, 2024 & 2034 (%)
Figure 42 Other Components Market by Region, 2024-2034 (US$ Mn, AGR (%))
Figure 43 Other Components Market Share Forecast by Region, 2024 & 2034 (%)
Figure 44 Vehicle to Grid (V2G) Market by Vehicle Type: Market Attractiveness Index
Figure 45 Global Vehicle to Grid (V2G) Market by Vehicle Type, 2024-2034 (US$ Mn, AGR (%))
Figure 46 Vehicle to Grid (V2G) Market Share Forecast by Vehicle Type, 2024, 2029, 2034 (%)
Figure 47 Electric Cars Market by Region, 2024-2034 (US$ Mn, AGR (%))
Figure 48 Electric Cars Market Share Forecast by Region, 2024 & 2034 (%)
Figure 49 Plug-in Hybrid Electric Vehicles (PHEVs) Market by Region, 2024-2034 (US$ Mn, AGR (%))
Figure 50 Plug-in Hybrid Electric Vehicles (PHEVs) Market Share Forecast by Region, 2024 & 2034 (%)
Figure 51 Electric Buses Market by Region, 2024-2034 (US$ Mn, AGR (%))
Figure 52 Electric Buses Market Share Forecast by Region, 2024 & 2034 (%)
Figure 53 Electric Trucks Market by Region, 2024-2034 (US$ Mn, AGR (%))
Figure 54 Electric Trucks Market Share Forecast by Region, 2024 & 2034 (%)
Figure 55 Other Vehicle Types Market by Region, 2024-2034 (US$ Mn, AGR (%))
Figure 56 Other Vehicle Types Market Share Forecast by Region, 2024 & 2034 (%)
Figure 57 Vehicle to Grid (V2G) Market by Technology: Market Attractiveness Index
Figure 58 Global Vehicle to Grid (V2G) Market by Technology, 2024-2034 (US$ Mn, AGR (%))
Figure 59 Vehicle to Grid (V2G) Market Share Forecast by Technology, 2024, 2029, 2034 (%)
Figure 60 Charging Infrastructure Market by Region, 2024-2034 (US$ Mn, AGR (%))
Figure 61 Charging Infrastructure Market Share Forecast by Region, 2024 & 2034 (%)
Figure 62 Communication Equipment Market by Region, 2024-2034 (US$ Mn, AGR (%))
Figure 63 Communication Equipment Market Share Forecast by Region, 2024 & 2034 (%)
Figure 64 Grid Management Software Market by Region, 2024-2034 (US$ Mn, AGR (%))
Figure 65 Grid Management Software Market Share Forecast by Region, 2024 & 2034 (%)
Figure 66 Energy Management Software Market by Region, 2024-2034 (US$ Mn, AGR (%))
Figure 67 Energy Management Software Market Share Forecast by Region, 2024 & 2034 (%)
Figure 68 Smart Grid Integration Solutions Market by Region, 2024-2034 (US$ Mn, AGR (%))
Figure 69 Smart Grid Integration Solutions Market Share Forecast by Region, 2024 & 2034 (%)
Figure 70 Other Technology Market by Region, 2024-2034 (US$ Mn, AGR (%))
Figure 71 Other Technology Market Share Forecast by Region, 2024 & 2034 (%)
Figure 72 Vehicle to Grid (V2G) Market Forecast by Region 2024 and 2034 (Revenue, CAGR%)
Figure 73 Vehicle to Grid (V2G) Market Share Forecast by Region 2024, 2029, 2034 (%)
Figure 74 Global Vehicle to Grid (V2G) Market by Region, 2024-2034 (US$ Mn, AGR (%))
Figure 75 North America Vehicle to Grid (V2G) Market Attractiveness Index
Figure 76 North America Vehicle to Grid (V2G) Market by Region, 2024, 2029 & 2034 (US$ Million)
Figure 77 North America Vehicle to Grid (V2G) Market by Value, 2024-2034 (US$ Mn, AGR (%))
Figure 78 North America Vehicle to Grid (V2G) Market by Country, 2024-2034 (US$ Mn, AGR (%))
Figure 79 North America Vehicle to Grid (V2G) Market Share Forecast by Country, 2024 & 2034 (%)
Figure 80 North America Vehicle to Grid (V2G) Market by Charger Type, 2024-2034 (US$ Mn, AGR (%))
Figure 81 North America Vehicle to Grid (V2G) Market Share Forecast Charger Type, 2024 & 2034 (%)
Figure 82 North America Vehicle to Grid (V2G) Market by Power Capacity, 2024-2034 (US$ Mn, AGR (%))
Figure 83 North America Vehicle to Grid (V2G) Market Share Forecast by Power Capacity, 2024 & 2034 (%)
Figure 84 North America Vehicle to Grid (V2G) Market by Components, 2024-2034 (US$ Mn, AGR (%))
Figure 85 North America Vehicle to Grid (V2G) Market Share Forecast by Components, 2024 & 2034 (%)
Figure 86 North America Vehicle to Grid (V2G) Market by Vehicle Type, 2024-2034 (US$ Mn, AGR (%))
Figure 87 North America Vehicle to Grid (V2G) Market Share Forecast by Vehicle Type, 2024 & 2034 (%)
Figure 88 North America Vehicle to Grid (V2G) Market by Technology, 2024-2034 (US$ Mn, AGR (%))
Figure 89 North America Vehicle to Grid (V2G) Market Share Forecast by Technology, 2024 & 2034 (%)
Figure 90 US Vehicle to Grid (V2G) Market by Value, 2024-2034 (US$ Mn, AGR (%))
Figure 91 Canada Vehicle to Grid (V2G) Market by Value, 2024-2034 (US$ Mn, AGR (%))
Figure 92 Europe Vehicle to Grid (V2G) Market Attractiveness Index
Figure 93 Europe Vehicle to Grid (V2G) Market by Region, 2024, 2029 & 2034 (US$ Million)
Figure 94 Europe Vehicle to Grid (V2G) Market by Value, 2024-2034 (US$ Mn, AGR (%))
Figure 95 Europe Vehicle to Grid (V2G) Market by Country, 2024-2034 (US$ Mn, AGR (%))
Figure 96 Europe Vehicle to Grid (V2G) Market Share Forecast by Country, 2024 & 2034 (%)
Figure 97 Europe Vehicle to Grid (V2G) Market by Charger Type, 2024-2034 (US$ Mn, AGR (%))
Figure 98 Europe Vehicle to Grid (V2G) Market Share Forecast Charger Type, 2024 & 2034 (%)
Figure 99 Europe Vehicle to Grid (V2G) Market by Power Capacity, 2024-2034 (US$ Mn, AGR (%))
Figure 100 Europe Vehicle to Grid (V2G) Market Share Forecast by Power Capacity, 2024 & 2034 (%)
Figure 101 Europe Vehicle to Grid (V2G) Market by Components, 2024-2034 (US$ Mn, AGR (%))
Figure 102 Europe Vehicle to Grid (V2G) Market Share Forecast by Components, 2024 & 2034 (%)
Figure 103 Europe Vehicle to Grid (V2G) Market by Vehicle Type, 2024-2034 (US$ Mn, AGR (%))
Figure 104 Europe Vehicle to Grid (V2G) Market Share Forecast by Vehicle Type, 2024 & 2034 (%)
Figure 105 Europe Vehicle to Grid (V2G) Market by Technology, 2024-2034 (US$ Mn, AGR (%))
Figure 106 Europe Vehicle to Grid (V2G) Market Share Forecast by Technology, 2024 & 2034 (%)
Figure 107 Germany Vehicle to Grid (V2G) Market by Value, 2024-2034 (US$ Mn, AGR (%))
Figure 108 UK Vehicle to Grid (V2G) Market by Value, 2024-2034 (US$ Mn, AGR (%))
Figure 109 France Vehicle to Grid (V2G) Market by Value, 2024-2034 (US$ Mn, AGR (%))
Figure 110 Italy Vehicle to Grid (V2G) Market by Value, 2024-2034 (US$ Mn, AGR (%))
Figure 111 Spain Vehicle to Grid (V2G) Market by Value, 2024-2034 (US$ Mn, AGR (%))
Figure 112 Rest of Europe Vehicle to Grid (V2G) Market by Value, 2024-2034 (US$ Mn, AGR (%))
Figure 113 Asia-Pacific Vehicle to Grid (V2G) Market Attractiveness Index
Figure 114 Asia-Pacific Vehicle to Grid (V2G) Market by Region, 2024, 2029 & 2034 (US$ Million)
Figure 115 Asia-Pacific Vehicle to Grid (V2G) Market by Value, 2024-2034 (US$ Mn, AGR (%))
Figure 116 Asia-Pacific Vehicle to Grid (V2G) Market by Country, 2024-2034 (US$ Mn, AGR (%))
Figure 117 Asia-Pacific Vehicle to Grid (V2G) Market Share Forecast by Country, 2024 & 2034 (%)
Figure 118 Asia-Pacific Vehicle to Grid (V2G) Market by Charger Type, 2024-2034 (US$ Mn, AGR (%))
Figure 119 Asia-Pacific Vehicle to Grid (V2G) Market Share Forecast Charger Type, 2024 & 2034 (%)
Figure 120 Asia-Pacific Vehicle to Grid (V2G) Market by Power Capacity, 2024-2034 (US$ Mn, AGR (%))
Figure 121 Asia-Pacific Vehicle to Grid (V2G) Market Share Forecast by Power Capacity, 2024 & 2034 (%)
Figure 122 Asia-Pacific Vehicle to Grid (V2G) Market by Components, 2024-2034 (US$ Mn, AGR (%))
Figure 123 Asia-Pacific Vehicle to Grid (V2G) Market Share Forecast by Components, 2024 & 2034 (%)
Figure 124 Asia-Pacific Vehicle to Grid (V2G) Market by Vehicle Type, 2024-2034 (US$ Mn, AGR (%))
Figure 125 Asia-Pacific Vehicle to Grid (V2G) Market Share Forecast by Vehicle Type, 2024 & 2034 (%)
Figure 126 Asia-Pacific Vehicle to Grid (V2G) Market by Technology, 2024-2034 (US$ Mn, AGR (%))
Figure 127 Asia-Pacific Vehicle to Grid (V2G) Market Share Forecast by Technology, 2024 & 2034 (%)
Figure 128 China Vehicle to Grid (V2G) Market by Value, 2024-2034 (US$ Mn, AGR (%))
Figure 129 India Vehicle to Grid (V2G) Market by Value, 2024-2034 (US$ Mn, AGR (%))
Figure 130 Japan Vehicle to Grid (V2G) Market by Value, 2024-2034 (US$ Mn, AGR (%))
Figure 131 South Korea Vehicle to Grid (V2G) Market by Value, 2024-2034 (US$ Mn, AGR (%))
Figure 132 Australia Vehicle to Grid (V2G) Market by Value, 2024-2034 (US$ Mn, AGR (%))
Figure 133 Rest of Asia-Pacific Vehicle to Grid (V2G) Market by Value, 2024-2034 (US$ Mn, AGR (%))
Figure 134 Middle East and Africa Vehicle to Grid (V2G) Market Attractiveness Index
Figure 135 Middle East and Africa Vehicle to Grid (V2G) Market by Region, 2024, 2029 & 2034 (US$ Million)
Figure 136 Middle East & Africa Vehicle to Grid (V2G) Market by Value, 2024-2034 (US$ Mn, AGR (%))
Figure 137 Middle East & Africa Vehicle to Grid (V2G) Market by Country, 2024-2034 (US$ Mn, AGR (%))
Figure 138 Middle East and Africa Vehicle to Grid (V2G) Market Share Forecast by Country, 2024 & 2034 (%)
Figure 139 Middle East & Africa Vehicle to Grid (V2G) Market by Charger Type, 2024-2034 (US$ Mn, AGR (%))
Figure 140 Middle East and Africa Vehicle to Grid (V2G) Market Share Forecast Charger Type, 2024 & 2034 (%)
Figure 141 Middle East & Africa Vehicle to Grid (V2G) Market by Power Capacity, 2024-2034 (US$ Mn, AGR (%))
Figure 142 Middle East and Africa Vehicle to Grid (V2G) Market Share Forecast by Power Capacity, 2024 & 2034 (%)
Figure 143 Middle East & Africa Vehicle to Grid (V2G) Market by Components, 2024-2034 (US$ Mn, AGR (%))
Figure 144 Middle East and Africa Vehicle to Grid (V2G) Market Share Forecast by Components, 2024 & 2034 (%)
Figure 145 Middle East & Africa Vehicle to Grid (V2G) Market by Vehicle Type, 2024-2034 (US$ Mn, AGR (%))
Figure 146 Middle East and Africa Vehicle to Grid (V2G) Market Share Forecast by Vehicle Type, 2024 & 2034 (%)
Figure 147 Middle East & Africa Vehicle to Grid (V2G) Market by Technology, 2024-2034 (US$ Mn, AGR (%))
Figure 148 Middle East and Africa Vehicle to Grid (V2G) Market Share Forecast by Technology, 2024 & 2034 (%)
Figure 149 GCC Vehicle to Grid (V2G) Market by Value, 2024-2034 (US$ Mn, AGR (%))
Figure 150 South Africa Vehicle to Grid (V2G) Market by Value, 2024-2034 (US$ Mn, AGR (%))
Figure 151 Rest of Middle East & Africa Vehicle to Grid (V2G) Market by Value, 2024-2034 (US$ Mn, AGR (%))
Figure 152 Latin America Vehicle to Grid (V2G) Market Attractiveness Index
Figure 153 Latin America Vehicle to Grid (V2G) Market by Region, 2024, 2029 & 2034 (US$ Million)
Figure 154 Latin America Vehicle to Grid (V2G) Market by Value, 2024-2034 (US$ Mn, AGR (%))
Figure 155 Latin America Vehicle to Grid (V2G) Market by Country, 2024-2034 (US$ Mn, AGR (%))
Figure 156 Latin America Vehicle to Grid (V2G) Market Share Forecast by Country, 2024 & 2034 (%)
Figure 157 Latin America Vehicle to Grid (V2G) Market by Charger Type, 2024-2034 (US$ Mn, AGR (%))
Figure 158 Latin America Vehicle to Grid (V2G) Market Share Forecast Charger Type, 2024 & 2034 (%)
Figure 159 Latin America Vehicle to Grid (V2G) Market by Power Capacity, 2024-2034 (US$ Mn, AGR (%))
Figure 160 Latin America Vehicle to Grid (V2G) Market Share Forecast by Power Capacity, 2024 & 2034 (%)
Figure 161 Latin America Vehicle to Grid (V2G) Market by Components, 2024-2034 (US$ Mn, AGR (%))
Figure 162 Latin America Vehicle to Grid (V2G) Market Share Forecast by Components, 2024 & 2034 (%)
Figure 163 Latin America Vehicle to Grid (V2G) Market by Vehicle Type, 2024-2034 (US$ Mn, AGR (%))
Figure 164 Latin America Vehicle to Grid (V2G) Market Share Forecast by Vehicle Type, 2024 & 2034 (%)
Figure 165 Latin America Vehicle to Grid (V2G) Market by Technology, 2024-2034 (US$ Mn, AGR (%))
Figure 166 Latin America Vehicle to Grid (V2G) Market Share Forecast by Technology, 2024 & 2034 (%)
Figure 167 Brazil Vehicle to Grid (V2G) Market by Value, 2024-2034 (US$ Mn, AGR (%))
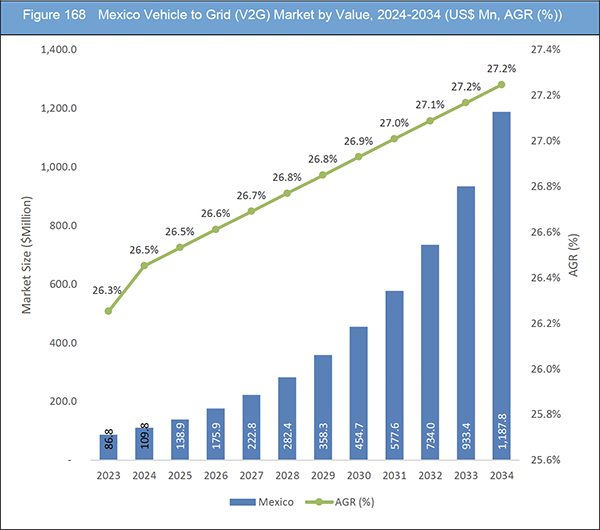
Figure 168 Mexico Vehicle to Grid (V2G) Market by Value, 2024-2034 (US$ Mn, AGR (%))
Figure 169 Rest of Latin America Vehicle to Grid (V2G) Market by Value, 2024-2034 (US$ Mn, AGR (%))
Figure 170 Vehicle to Grid (V2G) Market: Company Share, 2022
Figure 171 Denso Corporation.: Net Revenue, 2019-2023 (US$ Million, AGR%)
Figure 172 NRG Energy, Inc..: Net Revenue, 2018-2022 (US$ Million, AGR%)
Figure 173 NRG Energy, Inc..: Business Segment Revenue Share, 2022 (%)
Figure 174 Honda Motor Co., Ltd.: Net Revenue, 2019-2023 (US$ Million, AGR%)
Figure 175 Honda Motor Co., Ltd.: R&D, 2019-2023 (US$ Million, AGR%)
Figure 176 Honda Motor Co., Ltd.: Regional Revenue Share, 2023 (%)
Figure 177 Toyota Industries Corporation.: Net Revenue, 2019-2023 (US$ Million, AGR%)
Figure 178 Toyota Industries Corporation.: R&D, 2019-2023 (US$ Million, AGR%)
Figure 179 Toyota Industries Corporation.: Regional Revenue Share, 2023 (%)
Figure 180 Toyota Industries Corporation.: Business Segment Revenue Share, 2023 (%)
Figure 181 Hitachi, Ltd.: Net Revenue, 2019-2023 (US$ Million, AGR%)
Figure 182 Hitachi, Ltd.: Regional Revenue Share, 2023 (%)
Figure 183 Hitachi, Ltd.: Business Segment Revenue Share, 2023 (%)
Figure 184 ABB Limited.: Net Revenue, 2018-2022 (US$ Million, AGR%)
Figure 185 ABB Limited.: R&D, 2018-2022 (US$ Million, AGR%)
Figure 186 ABB Limited.: Business Segment Revenue Share, 2022 (%)
Figure 187 Edison International.: Net Revenue, 2018-2022 (US$ Million, AGR%)
Figure 188 Nissan Motor Co., Ltd..: Net Revenue, 2018-2022 (US$ Million, AGR%)
Figure 189 Nissan Motor Co., Ltd..: Regional Revenue Share, 2022 (%)
Figure 190 Nissan Motor Co., Ltd..: Business Segment Revenue Share, 2022 (%)
Figure 191 Indra Sistemas, S.A.: Net Revenue, 2018-2022 (US$ Million, AGR%)
Figure 192 NUVVE Holding Corp.: Net Revenue, 2020-2022 (US$ Million, AGR%)
Figure 193 NUVVE Holding Corp.: R&D, 2020-2022 (US$ Million, AGR%)
Figure 194 NUVVE Holding Corp.: Regional Revenue Share, 2022 (%)
Figure 195 Wallbox.: Net Revenue, 2019-2022 (US$ Million, AGR%)
ページTOPに戻る
Summary
Report Details
The Vehicle to Grid (V2G) Market Report 2024-2034: This report will prove invaluable to leading firms striving for new revenue pockets if they wish to better understand the industry and its underlying dynamics. It will be useful for companies that would like to expand into different industries or to expand their existing operations in a new region.
Escalating Demand for Electricity, Coupled With a Global Commitment to Reduce Reliance on Fossil Fuels, Resulting in a Surge in the Adoption of Electric Vehicles
The vehicle-to-grid (V2G) market is witnessing unprecedented growth driven by a confluence of factors shaping the future of sustainable transportation and power management. Key drivers include the escalating demand for electricity, coupled with a global commitment to reduce reliance on fossil fuels, resulting in a surge in the adoption of electric vehicles (EVs). This market is characterized by opportunities that lie in the integration of renewable energy sources, such as solar and wind, to meet energy demands, while also addressing challenges associated with the variable nature of these sources.
The primary driver for the V2G market is the escalating demand for electricity worldwide. Governments and industries are increasingly recognizing the need for sustainable and low-emission solutions, driving the widespread adoption of EVs. The electrification of the transportation sector not only addresses environmental concerns but also provides a unique opportunity for EVs to serve as mobile energy storage units. This bidirectional flow of power, where EVs can both draw and supply energy to the grid, is a key driver propelling the V2G market forward.
Opportunities in the V2G market are abundant, particularly in the integration of renewable energy sources. As countries strive to meet ambitious renewable energy targets, V2G technology becomes an enabler for managing the intermittent nature of solar and wind power. This creates opportunities for smart grid solutions and advanced energy storage systems. Additionally, the idle times of parked EVs present an untapped opportunity for bidirectional power flow, optimizing energy use during off-peak hours and supporting the grid during peak demand periods.
High Cost Associated with Upgrading Existing Charging Infrastructure
A significant challenge impeding the seamless progression of the vehicle-to-grid (V2G) market is the substantial cost associated with upgrading existing charging infrastructure. As the demand for V2G technology increases, the existing charging stations need to undergo modifications and enhancements to accommodate bidirectional power flow between the grid and electric vehicles (EVs). This retrofitting process involves installing advanced chargers capable of bidirectional energy transfer, along with the necessary communication and control systems. The high upfront investment required for these upgrades poses a financial hurdle for charging infrastructure providers and businesses operating in the V2G ecosystem.
What Questions Should You Ask before Buying a Market Research Report?
-
How is the vehicle-to-grid (V2G) market evolving?
-
What is driving and restraining the vehicle-to-grid (V2G) market?
-
How will each vehicle-to-grid (V2G) submarket segment grow over the forecast period and how much revenue will these submarkets account for in 2034?
-
How will the market shares for each vehicle-to-grid (V2G) submarket develop from 2024 to 2034?
-
What will be the main driver for the overall market from 2024 to 2034?
-
Will leading vehicle-to-grid (V2G) markets broadly follow the macroeconomic dynamics, or will individual national markets outperform others?
-
How will the market shares of the national markets change by 2034 and which geographical region will lead the market in 2034?
-
Who are the leading players and what are their prospects over the forecast period?
-
What are the vehicle-to-grid (V2G) projects for these leading companies?
-
How will the industry evolve during the period between 2024 and 2034? What are the implications of vehicle-to-grid (V2G) projects taking place now and over the next 10 years?
-
Is there a greater need for product commercialisation to further scale the vehicle-to-grid (V2G) market?
-
Where is the vehicle-to-grid (V2G) market heading and how can you ensure you are at the forefront of the market?
-
What are the best investment options for new product and service lines?
-
What are the key prospects for moving companies into a new growth path and C-suite?
You need to discover how this will impact the vehicle-to-grid (V2G) market today, and over the next 10 years:
-
Our 414-page report provides 127 tables and 195 charts/graphs exclusively to you.
-
The report highlights key lucrative areas in the industry so you can target them – NOW.
-
It contains in-depth analysis of global, regional and national sales and growth.
-
It highlights for you the key successful trends, changes and revenue projections made by your competitors.
This report tells you TODAY how the vehicle-to-grid (V2G) market will develop in the next 10 years, and in line with the variations in COVID-19 economic recession and bounce. This market is more critical now than at any point over the last 10 years.
Forecasts to 2034 and other analyses reveal commercial prospects
-
In addition to revenue forecasting to 2034, our new study provides you with recent results, growth rates, and market shares.
-
You will find original analyses, with business outlooks and developments.
-
Discover qualitative analyses (including market dynamics, drivers, opportunities, restraints and challenges), cost structure, impact of rising vehicle-to-grid (V2G) prices and recent developments.
This report includes data analysis and invaluable insight into how COVID-19 will affect the industry and your company. Four COVID-19 recovery patterns and their impact, namely, “V”, “L”, “W” and “U” are discussed in this report.
Segments Covered in the Report
Market Segment by Charger Type
-
Bi-Directional Chargers
-
Uni-Directional Chargers
Market Segment by Power Capacity
-
Low Power (<10 kW)
-
Medium Power (10 kW-50 kW)
-
High Power (>50 kW)
Market Segment by Components
-
Electric Vehicle Supply Equipment (EVSE)
-
Smart Meters
-
Home Energy Management (HEM)
-
Other Components
Market Segment by Vehicle Type
-
Electric Cars
-
Plug-in Hybrid Electric Vehicles (PHEVs)
-
Electric Buses
-
Electric Trucks
-
Other Vehicle Types
Market Segment by Technology
-
Charging Infrastructure
-
Communication Equipment
-
Grid Management Software
-
Energy Management Software
-
Smart Grid Integration Solutions
-
Other Technology
In addition to the revenue predictions for the overall world market and segments, you will also find revenue forecasts for four regional and 20 leading national markets:
North America
Europe
-
Germany
-
Spain
-
United Kingdom
-
France
-
Italy
-
Rest of Europe
Asia Pacific
-
China
-
Japan
-
India
-
Australia
-
South Korea
-
Rest of Asia Pacific
Latin America
-
Brazil
-
Mexico
-
Rest of Latin America
Middle East & Africa
-
GCC
-
South Africa
-
Rest of Middle East & Africa
The report also includes profiles and for some of the leading companies in the Vehicle-to-Grid (V2G) Market, 2024 to 2034, with a focus on this segment of these companies’ operations.
Leading companies profiled in the report
-
ABB Limited
-
AC Propulsion
-
Denso Corporation
-
Edison International
-
EV Grid, Inc
-
Fermata Energy
-
Hitachi, Ltd
-
Honda Motor Co., Ltd
-
Indra Sistemas, S.A
-
Nissan Motor Co., Ltd.
-
NRG Energy, Inc.
-
NUVVE Holding Corp
-
OVO Energy
-
Toyota Industries Corporation
-
Wallbox
Overall world revenue for Vehicle-to-Grid (V2G) Market, 2024 to 2034 in terms of value the market will surpass US$4,312.2 million in 2024, our work calculates. We predict strong revenue growth through to 2034. Our work identifies which organisations hold the greatest potential. Discover their capabilities, progress, and commercial prospects, helping you stay ahead.
How will the Vehicle-to-Grid (V2G) Market, 2024 to 2034 report help you?
In summary, our 410+ page report provides you with the following knowledge:
-
Revenue forecasts to 2034 for Vehicle-to-Grid (V2G) Market, 2024 to 2034 Market, with forecasts for charger type, power capacity, components, vehicle type, and technology, each forecast at a global and regional level – discover the industry’s prospects, finding the most lucrative places for investments and revenues.
-
Revenue forecasts to 2034 for four regional and 20 key national markets – See forecasts for the Vehicle-to-Grid (V2G) Market, 2024 to 2034 market in North America, Europe, Asia-Pacific, Latin America and Middle East & Africa. Also forecasted is the market in the US, Canada, Brazil, Germany, France, UK, Italy, China, India, Japan, and Australia among other prominent economies.
-
Prospects for established firms and those seeking to enter the market – including company profiles for 15 of the major companies involved in the Vehicle-to-Grid (V2G) Market, 2024 to 2034.
Find quantitative and qualitative analyses with independent predictions. Receive information that only our report contains, staying informed with invaluable business intelligence.
Information found nowhere else
With our new report, you are less likely to fall behind in knowledge or miss out on opportunities. See how our work could benefit your research, analyses, and decisions. Visiongain’s study is for everybody needing commercial analyses for the Vehicle-to-Grid (V2G) Market, 2024 to 2034, market-leading companies. You will find data, trends and predictions.
ページTOPに戻る
Table of Contents
Table of Contents
1 Report Overview
1.1 Objectives of the Study
1.2 Introduction to Vehicle to Grid (V2G) Market
1.3 What This Report Delivers
1.4 Why You Should Read This Report
1.5 Key Questions Answered by This Analytical Report
1.6 Who Is This Report for?
1.7 Methodology
1.7.1 Market Definitions
1.7.2 Market Evaluation & Forecasting Methodology
1.7.3 Data Validation
1.7.3.1 Primary Research
1.7.3.2 Secondary Research
1.8 Frequently Asked Questions (FAQs)
1.9 Associated Visiongain Reports
1.10 About Visiongain
2 Executive Summary
3 Market Overview
3.1 Key Findings
3.2 Market Dynamics
3.2.1 Market Driving Factors
3.2.1.1 Supportive Government Regulations and Financial Incentives for V2G Deployment.
3.2.1.2 Growing Adoption of Electric Vehicles Across the Globe Driving the Market Growth
3.2.1.3 Rising Urbanization and Industrialization Driving the Market Growth
3.2.2 Market Restraining Factors
3.2.2.1 High Cost Associated with Upgrading Existing Charging Infrastructure
3.2.2.2 Lack of Standardized Charging Infrastructure Hinder the Market Growth
3.2.2.3 Grid Limitations and Upgrades Hinder the Market
3.2.3 Market Opportunities
3.2.3.1 Ongoing Technological Advancements in V2G Technology Opportunities for Market
3.2.3.2 Collaboration and Partnership Opportunities for the Market Players
3.2.3.3 New Energy Management Technology Opportunities for the Market
3.3 Porter’s Five Forces Analysis
3.3.1 Bargaining Power of Suppliers (Medium)
3.3.2 Bargaining Power of Buyers (High)
3.3.3 Competitive Rivalry (High)
3.3.4 Threat from Substitutes (Low)
3.3.5 Threat of New Entrants (Low to Medium)
3.4 COVID-19 Impact Analysis
3.4.1 “V-Shaped Recovery”
3.4.2 “U-Shaped Recovery”
3.4.3 “W-Shaped Recovery”
3.4.4 “L-Shaped Recovery”
3.5 PEST Analysis
4 Vehicle to Grid (V2G) Market Analysis by Charger Type
4.1 Key Findings
4.2 Charger Type Segment: Market Attractiveness Index
4.3 Vehicle to Grid (V2G) Market Size Estimation and Forecast by Charger Type
4.4 Bi-Directional Chargers
4.4.1 Market Size by Region, 2024-2034 (US$ Million)
4.4.2 Market Share by Region, 2024 & 2034 (%)
4.5 Uni-Directional Chargers
4.5.1 Market Size by Region, 2024-2034 (US$ Million)
4.5.2 Market Share by Region, 2024 & 2034 (%)
5 Vehicle to Grid (V2G) Market Analysis by Power Capacity
5.1 Key Findings
5.2 Power Capacity Segment: Market Attractiveness Index
5.3 Vehicle to Grid (V2G) Market Size Estimation and Forecast by Power Capacity
5.4 Low Power (50 kW)
5.6.1 Market Size by Region, 2024-2034 (US$ Million)
5.6.2 Market Share by Region, 2024 & 2034 (%)
6 Vehicle to Grid (V2G) Market Analysis by Components
6.1 Key Findings
6.2 Components Segment: Market Attractiveness Index
6.3 Vehicle to Grid (V2G) Market Size Estimation and Forecast by Components
6.4 Electric Vehicle Supply Equipment (EVSE)
6.4.1 Market Size by Region, 2024-2034 (US$ Million)
6.4.2 Market Share by Region, 2024 & 2034 (%)
6.5 Smart Meters
6.5.1 Market Size by Region, 2024-2034 (US$ Million)
6.5.2 Market Share by Region, 2024 & 2034 (%)
6.6 Home Energy Management (HEM)
6.6.1 Market Size by Region, 2024-2034 (US$ Million)
6.6.2 Market Share by Region, 2024 & 2034 (%)
6.7 Other Components
6.7.1 Market Size by Region, 2024-2034 (US$ Million)
6.7.2 Market Share by Region, 2024 & 2034 (%)
7 Vehicle to Grid (V2G) Market Analysis by Vehicle Type
7.1 Key Findings
7.2 Vehicle Type Segment: Market Attractiveness Index
7.3 Vehicle to Grid (V2G) Market Size Estimation and Forecast by Vehicle Type
7.4 Electric Cars
7.4.1 Market Size by Region, 2024-2034 (US$ Million)
7.4.2 Market Share by Region, 2024 & 2034 (%)
7.5 Plug-in Hybrid Electric Vehicles (PHEVs)
7.5.1 Market Size by Region, 2024-2034 (US$ Million)
7.5.2 Market Share by Region, 2024 & 2034 (%)
7.6 Electric Buses
7.6.1 Market Size by Region, 2024-2034 (US$ Million)
7.6.2 Market Share by Region, 2024 & 2034 (%)
7.7 Electric Trucks
7.7.1 Market Size by Region, 2024-2034 (US$ Million)
7.7.2 Market Share by Region, 2024 & 2034 (%)
7.8 Other Vehicle Types
7.8.1 Market Size by Region, 2024-2034 (US$ Million)
7.8.2 Market Share by Region, 2024 & 2034 (%)
8 Vehicle to Grid (V2G) Market Analysis by Technology
8.1 Key Findings
8.2 Technology Segment: Market Attractiveness Index
8.3 Vehicle to Grid (V2G) Market Size Estimation and Forecast by Technology
8.4 Charging Infrastructure
8.4.1 Market Size by Region, 2024-2034 (US$ Million)
8.4.2 Market Share by Region, 2024 & 2034 (%)
8.5 Communication Equipment
8.5.1 Market Size by Region, 2024-2034 (US$ Million)
8.5.2 Market Share by Region, 2024 & 2034 (%)
8.6 Grid Management Software
8.6.1 Market Size by Region, 2024-2034 (US$ Million)
8.6.2 Market Share by Region, 2024 & 2034 (%)
8.7 Energy Management Software
8.7.1 Market Size by Region, 2024-2034 (US$ Million)
8.7.2 Market Share by Region, 2024 & 2034 (%)
8.8 Smart Grid Integration Solutions
8.8.1 Market Size by Region, 2024-2034 (US$ Million)
8.8.2 Market Share by Region, 2024 & 2034 (%)
8.9 Other Technology
8.9.1 Market Size by Region, 2024-2034 (US$ Million)
8.9.2 Market Share by Region, 2024 & 2034 (%)
9 Vehicle to Grid (V2G) Market Analysis by Region
9.1 Key Findings
9.2 Regional Market Size Estimation and Forecast
10 North America Vehicle to Grid (V2G) Market Analysis
10.1 Key Findings
10.2 North America Vehicle to Grid (V2G) Market Attractiveness Index
10.3 North America Vehicle to Grid (V2G) Market by Country, 2024, 2029 & 2034 (US$ Million)
10.4 North America Vehicle to Grid (V2G) Market Size Estimation and Forecast
10.5 North America Vehicle to Grid (V2G) Market Size Estimation and Forecast by Country
10.6 North America Vehicle to Grid (V2G) Market Size Estimation and Forecast by Charger Type
10.7 North America Vehicle to Grid (V2G) Market Size Estimation and Forecast by Power Capacity
10.8 North America Vehicle to Grid (V2G) Market Size Estimation and Forecast by Components
10.9 North America Vehicle to Grid (V2G) Market Size Estimation and Forecast by Vehicle Type
10.10 North America Vehicle to Grid (V2G) Market Size Estimation and Forecast by Technology
10.11 U.S. Vehicle to Grid (V2G) Market Analysis
10.12 Canada Vehicle to Grid (V2G) Market Analysis
11 Europe Vehicle to Grid (V2G) Market Analysis
11.1 Key Findings
11.2 Europe Vehicle to Grid (V2G) Market Attractiveness Index
11.3 Europe Vehicle to Grid (V2G) Market by Country, 2024, 2029 & 2034 (US$ Million)
11.4 Europe Vehicle to Grid (V2G) Market Size Estimation and Forecast
11.5 Europe Vehicle to Grid (V2G) Market Size Estimation and Forecast by Country
11.6 Europe Vehicle to Grid (V2G) Market Size Estimation and Forecast by Charger Type
11.7 Europe Vehicle to Grid (V2G) Market Size Estimation and Forecast by Power Capacity
11.8 Europe Vehicle to Grid (V2G) Market Size Estimation and Forecast by Components
11.9 Europe Vehicle to Grid (V2G) Market Size Estimation and Forecast by Vehicle Type
11.10 Europe Vehicle to Grid (V2G) Market Size Estimation and Forecast by Technology
11.11 Germany Vehicle to Grid (V2G) Market Analysis
11.12 UK Vehicle to Grid (V2G) Market Analysis
11.13 France Vehicle to Grid (V2G) Market Analysis
11.14 Italy Vehicle to Grid (V2G) Market Analysis
11.15 Spain Vehicle to Grid (V2G) Market Analysis
11.16 Rest of Europe Vehicle to Grid (V2G) Market Analysis
12 Asia-Pacific Vehicle to Grid (V2G) Market Analysis
12.1 Key Findings
12.2 Asia-Pacific Vehicle to Grid (V2G) Market Attractiveness Index
12.3 Asia-Pacific Vehicle to Grid (V2G) Market by Country, 2024, 2029 & 2034 (US$ Million)
12.4 Asia-Pacific Vehicle to Grid (V2G) Market Size Estimation and Forecast
12.5 Asia-Pacific Vehicle to Grid (V2G) Market Size Estimation and Forecast by Country
12.6 Asia-Pacific Vehicle to Grid (V2G) Market Size Estimation and Forecast by Charger Type
12.7 Asia-Pacific Vehicle to Grid (V2G) Market Size Estimation and Forecast by Power Capacity
12.8 Asia-Pacific Vehicle to Grid (V2G) Market Size Estimation and Forecast by Components
12.9 Asia-Pacific Vehicle to Grid (V2G) Market Size Estimation and Forecast by Vehicle Type
12.10 Asia-Pacific Vehicle to Grid (V2G) Market Size Estimation and Forecast by Technology
12.11 China Vehicle to Grid (V2G) Market Analysis
12.12 India Vehicle to Grid (V2G) Market Analysis
12.13 Japan Vehicle to Grid (V2G) Market Analysis
12.14 South Korea Vehicle to Grid (V2G) Market Analysis
12.15 Australia Vehicle to Grid (V2G) Market Analysis
12.16 Rest of Asia-Pacific Vehicle to Grid (V2G) Market Analysis
13 Middle East and Africa Vehicle to Grid (V2G) Market Analysis
13.1 Key Findings
13.2 Middle East and Africa Vehicle to Grid (V2G) Market Attractiveness Index
13.3 Middle East and Africa Vehicle to Grid (V2G) Market by Country, 2024, 2029 & 2034 (US$ Million)
13.4 Middle East and Africa Vehicle to Grid (V2G) Market Size Estimation and Forecast
13.5 Middle East and Africa Vehicle to Grid (V2G) Market Size Estimation and Forecast by Country
13.6 Middle East and Africa Vehicle to Grid (V2G) Market Size Estimation and Forecast by Charger Type
13.7 Middle East and Africa Vehicle to Grid (V2G) Market Size Estimation and Forecast by Power Capacity
13.8 Middle East and Africa Vehicle to Grid (V2G) Market Size Estimation and Forecast by Components
13.9 Middle East and Africa Vehicle to Grid (V2G) Market Size Estimation and Forecast by Vehicle Type
13.10 Middle East and Africa Vehicle to Grid (V2G) Market Size Estimation and Forecast by Technology
13.11 GCC Vehicle to Grid (V2G) Market Analysis
13.12 South Africa Vehicle to Grid (V2G) Market Analysis
13.13 Rest of Middle East & Africa Vehicle to Grid (V2G) Market Analysis
14 Latin America Vehicle to Grid (V2G) Market Analysis
14.1 Key Findings
14.2 Latin America Vehicle to Grid (V2G) Market Attractiveness Index
14.3 Latin America Vehicle to Grid (V2G) Market by Country, 2024, 2029 & 2034 (US$ Million)
14.4 Latin America Vehicle to Grid (V2G) Market Size Estimation and Forecast
14.5 Latin America Vehicle to Grid (V2G) Market Size Estimation and Forecast by Country
14.6 Latin America Vehicle to Grid (V2G) Market Size Estimation and Forecast by Charger Type
14.7 Latin America Vehicle to Grid (V2G) Market Size Estimation and Forecast by Power Capacity
14.8 Latin America Vehicle to Grid (V2G) Market Size Estimation and Forecast by Components
14.9 Latin America Vehicle to Grid (V2G) Market Size Estimation and Forecast by Vehicle Type
14.10 Latin America Vehicle to Grid (V2G) Market Size Estimation and Forecast by Technology
14.11 Brazil Vehicle to Grid (V2G) Market Analysis
14.12 Mexico Vehicle to Grid (V2G) Market Analysis
14.13 Rest of Latin America Vehicle to Grid (V2G) Market Analysis
15 Company Profiles
15.1 Competitive Landscape, 2022
15.2 Strategic Outlook
15.3 Denso Corporation
15.3.1 Company Snapshot
15.3.2 Company Overview
15.3.3 Financial Analysis
15.3.3.1 Net Revenue, 2019-2023
15.3.4 Product Benchmarking
15.3.5 Strategic Outlook
15.4 AC Propulsion
15.4.1 Company Snapshot
15.4.2 Company Overview
15.4.3 Product Benchmarking
15.5 NRG Energy, Inc.
15.5.1 Company Snapshot
15.5.2 Company Overview
15.5.3 Financial Analysis
15.5.3.1 Net Revenue, 2018-2022
15.5.3.2 Business Segment Revenue Share, 2022 (%)
15.5.4 Product Benchmarking
15.6 Honda Motor Co., Ltd
15.6.1 Company Snapshot
15.6.2 Company Overview
15.6.3 Financial Analysis
15.6.3.1 Net Revenue, 2019-2023
15.6.3.2 R&D, 2019-2023
15.6.3.3 Regional Revenue Share, 2022 (%)
15.6.4 Product Benchmarking
15.6.5 Strategic Outlook
15.7 OVO Energy
15.7.1 Company Snapshot
15.7.2 Company Overview
15.7.3 Product Benchmarking
15.7.4 Strategic Outlook
15.8 Fermata Energy
15.8.1 Company Snapshot
15.8.2 Company Overview
15.8.3 Product Benchmarking
15.8.4 Strategic Outlook
15.9 Toyota Industries Corporation
15.9.1 Company Snapshot
15.9.2 Company Overview
15.9.3 Financial Analysis
15.9.3.1 Net Revenue, 2019-2023
15.9.3.2 R&D, 2019-2023
15.9.3.3 Regional Revenue Share, 2023 (%)
15.9.3.4 Business Segment Revenue Share, 2023 (%)
15.9.4 Product Benchmarking
15.9.5 Strategic Outlook
15.10 Hitachi, Ltd
15.10.1 Company Snapshot
15.10.2 Company Overview
15.10.3 Financial Analysis
15.10.3.1 Net Revenue, 2019-2023
15.10.3.2 Regional Revenue Share, 2023 (%)
15.10.3.3 Business Segment Revenue Share, 2023 (%)
15.10.4 Product Benchmarking
15.10.5 Strategic Outlook
15.11 ABB Limited
15.11.1 Company Snapshot
15.11.2 Company Overview
15.11.3 Financial Analysis
15.11.3.1 Net Revenue, 2018-2022
15.11.3.2 R&D, 2018-2022
15.11.3.3 Business Segment Revenue Share, 2022 (%)
15.11.4 Product Benchmarking
15.11.5 Strategic Outlook
15.12 Edison International
15.12.1 Company Snapshot
15.12.2 Company Overview
15.12.3 Financial Analysis
15.12.3.1 Net Revenue, 2018-2022
15.12.4 Product Benchmarking
15.13 EV Grid, Inc
15.13.1 Company Snapshot
15.13.2 Company Overview
15.13.3 Product Benchmarking
15.14 Nissan Motor Co., Ltd.
15.14.1 Company Snapshot
15.14.2 Company Overview
15.14.3 Financial Analysis
15.14.3.1 Net Revenue, 2018-2022
15.14.3.2 Regional Revenue Share, 2022 (%)
15.14.3.3 Business Segment Revenue Share, 2022 (%)
15.14.4 Product Benchmarking
15.15 Indra Sistemas, S.A
15.15.1 Company Snapshot
15.15.2 Company Overview
15.15.3 Financial Analysis
15.15.3.1 Net Revenue, 2018-2022
15.15.4 Product Benchmarking
15.15.5 Strategic Outlook
15.16 NUVVE Holding Corp
15.16.1 Company Snapshot
15.16.2 Company Overview
15.16.3 Financial Analysis
15.16.3.1 Net Revenue, 2020-2022
15.16.3.2 R&D, 2020-2022
15.16.3.3 Regional Revenue Share, 2022 (%)
15.16.4 Product Benchmarking
15.16.5 Strategic Outlook
15.17 Wallbox
15.17.1 Company Snapshot
15.17.2 Company Overview
15.17.3 Financial Analysis
15.17.3.1 Net Revenue, 2019-2022
15.17.4 Product Benchmarking
15.17.5 Strategic Outlook
16 Conclusion and Recommendations
16.1 Concluding Remarks from Visiongain
16.2 Recommendations for Market Players
ページTOPに戻る
List of Tables/Graphs
List of Tables
Table 1 Vehicle to Grid (V2G) Market Snapshot, 2024 & 2034 (US$ Million, CAGR %)
Table 2 Global Vehicle to Grid (V2G) Market by Region, 2024-2034 (US$ Mn, AGR (%), CAGR (%)) (V-Shaped Recovery Scenario)
Table 3 Global Vehicle to Grid (V2G) Market by Region, 2024-2034 (US$ Mn, AGR (%), CAGR (%)) (U-Shaped Recovery Scenario)
Table 4 Global Vehicle to Grid (V2G) Market by Region, 2024-2034 (US$ Mn, AGR (%), CAGR (%)) (W-Shaped Recovery Scenario)
Table 5 Global Vehicle to Grid (V2G) Market by Region, 2024-2034 (US$ Mn, AGR (%), CAGR (%)) (L-Shaped Recovery Scenario)
Table 6 Global Vehicle to Grid (V2G) Market by Charger Type, 2024-2034 (US$ Mn, AGR (%), CAGR (%))
Table 7 Bi-Directional Chargers Market by Region, 2024-2034 (US$ Mn, AGR (%), CAGR (%))
Table 8 Uni-Directional Chargers Market by Region, 2024-2034 (US$ Mn, AGR (%), CAGR (%))
Table 9 Global Vehicle to Grid (V2G) Market by Power Capacity, 2024-2034 (US$ Mn, AGR (%), CAGR (%))
Table 10 Low Power (50 kW) Market by Region, 2024-2034 (US$ Mn, AGR (%), CAGR (%))
Table 13 Global Vehicle to Grid (V2G) Market by Components, 2024-2034 (US$ Mn, AGR (%), CAGR (%))
Table 14 Electric Vehicle Supply Equipment (EVSE) Market by Region, 2024-2034 (US$ Mn, AGR (%), CAGR (%))
Table 15 Smart Meters Market by Region, 2024-2034 (US$ Mn, AGR (%), CAGR (%))
Table 16 Home Energy Management (HEM) Market by Region, 2024-2034 (US$ Mn, AGR (%), CAGR (%))
Table 17 Other Components Market by Region, 2024-2034 (US$ Mn, AGR (%), CAGR (%))
Table 18 Global Vehicle to Grid (V2G) Market by Vehicle Type, 2024-2034 (US$ Mn, AGR (%), CAGR (%))
Table 19 Electric Cars Market by Region, 2024-2034 (US$ Mn, AGR (%), CAGR (%))
Table 20 Plug-in Hybrid Electric Vehicles (PHEVs) Market by Region, 2024-2034 (US$ Mn, AGR (%), CAGR (%))
Table 21 Electric Buses Market by Region, 2024-2034 (US$ Mn, AGR (%), CAGR (%))
Table 22 Electric Trucks Market by Region, 2024-2034 (US$ Mn, AGR (%), CAGR (%))
Table 23 Other Vehicle Types Market by Region, 2024-2034 (US$ Mn, AGR (%), CAGR (%))
Table 24 Global Vehicle to Grid (V2G) Market by Technology, 2024-2034 (US$ Mn, AGR (%), CAGR (%))
Table 25 Charging Infrastructure Market by Region, 2024-2034 (US$ Mn, AGR (%), CAGR (%))
Table 26 Communication Equipment Market by Region, 2024-2034 (US$ Mn, AGR (%), CAGR (%))
Table 27 Grid Management Software Market by Region, 2024-2034 (US$ Mn, AGR (%), CAGR (%))
Table 28 Energy Management Software Market by Region, 2024-2034 (US$ Mn, AGR (%), CAGR (%))
Table 29 Smart Grid Integration Solutions Market by Region, 2024-2034 (US$ Mn, AGR (%), CAGR (%))
Table 30 Other Technology Market by Region, 2024-2034 (US$ Mn, AGR (%), CAGR (%))
Table 31 Global Vehicle to Grid (V2G) Market by Region, 2024-2034 (US$ Mn, AGR (%), CAGR (%))
Table 32 North America Vehicle to Grid (V2G) Market by Value, 2024-2034 (US$ Mn, AGR (%), CAGR (%))
Table 33 North America Vehicle to Grid (V2G) Market by Country, 2024-2034 (US$ Mn, AGR (%), CAGR (%))
Table 34 North America Vehicle to Grid (V2G) Market by Charger Type, 2024-2034 (US$ Mn, AGR (%), CAGR (%))
Table 35 North America Vehicle to Grid (V2G) Market by Power Capacity, 2024-2034 (US$ Mn, AGR (%), CAGR (%))
Table 36 North America Vehicle to Grid (V2G) Market by Components, 2024-2034 (US$ Mn, AGR (%), CAGR (%))
Table 37 North America Vehicle to Grid (V2G) Market by Vehicle Type, 2024-2034 (US$ Mn, AGR (%), CAGR (%))
Table 38 North America Vehicle to Grid (V2G) Market by Technology, 2024-2034 (US$ Mn, AGR (%), CAGR (%))
Table 39 US Vehicle to Grid (V2G) Market by Value, 2024-2034 (US$ Mn, AGR (%), CAGR (%))
Table 40 Canada Vehicle to Grid (V2G) Market by Value, 2024-2034 (US$ Mn, AGR (%), CAGR (%))
Table 41 Europe Vehicle to Grid (V2G) Market by Value, 2024-2034 (US$ Mn, AGR (%), CAGR (%))
Table 42 Europe Vehicle to Grid (V2G) Market by Country, 2024-2034 (US$ Mn, AGR (%), CAGR (%))
Table 43 Europe Vehicle to Grid (V2G) Market by Charger Type, 2024-2034 (US$ Mn, AGR (%), CAGR (%))
Table 44 Europe Vehicle to Grid (V2G) Market by Power Capacity, 2024-2034 (US$ Mn, AGR (%), CAGR (%))
Table 45 Europe Vehicle to Grid (V2G) Market by Components, 2024-2034 (US$ Mn, AGR (%), CAGR (%))
Table 46 Europe Vehicle to Grid (V2G) Market by Vehicle Type, 2024-2034 (US$ Mn, AGR (%), CAGR (%))
Table 47 Europe Vehicle to Grid (V2G) Market by Technology, 2024-2034 (US$ Mn, AGR (%), CAGR (%))
Table 48 Germany Vehicle to Grid (V2G) Market by Value, 2024-2034 (US$ Mn, AGR (%), CAGR (%))
Table 49 UK Vehicle to Grid (V2G) Market by Value, 2024-2034 (US$ Mn, AGR (%), CAGR (%))
Table 50 France Vehicle to Grid (V2G) Market by Value, 2024-2034 (US$ Mn, AGR (%), CAGR (%))
Table 51 Italy Vehicle to Grid (V2G) Market by Value, 2024-2034 (US$ Mn, AGR (%), CAGR (%))
Table 52 Spain Vehicle to Grid (V2G) Market by Value, 2024-2034 (US$ Mn, AGR (%), CAGR (%))
Table 53 Rest of Europe Vehicle to Grid (V2G) Market by Value, 2024-2034 (US$ Mn, AGR (%), CAGR (%))
Table 54 Asia-Pacific Vehicle to Grid (V2G) Market by Value, 2024-2034 (US$ Mn, AGR (%), CAGR (%))
Table 55 Asia-Pacific Vehicle to Grid (V2G) Market by Country, 2024-2034 (US$ Mn, AGR (%), CAGR (%))
Table 56 Asia-Pacific Vehicle to Grid (V2G) Market by Charger Type, 2024-2034 (US$ Mn, AGR (%), CAGR (%))
Table 57 Asia-Pacific Vehicle to Grid (V2G) Market by Power Capacity, 2024-2034 (US$ Mn, AGR (%), CAGR (%))
Table 58 Asia-Pacific Vehicle to Grid (V2G) Market by Components, 2024-2034 (US$ Mn, AGR (%), CAGR (%))
Table 59 Asia-Pacific Vehicle to Grid (V2G) Market by Vehicle Type, 2024-2034 (US$ Mn, AGR (%), CAGR (%))
Table 60 Asia-Pacific Vehicle to Grid (V2G) Market by Technology, 2024-2034 (US$ Mn, AGR (%), CAGR (%))
Table 61 China Vehicle to Grid (V2G) Market by Value, 2024-2034 (US$ Mn, AGR (%), CAGR (%))
Table 62 India Vehicle to Grid (V2G) Market by Value, 2024-2034 (US$ Mn, AGR (%), CAGR (%))
Table 63 Japan Vehicle to Grid (V2G) Market by Value, 2024-2034 (US$ Mn, AGR (%), CAGR (%))
Table 64 South Korea Vehicle to Grid (V2G) Market by Value, 2024-2034 (US$ Mn, AGR (%), CAGR (%))
Table 65 Australia Vehicle to Grid (V2G) Market by Value, 2024-2034 (US$ Mn, AGR (%), CAGR (%))
Table 66 Rest of Asia-Pacific Vehicle to Grid (V2G) Market by Value, 2024-2034 (US$ Mn, AGR (%), CAGR (%))
Table 67 Middle East & Africa Vehicle to Grid (V2G) Market by Value, 2024-2034 (US$ Mn, AGR (%), CAGR (%))
Table 68 Middle East & Africa Vehicle to Grid (V2G) Market by Country, 2024-2034 (US$ Mn, AGR (%), CAGR (%))
Table 69 Middle East & Africa Vehicle to Grid (V2G) Market by Charger Type, 2024-2034 (US$ Mn, AGR (%), CAGR (%))
Table 70 Middle East & Africa Vehicle to Grid (V2G) Market by Power Capacity, 2024-2034 (US$ Mn, AGR (%), CAGR (%))
Table 71 Middle East & Africa Vehicle to Grid (V2G) Market by Components, 2024-2034 (US$ Mn, AGR (%), CAGR (%))
Table 72 Middle East & Africa Vehicle to Grid (V2G) Market by Vehicle Type, 2024-2034 (US$ Mn, AGR (%), CAGR (%))
Table 73 Middle East & Africa Vehicle to Grid (V2G) Market by Technology, 2024-2034 (US$ Mn, AGR (%), CAGR (%))
Table 74 GCC Vehicle to Grid (V2G) Market by Value, 2024-2034 (US$ Mn, AGR (%), CAGR (%))
Table 75 South Africa Vehicle to Grid (V2G) Market by Value, 2024-2034 (US$ Mn, AGR (%), CAGR (%))
Table 76 Rest of Middle East & Africa Vehicle to Grid (V2G) Market by Value, 2024-2034 (US$ Mn, AGR (%), CAGR (%))
Table 77 Latin America Vehicle to Grid (V2G) Market by Value, 2024-2034 (US$ Mn, AGR (%), CAGR (%))
Table 78 Latin America Vehicle to Grid (V2G) Market by Country, 2024-2034 (US$ Mn, AGR (%), CAGR (%))
Table 79 Latin America Vehicle to Grid (V2G) Market by Charger Type, 2024-2034 (US$ Mn, AGR (%), CAGR (%))
Table 80 Latin America Vehicle to Grid (V2G) Market by Power Capacity, 2024-2034 (US$ Mn, AGR (%), CAGR (%))
Table 81 Latin America Vehicle to Grid (V2G) Market by Components, 2024-2034 (US$ Mn, AGR (%), CAGR (%))
Table 82 Latin America Vehicle to Grid (V2G) Market by Vehicle Type, 2024-2034 (US$ Mn, AGR (%), CAGR (%))
Table 83 Latin America Vehicle to Grid (V2G) Market by Technology, 2024-2034 (US$ Mn, AGR (%), CAGR (%))
Table 84 Brazil Vehicle to Grid (V2G) Market by Value, 2024-2034 (US$ Mn, AGR (%), CAGR (%))
Table 85 Mexico Vehicle to Grid (V2G) Market by Value, 2024-2034 (US$ Mn, AGR (%), CAGR (%))
Table 86 Rest of Latin America Vehicle to Grid (V2G) Market by Value, 2024-2034 (US$ Mn, AGR (%), CAGR (%))
Table 87 Strategic Outlook - Contract
Table 88 Denso Corporation: Key Details, (CEO, HQ, Revenue, Founded, No. of Employees, Company Type, Website, Business Segment)
Table 89 Denso Corporation: Product Benchmarking
Table 90 Denso Corporation: Strategic Outlook
Table 91 AC Propulsion: Key Details, (CEO, HQ, Revenue, Founded, No. of Employees, Company Type, Website, Business Segment)
Table 92 AC Propulsion: Product Benchmarking
Table 93 Vehicle to Grid (V2G).: Key Details, (CEO, HQ, Revenue, Founded, No. of Employees, Company Type, Website, Business Segment)
Table 94 NRG Energy, Inc.: Product Benchmarking
Table 95 Honda Motor Co., Ltd: Key Details, (CEO, HQ, Revenue, Founded, No. of Employees, Company Type, Website, Business Segment)
Table 96 Honda Motor Co., Ltd: Product Benchmarking
Table 97 Honda Motor Co., Ltd: Strategic Outlook
Table 98 OVO Energy: Key Details, (CEO, HQ, Revenue, Founded, No. of Employees, Company Type, Website, Business Segment)
Table 99 OVO Energy: Product Benchmarking
Table 100 OVO Energy: Strategic Outlook
Table 101 Fermata Energy: Key Details, (CEO, HQ, Revenue, Founded, No. of Employees, Company Type, Website, Business Segment)
Table 102 Fermata Energy: Product Benchmarking
Table 103 Fermata Energy: Strategic Outlook
Table 104 Toyota Industries Corporation: Key Details, (CEO, HQ, Revenue, Founded, No. of Employees, Company Type, Website, Business Segment)
Table 105 Toyota Industries Corporation: Product Benchmarking
Table 106 Toyota Industries Corporation: Strategic Outlook
Table 107 Hitachi, Ltd: Key Details, (CEO, HQ, Revenue, Founded, No. of Employees, Company Type, Website, Business Segment)
Table 108 Hitachi, Ltd: Product Benchmarking
Table 109 Hitachi, Ltd: Strategic Outlook
Table 110 ABB Limited: Key Details, (CEO, HQ, Revenue, Founded, No. of Employees, Company Type, Website, Business Segment)
Table 111 ABB Limited: Product Benchmarking
Table 112 ABB Limited: Strategic Outlook
Table 113 Edison International: Key Details, (CEO, HQ, Revenue, Founded, No. of Employees, Company Type, Website, Business Segment)
Table 114 Edison International: Product Benchmarking
Table 115 EV Grid, Inc: Key Details, (CEO, HQ, Revenue, Founded, No. of Employees, Company Type, Website, Business Segment)
Table 116 EV Grid, Inc: Product Benchmarking
Table 117 Nissan Motor Co., Ltd.: Key Details, (CEO, HQ, Revenue, Founded, No. of Employees, Company Type, Website, Business Segment)
Table 118 Nissan Motor Co., Ltd.: Product Benchmarking
Table 119 Indra Sistemas, S.A: Key Details, (CEO, HQ, Revenue, Founded, No. of Employees, Company Type, Website, Business Segment)
Table 120 Indra Sistemas, S.A: Product Benchmarking
Table 121 Indra Sistemas, S.A: Strategic Outlook
Table 122 NUVVE Holding Corp: Key Details, (CEO, HQ, Revenue, Founded, No. of Employees, Company Type, Website, Business Segment)
Table 123 NUVVE Holding Corp: Product Benchmarking
Table 124 NUVVE Holding Corp: Strategic Outlook
Table 125 Wallbox: Key Details, (CEO, HQ, Revenue, Founded, No. of Employees, Company Type, Website, Business Segment)
Table 126 Wallbox: Product Benchmarking
Table 127 Wallbox: Strategic Outlook
List of Figures
Figure 1 Vehicle to Grid (V2G) Market Segmentation
Figure 2 Vehicle to Grid (V2G) Market by Charger Type: Market Attractiveness Index
Figure 3 Vehicle to Grid (V2G) Market by Power Capacity: Market Attractiveness Index
Figure 4 Vehicle to Grid (V2G) Market by Components: Market Attractiveness Index
Figure 5 Vehicle to Grid (V2G) Market by Vehicle Type: Market Attractiveness Index
Figure 6 Vehicle to Grid (V2G) Market by Technology: Market Attractiveness Index
Figure 7 Vehicle to Grid (V2G) Market Attractiveness Index by Region
Figure 8 Vehicle to Grid (V2G) Market: Market Dynamics
Figure 9 Electric Car Sales, 2019-2023
Figure 10 Vehicle to Grid (V2G) Market: Porter’s Five Forces Analysis
Figure 11 Global Vehicle to Grid (V2G) Market Share Forecast by COVID, 2024-2034 (%)
Figure 12 Global Vehicle to Grid (V2G) Market by Region, 2024-2034 (US$ Mn, AGR (%)) (V-Shaped Recovery Scenario)
Figure 13 Global Vehicle to Grid (V2G) Market by Region, 2024-2034 (US$ Mn, AGR (%)) (U-Shaped Recovery Scenario)
Figure 14 Global Vehicle to Grid (V2G) Market by Region, 2024-2034 (US$ Mn, AGR (%)) (W-Shaped Recovery Scenario)
Figure 15 Global Vehicle to Grid (V2G) Market by Region, 2024-2034 (US$ Mn, AGR (%)) (L-Shaped Recovery Scenario)
Figure 16 Vehicle to Grid (V2G) Market: PEST Analysis
Figure 17 Vehicle to Grid (V2G) Market by Charger Type: Market Attractiveness Index
Figure 18 Global Vehicle to Grid (V2G) Market by Charger Type, 2024-2034 (US$ Mn, AGR (%))
Figure 19 Vehicle to Grid (V2G) Market Share Forecast by Charger Type, 2024, 2029, 2034 (%)
Figure 20 Bi-Directional Chargers Market by Region, 2024-2034 (US$ Mn, AGR (%))
Figure 21 Bi-Directional Chargers Market Share Forecast by Region, 2024 & 2034 (%)
Figure 22 Uni-Directional Chargers Market by Region, 2024-2034 (US$ Mn, AGR (%))
Figure 23 Uni-Directional Chargers Market Share Forecast by Region, 2024 & 2034 (%)
Figure 24 Vehicle to Grid (V2G) Market by Power Capacity: Market Attractiveness Index
Figure 25 Global Vehicle to Grid (V2G) Market by Power Capacity, 2024-2034 (US$ Mn, AGR (%))
Figure 26 Vehicle to Grid (V2G) Market Share Forecast by Power Capacity, 2024, 2029, 2034 (%)
Figure 27 Low Power (<10 kW) Market by Region, 2024-2034 (US$ Mn, AGR (%))
Figure 28 Low Power (50 kW) Market by Region, 2024-2034 (US$ Mn, AGR (%))
Figure 32 High Power (>50 kW) Market Share Forecast by Region, 2024 & 2034 (%)
Figure 33 Vehicle to Grid (V2G) Market by Components: Market Attractiveness Index
Figure 34 Global Vehicle to Grid (V2G) Market by Components, 2024-2034 (US$ Mn, AGR (%))
Figure 35 Vehicle to Grid (V2G) Market Share Forecast by Components, 2024, 2029, 2034 (%)
Figure 36 Electric Vehicle Supply Equipment (EVSE) Market by Region, 2024-2034 (US$ Mn, AGR (%))
Figure 37 Electric Vehicle Supply Equipment (EVSE) Market Share Forecast by Region, 2024 & 2034 (%)
Figure 38 Smart Meters Market by Region, 2024-2034 (US$ Mn, AGR (%))
Figure 39 Smart Meters Market Share Forecast by Region, 2024 & 2034 (%)
Figure 40 Home Energy Management (HEM) Market by Region, 2024-2034 (US$ Mn, AGR (%))
Figure 41 Home Energy Management (HEM) Market Share Forecast by Region, 2024 & 2034 (%)
Figure 42 Other Components Market by Region, 2024-2034 (US$ Mn, AGR (%))
Figure 43 Other Components Market Share Forecast by Region, 2024 & 2034 (%)
Figure 44 Vehicle to Grid (V2G) Market by Vehicle Type: Market Attractiveness Index
Figure 45 Global Vehicle to Grid (V2G) Market by Vehicle Type, 2024-2034 (US$ Mn, AGR (%))
Figure 46 Vehicle to Grid (V2G) Market Share Forecast by Vehicle Type, 2024, 2029, 2034 (%)
Figure 47 Electric Cars Market by Region, 2024-2034 (US$ Mn, AGR (%))
Figure 48 Electric Cars Market Share Forecast by Region, 2024 & 2034 (%)
Figure 49 Plug-in Hybrid Electric Vehicles (PHEVs) Market by Region, 2024-2034 (US$ Mn, AGR (%))
Figure 50 Plug-in Hybrid Electric Vehicles (PHEVs) Market Share Forecast by Region, 2024 & 2034 (%)
Figure 51 Electric Buses Market by Region, 2024-2034 (US$ Mn, AGR (%))
Figure 52 Electric Buses Market Share Forecast by Region, 2024 & 2034 (%)
Figure 53 Electric Trucks Market by Region, 2024-2034 (US$ Mn, AGR (%))
Figure 54 Electric Trucks Market Share Forecast by Region, 2024 & 2034 (%)
Figure 55 Other Vehicle Types Market by Region, 2024-2034 (US$ Mn, AGR (%))
Figure 56 Other Vehicle Types Market Share Forecast by Region, 2024 & 2034 (%)
Figure 57 Vehicle to Grid (V2G) Market by Technology: Market Attractiveness Index
Figure 58 Global Vehicle to Grid (V2G) Market by Technology, 2024-2034 (US$ Mn, AGR (%))
Figure 59 Vehicle to Grid (V2G) Market Share Forecast by Technology, 2024, 2029, 2034 (%)
Figure 60 Charging Infrastructure Market by Region, 2024-2034 (US$ Mn, AGR (%))
Figure 61 Charging Infrastructure Market Share Forecast by Region, 2024 & 2034 (%)
Figure 62 Communication Equipment Market by Region, 2024-2034 (US$ Mn, AGR (%))
Figure 63 Communication Equipment Market Share Forecast by Region, 2024 & 2034 (%)
Figure 64 Grid Management Software Market by Region, 2024-2034 (US$ Mn, AGR (%))
Figure 65 Grid Management Software Market Share Forecast by Region, 2024 & 2034 (%)
Figure 66 Energy Management Software Market by Region, 2024-2034 (US$ Mn, AGR (%))
Figure 67 Energy Management Software Market Share Forecast by Region, 2024 & 2034 (%)
Figure 68 Smart Grid Integration Solutions Market by Region, 2024-2034 (US$ Mn, AGR (%))
Figure 69 Smart Grid Integration Solutions Market Share Forecast by Region, 2024 & 2034 (%)
Figure 70 Other Technology Market by Region, 2024-2034 (US$ Mn, AGR (%))
Figure 71 Other Technology Market Share Forecast by Region, 2024 & 2034 (%)
Figure 72 Vehicle to Grid (V2G) Market Forecast by Region 2024 and 2034 (Revenue, CAGR%)
Figure 73 Vehicle to Grid (V2G) Market Share Forecast by Region 2024, 2029, 2034 (%)
Figure 74 Global Vehicle to Grid (V2G) Market by Region, 2024-2034 (US$ Mn, AGR (%))
Figure 75 North America Vehicle to Grid (V2G) Market Attractiveness Index
Figure 76 North America Vehicle to Grid (V2G) Market by Region, 2024, 2029 & 2034 (US$ Million)
Figure 77 North America Vehicle to Grid (V2G) Market by Value, 2024-2034 (US$ Mn, AGR (%))
Figure 78 North America Vehicle to Grid (V2G) Market by Country, 2024-2034 (US$ Mn, AGR (%))
Figure 79 North America Vehicle to Grid (V2G) Market Share Forecast by Country, 2024 & 2034 (%)
Figure 80 North America Vehicle to Grid (V2G) Market by Charger Type, 2024-2034 (US$ Mn, AGR (%))
Figure 81 North America Vehicle to Grid (V2G) Market Share Forecast Charger Type, 2024 & 2034 (%)
Figure 82 North America Vehicle to Grid (V2G) Market by Power Capacity, 2024-2034 (US$ Mn, AGR (%))
Figure 83 North America Vehicle to Grid (V2G) Market Share Forecast by Power Capacity, 2024 & 2034 (%)
Figure 84 North America Vehicle to Grid (V2G) Market by Components, 2024-2034 (US$ Mn, AGR (%))
Figure 85 North America Vehicle to Grid (V2G) Market Share Forecast by Components, 2024 & 2034 (%)
Figure 86 North America Vehicle to Grid (V2G) Market by Vehicle Type, 2024-2034 (US$ Mn, AGR (%))
Figure 87 North America Vehicle to Grid (V2G) Market Share Forecast by Vehicle Type, 2024 & 2034 (%)
Figure 88 North America Vehicle to Grid (V2G) Market by Technology, 2024-2034 (US$ Mn, AGR (%))
Figure 89 North America Vehicle to Grid (V2G) Market Share Forecast by Technology, 2024 & 2034 (%)
Figure 90 US Vehicle to Grid (V2G) Market by Value, 2024-2034 (US$ Mn, AGR (%))
Figure 91 Canada Vehicle to Grid (V2G) Market by Value, 2024-2034 (US$ Mn, AGR (%))
Figure 92 Europe Vehicle to Grid (V2G) Market Attractiveness Index
Figure 93 Europe Vehicle to Grid (V2G) Market by Region, 2024, 2029 & 2034 (US$ Million)
Figure 94 Europe Vehicle to Grid (V2G) Market by Value, 2024-2034 (US$ Mn, AGR (%))
Figure 95 Europe Vehicle to Grid (V2G) Market by Country, 2024-2034 (US$ Mn, AGR (%))
Figure 96 Europe Vehicle to Grid (V2G) Market Share Forecast by Country, 2024 & 2034 (%)
Figure 97 Europe Vehicle to Grid (V2G) Market by Charger Type, 2024-2034 (US$ Mn, AGR (%))
Figure 98 Europe Vehicle to Grid (V2G) Market Share Forecast Charger Type, 2024 & 2034 (%)
Figure 99 Europe Vehicle to Grid (V2G) Market by Power Capacity, 2024-2034 (US$ Mn, AGR (%))
Figure 100 Europe Vehicle to Grid (V2G) Market Share Forecast by Power Capacity, 2024 & 2034 (%)
Figure 101 Europe Vehicle to Grid (V2G) Market by Components, 2024-2034 (US$ Mn, AGR (%))
Figure 102 Europe Vehicle to Grid (V2G) Market Share Forecast by Components, 2024 & 2034 (%)
Figure 103 Europe Vehicle to Grid (V2G) Market by Vehicle Type, 2024-2034 (US$ Mn, AGR (%))
Figure 104 Europe Vehicle to Grid (V2G) Market Share Forecast by Vehicle Type, 2024 & 2034 (%)
Figure 105 Europe Vehicle to Grid (V2G) Market by Technology, 2024-2034 (US$ Mn, AGR (%))
Figure 106 Europe Vehicle to Grid (V2G) Market Share Forecast by Technology, 2024 & 2034 (%)
Figure 107 Germany Vehicle to Grid (V2G) Market by Value, 2024-2034 (US$ Mn, AGR (%))
Figure 108 UK Vehicle to Grid (V2G) Market by Value, 2024-2034 (US$ Mn, AGR (%))
Figure 109 France Vehicle to Grid (V2G) Market by Value, 2024-2034 (US$ Mn, AGR (%))
Figure 110 Italy Vehicle to Grid (V2G) Market by Value, 2024-2034 (US$ Mn, AGR (%))
Figure 111 Spain Vehicle to Grid (V2G) Market by Value, 2024-2034 (US$ Mn, AGR (%))
Figure 112 Rest of Europe Vehicle to Grid (V2G) Market by Value, 2024-2034 (US$ Mn, AGR (%))
Figure 113 Asia-Pacific Vehicle to Grid (V2G) Market Attractiveness Index
Figure 114 Asia-Pacific Vehicle to Grid (V2G) Market by Region, 2024, 2029 & 2034 (US$ Million)
Figure 115 Asia-Pacific Vehicle to Grid (V2G) Market by Value, 2024-2034 (US$ Mn, AGR (%))
Figure 116 Asia-Pacific Vehicle to Grid (V2G) Market by Country, 2024-2034 (US$ Mn, AGR (%))
Figure 117 Asia-Pacific Vehicle to Grid (V2G) Market Share Forecast by Country, 2024 & 2034 (%)
Figure 118 Asia-Pacific Vehicle to Grid (V2G) Market by Charger Type, 2024-2034 (US$ Mn, AGR (%))
Figure 119 Asia-Pacific Vehicle to Grid (V2G) Market Share Forecast Charger Type, 2024 & 2034 (%)
Figure 120 Asia-Pacific Vehicle to Grid (V2G) Market by Power Capacity, 2024-2034 (US$ Mn, AGR (%))
Figure 121 Asia-Pacific Vehicle to Grid (V2G) Market Share Forecast by Power Capacity, 2024 & 2034 (%)
Figure 122 Asia-Pacific Vehicle to Grid (V2G) Market by Components, 2024-2034 (US$ Mn, AGR (%))
Figure 123 Asia-Pacific Vehicle to Grid (V2G) Market Share Forecast by Components, 2024 & 2034 (%)
Figure 124 Asia-Pacific Vehicle to Grid (V2G) Market by Vehicle Type, 2024-2034 (US$ Mn, AGR (%))
Figure 125 Asia-Pacific Vehicle to Grid (V2G) Market Share Forecast by Vehicle Type, 2024 & 2034 (%)
Figure 126 Asia-Pacific Vehicle to Grid (V2G) Market by Technology, 2024-2034 (US$ Mn, AGR (%))
Figure 127 Asia-Pacific Vehicle to Grid (V2G) Market Share Forecast by Technology, 2024 & 2034 (%)
Figure 128 China Vehicle to Grid (V2G) Market by Value, 2024-2034 (US$ Mn, AGR (%))
Figure 129 India Vehicle to Grid (V2G) Market by Value, 2024-2034 (US$ Mn, AGR (%))
Figure 130 Japan Vehicle to Grid (V2G) Market by Value, 2024-2034 (US$ Mn, AGR (%))
Figure 131 South Korea Vehicle to Grid (V2G) Market by Value, 2024-2034 (US$ Mn, AGR (%))
Figure 132 Australia Vehicle to Grid (V2G) Market by Value, 2024-2034 (US$ Mn, AGR (%))
Figure 133 Rest of Asia-Pacific Vehicle to Grid (V2G) Market by Value, 2024-2034 (US$ Mn, AGR (%))
Figure 134 Middle East and Africa Vehicle to Grid (V2G) Market Attractiveness Index
Figure 135 Middle East and Africa Vehicle to Grid (V2G) Market by Region, 2024, 2029 & 2034 (US$ Million)
Figure 136 Middle East & Africa Vehicle to Grid (V2G) Market by Value, 2024-2034 (US$ Mn, AGR (%))
Figure 137 Middle East & Africa Vehicle to Grid (V2G) Market by Country, 2024-2034 (US$ Mn, AGR (%))
Figure 138 Middle East and Africa Vehicle to Grid (V2G) Market Share Forecast by Country, 2024 & 2034 (%)
Figure 139 Middle East & Africa Vehicle to Grid (V2G) Market by Charger Type, 2024-2034 (US$ Mn, AGR (%))
Figure 140 Middle East and Africa Vehicle to Grid (V2G) Market Share Forecast Charger Type, 2024 & 2034 (%)
Figure 141 Middle East & Africa Vehicle to Grid (V2G) Market by Power Capacity, 2024-2034 (US$ Mn, AGR (%))
Figure 142 Middle East and Africa Vehicle to Grid (V2G) Market Share Forecast by Power Capacity, 2024 & 2034 (%)
Figure 143 Middle East & Africa Vehicle to Grid (V2G) Market by Components, 2024-2034 (US$ Mn, AGR (%))
Figure 144 Middle East and Africa Vehicle to Grid (V2G) Market Share Forecast by Components, 2024 & 2034 (%)
Figure 145 Middle East & Africa Vehicle to Grid (V2G) Market by Vehicle Type, 2024-2034 (US$ Mn, AGR (%))
Figure 146 Middle East and Africa Vehicle to Grid (V2G) Market Share Forecast by Vehicle Type, 2024 & 2034 (%)
Figure 147 Middle East & Africa Vehicle to Grid (V2G) Market by Technology, 2024-2034 (US$ Mn, AGR (%))
Figure 148 Middle East and Africa Vehicle to Grid (V2G) Market Share Forecast by Technology, 2024 & 2034 (%)
Figure 149 GCC Vehicle to Grid (V2G) Market by Value, 2024-2034 (US$ Mn, AGR (%))
Figure 150 South Africa Vehicle to Grid (V2G) Market by Value, 2024-2034 (US$ Mn, AGR (%))
Figure 151 Rest of Middle East & Africa Vehicle to Grid (V2G) Market by Value, 2024-2034 (US$ Mn, AGR (%))
Figure 152 Latin America Vehicle to Grid (V2G) Market Attractiveness Index
Figure 153 Latin America Vehicle to Grid (V2G) Market by Region, 2024, 2029 & 2034 (US$ Million)
Figure 154 Latin America Vehicle to Grid (V2G) Market by Value, 2024-2034 (US$ Mn, AGR (%))
Figure 155 Latin America Vehicle to Grid (V2G) Market by Country, 2024-2034 (US$ Mn, AGR (%))
Figure 156 Latin America Vehicle to Grid (V2G) Market Share Forecast by Country, 2024 & 2034 (%)
Figure 157 Latin America Vehicle to Grid (V2G) Market by Charger Type, 2024-2034 (US$ Mn, AGR (%))
Figure 158 Latin America Vehicle to Grid (V2G) Market Share Forecast Charger Type, 2024 & 2034 (%)
Figure 159 Latin America Vehicle to Grid (V2G) Market by Power Capacity, 2024-2034 (US$ Mn, AGR (%))
Figure 160 Latin America Vehicle to Grid (V2G) Market Share Forecast by Power Capacity, 2024 & 2034 (%)
Figure 161 Latin America Vehicle to Grid (V2G) Market by Components, 2024-2034 (US$ Mn, AGR (%))
Figure 162 Latin America Vehicle to Grid (V2G) Market Share Forecast by Components, 2024 & 2034 (%)
Figure 163 Latin America Vehicle to Grid (V2G) Market by Vehicle Type, 2024-2034 (US$ Mn, AGR (%))
Figure 164 Latin America Vehicle to Grid (V2G) Market Share Forecast by Vehicle Type, 2024 & 2034 (%)
Figure 165 Latin America Vehicle to Grid (V2G) Market by Technology, 2024-2034 (US$ Mn, AGR (%))
Figure 166 Latin America Vehicle to Grid (V2G) Market Share Forecast by Technology, 2024 & 2034 (%)
Figure 167 Brazil Vehicle to Grid (V2G) Market by Value, 2024-2034 (US$ Mn, AGR (%))
Figure 168 Mexico Vehicle to Grid (V2G) Market by Value, 2024-2034 (US$ Mn, AGR (%))
Figure 169 Rest of Latin America Vehicle to Grid (V2G) Market by Value, 2024-2034 (US$ Mn, AGR (%))
Figure 170 Vehicle to Grid (V2G) Market: Company Share, 2022
Figure 171 Denso Corporation.: Net Revenue, 2019-2023 (US$ Million, AGR%)
Figure 172 NRG Energy, Inc..: Net Revenue, 2018-2022 (US$ Million, AGR%)
Figure 173 NRG Energy, Inc..: Business Segment Revenue Share, 2022 (%)
Figure 174 Honda Motor Co., Ltd.: Net Revenue, 2019-2023 (US$ Million, AGR%)
Figure 175 Honda Motor Co., Ltd.: R&D, 2019-2023 (US$ Million, AGR%)
Figure 176 Honda Motor Co., Ltd.: Regional Revenue Share, 2023 (%)
Figure 177 Toyota Industries Corporation.: Net Revenue, 2019-2023 (US$ Million, AGR%)
Figure 178 Toyota Industries Corporation.: R&D, 2019-2023 (US$ Million, AGR%)
Figure 179 Toyota Industries Corporation.: Regional Revenue Share, 2023 (%)
Figure 180 Toyota Industries Corporation.: Business Segment Revenue Share, 2023 (%)
Figure 181 Hitachi, Ltd.: Net Revenue, 2019-2023 (US$ Million, AGR%)
Figure 182 Hitachi, Ltd.: Regional Revenue Share, 2023 (%)
Figure 183 Hitachi, Ltd.: Business Segment Revenue Share, 2023 (%)
Figure 184 ABB Limited.: Net Revenue, 2018-2022 (US$ Million, AGR%)
Figure 185 ABB Limited.: R&D, 2018-2022 (US$ Million, AGR%)
Figure 186 ABB Limited.: Business Segment Revenue Share, 2022 (%)
Figure 187 Edison International.: Net Revenue, 2018-2022 (US$ Million, AGR%)
Figure 188 Nissan Motor Co., Ltd..: Net Revenue, 2018-2022 (US$ Million, AGR%)
Figure 189 Nissan Motor Co., Ltd..: Regional Revenue Share, 2022 (%)
Figure 190 Nissan Motor Co., Ltd..: Business Segment Revenue Share, 2022 (%)
Figure 191 Indra Sistemas, S.A.: Net Revenue, 2018-2022 (US$ Million, AGR%)
Figure 192 NUVVE Holding Corp.: Net Revenue, 2020-2022 (US$ Million, AGR%)
Figure 193 NUVVE Holding Corp.: R&D, 2020-2022 (US$ Million, AGR%)
Figure 194 NUVVE Holding Corp.: Regional Revenue Share, 2022 (%)
Figure 195 Wallbox.: Net Revenue, 2019-2022 (US$ Million, AGR%)
ページTOPに戻る
Visiongain社の自動車・輸送分野での最新刊レポート
本レポートと同じKEY WORD(v2g)の最新刊レポート
- 本レポートと同じKEY WORDの最新刊レポートはありません。
よくあるご質問
Visiongain社はどのような調査会社ですか?
英国の調査会社ヴィジョンゲイン社(Visiongain)は、通信とエネルギーのほか、自動車や化学・医薬品、金属など、広範な市場を対象に調査を行っています。自動車市場については、市場全般に関する調査のほ... もっと見る
調査レポートの納品までの日数はどの程度ですか?
在庫のあるものは速納となりますが、平均的には 3-4日と見て下さい。
但し、一部の調査レポートでは、発注を受けた段階で内容更新をして納品をする場合もあります。
発注をする前のお問合せをお願いします。
注文の手続きはどのようになっていますか?
1)お客様からの御問い合わせをいただきます。
2)見積書やサンプルの提示をいたします。
3)お客様指定、もしくは弊社の発注書をメール添付にて発送してください。
4)データリソース社からレポート発行元の調査会社へ納品手配します。
5) 調査会社からお客様へ納品されます。最近は、pdfにてのメール納品が大半です。
お支払方法の方法はどのようになっていますか?
納品と同時にデータリソース社よりお客様へ請求書(必要に応じて納品書も)を発送いたします。
お客様よりデータリソース社へ(通常は円払い)の御振り込みをお願いします。
請求書は、納品日の日付で発行しますので、翌月最終営業日までの当社指定口座への振込みをお願いします。振込み手数料は御社負担にてお願いします。
お客様の御支払い条件が60日以上の場合は御相談ください。
尚、初めてのお取引先や個人の場合、前払いをお願いすることもあります。ご了承のほど、お願いします。
データリソース社はどのような会社ですか?
当社は、世界各国の主要調査会社・レポート出版社と提携し、世界各国の市場調査レポートや技術動向レポートなどを日本国内の企業・公官庁及び教育研究機関に提供しております。
世界各国の「市場・技術・法規制などの」実情を調査・収集される時には、データリソース社にご相談ください。
お客様の御要望にあったデータや情報を抽出する為のレポート紹介や調査のアドバイスも致します。
|
|

