水素自動車市場レポート:2024-2034
Hydrogen Vehicle Market Report 2024-2034
レポート詳細
水素自動車市場レポート 2024-2034年 :本レポートは、業界とその基礎となるダイナミクスをより良く理解することを望むなら、新たな収益ポケットを目指す大手企業にとって貴重なものと... もっと見る
※上記価格は部署ライセンス(Departmental licence)価格です。
その他の価格についてはデータリソースまでお問合せください。
日本語のページは自動翻訳を利用し作成しています。
実際のレポートは英文のみでご納品いたします。

|

|
サマリー
レポート詳細
水素自動車市場レポート 2024-2034年:本レポートは、業界とその基礎となるダイナミクスをより良く理解することを望むなら、新たな収益ポケットを目指す大手企業にとって貴重なものとなるでしょう。異業種への進出や新規地域での既存事業の拡大を目指す企業にも有用です。
環境規制と排出削減目標
世界各国政府が課す厳しい環境規制と排出削減目標により、自動車メーカーは規制要件を満たし、輸送が環境に与える影響を軽減するため、水素燃料電池技術を含む代替燃料の選択肢を模索する必要に迫られている。水素自動車はゼロエミッションの輸送ソリューションを提供し、運転中に排出されるのは水蒸気と熱だけであるため、カーボンニュートラルの達成と大気環境の改善にとって魅力的な選択肢となっている。
自動車排出ガス規制、カーボンプライシングメカニズム、ゼロエミッション車義務化などの規制的イニシアチブは、自動車メーカーが長期的な持続可能性戦略の一環として水素燃料電池技術に投資する動機付けとなっている。例えば、欧州連合(EU)は自動車セクターに対して野心的な排出削減目標を設定しており、自動車メーカーは規制要件に対応するため、水素自動車の開発・展開を加速させている。
BEVとHEVの需要増加が水素自動車機会を抑制
水素自動車市場は、バッテリー電気自動車(BEV)とハイブリッド電気自動車(HEV)の需要増加により、大きな抑制要因に直面している。消費者の嗜好が電気自動車、特にBEVにシフトするにつれ、水素自動車の需要は厳しい競争に直面している。BEVとHEVは、水素自動車に比べ、運転コストが低い、化石燃料への依存度が低い、充電インフラが確立されているなどの魅力的な利点がある。
さらに、バッテリー技術の進歩により、BEV の走行距離が伸び、充電時間も短縮され、消費者へのアピールがさらに高まっている。このような BEV と HEV の需要の高まりは、自動車メーカーも消費者も電気自動車を優先するため、水素自動車の市場機会を制限している。水素自動車の潜在的な環境メリットにもかかわらず、現在の市場力学はBEVとHEVの普及を支持しており、水素自動車技術の成長にとって大きな課題となっている。
市場調査レポートを購入する前にすべき質問とは?
-
水素自動車市場はどのように進化しているのか?
-
何が水素自動車市場を牽引し、何が抑制しているのか?
-
水素自動車の各サブマーケットは予測期間中にどのように成長し、2034年にはどれくらいの売上を占めるようになるのか?
-
2024年から2034年にかけて、水素自動車の各サブマーケットの市場シェアはどのように推移するのか?
-
2024年から2034年にかけて、市場全体を牽引する主な要因は何か?
-
主導的な水素自動車市場はマクロ経済の動きに幅広く追随するのか、それとも個々の国市場が他を凌駕するのか。
-
2034年までに各国市場のシェアはどのように変化し、どの地域が2034年の市場をリードするのか。
-
主要プレーヤーと予測期間中の見通しは?
-
これらの大手企業の水素自動車プロジェクトとは?
-
2024年から2034年の間に、業界はどのように進化するのか?現在、そして今後10年間に行われる水素自動車プロジェクトはどのような意味を持つのか?
-
水素自動車市場をさらに拡大するためには、製品の商業化がより必要なのでしょうか?
-
水素自動車市場はどこに向かっているのか、また、どのようにして市場の最前線に立つことができるのか。
-
新商品や新サービスに最適な投資方法とは?
-
企業を新たな成長軌道に乗せ、C-suiteに移行させるための重要な展望とは?
このことが、現在、そして今後10年間の水素自動車市場にどのような影響を与えるかを見極める必要がある:
-
119の表と186の図表を掲載した384ページの報告書を独占的に提供する。
-
本レポートでは、業界の主要な有利分野を取り上げている。
-
世界、地域、国の売上高と成長に関する詳細な分析が含まれている。
-
競合他社が成功した主なトレンド、変化、収益予測をハイライトします。
本レポートは、COVID-19の景気後退と好転の変動に合わせて、今後10年間に水素自動車市場がどのように発展するかをTODAYでお伝えする。この市場は、過去10年間のどの時点よりも今が重要である。
2034年までの予測やその他の分析から、商業的な展望が明らかになる
-
2034年までの収益予測に加え、最近の実績、成長率、市場シェアも提供している。
-
ビジネスの展望や展開など、独自の分析が掲載されている。
-
定性的分析(市場ダイナミクス、促進要因、機会、阻害要因、課題を含む)、コスト構造、水素自動車価格上昇の影響、最近の動向をご覧いただけます。
本レポートには、COVID-19が業界と貴社にどのような影響を与えるかについてのデータ分析と貴重な洞察が含まれている。本レポートでは、COVID-19の4つの回収パターンとその影響、すなわち「V」、「L」、「W」、「U」について論じている。
レポート対象セグメント
技術タイプ別市場セグメント
-
燃料電池電気自動車(FCEV)
-
水素内燃機関自動車(HICEVs)
レンジ別市場セグメント
タイプ別市場セグメント
流通チャネル別市場セグメント
-
直販(OEM)
-
ディーラー
-
フリートリース会社
-
オンライン・プラットフォーム
-
その他の流通チャネル
世界市場全体とセグメント別の収益予測に加え、4つの地域と20の主要国市場の収益予測も掲載しています:
北米
欧州
-
ドイツ
-
スペイン
-
イギリス
-
フランス
-
イタリア
-
その他の欧州地域
アジア太平洋
-
中国
-
日本
-
インド
-
オーストラリア
-
韓国
-
その他のアジア太平洋地域
ラテンアメリカ
中東・アフリカ
このレポートには、2024 年から 2034 年までの水素自動車市場のいくつかの主要企業のプロフィールも含まれており、これらの企業の事業分野に焦点を当てています。
報告書に掲載されている主要企業
-
Alstom SA
-
Audi AG
-
Ballard Power Systems Inc
-
Bayerische Motoren Werke AG
-
Cummins Inc.
-
General Motors Company
-
Hino Motors, Ltd.
-
Hyundai Mobis
-
Hyundai Motor Company
-
MAN Truck & Bus SE
-
Mercedes-Benz Group AG
-
Nikola Corporation
-
Riversimple
-
Symbio
-
Toyota Motor Corporation
2024年から2034年までの水素自動車市場全体の世界売上高(金額ベース)は、2024年に285億3,000万米ドルを突破する。2034年まで大幅な売上増を予測している。当調査では、最も大きな可能性を秘めた企業を特定しています。彼らの能力、進歩、商業的展望を発見し、一歩先を行くお手伝いをします。
水素自動車市場、2024-2034年レポートはどのようにお役に立ちますか?
要約すると、380ページを超えるこのレポートは、以下の知識を提供する:
-
水素自動車市場、2024年から2034年までの収益予測 技術タイプ、レンジ、タイプ、流通チャネルの各予測を世界および地域レベルで掲載 - 業界の将来性を発見し、投資と収益に最も有利な場所を見つけます。
-
4つの地域と20の主要国市場の2034年までの収益予測 - 北米、欧州、アジア太平洋、中南米、中東・アフリカの水素自動車市場2024年から2034年までの市場予測をご覧ください。また、米国、カナダ、ブラジル、ドイツ、フランス、英国、イタリア、中国、インド、日本、オーストラリアなどの主要経済圏の市場も予測しています。
2024年から2034年までの水素自動車市場に関わる主要企業15社の企業プロファイルを含む。
独自の予測による定量的・定性的分析をご覧ください。私たちのレポートだけに含まれる情報を入手し、貴重なビジネスインテリジェンスで情報を得ることができます。
他にはない情報
私たちの新しいレポートがあれば、知識に遅れをとったり、チャンスを逃したりする可能性が低くなります。弊社のレポートが貴社の調査、分析、意思決定にどのように役立つかをご覧ください。Visiongainの調査は、水素自動車市場、2024年から2034年、市場をリードする企業の商業分析を必要とするすべての人のためのものです。データ、トレンド、予測をご覧いただけます。
ページTOPに戻る
目次
1 レポート概要
1.1 研究の目的
1.2 水素自動車市場の紹介
1.3 本レポートの特徴
1.4 本レポートを読むべき理由
1.5 本分析レポートが回答する主な質問
1.6 本レポートは誰のためのものか?
1.7 方法論
1.7.1 市場の定義
1.7.2 市場評価・予測手法
1.7.3 データの検証
1.7.3.1 一次調査
1.7.3.2 セカンダリーリサーチ
1.8 よくある質問(FAQ)
1.9 Visiongainの関連レポート
1.10 Visiongainについて
2 エグゼクティブ・サマリー
3 市場概要
3.1 主要な調査結果
3.2 市場ダイナミクス
3.2.1 市場牽引要因
3.2.1.1 石油依存度の低減が水素自動車市場成長を牽引
3.2.1.2 ガス排出量削減への世界的な取り組みが市場成長を牽引
3.2.1.3 水素インフラを促進する政府の取り組みが市場成長を牽引
3.2.2 市場抑制要因
3.2.2.1 BEVとHEVの需要増加が水素自動車機会を抑制
3.2.2.2 燃料電池用白金触媒の高コストが市場成長を妨げる
3.2.2.3 水素燃料供給インフラへの高額な初期投資が市場成長を妨げる
3.2.3 市場機会
3.2.3.1 市場プレイヤー間のコラボレーションとパートナーシップは市場成長のチャンス
3.2.3.2 新地域への拡大、市場にとっての機会
3.2.3.3 水素自動車とインフラへの投資
3.3 ポーターのファイブフォース分析
3.3.1 サプライヤーの交渉力(低~中)
3.3.2 買い手の交渉力(中)
3.3.3 競争力(高)
3.3.4 代替品による脅威(中~高)
3.3.5 新規参入の脅威(低)
3.4 COVID-19の影響分析
3.4.1 "V字型回復"
3.4.2 "U字型回復"
3.4.3 "W字型回復"
3.4.4 "L字型回復"
3.5 PEST分析
4 水素自動車市場分析:技術タイプ別
4.1 主な調査結果
4.2 技術タイプ別セグメント 市場魅力度指数
4.3 技術タイプ別水素自動車市場規模の推定と予測
4.4 燃料電池電気自動車(FCEVs)
4.4.1 2024年~2034年の地域別市場規模(US$ Billion)
4.4.2 地域別市場シェア、2024年・2034年(%)
4.5 水素内燃機関自動車(HICEVs)
4.5.1 2024年~2034年の地域別市場規模(US$ Billion)
4.5.2 地域別市場シェア、2024年・2034年(%)
5 水素自動車市場分析:レンジ別
5.1 主要調査結果
5.2 レンジセグメント 市場魅力度指数
5.3 水素自動車のレンジ別市場規模推定と予測
5.4 短距離
5.4.1 2024〜2034年の地域別市場規模(US$ Billion)
5.4.2 地域別市場シェア、2024年・2034年(%)
5.5 中距離
5.5.1 2024〜2034年の地域別市場規模(US$ Billion)
5.5.2 地域別市場シェア、2024年・2034年(%)
5.6 長距離
5.6.1 2024〜2034年の地域別市場規模(US$ Billion)
5.6.2 地域別市場シェア、2024年・2034年(%)
6 水素自動車市場分析:タイプ別
6.1 主要調査結果
6.2 タイプ別セグメント 市場魅力度指数
6.3 水素自動車のタイプ別市場規模推定と予測
6.4 乗用車
6.4.1 2024〜2034年の地域別市場規模(US$ Billion)
6.4.2 地域別市場シェア、2024年・2034年(%)
6.5 商用車
6.5.1 2024〜2034年の地域別市場規模(US$ Billion)
6.5.2 地域別市場シェア、2024年・2034年(%)
6.6 公共交通車両
6.6.1 2024〜2034年の地域別市場規模(US$ Billion)
6.6.2 地域別市場シェア、2024年・2034年(%)
6.7 その他の車両タイプ
6.7.1 2024〜2034年の地域別市場規模(US$ Billion)
6.7.2 地域別市場シェア、2024年・2034年(%)
7 水素自動車市場分析:流通チャネル別
7.1 主要調査結果
7.2 流通チャネルセグメント 市場魅力度指数
7.3 流通チャネル別水素自動車市場規模推定と予測
7.4 直接販売(OEM)
7.4.1 2024〜2034年の地域別市場規模(US$ Billion)
7.4.2 地域別市場シェア、2024年・2034年(%)
7.5 ディーラー
7.5.1 2024〜2034年の地域別市場規模(US$ Billion)
7.5.2 地域別市場シェア、2024年・2034年(%)
7.6 フリートリース会社
7.6.1 2024〜2034年の地域別市場規模(US$ Billion)
7.6.2 地域別市場シェア、2024年・2034年(%)
7.7 オンラインプラットフォーム
7.7.1 2024〜2034年の地域別市場規模(US$ Billion)
7.7.2 地域別市場シェア、2024年・2034年(%)
7.8 その他の流通チャネル
7.8.1 2024〜2034年の地域別市場規模(US$ Billion)
7.8.2 地域別市場シェア、2024年・2034年(%)
8 水素自動車市場分析:地域別
8.1 主要な調査結果
8.2 地域別市場規模の推定と予測
9 北米の水素自動車市場分析
9.1 主要な調査結果
9.2 北米の水素自動車市場魅力度指数
9.3 北米の水素自動車国別市場、2024年、2029年、2034年(US$ Billion)
9.4 北米の水素自動車市場規模推定と予測
9.5 北米の水素自動車市場規模推定と予測:国別
9.6 北米の水素自動車市場規模推定と予測:技術タイプ別
9.7 北米の水素自動車市場規模推定と予測:レンジ別
9.8 北米の水素自動車市場規模推定と予測:タイプ別
9.9 北米水素自動車の市場規模推定と予測:流通チャネル別
9.10 アメリカの水素自動車市場分析
9.11 カナダの水素自動車市場分析
10 欧州の水素自動車市場分析
10.1 主要な調査結果
10.2 欧州水素自動車市場魅力度指数
10.3 欧州の水素自動車国別市場、2024年、2029年、2034年(US$ Billion)
10.4 欧州の水素自動車市場規模推定と予測
10.5 欧州の水素自動車市場規模推定と予測:国別
10.6 欧州の水素自動車市場規模推定と予測:技術タイプ別
10.7 欧州の水素自動車市場規模推定と予測:走行距離別
10.8 欧州の水素自動車市場規模推定と予測:タイプ別
10.9 欧州の水素自動車市場規模推定と予測:流通チャネル別
10.10 ドイツの水素自動車市場分析
10.11 イギリスの水素自動車市場分析
10.12 フランスの水素自動車市場分析
10.13 イタリアの水素自動車市場分析
10.14 スペインの水素自動車市場分析
10.15 その他の欧州の水素自動車市場分析
11 アジア太平洋地域の水素自動車市場分析
11.1 主要な調査結果
11.2 アジア太平洋地域の水素自動車市場魅力度指数
11.3 アジア太平洋地域の水素自動車国別市場、2024年、2029年、2034年(US$ Billion)
11.4 アジア太平洋地域の水素自動車市場規模推定と予測
11.5 アジア太平洋地域の水素自動車市場規模推定と予測:国別
11.6 アジア太平洋地域の水素自動車市場規模推定と予測:技術タイプ別
11.7 アジア太平洋地域の水素自動車市場規模推定と予測:走行距離別
11.8 アジア太平洋地域の水素自動車市場規模推定と予測:タイプ別
11.9 アジア太平洋地域の水素自動車市場規模推定と予測:流通チャネル別
11.10 中国の水素自動車市場分析
11.11 インドの水素自動車市場分析
11.12 日本の水素自動車市場分析
11.13 韓国の水素自動車市場分析
11.14 オーストラリアの水素自動車市場分析
11.15 その他のアジア太平洋地域の水素自動車市場分析
12 中東・アフリカの水素自動車市場分析
12.1 主要な調査結果
12.2 中東・アフリカの水素自動車市場魅力度指数
12.3 中東・アフリカの国別水素自動車市場、2024年、2029年、2034年(US$ Billion)
12.4 中東・アフリカの水素自動車市場規模推定と予測
12.5 中東・アフリカの水素自動車市場規模推定と予測:国別
12.6 中東・アフリカの水素自動車市場規模推定と予測:技術タイプ別
12.7 中東・アフリカの水素自動車市場規模推定と予測:レンジ別
12.8 中東・アフリカの水素自動車市場規模推定と予測:タイプ別
12.9 中東・アフリカの水素自動車市場規模推定と予測:流通経路別
12.10 GCCの水素自動車市場分析
12.11 南アフリカの水素自動車市場分析
12.12 その他の中東・アフリカ地域の水素自動車市場分析
13 ラテンアメリカの水素自動車市場分析
13.1 主要な調査結果
13.2 ラテンアメリカの水素自動車市場魅力度指数
13.3 ラテンアメリカの国別水素自動車市場、2024年、2029年、2034年(US$ Billion)
13.4 ラテンアメリカの水素自動車市場規模推定と予測
13.5 ラテンアメリカの水素自動車市場規模推定と予測:国別
13.6 ラテンアメリカの水素自動車市場規模推定と予測:技術タイプ別
13.7 ラテンアメリカの水素自動車市場規模推定と予測:走行距離別
13.8 ラテンアメリカの水素自動車市場規模推定と予測:タイプ別
13.9 ラテンアメリカの水素自動車市場規模推定と予測:流通チャネル別
13.10 ブラジルの水素自動車市場分析
13.11 メキシコの水素自動車市場分析
13.12 その他のラテンアメリカの水素自動車市場分析
14 主要企業のプロファイル
14.1 競争環境、2023年
14.2 戦略的展望
14.3 Toyota Motor Corporation
14.3.1 会社概要
14.3.2 会社概要
14.3.3 財務分析
14.3.3.1 純収入(2019-2023年
14.3.3.2 R&D、2019-2023年
14.3.3.3 地域別収益シェア、2023年(%)
14.3.3.4 事業セグメント収益シェア、2023年(%)
14.3.4 製品ベンチマーク
14.3.5 戦略的展望
14.4 Hyundai Motor Company
14.4.1 会社概要
14.4.2 会社概要
14.4.3 財務分析
14.4.3.1 純収入、2019-2023年
14.4.3.2 R&D、2019-2023年
14.4.3.3 地域別収益シェア、2023年(%)
14.4.3.4 事業セグメント収益シェア、2023年(%)
14.4.4 製品ベンチマーク
14.4.5 戦略的展望
14.5 Mercedes-Benz Group AG
14.5.1 会社概要
14.5.2 会社概要
14.5.3 財務分析
14.5.3.1 純収入、2019-2023年
14.5.3.2 R&D、2019-2023年
14.5.3.3 地域別収益シェア、2023年(%)
14.5.3.4 事業セグメント収益シェア、2023年(%)
14.5.4 製品ベンチマーク
14.6 Ballard Power Systems Inc
14.6.1 会社概要
14.6.2 会社概要
14.6.3 財務分析
14.6.3.1 純収入、2019-2023年
14.6.3.2 R&D、2019-2023年
14.6.3.3 地域別売上高シェア(2023年)
14.6.4 製品ベンチマーク
14.6.5 戦略的展望
14.7 General Motors Company
14.7.1 会社概要
14.7.2 会社概要
14.7.3 財務分析
14.7.3.1 純収入、2019-2023年
14.7.3.2 R&D、2019-2023年
14.7.3.3 地域別売上高シェア(2023年)
14.7.3.4 事業セグメント収益シェア、2023年(%)
14.7.4 製品ベンチマーク
14.7.5 戦略的展望
14.8 Bayerische Motoren Werke AG
14.8.1 会社概要
14.8.2 会社概要
14.8.3 財務分析
14.8.3.1 純収入、2019-2023年
14.8.3.2 売上高、2019-2023年
14.8.3.3 事業セグメント収益シェア、2023年(%)
14.8.4 製品ベンチマーク
14.9 Riversimple
14.9.1 会社概要
14.9.2 会社概要
14.9.3 製品ベンチマーク
14.9.4 戦略的展望
14.10 Audi AG
14.10.1 会社概要
14.10.2 会社概要
14.10.3 財務分析
14.10.3.1 純収入、2019-2023年
14.10.3.2 R&D、2019-2023年
14.10.3.3 事業セグメント収益シェア、2023年(%)
14.10.4 製品ベンチマーク
14.10.5 戦略的展望
14.11 Hino Motors, Ltd.
14.11.1 会社概要
14.11.2 会社概要
14.11.3 財務分析
14.11.3.1 純収入(2019-2023年
14.11.3.2 R&D(2019年~2023年
14.11.3.3 地域別売上高シェア(2023年)
14.11.3.4 事業セグメント収益シェア、2023年(%)
14.11.4 製品ベンチマーク
14.11.5 戦略的展望
14.12 Cummins Inc
14.12.1 会社概要
14.12.2 会社概要
14.12.3 財務分析
14.12.3.1 純収入、2019-2023年
14.12.3.2 売上高、2019-2023年
14.12.4 製品ベンチマーク
14.12.5 戦略的展望
14.13 Alstom SA
14.13.1 会社概要
14.13.2 会社概要
14.13.3 財務分析
14.13.3.1 純収入、2019-2023年
14.13.3.2 R&D、2019年~2023年
14.13.4 製品ベンチマーク
14.13.5 戦略的展望
14.14 MAN Truck & Bus SE
14.14.1 会社概要
14.14.2 会社概要
14.14.3 財務分析
14.14.3.1 純収入(2019-2023年
14.14.3.2 売上高、2019-2023年
14.14.3.3 事業セグメント収益シェア、2023年(%)
14.14.4 製品ベンチマーク
14.15 Symbio
14.15.1 会社概要
14.15.2 会社概要
14.15.3 製品ベンチマーク
14.15.4 戦略的展望
14.16 Hyundai Mobis
14.16.1 会社概要
14.16.2 会社概要
14.16.3 財務分析
14.16.3.1 純収入(2019-2023年
14.16.3.2 R&D、2019年~2023年
14.16.3.3 地域別収益シェア、2023年(%)
14.16.3.4 事業セグメント収益シェア、2023年(%)
14.16.4 製品ベンチマーク
14.16.5 戦略的展望
14.17 Nikola Corporation
14.17.1 会社概要
14.17.2 会社概要
14.17.3 財務分析
14.17.3.1 純収入(2019-2023年
14.17.3.2 売上高、2019-2023年
14.17.4 製品ベンチマーク
14.17.5 戦略的展望
15 結論と提言
15.1 Visiongainからの結びの言葉
15.2 市場プレイヤーへの提言
ページTOPに戻る
図表リスト
表の一覧
表1 水素自動車市場のスナップショット、2024年〜2034年(10億米ドル、CAGR %)
表2 水素自動車の世界地域別市場:2024~2034年(10億米ドル、AGR(%)、CAGR(%))(V字回復シナリオ)
表3 水素自動車の世界地域別市場:2024~2034年(億米ドル、AGR(%)、CAGR(%))(U字回復シナリオ)
表4 水素自動車の世界地域別市場:2024~2034年(10億米ドル、AGR(%)、CAGR(%))(W字型回復シナリオ)
表5 水素自動車の世界地域別市場:2024~2034年(億米ドル、AGR(%)、CAGR(%))(L字型回復シナリオ)
表6 水素自動車の世界市場:技術タイプ別、2024-2034年(億米ドル、AGR (%)、CAGR (%)
表7 燃料電池電気自動車(FCEV)の地域別市場:2024年~2034年(億米ドル、AGR (%)、CAGR (%)
表8 水素内燃機関自動車(HICEVs)の地域別市場:2024~2034年(億米ドル、AGR(%)、CAGR(%))
表9 水素自動車の世界市場:航続距離別、2024年~2034年(億米ドル、AGR (%)、CAGR (%)
表10 短期レンジの地域別市場:2024-2034年(億米ドル、AGR (%)、CAGR (%)
表11 中距離地域別市場:2024-2034年(億米ドル、AGR (%)、CAGR (%)
表12 2024~2034年の地域別長距離市場(億米ドル、AGR (%)、CAGR (%)
表13 水素自動車の世界市場:タイプ別、2024-2034年(億米ドル、AGR (%)、CAGR (%)
表14 乗用車の地域別市場:2024-2034年(億米ドル、AGR (%)、CAGR (%)
表15 商用車の地域別市場:2024-2034年(億米ドル、AGR (%)、CAGR (%)
表16 地域別公共交通車両市場:2024-2034年(億米ドル、AGR (%)、CAGR (%)
表17 その他の車両タイプ地域別市場:2024-2034年(億米ドル、AGR (%)、CAGR (%)
表18 水素自動車の世界市場:流通チャネル別、2024-2034年(億米ドル、AGR (%)、CAGR (%)
表19 直販(OEM)市場:地域別、2024-2034年(億米ドル、AGR (%)、CAGR (%)
表20 ディーラー市場:地域別(2024-2034年、10億米ドル、AGR (%)、CAGR (%)
表21 フリートリース会社の地域別市場:2024-2034年(億米ドル、AGR (%)、CAGR (%)
表22 オンラインプラットフォーム市場:地域別(2024-2034年、10億米ドル、AGR (%)、CAGR (%)
表23 その他の流通チャネル市場:地域別、2024-2034年(億米ドル、AGR (%)、CAGR (%)
表24 水素自動車の世界地域別市場:2024-2034年(億米ドル、AGR (%)、CAGR (%)
表25 北米の水素自動車市場:金額ベース、2024-2034年(億米ドル、AGR (%)、CAGR (%)
表26 北米の水素自動車市場:国別、2024-2034年(億米ドル、AGR (%)、CAGR (%)
表27 北米の水素自動車市場:技術タイプ別、2024-2034年(億米ドル、AGR (%)、CAGR (%)
表28 北米の水素自動車市場:走行距離別(2024-2034年、億米ドル、AGR (%)、CAGR (%)
表29 北米の水素自動車市場:タイプ別、2024-2034年(億米ドル、AGR (%)、CAGR (%)
表30 北米の水素自動車市場:流通チャネル別、2024-2034年(億米ドル、AGR (%)、CAGR (%)
表31 米国における水素自動車販売
表32 米国の水素自動車市場:金額ベース、2024~2034年(億米ドル、AGR (%)、CAGR (%)
表33 カナダの水素自動車市場:2024-2034年(億米ドル、AGR (%)、CAGR (%)
表34 欧州の水素自動車市場:金額 2024-2034 (億米ドル、AGR (%)、CAGR (%))
表35 欧州の水素自動車市場:国別(2024-2034年、10億米ドル、AGR (%)、CAGR (%)
表36 欧州の水素自動車市場:技術タイプ別、2024~2034年(億米ドル、AGR (%)、CAGR (%)
表37 欧州の水素自動車市場:走行距離別(2024-2034年、億米ドル、AGR (%)、CAGR (%)
表38 欧州の水素自動車市場:タイプ別(2024~2034年、10億米ドル、AGR (%)、CAGR (%)
表39 欧州の水素自動車市場:流通経路別、2024~2034年(億米ドル、AGR (%)、CAGR (%)
表40 ドイツの水素自動車市場:金額ベース、2024-2034年(億米ドル、AGR (%)、CAGR (%)
表41 イギリスの水素自動車市場:金額ベース、2024~2034年(億米ドル、AGR (%)、CAGR (%)
表42 フランスの水素自動車市場:金額 2024-2034 (億米ドル、AGR (%)、CAGR (%))
表43 イタリアの水素自動車市場:金額 2024-2034 (億米ドル、AGR (%)、CAGR (%))
表44 スペインの水素自動車市場:2024-2034年(億米ドル、AGR (%)、CAGR (%)
表45 その他のヨーロッパの水素自動車市場:金額ベース、2024-2034年(億米ドル、AGR (%)、CAGR (%)
表46 アジア太平洋地域の水素自動車市場:2024-2034年(億米ドル、AGR (%)、CAGR (%)
表47 アジア太平洋地域の水素自動車市場:国別(2024-2034年、10億米ドル、AGR (%)、CAGR (%)
表48 アジア太平洋地域の水素自動車市場:技術タイプ別、2024-2034年(億米ドル、AGR (%)、CAGR (%)
表49 アジア太平洋地域の水素自動車市場:走行距離別(2024-2034年、10億米ドル、AGR (%)、CAGR (%)
表50 アジア太平洋地域の水素自動車市場:タイプ別(2024~2034年、10億米ドル、AGR (%)、CAGR (%)
表51 アジア太平洋地域の水素自動車市場:流通チャネル別、2024年~2034年(億米ドル、AGR (%)、CAGR (%)
表52 中国の水素自動車市場:金額ベース、2024~2034年(億米ドル、AGR (%)、CAGR (%)
表53 インドの水素自動車市場:金額ベース、2024~2034年(億米ドル、AGR (%)、CAGR (%)
表54 日本の水素自動車市場:金額ベース、2024-2034年(億米ドル、AGR (%)、CAGR (%)
表55 韓国の水素自動車市場:金額ベース、2024-2034年(億米ドル、AGR (%)、CAGR (%)
表56 オーストラリアの自動車販売台数(2023年)
表57 オーストラリアの水素自動車市場:金額ベース(2024~2034年、10億米ドル、AGR (%)、CAGR (%)
表58 その他のアジア太平洋地域の水素自動車市場:2024~2034年(億米ドル、AGR (%)、CAGR (%)
表 59 中東・アフリカの水素自動車市場:金額 2024-2034 (億米ドル、AGR (%)、CAGR (%))
表60 中東・アフリカ水素自動車国別市場:2024-2034年(億米ドル、AGR (%)、CAGR (%)
表61 中東・アフリカの水素自動車市場:技術タイプ別、2024-2034年(億米ドル、AGR (%)、CAGR (%)
表62 中東・アフリカ水素自動車市場:走行距離別(2024-2034年:億米ドル、AGR (%)、CAGR (%)
表63 中東・アフリカの水素自動車市場:タイプ別(2024~2034年:億米ドル、AGR (%)、CAGR (%)
表64 中東・アフリカの水素自動車市場:流通経路別(2024~2034年:億米ドル、AGR (%)、CAGR (%)
表65 GCCの水素自動車市場:金額ベース、2024~2034年(億米ドル、AGR (%)、CAGR (%)
表66 南アフリカの水素自動車市場:2024-2034年(億米ドル、AGR (%)、CAGR (%)
表67 中東・アフリカの残りの地域の水素自動車市場:金額(億米ドル、AGR (%)、CAGR (%)
表68 ラテンアメリカの水素自動車市場:2024-2034年(億米ドル、AGR (%)、CAGR (%)
表69 ラテンアメリカの水素自動車市場:国別(2024-2034年、億米ドル、AGR (%)、CAGR (%)
表70 ラテンアメリカの水素自動車市場:技術タイプ別、2024-2034年 (億米ドル、AGR (%)、CAGR (%))
表71 中南米の水素自動車市場:走行距離別(2024-2034年、億米ドル、AGR (%)、CAGR (%)
表72 ラテンアメリカの水素自動車市場:タイプ別(2024-2034年、億米ドル、AGR (%)、CAGR (%)
表73 中南米の水素自動車市場:流通経路別、2024~2034年(億米ドル、AGR (%)、CAGR (%)
表74 ブラジルの水素自動車市場:金額ベース、2024-2034年 (億米ドル、AGR (%)、CAGR (%))
表75 メキシコの水素自動車市場:2024-2034年(億米ドル、AGR (%)、CAGR (%)
表76 その他のラテンアメリカの水素自動車市場:2024-2034年(億米ドル、AGR (%)、CAGR (%)
表77 戦略的展望 - 契約
表78 トヨタ自動車株式会社主な詳細(CEO, 本社, 売上高, 設立, 従業員数, 企業タイプ, ウェブサイト, 事業セグメント)
表 79 トヨタ自動車製品ベンチマーク
表 80 トヨタ自動車:戦略的展望
表81 現代自動車主要詳細(CEO, 本社, 売上高, 設立, 従業員数, 企業タイプ, ウェブサイト, 事業セグメント)
表 82 現代自動車製品ベンチマーク
表83 現代自動車戦略的展望
表84 メルセデス・ベンツグループAG:主要詳細(CEO, 本社, 売上高, 設立, 従業員数, 企業タイプ, ウェブサイト, 事業セグメント)
表 85 メルセデス・ベンツグループ AG: 製品ベンチマーク
表 86 バラード・パワー・システムズ社主な詳細(CEO, 本社, 売上高, 設立, 従業員数, 企業タイプ, ウェブサイト, 事業セグメント)
表 87 バラード・パワー・システムズ社製品ベンチマーク
表 88 バラード・パワー・システムズ社戦略的展望
表 89 ゼネラルモーターズ社主な詳細(CEO, 本社, 売上高, 設立, 従業員数, 企業タイプ, ウェブサイト, 事業セグメント)
表 90 ゼネラルモーターズ製品ベンチマーク
表91 ゼネラルモーターズ戦略的展望
表92 Bayerische Motoren Werke AG: 主要詳細(CEO, 本社, 売上高, 設立, 従業員数, 企業タイプ, ウェブサイト, 事業セグメント)
表 93 バイエリッシュ・モトーレン・ヴェルケ:製品ベンチマーク
表94 リバーシンプル主な詳細(CEO, 本社, 売上高, 設立, 従業員数, 企業タイプ, ウェブサイト, 事業セグメント)
表 95 リバーシンプル製品ベンチマーク
表96 リバーシンプル戦略的展望
表97 アウディAG:主要詳細(CEO, 本社, 売上高, 設立, 従業員数, 企業タイプ, ウェブサイト, 事業セグメント)
表98 アウディAG:製品ベンチマーク
表99 アウディAG:戦略的展望
表100 日野自動車(株): 主要詳細(CEO, 本社, 売上高, 設立, 従業員数, 企業タイプ, ウェブサイト, 事業セグメント
表 101 日野自動車製品ベンチマーク
表102 日野自動車:戦略的展望
表103 カミンズInc:主な詳細(CEO, 本社, 売上高, 設立, 従業員数, 企業タイプ, ウェブサイト, 事業セグメント)
表 104 カミンズInc:製品のベンチマーキング
表105 カミンズInc:戦略的展望
表106 アルストムSA:主要業績(CEO, 本社, 売上高, 設立, 従業員数, 企業タイプ, ウェブサイト, 事業セグメント)
表 107 アルストム SA: 製品ベンチマーク
表108 アルストムSA:戦略的展望
表 109 MAN Truck & Bus SE: 主要詳細(CEO, 本社, 売上高, 設立, 従業員数, 企業タイプ, ウェブサイト, 事業セグメント)
表110 MAN Truck & Bus SE: 製品ベンチマーク
表111 シンバイオ主な詳細(CEO, 本社, 売上高, 設立, 従業員数, 企業タイプ, ウェブサイト, 事業セグメント)
表112 シンバイオ製品ベンチマーク
表113 シンバイオ戦略的展望
表114 現代モービス:主要詳細(CEO, 本社, 売上高, 設立, 従業員数, 企業タイプ, ウェブサイト, 事業セグメント)
表115 現代モービス:製品ベンチマーク
表116 現代モービス:戦略的展望
表117 ニコラ・コーポレーション主な詳細(CEO, 本社, 売上高, 設立, 従業員数, 企業タイプ, ウェブサイト, 事業セグメント)
表118 ニコラ・コーポレーション製品ベンチマーク
表119 ニコラ・コーポレーション戦略的展望
表 119 ニコラ・コーポレーション:戦略的展望
図の一覧
図 1 水素自動車市場のセグメンテーション
図2 技術タイプ別水素自動車市場:市場魅力度指数
図3 水素自動車市場:走行距離別:市場魅力度指数
図4 水素自動車のタイプ別市場:市場魅力度指数市場魅力度指数
図5 水素自動車の流通チャネル別市場:市場魅力度指数市場魅力度指数
図6 水素自動車市場:地域別市場魅力度指数
図7 水素自動車市場市場ダイナミクス
図8 乗用車用電気自動車の世界販売台数
図9 水素自動車市場ポーターのファイブフォース分析
図10 水素自動車の世界市場:COVID別シェア予測(2024年~2034年)
図11 水素自動車の世界地域別市場 2024-2034 (億米ドル, AGR (%)) (V字回復シナリオ)
図12 水素自動車の世界地域別市場:2024~2034年(億米ドル、AGR (%))(U字回復シナリオ)
図13 水素自動車の世界地域別市場:2024~2034年(10億米ドル、AGR (%))(W字型回復シナリオ)
図14 水素自動車の世界地域別市場:2024~2034年(億米ドル、AGR (%))(L字型回復シナリオ)
図 15 水素自動車市場PEST分析
図16 水素自動車の技術タイプ別市場市場魅力度指数
図 17 水素自動車の世界市場:技術タイプ別、2024~2034年(10億ドル、AGR (%)
図18 技術タイプ別水素自動車市場シェア予測(2024年、2029年、2034年)
図 19 燃料電池電気自動車(FCEV)の地域別市場予測、2024~2034 年(億米ドル、AGR (%)
図 20 燃料電池電気自動車(FCEV)地域別市場シェア予測、2024 年~2034 年(%)
図 21 水素内燃機関自動車(HICEVs)地域別市場予測、2024~2034 年(億米ドル、AGR (%)
図 22 水素内燃機関自動車(HICEVs)地域別市場シェア予測、2024 年~2034 年 (%)
図 23 水素自動車のレンジ別市場:市場魅力度指数
図 24 水素自動車の世界市場:レンジ別(2024~2034 年)(億米ドル、AGR (%)
図25 水素自動車のレンジ別市場シェア予測、2024年、2029年、2034年 (%)
図26 2024~2034年の短距離地域別市場規模(億米ドル、AGR (%)
図 27 短距離レンジの地域別市場シェア予測、2024年&2034年(%)
図28 2024〜2034年の地域別中距離市場予測(億米ドル、AGR (%)
図 29 2024-2034 年地域別中距離レンジ市場シェア予測 (%)
図30 2024〜2034年の地域別長距離市場(億米ドル、AGR (%)
図 31 2024~2034 年の地域別長距離市場シェア予測 (%)
図 32 水素自動車のタイプ別市場市場魅力度指数
図 33 水素自動車のタイプ別世界市場:2024~2034 年(億米ドル、AGR (%)
図 34 水素自動車のタイプ別市場シェア予測(2024, 2029, 2034年)
図 35 乗用車の地域別市場規模予測(2024~2034 年、10 億米ドル、AGR (%)
図 36 乗用車の地域別市場シェア予測、2024 年& 2034 年(%)
図37 2024~2034年商用車地域別市場規模予測(億米ドル、AGR (%)
図 38 2024-2034 年の商用車地域別市場シェア予測 (%)
図39 2024~2034年の地域別公共輸送車市場(億米ドル、AGR (%)
図40 2024年~2034年の地域別公共輸送車市場シェア予測 (%)
図 41 その他の車両タイプ地域別市場:2024~2034年(億米ドル、AGR (%)
図 42 その他の車両タイプ地域別市場シェア予測、2024 年~2034 年 (%)
図43 水素自動車の流通チャネル別市場市場魅力度指数
図44 水素自動車の世界市場:流通チャネル別、2024年~2034年(億米ドル、AGR (%)
図45 2024年、2029年、2034年の流通チャネル別水素自動車市場シェア予測 (%)
図 46 直接販売(OEM)地域別市場、2024~2034 年(10 億米ドル、AGR (%)
図 47 直販(OEM)地域別市場シェア予測、2024 年~2034 年(%)
図 48 地域別ディーラー市場予測(2024~2034 年、10 億米ドル、AGR (%)
図 49 2024-2034 地域別ディーラー市場シェア予測 (%)
図50 フリートリース会社の地域別市場:2024~2034年(10億米ドル、AGR (%)
図51 フリートリース会社の地域別市場シェア予測、2024年~2034年(%)
図52 オンラインプラットフォーム地域別市場:2024年~2034年(億米ドル、AGR (%)
図53 オンラインプラットフォーム市場地域別シェア予測、2024年~2034年(%)
図54 その他の流通チャネル地域別市場:2024年~2034年(億米ドル、AGR (%)
図55 その他の流通チャネル市場地域別シェア予測、2024年~2034年(%)
図56 水素自動車の地域別市場予測(2024年、2034年)(売上高、CAGR
図 57 2024年、2029年、2034年の地域別水素自動車市場シェア予測(%)
図 58 水素自動車の世界地域別市場予測 2024-2034 (億米ドル, AGR (%))
図 59 北米の水素自動車市場魅力度指数
図60 北米水素自動車地域別市場(2024年、2029年&2034年)(億米ドル
図 61 北米の水素自動車市場:金額ベース(2024~2034年、10億米ドル、AGR (%)
図 62 北米の水素自動車市場:国別(2024~2034年、10億米ドル、AGR (%)
図63 北米の水素自動車国別市場シェア予測、2024年&2034年 (%)
図 64 北米の水素自動車市場:技術タイプ別、2024~2034年(億米ドル、AGR (%)
図65 北米の水素自動車市場:技術タイプ別シェア予測、2024年~2034年(%)
図 66 北米の水素自動車市場:走行距離別(2024~2034年、10億米ドル、AGR (%)
図67 北米の水素自動車市場レンジ別シェア予測、2024年&2034年(%)
図 68 北米の水素自動車市場:タイプ別(2024~2034年、10億米ドル、AGR (%)
図69 北米の水素自動車市場タイプ別シェア予測、2024年~2034年 (%)
図70 北米の水素自動車市場:流通チャネル別予測(2024~2034年、10億米ドル、AGR (%)
図 71 北米の水素自動車市場:流通チャネル別シェア予測、2024~2034 年 (%)
図 72 米国の水素自動車市場:金額ベース(2024~2034 年)(億米ドル、AGR (%)
図 73 カナダの水素自動車市場:金額 2024-2034 (US$ Bn, AGR (%))
図 74 欧州水素自動車市場魅力度指数
図75 欧州水素自動車市場(地域別):2024年、2029年、2034年(10億米ドル
図 76 欧州水素自動車市場:金額ベース(2024~2034年、10億ドル、AGR (%)
図 77 欧州の水素自動車市場:国別(2024~2034 年、10 億米ドル、AGR (%)
図 78 水素自動車の欧州国別市場シェア予測、2024 年~2034 年 (%)
図79 欧州水素自動車市場:技術タイプ別、2024~2034年(億米ドル、AGR (%)
図 80 欧州水素自動車市場:技術タイプ別シェア予測、2024~2034 年 (%)
図 81 欧州水素自動車市場:走行距離別(2024~2034年、10億米ドル、AGR (%)
図82 欧州水素自動車市場レンジ別シェア予測、2024年~2034年 (%)
図83 欧州水素自動車市場:タイプ別予測(2024~2034年、10億米ドル、AGR (%)
図84 欧州水素自動車市場タイプ別シェア予測、2024年~2034年 (%)
図85 欧州水素自動車市場:流通チャネル別予測(2024~2034年、10億米ドル、AGR (%)
図 86 水素自動車の欧州市場流通チャネル別シェア予測、2024~2034 年 (%)
図 87 ドイツ水素自動車市場:金額ベース(2024~2034 年)(億米ドル、AGR (%)
図 88 英国の水素自動車市場:金額ベース(2024~2034 年)(億米ドル、AGR (%)
図 89 フランスの水素自動車市場:2024-2034 年(億米ドル、AGR (%)
図 90 イタリアの水素自動車市場:2024-2034 年(億米ドル、AGR (%)
図 91 スペインの水素自動車市場:2024-2034 年(億米ドル、AGR (%)
図 92 その他の地域の 2024-2034 年の水素自動車市場(億米ドル、AGR (%)
図 93 アジア太平洋地域の水素自動車市場魅力度指数
図94 アジア太平洋地域の水素自動車地域別市場(2024年、2029年、2034年)(億米ドル
図95 アジア太平洋地域の水素自動車市場:金額ベース(2024年~2034年、10億米ドル、AGR (%)
図 96 アジア太平洋地域の水素自動車市場:国別(2024~2034年、10億米ドル、AGR (%)
図 97 アジア太平洋地域の水素自動車国別市場シェア予測、2024年~2034年 (%)
図98 アジア太平洋地域の水素自動車市場:技術タイプ別、2024年~2034年(億米ドル、AGR (%)
図99 アジア太平洋地域の水素自動車市場:技術タイプ別シェア予測、2024年~2034年(%)
図100 アジア太平洋地域の水素自動車市場:走行距離別(2024年~2034年、10億米ドル、AGR (%)
図101 アジア太平洋地域の水素自動車市場:レンジ別シェア予測、2024年~2034年(%)
図102 アジア太平洋地域の水素自動車市場:タイプ別予測(2024~2034年、10億米ドル、AGR (%)
図103 アジア太平洋地域の水素自動車市場タイプ別シェア予測、2024年~2034年 (%)
図104 アジア太平洋地域の水素自動車市場:流通チャネル別予測(2024年~2034年、10億米ドル、AGR (%)
図105 アジア太平洋地域の水素自動車市場流通チャネル別シェア予測、2024年~2034年 (%)
図 106 中国の水素自動車市場:金額ベース、2024~2034年(億米ドル、AGR (%)
図 107 インドの水素自動車市場:金額ベース(2024~2034年、10億米ドル、AGR (%)
図 108 日本の水素自動車市場:金額ベース、2024-2034年(億米ドル、AGR (%)
図 109 韓国の水素自動車市場:金額ベース、2024-2034年(億米ドル、AGR (%)
図 110 オーストラリアの水素自動車市場:2024-2034年(億米ドル、AGR (%)
図 111 その他のアジア太平洋地域の水素自動車市場:金額ベース(2024-2034 年)(億米ドル、AGR (%)
図 112 中東・アフリカ水素自動車市場魅力度指数
図 113 中東・アフリカ地域別水素自動車市場(2024 年、2029 年、2034 年)(億米ドル
図 114 中東・アフリカ水素自動車市場:金額ベース(2024~2034年、10億ドル、AGR (%)
図 115 中東・アフリカ水素自動車国別市場:2024~2034年(億米ドル、AGR (%)
図 116 中東・アフリカ水素自動車国別市場シェア予測、2024~2034 年 (%)
図 117 中東・アフリカの水素自動車市場:技術タイプ別予測(2024~2034年、10億ドル、AGR (%)
図 118 中東・アフリカ水素自動車市場:技術タイプ別シェア予測、2024~2034 年 (%)
図 119 中東・アフリカ水素自動車市場:走行距離別(2024~2034年、10億ドル、AGR (%)
図 120 中東・アフリカ水素自動車市場レンジ別シェア予測、2024~2034 年 (%)
図 121 2024-2034 年中東・アフリカ水素自動車タイプ別市場予測(億米ドル、AGR (%)
図 122 中東・アフリカの水素自動車市場タイプ別シェア予測、2024~2034 年 (%)
図 123 中東・アフリカの水素自動車市場:流通チャネル別予測(2024~2034年、10億ドル、AGR (%)
図 124 中東・アフリカ水素自動車市場流通チャネル別シェア予測、2024~2034 年 (%)
図 125 GCC 水素自動車市場:金額ベース、2024~2034 年(億米ドル、AGR (%)
図 126 南アフリカの水素自動車市場:金額(億米ドル、AGR (%)
図 127 その他の中東・アフリカ水素自動車市場:金額(億米ドル、AGR (%)
図 128 中南米の水素自動車市場魅力度指数
図129 中南米の水素自動車地域別市場(2024年、2029年、2034年)(億米ドル
図130 中南米の水素自動車市場:金額ベース(2024~2034年、10億ドル、AGR (%)
図131 ラテンアメリカの水素自動車市場:国別(2024~2034年、10億米ドル、AGR (%)
図132 中南米の水素自動車国別市場シェア予測、2024~2034年 (%)
図133 ラテンアメリカの水素自動車市場:技術タイプ別、2024~2034年(億米ドル、AGR (%)
図134 ラテンアメリカの水素自動車市場:技術タイプ別シェア予測、2024年~2034年(%)
図135 ラテンアメリカの水素自動車市場:走行距離別(2024~2034年、億米ドル、AGR (%)
図 136 中南米の水素自動車市場レンジ別シェア予測、2024~2034 年 (%)
図 137 ラテンアメリカの水素自動車市場:タイプ別予測(2024~2034年、10億米ドル、AGR (%)
図 138 ラテンアメリカの水素自動車市場タイプ別シェア予測、2024~2034 年 (%)
図139 中南米の水素自動車市場:流通経路別(2024~2034年、10億米ドル、AGR (%)
図 140 中南米の水素自動車市場流通チャネル別シェア予測、2024~2034 年 (%)
図 141 ブラジルの水素自動車市場:金額ベース(2024~2034 年)(億米ドル、AGR (%)
図 142 メキシコの水素自動車市場:金額(2024~2034年、10億米ドル、AGR (%)
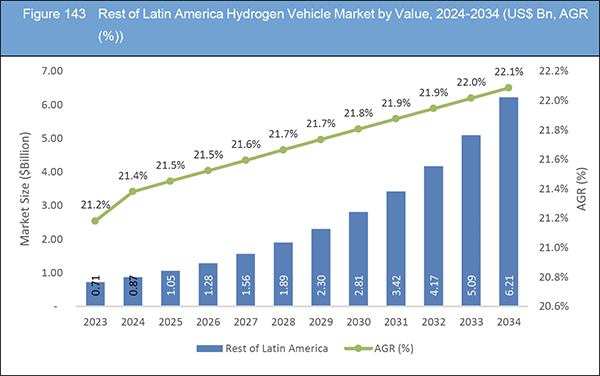
図 143 その他のラテンアメリカの水素自動車市場:金額ベース(2024-2034年、10億米ドル、AGR (%)
図 144 水素自動車市場企業シェア、2023年
図 145 トヨタ自動車純収入、2019年~2023年(百万米ドル、AGR)
図 146 トヨタ自動車R&D、2019-2023年(百万米ドル、AGR)
図 147 トヨタ自動車地域別売上高シェア、2023年
図 148 トヨタ自動車:事業セグメント別売上高シェア、2023 年 (%)
図 149 現代自動車:純収入、2019年~2023年(百万米ドル、AGR)
図 150 現代自動車:R&D, 2019-2023 (百万米ドル, AGR%)
図 151 現代自動車:地域別売上高シェア(%)
図 152 現代自動車:事業セグメント別売上高シェア、2023年(%)
図 153 メルセデス・ベンツ・グループ AG.:純収入、2019-2023 年(百万米ドル、AGR)
図 154 メルセデス・ベンツ・グループ AG.:R&D、2019-2023 年(百万米ドル、AGR)
図 155 メルセデス・ベンツグループ AG.:地域別収益シェア、2023 年 (%)
図 156 メルセデス・ベンツ・グループ AG.:事業別売上高シェア、2023 年(%)
図 157 Ballard Power Systems Inc:純収入、2019 年~2023 年(百万米ドル、AGR)
図 158 Ballard Power Systems Inc:R&D, 2019-2023 (百万米ドル, AGR%)
図 159 Ballard Power Systems Inc:地域別収益シェア、2023 年
図 160 General Motors Company:純収入、2019 年~2023 年(百万米ドル、AGR)
図 161 General Motors Company:R&D、2019年~2023年(百万米ドル、AGR)
図 162 ゼネラルモーターズ・カンパニー:地域別売上高シェア(%)
図 163 ゼネラルモーターズ・カンパニー:事業セグメント別売上高シェア、2023 年 (%)
図 164 Bayerische Motoren Werke AG.:純収入、2019-2023 年(百万米ドル、AGR)
図 165 Bayerische Motoren Werke AG.:R&D、2019-2023年(百万米ドル、AGR)
図 166 Bayerische Motoren Werke AG.:事業セグメント別売上高シェア(%)(2023 年
図 167 アウディ:純収入、2019-2023 (百万米ドル、AGR%)
図168 アウディAG.:R&D、2019-2023年(百万米ドル、AGR)
図 169 アウディ AG.:事業セグメント別売上高シェア、2023 年 (%)
図 170 日野自動車(株):純収入、2019-2023 年(百万米ドル、AGR
図 171 日野自動車(株):R&D, 2019-2023 (百万米ドル, AGR%)
図 172 日野自動車(株):地域別売上高シェア、2023 年
図 173 日野自動車(株):事業別売上高シェア、2023 年(%)
図 174 Cummins Inc:純収入、2019 年~2023 年 (US$ Million, AGR%)
図 175 Cummins Inc:R&D、2019年~2023年(百万米ドル、AGR)
図 176 アルストム SA.:純収入、2019~2023 年(百万米ドル、AGR)
図 177 アルストム SA.:R&D、2019~2023 年(百万米ドル、AGR)
図 178 MAN Truck & Bus SE.:純収入、2019~2023 年(百万米ドル、AGR)
図 179 MAN Truck & Bus SE.: R&D, 2019-2023 (US$ Million, AGR%)
図 180 MAN Truck & Bus SE.:事業セグメント売上高シェア、2023 年 (%)
図 181 現代モービス:純収入、2019年~2023年(百万米ドル、AGR)
図 182 現代モービス:R&D, 2019-2023 (百万米ドル, AGR%)
図 183 現代モービス:地域別収益シェア(%)
図184 現代モービス:事業セグメント別売上高シェア、2023年(%)
図 185 ニコラ・コーポレーション純収入、2019年~2023年(百万米ドル、AGR)
図 186 ニコラ社:R&D, 2019-2023 (百万米ドル, AGR%)
ページTOPに戻る
Summary
Report Details
The Hydrogen Vehicle Market Report 2024-2034: This report will prove invaluable to leading firms striving for new revenue pockets if they wish to better understand the industry and its underlying dynamics. It will be useful for companies that would like to expand into different industries or to expand their existing operations in a new region.
Environmental Regulations and Emissions Reduction Targets
Stringent environmental regulations and emissions reduction targets imposed by governments around the world are driving automakers to explore alternative fuel options, including hydrogen fuel cell technology, to meet regulatory requirements and mitigate the environmental impact of transportation. Hydrogen vehicles offer zero-emission transportation solutions, emitting only water vapour and heat during operation, making them attractive options for achieving carbon neutrality and improving air quality.
Regulatory initiatives such as vehicle emission standards, carbon pricing mechanisms, and zero-emission vehicle mandates are incentivising automakers to invest in hydrogen fuel cell technology as part of their long-term sustainability strategies. For instance, the European Union has set ambitious emission reduction targets for the automotive sector, spurring automakers to accelerate the development and deployment of hydrogen vehicles to comply with regulatory requirements.
Rising Demand for BEV and HEVs Restraining Hydrogen Vehicle Opportunity
The market for hydrogen vehicles faces a significant restraining factor due to the rising demand for Battery Electric Vehicles (BEVs) and Hybrid Electric Vehicles (HEVs). As consumer preferences shift towards electric vehicles, particularly BEVs, the demand for hydrogen vehicles faces stiff competition. BEVs and HEVs offer appealing advantages such as lower operating costs, reduced reliance on fossil fuels, and a more established charging infrastructure compared to hydrogen vehicles.
Additionally, advancements in battery technology have led to increased driving ranges and shorter charging times for BEVs, further enhancing their appeal to consumers. This rising demand for BEVs and HEVs limits the market opportunity for hydrogen vehicles, as automakers and consumers alike prioritise electric alternatives. Despite the potential environmental benefits of hydrogen vehicles, the current market dynamics favour the widespread adoption of BEVs and HEVs, presenting a significant challenge for the growth of hydrogen vehicle technology
What Questions Should You Ask before Buying a Market Research Report?
-
How is the hydrogen vehicle market evolving?
-
What is driving and restraining the hydrogen vehicle market?
-
How will each hydrogen vehicle submarket segment grow over the forecast period and how much revenue will these submarkets account for in 2034?
-
How will the market shares for each hydrogen vehicle submarket develop from 2024 to 2034?
-
What will be the main driver for the overall market from 2024 to 2034?
-
Will leading hydrogen vehicle markets broadly follow the macroeconomic dynamics, or will individual national markets outperform others?
-
How will the market shares of the national markets change by 2034 and which geographical region will lead the market in 2034?
-
Who are the leading players and what are their prospects over the forecast period?
-
What are the hydrogen vehicle projects for these leading companies?
-
How will the industry evolve during the period between 2024 and 2034? What are the implications of hydrogen vehicle projects taking place now and over the next 10 years?
-
Is there a greater need for product commercialisation to further scale the hydrogen vehicle market?
-
Where is the hydrogen vehicle market heading and how can you ensure you are at the forefront of the market?
-
What are the best investment options for new product and service lines?
-
What are the key prospects for moving companies into a new growth path and C-suite?
You need to discover how this will impact the hydrogen vehicle market today, and over the next 10 years:
-
Our 384-page report provides 119 tables and 186 charts/graphs exclusively to you.
-
The report highlights key lucrative areas in the industry so you can target them – NOW.
-
It contains in-depth analysis of global, regional and national sales and growth.
-
It highlights for you the key successful trends, changes and revenue projections made by your competitors.
This report tells you TODAY how the hydrogen vehicle market will develop in the next 10 years, and in line with the variations in COVID-19 economic recession and bounce. This market is more critical now than at any point over the last 10 years.
Forecasts to 2034 and other analyses reveal commercial prospects
-
In addition to revenue forecasting to 2034, our new study provides you with recent results, growth rates, and market shares.
-
You will find original analyses, with business outlooks and developments.
-
Discover qualitative analyses (including market dynamics, drivers, opportunities, restraints and challenges), cost structure, impact of rising hydrogen vehicle prices and recent developments.
This report includes data analysis and invaluable insight into how COVID-19 will affect the industry and your company. Four COVID-19 recovery patterns and their impact, namely, “V”, “L”, “W” and “U” are discussed in this report.
Segments Covered in the Report
Market Segment by Technology Type
-
Fuel Cell Electric Vehicles (FCEVs)
-
Hydrogen Internal Combustion Engine Vehicles (HICEVs)
Market Segment by Range
-
Short Range
-
Medium Range
-
Long Range
Market Segment by Type
-
Passenger Vehicles
-
Commercial Vehicles
-
Public Transport Vehicles
-
Other Vehicle Type
Market Segment by Distribution Channel
-
Direct Sales (OEMs)
-
Dealerships
-
Fleet Leasing Companies
-
Online Platforms
-
Other Distribution Channels
In addition to the revenue predictions for the overall world market and segments, you will also find revenue forecasts for four regional and 20 leading national markets:
North America
Europe
-
Germany
-
Spain
-
United Kingdom
-
France
-
Italy
-
Rest of Europe
Asia Pacific
-
China
-
Japan
-
India
-
Australia
-
South Korea
-
Rest of Asia Pacific
Latin America
-
Brazil
-
Mexico
-
Rest of Latin America
Middle East & Africa
-
GCC
-
South Africa
-
Rest of Middle East & Africa
The report also includes profiles and for some of the leading companies in the Hydrogen Vehicle Market, 2024 to 2034, with a focus on this segment of these companies’ operations.
Leading companies profiled in the report
-
Alstom SA
-
Audi AG
-
Ballard Power Systems Inc
-
Bayerische Motoren Werke AG
-
Cummins Inc.
-
General Motors Company
-
Hino Motors, Ltd.
-
Hyundai Mobis
-
Hyundai Motor Company
-
MAN Truck & Bus SE
-
Mercedes-Benz Group AG
-
Nikola Corporation
-
Riversimple
-
Symbio
-
Toyota Motor Corporation
Overall world revenue for Hydrogen Vehicle Market, 2024 to 2034 in terms of value the market will surpass US$28.53 billion in 2024, our work calculates. We predict strong revenue growth through to 2034. Our work identifies which organisations hold the greatest potential. Discover their capabilities, progress, and commercial prospects, helping you stay ahead.
How will the Hydrogen Vehicle Market, 2024 to 2034 report help you?
In summary, our 380+ page report provides you with the following knowledge:
-
Revenue forecasts to 2034 for Hydrogen Vehicle Market, 2024 to 2034 Market, with forecasts for technology type, range, type, and distribution channel, each forecast at a global and regional level – discover the industry’s prospects, finding the most lucrative places for investments and revenues.
-
Revenue forecasts to 2034 for four regional and 20 key national markets – See forecasts for the Hydrogen Vehicle Market, 2024 to 2034 market in North America, Europe, Asia-Pacific, Latin America and Middle East & Africa. Also forecasted is the market in the US, Canada, Brazil, Germany, France, UK, Italy, China, India, Japan, and Australia among other prominent economies.
-
Prospects for established firms and those seeking to enter the market – including company profiles for 15 of the major companies involved in the Hydrogen Vehicle Market, 2024 to 2034.
Find quantitative and qualitative analyses with independent predictions. Receive information that only our report contains, staying informed with invaluable business intelligence.
Information found nowhere else
With our new report, you are less likely to fall behind in knowledge or miss out on opportunities. See how our work could benefit your research, analyses, and decisions. Visiongain’s study is for everybody needing commercial analyses for the Hydrogen Vehicle Market, 2024 to 2034, market-leading companies. You will find data, trends and predictions.
ページTOPに戻る
Table of Contents
1 Report Overview
1.1 Objectives of the Study
1.2 Introduction to Hydrogen Vehicle Market
1.3 What This Report Delivers
1.4 Why You Should Read This Report
1.5 Key Questions Answered by This Analytical Report
1.6 Who Is This Report for?
1.7 Methodology
1.7.1 Market Definitions
1.7.2 Market Evaluation & Forecasting Methodology
1.7.3 Data Validation
1.7.3.1 Primary Research
1.7.3.2 Secondary Research
1.8 Frequently Asked Questions (FAQs)
1.9 Associated Visiongain Reports
1.10 About Visiongain
2 Executive Summary
3 Market Overview
3.1 Key Findings
3.2 Market Dynamics
3.2.1 Market Driving Factors
3.2.1.1 Reduce Oil Dependency Driving the Market Growth for Hydrogen Vehicle
3.2.1.2 Global Efforts to Reduce Gas Emissions Driving the Market Growth
3.2.1.3 Government Initiatives Promoting Hydrogen Infrastructure Driving the Market Growth
3.2.2 Market Restraining Factors
3.2.2.1 Rising Demand for BEV and HEVs Restraining Hydrogen Vehicle Opportunity
3.2.2.2 High Cost of Platinum Catalyst for Fuel Cells Hinder the Market Growth
3.2.2.3 High Initial Investment in Hydrogen Fuelling Infrastructure Hinder the Market Growth
3.2.3 Market Opportunities
3.2.3.1 Collaboration and Partnership Between Market Players Opportunities for Market Growth
3.2.3.2 Expansion into New Geographic Regions, Opportunities for the Market
3.2.3.3 Investment in Hydrogen Vehicle and Infrastructure
3.3 Porter’s Five Forces Analysis
3.3.1 Bargaining Power of Suppliers (Low to Medium)
3.3.2 Bargaining Power of Buyers (Medium)
3.3.3 Competitive Rivalry (High)
3.3.4 Threat from Substitutes (Medium to High)
3.3.5 Threat of New Entrants (Low)
3.4 COVID-19 Impact Analysis
3.4.1 “V-Shaped Recovery”
3.4.2 “U-Shaped Recovery”
3.4.3 “W-Shaped Recovery”
3.4.4 “L-Shaped Recovery”
3.5 PEST Analysis
4 Hydrogen Vehicle Market Analysis by Technology Type
4.1 Key Findings
4.2 Technology Type Segment: Market Attractiveness Index
4.3 Hydrogen Vehicle Market Size Estimation and Forecast by Technology Type
4.4 Fuel Cell Electric Vehicles (FCEVs)
4.4.1 Market Size by Region, 2024-2034 (US$ Billion)
4.4.2 Market Share by Region, 2024 & 2034 (%)
4.5 Hydrogen Internal Combustion Engine Vehicles (HICEVs)
4.5.1 Market Size by Region, 2024-2034 (US$ Billion)
4.5.2 Market Share by Region, 2024 & 2034 (%)
5 Hydrogen Vehicle Market Analysis by Range
5.1 Key Findings
5.2 Range Segment: Market Attractiveness Index
5.3 Hydrogen Vehicle Market Size Estimation and Forecast by Range
5.4 Short Range
5.4.1 Market Size by Region, 2024-2034 (US$ Billion)
5.4.2 Market Share by Region, 2024 & 2034 (%)
5.5 Medium Range
5.5.1 Market Size by Region, 2024-2034 (US$ Billion)
5.5.2 Market Share by Region, 2024 & 2034 (%)
5.6 Long Range
5.6.1 Market Size by Region, 2024-2034 (US$ Billion)
5.6.2 Market Share by Region, 2024 & 2034 (%)
6 Hydrogen Vehicle Market Analysis by Type
6.1 Key Findings
6.2 Type Segment: Market Attractiveness Index
6.3 Hydrogen Vehicle Market Size Estimation and Forecast by Type
6.4 Passenger Vehicles
6.4.1 Market Size by Region, 2024-2034 (US$ Billion)
6.4.2 Market Share by Region, 2024 & 2034 (%)
6.5 Commercial Vehicles
6.5.1 Market Size by Region, 2024-2034 (US$ Billion)
6.5.2 Market Share by Region, 2024 & 2034 (%)
6.6 Public Transport Vehicles
6.6.1 Market Size by Region, 2024-2034 (US$ Billion)
6.6.2 Market Share by Region, 2024 & 2034 (%)
6.7 Other Vehicle Type
6.7.1 Market Size by Region, 2024-2034 (US$ Billion)
6.7.2 Market Share by Region, 2024 & 2034 (%)
7 Hydrogen Vehicle Market Analysis by Distribution Channel
7.1 Key Findings
7.2 Distribution Channel Segment: Market Attractiveness Index
7.3 Hydrogen Vehicle Market Size Estimation and Forecast by Distribution Channel
7.4 Direct Sales (OEMs)
7.4.1 Market Size by Region, 2024-2034 (US$ Billion)
7.4.2 Market Share by Region, 2024 & 2034 (%)
7.5 Dealerships
7.5.1 Market Size by Region, 2024-2034 (US$ Billion)
7.5.2 Market Share by Region, 2024 & 2034 (%)
7.6 Fleet Leasing Companies
7.6.1 Market Size by Region, 2024-2034 (US$ Billion)
7.6.2 Market Share by Region, 2024 & 2034 (%)
7.7 Online Platforms
7.7.1 Market Size by Region, 2024-2034 (US$ Billion)
7.7.2 Market Share by Region, 2024 & 2034 (%)
7.8 Other Distribution Channel
7.8.1 Market Size by Region, 2024-2034 (US$ Billion)
7.8.2 Market Share by Region, 2024 & 2034 (%)
8 Hydrogen Vehicle Market Analysis by Region
8.1 Key Findings
8.2 Regional Market Size Estimation and Forecast
9 North America Hydrogen Vehicle Market Analysis
9.1 Key Findings
9.2 North America Hydrogen Vehicle Market Attractiveness Index
9.3 North America Hydrogen Vehicle Market by Country, 2024, 2029 & 2034 (US$ Billion)
9.4 North America Hydrogen Vehicle Market Size Estimation and Forecast
9.5 North America Hydrogen Vehicle Market Size Estimation and Forecast by Country
9.6 North America Hydrogen Vehicle Market Size Estimation and Forecast by Technology Type
9.7 North America Hydrogen Vehicle Market Size Estimation and Forecast by Range
9.8 North America Hydrogen Vehicle Market Size Estimation and Forecast by Type
9.9 North America Hydrogen Vehicle Market Size Estimation and Forecast by Distribution Channel
9.10 U.S. Hydrogen Vehicle Market Analysis
9.11 Canada Hydrogen Vehicle Market Analysis
10 Europe Hydrogen Vehicle Market Analysis
10.1 Key Findings
10.2 Europe Hydrogen Vehicle Market Attractiveness Index
10.3 Europe Hydrogen Vehicle Market by Country, 2024, 2029 & 2034 (US$ Billion)
10.4 Europe Hydrogen Vehicle Market Size Estimation and Forecast
10.5 Europe Hydrogen Vehicle Market Size Estimation and Forecast by Country
10.6 Europe Hydrogen Vehicle Market Size Estimation and Forecast by Technology Type
10.7 Europe Hydrogen Vehicle Market Size Estimation and Forecast by Range
10.8 Europe Hydrogen Vehicle Market Size Estimation and Forecast by Type
10.9 Europe Hydrogen Vehicle Market Size Estimation and Forecast by Distribution Channel
10.10 Germany Hydrogen Vehicle Market Analysis
10.11 UK Hydrogen Vehicle Market Analysis
10.12 France Hydrogen Vehicle Market Analysis
10.13 Italy Hydrogen Vehicle Market Analysis
10.14 Spain Hydrogen Vehicle Market Analysis
10.15 Rest of Europe Hydrogen Vehicle Market Analysis
11 Asia-Pacific Hydrogen Vehicle Market Analysis
11.1 Key Findings
11.2 Asia-Pacific Hydrogen Vehicle Market Attractiveness Index
11.3 Asia-Pacific Hydrogen Vehicle Market by Country, 2024, 2029 & 2034 (US$ Billion)
11.4 Asia-Pacific Hydrogen Vehicle Market Size Estimation and Forecast
11.5 Asia-Pacific Hydrogen Vehicle Market Size Estimation and Forecast by Country
11.6 Asia-Pacific Hydrogen Vehicle Market Size Estimation and Forecast by Technology Type
11.7 Asia-Pacific Hydrogen Vehicle Market Size Estimation and Forecast by Range
11.8 Asia-Pacific Hydrogen Vehicle Market Size Estimation and Forecast by Type
11.9 Asia-Pacific Hydrogen Vehicle Market Size Estimation and Forecast by Distribution Channel
11.10 China Hydrogen Vehicle Market Analysis
11.11 India Hydrogen Vehicle Market Analysis
11.12 Japan Hydrogen Vehicle Market Analysis
11.13 South Korea Hydrogen Vehicle Market Analysis
11.14 Australia Hydrogen Vehicle Market Analysis
11.15 Rest of Asia-Pacific Hydrogen Vehicle Market Analysis
12 Middle East and Africa Hydrogen Vehicle Market Analysis
12.1 Key Findings
12.2 Middle East and Africa Hydrogen Vehicle Market Attractiveness Index
12.3 Middle East and Africa Hydrogen Vehicle Market by Country, 2024, 2029 & 2034 (US$ Billion)
12.4 Middle East and Africa Hydrogen Vehicle Market Size Estimation and Forecast
12.5 Middle East and Africa Hydrogen Vehicle Market Size Estimation and Forecast by Country
12.6 Middle East and Africa Hydrogen Vehicle Market Size Estimation and Forecast by Technology Type
12.7 Middle East and Africa Hydrogen Vehicle Market Size Estimation and Forecast by Range
12.8 Middle East and Africa Hydrogen Vehicle Market Size Estimation and Forecast by Type
12.9 Middle East and Africa Hydrogen Vehicle Market Size Estimation and Forecast by Distribution Channel
12.10 GCC Hydrogen Vehicle Market Analysis
12.11 South Africa Hydrogen Vehicle Market Analysis
12.12 Rest of Middle East & Africa Hydrogen Vehicle Market Analysis
13 Latin America Hydrogen Vehicle Market Analysis
13.1 Key Findings
13.2 Latin America Hydrogen Vehicle Market Attractiveness Index
13.3 Latin America Hydrogen Vehicle Market by Country, 2024, 2029 & 2034 (US$ Billion)
13.4 Latin America Hydrogen Vehicle Market Size Estimation and Forecast
13.5 Latin America Hydrogen Vehicle Market Size Estimation and Forecast by Country
13.6 Latin America Hydrogen Vehicle Market Size Estimation and Forecast by Technology Type
13.7 Latin America Hydrogen Vehicle Market Size Estimation and Forecast by Range
13.8 Latin America Hydrogen Vehicle Market Size Estimation and Forecast by Type
13.9 Latin America Hydrogen Vehicle Market Size Estimation and Forecast by Distribution Channel
13.10 Brazil Hydrogen Vehicle Market Analysis
13.11 Mexico Hydrogen Vehicle Market Analysis
13.12 Rest of Latin America Hydrogen Vehicle Market Analysis
14 Company Profiles
14.1 Competitive Landscape, 2023
14.2 Strategic Outlook
14.3 Toyota Motor Corporation
14.3.1 Company Snapshot
14.3.2 Company Overview
14.3.3 Financial Analysis
14.3.3.1 Net Revenue, 2019-2023
14.3.3.2 R&D, 2019-2023
14.3.3.3 Regional Revenue Share, 2023 (%)
14.3.3.4 Business Segment Revenue Share, 2023 (%)
14.3.4 Product Benchmarking
14.3.5 Strategic Outlook
14.4 Hyundai Motor Company
14.4.1 Company Snapshot
14.4.2 Company Overview
14.4.3 Financial Analysis
14.4.3.1 Net Revenue, 2019-2023
14.4.3.2 R&D, 2019-2023
14.4.3.3 Regional Revenue Share, 2023 (%)
14.4.3.4 Business Segment Revenue Share, 2023 (%)
14.4.4 Product Benchmarking
14.4.5 Strategic Outlook
14.5 Mercedes-Benz Group AG
14.5.1 Company Snapshot
14.5.2 Company Overview
14.5.3 Financial Analysis
14.5.3.1 Net Revenue, 2019-2023
14.5.3.2 R&D, 2019-2023
14.5.3.3 Regional Revenue Share, 2023 (%)
14.5.3.4 Business Segment Revenue Share, 2023 (%)
14.5.4 Product Benchmarking
14.6 Ballard Power Systems Inc
14.6.1 Company Snapshot
14.6.2 Company Overview
14.6.3 Financial Analysis
14.6.3.1 Net Revenue, 2019-2023
14.6.3.2 R&D, 2019-2023
14.6.3.3 Regional Revenue Share, 2023 (%)
14.6.4 Product Benchmarking
14.6.5 Strategic Outlook
14.7 General Motors Company
14.7.1 Company Snapshot
14.7.2 Company Overview
14.7.3 Financial Analysis
14.7.3.1 Net Revenue, 2019-2023
14.7.3.2 R&D, 2019-2023
14.7.3.3 Regional Revenue Share, 2023 (%)
14.7.3.4 Business Segment Revenue Share, 2023 (%)
14.7.4 Product Benchmarking
14.7.5 Strategic Outlook
14.8 Bayerische Motoren Werke AG
14.8.1 Company Snapshot
14.8.2 Company Overview
14.8.3 Financial Analysis
14.8.3.1 Net Revenue, 2019-2023
14.8.3.2 R&D, 2019-2023
14.8.3.3 Business Segment Revenue Share, 2023 (%)
14.8.4 Product Benchmarking
14.9 Riversimple
14.9.1 Company Snapshot
14.9.2 Company Overview
14.9.3 Product Benchmarking
14.9.4 Strategic Outlook
14.10 Audi AG
14.10.1 Company Snapshot
14.10.2 Company Overview
14.10.3 Financial Analysis
14.10.3.1 Net Revenue, 2019-2023
14.10.3.2 R&D, 2019-2023
14.10.3.3 Business Segment Revenue Share, 2023 (%)
14.10.4 Product Benchmarking
14.10.5 Strategic Outlook
14.11 Hino Motors, Ltd.
14.11.1 Company Snapshot
14.11.2 Company Overview
14.11.3 Financial Analysis
14.11.3.1 Net Revenue, 2019-2023
14.11.3.2 R&D, 2019-2023
14.11.3.3 Regional Revenue Share, 2023 (%)
14.11.3.4 Business Segment Revenue Share, 2023 (%)
14.11.4 Product Benchmarking
14.11.5 Strategic Outlook
14.12 Cummins Inc
14.12.1 Company Snapshot
14.12.2 Company Overview
14.12.3 Financial Analysis
14.12.3.1 Net Revenue, 2019-2023
14.12.3.2 R&D, 2019-2023
14.12.4 Product Benchmarking
14.12.5 Strategic Outlook
14.13 Alstom SA
14.13.1 Company Snapshot
14.13.2 Company Overview
14.13.3 Financial Analysis
14.13.3.1 Net Revenue, 2019-2023
14.13.3.2 R&D, 2019-2023
14.13.4 Product Benchmarking
14.13.5 Strategic Outlook
14.14 MAN Truck & Bus SE
14.14.1 Company Snapshot
14.14.2 Company Overview
14.14.3 Financial Analysis
14.14.3.1 Net Revenue, 2019-2023
14.14.3.2 R&D, 2019-2023
14.14.3.3 Business Segment Revenue Share, 2023 (%)
14.14.4 Product Benchmarking
14.15 Symbio
14.15.1 Company Snapshot
14.15.2 Company Overview
14.15.3 Product Benchmarking
14.15.4 Strategic Outlook
14.16 Hyundai Mobis
14.16.1 Company Snapshot
14.16.2 Company Overview
14.16.3 Financial Analysis
14.16.3.1 Net Revenue, 2019-2023
14.16.3.2 R&D, 2019-2023
14.16.3.3 Regional Revenue Share, 2023 (%)
14.16.3.4 Business Segment Revenue Share, 2023 (%)
14.16.4 Product Benchmarking
14.16.5 Strategic Outlook
14.17 Nikola Corporation
14.17.1 Company Snapshot
14.17.2 Company Overview
14.17.3 Financial Analysis
14.17.3.1 Net Revenue, 2019-2023
14.17.3.2 R&D, 2019-2023
14.17.4 Product Benchmarking
14.17.5 Strategic Outlook
15 Conclusion and Recommendations
15.1 Concluding Remarks from Visiongain
15.2 Recommendations for Market Players
ページTOPに戻る
List of Tables/Graphs
List of Tables
Table 1 Hydrogen Vehicle Market Snapshot, 2024 & 2034 (US$ Billion, CAGR %)
Table 2 Global Hydrogen Vehicle Market by Region, 2024-2034 (US$ Bn, AGR (%), CAGR (%)) (V-Shaped Recovery Scenario)
Table 3 Global Hydrogen Vehicle Market by Region, 2024-2034 (US$ Bn, AGR (%), CAGR (%)) (U-Shaped Recovery Scenario)
Table 4 Global Hydrogen Vehicle Market by Region, 2024-2034 (US$ Bn, AGR (%), CAGR (%)) (W-Shaped Recovery Scenario)
Table 5 Global Hydrogen Vehicle Market by Region, 2024-2034 (US$ Bn, AGR (%), CAGR (%)) (L-Shaped Recovery Scenario)
Table 6 Global Hydrogen Vehicle Market by Technology Type, 2024-2034 (US$ Bn, AGR (%), CAGR (%))
Table 7 Fuel Cell Electric Vehicles (FCEVs) Market by Region, 2024-2034 (US$ Bn, AGR (%), CAGR (%))
Table 8 Hydrogen Internal Combustion Engine Vehicles (HICEVs) Market by Region, 2024-2034 (US$ Bn, AGR (%), CAGR (%))
Table 9 Global Hydrogen Vehicle Market by Range, 2024-2034 (US$ Bn, AGR (%), CAGR (%))
Table 10 Short Range Market by Region, 2024-2034 (US$ Bn, AGR (%), CAGR (%))
Table 11 Medium Range Market by Region, 2024-2034 (US$ Bn, AGR (%), CAGR (%))
Table 12 Long Range Market by Region, 2024-2034 (US$ Bn, AGR (%), CAGR (%))
Table 13 Global Hydrogen Vehicle Market by Type, 2024-2034 (US$ Bn, AGR (%), CAGR (%))
Table 14 Passenger Vehicles Market by Region, 2024-2034 (US$ Bn, AGR (%), CAGR (%))
Table 15 Commercial Vehicles Market by Region, 2024-2034 (US$ Bn, AGR (%), CAGR (%))
Table 16 Public Transport Vehicles Market by Region, 2024-2034 (US$ Bn, AGR (%), CAGR (%))
Table 17 Other Vehicle Type Market by Region, 2024-2034 (US$ Bn, AGR (%), CAGR (%))
Table 18 Global Hydrogen Vehicle Market by Distribution Channel, 2024-2034 (US$ Bn, AGR (%), CAGR (%))
Table 19 Direct Sales (OEMs) Market by Region, 2024-2034 (US$ Bn, AGR (%), CAGR (%))
Table 20 Dealerships Market by Region, 2024-2034 (US$ Bn, AGR (%), CAGR (%))
Table 21 Fleet Leasing Companies Market by Region, 2024-2034 (US$ Bn, AGR (%), CAGR (%))
Table 22 Online Platforms Market by Region, 2024-2034 (US$ Bn, AGR (%), CAGR (%))
Table 23 Other Distribution Channels Market by Region, 2024-2034 (US$ Bn, AGR (%), CAGR (%))
Table 24 Global Hydrogen Vehicle Market by Region, 2024-2034 (US$ Bn, AGR (%), CAGR (%))
Table 25 North America Hydrogen Vehicle Market by Value, 2024-2034 (US$ Bn, AGR (%), CAGR (%))
Table 26 North America Hydrogen Vehicle Market by Country, 2024-2034 (US$ Bn, AGR (%), CAGR (%))
Table 27 North America Hydrogen Vehicle Market by Technology Type, 2024-2034 (US$ Bn, AGR (%), CAGR (%))
Table 28 North America Hydrogen Vehicle Market by Range, 2024-2034 (US$ Bn, AGR (%), CAGR (%))
Table 29 North America Hydrogen Vehicle Market by Type, 2024-2034 (US$ Bn, AGR (%), CAGR (%))
Table 30 North America Hydrogen Vehicle Market by Distribution Channel, 2024-2034 (US$ Bn, AGR (%), CAGR (%))
Table 31 Hydrogen Vehicle sale in U.S.
Table 32 US Hydrogen Vehicle Market by Value, 2024-2034 (US$ Bn, AGR (%), CAGR (%))
Table 33 Canada Hydrogen Vehicle Market by Value, 2024-2034 (US$ Bn, AGR (%), CAGR (%))
Table 34 Europe Hydrogen Vehicle Market by Value, 2024-2034 (US$ Bn, AGR (%), CAGR (%))
Table 35 Europe Hydrogen Vehicle Market by Country, 2024-2034 (US$ Bn, AGR (%), CAGR (%))
Table 36 Europe Hydrogen Vehicle Market by Technology Type, 2024-2034 (US$ Bn, AGR (%), CAGR (%))
Table 37 Europe Hydrogen Vehicle Market by Range, 2024-2034 (US$ Bn, AGR (%), CAGR (%))
Table 38 Europe Hydrogen Vehicle Market by Type, 2024-2034 (US$ Bn, AGR (%), CAGR (%))
Table 39 Europe Hydrogen Vehicle Market by Distribution Channel, 2024-2034 (US$ Bn, AGR (%), CAGR (%))
Table 40 Germany Hydrogen Vehicle Market by Value, 2024-2034 (US$ Bn, AGR (%), CAGR (%))
Table 41 UK Hydrogen Vehicle Market by Value, 2024-2034 (US$ Bn, AGR (%), CAGR (%))
Table 42 France Hydrogen Vehicle Market by Value, 2024-2034 (US$ Bn, AGR (%), CAGR (%))
Table 43 Italy Hydrogen Vehicle Market by Value, 2024-2034 (US$ Bn, AGR (%), CAGR (%))
Table 44 Spain Hydrogen Vehicle Market by Value, 2024-2034 (US$ Bn, AGR (%), CAGR (%))
Table 45 Rest of Europe Hydrogen Vehicle Market by Value, 2024-2034 (US$ Bn, AGR (%), CAGR (%))
Table 46 Asia-Pacific Hydrogen Vehicle Market by Value, 2024-2034 (US$ Bn, AGR (%), CAGR (%))
Table 47 Asia-Pacific Hydrogen Vehicle Market by Country, 2024-2034 (US$ Bn, AGR (%), CAGR (%))
Table 48 Asia-Pacific Hydrogen Vehicle Market by Technology Type, 2024-2034 (US$ Bn, AGR (%), CAGR (%))
Table 49 Asia-Pacific Hydrogen Vehicle Market by Range, 2024-2034 (US$ Bn, AGR (%), CAGR (%))
Table 50 Asia-Pacific Hydrogen Vehicle Market by Type, 2024-2034 (US$ Bn, AGR (%), CAGR (%))
Table 51 Asia-Pacific Hydrogen Vehicle Market by Distribution Channel, 2024-2034 (US$ Bn, AGR (%), CAGR (%))
Table 52 China Hydrogen Vehicle Market by Value, 2024-2034 (US$ Bn, AGR (%), CAGR (%))
Table 53 India Hydrogen Vehicle Market by Value, 2024-2034 (US$ Bn, AGR (%), CAGR (%))
Table 54 Japan Hydrogen Vehicle Market by Value, 2024-2034 (US$ Bn, AGR (%), CAGR (%))
Table 55 South Korea Hydrogen Vehicle Market by Value, 2024-2034 (US$ Bn, AGR (%), CAGR (%))
Table 56 Sale of Vehicle in Australia (2023)
Table 57 Australia Hydrogen Vehicle Market by Value, 2024-2034 (US$ Bn, AGR (%), CAGR (%))
Table 58 Rest of Asia-Pacific Hydrogen Vehicle Market by Value, 2024-2034 (US$ Bn, AGR (%), CAGR (%))
Table 59 Middle East & Africa Hydrogen Vehicle Market by Value, 2024-2034 (US$ Bn, AGR (%), CAGR (%))
Table 60 Middle East & Africa Hydrogen Vehicle Market by Country, 2024-2034 (US$ Bn, AGR (%), CAGR (%))
Table 61 Middle East & Africa Hydrogen Vehicle Market by Technology Type, 2024-2034 (US$ Bn, AGR (%), CAGR (%))
Table 62 Middle East & Africa Hydrogen Vehicle Market by Range, 2024-2034 (US$ Bn, AGR (%), CAGR (%))
Table 63 Middle East & Africa Hydrogen Vehicle Market by Type, 2024-2034 (US$ Bn, AGR (%), CAGR (%))
Table 64 Middle East & Africa Hydrogen Vehicle Market by Distribution Channel, 2024-2034 (US$ Bn, AGR (%), CAGR (%))
Table 65 GCC Hydrogen Vehicle Market by Value, 2024-2034 (US$ Bn, AGR (%), CAGR (%))
Table 66 South Africa Hydrogen Vehicle Market by Value, 2024-2034 (US$ Bn, AGR (%), CAGR (%))
Table 67 Rest of Middle East & Africa Hydrogen Vehicle Market by Value, 2024-2034 (US$ Bn, AGR (%), CAGR (%))
Table 68 Latin America Hydrogen Vehicle Market by Value, 2024-2034 (US$ Bn, AGR (%), CAGR (%))
Table 69 Latin America Hydrogen Vehicle Market by Country, 2024-2034 (US$ Bn, AGR (%), CAGR (%))
Table 70 Latin America Hydrogen Vehicle Market by Technology Type, 2024-2034 (US$ Bn, AGR (%), CAGR (%))
Table 71 Latin America Hydrogen Vehicle Market by Range, 2024-2034 (US$ Bn, AGR (%), CAGR (%))
Table 72 Latin America Hydrogen Vehicle Market by Type, 2024-2034 (US$ Bn, AGR (%), CAGR (%))
Table 73 Latin America Hydrogen Vehicle Market by Distribution Channel, 2024-2034 (US$ Bn, AGR (%), CAGR (%))
Table 74 Brazil Hydrogen Vehicle Market by Value, 2024-2034 (US$ Bn, AGR (%), CAGR (%))
Table 75 Mexico Hydrogen Vehicle Market by Value, 2024-2034 (US$ Bn, AGR (%), CAGR (%))
Table 76 Rest of Latin America Hydrogen Vehicle Market by Value, 2024-2034 (US$ Bn, AGR (%), CAGR (%))
Table 77 Strategic Outlook - Contract
Table 78 Toyota Motor Corporation: Key Details, (CEO, HQ, Revenue, Founded, No. of Employees, Company Type, Website, Business Segment)
Table 79 Toyota Motor Corporation: Product Benchmarking
Table 80 Toyota Motor Corporation: Strategic Outlook
Table 81 Hyundai Motor Company: Key Details, (CEO, HQ, Revenue, Founded, No. of Employees, Company Type, Website, Business Segment)
Table 82 Hyundai Motor Company: Product Benchmarking
Table 83 Hyundai Motor Company: Strategic Outlook
Table 84 Mercedes-Benz Group AG: Key Details, (CEO, HQ, Revenue, Founded, No. of Employees, Company Type, Website, Business Segment)
Table 85 Mercedes-Benz Group AG: Product Benchmarking
Table 86 Ballard Power Systems Inc: Key Details, (CEO, HQ, Revenue, Founded, No. of Employees, Company Type, Website, Business Segment)
Table 87 Ballard Power Systems Inc: Product Benchmarking
Table 88 Ballard Power Systems Inc: Strategic Outlook
Table 89 General Motors Company: Key Details, (CEO, HQ, Revenue, Founded, No. of Employees, Company Type, Website, Business Segment)
Table 90 General Motors Company: Product Benchmarking
Table 91 General Motors Company: Strategic Outlook
Table 92 Bayerische Motoren Werke AG: Key Details, (CEO, HQ, Revenue, Founded, No. of Employees, Company Type, Website, Business Segment)
Table 93 Bayerische Motoren Werke AG: Product Benchmarking
Table 94 Riversimple: Key Details, (CEO, HQ, Revenue, Founded, No. of Employees, Company Type, Website, Business Segment)
Table 95 Riversimple: Product Benchmarking
Table 96 Riversimple: Strategic Outlook
Table 97 Audi AG: Key Details, (CEO, HQ, Revenue, Founded, No. of Employees, Company Type, Website, Business Segment)
Table 98 Audi AG: Product Benchmarking
Table 99 Audi AG: Strategic Outlook
Table 100 Hino Motors, Ltd.: Key Details, (CEO, HQ, Revenue, Founded, No. of Employees, Company Type, Website, Business Segment)
Table 101 Hino Motors, Ltd.: Product Benchmarking
Table 102 Hino Motors, Ltd.: Strategic Outlook
Table 103 Cummins Inc: Key Details, (CEO, HQ, Revenue, Founded, No. of Employees, Company Type, Website, Business Segment)
Table 104 Cummins Inc: Product Benchmarking
Table 105 Cummins Inc: Strategic Outlook
Table 106 Alstom SA: Key Details, (CEO, HQ, Revenue, Founded, No. of Employees, Company Type, Website, Business Segment)
Table 107 Alstom SA: Product Benchmarking
Table 108 Alstom SA: Strategic Outlook
Table 109 MAN Truck & Bus SE: Key Details, (CEO, HQ, Revenue, Founded, No. of Employees, Company Type, Website, Business Segment)
Table 110 MAN Truck & Bus SE: Product Benchmarking
Table 111 Symbio: Key Details, (CEO, HQ, Revenue, Founded, No. of Employees, Company Type, Website, Business Segment)
Table 112 Symbio: Product Benchmarking
Table 113 Symbio: Strategic Outlook
Table 114 Hyundai Mobis: Key Details, (CEO, HQ, Revenue, Founded, No. of Employees, Company Type, Website, Business Segment)
Table 115 Hyundai Mobis: Product Benchmarking
Table 116 Hyundai Mobis: Strategic Outlook
Table 117 Nikola Corporation: Key Details, (CEO, HQ, Revenue, Founded, No. of Employees, Company Type, Website, Business Segment)
Table 118 Nikola Corporation: Product Benchmarking
Table 119 Nikola Corporation: Strategic Outlook
List of Figures
Figure 1 Hydrogen Vehicle Market Segmentation
Figure 2 Hydrogen Vehicle Market by Technology Type: Market Attractiveness Index
Figure 3 Hydrogen Vehicle Market by Range: Market Attractiveness Index
Figure 4 Hydrogen Vehicle Market by Type: Market Attractiveness Index
Figure 5 Hydrogen Vehicle Market by Distribution Channel: Market Attractiveness Index
Figure 6 Hydrogen Vehicle Market Attractiveness Index by Region
Figure 7 Hydrogen Vehicle Market: Market Dynamics
Figure 8 Global Passenger Electric Vehicle Sales
Figure 9 Hydrogen Vehicle Market: Porter’s Five Forces Analysis
Figure 10 Global Hydrogen Vehicle Market Share Forecast by COVID, 2024-2034 (%)
Figure 11 Global Hydrogen Vehicle Market by Region, 2024-2034 (US$ Bn, AGR (%)) (V-Shaped Recovery Scenario)
Figure 12 Global Hydrogen Vehicle Market by Region, 2024-2034 (US$ Bn, AGR (%)) (U-Shaped Recovery Scenario)
Figure 13 Global Hydrogen Vehicle Market by Region, 2024-2034 (US$ Bn, AGR (%)) (W-Shaped Recovery Scenario)
Figure 14 Global Hydrogen Vehicle Market by Region, 2024-2034 (US$ Bn, AGR (%)) (L-Shaped Recovery Scenario)
Figure 15 Hydrogen Vehicle Market: PEST Analysis
Figure 16 Hydrogen Vehicle Market by Technology Type: Market Attractiveness Index
Figure 17 Global Hydrogen Vehicle Market by Technology Type, 2024-2034 (US$ Bn, AGR (%))
Figure 18 Hydrogen Vehicle Market Share Forecast by Technology Type, 2024, 2029, 2034 (%)
Figure 19 Fuel Cell Electric Vehicles (FCEVs) Market by Region, 2024-2034 (US$ Bn, AGR (%))
Figure 20 Fuel Cell Electric Vehicles (FCEVs) Market Share Forecast by Region, 2024 & 2034 (%)
Figure 21 Hydrogen Internal Combustion Engine Vehicles (HICEVs) Market by Region, 2024-2034 (US$ Bn, AGR (%))
Figure 22 Hydrogen Internal Combustion Engine Vehicles (HICEVs) Market Share Forecast by Region, 2024 & 2034 (%)
Figure 23 Hydrogen Vehicle Market by Range: Market Attractiveness Index
Figure 24 Global Hydrogen Vehicle Market by Range, 2024-2034 (US$ Bn, AGR (%))
Figure 25 Hydrogen Vehicle Market Share Forecast by Range, 2024, 2029, 2034 (%)
Figure 26 Short Range Market by Region, 2024-2034 (US$ Bn, AGR (%))
Figure 27 Short Range Market Share Forecast by Region, 2024 & 2034 (%)
Figure 28 Medium Range Market by Region, 2024-2034 (US$ Bn, AGR (%))
Figure 29 Medium Range Market Share Forecast by Region, 2024 & 2034 (%)
Figure 30 Long Range Market by Region, 2024-2034 (US$ Bn, AGR (%))
Figure 31 Long Range Market Share Forecast by Region, 2024 & 2034 (%)
Figure 32 Hydrogen Vehicle Market by Type: Market Attractiveness Index
Figure 33 Global Hydrogen Vehicle Market by Type, 2024-2034 (US$ Bn, AGR (%))
Figure 34 Hydrogen Vehicle Market Share Forecast by Type, 2024, 2029, 2034 (%)
Figure 35 Passenger Vehicles Market by Region, 2024-2034 (US$ Bn, AGR (%))
Figure 36 Passenger Vehicles Market Share Forecast by Region, 2024 & 2034 (%)
Figure 37 Commercial Vehicles Market by Region, 2024-2034 (US$ Bn, AGR (%))
Figure 38 Commercial Vehicles Market Share Forecast by Region, 2024 & 2034 (%)
Figure 39 Public Transport Vehicles Market by Region, 2024-2034 (US$ Bn, AGR (%)
Figure 40 Public Transport Vehicles Market Share Forecast by Region, 2024 & 2034 (%)
Figure 41 Other Vehicle Type Market by Region, 2024-2034 (US$ Bn, AGR (%))
Figure 42 Other Vehicle Type Market Share Forecast by Region, 2024 & 2034 (%)
Figure 43 Hydrogen Vehicle Market by Distribution Channel: Market Attractiveness Index
Figure 44 Global Hydrogen Vehicle Market by Distribution Channel, 2024-2034 (US$ Bn, AGR (%))
Figure 45 Hydrogen Vehicle Market Share Forecast by Distribution Channel, 2024, 2029, 2034 (%)
Figure 46 Direct Sales (OEMs) Market by Region, 2024-2034 (US$ Bn, AGR (%))
Figure 47 Direct Sales (OEMs) Market Share Forecast by Region, 2024 & 2034 (%)
Figure 48 Dealerships Market by Region, 2024-2034 (US$ Bn, AGR (%))
Figure 49 Dealerships Market Share Forecast by Region, 2024 & 2034 (%)
Figure 50 Fleet Leasing Companies Market by Region, 2024-2034 (US$ Bn, AGR (%))
Figure 51 Fleet Leasing Companies Market Share Forecast by Region, 2024 & 2034 (%)
Figure 52 Online Platforms Market by Region, 2024-2034 (US$ Bn, AGR (%))
Figure 53 Online Platforms Market Share Forecast by Region, 2024 & 2034 (%)
Figure 54 Other Distribution Channels Market by Region, 2024-2034 (US$ Bn, AGR (%))
Figure 55 Other Distribution Channel Market Share Forecast by Region, 2024 & 2034 (%)
Figure 56 Hydrogen Vehicle Market Forecast by Region 2024 and 2034 (Revenue, CAGR%)
Figure 57 Hydrogen Vehicle Market Share Forecast by Region 2024, 2029, 2034 (%)
Figure 58 Global Hydrogen Vehicle Market by Region, 2024-2034 (US$ Bn, AGR (%))
Figure 59 North America Hydrogen Vehicle Market Attractiveness Index
Figure 60 North America Hydrogen Vehicle Market by Region, 2024, 2029 & 2034 (US$ Billion)
Figure 61 North America Hydrogen Vehicle Market by Value, 2024-2034 (US$ Bn, AGR (%))
Figure 62 North America Hydrogen Vehicle Market by Country, 2024-2034 (US$ Bn, AGR (%))
Figure 63 North America Hydrogen Vehicle Market Share Forecast by Country, 2024 & 2034 (%)
Figure 64 North America Hydrogen Vehicle Market by Technology Type, 2024-2034 (US$ Bn, AGR (%))
Figure 65 North America Hydrogen Vehicle Market Share Forecast Technology Type, 2024 & 2034 (%)
Figure 66 North America Hydrogen Vehicle Market by Range, 2024-2034 (US$ Bn, AGR (%))
Figure 67 North America Hydrogen Vehicle Market Share Forecast by Range, 2024 & 2034 (%)
Figure 68 North America Hydrogen Vehicle Market by Type, 2024-2034 (US$ Bn, AGR (%))
Figure 69 North America Hydrogen Vehicle Market Share Forecast by Type, 2024 & 2034 (%)
Figure 70 North America Hydrogen Vehicle Market by Distribution Channel, 2024-2034 (US$ Bn, AGR (%))
Figure 71 North America Hydrogen Vehicle Market Share Forecast by Distribution Channel, 2024 & 2034 (%)
Figure 72 US Hydrogen Vehicle Market by Value, 2024-2034 (US$ Bn, AGR (%))
Figure 73 Canada Hydrogen Vehicle Market by Value, 2024-2034 (US$ Bn, AGR (%))
Figure 74 Europe Hydrogen Vehicle Market Attractiveness Index
Figure 75 Europe Hydrogen Vehicle Market by Region, 2024, 2029 & 2034 (US$ Billion)
Figure 76 Europe Hydrogen Vehicle Market by Value, 2024-2034 (US$ Bn, AGR (%))
Figure 77 Europe Hydrogen Vehicle Market by Country, 2024-2034 (US$ Bn, AGR (%))
Figure 78 Europe Hydrogen Vehicle Market Share Forecast by Country, 2024 & 2034 (%)
Figure 79 Europe Hydrogen Vehicle Market by Technology Type, 2024-2034 (US$ Bn, AGR (%))
Figure 80 Europe Hydrogen Vehicle Market Share Forecast Technology Type, 2024 & 2034 (%)
Figure 81 Europe Hydrogen Vehicle Market by Range, 2024-2034 (US$ Bn, AGR (%))
Figure 82 Europe Hydrogen Vehicle Market Share Forecast by Range, 2024 & 2034 (%)
Figure 83 Europe Hydrogen Vehicle Market by Type, 2024-2034 (US$ Bn, AGR (%))
Figure 84 Europe Hydrogen Vehicle Market Share Forecast by Type, 2024 & 2034 (%)
Figure 85 Europe Hydrogen Vehicle Market by Distribution Channel, 2024-2034 (US$ Bn, AGR (%))
Figure 86 Europe Hydrogen Vehicle Market Share Forecast by Distribution Channel, 2024 & 2034 (%)
Figure 87 Germany Hydrogen Vehicle Market by Value, 2024-2034 (US$ Bn, AGR (%))
Figure 88 UK Hydrogen Vehicle Market by Value, 2024-2034 (US$ Bn, AGR (%))
Figure 89 France Hydrogen Vehicle Market by Value, 2024-2034 (US$ Bn, AGR (%))
Figure 90 Italy Hydrogen Vehicle Market by Value, 2024-2034 (US$ Bn, AGR (%))
Figure 91 Spain Hydrogen Vehicle Market by Value, 2024-2034 (US$ Bn, AGR (%))
Figure 92 Rest of Europe Hydrogen Vehicle Market by Value, 2024-2034 (US$ Bn, AGR (%))
Figure 93 Asia-Pacific Hydrogen Vehicle Market Attractiveness Index
Figure 94 Asia-Pacific Hydrogen Vehicle Market by Region, 2024, 2029 & 2034 (US$ Billion)
Figure 95 Asia-Pacific Hydrogen Vehicle Market by Value, 2024-2034 (US$ Bn, AGR (%))
Figure 96 Asia-Pacific Hydrogen Vehicle Market by Country, 2024-2034 (US$ Bn, AGR (%))
Figure 97 Asia-Pacific Hydrogen Vehicle Market Share Forecast by Country, 2024 & 2034 (%)
Figure 98 Asia-Pacific Hydrogen Vehicle Market by Technology Type, 2024-2034 (US$ Bn, AGR (%))
Figure 99 Asia-Pacific Hydrogen Vehicle Market Share Forecast Technology Type, 2024 & 2034 (%)
Figure 100 Asia-Pacific Hydrogen Vehicle Market by Range, 2024-2034 (US$ Bn, AGR (%))
Figure 101 Asia-Pacific Hydrogen Vehicle Market Share Forecast by Range, 2024 & 2034 (%)
Figure 102 Asia-Pacific Hydrogen Vehicle Market by Type, 2024-2034 (US$ Bn, AGR (%))
Figure 103 Asia-Pacific Hydrogen Vehicle Market Share Forecast by Type, 2024 & 2034 (%)
Figure 104 Asia-Pacific Hydrogen Vehicle Market by Distribution Channel, 2024-2034 (US$ Bn, AGR (%))
Figure 105 Asia-Pacific Hydrogen Vehicle Market Share Forecast by Distribution Channel, 2024 & 2034 (%)
Figure 106 China Hydrogen Vehicle Market by Value, 2024-2034 (US$ Bn, AGR (%))
Figure 107 India Hydrogen Vehicle Market by Value, 2024-2034 (US$ Bn, AGR (%))
Figure 108 Japan Hydrogen Vehicle Market by Value, 2024-2034 (US$ Bn, AGR (%))
Figure 109 South Korea Hydrogen Vehicle Market by Value, 2024-2034 (US$ Bn, AGR (%))
Figure 110 Australia Hydrogen Vehicle Market by Value, 2024-2034 (US$ Bn, AGR (%))
Figure 111 Rest of Asia-Pacific Hydrogen Vehicle Market by Value, 2024-2034 (US$ Bn, AGR (%))
Figure 112 Middle East and Africa Hydrogen Vehicle Market Attractiveness Index
Figure 113 Middle East and Africa Hydrogen Vehicle Market by Region, 2024, 2029 & 2034 (US$ Billion)
Figure 114 Middle East & Africa Hydrogen Vehicle Market by Value, 2024-2034 (US$ Bn, AGR (%))
Figure 115 Middle East & Africa Hydrogen Vehicle Market by Country, 2024-2034 (US$ Bn, AGR (%))
Figure 116 Middle East and Africa Hydrogen Vehicle Market Share Forecast by Country, 2024 & 2034 (%)
Figure 117 Middle East & Africa Hydrogen Vehicle Market by Technology Type, 2024-2034 (US$ Bn, AGR (%))
Figure 118 Middle East and Africa Hydrogen Vehicle Market Share Forecast Technology Type, 2024 & 2034 (%)
Figure 119 Middle East & Africa Hydrogen Vehicle Market by Range, 2024-2034 (US$ Bn, AGR (%))
Figure 120 Middle East and Africa Hydrogen Vehicle Market Share Forecast by Range, 2024 & 2034 (%)
Figure 121 Middle East & Africa Hydrogen Vehicle Market by Type, 2024-2034 (US$ Bn, AGR (%))
Figure 122 Middle East and Africa Hydrogen Vehicle Market Share Forecast by Type, 2024 & 2034 (%)
Figure 123 Middle East & Africa Hydrogen Vehicle Market by Distribution Channel, 2024-2034 (US$ Bn, AGR (%))
Figure 124 Middle East and Africa Hydrogen Vehicle Market Share Forecast by Distribution Channel, 2024 & 2034 (%)
Figure 125 GCC Hydrogen Vehicle Market by Value, 2024-2034 (US$ Bn, AGR (%))
Figure 126 South Africa Hydrogen Vehicle Market by Value, 2024-2034 (US$ Bn, AGR (%))
Figure 127 Rest of Middle East & Africa Hydrogen Vehicle Market by Value, 2024-2034 (US$ Bn, AGR (%))
Figure 128 Latin America Hydrogen Vehicle Market Attractiveness Index
Figure 129 Latin America Hydrogen Vehicle Market by Region, 2024, 2029 & 2034 (US$ Billion)
Figure 130 Latin America Hydrogen Vehicle Market by Value, 2024-2034 (US$ Bn, AGR (%))
Figure 131 Latin America Hydrogen Vehicle Market by Country, 2024-2034 (US$ Bn, AGR (%))
Figure 132 Latin America Hydrogen Vehicle Market Share Forecast by Country, 2024 & 2034 (%)
Figure 133 Latin America Hydrogen Vehicle Market by Technology Type, 2024-2034 (US$ Bn, AGR (%))
Figure 134 Latin America Hydrogen Vehicle Market Share Forecast Technology Type, 2024 & 2034 (%)
Figure 135 Latin America Hydrogen Vehicle Market by Range, 2024-2034 (US$ Bn, AGR (%))
Figure 136 Latin America Hydrogen Vehicle Market Share Forecast by Range, 2024 & 2034 (%)
Figure 137 Latin America Hydrogen Vehicle Market by Type, 2024-2034 (US$ Bn, AGR (%))
Figure 138 Latin America Hydrogen Vehicle Market Share Forecast by Type, 2024 & 2034 (%)
Figure 139 Latin America Hydrogen Vehicle Market by Distribution Channel, 2024-2034 (US$ Bn, AGR (%))
Figure 140 Latin America Hydrogen Vehicle Market Share Forecast by Distribution Channel, 2024 & 2034 (%)
Figure 141 Brazil Hydrogen Vehicle Market by Value, 2024-2034 (US$ Bn, AGR (%))
Figure 142 Mexico Hydrogen Vehicle Market by Value, 2024-2034 (US$ Bn, AGR (%))
Figure 143 Rest of Latin America Hydrogen Vehicle Market by Value, 2024-2034 (US$ Bn, AGR (%))
Figure 144 Hydrogen Vehicle Market: Company Share, 2023
Figure 145 Toyota Motor Corporation.: Net Revenue, 2019-2023 (US$ Million, AGR%)
Figure 146 Toyota Motor Corporation.: R&D, 2019-2023 (US$ Million, AGR%)
Figure 147 Toyota Motor Corporation.: Regional Revenue Share, 2023 (%)
Figure 148 Toyota Motor Corporation.: Business Segment Revenue Share, 2023 (%)
Figure 149 Hyundai Motor Company.: Net Revenue, 2019-2023 (US$ Million, AGR%)
Figure 150 Hyundai Motor Company.: R&D, 2019-2023 (US$ Million, AGR%)
Figure 151 Hyundai Motor Company.: Regional Revenue Share, 2023 (%)
Figure 152 Hyundai Motor Company.: Business Segment Revenue Share, 2023 (%)
Figure 153 Mercedes-Benz Group AG.: Net Revenue, 2019-2023 (US$ Million, AGR%)
Figure 154 Mercedes-Benz Group AG.: R&D, 2019-2023 (US$ Million, AGR%)
Figure 155 Mercedes-Benz Group AG.: Regional Revenue Share, 2023 (%)
Figure 156 Mercedes-Benz Group AG.: Business Segment Revenue Share, 2023 (%)
Figure 157 Ballard Power Systems Inc.: Net Revenue, 2019-2023 (US$ Million, AGR%)
Figure 158 Ballard Power Systems Inc.: R&D, 2019-2023 (US$ Million, AGR%)
Figure 159 Ballard Power Systems Inc.: Regional Revenue Share, 2023 (%)
Figure 160 General Motors Company.: Net Revenue, 2019-2023 (US$ Million, AGR%)
Figure 161 General Motors Company.: R&D, 2019-2023 (US$ Million, AGR%)
Figure 162 General Motors Company.: Regional Revenue Share, 2023 (%)
Figure 163 General Motors Company.: Business Segment Revenue Share, 2023 (%)
Figure 164 Bayerische Motoren Werke AG.: Net Revenue, 2019-2023 (US$ Million, AGR%)
Figure 165 Bayerische Motoren Werke AG.: R&D, 2019-2023 (US$ Million, AGR%)
Figure 166 Bayerische Motoren Werke AG.: Business Segment Revenue Share, 2023 (%)
Figure 167 Audi AG.: Net Revenue, 2019-2023 (US$ Million, AGR%)
Figure 168 Audi AG.: R&D, 2019-2023 (US$ Million, AGR%)
Figure 169 Audi AG.: Business Segment Revenue Share, 2023 (%)
Figure 170 Hino Motors, Ltd..: Net Revenue, 2019-2023 (US$ Million, AGR%)
Figure 171 Hino Motors, Ltd..: R&D, 2019-2023 (US$ Million, AGR%)
Figure 172 Hino Motors, Ltd..: Regional Revenue Share, 2023 (%)
Figure 173 Hino Motors, Ltd..: Business Segment Revenue Share, 2023 (%)
Figure 174 Cummins Inc.: Net Revenue, 2019-2023 (US$ Million, AGR%)
Figure 175 Cummins Inc.: R&D, 2019-2023 (US$ Million, AGR%)
Figure 176 Alstom SA.: Net Revenue, 2019-2023 (US$ Million, AGR%)
Figure 177 Alstom SA.: R&D, 2019-2023 (US$ Million, AGR%)
Figure 178 MAN Truck & Bus SE.: Net Revenue, 2019-2023 (US$ Million, AGR%)
Figure 179 MAN Truck & Bus SE.: R&D, 2019-2023 (US$ Million, AGR%)
Figure 180 MAN Truck & Bus SE.: Business Segment Revenue Share, 2023 (%)
Figure 181 Hyundai Mobis.: Net Revenue, 2019-2023 (US$ Million, AGR%)
Figure 182 Hyundai Mobis.: R&D, 2019-2023 (US$ Million, AGR%)
Figure 183 Hyundai Mobis.: Regional Revenue Share, 2023 (%)
Figure 184 Hyundai Mobis.: Business Segment Revenue Share, 2023 (%)
Figure 185 Nikola Corporation.: Net Revenue, 2019-2023 (US$ Million, AGR%)
Figure 186 Nikola Corporation.: R&D, 2019-2023 (US$ Million, AGR%)
ページTOPに戻る
よくあるご質問
Visiongain社はどのような調査会社ですか?
英国の調査会社ヴィジョンゲイン社(Visiongain)は、通信とエネルギーのほか、自動車や化学・医薬品、金属など、広範な市場を対象に調査を行っています。自動車市場については、市場全般に関する調査のほ... もっと見る
調査レポートの納品までの日数はどの程度ですか?
在庫のあるものは速納となりますが、平均的には 3-4日と見て下さい。
但し、一部の調査レポートでは、発注を受けた段階で内容更新をして納品をする場合もあります。
発注をする前のお問合せをお願いします。
注文の手続きはどのようになっていますか?
1)お客様からの御問い合わせをいただきます。
2)見積書やサンプルの提示をいたします。
3)お客様指定、もしくは弊社の発注書をメール添付にて発送してください。
4)データリソース社からレポート発行元の調査会社へ納品手配します。
5) 調査会社からお客様へ納品されます。最近は、pdfにてのメール納品が大半です。
お支払方法の方法はどのようになっていますか?
納品と同時にデータリソース社よりお客様へ請求書(必要に応じて納品書も)を発送いたします。
お客様よりデータリソース社へ(通常は円払い)の御振り込みをお願いします。
請求書は、納品日の日付で発行しますので、翌月最終営業日までの当社指定口座への振込みをお願いします。振込み手数料は御社負担にてお願いします。
お客様の御支払い条件が60日以上の場合は御相談ください。
尚、初めてのお取引先や個人の場合、前払いをお願いすることもあります。ご了承のほど、お願いします。
データリソース社はどのような会社ですか?
当社は、世界各国の主要調査会社・レポート出版社と提携し、世界各国の市場調査レポートや技術動向レポートなどを日本国内の企業・公官庁及び教育研究機関に提供しております。
世界各国の「市場・技術・法規制などの」実情を調査・収集される時には、データリソース社にご相談ください。
お客様の御要望にあったデータや情報を抽出する為のレポート紹介や調査のアドバイスも致します。
|
|

