水素燃料電池自動車(FCVs)市場レポート:2023-2033
Hydrogen Fuel Cell Vehicles (FCVs) Market Report 2023-2033
レポート詳細
水素燃料電池自動車(FCVs)市場レポート 2023-2033 : 本レポートは、業界とその基礎となる力学をよりよく理解したい場合、新たな収益ポケットを目指す大手企業にとって貴重なものとな... もっと見る
※上記価格は部署ライセンス(Departmental licence)価格です。
その他の価格についてはデータリソースまでお問合せください。
日本語のページは自動翻訳を利用し作成しています。
実際のレポートは英文のみでご納品いたします。
サマリー
レポート詳細
水素燃料電池自動車(FCVs)市場レポート 2023-2033: 本レポートは、業界とその基礎となる力学をよりよく理解したい場合、新たな収益ポケットを目指す大手企業にとって貴重なものとなります。また、異業種への進出や新地域での既存事業の拡大を目指す企業にとっても有益なレポートです。
環境規制の強化、技術の進歩、持続可能な輸送手段への需要の高まり
水素燃料電池自動車市場は、環境規制の強化、技術の進歩、持続可能な輸送手段への需要の高まりなど、さまざまな要因から大きな成長を遂げています。現在、市場はトヨタ、ヒュンダイ、ホンダなど少数の大手企業によって支配されていますが、市場の拡大に伴い、新規参入企業が影響を与える可能性があります。
政府のイニシアティブや水素インフラへの投資も、市場の成長に大きな役割を果たすでしょう。特に欧州、アジア、カリフォルニアなど、水素経済の確立に向けてすでに大きな取り組みが行われている地域では、その傾向が顕著です。水素燃料の入手可能性と価格、そして燃料補給ステーションなどの支援インフラの整備は、市場の成功に欠かせないものとなるでしょう。しかし、高コスト、航続距離の制限、社会的認知度の低さなど、解決すべき課題もあります。
全体として、水素燃料電池自動車市場は、従来のガソリン自動車に代わる持続可能な選択肢を提供し、輸送業界に革命をもたらす可能性を持っています。継続的な技術の進歩と政府および業界関係者の支援により、この市場は今後数年間で大きく成長するものと思われます。
マーケットリサーチレポートを購入する前に、どのような質問をするべきか?
- 水素燃料電池車(FCVs)市場はどのように進化しているのか?
- 水素燃料電池車(FCVs)市場を牽引し、抑制しているものは何か?
- 水素燃料電池車(FCVs)の各サブマーケットセグメントは予測期間中にどのように成長し、これらのサブマーケットが2033年に占める収益はどの程度になるのか?
- 2023年から2033年にかけて、各水素燃料電池車(FCVs)サブマーケットの市場シェアはどのように推移するのか?
- 2023年から2033年にかけて、市場全体の主な牽引役となるのは何か?
- 主要な水素燃料電池車(FCVs)市場はマクロ経済ダイナミクスに概ね追随するのか、それとも個々の国別市場が他を凌駕するのか?
- 2033年までに各国市場のシェアはどのように変化し、2033年に市場をリードするのはどの地域か?
- 主要プレイヤーは誰で、予測期間中の見通しはどうなっているのか?
- これらの主要企業の水素燃料電池車(FCVs)プロジェクトはどのようなものか?
- 2023年から2033年の間に、業界はどのように進化していくのか?現在および今後10年間に行われる水素燃料電池車(FCVs)プロジェクトには、どのような意味があるのか?
- 水素燃料電池自動車(FCVs)市場をさらに拡大するために、製品の商業化の必要性は高いか?
- 水素燃料電池自動車(FCVs)市場の方向性と、市場の最前線に立つためにはどうしたらよいか?
- 新製品やサービスラインに対する最適な投資オプションは何か?
- 企業を新たな成長軌道に乗せ、C-suiteに移行させるための重要な展望とは?
このことが、現在、そして今後10年間の水素燃料電池車(FCVs)市場にどのような影響を与えるかを知る必要があります:
- 331ページにわたる本レポートでは、112の表と170のチャート/グラフを独占的に提供します。
- 本レポートでは、業界における主要な収益性の高い分野を取り上げており、今すぐその分野をターゲットにすることができます。
- 世界、地域、国の売上と成長に関する詳細な分析が含まれています。
- 競合他社が成功した主要なトレンド、変化、収益予測をハイライトしています。
本レポートは、水素燃料電池自動車(FCVs)市場が今後10年間でどのように発展するか、またCOVID-19の景気後退やバウンスの変動に合わせて、今日あなたにお伝えします。この市場は、過去10年間のどの時点よりも今が重要である。
2033年までの予測やその他の分析により、商業的な展望を明らかにする。
- 今回の調査では、2033年までの収益予測に加え、直近の実績、成長率、市場シェアも掲載しています。
- ビジネスの展望や展開など、独自の分析がご覧いただけます。
- 定性的分析(市場力学、促進要因、機会、阻害要因、課題など)、コスト構造、水素燃料電池車(FCVs)価格上昇の影響、最近の動向などをご覧いただけます。
本レポートでは、COVID-19が業界や貴社にどのような影響を与えるかについて、データ分析および貴重な知見を提供しています。COVID-19の4つの回収パターン、すなわち「V」「L」「W」「U」の回収パターンとその影響について考察しています。
報告書の対象セグメント
技術別市場セグメント
- プロトン交換膜(PEM)
- アルカリ燃料電池(AFCs)
- 固体酸化物形燃料電池(SOFCs)
- ダイレクトメタノール型燃料電池(DMFCs)
車両タイプ別セグメント
- 乗用車
- 商用車
- マテリアルハンドリング車
- 軍用車
- その他の車両
コンポーネント別セグメント
- 燃料電池スタック
- 水素タンク
- バッテリー
- 電気モーター
- パワーエレクトロニクス
- その他部品
世界市場全体およびセグメントの収益予測に加え、4地域および主要20カ国市場の収益予測も掲載しています:
北米
- アメリカ
- カナダ
欧州
- ドイツ
- スペイン
- イギリス
- フランス
- イタリア
- その他の欧州地域
アジア太平洋地域
- 中国
- 日本
- インド
- オーストラリア
- 韓国
- その他のアジア太平洋地域
ラテンアメリカ
- ブラジル
- メキシコ
- その他のラテンアメリカ
中近東・アフリカ
- GCC
- 南アフリカ
- その他の中東・アフリカ地域
水素燃料電池自動車(FCVs)市場の2023年から2033年にかけての主要企業のプロファイルと、これらの企業のこのセグメントに焦点を当てたいくつかの企業についても報告しています。
主要企業と市場成長の可能性
・ Air Liquide
・ Ballard Power Systems Inc.
・ Bayerische Motoren Werke AG
・ Cummins Inc.
・ General Motors Company
・ Honda Motor Co., Ltd.
・ Horizon Fuel Cell Technologies
・ Hyundai Motor Company
・ Linde plc
・ Mercedes-Benz Group AG
・ Nel Hydrogen
・ Nikola Corporation
・ Plug Power Inc.
・ Riversimple
・ Toyota Motor Corporation
水素燃料電池自動車(FCVs)市場の世界全体の収益、金額ベースで2023年から2033年まで、市場は2023年に104億6000万米ドルを突破すると当作品は算出しました。2033年まで収益が大きく伸びると予測しています。当社の調査では、最も大きな可能性を秘めた企業を特定しています。彼らの能力、進歩、商業的な展望を知ることで、先を行くことができます。
水素燃料電池自動車(FCVs)市場、2023年から2033年までのレポートはどのように役立つのでしょうか?
要約すると、330ページ以上のレポートでは、以下のような知識を得ることができます:
- 水素燃料電池自動車(FCVs)市場の2033年までの収益予測、技術、車両タイプ、コンポーネントの各予測を世界および地域レベルで掲載 - 業界の展望を発見し、投資や収益に最も有利な場所を見つけることができます。
- 4つの地域と20の主要国市場の2033年までの収益予測 - 水素燃料電池自動車(FCVs)市場、2023年から2033年の北米、欧州、アジア太平洋、ラテンアメリカ、中東&アフリカの市場予測をご覧いただけます。また、米国、カナダ、ブラジル、ドイツ、フランス、英国、イタリア、中国、インド、日本、オーストラリアなどの著名な経済圏の市場も予測されています。
- 水素燃料電池車(FCVs)市場に参入する主要企業15社の会社概要を含む、2023年から2033年までの既存企業および参入を目指す企業の展望。
独自の予測による定量・定性分析をご覧いただけます。私たちのレポートだけが持つ情報を入手し、貴重なビジネスインテリジェンスとして情報を得ることができます。
他にはない情報
私たちの新しいレポートがあれば、知識に遅れをとったり、チャンスを逃したりする可能性は低くなります。私たちの仕事があなたの研究、分析、意思決定にどのように役立つかをご覧ください。Visiongainの調査は、水素燃料電池車(FCVs)市場、2023年から2033年、市場をリードする企業の商業分析を必要とするすべての人のためのものです。データ、トレンド、予測を見つけることができます。
ページTOPに戻る
目次
目次
1 レポートの概要
1.1 調査の目的
1.2 水素燃料電池自動車(FCVs)市場の紹介
1.3 本レポートが提供するもの
1.4 本レポートを読むべき理由
1.5 本分析レポートが回答する主な質問事項
1.6 本レポートは誰向けか?
1.7 調査方法
1.7.1 市場の定義
1.7.2 市場評価・予測手法
1.7.3 データの検証
1.7.3.1 プライマリーリサーチ
1.7.3.2 セカンダリーリサーチ
1.8 よくある質問(FAQ)
1.9 関連するVisiongainのレポート
1.10 Visiongainについて
2 エグゼクティブサマリー
3 市場の概要
3.1 主要な調査結果
3.2 マーケットダイナミクス
3.2.1 市場促進要因
3.2.1.1 水素燃料電池技術に対する政府の支援と投資の増加
3.2.1.2 代替エネルギー源とよりクリーンな輸送ソリューションへの需要の高まり
3.2.1.3 水素燃料電池技術とその利点に対する社会の認識と受容の高まり
3.2.2 市場抑制要因
3.2.2.1 水素燃料電池自動車に関連する高い先行投資コスト
3.2.2.2 水素燃料供給ステーションの不足
3.2.2.3 水素の貯蔵と輸送に関連する課題
3.2.3 市場の可能性
3.2.3.1 水素燃料供給インフラを開発・拡大する可能性
3.2.3.2 水素燃料電池技術が海運・航空産業の脱炭素化の一翼を担う可能性
3.2.3.3 水素燃料電池技術の研究開発を促進する産学官の連携
3.3 COVID-19影響度分析
3.3.1 V字型回復シナリオ
3.3.2 W字型回復シナリオ
3.3.3 U字型回復シナリオ
3.3.4 L字型回復シナリオ
3.4 スウォット分析
3.4.1 強み
3.4.2 弱点
3.4.3 機会
3.4.4 脅威
3.5 ポーターのファイブフォース分析
3.5.1 新規参入の脅威
3.5.2 サプライヤーのバーゲニングパワー
3.5.3 バイヤーのバーゲニングパワー
3.5.4 競合他社の脅威(
3.5.5 競争相手のライバルの強さ
3.6 ペストル分析
3.6.1 政治的要因
3.6.2 経済的要因
3.6.3 社会的要因
3.6.4 技術的要因
3.6.5 法的要因
3.6.6 環境要因
3.7 市場における最近の動向
4 水素燃料電池自動車(FCVs)市場分析:技術別
4.1 主要な調査結果
4.2 技術セグメント: 市場魅力度指数
4.2.1 水素燃料電池自動車(FCVs)技術別市場推移
4.3 プロトン交換膜(PEM)
4.3.1 地域別市場、2023年〜2033年(US$B)
4.3.2 2023年・2033年地域別市場シェア(%)
4.4 アルカリ性燃料電池(AFCs)
4.4.1 地域別市場、2023年~2033年(US$ Bn)
4.4.2 2023年・2033年地域別市場シェア(%)
4.5 固体酸化物形燃料電池(SOFCs)
4.5.1 地域別市場、2023年~2033年(US$ Bn)
4.5.2 2023年・2033年地域別市場シェア(%)
4.6 ダイレクトメタノール型燃料電池(DMFCs)
4.6.1 地域別市場、2023年~2033年(US$ Bn)
4.6.2 2023年・2033年地域別市場シェア(%)
5 水素燃料電池自動車(FCVs)市場分析:車両タイプ別
5.1 主要な調査結果
5.2 車両タイプセグメント: 市場魅力度指数
5.2.1 水素燃料電池自動車(FCVs)車種別市場
5.3 乗用車
5.3.1 地域別市場、2023年~2033年(US$ Bn)
5.3.2 2023年・2033年地域別市場シェア(%)
5.4 商用車
5.4.1 地域別市場、2023年~2033年(US$ Bn)
5.4.2 2023年・2033年地域別市場シェア(%)
5.5 マテリアルハンドリング車
5.5.1 地域別市場、2023年~2033年(US$ Bn)
5.5.2 2023年・2033年地域別市場シェア(%)
5.6 軍用車
5.6.1 地域別市場、2023年~2033年(US$ Bn)
5.6.2 2023年・2033年地域別市場シェア(%)
5.7 その他車両
5.7.1 地域別市場、2023年~2033年(US$ Bn)
5.7.2 2023年・2033年地域別市場シェア(%)
6 水素燃料電池自動車(FCVs)市場分析:コンポーネント別
6.1 主要な調査結果
6.2 コンポーネントセグメントの 市場魅力度指数
6.2.1 水素燃料電池自動車(FCVs)コンポーネント別市場
6.3 燃料電池スタック
6.3.1 地域別市場、2023年~2033年(US$ Bn)
6.3.2 2023年・2033年地域別市場シェア(%)
6.4 水素タンク
6.4.1 地域別市場、2023年~2033年(US$ Bn)
6.4.2 2023年・2033年地域別市場シェア(%)
6.5 バッテリー
6.5.1 地域別市場、2023年~2033年(US$ Bn)
6.5.2 2023年・2033年地域別市場シェア(%)
6.6 電気モーター
6.6.1 地域別市場、2023年~2033年(US$ Bn)
6.6.2 2023年・2033年地域別市場シェア(%)
6.7 パワーエレクトロニクス
6.7.1 地域別市場、2023年~2033年(US$ Bn)
6.7.2 2023年・2033年地域別市場シェア(%)
6.8 その他コンポーネント
6.8.1 地域別市場、2023年~2033年(US$ Bn)
6.8.2 2023年・2033年地域別市場シェア(%)
7 北米の水素燃料電池車(FCVs)市場分析
7.1 主要な調査結果
7.2 北米の水素燃料電池自動車(FCVs)市場魅力度指数
7.3 北米の水素燃料電池自動車(FCVs)国別市場、2023年、2028年、2033年(US$ Billion)
7.4 北米の水素燃料電池自動車(FCVs)市場:金額ベース
7.5 北米の水素燃料電池自動車(FCVs)市場:国別
7.6 北米の水素燃料電池自動車(FCVs)市場:技術別
7.7 北米の水素燃料電池自動車(FCVs)市場:車両タイプ別
7.8 北米の水素燃料電池自動車(FCVs)市場:コンポーネント別
7.9 米国水素燃料電池自動車(FCVs)市場分析
7.10 カナダ 水素燃料電池自動車(FCVs)市場分析
8 欧州の水素燃料電池自動車(FCVs)市場分析
8.1 主要な調査結果
8.2 欧州の水素燃料電池車(FCVs)市場魅力度指数
8.3 欧州の水素燃料電池自動車(FCVs)国別市場、2023年、2028年、2033年(US$ Billion)
8.4 欧州の水素燃料電池自動車(FCVs)市場:金額ベース
8.5 欧州の水素燃料電池自動車(FCVs)市場:国別
8.6 欧州の水素燃料電池自動車(FCVs)市場:技術別
8.7 欧州の水素燃料電池自動車(FCVs)市場:車両タイプ別
8.8 欧州の水素燃料電池自動車(FCVs)市場:コンポーネント別
8.9 ドイツ 水素燃料電池自動車(FCVs)市場分析
8.10 イギリス 水素燃料電池自動車(FCVs)の市場分析
8.11 フランス 水素燃料電池自動車(FCVs)の市場分析
8.12 イタリア 水素燃料電池自動車(FCVs)の市場分析
8.13 スペイン 水素燃料電池自動車(FCVs)の市場分析
8.14 その他の欧州の水素燃料電池自動車(FCVs)の市場分析
9 アジア太平洋地域の水素燃料電池自動車(FCVs)市場分析
9.1 主要な調査結果
9.2 アジア太平洋地域の水素燃料電池自動車(FCVs)市場魅力度指数
9.3 アジア太平洋地域の水素燃料電池自動車(FCVs)国別市場、2023年、2028年、2033年(US$ Billion)
9.4 アジア太平洋地域の水素燃料電池自動車(FCVs)市場:金額ベース
9.5 アジア太平洋地域の水素燃料電池自動車(FCVs)市場:国別
9.6 アジア太平洋地域の水素燃料電池自動車(FCVs)市場:技術別
9.7 アジア太平洋地域の水素燃料電池自動車(FCVs)市場:車両タイプ別
9.8 アジア太平洋地域の水素燃料電池自動車(FCVs)市場:コンポーネント別
9.9 中国 水素燃料電池自動車(FCVs)市場分析
9.10 インド 水素燃料電池自動車(FCVs)市場分析
9.11 日本 水素燃料電池自動車(FCVs)の市場分析
9.12 韓国 水素燃料電池自動車(FCVs)の市場分析
9.13 オーストラリア 水素燃料電池自動車(FCVs)の市場分析
9.14 その他のアジア太平洋地域の水素燃料電池自動車(FCVs)市場分析
10 中東・アフリカ 水素燃料電池自動車(FCVs)市場分析
10.1 主要な調査結果
10.2 中東・アフリカ 水素燃料電池自動車(FCVs)市場魅力度指数
10.3 中東・アフリカ 水素燃料電池自動車(FCVs)国別市場:2023年、2028年、2033年(US$ Billion)
10.4 中東・アフリカ 水素燃料電池自動車(FCVs)市場:金額ベース
10.5 中東・アフリカ 水素燃料電池自動車(FCVs)市場:国別
10.6 中東・アフリカ 水素燃料電池自動車(FCVs)市場:技術別
10.7 中東・アフリカ 水素燃料電池自動車(FCVs)市場:車両タイプ別
10.8 中東・アフリカ 水素燃料電池自動車(FCVs)市場:コンポーネント別
10.9 GCC 水素燃料電池自動車(FCVs)の市場分析
10.10 南アフリカの水素燃料電池自動車(FCVs)市場分析
10.11 その他の中東・アフリカ地域の水素燃料電池自動車(FCVs)市場分析
11 ラテンアメリカの水素燃料電池自動車(FCVs)市場分析
11.1 主要な調査結果
11.2 ラテンアメリカの水素燃料電池自動車(FCVs)市場魅力度指数
11.3 ラテンアメリカの水素燃料電池自動車(FCVs)国別市場:2023年、2028年、2033年(US$ Billion)
11.4 ラテンアメリカの水素燃料電池自動車(FCVs)市場:金額ベース
11.5 ラテンアメリカの水素燃料電池自動車(FCVs)市場:国別
11.6 ラテンアメリカの水素燃料電池自動車(FCVs)市場:技術別
11.7 ラテンアメリカの水素燃料電池自動車(FCVs)市場:車両タイプ別
11.8 ラテンアメリカの水素燃料電池自動車(FCVs)市場:コンポーネント別
11.9 ブラジル 水素燃料電池自動車(FCVs)市場分析
11.10 メキシコ 水素燃料電池自動車(FCVs)の市場分析
11.11 その他のラテンアメリカ地域 水素燃料電池自動車(FCVs)の市場分析
12 企業概要
12.1 競争環境、2022年
12.2 戦略的な展望
12.2.1 事業戦略としての契約
12.2.2 事業戦略としての協業
12.2.3 事業戦略としての契約
12.2.4 事業戦略としての拡大
12.2.5 事業戦略としての投資
12.2.6 ビジネス戦略としてのジョイントベンチャー
12.2.7 ビジネス戦略としての新製品発表
12.2.8 事業戦略としてのパートナーシップ
12.3 Honda Motor Co., Ltd.
12.3.1 会社概要
12.3.2 会社概要
12.3.3 財務分析
12.3.3.1 純収益、2018年~2022年
12.3.3.2 R&D、2018年~2022年
12.3.3.3 地域別売上高シェア、2022年(%)
12.3.4 製品ベンチマーキング
12.3.5 戦略的な展望
12.4 Toyota Motor Corporation
12.4.1 企業スナップショット
12.4.2 会社概要
12.4.3 財務分析
12.4.3.1 純収益、2018年〜2022年
12.4.3.2 R&D、2018年〜2022年
12.4.3.3 地域別収入シェア、2022年(%)
12.4.3.4 事業セグメント別売上高シェア、2022年(%)
12.4.4 製品のベンチマーキング
12.4.5 戦略的な展望
12.5 Hyundai Motor Company
12.5.1 企業スナップショット
12.5.2 会社概要
12.5.3 財務分析
12.5.3.1 純収益、2018年〜2022年
12.5.3.2 R&D、2018年〜2022年
12.5.3.3 地域別収入シェア、2021年(%)
12.5.3.4 事業セグメント別売上高シェア、2021年(%)
12.5.4 製品のベンチマーキング
12.5.5 戦略的な展望
12.6 General Motors Company
12.6.1 企業スナップショット
12.6.2 会社概要
12.6.3 財務分析
12.6.3.1 純収益、2018年〜2022年
12.6.3.2 R&D、2018年〜2022年
12.6.3.3 地域別売上高シェア、2021年(%)
12.6.4 製品のベンチマーキング
12.6.5 戦略的アウトルック
12.7 Mercedes-Benz Group AG
12.7.1 企業スナップショット
12.7.2 会社概要
12.7.3 財務分析
12.7.3.1 純収益、2018年〜2022年
12.7.3.2 R&D、2018年〜2022年
12.7.3.3 地域別収入シェア、2022年(%)
12.7.3.4 事業セグメント別売上高シェア、2022年(%)
12.7.4 製品のベンチマーキング
12.7.5 戦略的な展望
12.8 Bayerische Motoren Werke AG
12.8.1 企業スナップショット
12.8.2 会社概要
12.8.3 財務分析
12.8.3.1 純収益、2018年〜2022年
12.8.3.2 R&D、2018年〜2022年
12.8.3.3 地域別収入シェア、2022年(%)
12.8.3.4 事業セグメント別売上高シェア、2022年(%)
12.8.4 製品のベンチマーキング
12.8.5 戦略的な展望
12.9 Nikola Corporation
12.9.1 企業スナップショット
12.9.2 会社概要
12.9.3 財務分析
12.9.3.1 純収益、2018年〜2022年
12.9.3.2 R&D、2018年〜2022年
12.9.4 製品のベンチマーキング
12.9.5 戦略的な展望
12.10 Air Liquide
12.10.1 企業スナップショット
12.10.2 会社概要
12.10.3 財務分析
12.10.3.1 純収益、2018年〜2022年
12.10.3.2 R&D、2018年〜2022年
12.10.3.3 地域別収入シェア、2022年(%)
12.10.3.4 事業セグメント別売上高シェア、2022年(%)
12.10.4 製品のベンチマーキング
12.10.5 戦略的な展望
12.11 Linde plc
12.11.1 企業スナップショット
12.11.2 会社概要
12.11.3 財務分析
12.11.3.1 純収益、2018年〜2022年
12.11.3.2 R&D、2018年〜2022年
12.11.3.3 地域別収入シェア、2022年(%)
12.11.3.4 事業セグメント別売上高シェア、2022年(%)
12.11.4 製品のベンチマーキング
12.11.5 戦略的な展望
12.12 Cummins Inc.
12.12.1 企業スナップショット
12.12.2 会社概要
12.12.3 財務分析
12.12.3.1 純収益、2018年〜2022年
12.12.3.2 R&D、2018年〜2022年
12.12.3.3 地域別収入シェア、2022年(%)
12.12.3.4 事業セグメント別売上高シェア、2022年(%)
12.12.4 製品のベンチマーキング
12.12.5 戦略的な展望
12.13 Nel Hydrogen
12.13.1 企業スナップショット
12.13.2 会社概要
12.13.3 財務分析
12.13.3.1 純収益、2018年〜2022年
12.13.3.2 R&D、2018年〜2022年
12.13.3.3 地域別収入シェア、2022年(%)
12.13.3.4 事業セグメント別売上高シェア、2022年(%)
12.13.4 製品のベンチマーキング
12.13.5 戦略的な展望
12.14 Riversimple
12.14.1 企業スナップショット
12.14.2 会社概要
12.14.3 製品ベンチマーク
12.15 Horizon Fuel Cell Technologies
12.15.1 企業スナップショット
12.15.2 会社概要
12.15.3 製品ベンチマーク
12.15.4 戦略的な展望
12.16 Ballard Power Systems Inc.
12.16.1 企業スナップショット
12.16.2 会社概要
12.16.3 財務分析
12.16.3.1 純収益、2018年〜2022年
12.16.3.2 R&D、2018年〜2022年
12.16.3.3 地域別収入シェア、2022年(%)
12.16.3.4 事業セグメント別収益シェア、2022年(%)
12.16.4 製品のベンチマーキング
12.16.5 戦略的な展望
12.17 Plug Power Inc.
12.17.1 企業スナップショット
12.17.2 会社概要
12.17.3 財務分析
12.17.3.1 純収益、2018年〜2022年
12.17.3.2 R&D、2018年〜2022年
12.17.3.3 地域別売上高シェア、2022年(%)
12.17.4 製品のベンチマーキング
12.17.5 戦略的な展望
13 結論と提言
13.1 Visiongainからの結びの言葉
13.2 市場関係者への提言
ページTOPに戻る
図表リスト
表の一覧
Table 1 Hydrogen Fuel Cell Vehicles (FCVs) Market Snapshot, 2023 & 2033 (US$ Billion, CAGR %)
Table 2 Hydrogen Fuel Cell Vehicles (FCVs) Market by Region, 2023-2033 (US$ Bn, AGR (%), CAGR (%)) (V-Shaped Recovery Scenario)
Table 3 Hydrogen Fuel Cell Vehicles (FCVs) Market by Region, 2023-2033 (US$ Bn, AGR (%), CAGR (%)) (W-Shaped Recovery Scenario)
Table 4 Hydrogen Fuel Cell Vehicles (FCVs) Market by Region, 2023-2033 (US$ Bn, AGR (%), CAGR (%)) (U-Shaped Recovery Scenario)
Table 5 Hydrogen Fuel Cell Vehicles (FCVs) Market by Region, 2023-2033 (US$ Bn, AGR (%), CAGR (%)) (L-Shaped Recovery Scenario)
Table 6 Hydrogen Fuel Cell Vehicles (FCVs) Market by Technology, 2023-2033 (US$ Bn, AGR (%), CAGR (%))
Table 7 Proton Exchange Membrane (PEM) Market by Region, 2023-2033 (US$ Bn, AGR (%), CAGR (%))
Table 8 Alkaline Fuel Cells (AFCs) Market by Region, 2023-2033 (US$ Bn, AGR (%), CAGR (%))
Table 9 Solid Oxide Fuel Cells (SOFCs) Market by Region, 2023-2033 (US$ Bn, AGR (%), CAGR (%))
Table 10 Direct Methanol Fuel Cells (DMFCs) Market by Region, 2023-2033 (US$ Bn, AGR (%), CAGR (%))
Table 11 Hydrogen Fuel Cell Vehicles (FCVs) Market by Vehicle Type, 2023-2033 (US$ Bn, AGR (%), CAGR (%))
Table 12 Passenger Cars Market by Region, 2023-2033 (US$ Bn, AGR (%), CAGR (%))
Table 13 Commercial Vehicles Market by Region, 2023-2033 (US$ Bn, AGR (%), CAGR (%))
Table 14 Material Handling Vehicles Market by Region, 2023-2033 (US$ Bn, AGR (%), CAGR (%))
Table 15 Military Vehicles Market by Region, 2023-2033 (US$ Bn, AGR (%), CAGR (%))
Table 16 Other Vehicles Market by Region, 2023-2033 (US$ Bn, AGR (%), CAGR (%))
Table 17 Hydrogen Fuel Cell Vehicles (FCVs) Market by Component, 2023-2033 (US$ Bn, AGR (%), CAGR (%))
Table 18 Fuel Cell Stack Market by Region, 2023-2033 (US$ Bn, AGR (%), CAGR (%))
Table 19 Hydrogen Tanks Market by Region, 2023-2033 (US$ Bn, AGR (%), CAGR (%))
Table 20 Battery Market by Region, 2023-2033 (US$ Bn, AGR (%), CAGR (%))
Table 21 Electric Motor Market by Region, 2023-2033 (US$ Bn, AGR (%), CAGR (%))
Table 22 Power Electronics Market by Region, 2023-2033 (US$ Bn, AGR (%), CAGR (%))
Table 23 Other Components Market by Region, 2023-2033 (US$ Bn, AGR (%), CAGR (%))
Table 24 North America Hydrogen Fuel Cell Vehicles (FCVs) Market by Value, 2023-2033 (US$ Bn, AGR (%), CAGR (%))
Table 25 North America Hydrogen Fuel Cell Vehicles (FCVs) Market by Country, 2023-2033 (US$ Bn, AGR (%), CAGR (%))
Table 26 North America Hydrogen Fuel Cell Vehicles (FCVs) Market by Technology, 2023-2033 (US$ Bn, AGR (%), CAGR (%))
Table 27 North America Hydrogen Fuel Cell Vehicles (FCVs) Market by Vehicle Type, 2023-2033 (US$ Bn, AGR (%), CAGR (%))
Table 28 North America Hydrogen Fuel Cell Vehicles (FCVs) Market by Component, 2023-2033 (US$ Bn, AGR (%), CAGR (%))
Table 29 US Hydrogen Fuel Cell Vehicles (FCVs) Market by Value, 2023-2033 (US$ Bn, AGR (%), CAGR (%))
Table 30 Canada Hydrogen Fuel Cell Vehicles (FCVs) Market by Value, 2023-2033 (US$ Bn, AGR (%), CAGR (%))
Table 31 Europe Hydrogen Fuel Cell Vehicles (FCVs) Market by Value, 2023-2033 (US$ Bn, AGR (%), CAGR (%))
Table 32 Europe Hydrogen Fuel Cell Vehicles (FCVs) Market by Country, 2023-2033 (US$ Bn, AGR (%), CAGR (%))
Table 33 Europe Hydrogen Fuel Cell Vehicles (FCVs) Market by Technology, 2023-2033 (US$ Bn, AGR (%), CAGR (%))
Table 34 Europe Hydrogen Fuel Cell Vehicles (FCVs) Market by Vehicle Type, 2023-2033 (US$ Bn, AGR (%), CAGR (%))
Table 35 Europe Hydrogen Fuel Cell Vehicles (FCVs) Market by Component, 2023-2033 (US$ Bn, AGR (%), CAGR (%))
Table 36 Germany Hydrogen Fuel Cell Vehicles (FCVs) Market by Value, 2023-2033 (US$ Bn, AGR (%), CAGR (%))
Table 37 UK Hydrogen Fuel Cell Vehicles (FCVs) Market by Value, 2023-2033 (US$ Bn, AGR (%), CAGR (%))
Table 38 France Hydrogen Fuel Cell Vehicles (FCVs) Market by Value, 2023-2033 (US$ Bn, AGR (%), CAGR (%))
Table 39 Italy Hydrogen Fuel Cell Vehicles (FCVs) Market by Value, 2023-2033 (US$ Bn, AGR (%), CAGR (%))
Table 40 Spain Hydrogen Fuel Cell Vehicles (FCVs) Market by Value, 2023-2033 (US$ Bn, AGR (%), CAGR (%))
Table 41 Rest of Europe Hydrogen Fuel Cell Vehicles (FCVs) Market by Value, 2023-2033 (US$ Bn, AGR (%), CAGR (%))
Table 42 Asia-Pacific Hydrogen Fuel Cell Vehicles (FCVs) Market by Value, 2023-2033 (US$ Bn, AGR (%), CAGR (%))
Table 43 Asia-Pacific Hydrogen Fuel Cell Vehicles (FCVs) Market by Country, 2023-2033 (US$ Bn, AGR (%), CAGR (%))
Table 44 Asia-Pacific Hydrogen Fuel Cell Vehicles (FCVs) Market by Technology, 2023-2033 (US$ Bn, AGR (%), CAGR (%))
Table 45 Asia-Pacific Hydrogen Fuel Cell Vehicles (FCVs) Market by Vehicle Type, 2023-2033 (US$ Bn, AGR (%), CAGR (%))
Table 46 Asia-Pacific Hydrogen Fuel Cell Vehicles (FCVs) Market by Component, 2023-2033 (US$ Bn, AGR (%), CAGR (%))
Table 47 China Hydrogen Fuel Cell Vehicles (FCVs) Market by Value, 2023-2033 (US$ Bn, AGR (%), CAGR (%))
Table 48 India Hydrogen Fuel Cell Vehicles (FCVs) Market by Value, 2023-2033 (US$ Bn, AGR (%), CAGR (%))
Table 49 Japan Hydrogen Fuel Cell Vehicles (FCVs) Market by Value, 2023-2033 (US$ Bn, AGR (%), CAGR (%))
Table 50 South Korea Hydrogen Fuel Cell Vehicles (FCVs) Market by Value, 2023-2033 (US$ Bn, AGR (%), CAGR (%))
Table 51 Australia Hydrogen Fuel Cell Vehicles (FCVs) Market by Value, 2023-2033 (US$ Bn, AGR (%), CAGR (%))
Table 52 Rest of Asia-Pacific Hydrogen Fuel Cell Vehicles (FCVs) Market by Value, 2023-2033 (US$ Bn, AGR (%), CAGR (%))
Table 53 Middle East & Africa Hydrogen Fuel Cell Vehicles (FCVs) Market by Value, 2023-2033 (US$ Bn, AGR (%), CAGR (%))
Table 54 Middle East & Africa Hydrogen Fuel Cell Vehicles (FCVs) Market by Country, 2023-2033 (US$ Bn, AGR (%), CAGR (%))
Table 55 Middle East & Africa Hydrogen Fuel Cell Vehicles (FCVs) Market by Technology, 2023-2033 (US$ Bn, AGR (%), CAGR (%))
Table 56 Middle East & Africa Hydrogen Fuel Cell Vehicles (FCVs) Market by Vehicle Type, 2023-2033 (US$ Bn, AGR (%), CAGR (%))
Table 57 Middle East & Africa Hydrogen Fuel Cell Vehicles (FCVs) Market by Component, 2023-2033 (US$ Bn, AGR (%), CAGR (%))
Table 58 GCC Hydrogen Fuel Cell Vehicles (FCVs) Market by Value, 2023-2033 (US$ Bn, AGR (%), CAGR (%))
Table 59 South Africa Hydrogen Fuel Cell Vehicles (FCVs) Market by Value, 2023-2033 (US$ Bn, AGR (%), CAGR (%))
Table 60 Rest of Middle East & Africa Hydrogen Fuel Cell Vehicles (FCVs) Market by Value, 2023-2033 (US$ Bn, AGR (%), CAGR (%))
Table 61 Latin America Hydrogen Fuel Cell Vehicles (FCVs) Market by Value, 2023-2033 (US$ Bn, AGR (%), CAGR (%))
Table 62 Latin America Hydrogen Fuel Cell Vehicles (FCVs) Market by Country, 2023-2033 (US$ Bn, AGR (%), CAGR (%))
Table 63 Latin America Hydrogen Fuel Cell Vehicles (FCVs) Market by Technology, 2023-2033 (US$ Bn, AGR (%), CAGR (%))
Table 64 Latin America Hydrogen Fuel Cell Vehicles (FCVs) Market by Vehicle Type, 2023-2033 (US$ Bn, AGR (%), CAGR (%))
Table 65 Latin America Hydrogen Fuel Cell Vehicles (FCVs) Market by Component, 2023-2033 (US$ Bn, AGR (%), CAGR (%))
Table 66 Brazil Hydrogen Fuel Cell Vehicles (FCVs) Market by Value, 2023-2033 (US$ Bn, AGR (%), CAGR (%))
Table 67 Mexico Hydrogen Fuel Cell Vehicles (FCVs) Market by Value, 2023-2033 (US$ Bn, AGR (%), CAGR (%))
Table 68 Rest of Latin America Hydrogen Fuel Cell Vehicles (FCVs) Market by Value, 2023-2033 (US$ Bn, AGR (%), CAGR (%))
Table 69 Honda Motor Co., Ltd.: Key Details, (CEO, HQ, Revenue, Founded, No. of Employees, Company Type, Website, Business Segment)
Table 70 Honda Motor Co., Ltd.: Product Benchmarking
Table 71 Honda Motor Co., Ltd.: Strategic Outlook
Table 72 Toyota Motor Corporation: Key Details, (CEO, HQ, Revenue, Founded, No. of Employees, Company Type, Website, Business Segment)
Table 73 Toyota Motor Corporation: Product Benchmarking
Table 74 Toyota Motor Corporation: Strategic Outlook
Table 75 Hyundai Motor Company: Key Details, (CEO, HQ, Revenue, Founded, No. of Employees, Company Type, Website, Business Segment)
Table 76 Hyundai Motor Company: Product Benchmarking
Table 77 Hyundai Motor Company: Strategic Outlook
Table 78 General Motors Company: Key Details, (CEO, HQ, Revenue, Founded, No. of Employees, Company Type, Website, Business Segment)
Table 79 General Motors Company: Product Benchmarking
Table 80 General Motors Company: Strategic Outlook
Table 81 Mercedes-Benz Group AG: Key Details, (CEO, HQ, Revenue, Founded, No. of Employees, Company Type, Website, Business Segment)
Table 82 Mercedes-Benz Group AG: Product Benchmarking
Table 83 Mercedes-Benz Group AG: Strategic Outlook
Table 84 Bayerische Motoren Werke AG: Key Details, (CEO, HQ, Revenue, Founded, No. of Employees, Company Type, Website, Business Segment)
Table 85 Bayerische Motoren Werke AG: Product Benchmarking
Table 86 Bayerische Motoren Werke AG: Strategic Outlook
Table 87 Nikola Corporation: Key Details, (CEO, HQ, Revenue, Founded, No. of Employees, Company Type, Website, Business Segment)
Table 88 Nikola Corporation: Product Benchmarking
Table 89 Nikola Corporation: Strategic Outlook
Table 90 Air Liquide: Key Details, (CEO, HQ, Revenue, Founded, No. of Employees, Company Type, Website, Business Segment)
Table 91 Air Liquide: Product Benchmarking
Table 92 Air Liquide: Strategic Outlook
Table 93 Linde plc: Key Details, (CEO, HQ, Revenue, Founded, No. of Employees, Company Type, Website, Business Segment)
Table 94 Linde plc: Product Benchmarking
Table 95 Linde plc: Strategic Outlook
Table 96 Cummins Inc.: Key Details, (CEO, HQ, Revenue, Founded, No. of Employees, Company Type, Website, Business Segment)
Table 97 Cummins Inc.: Product Benchmarking
Table 98 Cummins Inc.: Strategic Outlook
Table 99 Nel Hydrogen: Key Details, (CEO, HQ, Revenue, Founded, No. of Employees, Company Type, Website, Business Segment)
Table 100 Nel Hydrogen: Product Benchmarking
Table 101 Nel Hydrogen: Strategic Outlook
Table 102 Riversimple: Key Details, (CEO, HQ, Revenue, Founded, No. of Employees, Company Type, Website, Business Segment)
Table 103 Riversimple: Product Benchmarking
Table 104 Horizon Fuel Cell Technologies: Key Details, (CEO, HQ, Revenue, Founded, No. of Employees, Company Type, Website, Business Segment)
Table 105 Horizon Fuel Cell Technologies: Product Benchmarking
Table 106 Horizon Fuel Cell Technologies: Strategic Outlook
Table 107 Ballard Power Systems Inc.: Key Details, (CEO, HQ, Revenue, Founded, No. of Employees, Company Type, Website, Business Segment)
Table 108 Ballard Power Systems Inc.: Product Benchmarking
Table 109 Ballard Power Systems Inc.: Strategic Outlook
Table 110 Plug Power Inc.: Key Details, (CEO, HQ, Revenue, Founded, No. of Employees, Company Type, Website, Business Segment)
Table 111 Plug Power Inc.: Product Benchmarking
Table 112 Plug Power Inc.: Strategic Outlook
図の一覧
Figure 1 Hydrogen Fuel Cell Vehicles (FCVs) Market Segmentation
Figure 2 Hydrogen Fuel Cell Vehicles (FCVs) Market by Technology: Market Attractiveness Index
Figure 3 Hydrogen Fuel Cell Vehicles (FCVs) Market by Vehicle Type: Market Attractiveness Index
Figure 4 Hydrogen Fuel Cell Vehicles (FCVs) Market by Components: Market Attractiveness Index
Figure 5 Hydrogen Fuel Cell Vehicles (FCVs) Market Attractiveness Index by Region
Figure 6 Hydrogen Fuel Cell Vehicles (FCVs) Market: Market Dynamics
Figure 7 Hydrogen Fuel Cell Vehicles (FCVs) Market by Region, 2023-2033 (US$ Bn, AGR (%)) (V-Shaped Recovery Scenario)
Figure 8 Hydrogen Fuel Cell Vehicles (FCVs) Market by Region, 2023-2033 (US$ Bn, AGR (%)) (W-Shaped Recovery Scenario)
Figure 9 Hydrogen Fuel Cell Vehicles (FCVs) Market by Region, 2023-2033 (US$ Bn, AGR (%)) (U-Shaped Recovery Scenario)
Figure 10 Hydrogen Fuel Cell Vehicles (FCVs) Market by Region, 2023-2033 (US$ Bn, AGR (%)) (L-Shaped Recovery Scenario)
Figure 11 Hydrogen Fuel Cell Vehicles (FCVs) Market: Porter’s Five Forces Analysis
Figure 12 Hydrogen Fuel Cell Vehicles (FCVs) Market by Technology: Market Attractiveness Index
Figure 13 Hydrogen Fuel Cell Vehicles (FCVs) Market by Technology, 2023-2033 (US$ Bn, AGR (%))
Figure 14 Proton Exchange Membrane (PEM) Market by Region, 2023-2033 (US$ Bn, AGR (%))
Figure 15 Table 7 Proton Exchange Membrane (PEM) Segment Market Share Forecast by Region, 2023 & 2033 (%)
Figure 16 Alkaline Fuel Cells (AFCs) Market by Region, 2023-2033 (US$ Bn, AGR (%))
Figure 17 Alkaline Fuel Cells (AFCs) Segment Market Share Forecast by Region, 2023 & 2033 (%)
Figure 18 Solid Oxide Fuel Cells (SOFCs) Market by Region, 2023-2033 (US$ Bn, AGR (%))
Figure 19 Solid Oxide Fuel Cells (SOFCs) Segment Market Share Forecast by Region, 2023 & 2033 (%)
Figure 20 Direct Methanol Fuel Cells (DMFCs) Market by Region, 2023-2033 (US$ Bn, AGR (%))
Figure 21 Direct Methanol Fuel Cells (DMFCs) Segment Market Share Forecast by Region, 2023 & 2033 (%)
Figure 22 Hydrogen Fuel Cell Vehicles (FCVs) Market by Vehicle Type: Market Attractiveness Index
Figure 23 Hydrogen Fuel Cell Vehicles (FCVs) Market by Vehicle Type, 2023-2033 (US$ Bn, AGR (%))
Figure 24 Passenger Cars Market by Region, 2023-2033 (US$ Bn, AGR (%))
Figure 25 Passenger Cars Segment Market Share Forecast by Region, 2023 & 2033 (%)
Figure 26 Commercial Vehicles Market by Region, 2023-2033 (US$ Bn, AGR (%))
Figure 27 Commercial Vehicles Segment Market Share Forecast by Region, 2023 & 2033 (%)
Figure 28 Material Handling Vehicles Market by Region, 2023-2033 (US$ Bn, AGR (%))
Figure 29 Material Handling Vehicles Segment Market Share Forecast by Region, 2023 & 2033 (%)
Figure 30 Military Vehicles Market by Region, 2023-2033 (US$ Bn, AGR (%))
Figure 31 Military Vehicles Segment Market Share Forecast by Region, 2023 & 2033 (%)
Figure 32 Other Vehicles Market by Region, 2023-2033 (US$ Bn, AGR (%))
Figure 33 Other Vehicles Segment Market Share Forecast by Region, 2023 & 2033 (%)
Figure 34 Hydrogen Fuel Cell Vehicles (FCVs) Market by Components: Market Attractiveness Index
Figure 35 Hydrogen Fuel Cell Vehicles (FCVs) Market by Component, 2023-2033 (US$ Bn, AGR (%))
Figure 36 Fuel Cell Stack Market by Region, 2023-2033 (US$ Bn, AGR (%))
Figure 37 Fuel Cell Stack Segment Market Share Forecast by Region, 2023 & 2033 (%)
Figure 38 Hydrogen Tanks Market by Region, 2023-2033 (US$ Bn, AGR (%))
Figure 39 Hydrogen Tanks Segment Market Share Forecast by Region, 2023 & 2033 (%)
Figure 40 Battery Market by Region, 2023-2033 (US$ Bn, AGR (%))
Figure 41 Battery Segment Market Share Forecast by Region, 2023 & 2033 (%)
Figure 42 Electric Motor Market by Region, 2023-2033 (US$ Bn, AGR (%))
Figure 43 Electric Motor Segment Market Share Forecast by Region, 2023 & 2033 (%)
Figure 44 Power Electronics Market by Region, 2023-2033 (US$ Bn, AGR (%))
Figure 45 Power Electronics Segment Market Share Forecast by Region, 2023 & 2033 (%)
Figure 46 Other Components Market by Region, 2023-2033 (US$ Bn, AGR (%))
Figure 47 Other Components Segment Market Share Forecast by Region, 2023 & 2033 (%)
Figure 48 North America Hydrogen Fuel Cell Vehicles (FCVs) Market Attractiveness Index
Figure 49 North America Hydrogen Fuel Cell Vehicles (FCVs) Market by Region, 2023, 2028 & 2033 (US$ Billion)
Figure 50 North America Hydrogen Fuel Cell Vehicles (FCVs) Market by Value, 2023-2033 (US$ Bn, AGR (%))
Figure 51 North America Hydrogen Fuel Cell Vehicles (FCVs) Market by Country, 2023-2033 (US$ Bn, AGR (%))
Figure 52 North America Hydrogen Fuel Cell Vehicles (FCVs) Market Share Forecast by Country, 2023 & 2033 (%)
Figure 53 North America Hydrogen Fuel Cell Vehicles (FCVs) Market by Technology, 2023-2033 (US$ Bn, AGR (%))
Figure 54 North America Hydrogen Fuel Cell Vehicles (FCVs) Market Share Forecast by Technology, 2023 & 2033 (%)
Figure 55 North America Hydrogen Fuel Cell Vehicles (FCVs) Market by Vehicle Type, 2023-2033 (US$ Bn, AGR (%))
Figure 56 North America Hydrogen Fuel Cell Vehicles (FCVs) Market Share Forecast by Vehicle Type, 2023 & 2033 (%)
Figure 57 North America Hydrogen Fuel Cell Vehicles (FCVs) Market by Component, 2023-2033 (US$ Bn, AGR (%))
Figure 58 North America Hydrogen Fuel Cell Vehicles (FCVs) Market Share Forecast by Component, 2023 & 2033 (%)
Figure 59 US Hydrogen Fuel Cell Vehicles (FCVs) Market by Value, 2023-2033 (US$ Bn, AGR (%))
Figure 60 Canada Hydrogen Fuel Cell Vehicles (FCVs) Market by Value, 2023-2033 (US$ Bn, AGR (%))
Figure 61 Europe Hydrogen Fuel Cell Vehicles (FCVs) Market Attractiveness Index
Figure 62 Europe Hydrogen Fuel Cell Vehicles (FCVs) Market by Region, 2023, 2028 & 2033 (US$ Billion)
Figure 63 Europe Hydrogen Fuel Cell Vehicles (FCVs) Market by Value, 2023-2033 (US$ Bn, AGR (%))
Figure 64 Europe Hydrogen Fuel Cell Vehicles (FCVs) Market by Country, 2023-2033 (US$ Bn, AGR (%))
Figure 65 Europe Hydrogen Fuel Cell Vehicles (FCVs) Market Share Forecast by Country, 2023 & 2033 (%)
Figure 66 Europe Hydrogen Fuel Cell Vehicles (FCVs) Market by Technology, 2023-2033 (US$ Bn, AGR (%))
Figure 67 Europe Hydrogen Fuel Cell Vehicles (FCVs) Market Share Forecast by Technology, 2023 & 2033 (%)
Figure 68 Europe Hydrogen Fuel Cell Vehicles (FCVs) Market by Vehicle Type, 2023-2033 (US$ Bn, AGR (%))
Figure 69 Europe Hydrogen Fuel Cell Vehicles (FCVs) Market Share Forecast by Vehicle Type, 2023 & 2033 (%)
Figure 70 Europe Hydrogen Fuel Cell Vehicles (FCVs) Market by Component, 2023-2033 (US$ Bn, AGR (%))
Figure 71 Europe Hydrogen Fuel Cell Vehicles (FCVs) Market Share Forecast by Component, 2023 & 2033 (%)
Figure 72 Germany Hydrogen Fuel Cell Vehicles (FCVs) Market by Value, 2023-2033 (US$ Bn, AGR (%))
Figure 73 UK Hydrogen Fuel Cell Vehicles (FCVs) Market by Value, 2023-2033 (US$ Bn, AGR (%))
Figure 74 France Hydrogen Fuel Cell Vehicles (FCVs) Market by Value, 2023-2033 (US$ Bn, AGR (%))
Figure 75 Italy Hydrogen Fuel Cell Vehicles (FCVs) Market by Value, 2023-2033 (US$ Bn, AGR (%))
Figure 76 Spain Hydrogen Fuel Cell Vehicles (FCVs) Market by Value, 2023-2033 (US$ Bn, AGR (%))
Figure 77 Rest of Europe Hydrogen Fuel Cell Vehicles (FCVs) Market by Value, 2023-2033 (US$ Bn, AGR (%))
Figure 78 Asia-Pacific Hydrogen Fuel Cell Vehicles (FCVs) Market Attractiveness Index
Figure 79 Asia-Pacific Hydrogen Fuel Cell Vehicles (FCVs) Market by Region, 2023, 2028 & 2033 (US$ Billion)
Figure 80 Asia-Pacific Hydrogen Fuel Cell Vehicles (FCVs) Market by Value, 2023-2033 (US$ Bn, AGR (%))
Figure 81 Asia-Pacific Hydrogen Fuel Cell Vehicles (FCVs) Market by Country, 2023-2033 (US$ Bn, AGR (%))
Figure 82 Asia-Pacific Hydrogen Fuel Cell Vehicles (FCVs) Market Share Forecast by Country, 2023 & 2033 (%)
Figure 83 Asia-Pacific Hydrogen Fuel Cell Vehicles (FCVs) Market by Technology, 2023-2033 (US$ Bn, AGR (%))
Figure 84 Asia-Pacific Hydrogen Fuel Cell Vehicles (FCVs) Market Share Forecast by Technology, 2023 & 2033 (%)
Figure 85 Asia-Pacific Hydrogen Fuel Cell Vehicles (FCVs) Market by Vehicle Type, 2023-2033 (US$ Bn, AGR (%))
Figure 86 Asia-Pacific Hydrogen Fuel Cell Vehicles (FCVs) Market Share Forecast by Vehicle Type, 2023 & 2033 (%)
Figure 87 Asia-Pacific Hydrogen Fuel Cell Vehicles (FCVs) Market by Component, 2023-2033 (US$ Bn, AGR (%))
Figure 88 Asia-Pacific Hydrogen Fuel Cell Vehicles (FCVs) Market Share Forecast by Component, 2023 & 2033 (%)
Figure 89 China Hydrogen Fuel Cell Vehicles (FCVs) Market by Value, 2023-2033 (US$ Bn, AGR (%))
Figure 90 India Hydrogen Fuel Cell Vehicles (FCVs) Market by Value, 2023-2033 (US$ Bn, AGR (%))
Figure 91 Japan Hydrogen Fuel Cell Vehicles (FCVs) Market by Value, 2023-2033 (US$ Bn, AGR (%))
Figure 92 South Korea Hydrogen Fuel Cell Vehicles (FCVs) Market by Value, 2023-2033 (US$ Bn, AGR (%))
Figure 93 Australia Hydrogen Fuel Cell Vehicles (FCVs) Market by Value, 2023-2033 (US$ Bn, AGR (%))
Figure 94 Rest of Asia-Pacific Hydrogen Fuel Cell Vehicles (FCVs) Market by Value, 2023-2033 (US$ Bn, AGR (%))
Figure 95 Middle East & Africa Hydrogen Fuel Cell Vehicles (FCVs) Market Attractiveness Index
Figure 96 Middle East & Africa Hydrogen Fuel Cell Vehicles (FCVs) Market by Region, 2023, 2028 & 2033 (US$ Billion)
Figure 97 Middle East & Africa Hydrogen Fuel Cell Vehicles (FCVs) Market by Value, 2023-2033 (US$ Bn, AGR (%))
Figure 98 Middle East & Africa Hydrogen Fuel Cell Vehicles (FCVs) Market by Country, 2023-2033 (US$ Bn, AGR (%))
Figure 99 Middle East & Africa Hydrogen Fuel Cell Vehicles (FCVs) Market Share Forecast by Country, 2023 & 2033 (%)
Figure 100 Middle East & Africa Hydrogen Fuel Cell Vehicles (FCVs) Market by Technology, 2023-2033 (US$ Bn, AGR (%))
Figure 101 Middle East & Africa Hydrogen Fuel Cell Vehicles (FCVs) Market Share Forecast by Technology, 2023 & 2033 (%)
Figure 102 Middle East & Africa Hydrogen Fuel Cell Vehicles (FCVs) Market by Vehicle Type, 2023-2033 (US$ Bn, AGR (%))
Figure 103 Middle East & Africa Hydrogen Fuel Cell Vehicles (FCVs) Market Share Forecast by Vehicle Type, 2023 & 2033 (%)
Figure 104 Middle East & Africa Hydrogen Fuel Cell Vehicles (FCVs) Market by Component, 2023-2033 (US$ Bn, AGR (%))
Figure 105 Middle East & Africa Hydrogen Fuel Cell Vehicles (FCVs) Market Share Forecast by Component, 2023 & 2033 (%)
Figure 106 GCC Hydrogen Fuel Cell Vehicles (FCVs) Market by Value, 2023-2033 (US$ Bn, AGR (%))
Figure 107 South Africa Hydrogen Fuel Cell Vehicles (FCVs) Market by Value, 2023-2033 (US$ Bn, AGR (%))
Figure 108 Rest of Middle East & Africa Hydrogen Fuel Cell Vehicles (FCVs) Market by Value, 2023-2033 (US$ Bn, AGR (%))
Figure 109 Latin America Hydrogen Fuel Cell Vehicles (FCVs) Market Attractiveness Index
Figure 110 Latin America Hydrogen Fuel Cell Vehicles (FCVs) Market by Region, 2023, 2028 & 2033 (US$ Billion)
Figure 111 Latin America Hydrogen Fuel Cell Vehicles (FCVs) Market by Value, 2023-2033 (US$ Bn, AGR (%))
Figure 112 Latin America Hydrogen Fuel Cell Vehicles (FCVs) Market by Country, 2023-2033 (US$ Bn, AGR (%))
Figure 113 Latin America Hydrogen Fuel Cell Vehicles (FCVs) Market Share Forecast by Country, 2023 & 2033 (%)
Figure 114 Latin America Hydrogen Fuel Cell Vehicles (FCVs) Market by Technology, 2023-2033 (US$ Bn, AGR (%))
Figure 115 Latin America Hydrogen Fuel Cell Vehicles (FCVs) Market Share Forecast by Technology, 2023 & 2033 (%)
Figure 116 Latin America Hydrogen Fuel Cell Vehicles (FCVs) Market by Vehicle Type, 2023-2033 (US$ Bn, AGR (%))
Figure 117 Latin America Hydrogen Fuel Cell Vehicles (FCVs) Market Share Forecast by Vehicle Type, 2023 & 2033 (%)
Figure 118 Latin America Hydrogen Fuel Cell Vehicles (FCVs) Market by Component, 2023-2033 (US$ Bn, AGR (%))
Figure 119 Latin America Hydrogen Fuel Cell Vehicles (FCVs) Market Share Forecast by Components, 2023 & 2033 (%)
Figure 120 Brazil Hydrogen Fuel Cell Vehicles (FCVs) Market by Value, 2023-2033 (US$ Bn, AGR (%))
Figure 121 Mexico Hydrogen Fuel Cell Vehicles (FCVs) Market by Value, 2023-2033 (US$ Bn, AGR (%))
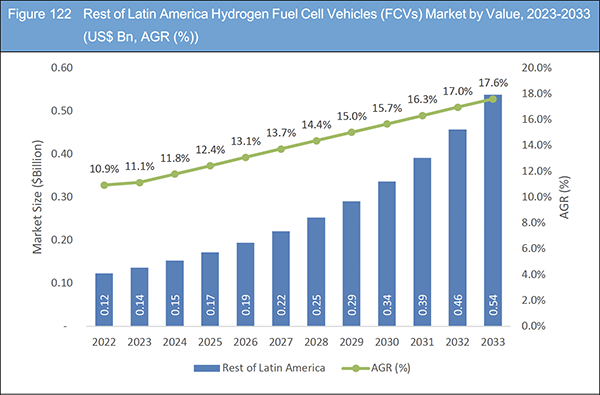
Figure 122 Rest of Latin America Hydrogen Fuel Cell Vehicles (FCVs) Market by Value, 2023-2033 (US$ Bn, AGR (%))
Figure 123 Hydrogen Fuel Cell Vehicles (FCVs) Market: Company Share, 2022
Figure 124 Honda Motor Co., Ltd.: Net Revenue, 2018-2022 (US$ million, AGR%)
Figure 125 Honda Motor Co., Ltd.: R&D, 2018-2022 (US$ million, AGR%)
Figure 126 Honda Motor Co., Ltd.: Regional Revenue Shares, 2022 (%)
Figure 127 Toyota Motor Corporation: Net Revenue, 2018-2022 (US$ million, AGR%)
Figure 128 Toyota Motor Corporation: R&D, 2018-2022 (US$ million, AGR%)
Figure 129 Toyota Motor Corporation: Regional Revenue Shares, 2022 (%)
Figure 130 Toyota Motor Corporation: Business Segment Revenue Shares, 2022 (%)
Figure 131 Hyundai Motor Company: Net Revenue, 2018-2022 (US$ million, AGR%)
Figure 132 Hyundai Motor Company: R&D, 2018-2022 (US$ million, AGR%)
Figure 133 Hyundai Motor Company: Regional Revenue Shares, 2021 (%)
Figure 134 Hyundai Motor Company: Business Segment Revenue Shares, 2021 (%)
Figure 135 General Motors Company: Net Revenue, 2018-2022 (US$ million, AGR%)
Figure 136 General Motors Company: R&D, 2018-2022 (US$ million, AGR%)
Figure 137 General Motors Company: Regional Revenue Shares, 2021 (%)
Figure 138 Mercedes-Benz Group AG: Net Revenue, 2018-2022 (US$ million, AGR%)
Figure 139 Mercedes-Benz Group AG: R&D, 2018-2022 (US$ million, AGR%)
Figure 140 Mercedes-Benz Group AG: Regional Revenue Shares, 2022 (%)
Figure 141 Mercedes-Benz Group AG: Business Segment Revenue Shares, 2022 (%)
Figure 142 Bayerische Motoren Werke AG: Net Revenue, 2018-2022 (US$ million, AGR%)
Figure 143 Bayerische Motoren Werke AG: R&D, 2018-2022 (US$ million, AGR%)
Figure 144 Bayerische Motoren Werke AG: Regional Revenue Shares, 2022 (%)
Figure 145 Bayerische Motoren Werke AG: Business Segment Revenue Shares, 2022 (%)
Figure 146 Nikola Corporation: Net Revenue, 2018-2022 (US$ million, AGR%)
Figure 147 Nikola Corporation: R&D, 2018-2022 (US$ million, AGR%)
Figure 148 Air Liquide: Net Revenue, 2018-2022 (US$ million, AGR%)
Figure 149 Air Liquide: R&D, 2018-2022 (US$ million, AGR%)
Figure 150 Air Liquide: Regional Revenue Shares, 2022 (%)
Figure 151 Air Liquide: Business Segment Revenue Shares, 2022 (%)
Figure 152 Linde plc: Net Revenue, 2018-2022 (US$ million, AGR%)
Figure 153 Linde plc: R&D, 2018-2022 (US$ million, AGR%)
Figure 154 Linde plc: Regional Revenue Shares, 2022 (%)
Figure 155 Linde plc: Business Segment Revenue Shares, 2022 (%)
Figure 156 Cummins Inc.: Net Revenue, 2018-2022 (US$ million, AGR%)
Figure 157 Cummins Inc.: R&D, 2018-2022 (US$ million, AGR%)
Figure 158 Cummins Inc.: Regional Revenue Shares, 2022 (%)
Figure 159 Cummins Inc.: Business Segment Revenue Shares, 2022 (%)
Figure 160 Nel Hydrogen: Net Revenue, 2018-2022 (US$ million, AGR%)
Figure 161 Nel Hydrogen: R&D, 2018-2022 (US$ million, AGR%)
Figure 162 Nel Hydrogen: Regional Revenue Shares, 2022 (%)
Figure 163 Nel Hydrogen: Business Segment Revenue Shares, 2022 (%)
Figure 164 Ballard Power Systems Inc.: Net Revenue, 2018-2022 (US$ million, AGR%)
Figure 165 Ballard Power Systems Inc.: R&D, 2018-2022 (US$ million, AGR%)
Figure 166 Ballard Power Systems Inc.: Regional Revenue Shares, 2022 (%)
Figure 167 Ballard Power Systems Inc.: Business Segment Revenue Shares, 2022 (%)
Figure 168 Plug Power Inc.: Net Revenue, 2018-2022 (US$ million, AGR%)
Figure 169 Plug Power Inc.: R&D, 2018-2022 (US$ million, AGR%)
Figure 170 Plug Power Inc.: Regional Revenue Shares, 2022 (%)
ページTOPに戻る
Summary
Report Details
The Hydrogen Fuel Cell Vehicles (FCVs) Market Report 2023-2033: This report will prove invaluable to leading firms striving for new revenue pockets if they wish to better understand the industry and its underlying dynamics. It will be useful for companies that would like to expand into different industries or to expand their existing operations in a new region.
Increasing Environmental Regulations, Advancements in Technology, and a Growing Demand for Sustainable Transportation Options
the hydrogen fuel cell vehicle market is experiencing significant growth due to a combination of factors, including increasing environmental regulations, advancements in technology, and a growing demand for sustainable transportation options. While the market is currently dominated by a few major players such as Toyota, Hyundai, and Honda, there is potential for new entrants to make an impact as the market expands.
Government initiatives and investments in hydrogen infrastructure will also play a significant role in the market’s growth, particularly in regions such as Europe, Asia, and California, where there are already significant efforts to establish a hydrogen economy. The availability and affordability of hydrogen fuel, as well as the development of supporting infrastructure such as refuelling stations, will be critical to the market’s success. However, there are also challenges such as high costs, limited range, and a lack of public awareness that will need to be addressed.
Overall, the hydrogen fuel cell vehicle market has the potential to revolutionise the transportation industry, providing a sustainable alternative to traditional gasoline-powered vehicles. With continued technological advancements and support from governments and industry players, the market is poised for significant growth in the coming years.
What Questions Should You Ask before Buying a Market Research Report?
• How is the hydrogen fuel cell vehicles (FCVs) market evolving?
• What is driving and restraining the hydrogen fuel cell vehicles (FCVs) market?
• How will each hydrogen fuel cell vehicles (FCVs) submarket segment grow over the forecast period and how much revenue will these submarkets account for in 2033?
• How will the market shares for each hydrogen fuel cell vehicles (FCVs) submarket develop from 2023 to 2033?
• What will be the main driver for the overall market from 2023 to 2033?
• Will leading hydrogen fuel cell vehicles (FCVs) markets broadly follow the macroeconomic dynamics, or will individual national markets outperform others?
• How will the market shares of the national markets change by 2033 and which geographical region will lead the market in 2033?
• Who are the leading players and what are their prospects over the forecast period?
• What are the hydrogen fuel cell vehicles (FCVs) projects for these leading companies?
• How will the industry evolve during the period between 2023 and 2033? What are the implications of hydrogen fuel cell vehicles (FCVs) projects taking place now and over the next 10 years?
• Is there a greater need for product commercialisation to further scale the hydrogen fuel cell vehicles (FCVs) market?
• Where is the hydrogen fuel cell vehicles (FCVs) market heading and how can you ensure you are at the forefront of the market?
• What are the best investment options for new product and service lines?
• What are the key prospects for moving companies into a new growth path and C-suite?
You need to discover how this will impact the hydrogen fuel cell vehicles (FCVs) market today, and over the next 10 years:
• Our 331-page report provides 112 tables and 170 charts/graphs exclusively to you.
• The report highlights key lucrative areas in the industry so you can target them – NOW.
• It contains in-depth analysis of global, regional and national sales and growth.
• It highlights for you the key successful trends, changes and revenue projections made by your competitors.
This report tells you TODAY how the hydrogen fuel cell vehicles (FCVs) market will develop in the next 10 years, and in line with the variations in COVID-19 economic recession and bounce. This market is more critical now than at any point over the last 10 years.
Forecasts to 2033 and other analyses reveal commercial prospects
• In addition to revenue forecasting to 2033, our new study provides you with recent results, growth rates, and market shares.
• You will find original analyses, with business outlooks and developments.
• Discover qualitative analyses (including market dynamics, drivers, opportunities, restraints and challenges), cost structure, impact of rising hydrogen fuel cell vehicles (FCVs) prices and recent developments.
This report includes data analysis and invaluable insight into how COVID-19 will affect the industry and your company. Four COVID-19 recovery patterns and their impact, namely, “V”, “L”, “W” and “U” are discussed in this report.
Segments Covered in the Report
Market Segment by Technology
• Proton Exchange Membrane (PEM)
• Alkaline Fuel Cells (AFCs)
• Solid Oxide Fuel Cells (SOFCs)
• Direct Methanol Fuel Cells (DMFCs)
Market Segment by Vehicle Type
• Passenger Cars
• Commercial Vehicles
• Material Handling Vehicles
• Military Vehicles
• Other Vehicles
Market Segment by Component
• Fuel Cell Stack
• Hydrogen Tanks
• Battery
• Electric Motor
• Power Electronics
• Other Components
In addition to the revenue predictions for the overall world market and segments, you will also find revenue forecasts for four regional and 20 leading national markets:
North America
• U.S.
• Canada
Europe
• Germany
• Spain
• United Kingdom
• France
• Italy
• Rest of Europe
Asia Pacific
• China
• Japan
• India
• Australia
• South Korea
• Rest of Asia Pacific
Latin America
• Brazil
• Mexico
• Rest of Latin America
Middle East & Africa
• GCC
• South Africa
• Rest of Middle East & Africa
The report also includes profiles and for some of the leading companies in the Hydrogen Fuel Cell Vehicles (FCVs) Market, 2023 to 2033, with a focus on this segment of these companies’ operations.
Leading companies and the potential for market growth
• Air Liquide
• Ballard Power Systems Inc.
• Bayerische Motoren Werke AG
• Cummins Inc.
• General Motors Company
• Honda Motor Co., Ltd.
• Horizon Fuel Cell Technologies
• Hyundai Motor Company
• Linde plc
• Mercedes-Benz Group AG
• Nel Hydrogen
• Nikola Corporation
• Plug Power Inc.
• Riversimple
• Toyota Motor Corporation
Overall world revenue for Hydrogen Fuel Cell Vehicles (FCVs) Market, 2023 to 2033 in terms of value the market will surpass US$10.46 billion in 2023, our work calculates. We predict strong revenue growth through to 2033. Our work identifies which organisations hold the greatest potential. Discover their capabilities, progress, and commercial prospects, helping you stay ahead.
How will the Hydrogen Fuel Cell Vehicles (FCVs) Market, 2023 to 2033 report help you?
In summary, our 330+ page report provides you with the following knowledge:
• Revenue forecasts to 2033 for Hydrogen Fuel Cell Vehicles (FCVs) Market, 2023 to 2033 Market, with forecasts for technology, vehicle type, and component, each forecast at a global and regional level – discover the industry’s prospects, finding the most lucrative places for investments and revenues.
• Revenue forecasts to 2033 for four regional and 20 key national markets – See forecasts for the Hydrogen Fuel Cell Vehicles (FCVs) Market, 2023 to 2033 market in North America, Europe, Asia-Pacific, Latin America and Middle East & Africa. Also forecasted is the market in the US, Canada, Brazil, Germany, France, UK, Italy, China, India, Japan, and Australia among other prominent economies.
• Prospects for established firms and those seeking to enter the market – including company profiles for 15 of the major companies involved in the hydrogen fuel cell vehicles (FCVs) Market, 2023 to 2033.
Find quantitative and qualitative analyses with independent predictions. Receive information that only our report contains, staying informed with invaluable business intelligence.
Information found nowhere else
With our new report, you are less likely to fall behind in knowledge or miss out on opportunities. See how our work could benefit your research, analyses, and decisions. Visiongain’s study is for everybody needing commercial analyses for the Hydrogen Fuel Cell Vehicles (FCVs) Market, 2023 to 2033, market-leading companies. You will find data, trends and predictions.
ページTOPに戻る
Table of Contents
Table of Contetns
1 Report Overview
1.1 Objectives of the Study
1.2 Introduction to Hydrogen Fuel Cell Vehicles (FCVs) Market
1.3 What This Report Delivers
1.4 Why You Should Read This Report
1.5 Key Questions Answered by This Analytical Report
1.6 Who is This Report for?
1.7 Research Methodology
1.7.1 Market Definitions
1.7.2 Market Evaluation & Forecasting Methodology
1.7.3 Data Validation
1.7.3.1 Primary Research
1.7.3.2 Secondary Research
1.8 Frequently Asked Questions (FAQs)
1.9 Associated Visiongain Reports
1.10 About Visiongain
2 Executive Summary
3 Market Overview
3.1 Key Findings
3.2 Market Dynamics
3.2.1 Market Driving Factors
3.2.1.1 Increasing Government Support and Investments for Hydrogen Fuel Cell Technology
3.2.1.2 Growing Demand for Alternative Energy Sources and Cleaner Transportation Solutions
3.2.1.3 Growing Public Awareness and Acceptance of Hydrogen Fuel Cell Technology and Its Benefits
3.2.2 Market Restraining Factors
3.2.2.1 High Upfront Costs Associated with Hydrogen Fuel Cell Vehicles
3.2.2.2 Limited Availability of Hydrogen Fuelling Stations
3.2.2.3 Challenges Associated with Storing and Transporting Hydrogen
3.2.3 Market Opportunities
3.2.3.1 The Potential to Develop and Expand the Hydrogen Fuelling Infrastructure
3.2.3.2 The Potential for Hydrogen Fuel Cell Technology to Play a Role in the Decarbonization of the Shipping and Aviation Industries
3.2.3.3 Collaboration Between Government, Industry, and Academic Institutions to Further Research and Development of Hydrogen Fuel Cell Technology
3.3 COVID-19 Impact Analysis
3.3.1 V-Shaped Recovery Scenario
3.3.2 W-Shaped Recovery Scenario
3.3.3 U-Shaped Recovery Scenario
3.3.4 L-Shaped Recovery Scenario
3.4 Swot Analysis
3.4.1 Strengths
3.4.2 Weaknesses
3.4.3 Opportunities
3.4.4 Threats
3.5 Porter’s Five Forces Analysis
3.5.1 Threat of New Entrants
3.5.2 Bargaining Power of Suppliers
3.5.3 Bargaining Power of Buyers
3.5.4 Threat of Substitutes
3.5.5 Intensity of Competitive Rivalry
3.6 PESTLE Analysis
3.6.1 Political Factors
3.6.2 Economic Factors
3.6.3 Sociocultural Factors
3.6.4 Technological Factors
3.6.5 Legal Factors
3.6.6 Environmental Factors
3.7 Recent Developments in the Market
4 Hydrogen Fuel Cell Vehicles (FCVs) Market Analysis by Technology
4.1 Key Findings
4.2 Technology Segment: Market Attractiveness Index
4.2.1 Hydrogen Fuel Cell Vehicles (FCVs) Market by Technology
4.3 Proton Exchange Membrane (PEM)
4.3.1 Market by Region, 2023-2033 (US$B)
4.3.2 Market Share by Region, 2023 & 2033 (%)
4.4 Alkaline Fuel Cells (AFCs)
4.4.1 Market by Region, 2023-2033 (US$ Bn)
4.4.2 Market Share by Region, 2023 & 2033 (%)
4.5 Solid Oxide Fuel Cells (SOFCs)
4.5.1 Market by Region, 2023-2033 (US$ Bn)
4.5.2 Market Share by Region, 2023 & 2033 (%)
4.6 Direct Methanol Fuel Cells (DMFCs)
4.6.1 Market by Region, 2023-2033 (US$ Bn)
4.6.2 Market Share by Region, 2023 & 2033 (%)
5 Hydrogen Fuel Cell Vehicles (FCVs) Market Analysis by Vehicle Type
5.1 Key Findings
5.2 Vehicle Type Segment: Market Attractiveness Index
5.2.1 Hydrogen Fuel Cell Vehicles (FCVs) Market by Vehicle Type
5.3 Passenger Cars
5.3.1 Market by Region, 2023-2033 (US$ Bn)
5.3.2 Market Share by Region, 2023 & 2033 (%)
5.4 Commercial Vehicles
5.4.1 Market by Region, 2023-2033 (US$ Bn)
5.4.2 Market Share by Region, 2023 & 2033 (%)
5.5 Material Handling Vehicles
5.5.1 Market by Region, 2023-2033 (US$ Bn)
5.5.2 Market Share by Region, 2023 & 2033 (%)
5.6 Military Vehicles
5.6.1 Market by Region, 2023-2033 (US$ Bn)
5.6.2 Market Share by Region, 2023 & 2033 (%)
5.7 Other Vehicles
5.7.1 Market by Region, 2023-2033 (US$ Bn)
5.7.2 Market Share by Region, 2023 & 2033 (%)
6 Hydrogen Fuel Cell Vehicles (FCVs) Market Analysis by Components
6.1 Key Findings
6.2 Components Segment: Market Attractiveness Index
6.2.1 Hydrogen Fuel Cell Vehicles (FCVs) Market by Component
6.3 Fuel Cell Stack
6.3.1 Market by Region, 2023-2033 (US$ Bn)
6.3.2 Market Share by Region, 2023 & 2033 (%)
6.4 Hydrogen Tanks
6.4.1 Market by Region, 2023-2033 (US$ Bn)
6.4.2 Market Share by Region, 2023 & 2033 (%)
6.5 Battery
6.5.1 Market by Region, 2023-2033 (US$ Bn)
6.5.2 Market Share by Region, 2023 & 2033 (%)
6.6 Electric Motor
6.6.1 Market by Region, 2023-2033 (US$ Bn)
6.6.2 Market Share by Region, 2023 & 2033 (%)
6.7 Power Electronics
6.7.1 Market by Region, 2023-2033 (US$ Bn)
6.7.2 Market Share by Region, 2023 & 2033 (%)
6.8 Other Components
6.8.1 Market by Region, 2023-2033 (US$ Bn)
6.8.2 Market Share by Region, 2023 & 2033 (%)
7 North America Hydrogen Fuel Cell Vehicles (FCVs) Market Analysis
7.1 Key Findings
7.2 North America Hydrogen Fuel Cell Vehicles (FCVs) Market Attractiveness Index
7.3 North America Hydrogen Fuel Cell Vehicles (FCVs) Market by Country, 2023, 2028 & 2033 (US$ Billion)
7.4 North America Hydrogen Fuel Cell Vehicles (FCVs) Market by Value
7.5 North America Hydrogen Fuel Cell Vehicles (FCVs) Market by Country
7.6 North America Hydrogen Fuel Cell Vehicles (FCVs) Market by Technology
7.7 North America Hydrogen Fuel Cell Vehicles (FCVs) Market by Vehicle Type
7.8 North America Hydrogen Fuel Cell Vehicles (FCVs) Market by Component
7.9 U.S. Hydrogen Fuel Cell Vehicles (FCVs) Market Analysis
7.10 Canada Hydrogen Fuel Cell Vehicles (FCVs) Market Analysis
8 Europe Hydrogen Fuel Cell Vehicles (FCVs) Market Analysis
8.1 Key Findings
8.2 Europe Hydrogen Fuel Cell Vehicles (FCVs) Market Attractiveness Index
8.3 Europe Hydrogen Fuel Cell Vehicles (FCVs) Market by Country, 2023, 2028 & 2033 (US$ Billion)
8.4 Europe Hydrogen Fuel Cell Vehicles (FCVs) Market by Value
8.5 Europe Hydrogen Fuel Cell Vehicles (FCVs) Market by Country
8.6 Europe Hydrogen Fuel Cell Vehicles (FCVs) Market by Technology
8.7 Europe Hydrogen Fuel Cell Vehicles (FCVs) Market by Vehicle Type
8.8 Europe Hydrogen Fuel Cell Vehicles (FCVs) Market by Component
8.9 Germany Hydrogen Fuel Cell Vehicles (FCVs) Market Analysis
8.10 UK Hydrogen Fuel Cell Vehicles (FCVs) Market Analysis
8.11 France Hydrogen Fuel Cell Vehicles (FCVs) Market Analysis
8.12 Italy Hydrogen Fuel Cell Vehicles (FCVs) Market Analysis
8.13 Spain Hydrogen Fuel Cell Vehicles (FCVs) Market Analysis
8.14 Rest of Europe Hydrogen Fuel Cell Vehicles (FCVs) Market Analysis
9 Asia-Pacific Hydrogen Fuel Cell Vehicles (FCVs) Market Analysis
9.1 Key Findings
9.2 Asia-Pacific Hydrogen Fuel Cell Vehicles (FCVs) Market Attractiveness Index
9.3 Asia-Pacific Hydrogen Fuel Cell Vehicles (FCVs) Market by Country, 2023, 2028 & 2033 (US$ Billion)
9.4 Asia-Pacific Hydrogen Fuel Cell Vehicles (FCVs) Market by Value
9.5 Asia-Pacific Hydrogen Fuel Cell Vehicles (FCVs) Market by Country
9.6 Asia-Pacific Hydrogen Fuel Cell Vehicles (FCVs) Market by Technology
9.7 Asia-Pacific Hydrogen Fuel Cell Vehicles (FCVs) Market by Vehicle Type
9.8 Asia-Pacific Hydrogen Fuel Cell Vehicles (FCVs) Market by Component
9.9 China Hydrogen Fuel Cell Vehicles (FCVs) Market Analysis
9.10 India Hydrogen Fuel Cell Vehicles (FCVs) Market Analysis
9.11 Japan Hydrogen Fuel Cell Vehicles (FCVs) Market Analysis
9.12 South Korea Hydrogen Fuel Cell Vehicles (FCVs) Market Analysis
9.13 Australia Hydrogen Fuel Cell Vehicles (FCVs) Market Analysis
9.14 Rest of Asia-Pacific Hydrogen Fuel Cell Vehicles (FCVs) Market Analysis
10 Middle East & Africa Hydrogen Fuel Cell Vehicles (FCVs) Market Analysis
10.1 Key Findings
10.2 Middle East & Africa Hydrogen Fuel Cell Vehicles (FCVs) Market Attractiveness Index
10.3 Middle East & Africa Hydrogen Fuel Cell Vehicles (FCVs) Market by Country, 2023, 2028 & 2033 (US$ Billion)
10.4 Middle East & Africa Hydrogen Fuel Cell Vehicles (FCVs) Market by Value
10.5 Middle East & Africa Hydrogen Fuel Cell Vehicles (FCVs) Market by Country
10.6 Middle East & Africa Hydrogen Fuel Cell Vehicles (FCVs) Market by Technology
10.7 Middle East & Africa Hydrogen Fuel Cell Vehicles (FCVs) Market by Vehicle Type
10.8 Middle East & Africa Hydrogen Fuel Cell Vehicles (FCVs) Market by Component
10.9 GCC Hydrogen Fuel Cell Vehicles (FCVs) Market Analysis
10.10 South Africa Hydrogen Fuel Cell Vehicles (FCVs) Market Analysis
10.11 Rest of Middle East & Africa Hydrogen Fuel Cell Vehicles (FCVs) Market Analysis
11 Latin America Hydrogen Fuel Cell Vehicles (FCVs) Market Analysis
11.1 Key Findings
11.2 Latin America Hydrogen Fuel Cell Vehicles (FCVs) Market Attractiveness Index
11.3 Latin America Hydrogen Fuel Cell Vehicles (FCVs) Market by Country, 2023, 2028 & 2033 (US$ Billion)
11.4 Latin America Hydrogen Fuel Cell Vehicles (FCVs) Market by Value
11.5 Latin America Hydrogen Fuel Cell Vehicles (FCVs) Market by Country
11.6 Latin America Hydrogen Fuel Cell Vehicles (FCVs) Market by Technology
11.7 Latin America Hydrogen Fuel Cell Vehicles (FCVs) Market by Vehicle Type
11.8 Latin America Hydrogen Fuel Cell Vehicles (FCVs) Market by Component
11.9 Brazil Hydrogen Fuel Cell Vehicles (FCVs) Market Analysis
11.10 Mexico Hydrogen Fuel Cell Vehicles (FCVs) Market Analysis
11.11 Rest of Latin America Hydrogen Fuel Cell Vehicles (FCVs) Market Analysis
12 Company Profiles
12.1 Competitive Landscape, 2022
12.2 Strategic Outlook
12.2.1 Agreement as Business Strategy
12.2.2 Collaboration as Business Strategy
12.2.3 Contract as Business Strategy
12.2.4 Expansion as Business Strategy
12.2.5 Investment as Business Strategy
12.2.6 Joint Venture as Business Strategy
12.2.7 New Product Launch as Business Strategy
12.2.8 Partnership as Business Strategy
12.3 Honda Motor Co., Ltd.
12.3.1 Company Snapshot
12.3.2 Company Overview
12.3.3 Financial Analysis
12.3.3.1 Net Revenue, 2018-2022
12.3.3.2 R&D, 2018-2022
12.3.3.3 Regional Revenue Shares, 2022 (%)
12.3.4 Product Benchmarking
12.3.5 Strategic Outlook
12.4 Toyota Motor Corporation
12.4.1 Company Snapshot
12.4.2 Company Overview
12.4.3 Financial Analysis
12.4.3.1 Net Revenue, 2018-2022
12.4.3.2 R&D, 2018-2022
12.4.3.3 Regional Revenue Shares, 2022 (%)
12.4.3.4 Business Segment Revenue Shares, 2022 (%)
12.4.4 Product Benchmarking
12.4.5 Strategic Outlook
12.5 Hyundai Motor Company
12.5.1 Company Snapshot
12.5.2 Company Overview
12.5.3 Financial Analysis
12.5.3.1 Net Revenue, 2018-2022
12.5.3.2 R&D, 2018-2022
12.5.3.3 Regional Revenue Shares, 2021 (%)
12.5.3.4 Business Segment Revenue Shares, 2021 (%)
12.5.4 Product Benchmarking
12.5.5 Strategic Outlook
12.6 General Motors Company
12.6.1 Company Snapshot
12.6.2 Company Overview
12.6.3 Financial Analysis
12.6.3.1 Net Revenue, 2018-2022
12.6.3.2 R&D, 2018-2022
12.6.3.3 Regional Revenue Shares, 2021 (%)
12.6.4 Product Benchmarking
12.6.5 Strategic Outlook
12.7 Mercedes-Benz Group AG
12.7.1 Company Snapshot
12.7.2 Company Overview
12.7.3 Financial Analysis
12.7.3.1 Net Revenue, 2018-2022
12.7.3.2 R&D, 2018-2022
12.7.3.3 Regional Revenue Shares, 2022 (%)
12.7.3.4 Business Segment Revenue Shares, 2022 (%)
12.7.4 Product Benchmarking
12.7.5 Strategic Outlook
12.8 Bayerische Motoren Werke AG
12.8.1 Company Snapshot
12.8.2 Company Overview
12.8.3 Financial Analysis
12.8.3.1 Net Revenue, 2018-2022
12.8.3.2 R&D, 2018-2022
12.8.3.3 Regional Revenue Shares, 2022 (%)
12.8.3.4 Business Segment Revenue Shares, 2022 (%)
12.8.4 Product Benchmarking
12.8.5 Strategic Outlook
12.9 Nikola Corporation
12.9.1 Company Snapshot
12.9.2 Company Overview
12.9.3 Financial Analysis
12.9.3.1 Net Revenue, 2018-2022
12.9.3.2 R&D, 2018-2022
12.9.4 Product Benchmarking
12.9.5 Strategic Outlook
12.10 Air Liquide
12.10.1 Company Snapshot
12.10.2 Company Overview
12.10.3 Financial Analysis
12.10.3.1 Net Revenue, 2018-2022
12.10.3.2 R&D, 2018-2022
12.10.3.3 Regional Revenue Shares, 2022 (%)
12.10.3.4 Business Segment Revenue Shares, 2022 (%)
12.10.4 Product Benchmarking
12.10.5 Strategic Outlook
12.11 Linde plc
12.11.1 Company Snapshot
12.11.2 Company Overview
12.11.3 Financial Analysis
12.11.3.1 Net Revenue, 2018-2022
12.11.3.2 R&D, 2018-2022
12.11.3.3 Regional Revenue Shares, 2022 (%)
12.11.3.4 Business Segment Revenue Shares, 2022 (%)
12.11.4 Product Benchmarking
12.11.5 Strategic Outlook
12.12 Cummins Inc.
12.12.1 Company Snapshot
12.12.2 Company Overview
12.12.3 Financial Analysis
12.12.3.1 Net Revenue, 2018-2022
12.12.3.2 R&D, 2018-2022
12.12.3.3 Regional Revenue Shares, 2022 (%)
12.12.3.4 Business Segment Revenue Shares, 2022 (%)
12.12.4 Product Benchmarking
12.12.5 Strategic Outlook
12.13 Nel Hydrogen
12.13.1 Company Snapshot
12.13.2 Company Overview
12.13.3 Financial Analysis
12.13.3.1 Net Revenue, 2018-2022
12.13.3.2 R&D, 2018-2022
12.13.3.3 Regional Revenue Shares, 2022 (%)
12.13.3.4 Business Segment Revenue Shares, 2022 (%)
12.13.4 Product Benchmarking
12.13.5 Strategic Outlook
12.14 Riversimple
12.14.1 Company Snapshot
12.14.2 Company Overview
12.14.3 Product Benchmarking
12.15 Horizon Fuel Cell Technologies
12.15.1 Company Snapshot
12.15.2 Company Overview
12.15.3 Product Benchmarking
12.15.4 Strategic Outlook
12.16 Ballard Power Systems Inc.
12.16.1 Company Snapshot
12.16.2 Company Overview
12.16.3 Financial Analysis
12.16.3.1 Net Revenue, 2018-2022
12.16.3.2 R&D, 2018-2022
12.16.3.3 Regional Revenue Shares, 2022 (%)
12.16.3.4 Business Segment Revenue Shares, 2022 (%)
12.16.4 Product Benchmarking
12.16.5 Strategic Outlook
12.17 Plug Power Inc.
12.17.1 Company Snapshot
12.17.2 Company Overview
12.17.3 Financial Analysis
12.17.3.1 Net Revenue, 2018-2022
12.17.3.2 R&D, 2018-2022
12.17.3.3 Regional Revenue Shares, 2022 (%)
12.17.4 Product Benchmarking
12.17.5 Strategic Outlook
13 Conclusion and Recommendations
13.1 Concluding Remarks from Visiongain
13.2 Recommendations for Market Players
ページTOPに戻る
List of Tables/Graphs
List of Tables
Table 1 Hydrogen Fuel Cell Vehicles (FCVs) Market Snapshot, 2023 & 2033 (US$ Billion, CAGR %)
Table 2 Hydrogen Fuel Cell Vehicles (FCVs) Market by Region, 2023-2033 (US$ Bn, AGR (%), CAGR (%)) (V-Shaped Recovery Scenario)
Table 3 Hydrogen Fuel Cell Vehicles (FCVs) Market by Region, 2023-2033 (US$ Bn, AGR (%), CAGR (%)) (W-Shaped Recovery Scenario)
Table 4 Hydrogen Fuel Cell Vehicles (FCVs) Market by Region, 2023-2033 (US$ Bn, AGR (%), CAGR (%)) (U-Shaped Recovery Scenario)
Table 5 Hydrogen Fuel Cell Vehicles (FCVs) Market by Region, 2023-2033 (US$ Bn, AGR (%), CAGR (%)) (L-Shaped Recovery Scenario)
Table 6 Hydrogen Fuel Cell Vehicles (FCVs) Market by Technology, 2023-2033 (US$ Bn, AGR (%), CAGR (%))
Table 7 Proton Exchange Membrane (PEM) Market by Region, 2023-2033 (US$ Bn, AGR (%), CAGR (%))
Table 8 Alkaline Fuel Cells (AFCs) Market by Region, 2023-2033 (US$ Bn, AGR (%), CAGR (%))
Table 9 Solid Oxide Fuel Cells (SOFCs) Market by Region, 2023-2033 (US$ Bn, AGR (%), CAGR (%))
Table 10 Direct Methanol Fuel Cells (DMFCs) Market by Region, 2023-2033 (US$ Bn, AGR (%), CAGR (%))
Table 11 Hydrogen Fuel Cell Vehicles (FCVs) Market by Vehicle Type, 2023-2033 (US$ Bn, AGR (%), CAGR (%))
Table 12 Passenger Cars Market by Region, 2023-2033 (US$ Bn, AGR (%), CAGR (%))
Table 13 Commercial Vehicles Market by Region, 2023-2033 (US$ Bn, AGR (%), CAGR (%))
Table 14 Material Handling Vehicles Market by Region, 2023-2033 (US$ Bn, AGR (%), CAGR (%))
Table 15 Military Vehicles Market by Region, 2023-2033 (US$ Bn, AGR (%), CAGR (%))
Table 16 Other Vehicles Market by Region, 2023-2033 (US$ Bn, AGR (%), CAGR (%))
Table 17 Hydrogen Fuel Cell Vehicles (FCVs) Market by Component, 2023-2033 (US$ Bn, AGR (%), CAGR (%))
Table 18 Fuel Cell Stack Market by Region, 2023-2033 (US$ Bn, AGR (%), CAGR (%))
Table 19 Hydrogen Tanks Market by Region, 2023-2033 (US$ Bn, AGR (%), CAGR (%))
Table 20 Battery Market by Region, 2023-2033 (US$ Bn, AGR (%), CAGR (%))
Table 21 Electric Motor Market by Region, 2023-2033 (US$ Bn, AGR (%), CAGR (%))
Table 22 Power Electronics Market by Region, 2023-2033 (US$ Bn, AGR (%), CAGR (%))
Table 23 Other Components Market by Region, 2023-2033 (US$ Bn, AGR (%), CAGR (%))
Table 24 North America Hydrogen Fuel Cell Vehicles (FCVs) Market by Value, 2023-2033 (US$ Bn, AGR (%), CAGR (%))
Table 25 North America Hydrogen Fuel Cell Vehicles (FCVs) Market by Country, 2023-2033 (US$ Bn, AGR (%), CAGR (%))
Table 26 North America Hydrogen Fuel Cell Vehicles (FCVs) Market by Technology, 2023-2033 (US$ Bn, AGR (%), CAGR (%))
Table 27 North America Hydrogen Fuel Cell Vehicles (FCVs) Market by Vehicle Type, 2023-2033 (US$ Bn, AGR (%), CAGR (%))
Table 28 North America Hydrogen Fuel Cell Vehicles (FCVs) Market by Component, 2023-2033 (US$ Bn, AGR (%), CAGR (%))
Table 29 US Hydrogen Fuel Cell Vehicles (FCVs) Market by Value, 2023-2033 (US$ Bn, AGR (%), CAGR (%))
Table 30 Canada Hydrogen Fuel Cell Vehicles (FCVs) Market by Value, 2023-2033 (US$ Bn, AGR (%), CAGR (%))
Table 31 Europe Hydrogen Fuel Cell Vehicles (FCVs) Market by Value, 2023-2033 (US$ Bn, AGR (%), CAGR (%))
Table 32 Europe Hydrogen Fuel Cell Vehicles (FCVs) Market by Country, 2023-2033 (US$ Bn, AGR (%), CAGR (%))
Table 33 Europe Hydrogen Fuel Cell Vehicles (FCVs) Market by Technology, 2023-2033 (US$ Bn, AGR (%), CAGR (%))
Table 34 Europe Hydrogen Fuel Cell Vehicles (FCVs) Market by Vehicle Type, 2023-2033 (US$ Bn, AGR (%), CAGR (%))
Table 35 Europe Hydrogen Fuel Cell Vehicles (FCVs) Market by Component, 2023-2033 (US$ Bn, AGR (%), CAGR (%))
Table 36 Germany Hydrogen Fuel Cell Vehicles (FCVs) Market by Value, 2023-2033 (US$ Bn, AGR (%), CAGR (%))
Table 37 UK Hydrogen Fuel Cell Vehicles (FCVs) Market by Value, 2023-2033 (US$ Bn, AGR (%), CAGR (%))
Table 38 France Hydrogen Fuel Cell Vehicles (FCVs) Market by Value, 2023-2033 (US$ Bn, AGR (%), CAGR (%))
Table 39 Italy Hydrogen Fuel Cell Vehicles (FCVs) Market by Value, 2023-2033 (US$ Bn, AGR (%), CAGR (%))
Table 40 Spain Hydrogen Fuel Cell Vehicles (FCVs) Market by Value, 2023-2033 (US$ Bn, AGR (%), CAGR (%))
Table 41 Rest of Europe Hydrogen Fuel Cell Vehicles (FCVs) Market by Value, 2023-2033 (US$ Bn, AGR (%), CAGR (%))
Table 42 Asia-Pacific Hydrogen Fuel Cell Vehicles (FCVs) Market by Value, 2023-2033 (US$ Bn, AGR (%), CAGR (%))
Table 43 Asia-Pacific Hydrogen Fuel Cell Vehicles (FCVs) Market by Country, 2023-2033 (US$ Bn, AGR (%), CAGR (%))
Table 44 Asia-Pacific Hydrogen Fuel Cell Vehicles (FCVs) Market by Technology, 2023-2033 (US$ Bn, AGR (%), CAGR (%))
Table 45 Asia-Pacific Hydrogen Fuel Cell Vehicles (FCVs) Market by Vehicle Type, 2023-2033 (US$ Bn, AGR (%), CAGR (%))
Table 46 Asia-Pacific Hydrogen Fuel Cell Vehicles (FCVs) Market by Component, 2023-2033 (US$ Bn, AGR (%), CAGR (%))
Table 47 China Hydrogen Fuel Cell Vehicles (FCVs) Market by Value, 2023-2033 (US$ Bn, AGR (%), CAGR (%))
Table 48 India Hydrogen Fuel Cell Vehicles (FCVs) Market by Value, 2023-2033 (US$ Bn, AGR (%), CAGR (%))
Table 49 Japan Hydrogen Fuel Cell Vehicles (FCVs) Market by Value, 2023-2033 (US$ Bn, AGR (%), CAGR (%))
Table 50 South Korea Hydrogen Fuel Cell Vehicles (FCVs) Market by Value, 2023-2033 (US$ Bn, AGR (%), CAGR (%))
Table 51 Australia Hydrogen Fuel Cell Vehicles (FCVs) Market by Value, 2023-2033 (US$ Bn, AGR (%), CAGR (%))
Table 52 Rest of Asia-Pacific Hydrogen Fuel Cell Vehicles (FCVs) Market by Value, 2023-2033 (US$ Bn, AGR (%), CAGR (%))
Table 53 Middle East & Africa Hydrogen Fuel Cell Vehicles (FCVs) Market by Value, 2023-2033 (US$ Bn, AGR (%), CAGR (%))
Table 54 Middle East & Africa Hydrogen Fuel Cell Vehicles (FCVs) Market by Country, 2023-2033 (US$ Bn, AGR (%), CAGR (%))
Table 55 Middle East & Africa Hydrogen Fuel Cell Vehicles (FCVs) Market by Technology, 2023-2033 (US$ Bn, AGR (%), CAGR (%))
Table 56 Middle East & Africa Hydrogen Fuel Cell Vehicles (FCVs) Market by Vehicle Type, 2023-2033 (US$ Bn, AGR (%), CAGR (%))
Table 57 Middle East & Africa Hydrogen Fuel Cell Vehicles (FCVs) Market by Component, 2023-2033 (US$ Bn, AGR (%), CAGR (%))
Table 58 GCC Hydrogen Fuel Cell Vehicles (FCVs) Market by Value, 2023-2033 (US$ Bn, AGR (%), CAGR (%))
Table 59 South Africa Hydrogen Fuel Cell Vehicles (FCVs) Market by Value, 2023-2033 (US$ Bn, AGR (%), CAGR (%))
Table 60 Rest of Middle East & Africa Hydrogen Fuel Cell Vehicles (FCVs) Market by Value, 2023-2033 (US$ Bn, AGR (%), CAGR (%))
Table 61 Latin America Hydrogen Fuel Cell Vehicles (FCVs) Market by Value, 2023-2033 (US$ Bn, AGR (%), CAGR (%))
Table 62 Latin America Hydrogen Fuel Cell Vehicles (FCVs) Market by Country, 2023-2033 (US$ Bn, AGR (%), CAGR (%))
Table 63 Latin America Hydrogen Fuel Cell Vehicles (FCVs) Market by Technology, 2023-2033 (US$ Bn, AGR (%), CAGR (%))
Table 64 Latin America Hydrogen Fuel Cell Vehicles (FCVs) Market by Vehicle Type, 2023-2033 (US$ Bn, AGR (%), CAGR (%))
Table 65 Latin America Hydrogen Fuel Cell Vehicles (FCVs) Market by Component, 2023-2033 (US$ Bn, AGR (%), CAGR (%))
Table 66 Brazil Hydrogen Fuel Cell Vehicles (FCVs) Market by Value, 2023-2033 (US$ Bn, AGR (%), CAGR (%))
Table 67 Mexico Hydrogen Fuel Cell Vehicles (FCVs) Market by Value, 2023-2033 (US$ Bn, AGR (%), CAGR (%))
Table 68 Rest of Latin America Hydrogen Fuel Cell Vehicles (FCVs) Market by Value, 2023-2033 (US$ Bn, AGR (%), CAGR (%))
Table 69 Honda Motor Co., Ltd.: Key Details, (CEO, HQ, Revenue, Founded, No. of Employees, Company Type, Website, Business Segment)
Table 70 Honda Motor Co., Ltd.: Product Benchmarking
Table 71 Honda Motor Co., Ltd.: Strategic Outlook
Table 72 Toyota Motor Corporation: Key Details, (CEO, HQ, Revenue, Founded, No. of Employees, Company Type, Website, Business Segment)
Table 73 Toyota Motor Corporation: Product Benchmarking
Table 74 Toyota Motor Corporation: Strategic Outlook
Table 75 Hyundai Motor Company: Key Details, (CEO, HQ, Revenue, Founded, No. of Employees, Company Type, Website, Business Segment)
Table 76 Hyundai Motor Company: Product Benchmarking
Table 77 Hyundai Motor Company: Strategic Outlook
Table 78 General Motors Company: Key Details, (CEO, HQ, Revenue, Founded, No. of Employees, Company Type, Website, Business Segment)
Table 79 General Motors Company: Product Benchmarking
Table 80 General Motors Company: Strategic Outlook
Table 81 Mercedes-Benz Group AG: Key Details, (CEO, HQ, Revenue, Founded, No. of Employees, Company Type, Website, Business Segment)
Table 82 Mercedes-Benz Group AG: Product Benchmarking
Table 83 Mercedes-Benz Group AG: Strategic Outlook
Table 84 Bayerische Motoren Werke AG: Key Details, (CEO, HQ, Revenue, Founded, No. of Employees, Company Type, Website, Business Segment)
Table 85 Bayerische Motoren Werke AG: Product Benchmarking
Table 86 Bayerische Motoren Werke AG: Strategic Outlook
Table 87 Nikola Corporation: Key Details, (CEO, HQ, Revenue, Founded, No. of Employees, Company Type, Website, Business Segment)
Table 88 Nikola Corporation: Product Benchmarking
Table 89 Nikola Corporation: Strategic Outlook
Table 90 Air Liquide: Key Details, (CEO, HQ, Revenue, Founded, No. of Employees, Company Type, Website, Business Segment)
Table 91 Air Liquide: Product Benchmarking
Table 92 Air Liquide: Strategic Outlook
Table 93 Linde plc: Key Details, (CEO, HQ, Revenue, Founded, No. of Employees, Company Type, Website, Business Segment)
Table 94 Linde plc: Product Benchmarking
Table 95 Linde plc: Strategic Outlook
Table 96 Cummins Inc.: Key Details, (CEO, HQ, Revenue, Founded, No. of Employees, Company Type, Website, Business Segment)
Table 97 Cummins Inc.: Product Benchmarking
Table 98 Cummins Inc.: Strategic Outlook
Table 99 Nel Hydrogen: Key Details, (CEO, HQ, Revenue, Founded, No. of Employees, Company Type, Website, Business Segment)
Table 100 Nel Hydrogen: Product Benchmarking
Table 101 Nel Hydrogen: Strategic Outlook
Table 102 Riversimple: Key Details, (CEO, HQ, Revenue, Founded, No. of Employees, Company Type, Website, Business Segment)
Table 103 Riversimple: Product Benchmarking
Table 104 Horizon Fuel Cell Technologies: Key Details, (CEO, HQ, Revenue, Founded, No. of Employees, Company Type, Website, Business Segment)
Table 105 Horizon Fuel Cell Technologies: Product Benchmarking
Table 106 Horizon Fuel Cell Technologies: Strategic Outlook
Table 107 Ballard Power Systems Inc.: Key Details, (CEO, HQ, Revenue, Founded, No. of Employees, Company Type, Website, Business Segment)
Table 108 Ballard Power Systems Inc.: Product Benchmarking
Table 109 Ballard Power Systems Inc.: Strategic Outlook
Table 110 Plug Power Inc.: Key Details, (CEO, HQ, Revenue, Founded, No. of Employees, Company Type, Website, Business Segment)
Table 111 Plug Power Inc.: Product Benchmarking
Table 112 Plug Power Inc.: Strategic Outlook
List of Figures
Figure 1 Hydrogen Fuel Cell Vehicles (FCVs) Market Segmentation
Figure 2 Hydrogen Fuel Cell Vehicles (FCVs) Market by Technology: Market Attractiveness Index
Figure 3 Hydrogen Fuel Cell Vehicles (FCVs) Market by Vehicle Type: Market Attractiveness Index
Figure 4 Hydrogen Fuel Cell Vehicles (FCVs) Market by Components: Market Attractiveness Index
Figure 5 Hydrogen Fuel Cell Vehicles (FCVs) Market Attractiveness Index by Region
Figure 6 Hydrogen Fuel Cell Vehicles (FCVs) Market: Market Dynamics
Figure 7 Hydrogen Fuel Cell Vehicles (FCVs) Market by Region, 2023-2033 (US$ Bn, AGR (%)) (V-Shaped Recovery Scenario)
Figure 8 Hydrogen Fuel Cell Vehicles (FCVs) Market by Region, 2023-2033 (US$ Bn, AGR (%)) (W-Shaped Recovery Scenario)
Figure 9 Hydrogen Fuel Cell Vehicles (FCVs) Market by Region, 2023-2033 (US$ Bn, AGR (%)) (U-Shaped Recovery Scenario)
Figure 10 Hydrogen Fuel Cell Vehicles (FCVs) Market by Region, 2023-2033 (US$ Bn, AGR (%)) (L-Shaped Recovery Scenario)
Figure 11 Hydrogen Fuel Cell Vehicles (FCVs) Market: Porter’s Five Forces Analysis
Figure 12 Hydrogen Fuel Cell Vehicles (FCVs) Market by Technology: Market Attractiveness Index
Figure 13 Hydrogen Fuel Cell Vehicles (FCVs) Market by Technology, 2023-2033 (US$ Bn, AGR (%))
Figure 14 Proton Exchange Membrane (PEM) Market by Region, 2023-2033 (US$ Bn, AGR (%))
Figure 15 Table 7 Proton Exchange Membrane (PEM) Segment Market Share Forecast by Region, 2023 & 2033 (%)
Figure 16 Alkaline Fuel Cells (AFCs) Market by Region, 2023-2033 (US$ Bn, AGR (%))
Figure 17 Alkaline Fuel Cells (AFCs) Segment Market Share Forecast by Region, 2023 & 2033 (%)
Figure 18 Solid Oxide Fuel Cells (SOFCs) Market by Region, 2023-2033 (US$ Bn, AGR (%))
Figure 19 Solid Oxide Fuel Cells (SOFCs) Segment Market Share Forecast by Region, 2023 & 2033 (%)
Figure 20 Direct Methanol Fuel Cells (DMFCs) Market by Region, 2023-2033 (US$ Bn, AGR (%))
Figure 21 Direct Methanol Fuel Cells (DMFCs) Segment Market Share Forecast by Region, 2023 & 2033 (%)
Figure 22 Hydrogen Fuel Cell Vehicles (FCVs) Market by Vehicle Type: Market Attractiveness Index
Figure 23 Hydrogen Fuel Cell Vehicles (FCVs) Market by Vehicle Type, 2023-2033 (US$ Bn, AGR (%))
Figure 24 Passenger Cars Market by Region, 2023-2033 (US$ Bn, AGR (%))
Figure 25 Passenger Cars Segment Market Share Forecast by Region, 2023 & 2033 (%)
Figure 26 Commercial Vehicles Market by Region, 2023-2033 (US$ Bn, AGR (%))
Figure 27 Commercial Vehicles Segment Market Share Forecast by Region, 2023 & 2033 (%)
Figure 28 Material Handling Vehicles Market by Region, 2023-2033 (US$ Bn, AGR (%))
Figure 29 Material Handling Vehicles Segment Market Share Forecast by Region, 2023 & 2033 (%)
Figure 30 Military Vehicles Market by Region, 2023-2033 (US$ Bn, AGR (%))
Figure 31 Military Vehicles Segment Market Share Forecast by Region, 2023 & 2033 (%)
Figure 32 Other Vehicles Market by Region, 2023-2033 (US$ Bn, AGR (%))
Figure 33 Other Vehicles Segment Market Share Forecast by Region, 2023 & 2033 (%)
Figure 34 Hydrogen Fuel Cell Vehicles (FCVs) Market by Components: Market Attractiveness Index
Figure 35 Hydrogen Fuel Cell Vehicles (FCVs) Market by Component, 2023-2033 (US$ Bn, AGR (%))
Figure 36 Fuel Cell Stack Market by Region, 2023-2033 (US$ Bn, AGR (%))
Figure 37 Fuel Cell Stack Segment Market Share Forecast by Region, 2023 & 2033 (%)
Figure 38 Hydrogen Tanks Market by Region, 2023-2033 (US$ Bn, AGR (%))
Figure 39 Hydrogen Tanks Segment Market Share Forecast by Region, 2023 & 2033 (%)
Figure 40 Battery Market by Region, 2023-2033 (US$ Bn, AGR (%))
Figure 41 Battery Segment Market Share Forecast by Region, 2023 & 2033 (%)
Figure 42 Electric Motor Market by Region, 2023-2033 (US$ Bn, AGR (%))
Figure 43 Electric Motor Segment Market Share Forecast by Region, 2023 & 2033 (%)
Figure 44 Power Electronics Market by Region, 2023-2033 (US$ Bn, AGR (%))
Figure 45 Power Electronics Segment Market Share Forecast by Region, 2023 & 2033 (%)
Figure 46 Other Components Market by Region, 2023-2033 (US$ Bn, AGR (%))
Figure 47 Other Components Segment Market Share Forecast by Region, 2023 & 2033 (%)
Figure 48 North America Hydrogen Fuel Cell Vehicles (FCVs) Market Attractiveness Index
Figure 49 North America Hydrogen Fuel Cell Vehicles (FCVs) Market by Region, 2023, 2028 & 2033 (US$ Billion)
Figure 50 North America Hydrogen Fuel Cell Vehicles (FCVs) Market by Value, 2023-2033 (US$ Bn, AGR (%))
Figure 51 North America Hydrogen Fuel Cell Vehicles (FCVs) Market by Country, 2023-2033 (US$ Bn, AGR (%))
Figure 52 North America Hydrogen Fuel Cell Vehicles (FCVs) Market Share Forecast by Country, 2023 & 2033 (%)
Figure 53 North America Hydrogen Fuel Cell Vehicles (FCVs) Market by Technology, 2023-2033 (US$ Bn, AGR (%))
Figure 54 North America Hydrogen Fuel Cell Vehicles (FCVs) Market Share Forecast by Technology, 2023 & 2033 (%)
Figure 55 North America Hydrogen Fuel Cell Vehicles (FCVs) Market by Vehicle Type, 2023-2033 (US$ Bn, AGR (%))
Figure 56 North America Hydrogen Fuel Cell Vehicles (FCVs) Market Share Forecast by Vehicle Type, 2023 & 2033 (%)
Figure 57 North America Hydrogen Fuel Cell Vehicles (FCVs) Market by Component, 2023-2033 (US$ Bn, AGR (%))
Figure 58 North America Hydrogen Fuel Cell Vehicles (FCVs) Market Share Forecast by Component, 2023 & 2033 (%)
Figure 59 US Hydrogen Fuel Cell Vehicles (FCVs) Market by Value, 2023-2033 (US$ Bn, AGR (%))
Figure 60 Canada Hydrogen Fuel Cell Vehicles (FCVs) Market by Value, 2023-2033 (US$ Bn, AGR (%))
Figure 61 Europe Hydrogen Fuel Cell Vehicles (FCVs) Market Attractiveness Index
Figure 62 Europe Hydrogen Fuel Cell Vehicles (FCVs) Market by Region, 2023, 2028 & 2033 (US$ Billion)
Figure 63 Europe Hydrogen Fuel Cell Vehicles (FCVs) Market by Value, 2023-2033 (US$ Bn, AGR (%))
Figure 64 Europe Hydrogen Fuel Cell Vehicles (FCVs) Market by Country, 2023-2033 (US$ Bn, AGR (%))
Figure 65 Europe Hydrogen Fuel Cell Vehicles (FCVs) Market Share Forecast by Country, 2023 & 2033 (%)
Figure 66 Europe Hydrogen Fuel Cell Vehicles (FCVs) Market by Technology, 2023-2033 (US$ Bn, AGR (%))
Figure 67 Europe Hydrogen Fuel Cell Vehicles (FCVs) Market Share Forecast by Technology, 2023 & 2033 (%)
Figure 68 Europe Hydrogen Fuel Cell Vehicles (FCVs) Market by Vehicle Type, 2023-2033 (US$ Bn, AGR (%))
Figure 69 Europe Hydrogen Fuel Cell Vehicles (FCVs) Market Share Forecast by Vehicle Type, 2023 & 2033 (%)
Figure 70 Europe Hydrogen Fuel Cell Vehicles (FCVs) Market by Component, 2023-2033 (US$ Bn, AGR (%))
Figure 71 Europe Hydrogen Fuel Cell Vehicles (FCVs) Market Share Forecast by Component, 2023 & 2033 (%)
Figure 72 Germany Hydrogen Fuel Cell Vehicles (FCVs) Market by Value, 2023-2033 (US$ Bn, AGR (%))
Figure 73 UK Hydrogen Fuel Cell Vehicles (FCVs) Market by Value, 2023-2033 (US$ Bn, AGR (%))
Figure 74 France Hydrogen Fuel Cell Vehicles (FCVs) Market by Value, 2023-2033 (US$ Bn, AGR (%))
Figure 75 Italy Hydrogen Fuel Cell Vehicles (FCVs) Market by Value, 2023-2033 (US$ Bn, AGR (%))
Figure 76 Spain Hydrogen Fuel Cell Vehicles (FCVs) Market by Value, 2023-2033 (US$ Bn, AGR (%))
Figure 77 Rest of Europe Hydrogen Fuel Cell Vehicles (FCVs) Market by Value, 2023-2033 (US$ Bn, AGR (%))
Figure 78 Asia-Pacific Hydrogen Fuel Cell Vehicles (FCVs) Market Attractiveness Index
Figure 79 Asia-Pacific Hydrogen Fuel Cell Vehicles (FCVs) Market by Region, 2023, 2028 & 2033 (US$ Billion)
Figure 80 Asia-Pacific Hydrogen Fuel Cell Vehicles (FCVs) Market by Value, 2023-2033 (US$ Bn, AGR (%))
Figure 81 Asia-Pacific Hydrogen Fuel Cell Vehicles (FCVs) Market by Country, 2023-2033 (US$ Bn, AGR (%))
Figure 82 Asia-Pacific Hydrogen Fuel Cell Vehicles (FCVs) Market Share Forecast by Country, 2023 & 2033 (%)
Figure 83 Asia-Pacific Hydrogen Fuel Cell Vehicles (FCVs) Market by Technology, 2023-2033 (US$ Bn, AGR (%))
Figure 84 Asia-Pacific Hydrogen Fuel Cell Vehicles (FCVs) Market Share Forecast by Technology, 2023 & 2033 (%)
Figure 85 Asia-Pacific Hydrogen Fuel Cell Vehicles (FCVs) Market by Vehicle Type, 2023-2033 (US$ Bn, AGR (%))
Figure 86 Asia-Pacific Hydrogen Fuel Cell Vehicles (FCVs) Market Share Forecast by Vehicle Type, 2023 & 2033 (%)
Figure 87 Asia-Pacific Hydrogen Fuel Cell Vehicles (FCVs) Market by Component, 2023-2033 (US$ Bn, AGR (%))
Figure 88 Asia-Pacific Hydrogen Fuel Cell Vehicles (FCVs) Market Share Forecast by Component, 2023 & 2033 (%)
Figure 89 China Hydrogen Fuel Cell Vehicles (FCVs) Market by Value, 2023-2033 (US$ Bn, AGR (%))
Figure 90 India Hydrogen Fuel Cell Vehicles (FCVs) Market by Value, 2023-2033 (US$ Bn, AGR (%))
Figure 91 Japan Hydrogen Fuel Cell Vehicles (FCVs) Market by Value, 2023-2033 (US$ Bn, AGR (%))
Figure 92 South Korea Hydrogen Fuel Cell Vehicles (FCVs) Market by Value, 2023-2033 (US$ Bn, AGR (%))
Figure 93 Australia Hydrogen Fuel Cell Vehicles (FCVs) Market by Value, 2023-2033 (US$ Bn, AGR (%))
Figure 94 Rest of Asia-Pacific Hydrogen Fuel Cell Vehicles (FCVs) Market by Value, 2023-2033 (US$ Bn, AGR (%))
Figure 95 Middle East & Africa Hydrogen Fuel Cell Vehicles (FCVs) Market Attractiveness Index
Figure 96 Middle East & Africa Hydrogen Fuel Cell Vehicles (FCVs) Market by Region, 2023, 2028 & 2033 (US$ Billion)
Figure 97 Middle East & Africa Hydrogen Fuel Cell Vehicles (FCVs) Market by Value, 2023-2033 (US$ Bn, AGR (%))
Figure 98 Middle East & Africa Hydrogen Fuel Cell Vehicles (FCVs) Market by Country, 2023-2033 (US$ Bn, AGR (%))
Figure 99 Middle East & Africa Hydrogen Fuel Cell Vehicles (FCVs) Market Share Forecast by Country, 2023 & 2033 (%)
Figure 100 Middle East & Africa Hydrogen Fuel Cell Vehicles (FCVs) Market by Technology, 2023-2033 (US$ Bn, AGR (%))
Figure 101 Middle East & Africa Hydrogen Fuel Cell Vehicles (FCVs) Market Share Forecast by Technology, 2023 & 2033 (%)
Figure 102 Middle East & Africa Hydrogen Fuel Cell Vehicles (FCVs) Market by Vehicle Type, 2023-2033 (US$ Bn, AGR (%))
Figure 103 Middle East & Africa Hydrogen Fuel Cell Vehicles (FCVs) Market Share Forecast by Vehicle Type, 2023 & 2033 (%)
Figure 104 Middle East & Africa Hydrogen Fuel Cell Vehicles (FCVs) Market by Component, 2023-2033 (US$ Bn, AGR (%))
Figure 105 Middle East & Africa Hydrogen Fuel Cell Vehicles (FCVs) Market Share Forecast by Component, 2023 & 2033 (%)
Figure 106 GCC Hydrogen Fuel Cell Vehicles (FCVs) Market by Value, 2023-2033 (US$ Bn, AGR (%))
Figure 107 South Africa Hydrogen Fuel Cell Vehicles (FCVs) Market by Value, 2023-2033 (US$ Bn, AGR (%))
Figure 108 Rest of Middle East & Africa Hydrogen Fuel Cell Vehicles (FCVs) Market by Value, 2023-2033 (US$ Bn, AGR (%))
Figure 109 Latin America Hydrogen Fuel Cell Vehicles (FCVs) Market Attractiveness Index
Figure 110 Latin America Hydrogen Fuel Cell Vehicles (FCVs) Market by Region, 2023, 2028 & 2033 (US$ Billion)
Figure 111 Latin America Hydrogen Fuel Cell Vehicles (FCVs) Market by Value, 2023-2033 (US$ Bn, AGR (%))
Figure 112 Latin America Hydrogen Fuel Cell Vehicles (FCVs) Market by Country, 2023-2033 (US$ Bn, AGR (%))
Figure 113 Latin America Hydrogen Fuel Cell Vehicles (FCVs) Market Share Forecast by Country, 2023 & 2033 (%)
Figure 114 Latin America Hydrogen Fuel Cell Vehicles (FCVs) Market by Technology, 2023-2033 (US$ Bn, AGR (%))
Figure 115 Latin America Hydrogen Fuel Cell Vehicles (FCVs) Market Share Forecast by Technology, 2023 & 2033 (%)
Figure 116 Latin America Hydrogen Fuel Cell Vehicles (FCVs) Market by Vehicle Type, 2023-2033 (US$ Bn, AGR (%))
Figure 117 Latin America Hydrogen Fuel Cell Vehicles (FCVs) Market Share Forecast by Vehicle Type, 2023 & 2033 (%)
Figure 118 Latin America Hydrogen Fuel Cell Vehicles (FCVs) Market by Component, 2023-2033 (US$ Bn, AGR (%))
Figure 119 Latin America Hydrogen Fuel Cell Vehicles (FCVs) Market Share Forecast by Components, 2023 & 2033 (%)
Figure 120 Brazil Hydrogen Fuel Cell Vehicles (FCVs) Market by Value, 2023-2033 (US$ Bn, AGR (%))
Figure 121 Mexico Hydrogen Fuel Cell Vehicles (FCVs) Market by Value, 2023-2033 (US$ Bn, AGR (%))
Figure 122 Rest of Latin America Hydrogen Fuel Cell Vehicles (FCVs) Market by Value, 2023-2033 (US$ Bn, AGR (%))
Figure 123 Hydrogen Fuel Cell Vehicles (FCVs) Market: Company Share, 2022
Figure 124 Honda Motor Co., Ltd.: Net Revenue, 2018-2022 (US$ million, AGR%)
Figure 125 Honda Motor Co., Ltd.: R&D, 2018-2022 (US$ million, AGR%)
Figure 126 Honda Motor Co., Ltd.: Regional Revenue Shares, 2022 (%)
Figure 127 Toyota Motor Corporation: Net Revenue, 2018-2022 (US$ million, AGR%)
Figure 128 Toyota Motor Corporation: R&D, 2018-2022 (US$ million, AGR%)
Figure 129 Toyota Motor Corporation: Regional Revenue Shares, 2022 (%)
Figure 130 Toyota Motor Corporation: Business Segment Revenue Shares, 2022 (%)
Figure 131 Hyundai Motor Company: Net Revenue, 2018-2022 (US$ million, AGR%)
Figure 132 Hyundai Motor Company: R&D, 2018-2022 (US$ million, AGR%)
Figure 133 Hyundai Motor Company: Regional Revenue Shares, 2021 (%)
Figure 134 Hyundai Motor Company: Business Segment Revenue Shares, 2021 (%)
Figure 135 General Motors Company: Net Revenue, 2018-2022 (US$ million, AGR%)
Figure 136 General Motors Company: R&D, 2018-2022 (US$ million, AGR%)
Figure 137 General Motors Company: Regional Revenue Shares, 2021 (%)
Figure 138 Mercedes-Benz Group AG: Net Revenue, 2018-2022 (US$ million, AGR%)
Figure 139 Mercedes-Benz Group AG: R&D, 2018-2022 (US$ million, AGR%)
Figure 140 Mercedes-Benz Group AG: Regional Revenue Shares, 2022 (%)
Figure 141 Mercedes-Benz Group AG: Business Segment Revenue Shares, 2022 (%)
Figure 142 Bayerische Motoren Werke AG: Net Revenue, 2018-2022 (US$ million, AGR%)
Figure 143 Bayerische Motoren Werke AG: R&D, 2018-2022 (US$ million, AGR%)
Figure 144 Bayerische Motoren Werke AG: Regional Revenue Shares, 2022 (%)
Figure 145 Bayerische Motoren Werke AG: Business Segment Revenue Shares, 2022 (%)
Figure 146 Nikola Corporation: Net Revenue, 2018-2022 (US$ million, AGR%)
Figure 147 Nikola Corporation: R&D, 2018-2022 (US$ million, AGR%)
Figure 148 Air Liquide: Net Revenue, 2018-2022 (US$ million, AGR%)
Figure 149 Air Liquide: R&D, 2018-2022 (US$ million, AGR%)
Figure 150 Air Liquide: Regional Revenue Shares, 2022 (%)
Figure 151 Air Liquide: Business Segment Revenue Shares, 2022 (%)
Figure 152 Linde plc: Net Revenue, 2018-2022 (US$ million, AGR%)
Figure 153 Linde plc: R&D, 2018-2022 (US$ million, AGR%)
Figure 154 Linde plc: Regional Revenue Shares, 2022 (%)
Figure 155 Linde plc: Business Segment Revenue Shares, 2022 (%)
Figure 156 Cummins Inc.: Net Revenue, 2018-2022 (US$ million, AGR%)
Figure 157 Cummins Inc.: R&D, 2018-2022 (US$ million, AGR%)
Figure 158 Cummins Inc.: Regional Revenue Shares, 2022 (%)
Figure 159 Cummins Inc.: Business Segment Revenue Shares, 2022 (%)
Figure 160 Nel Hydrogen: Net Revenue, 2018-2022 (US$ million, AGR%)
Figure 161 Nel Hydrogen: R&D, 2018-2022 (US$ million, AGR%)
Figure 162 Nel Hydrogen: Regional Revenue Shares, 2022 (%)
Figure 163 Nel Hydrogen: Business Segment Revenue Shares, 2022 (%)
Figure 164 Ballard Power Systems Inc.: Net Revenue, 2018-2022 (US$ million, AGR%)
Figure 165 Ballard Power Systems Inc.: R&D, 2018-2022 (US$ million, AGR%)
Figure 166 Ballard Power Systems Inc.: Regional Revenue Shares, 2022 (%)
Figure 167 Ballard Power Systems Inc.: Business Segment Revenue Shares, 2022 (%)
Figure 168 Plug Power Inc.: Net Revenue, 2018-2022 (US$ million, AGR%)
Figure 169 Plug Power Inc.: R&D, 2018-2022 (US$ million, AGR%)
Figure 170 Plug Power Inc.: Regional Revenue Shares, 2022 (%)
ページTOPに戻る
Visiongain社の自動車・輸送分野での最新刊レポート
本レポートと同じKEY WORD(hydrogen)の最新刊レポート
よくあるご質問
Visiongain社はどのような調査会社ですか?
英国の調査会社ヴィジョンゲイン社(Visiongain)は、通信とエネルギーのほか、自動車や化学・医薬品、金属など、広範な市場を対象に調査を行っています。自動車市場については、市場全般に関する調査のほ... もっと見る
調査レポートの納品までの日数はどの程度ですか?
在庫のあるものは速納となりますが、平均的には 3-4日と見て下さい。
但し、一部の調査レポートでは、発注を受けた段階で内容更新をして納品をする場合もあります。
発注をする前のお問合せをお願いします。
注文の手続きはどのようになっていますか?
1)お客様からの御問い合わせをいただきます。
2)見積書やサンプルの提示をいたします。
3)お客様指定、もしくは弊社の発注書をメール添付にて発送してください。
4)データリソース社からレポート発行元の調査会社へ納品手配します。
5) 調査会社からお客様へ納品されます。最近は、pdfにてのメール納品が大半です。
お支払方法の方法はどのようになっていますか?
納品と同時にデータリソース社よりお客様へ請求書(必要に応じて納品書も)を発送いたします。
お客様よりデータリソース社へ(通常は円払い)の御振り込みをお願いします。
請求書は、納品日の日付で発行しますので、翌月最終営業日までの当社指定口座への振込みをお願いします。振込み手数料は御社負担にてお願いします。
お客様の御支払い条件が60日以上の場合は御相談ください。
尚、初めてのお取引先や個人の場合、前払いをお願いすることもあります。ご了承のほど、お願いします。
データリソース社はどのような会社ですか?
当社は、世界各国の主要調査会社・レポート出版社と提携し、世界各国の市場調査レポートや技術動向レポートなどを日本国内の企業・公官庁及び教育研究機関に提供しております。
世界各国の「市場・技術・法規制などの」実情を調査・収集される時には、データリソース社にご相談ください。
お客様の御要望にあったデータや情報を抽出する為のレポート紹介や調査のアドバイスも致します。
|
|

