自動車用複合材料市場レポート:2024-2034
Automotive Composites Market Report 2024-2034
レポート詳細
自動車用複合材料市場レポート 2024-2034:この調査レポートは、業界とその基礎となるダイナミクスをより良く理解することを望むなら、新たな収益ポケットを目指す大手企業にとって非常... もっと見る
※上記価格は部署ライセンス(Departmental licence)価格です。
その他の価格についてはデータリソースまでお問合せください。
日本語のページは自動翻訳を利用し作成しています。
実際のレポートは英文のみでご納品いたします。

|

|
サマリー
レポート詳細
自動車用複合材料市場レポート 2024-2034:この調査レポートは、業界とその基礎となるダイナミクスをより良く理解することを望むなら、新たな収益ポケットを目指す大手企業にとって非常に貴重なものとなるでしょう。異業種への進出や新規地域での既存事業の拡大を目指す企業にも有用です。
低燃費で軽量な自動車への需要の高まりが市場成長を牽引
自動車用複合材料の市場成長の原動力となっているのは、燃費効率と軽量設計の両方を優先する自動車に対する需要の高まりである。このような需要の急増が、自動車用複合材料市場の拡大を支える中心的な要因となっている。自動車業界が、燃費を向上させ、排出ガスを削減し、車両性能全体を向上させる解決策を見出すことに継続的に取り組んでいることが、この市場を後押ししている。顕著な強度対重量比で知られる自動車用複合材料は、こうした目標の達成に役立っている。燃費に直接影響する自動車の軽量化の必要性から、自動車用複合材料は、より軽量な自動車を製造するための革新的な材料を求めるメーカーにとって魅力的な選択肢となっている。
さらに、自動車用複合材料の採用は、環境の持続可能性に関する世界的な懸念とシームレスに整合しており、これらの材料は、気候変動に対処するための継続的な取り組みにおいて重要な構成要素として位置づけられている。自動車用複合材料の本質的な軽量性は、燃費の改善に貢献するだけでなく、加速、ハンドリング、ブレーキなどの要素を含む全体的な車両性能も向上させる。排出ガスと燃料効率に関連する厳しい規制基準は、自動車業界が自動車用複合材料のような革新的材料を探求し、車両設計に取り入れる動機付けをさらに強めている。
自動車産業における複合材用途のさらなる強化に向けた研究開発(R&D)投資の拡大
研究開発投資は、複合材料の競争力を高める上で極めて重要な要素であるコスト削減を目標とすることができる。研究イニシアチブは、樹脂システム、硬化プロセス、自動化技術の最適化に焦点を当てることができる。これは、複合材料を従来の材料と比較して、より魅力的な選択肢とする上で極めて重要な要素である。研究開発の努力は、自動積層、3D印刷、連続繊維強化などの革新的な製造技術の創造につながる。これらの最先端技術は、生産をより効率的にし、複雑な部品の製造を可能にする。その結果、以前は製造が困難であったりコストが高かったりした、カスタマイズされた高性能複合部品を製造することができるようになる。
市場調査レポートを購入する前にすべき質問とは?
-
自動車用複合材市場はどのように進化しているのか?
-
何が自動車用複合材市場を牽引し、阻害しているのか?
-
自動車用複合材料の各サブマーケット分野は予測期間中にどのように成長し、2034年にはどれくらいの収益を占めるようになるのか。
-
2024年から2034年にかけて、自動車用コンポジットの各サブマーケットの市場シェアはどのように推移するか?
-
2024年から2034年にかけて、市場全体を牽引する主な要因は何か?
-
主要な自動車用複合材料市場はマクロ経済の動きに大枠で追随するのか、それとも個々の国の市場が他を凌駕するのか。
-
2034年までに各国市場のシェアはどのように変化し、どの地域が2034年の市場をリードするのか。
-
主要プレーヤーと予測期間中の見通しは?
-
これらの大手企業の自動車用複合材プロジェクトとは?
-
2024年から2034年の間に、業界はどのように進化するのか?現在および今後10年間に行われる自動車用コンポジット・プロジェクトにはどのような意味があるのか?
-
自動車用複合材市場をさらに拡大するために、製品の商業化の必要性は高まっていますか?
-
自動車用コンポジット市場はどこに向かっているのか、そしてどのようにすれば市場の最前線に立てるのか。
-
新商品や新サービスに最適な投資方法とは?
-
企業を新たな成長軌道に乗せ、C-suiteに移行させるための重要な展望とは?
このことが、現在、そして今後10年間、自動車用複合材市場にどのような影響を与えるかを見極める必要がある:
-
158の表と257の図表を掲載した460ページに及ぶレポートを独占的に提供する。
-
について本レポートでは、業界の主要な有利分野を取り上げている。今すぐ
-
世界、地域、国の売上高と成長に関する詳細な分析が含まれている。
-
競合他社が成功した主なトレンド、変化、収益予測をハイライトします。
本レポートは、自動車用複合材料市場が今後10年間にどのように発展していくのか、またCOVID-19の景気後退と好転の変動に合わせてどのように発展していくのかを今でお伝えします。この市場は、過去10年間のどの時点よりも今が重要である。
2034年までの予測やその他の分析から、商業的な展望が明らかになる
-
2034年までの収益予測に加え、最近の実績、成長率、市場シェアも提供している。
-
ビジネスの展望や展開など、独自の分析が掲載されている。
-
定性的分析(市場ダイナミクス、促進要因、機会、阻害要因、課題を含む)、コスト構造、自動車用コンポジット価格上昇の影響、最近の動向をご覧いただけます。
本レポートには、COVID-19が業界と貴社にどのような影響を与えるかについてのデータ分析と貴重な洞察が含まれている。本レポートでは、COVID-19の4つの回収パターンとその影響、すなわち「V」、「L」、「W」、「U」について論じている。
レポート対象セグメント
ポリマータイプ
ファイバータイプ
用途
-
内装部品
-
エクステリア・コンポーネント
-
パワートレイン&シャシー
-
その他
製造プロセス
-
圧縮成形
-
射出成形
-
樹脂トランスファー成形(RTM)
-
その他
自動車エンジンタイプ
車両タイプ
-
乗用車
-
小型商用車(LCV)
-
大型商用車(HCV)
世界市場全体と各分野の売上予測に加え、5つの地域と17の主要国市場の売上予測も掲載しています:
北米
欧州
-
ドイツ
-
英国
-
フランス
-
イタリア
-
スペイン
-
ロシア
-
その他の欧州
アジア太平洋
-
中国
-
日本
-
インド
-
韓国
-
オーストラリア
-
その他のAPAC
ラテンアメリカ
MEA
また、2024年から2034年までの自動車用複合材料市場における主要企業のプロファイルも掲載している。
報告書に掲載されている主要企業
-
Toray Industries, Inc.
-
SGL Carbon SE
-
Teijin Limited
-
Mitsubishi Chemical Group Corporation
-
Hexcel Corporation
-
BASF SE
-
Solvay
-
Lanxess AG
-
Voith GmbH & Co. KGaA
-
Nippon Carbon Co Ltd.
-
Formosa Plastics Corporation
-
DowAksa Advanced Composite Material Industries Limited Company
-
Formosa Taffeta Co., Ltd.
-
ZOLTEK Corporation
-
Hyosung Advanced Materials
2024年から2034年までの自動車用複合材市場全体の世界売上高(金額ベース)は、2024年に114億4,000万米ドルを突破する。2034年まで力強い収益成長を予測。当調査では、最も大きな可能性を秘めた企業を特定しています。彼らの能力、進歩、商業的展望を発見し、あなたが一歩先を行くのを支援します。
自動車用複合材料市場、2024-2034年レポートはどのようにお役に立つでしょうか?
要約すると、460ページに及ぶこのレポートは、以下のような知識を提供する:
-
自動車用複合材料市場の2024年から2034年までの収益予測 - ポリマーの種類、繊維の種類、製造工程、自動車エンジンの種類、自動車の種類ごとに世界レベルと地域レベルで予測 - 業界の将来性を発見し、投資と収益に最も有利な場所を見つけることができます。
-
5つの地域と17の主要国市場の2034年までの収益予測 - 北米、欧州、アジア太平洋、中南米、MEAの自動車用複合材料市場の2024年から2034年までの市場予測をご覧ください。また、米国、カナダ、メキシコ、ブラジル、ドイツ、フランス、英国、イタリア、中国、インド、日本、オーストラリアなどの主要国の市場も予測しています。
-
2024年から2034年までの自動車用複合材料市場に関わる主要企業14社の企業プロファイルを含む。
独自の予測による定量的・定性的分析をご覧ください。私たちのレポートだけに含まれる情報を入手し、貴重なビジネスインテリジェンスで情報を得ることができます。
他にはない情報
私たちの新しいレポートがあれば、知識に遅れをとったり、チャンスを逃したりする可能性が低くなります。弊社のレポートが貴社の調査、分析、意思決定にどのように役立つかをご覧ください。Visiongainのこの調査レポートは、自動車用複合材料市場(2024年~2034年)の商業分析を必要とする全ての方、市場リーダー企業を対象としています。データ、トレンド、予測をご覧いただけます。
ページTOPに戻る
目次
目次
1 レポート概要
1.1 研究の目的
1.2 自動車用複合材料市場の紹介
1.3 本レポートの特徴
1.4 本レポートを読むべき理由
1.5 本分析レポートが回答する主な質問
1.6 本レポートの対象者
1.7 方法論
1.7.1 市場の定義
1.7.2 市場評価・予測手法
1.7.3 データの検証
1.7.3.1 一次調査
1.7.3.2 セカンダリーリサーチ
1.8 よくある質問(FAQ)
1.9 Visiongainの関連レポート
1.10 Visiongainについて
2 エグゼクティブ・サマリー
3 市場概要
3.1 主要な調査結果
3.2 市場ダイナミクス
3.2.1 市場牽引要因
3.2.1.1 性能の回復と相まって高まる自動車需要
3.2.1.2 電気自動車(EV)販売の2桁成長、革新的材料への需要を促進
3.2.1.3 軽量で低燃費の自動車に対する市場の嗜好の高まり
3.2.1.4 自動車部門からの炭素排出量削減を目指す厳しい政府規制
3.2.2 市場抑制要因
3.2.2.1 自動車用複合材料の加工・製造コストの高さ
3.2.2.2 複合材料の限られた技術的進歩
3.2.2.3 複合材料のリサイクルにおける課題
3.2.2.4 代替軽量材料の入手可能性が複合材料の採用に影響
3.2.3 市場機会
3.2.3.1 自動車用複合材製造プロセスにおける継続的革新
3.2.3.2 複合材料のリサイクル技術の進歩
3.2.3.3 自動車産業における複合材用途をさらに強化するための研究開発投資の増加
3.3 COVID-19影響分析
3.4 ポーターのファイブフォース分析
3.4.1 サプライヤーの交渉力 - 高い
3.4.2 買い手の交渉力 ?中
3.4.3 競争力 - 中程度
3.4.4 代替品による脅威 - 中
3.4.5 新規参入企業の脅威 - 高
3.5 PEST分析
4 自動車用複合材料市場分析:ポリマータイプ別
4.1 主要な調査結果
4.2 ポリマータイプセグメント 市場魅力度指数
4.3 ポリマータイプ別自動車用複合材料の市場規模推定と予測
4.4 熱硬化性ポリマーベースの自動車用複合材料
4.4.1 2024〜2034年の地域別市場規模(US$ Billion)
4.4.2 地域別市場シェア、2024年・2034年(%)
4.5 熱可塑性ポリマーベースの自動車用複合材料
4.5.1 2024〜2034年の地域別市場規模(US$ Billion)
4.5.2 地域別市場シェア、2024年・2034年(%)
5 自動車用複合材料市場分析:ファイバータイプ別
5.1 主要調査結果
5.2 ファイバータイプ別セグメント 市場魅力度指数
5.3 ファイバータイプ別自動車用複合材料の市場規模推定と予測
5.4 炭素繊維ベースの自動車用複合材料
5.4.1 2024〜2034年の地域別市場規模(US$ Billion)
5.4.2 地域別市場シェア、2024年・2034年(%)
5.5 ガラス繊維ベースの自動車用複合材料
5.5.1 2024〜2034年の地域別市場規模(US$ Billion)
5.5.2 地域別市場シェア、2024年・2034年(%)
5.6 その他の繊維ベースの自動車用複合材料
5.6.1 2024~2034年の地域別市場規模(US$ Billion)
5.6.2 地域別市場シェア、2024年・2034年(%)
6 自動車用複合材料市場分析:用途別
6.1 主な調査結果
6.2 用途別セグメント 市場魅力度指数
6.3 自動車用複合材料の用途別市場規模推定と予測
6.4 内装部品
6.4.1 2024〜2034年の地域別市場規模(US$ Billion)
6.4.2 地域別市場シェア、2024年・2034年(%)
6.5 外装部品
6.5.1 2024〜2034年の地域別市場規模(US$ Billion)
6.5.2 地域別市場シェア、2024年・2034年(%)
6.6 パワートレイン&シャシー
6.6.1 2024〜2034年の地域別市場規模(US$ Billion)
6.6.2 地域別市場シェア、2024年・2034年(%)
6.7 その他の用途
6.7.1 2024〜2034年の地域別市場規模(US$ Billion)
6.7.2 地域別市場シェア、2024年・2034年(%)
7 自動車用複合材料市場分析:製造プロセス別
7.1 主要調査結果
7.2 製造プロセスセグメント 市場魅力度指数
7.3 自動車用複合材料の製造工程別市場規模推定と予測
7.4 圧縮成形
7.4.1 2024〜2034年の地域別市場規模(US$ Billion)
7.4.2 地域別市場シェア、2024年・2034年(%)
7.5 射出成形
7.5.1 2024〜2034年の地域別市場規模(US$ Billion)
7.5.2 地域別市場シェア、2024年・2034年(%)
7.6 樹脂トランスファー成形(RTM)
7.6.1 2024~2034年の地域別市場規模(US$ Billion)
7.6.2 地域別市場シェア、2024年・2034年(%)
7.7 その他の製造プロセス
7.7.1 2024〜2034年の地域別市場規模(US$ Billion)
7.7.2 地域別市場シェア、2024年・2034年(%)
8 自動車用複合材料の市場分析:自動車エンジンタイプ別
8.1 主要調査結果
8.2 自動車エンジンタイプ別セグメント 市場魅力度指数
8.3 自動車用複合材料の自動車エンジンタイプ別市場規模推定と予測
8.4 電気
8.4.1 2024〜2034年の地域別市場規模(US$ Billion)
8.4.2 地域別市場シェア、2024年・2034年(%)
8.5 非電気式
8.5.1 2024~2034年の地域別市場規模(US$ Billion)
8.5.2 地域別市場シェア、2024年・2034年(%)
9 自動車用複合材料市場分析:自動車タイプ別
9.1 主要調査結果
9.2 自動車タイプ別セグメント 市場魅力度指数
9.3 自動車用複合材料の自動車タイプ別市場規模推定と予測
9.4 乗用車
9.4.1 2024〜2034年の地域別市場規模(US$ Billion)
9.4.2 地域別市場シェア、2024年・2034年(%)
9.5 小型商用車(LCV)
9.5.1 2024〜2034年の地域別市場規模(US$ Billion)
9.5.2 地域別市場シェア、2024年・2034年(%)
9.6 大型商用車(HCV)
9.6.1 2024〜2034年の地域別市場規模(US$ Billion)
9.6.2 地域別市場シェア、2024年・2034年(%)
10 自動車用複合材料市場分析:地域別
10.1 主要な調査結果
10.2 地域別市場規模の推定と予測
11 北米の自動車用複合材料市場分析
11.1 主要な調査結果
11.2 北米の自動車用複合材料市場魅力度指数
11.3 北米の自動車用複合材料の国別市場、2024年、2029年、2034年(US$ Billion、キロトン)
11.4 北米の自動車用複合材料国別市場規模推定と予測
11.5 北米の自動車用複合材料市場規模推定と予測:ポリマータイプ別
11.6 北米の自動車用複合材料市場規模推定と予測:繊維タイプ別
11.7 北米の自動車用複合材料市場規模推定と予測:用途別
11.8 北米の自動車用複合材料市場規模推定と予測:製造プロセス別
11.9 北米の自動車用複合材料市場規模推定と予測:自動車エンジンタイプ別
11.10 北米の自動車用複合材料市場規模推定と予測:自動車タイプ別
11.11 アメリカの自動車用複合材料市場分析
11.12 カナダの自動車用複合材料市場分析
12 欧州の自動車用複合材料市場分析
12.1 主要な調査結果
12.2 欧州の自動車用複合材料市場魅力度指数
12.3 欧州の自動車用複合材料の国別市場、2024年、2029年、2034年 (US$ Billion、キロトン)
12.4 欧州の自動車用複合材料の国別市場規模推定と予測
12.5 欧州の自動車用複合材料市場規模推定と予測:ポリマータイプ別
12.6 欧州の自動車用複合材料市場規模推定と予測:繊維タイプ別
12.7 欧州の自動車用複合材料市場規模推定と予測:用途別
12.8 欧州の自動車用複合材料市場規模推定と予測:製造プロセス別
12.9 欧州の自動車用複合材料市場規模推定と予測:自動車エンジンタイプ別
12.10 欧州の自動車用複合材料市場規模推定と予測:自動車タイプ別
12.11 ドイツの自動車用複合材料市場分析
12.12 イギリスの自動車用複合材料市場分析
12.13 フランスの自動車用複合材料市場分析
12.14 イタリアの自動車用複合材料市場分析
12.15 スペインの自動車用複合材料市場分析
12.16 ロシアの自動車用複合材料市場分析
12.17 その他の欧州の自動車用複合材料市場分析
13 アジア太平洋地域の自動車用複合材料の市場分析
13.1 主要な調査結果
13.2 アジア太平洋地域の自動車用複合材料市場魅力度指数
13.3 アジア太平洋地域の自動車用複合材料の国別市場、2024年、2029年、2034年(US$ Billion、キロトン)
13.4 アジア太平洋地域の自動車用複合材料の国別市場規模推定と予測
13.5 アジア太平洋地域の自動車用複合材料市場規模推定と予測:ポリマータイプ別
13.6 アジア太平洋地域の自動車用複合材料市場規模推定と予測:繊維タイプ別
13.7 アジア太平洋地域の自動車用複合材料市場規模推定と予測:用途別
13.8 アジア太平洋地域の自動車用複合材料市場規模推定と予測:製造プロセス別
13.9 アジア太平洋地域の自動車用複合材料市場規模推定と予測:自動車エンジンタイプ別
13.10 アジア太平洋地域の自動車用複合材料市場規模推定と予測:自動車タイプ別
13.11 中国の自動車用複合材料市場分析
13.12 日本の自動車用複合材料市場分析
13.13 インド自動車用複合材料市場分析
13.14 韓国の自動車用複合材料市場分析
13.15 オーストラリアの自動車用複合材料市場分析
13.16 その他のアジア太平洋地域の自動車用複合材料市場分析
14 ラテンアメリカの自動車用複合材料市場分析
14.1 主要な調査結果
14.2 ラテンアメリカの自動車用複合材料市場魅力度指数
14.3 ラテンアメリカの自動車用複合材料の国別市場、2024年、2029年、2034年(US$ Billion、キロトン)
14.4 ラテンアメリカの自動車用複合材料の国別市場規模推定と予測
14.5 ラテンアメリカの自動車用複合材料市場規模推定と予測:ポリマータイプ別
14.6 ラテンアメリカの自動車用複合材料市場規模推定と予測:繊維タイプ別
14.7 ラテンアメリカの自動車用複合材料市場規模推定と予測:用途別
14.8 ラテンアメリカの自動車用複合材料市場規模推定と予測:製造プロセス別
14.9 ラテンアメリカの自動車用複合材料市場規模推定と予測:自動車エンジンタイプ別
14.10 ラテンアメリカの自動車用複合材料市場規模推定と予測:自動車タイプ別
14.11 メキシコの自動車用複合材料市場分析
14.12 ブラジルの自動車用複合材料市場分析
14.13 その他のラテンアメリカの自動車用複合材料市場分析
15 中東・アフリカ自動車用複合材料市場分析
15.1 主要調査結果
15.2 中東・アフリカ自動車用複合材料市場魅力度指数
15.3 中東・アフリカ自動車用複合材料の国別市場、2024年、2029年、2034年(US$ Billion、キロトン)
15.4 中東・アフリカ自動車用複合材料の国別市場規模推定と予測
15.5 中東・アフリカ自動車用複合材料市場規模推定と予測:ポリマータイプ別
15.6 中東・アフリカ自動車用複合材料市場規模推定と予測:繊維タイプ別
15.7 中東・アフリカ自動車用複合材料市場規模推定と予測:用途別
15.8 中東・アフリカ自動車用複合材料市場規模推定と予測:製造プロセス別
15.9 中東・アフリカ自動車用複合材料市場規模推定と予測:自動車エンジンタイプ別
15.10 中東・アフリカ自動車用複合材料市場規模推定と予測:自動車タイプ別
15.11 GCCの自動車用複合材料市場分析
15.12 南アフリカの自動車用複合材料市場分析
15.13 その他の中東・アフリカ地域の自動車用複合材料市場分析
16 会社概要
16.1 競争環境、2023年
16.2 戦略的展望
16.3 Toray Industries, Inc.
16.3.1 会社概要
16.3.2 会社概要
16.3.3 財務分析
16.3.3.1 純収入、2017-2023年
16.3.3.2 R&D、2018-2023年
16.3.3.3 地域市場シェア、2023年
16.3.3.4 セグメント別市場シェア(2023年
16.3.4 製品ベンチマーク
16.3.5 戦略的展望
16.4 SGL Carbon SE
16.4.1 会社概要
16.4.2 会社概要
16.4.3 財務分析
16.4.3.1 純収入、2017-2022年
16.4.3.2 R&D、2017-2022年
16.4.3.3 セグメント別市場シェア、2022年
16.4.3.4 地域別市場シェア、2022年
16.4.4 製品ベンチマーク
16.4.5 戦略的展望
16.5 Teijin Limited
16.5.1 会社概要
16.5.2 会社概要
16.5.3 財務分析
16.5.3.1 純収入(2017~2022年
16.5.3.2 売上高、201~2022年
16.5.3.3 地域市場シェア、2022年
16.5.3.4 セグメント別市場シェア、2022年
16.5.4 製品ベンチマーク
16.5.5 戦略的展望
16.6 Mitsubishi Chemical Group Corporation
16.6.1 会社概要
16.6.2 会社概要
16.6.3 財務分析
16.6.3.1 純売上高、2017年~2022年
16.6.3.2 セグメント別市場シェア(2022年
16.6.4 製品ベンチマーク
16.6.5 戦略的展望
16.7 Hexcel Corporation
16.7.1 会社概要
16.7.2 会社概要
16.7.3 財務分析
16.7.3.1 純収入、2017-2023年
16.7.3.2 R&T、2017年~2023年
16.7.3.3 地域別市場シェア、2023年
16.7.3.4 セグメント別市場シェア、2022年
16.7.4 製品ベンチマーク
16.7.5 戦略的展望
16.8 BASF SE
16.8.1 会社概要
16.8.2 会社概要
16.8.3 財務分析
16.8.3.1 純収入(2017年~2023年
16.8.3.2 売上高、2017-2022年
16.8.3.3 地域市場シェア、2022年
16.8.3.4 セグメント別市場シェア、2022年
16.8.4 製品ベンチマーク
16.8.5 戦略的展望
16.9 Solvay
16.9.1 会社概要
16.9.2 会社概要
16.9.3 財務分析
16.9.3.1 純収入、2017-2022年
16.9.3.2 r&i、2017-2022年
16.9.3.3 地域市場シェア、2022年
16.9.3.4 セグメント別市場シェア、2022年
16.9.4 製品ベンチマーク
16.9.5 戦略的展望
16.10 Lanxess AG
16.10.1 会社概要
16.10.2 会社概要
16.10.3 財務分析
16.10.3.1 純売上高、2018年~2022年
16.10.3.2 R&I、2018年~2022年
16.10.3.3 地域市場シェア、2022年
16.10.3.4 セグメント別市場シェア、2022年
16.10.4 製品ベンチマーク
16.10.5 戦略的展望
16.11 Voith GmbH & Co.KGaA
16.11.1 会社概要
16.11.2 会社概要
16.11.3 財務分析
16.11.3.1 純収入(2019-2023年
16.11.3.2 R&D、2019-2023年
16.11.3.3 地域市場シェア、2023年
16.11.3.4 セグメント別市場シェア(2023年
16.11.4 製品ベンチマーク
16.11.5 戦略的展望
16.12 Nippon Carbon Co Ltd.
16.12.1 会社概要
16.12.2 会社概要
16.12.3 財務分析
16.12.3.1 純収入、2018-2022年
16.12.3.2 R&D、2021-2022年
16.12.3.3 地域市場シェア、2022年
16.12.3.4 セグメント別市場シェア、2022年
16.12.4 製品ベンチマーク
16.13 Formosa Plastics Corporation
16.13.1 会社概要
16.13.2 会社概要
16.13.3 財務分析
16.13.3.1 純収入、2017-2022年
16.13.3.2 売上高、2017-2022年
16.13.4 製品ベンチマーク
16.13.5 戦略的展望
16.14 DowAksa Advanced Composite Material Industries Limited Company
16.14.1 会社概要
16.14.2 会社概要
16.14.3 製品ベンチマーク
16.14.4 戦略的展望
16.15 Formosa Taffeta Co., Ltd.
16.15.1 会社概要
16.15.2 会社概要
16.15.3 財務分析
16.15.3.1 純収入、2017年~2022年
16.15.3.2 セグメント別市場シェア(2022年
16.15.4 製品ベンチマーク
16.16 ZOLTEK Corporation
16.16.1 会社概要
16.16.2 会社概要
16.16.3 製品ベンチマーク
16.16.4 戦略的展望
16.17 Hyosung Advanced Materials
16.17.1 会社概要
16.17.2 会社概要
16.17.3 財務分析
16.17.3.1 純収入(2018年~2022年
16.17.3.2 売上高、2018年~2022年
16.17.4 製品ベンチマーク
16.17.5 戦略的展望
17 結論と提言
17.1 Visiongainからの結びの言葉
17.2 市場プレイヤーへの提言
ページTOPに戻る
プレスリリース
表の一覧
Table 1 Automotive Composites Market Snapshot, 2024 & 2034 (US$ Billion, Kilo Tons, CAGR %)
Table 2 Automotive Composites Market Revenue Forecast by Region, 2023-2033 (US$ Billion, AGR%, CAGR%): “V” Shaped Recovery Scenario
Table 3 Automotive Composites Market Revenue Forecast by Region, 2023-2033 (US$ Billion, AGR%, CAGR%): “U” Shaped Recovery Scenario
Table 4 Automotive Composites Market Revenue Forecast by Region, 2023-2033 (US$ Billion, AGR%, CAGR%): “W” Shaped Recovery Scenario
Table 5 Automotive Composites Market Revenue Forecast by Region, 2023-2033 (US$ Billion, AGR%, CAGR%): “L” Shaped Recovery Scenario
Table 6 Global Automotive Composites Market Revenue Forecast by Polymer Type, 2024-2034 (US$ Billion, AGR%, CAGR%)
Table 7 Thermosetting Polymer Based Automotive Composites Market Revenue Forecast by Region, 2024-2034 (US$ Billion, AGR%, CAGR%)
Table 8 Thermoplastic Polymer Based Automotive Composites Market Revenue Forecast by Region, 2024-2034 (US$ Billion, AGR%, CAGR%)
Table 9 Global Automotive Composites Market Revenue Forecast by Fiber Type, 2024-2034 (US$ Billion, AGR%, CAGR%)
Table 10 Carbon Fiber Based Automotive Composites Market Revenue Forecast by Region, 2024-2034 (US$ Billion, AGR%, CAGR%)
Table 11 Glass Fiber Based Automotive Composites Market Revenue Forecast by Region, 2024-2034 (US$ Billion, AGR%, CAGR%)
Table 12 Other Fibers Based Automotive Composites Market Revenue Forecast by Region, 2024-2034 (US$ Billion, AGR%, CAGR%)
Table 13 Global Automotive Composites Market Revenue Forecast By Application, 2024-2034 (US$ Billion, AGR%, CAGR%)
Table 14 Interior Components Automotive Composites Market Revenue Forecast by Region, 2024-2034 (US$ Billion, AGR%, CAGR%)
Table 15 Exterior Components Automotive Composites Market Revenue Forecast by Region, 2024-2034 (US$ Billion, AGR%, CAGR%)
Table 16 Powertrain & Chassis Automotive Composites Market Revenue Forecast by Region, 2024-2034 (US$ Billion, AGR%, CAGR%)
Table 17 Other Application Automotive Composites Market Revenue Forecast by Region, 2024-2034 (US$ Billion, AGR%, CAGR%)
Table 18 Global Automotive Composites Market Revenue Forecast by Manufacturing Process, 2024-2034 (US$ Billion, AGR%, CAGR%)
Table 19 Compression Moulding Automotive Composites Market Revenue Forecast by Region, 2024-2034 (US$ Billion, AGR%, CAGR%)
Table 20 Injection Moulding Automotive Composites Market Revenue Forecast by Region, 2024-2034 (US$ Billion, AGR%, CAGR%)
Table 21 Resin Transfer Molding (RTM) Automotive Composites Market Revenue Forecast by Region, 2024-2034 (US$ Billion, AGR%, CAGR%)
Table 22 Other Manufacturing Process Automotive Composites Market Revenue Forecast by Region, 2024-2034 (US$ Billion, AGR%, CAGR%)
Table 23 Global Automotive Composites Market Revenue Forecast by Vehicle Engine Type, 2024-2034 (US$ Billion, AGR%, CAGR%)
Table 24 Electric Automotive Composites Market Revenue Forecast by Region, 2024-2034 (US$ Billion, AGR%, CAGR%)
Table 25 Non-electric Automotive Composites Market Revenue Forecast by Region, 2024-2034 (US$ Billion, AGR%, CAGR%)
Table 26 Global Automotive Composites Market Revenue Forecast by Vehicle Type, 2024-2034 (US$ Billion, AGR%, CAGR%)
Table 27 Passenger Vehicles Automotive Composites Market Revenue Forecast by Region, 2024-2034 (US$ Billion, AGR%, CAGR%)
Table 28 Light Commercial Vehicles (LCV) Automotive Composites Market Revenue Forecast by Region, 2024-2034 (US$ Billion, AGR%, CAGR%)
Table 29 Heavy Commercial Vehicles (HCV) Automotive Composites Market Revenue Forecast by Region, 2024-2034 (US$ Billion, AGR%, CAGR%)
Table 30 Global Automotive Composites Market Revenue Forecast by Region, 2024-2034 (US$ Billion, AGR%, CAGR%)
Table 31 Global Automotive Composites Market Volume Forecast by Region, 2024-2034 (Kilo Tons, AGR%, CAGR%)
Table 32 North America Automotive Composites Market Revenue Forecast by Country, 2024-2034 (US$ Billion, AGR%, CAGR%)
Table 33 North America Automotive Composites Market Volume Forecast by Country, 2024-2034 (Kilo Tons, AGR%, CAGR%)
Table 34 North America Automotive Composites Market Revenue Forecast by Polymer Type, 2024-2034 (US$ Billion, AGR%, CAGR%)
Table 35 North America Automotive Composites Market Revenue Forecast by Fiber Type, 2024-2034 (US$ Billion, AGR%, CAGR%)
Table 36 North America Automotive Composites Market Revenue Forecast By Application, 2024-2034 (US$ Billion, AGR%, CAGR%)
Table 37 North America Automotive Composites Market Revenue Forecast by Manufacturing Process, 2024-2034 (US$ Billion, AGR%, CAGR%)
Table 38 North America Automotive Composites Market Revenue Forecast by Vehicle Engine Type, 2024-2034 (US$ Billion, AGR%, CAGR%)
Table 39 North America Automotive Composites Market Revenue Forecast by Vehicle Type, 2024-2034 (US$ Billion, AGR%, CAGR%)
Table 40 U.S. Automotive Composites Market Revenue Forecast, 2024-2034 (US$ Billion, AGR%, CAGR%)
Table 41 U.S. Automotive Composites Market Volume Forecast, 2024-2034 (Kilo Tons, AGR%, CAGR%)
Table 42 Canada Automotive Composites Market Revenue Forecast, 2024-2034 (US$ Billion, AGR%, CAGR%)
Table 43 Canada Automotive Composites Market Volume Forecast, 2024-2034 (Kilo Tons, AGR%, CAGR%)
Table 44 Europe Automotive Composites Market Revenue Forecast by Country, 2024-2034 (US$ Billion, AGR%, CAGR%)
Table 45 Europe Automotive Composites Market Volume Forecast by Country, 2024-2034 (Kilo Tons, AGR%, CAGR%)
Table 46 Europe Automotive Composites Market Revenue Forecast by Polymer Type, 2024-2034 (US$ Billion, AGR%, CAGR%)
Table 47 Europe Automotive Composites Market Revenue Forecast by Fiber Type, 2024-2034 (US$ Billion, AGR%, CAGR%)
Table 48 Europe Automotive Composites Market Revenue Forecast By Application, 2024-2034 (US$ Billion, AGR%, CAGR%)
Table 49 Europe Automotive Composites Market Revenue Forecast by Manufacturing Process, 2024-2034 (US$ Billion, AGR%, CAGR%)
Table 50 Europe Automotive Composites Market Revenue Forecast by Vehicle Engine Type, 2024-2034 (US$ Billion, AGR%, CAGR%)
Table 51 Europe Automotive Composites Market Revenue Forecast by Vehicle Type, 2024-2034 (US$ Billion, AGR%, CAGR%)
Table 52 Germany Automotive Composites Market Revenue Forecast, 2024-2034 (US$ Billion, AGR%, CAGR%)
Table 53 Germany Automotive Composites Market Volume Forecast, 2024-2034 (Kilo Tons, AGR%, CAGR%)
Table 54 UK Automotive Composites Market Revenue Forecast, 2024-2034 (US$ Billion, AGR%, CAGR%)
Table 55 UK Automotive Composites Market Volume Forecast, 2024-2034 (Kilo Tons, AGR%, CAGR%)
Table 56 France Automotive Composites Market Revenue Forecast, 2024-2034 (US$ Billion, AGR%, CAGR%)
Table 57 France Automotive Composites Market Volume Forecast, 2024-2034 (Kilo Tons, AGR%, CAGR%)
Table 58 Italy Automotive Composites Market Revenue Forecast, 2024-2034 (US$ Billion, AGR%, CAGR%)
Table 59 Italy Automotive Composites Market Volume Forecast, 2024-2034 (Kilo Tons, AGR%, CAGR%)
Table 60 Spain Automotive Composites Market Revenue Forecast, 2024-2034 (US$ Billion, AGR%, CAGR%)
Table 61 Spain Automotive Composites Market Volume Forecast, 2024-2034 (Kilo Tons, AGR%, CAGR%)
Table 62 Russia Automotive Composites Market Revenue Forecast, 2024-2034 (US$ Billion, AGR%, CAGR%)
Table 63 Russia Automotive Composites Market Volume Forecast, 2024-2034 (Kilo Tons, AGR%, CAGR%)
Table 64 Rest of Europe Automotive Composites Market Revenue Forecast, 2024-2034 (US$ Billion, AGR%, CAGR%)
Table 65 Rest of Europe Automotive Composites Market Volume Forecast, 2024-2034 (Kilo Tons, AGR%, CAGR%)
Table 66 Asia Pacific Automotive Composites Market Revenue Forecast by Country, 2024-2034 (US$ Billion, AGR%, CAGR%)
Table 67 Asia Pacific Automotive Composites Market Volume Forecast by Country, 2024-2034 (Kilo Tons, AGR%, CAGR%)
Table 68 Asia Pacific Automotive Composites Market Revenue Forecast by Polymer Type, 2024-2034 (US$ Billion, AGR%, CAGR%)
Table 69 Asia Pacific Automotive Composites Market Revenue Forecast by Fiber Type, 2024-2034 (US$ Billion, AGR%, CAGR%)
Table 70 Asia Pacific Automotive Composites Market Revenue Forecast By Application, 2024-2034 (US$ Billion, AGR%, CAGR%)
Table 71 Asia Pacific Automotive Composites Market Revenue Forecast by Manufacturing Process, 2024-2034 (US$ Billion, AGR%, CAGR%)
Table 72 Asia Pacific Automotive Composites Market Revenue Forecast by Vehicle Engine Type, 2024-2034 (US$ Billion, AGR%, CAGR%)
Table 73 Asia Pacific Automotive Composites Market Revenue Forecast by Vehicle Type, 2024-2034 (US$ Billion, AGR%, CAGR%)
Table 74 China Automotive Composites Market Revenue Forecast, 2024-2034 (US$ Billion, AGR%, CAGR%)
Table 75 China Automotive Composites Market Volume Forecast, 2024-2034 (Kilo Tons, AGR%, CAGR%)
Table 76 Japan Automotive Composites Market Revenue Forecast, 2024-2034 (US$ Billion, AGR%, CAGR%)
Table 77 Japan Automotive Composites Market Volume Forecast, 2024-2034 (Kilo Tons, AGR%, CAGR%)
Table 78 India Automotive Composites Market Revenue Forecast, 2024-2034 (US$ Billion, AGR%, CAGR%)
Table 79 India Automotive Composites Market Volume Forecast, 2024-2034 (Kilo Tons, AGR%, CAGR%)
Table 80 South Korea Automotive Composites Market Revenue Forecast, 2024-2034 (US$ Billion, AGR%, CAGR%)
Table 81 South Korea Automotive Composites Market Volume Forecast, 2024-2034 (Kilo Tons, AGR%, CAGR%)
Table 82 Australia Automotive Composites Market Revenue Forecast, 2024-2034 (US$ Billion, AGR%, CAGR%)
Table 83 Australia Automotive Composites Market Volume Forecast, 2024-2034 (Kilo Tons, AGR%, CAGR%)
Table 84 Rest of Asia Pacific Automotive Composites Market Revenue Forecast, 2024-2034 (US$ Billion, AGR%, CAGR%)
Table 85 Rest of Asia Pacific Automotive Composites Market Volume Forecast, 2024-2034 (Kilo Tons, AGR%, CAGR%)
Table 86 Latin America Automotive Composites Market Revenue Forecast by Country, 2024-2034 (US$ Billion, AGR%, CAGR%)
Table 87 Latin America Automotive Composites Market Volume Forecast by Country, 2024-2034 (Kilo Tons, AGR%, CAGR%)
Table 88 Latin America Automotive Composites Market Revenue Forecast by Polymer Type, 2024-2034 (US$ Billion, AGR%, CAGR%)
Table 89 Latin America Automotive Composites Market Revenue Forecast by Fiber Type, 2024-2034 (US$ Billion, AGR%, CAGR%)
Table 90 Latin America Automotive Composites Market Revenue Forecast By Application, 2024-2034 (US$ Billion, AGR%, CAGR%)
Table 91 Latin America Automotive Composites Market Revenue Forecast by Manufacturing Process, 2024-2034 (US$ Billion, AGR%, CAGR%)
Table 92 Latin America Automotive Composites Market Revenue Forecast by Vehicle Engine Type, 2024-2034 (US$ Billion, AGR%, CAGR%)
Table 93 Latin America Automotive Composites Market Revenue Forecast by Vehicle Type, 2024-2034 (US$ Billion, AGR%, CAGR%)
Table 94 Mexico Automotive Composites Market Revenue Forecast, 2024-2034 (US$ Billion, AGR%, CAGR%)
Table 95 Mexico Automotive Composites Market Volume Forecast, 2024-2034 (Kilo Tons, AGR%, CAGR%)
Table 96 Brazil Automotive Composites Market Revenue Forecast, 2024-2034 (US$ Billion, AGR%, CAGR%)
Table 97 Brazil Automotive Composites Market Volume Forecast, 2024-2034 (Kilo Tons, AGR%, CAGR%)
Table 98 Rest of Latin America Automotive Composites Market Revenue Forecast, 2024-2034 (US$ Billion, AGR%, CAGR%)
Table 99 Rest of Latin America Automotive Composites Market Volume Forecast, 2024-2034 (Kilo Tons, AGR%, CAGR%)
Table 100 Middle East & Africa Automotive Composites Market Revenue Forecast by Country, 2024-2034 (US$ Billion, AGR%, CAGR%)
Table 101 Middle East & Africa Automotive Composites Market Volume Forecast by Country, 2024-2034 (Kilo Tons, AGR%, CAGR%)
Table 102 Middle East & Africa Automotive Composites Market Revenue Forecast by Polymer Type, 2024-2034 (US$ Billion, AGR%, CAGR%)
Table 103 Middle East & Africa Automotive Composites Market Revenue Forecast by Fiber Type, 2024-2034 (US$ Billion, AGR%, CAGR%)
Table 104 Middle East & Africa Automotive Composites Market Revenue Forecast By Application, 2024-2034 (US$ Billion, AGR%, CAGR%)
Table 105 Middle East & Africa Automotive Composites Market Revenue Forecast by Manufacturing Process, 2024-2034 (US$ Billion, AGR%, CAGR%)
Table 106 Middle East & Africa Automotive Composites Market Revenue Forecast by Vehicle Engine Type, 2024-2034 (US$ Billion, AGR%, CAGR%)
Table 107 Middle East & Africa Automotive Composites Market Revenue Forecast by Vehicle Type, 2024-2034 (US$ Billion, AGR%, CAGR%)
Table 108 GCC Automotive Composites Market Revenue Forecast, 2024-2034 (US$ Billion, AGR%, CAGR%)
Table 109 GCC Automotive Composites Market Volume Forecast, 2024-2034 (Kilo Tons, AGR%, CAGR%)
Table 110 South Africa Automotive Composites Market Revenue Forecast, 2024-2034 (US$ Billion, AGR%, CAGR%)
Table 111 South Africa Automotive Composites Market Volume Forecast, 2024-2034 (Kilo Tons, AGR%, CAGR%)
Table 112 Rest of Middle East & Africa Automotive Composites Market Revenue Forecast, 2024-2034 (US$ Billion, AGR%, CAGR%)
Table 113 Rest of Middle East & Africa Automotive Composites Market Volume Forecast, 2024-2034 (Kilo Tons, AGR%, CAGR%)
Table 114 Automotive Composites Market: Company Ranking, 2023
Table 115 Strategic Outlook
Table 116 Toray Industries, Inc.: Key Details, (CEO, HQ, Revenue, Founded, No. of Employees, Company Type, Website, Business Segment)
Table 117 Toray Industries, Inc.: Product Benchmarking
Table 118 Toray Industries, Inc.: Strategic Outlook
Table 119 SGL Carbon SE: Key Details, (CEO, HQ, Revenue, Founded, No. of Employees, Company Type, Website, Business Segment)
Table 120 SGL Carbon SE: Product Benchmarking
Table 121 SGL Carbon SE: Strategic Outlook
Table 122 Teijin Limited: Key Details, (CEO, HQ, Revenue, Founded, No. of Employees, Company Type, Website, Business Segment)
Table 123 Teijin Limited: Product Benchmarking
Table 124 Teijin Limited: Strategic Outlook
Table 125 Mitsubishi Chemical Group Corporation: Key Details, (CEO, HQ, Revenue, Founded, No. of Employees, Company Type, Website, Business Segment)
Table 126 Mitsubishi Chemical Group Corporation: Product Benchmarking
Table 127 Mitsubishi Chemical Group Corporation: Strategic Outlook
Table 128 Hexcel Corporation: Key Details, (CEO, HQ, Revenue, Founded, No. of Employees, Company Type, Website, Business Segment)
Table 129 Hexcel Corporation: Product Benchmarking
Table 130 Hexcel Corporation: Strategic Outlook
Table 131 BASF SE: Key Details, (CEO, HQ, Revenue, Founded, No. of Employees, Company Type, Website, Business Segment)
Table 132 BASF SE: Product Benchmarking
Table 133 BASF SE: Strategic Outlook
Table 134 Solvay: Key Details, (CEO, HQ, Revenue, Founded, No. of Employees, Company Type, Website, Business Segment)
Table 135 Solvay: Product Benchmarking
Table 136 Solvay: Strategic Outlook
Table 137 Lanxess AG: Key Details, (CEO, HQ, Revenue, Founded, No. of Employees, Company Type, Website, Business Segment)
Table 138 Lanxess: Product Benchmarking
Table 139 Lanxess: Strategic Outlook
Table 140 Voith GmbH & Co. KGaA: Key Details, (CEO, HQ, Revenue, Founded, No. of Employees, Company Type, Website, Business Segment)
Table 141 Voith GmbH & Co. KGaA: Product Benchmarking
Table 142 Voith GmbH & Co. KGaA: Strategic Outlook
Table 143 Nippon Carbon Co Ltd.: Key Details, (CEO, HQ, Revenue, Founded, No. of Employees, Company Type, Website, Business Segment)
Table 144 Nippon Carbon Co Ltd.: Product Benchmarking
Table 145 Formosa Plastics Corporation: Key Details, (CEO, HQ, Revenue, Founded, No. of Employees, Company Type, Website, Business Segment)
Table 146 Formosa Plastics Corporation: Product Benchmarking
Table 147 Formosa Plastics Corporation: Strategic Outlook
Table 148 DowAksa Advanced Composite Material Industries Limited Company: Key Details, (CEO, HQ, Revenue, Founded, No. of Employees, Company Type, Website, Business Segment)
Table 149 DowAksa Advanced Composite Material Industries Limited Company: Product Benchmarking
Table 150 DowAksa Advanced Composite Material Industries Limited Company: Strategic Outlook
Table 151 Formosa Taffeta Co., Ltd.: Key Details, (CEO, HQ, Revenue, Founded, No. of Employees, Company Type, Website, Business Segment)
Table 152 Formosa Taffeta Co., Ltd.: Product Benchmarking
Table 153 ZOLTEK Corporation: Key Details, (CEO, HQ, Revenue, Founded, No. of Employees, Company Type, Website, Business Segment)
Table 154 ZOLTEK Corporation: Product Benchmarking
Table 155 ZOLTEK Corporation: Strategic Outlook
Table 156 Hyosung Advanced Materials: Key Details, (CEO, HQ, Revenue, Founded, No. of Employees, Company Type, Website, Business Segment)
Table 157 Hyosung Advanced Materials: Product Benchmarking
Table 158 Hyosung Advanced Materials: Strategic Outlook
図の一覧
Figure 1 Automotive Composites Market Segmentation
Figure 2 Automotive Composites Market by Polymer Type: Market Attractiveness Index
Figure 3 Automotive Composites Market by Fiber Type: Market Attractiveness Index
Figure 4 Automotive Composites Market by Application: Market Attractiveness Index
Figure 5 Automotive Composites Market by Manufacturing Process: Market Attractiveness Index
Figure 6 Automotive Composites Market by Vehicle Engine Type: Market Attractiveness Index
Figure 7 Automotive Composites Market by Vehicle Type: Market Attractiveness Index
Figure 8 Automotive Composites Market by Region: Market Attractiveness Index
Figure 9 Automotive Composites Market: Market Dynamics
Figure 10 Global Passenger Car and Light Commercial Vehicle Production, 2022-2038 (Million Units, AGR%)
Figure 11 Automotive Composites Market Revenue Forecast by Region, 2024-2034 (US$ Billion, AGR%): “V” Shaped Recovery Scenario
Figure 12 Automotive Composites Market Revenue Forecast by Region, 2024-2034 (US$ Billion, AGR%): “U” Shaped Recovery Scenario
Figure 13 Automotive Composites Market Revenue Forecast by Region, 2024-2034 (US$ Billion, AGR%): “W” Shaped Recovery Scenario
Figure 14 Automotive Composites Market Revenue Forecast by Region, 2024-2034 (US$ Billion, AGR%): “L” Shaped Recovery Scenario
Figure 15 Automotive Composites Market: Porter’s Five Forces Analysis
Figure 16 Automotive Composites Market: PEST Analysis
Figure 17 Automotive Composites Market by Polymer Type: Market Attractiveness Index
Figure 18 Automotive Composites Market Revenue Forecast by Polymer Type, 2024-2034 (US$ Billion, AGR %)
Figure 19 Automotive Composites Market Revenue Share Forecast by Polymer Type, 2024, 2029, 2034 (%)
Figure 20 Thermosetting Polymer Based Automotive Composites Market Revenue Forecast by Region, 2024-2034 (US$ Billion, AGR %)
Figure 21 Thermosetting Polymer Based Automotive Composites Market Revenue Share Forecast by Region, 2024 & 2034 (%)
Figure 22 Thermoplastic Polymer Based Automotive Composites Market Revenue Forecast by Region, 2024-2034 (US$ Billion, AGR %)
Figure 23 Thermoplastic Polymer Based Automotive Composites Market Revenue Share Forecast by Region, 2024 & 2034 (%)
Figure 24 Automotive Composites Market by Fiber Type: Market Attractiveness Index
Figure 25 Automotive Composites Market Revenue Forecast by Fiber Type, 2024-2034 (US$ Billion, AGR %)
Figure 26 Automotive Composites Market Revenue Share Forecast by Fiber Type, 2024, 2029, 2034 (%)
Figure 27 Carbon Fiber Based Automotive Composites Market Revenue Forecast by Region, 2024-2034 (US$ Billion, AGR %)
Figure 28 Carbon Fiber Based Automotive Composites Market Revenue Share Forecast by Region, 2024 & 2034 (%)
Figure 29 Glass Fiber Based Automotive Composites Market Revenue Forecast by Region, 2024-2034 (US$ Billion, AGR %)
Figure 30 Glass Fiber Based Automotive Composites Market Revenue Share Forecast by Region, 2024 & 2034 (%)
Figure 31 Other Fibers Based Automotive Composites Market Revenue Forecast by Region, 2024-2034 (US$ Billion, AGR %)
Figure 32 Other Fibers Based Automotive Composites Market Revenue Share Forecast by Region, 2024 & 2034 (%)
Figure 33 Automotive Composites Market by Application: Market Attractiveness Index
Figure 34 Automotive Composites Market Revenue Forecast by Application, 2024-2034 (US$ Billion, AGR %)
Figure 35 Automotive Composites Market Revenue Share Forecast by Application, 2024, 2029, 2034 (%)
Figure 36 Interior Components Automotive Composites Market Revenue Forecast by Region, 2024-2034 (US$ Billion, AGR %)
Figure 37 Interior Components Automotive Composites Market Revenue Share Forecast by Region, 2024 & 2034 (%)
Figure 38 Exterior Components Automotive Composites Market Revenue Forecast by Region, 2024-2034 (US$ Billion, AGR %)
Figure 39 Exterior Components Automotive Composites Market Revenue Share Forecast by Region, 2024 & 2034 (%)
Figure 40 Powertrain & Chassis Automotive Composites Market Revenue Forecast by Region, 2024-2034 (US$ Billion, AGR %)
Figure 41 Powertrain & Chassis Automotive Composites Market Revenue Share Forecast by Region, 2024 & 2034 (%)
Figure 42 Other Applications Automotive Composites Market Revenue Forecast by Region, 2024-2034 (US$ Billion, AGR %)
Figure 43 Other Applications Automotive Composites Market Revenue Share Forecast by Region, 2024 & 2034 (%)
Figure 44 Automotive Composites Market by Manufacturing Process: Market Attractiveness Index
Figure 45 Automotive Composites Market Revenue Forecast by Manufacturing Process, 2024-2034 (US$ Billion, AGR %)
Figure 46 Automotive Composites Market Revenue Share Forecast by Manufacturing Process, 2024, 2029, 2034 (%)
Figure 47 Compression Moulding Automotive Composites Market Revenue Forecast by Region, 2024-2034 (US$ Billion, AGR %)
Figure 48 Compression Moulding Automotive Composites Market Revenue Share Forecast by Region, 2024 & 2034 (%)
Figure 49 Injection Moulding Automotive Composites Market Revenue Forecast by Region, 2024-2034 (US$ Billion, AGR %)
Figure 50 Injection Moulding Automotive Composites Market Revenue Share Forecast by Region, 2024 & 2034 (%)
Figure 51 RTM Automotive Composites Market Revenue Forecast by Region, 2024-2034 (US$ Billion, AGR %)
Figure 52 RTM Automotive Composites Market Revenue Share Forecast by Region, 2024 & 2034 (%)
Figure 53 Other Manufacturing Processes Automotive Composites Market Revenue Forecast by Region, 2024-2034 (US$ Billion, AGR %)
Figure 54 Other Manufacturing Processes Automotive Composites Market Revenue Share Forecast by Region, 2024 & 2034 (%)
Figure 55 Automotive Composites Market by Vehicle Engine Type: Market Attractiveness Index
Figure 56 Automotive Composites Market Revenue Forecast by Vehicle Engine Type, 2024-2034 (US$ Billion, AGR %)
Figure 57 Automotive Composites Market Revenue Share Forecast by Vehicle Engine Type, 2024, 2029, 2034 (%)
Figure 58 Electric Automotive Composites Market Revenue Forecast by Region, 2024-2034 (US$ Billion, AGR %)
Figure 59 Electric Automotive Composites Market Revenue Share Forecast by Region, 2024 & 2034 (%)
Figure 60 Non-electric Automotive Composites Market Revenue Forecast by Region, 2024-2034 (US$ Billion, AGR %)
Figure 61 Non-electric Automotive Composites Market Revenue Share Forecast by Region, 2024 & 2034 (%)
Figure 62 Automotive Composites Market by Vehicle Type: Market Attractiveness Index
Figure 63 Automotive Composites Market Revenue Forecast by Vehicle Type, 2024-2034 (US$ Billion, AGR %)
Figure 64 Automotive Composites Market Revenue Share Forecast by Vehicle Type, 2024, 2029, 2034 (%)
Figure 65 Passenger Vehicles Automotive Composites Market Revenue Forecast by Region, 2024-2034 (US$ Billion, AGR %)
Figure 66 Passenger Vehicles Automotive Composites Market Revenue Share Forecast by Region, 2024 & 2034 (%)
Figure 67 Light Commercial Vehicles (LCV) Automotive Composites Market Revenue Forecast by Region, 2024-2034 (US$ Billion, AGR %)
Figure 68 Light Commercial Vehicles (LCV) Automotive Composites Market Revenue Share Forecast by Region, 2024 & 2034 (%)
Figure 69 Heavy Commercial Vehicles (HCV) Automotive Composites Market Revenue Forecast by Region, 2024-2034 (US$ Billion, AGR %)
Figure 70 Heavy Commercial Vehicles (HCV) Automotive Composites Market Revenue Share Forecast by Region, 2024 & 2034 (%)
Figure 71 Automotive Composites Market Revenue Forecast by Region 2024, 2029 & 2034 (US$ Billion, CAGR%)
Figure 72 Automotive Composites Market Revenue Share Forecast by Region 2024, 2029, 2034 (%)
Figure 73 Automotive Composites Market Volume Forecast by Region 2024, 2029 & 2034 (Kilo Tons, CAGR%)
Figure 74 Automotive Composites Market Volume Share Forecast by Region 2024, 2029, 2034 (%)
Figure 75 Automotive Composites Market Revenue by Region, 2024-2034 (US$ Billion, AGR %)
Figure 76 Automotive Composites Market Volume by Region, 2024-2034 (Kilo Tons, AGR %)
Figure 77 North America Automotive Composites Market Attractiveness Index
Figure 78 North America Automotive Composites Market Revenue by Country, 2024, 2029 & 2034 (US$ Billion)
Figure 79 North America Automotive Composites Market Volume by Country, 2024, 2029 & 2034 (Kilo Tons)
Figure 80 North America Automotive Composites Market Revenue Forecast by Country, 2024-2034 (US$ Billion, AGR %)
Figure 81 North America Automotive Composites Market Revenue Share Forecast by Country, 2024 & 2034 (%)
Figure 82 North America Automotive Composites Market Volume Forecast by Country, 2024-2034 (Kilo Tons, AGR %)
Figure 83 North America Automotive Composites Market Volume Share Forecast by Country, 2024 & 2034 (%)
Figure 84 North America Automotive Composites Market Revenue Forecast by Polymer Type, 2024-2034 (US$ Billion, AGR %)
Figure 85 North America Automotive Composites Market Revenue Share Forecast by Polymer Type, 2024 & 2034 (%)
Figure 86 North America Automotive Composites Market Revenue Forecast by Fiber Type, 2024-2034 (US$ Billion, AGR %)
Figure 87 North America Automotive Composites Market Revenue Share Forecast by Fiber Type, 2024 & 2034 (%)
Figure 88 North America Automotive Composites Market Revenue Forecast by Application, 2024-2034 (US$ Billion, AGR %)
Figure 89 North America Automotive Composites Market Revenue Share Forecast by Application, 2024 & 2034 (%)
Figure 90 North America Automotive Composites Market Revenue Forecast by Manufacturing Process, 2024-2034 (US$ Billion, AGR %)
Figure 91 North America Automotive Composites Market Revenue Share Forecast by Manufacturing Process, 2024 & 2034 (%)
Figure 92 North America Automotive Composites Market Revenue Forecast by Vehicle Engine Type, 2024-2034 (US$ Billion, AGR %)
Figure 93 North America Automotive Composites Market Revenue Share Forecast by Vehicle Engine Type, 2024 & 2034 (%)
Figure 94 North America Automotive Composites Market Revenue Forecast by Vehicle Type, 2024-2034 (US$ Billion, AGR %)
Figure 95 North America Automotive Composites Market Revenue Share Forecast by Vehicle Type, 2024 & 2034 (%)
Figure 96 U.S. Automotive Composites Market Revenue Forecast, 2024-2034 (US$ Billion, AGR %)
Figure 97 U.S. Automotive Composites Market Volume Forecast, 2024-2034 (Kilo Tons, AGR %)
Figure 98 Canada Automotive Composites Market Revenue Forecast, 2024-2034 (US$ Billion, AGR %)
Figure 99 Canada Automotive Composites Market Volume Forecast, 2024-2034 (Kilo Tons, AGR %)
Figure 100 Europe Automotive Composites Market Attractiveness Index
Figure 101 Europe Automotive Composites Market Revenue by Country, 2024, 2029 & 2034 (US$ Billion)
Figure 102 Europe Automotive Composites Market Volume by Country, 2024, 2029 & 2034 (Kilo Tons)
Figure 103 Europe Automotive Composites Market Revenue Forecast by Country, 2024-2034 (US$ Billion, AGR %)
Figure 104 Europe Automotive Composites Market Revenue Share Forecast by Country, 2024 & 2034 (%)
Figure 105 Europe Automotive Composites Market Volume Forecast by Country, 2024-2034 (Kilo Tons, AGR %)
Figure 106 Europe Automotive Composites Market Volume Share Forecast by Country, 2024 & 2034 (%)
Figure 107 Europe Automotive Composites Market Revenue Forecast by Polymer Type, 2024-2034 (US$ Billion, AGR %)
Figure 108 Europe Automotive Composites Market Revenue Share Forecast by Polymer Type, 2024 & 2034 (%)
Figure 109 Europe Automotive Composites Market Revenue Forecast by Fiber Type, 2024-2034 (US$ Billion, AGR %)
Figure 110 Europe Automotive Composites Market Revenue Share Forecast by Fiber Type, 2024 & 2034 (%)
Figure 111 Europe Automotive Composites Market Revenue Forecast by Application, 2024-2034 (US$ Billion, AGR %)
Figure 112 Europe Automotive Composites Market Revenue Share Forecast by Application, 2024 & 2034 (%)
Figure 113 Europe Automotive Composites Market Revenue Forecast by Manufacturing Process, 2024-2034 (US$ Billion, AGR %)
Figure 114 Europe Automotive Composites Market Revenue Share Forecast by Manufacturing Process, 2024 & 2034 (%)
Figure 115 Europe Automotive Composites Market Revenue Forecast by Vehicle Engine Type, 2024-2034 (US$ Billion, AGR %)
Figure 116 Europe Automotive Composites Market Revenue Share Forecast by Vehicle Engine Type, 2024 & 2034 (%)
Figure 117 Europe Automotive Composites Market Revenue Forecast by Vehicle Type, 2024-2034 (US$ Billion, AGR %)
Figure 118 Europe Automotive Composites Market Revenue Share Forecast by Vehicle Type, 2024 & 2034 (%)
Figure 119 Germany Automotive Composites Market Revenue Forecast, 2024-2034 (US$ Billion, AGR %)
Figure 120 Germany Automotive Composites Market Volume Forecast, 2024-2034 (Kilo Tons, AGR %)
Figure 121 UK Automotive Composites Market Revenue Forecast, 2024-2034 (US$ Billion, AGR %)
Figure 122 UK Automotive Composites Market Volume Forecast, 2024-2034 (Kilo Tons, AGR %)
Figure 123 France Automotive Composites Market Revenue Forecast, 2024-2034 (US$ Billion, AGR %)
Figure 124 France Automotive Composites Market Volume Forecast, 2024-2034 (Kilo Tons, AGR %)
Figure 125 Italy Automotive Composites Market Revenue Forecast, 2024-2034 (US$ Billion, AGR %)
Figure 126 Italy Automotive Composites Market Volume Forecast, 2024-2034 (Kilo Tons, AGR %)
Figure 127 Spain Automotive Composites Market Revenue Forecast, 2024-2034 (US$ Billion, AGR %)
Figure 128 Spain Automotive Composites Market Volume Forecast, 2024-2034 (Kilo Tons, AGR %)
Figure 129 Russia Automotive Composites Market Revenue Forecast, 2024-2034 (US$ Billion, AGR %)
Figure 130 Russia Automotive Composites Market Volume Forecast, 2024-2034 (Kilo Tons, AGR %)
Figure 131 Rest of Europe Automotive Composites Market Revenue Forecast, 2024-2034 (US$ Billion, AGR %)
Figure 132 Russia Automotive Composites Market Volume Forecast, 2024-2034 (Kilo Tons, AGR %)
Figure 133 Asia Pacific Automotive Composites Market Attractiveness Index
Figure 134 Asia Pacific Automotive Composites Market Revenue by Country, 2024, 2029 & 2034 (US$ Billion)
Figure 135 Asia Pacific Automotive Composites Market Volume by Country, 2024, 2029 & 2034 (Kilo Tons)
Figure 136 Asia Pacific Automotive Composites Market Revenue Forecast by Country, 2024-2034 (US$ Billion, AGR %)
Figure 137 Asia Pacific Automotive Composites Market Revenue Share Forecast by Country, 2024 & 2034 (%)
Figure 138 Asia Pacific Automotive Composites Market Volume Forecast by Country, 2024-2034 (Kilo Tons, AGR %)
Figure 139 Asia Pacific Automotive Composites Market Volume Share Forecast by Country, 2024 & 2034 (%)
Figure 140 Asia Pacific Automotive Composites Market Revenue Forecast by Polymer Type, 2024-2034 (US$ Billion, AGR %)
Figure 141 Asia Pacific Automotive Composites Market Revenue Share Forecast by Polymer Type, 2024 & 2034 (%)
Figure 142 Asia Pacific Automotive Composites Market Revenue Forecast by Fiber Type, 2024-2034 (US$ Billion, AGR %)
Figure 143 Asia Pacific Automotive Composites Market Revenue Share Forecast by Fiber Type, 2024 & 2034 (%)
Figure 144 Asia Pacific Automotive Composites Market Revenue Forecast by Application, 2024-2034 (US$ Billion, AGR %)
Figure 145 Asia Pacific Automotive Composites Market Revenue Share Forecast by Application, 2024 & 2034 (%)
Figure 146 Asia Pacific Automotive Composites Market Revenue Forecast by Manufacturing Process, 2024-2034 (US$ Billion, AGR %)
Figure 147 Asia Pacific Automotive Composites Market Revenue Share Forecast by Manufacturing Process, 2024 & 2034 (%)
Figure 148 Asia Pacific Automotive Composites Market Revenue Forecast by Vehicle Engine Type, 2024-2034 (US$ Billion, AGR %)
Figure 149 Europe Automotive Composites Market Revenue Share Forecast by Vehicle Engine Type, 2024 & 2034 (%)
Figure 150 Asia Pacific Automotive Composites Market Revenue Forecast by Vehicle Type, 2024-2034 (US$ Billion, AGR %)
Figure 151 Europe Automotive Composites Market Revenue Share Forecast by Vehicle Type, 2024 & 2034 (%)
Figure 152 China Automotive Composites Market Revenue Forecast, 2024-2034 (US$ Billion, AGR %)
Figure 153 China Automotive Composites Market Volume Forecast, 2024-2034 (Kilo Tons, AGR %)
Figure 154 Japan Automotive Composites Market Revenue Forecast, 2024-2034 (US$ Billion, AGR %)
Figure 155 Japan Automotive Composites Market Volume Forecast, 2024-2034 (Kilo Tons, AGR %)
Figure 156 India Automotive Composites Market Revenue Forecast, 2024-2034 (US$ Billion, AGR %)
Figure 157 India Automotive Composites Market Volume Forecast, 2024-2034 (Kilo Tons, AGR %)
Figure 158 South Korea Automotive Composites Market Revenue Forecast, 2024-2034 (US$ Billion, AGR %)
Figure 159 South Korea Automotive Composites Market Volume Forecast, 2024-2034 (Kilo Tons, AGR %)
Figure 160 Australia Automotive Composites Market Revenue Forecast, 2024-2034 (US$ Billion, AGR %)
Figure 161 Australia Automotive Composites Market Volume Forecast, 2024-2034 (Kilo Tons, AGR %)
Figure 162 Rest of APAC Automotive Composites Market Revenue Forecast, 2024-2034 (US$ Billion, AGR %)
Figure 163 Rest of Asia Pacific Automotive Composites Market Volume Forecast, 2024-2034 (Kilo Tons, AGR %)
Figure 164 Latin America Automotive Composites Market Attractiveness Index
Figure 165 Latin America Automotive Composites Market Revenue by Region, 2024, 2029 & 2034 (US$ Billion)
Figure 166 Latin America Automotive Composites Market Volume by Region, 2024, 2029 & 2034 (Kilo Tons)
Figure 167 Latin America Automotive Composites Market Revenue Forecast by Country, 2024-2034 (US$ Billion, AGR %)
Figure 168 Latin America Automotive Composites Market Revenue Share Forecast by Country, 2024 & 2034 (%)
Figure 169 Latin America Automotive Composites Market Volume Forecast by Country, 2024-2034 (Kilo Tons, AGR %)
Figure 170 Latin America Automotive Composites Market Volume Share Forecast by Country, 2024 & 2034 (%)
Figure 171 Latin America Automotive Composites Market Revenue Forecast by Polymer Type, 2024-2034 (US$ Billion, AGR %)
Figure 172 Latin America Automotive Composites Market Revenue Share Forecast by Polymer Type, 2024 & 2034 (%)
Figure 173 Latin America Automotive Composites Market Revenue Forecast by Fiber Type, 2024-2034 (US$ Billion, AGR %)
Figure 174 Latin America Automotive Composites Market Revenue Share Forecast by Fiber Type, 2024 & 2034 (%)
Figure 175 Latin America Automotive Composites Market Revenue Forecast by Application, 2024-2034 (US$ Billion, AGR %)
Figure 176 Latin America Automotive Composites Market Revenue Share Forecast by Application, 2024 & 2034 (%)
Figure 177 Latin America Automotive Composites Market Revenue Forecast by Manufacturing Process, 2024-2034 (US$ Billion, AGR %)
Figure 178 Latin America Automotive Composites Market Revenue Share Forecast by Manufacturing Process, 2024 & 2034 (%)
Figure 179 Latin America Automotive Composites Market Revenue Forecast by Vehicle Engine Type, 2024-2034 (US$ Billion, AGR %)
Figure 180 Latin America Automotive Composites Market Revenue Share Forecast by Vehicle Engine Type, 2024 & 2034 (%)
Figure 181 Latin America Automotive Composites Market Revenue Forecast by Vehicle Type, 2024-2034 (US$ Billion, AGR %)
Figure 182 Latin America Automotive Composites Market Revenue Share Forecast by Vehicle Type, 2024 & 2034 (%)
Figure 183 Mexico Automotive Composites Market Revenue Forecast, 2024-2034 (US$ Billion, AGR %)
Figure 184 Mexico Automotive Composites Market Volume Forecast, 2024-2034 (Kilo Tons, AGR %)
Figure 185 Brazil Automotive Composites Market Revenue Forecast, 2024-2034 (US$ Billion, AGR %)
Figure 186 Brazil Automotive Composites Market Volume Forecast, 2024-2034 (Kilo Tons, AGR %)
Figure 187 Rest of Latin America Automotive Composites Market Revenue Forecast, 2024-2034 (US$ Billion, AGR %)
Figure 188 Rest of Latin America Automotive Composites Market Volume Forecast, 2024-2034 (Kilo Tons, AGR %)
Figure 189 Middle East & Africa Automotive Composites Market Attractiveness Index
Figure 190 Middle East & Africa Automotive Composites Market Revenue by Country, 2024, 2029 & 2034 (US$ Billion)
Figure 191 Middle East & Africa Automotive Composites Market Volume by Country, 2024, 2029 & 2034 (Kilo Tons)
Figure 192 Middle East & Africa Automotive Composites Market Revenue Forecast by Country, 2024-2034 (US$ Billion, AGR %)
Figure 193 Middle East & Africa Automotive Composites Market Revenue Share Forecast by Country, 2024 & 2034 (%)
Figure 194 Middle East & Africa Automotive Composites Market Volume Forecast by Country, 2024-2034 (Kilo Tons, AGR %)
Figure 195 Middle East & Africa Automotive Composites Market Volume Share Forecast by Country, 2024 & 2034 (%)
Figure 196 Middle East & Africa Automotive Composites Market Revenue Forecast by Polymer Type, 2024-2034 (US$ Billion, AGR %)
Figure 197 Middle East & Africa Automotive Composites Market Revenue Share Forecast by Polymer Type, 2024 & 2034 (%)
Figure 198 Middle East & Africa Automotive Composites Market Revenue Forecast by Fiber Type, 2024-2034 (US$ Billion, AGR %)
Figure 199 Middle East & Africa Automotive Composites Market Revenue Share Forecast by Fiber Type, 2024 & 2034 (%)
Figure 200 Middle East & Africa Automotive Composites Market Revenue Forecast by Application, 2024-2034 (US$ Billion, AGR %)
Figure 201 Middle East & Africa Automotive Composites Market Revenue Share Forecast by Application, 2024 & 2034 (%)
Figure 202 Middle East & Africa Automotive Composites Market Revenue Forecast by Manufacturing Process, 2024-2034 (US$ Billion, AGR %)
Figure 203 Middle East & Africa Automotive Composites Market Revenue Share Forecast by Manufacturing Process, 2024 & 2034 (%)
Figure 204 Middle East & Africa Automotive Composites Market Revenue Forecast by Vehicle Engine Type, 2024-2034 (US$ Billion, AGR %)
Figure 205 Middle East & Africa Automotive Composites Market Revenue Share Forecast by Vehicle Engine Type, 2024 & 2034 (%)
Figure 206 Middle East & Africa Automotive Composites Market Revenue Forecast by Vehicle Type, 2024-2034 (US$ Billion, AGR %)
Figure 207 Middle East & Africa Automotive Composites Market Revenue Share Forecast by Vehicle Type, 2024 & 2034 (%)
Figure 208 GCC Automotive Composites Market Revenue Forecast, 2024-2034 (US$ Billion, AGR %)
Figure 209 GCC Automotive Composites Market Volume Forecast, 2024-2034 (Kilo Tons, AGR %)
Figure 210 South Africa Automotive Composites Market Revenue Forecast, 2024-2034 (US$ Billion, AGR %)
Figure 211 South Africa Automotive Composites Market Volume Forecast, 2024-2034 (Kilo Tons, AGR %)
Figure 212 Rest of Middle East & Africa Automotive Composites Market Revenue Forecast, 2024-2034 (US$ Billion, AGR %)
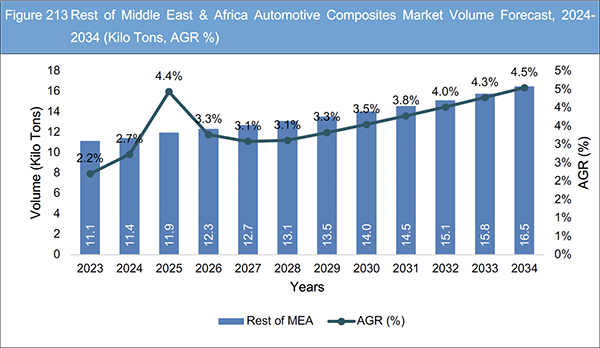
Figure 213 Rest of Middle East & Africa Automotive Composites Market Volume Forecast, 2024-2034 (Kilo Tons, AGR %)
Figure 214 Toray Industries, Inc.: Net Revenue, 2017-2023 (US$ Million, AGR%)
Figure 215 Toray Industries, Inc.: R&D, 2018-2023 (US$ Million, AGR%)
Figure 216 Toray Industries, Inc.: Regional Market Shares, 2023
Figure 217 Toray Industries, Inc.: Segmental Market Shares, 2023
Figure 218 SGL Carbon SE: Net Revenue, 2017-2022 (US$ Million, AGR%)
Figure 219 SGL Carbon SE: R&D, 2017-2022 (US$ Million, AGR%)
Figure 220 SGL Carbon SE: Segmental Market Shares, 2022
Figure 221 SGL Carbon SE: Regional Market Shares, 2022
Figure 222 Teijin Limited: Net Revenue, 2017-2022 (US$ Million, AGR%)
Figure 223 Teijin Limited: R&D, 2017-2022 (US$ Million, AGR%)
Figure 224 Teijin Limited: Regional Market Shares, 2022
Figure 225 Teijin Limited: Segmental Market Shares, 2022
Figure 226 Mitsubishi Chemical Group Corporation: Net Revenue, 2017-2022 (US$ Million, AGR%)
Figure 227 Mitsubishi Chemical Group Corporation: Segmental Market Shares, 2022
Figure 228 Hexcel Corporation: Net Revenue, 2017-2023 (US$ Million, AGR%)
Figure 229 Hexcel Corporation: R&T, 2017-2023 (US$ Million, AGR%)
Figure 230 Hexcel Corporation: Regional Market Shares, 2023
Figure 231 Hexcel Corporation: Segmental Market Shares, 2022
Figure 232 BASF SE: Net Revenue, 2017-2023 (US$ Million, AGR%)
Figure 233 BASF SE: R&D, 2017-2022 (US$ Million, AGR%)
Figure 234 BASF SE: Regional Market Shares, 2022
Figure 235 BASF SE: Segmental Market Shares, 2022
Figure 236 Solvay: Net Revenue, 2017-2022 (US$ Million, AGR%)
Figure 237 Solvay: R&I, 2017-2022 (US$ Million, AGR%)
Figure 238 Solvay: Regional Market Shares, 2022
Figure 239 Solvay: Segmental Market Shares, 2022
Figure 240 Lanxess: Net Revenue, 2018-2022 (US$ Million, AGR%)
Figure 241 Lanxess: R&D, 2018-2022 (US$ Million, AGR%)
Figure 242 Lanxess: Regional Market Shares, 2022
Figure 243 Lanxess: Segmental Market Shares, 2022
Figure 244 Voith GmbH & Co. KGaA: Net Revenue, 2019-2023 (US$ Million, AGR%)
Figure 245 Voith GmbH & Co. KGaA: R&D, 2019-2023 (US$ Million, AGR%)
Figure 246 Voith GmbH & Co. KGaA: Regional Market Shares, 2023
Figure 247 Voith GmbH & Co. KGaA: Segmental Market Shares, 2023
Figure 248 Nippon Carbon Co Ltd.: Net Revenue, 2018-2022 (US$ Million, AGR%)
Figure 249 Nippon Carbon Co Ltd.: R&D, 2021-2022 (US$ Million, AGR%)
Figure 250 Nippon Carbon Co Ltd.: Regional Market Shares, 2022
Figure 251 Nippon Carbon Co Ltd.: Segmental Market Shares, 2022
Figure 252 Formosa Plastics Corporation: Net Revenue, 2017-2022 (US$ Million, AGR%)
Figure 253 Formosa Plastics Corporation: R&D, 2017-2022 (US$ Million, AGR%)
Figure 254 Formosa Taffeta Co., Ltd.: Net Revenue, 2017-2022 (US$ Million, AGR%)
Figure 255 Formosa Taffeta Co., Ltd.: Segmental Market Shares, 2022
Figure 256 Hyosung Advanced Materials: Net Revenue, 2018-2022 (US$ Million, AGR%)
Figure 257 Hyosung Advanced Materials: R&D, 2018-2022 (US$ Million, AGR%)
ページTOPに戻る
Summary
Report Details
The Automotive Composites Market Report 2024-2034: This report will prove invaluable to leading firms striving for new revenue pockets if they wish to better understand the industry and its underlying dynamics. It will be useful for companies that would like to expand into different industries or to expand their existing operations in a new region.
Rising Demand for Fuel-Efficient and Light-Weight Vehicles Driving Market Growth
The market growth of automotive composites is being driven by an increasing demand for vehicles that prioritize both fuel efficiency and lightweight design. This surge in demand is a central catalyst behind the flourishing expansion of the automotive composites market. It is propelled by the automotive industry’s ongoing commitment to finding solutions that enhance fuel efficiency, reduce emissions, and elevate overall vehicle performance. Automotive composites, known for their remarkable strength-to-weight ratio, have become instrumental in achieving these objectives. The necessity to reduce vehicle weight, directly impacting fuel consumption, makes automotive composites an appealing choice for manufacturers seeking innovative materials to construct lighter vehicles.
Moreover, the adoption of automotive composites aligns seamlessly with global concerns about environmental sustainability, positioning these materials as a crucial component in the ongoing effort to address climate change. The intrinsic lightweight nature of automotive composites not only contributes to improved fuel efficiency but also enhances overall vehicle performance, including factors such as acceleration, handling, and braking. Stringent regulatory standards related to emissions and fuel efficiency further incentivize the automotive industry to explore and incorporate innovative materials like automotive composites into vehicle design.
Growing Investments in Research and Development (R&D) to Further Enhance Composite Applications in the Automotive Industry
R&D investments can target cost reduction, a pivotal factor in boosting the competitiveness of composites. Research initiatives can focus on optimizing resin systems, curing processes, and automation technologies, all of which streamline production and reduce costs. This is a critical element in making composites a more appealing choice compared to traditional materials. R&D efforts can lead to the creation of innovative manufacturing techniques, such as automated lay-up, 3D printing, and continuous fibre reinforcement. These cutting-edge methods make production more efficient and allow for the fabrication of complex components. The result is the ability to produce customized, high-performance composite parts that were previously challenging or costly to manufacture
What Questions Should You Ask before Buying a Market Research Report?
-
How is the automotive composites market evolving?
-
What is driving and restraining the automotive composites market?
-
How will each automotive composites submarket segment grow over the forecast period and how much revenue will these submarkets account for in 2034?
-
How will the market shares for each automotive composite’s submarket develop from 2024 to 2034?
-
What will be the main driver for the overall market from 2024 to 2034?
-
Will leading automotive composites markets broadly follow the macroeconomic dynamics, or will individual national markets outperform others?
-
How will the market shares of the national markets change by 2034 and which geographical region will lead the market in 2034?
-
Who are the leading players and what are their prospects over the forecast period?
-
What are the automotive composite projects for these leading companies?
-
How will the industry evolve during the period between 2024 and 2034? What are the implications of automotive composite projects taking place now and over the next 10 years?
-
Is there a greater need for product commercialisation to further scale the automotive composites market?
-
Where is the automotive composites market heading and how can you ensure you are at the forefront of the market?
-
What are the best investment options for new product and service lines?
-
What are the key prospects for moving companies into a new growth path and C-suite?
You need to discover how this will impact the automotive composites market today, and over the next 10 years:
-
Our 460-page report provides 158 tables and 257 charts/graphs exclusively to you.
-
The report highlights key lucrative areas in the industry so you can target them – NOW.
-
It contains in-depth analysis of global, regional and national sales and growth.
-
It highlights for you the key successful trends, changes and revenue projections made by your competitors.
This report tells you TODAY how the automotive composites market will develop in the next 10 years, and in line with the variations in COVID-19 economic recession and bounce. This market is more critical now than at any point over the last 10 years.
Forecasts to 2034 and other analyses reveal commercial prospects
-
In addition to revenue forecasting to 2034, our new study provides you with recent results, growth rates, and market shares.
-
You will find original analyses, with business outlooks and developments.
-
Discover qualitative analyses (including market dynamics, drivers, opportunities, restraints and challenges), cost structure, impact of rising automotive composite prices and recent developments.
This report includes data analysis and invaluable insight into how COVID-19 will affect the industry and your company. Four COVID-19 recovery patterns and their impact, namely, “V”, “L”, “W” and “U” are discussed in this report.
Segments Covered in the Report
Polymer Type
-
Thermosetting
-
Thermoplastic
Fiber Type
-
Carbon Fiber
-
Glass Fiber
-
Others
Application
-
Interior Components
-
Exterior Components
-
Powertrain & Chassis
-
Others
Manufacturing Process
-
Compression Moulding
-
Injection Moulding
-
Resin Transfer Molding (RTM)
-
Others
Vehicle Engine Type
Vehicle Type
-
Passenger Vehicles
-
Light Commercial Vehicles (LCV)
-
Heavy Commercial Vehicles (HCV)
In addition to the revenue predictions for the overall world market and segments, you will also find revenue forecasts for five regional and 17 leading national markets:
North America
Europe
-
Germany
-
UK
-
France
-
Italy
-
Spain
-
Russia
-
Rest of Europe
Asia Pacific
-
China
-
Japan
-
India
-
South Korea
-
Australia
-
Rest of APAC
Latin America
-
Brazil
-
Mexico
-
Rest of Latin America
MEA
-
GCC
-
South Africa
-
Rest of MEA
The report also includes profiles and for some of the leading companies in the Automotive Composites Market, 2024 to 2034, with a focus on this segment of these companies’ operations.
Leading companies profiled in the report
-
Toray Industries, Inc.
-
SGL Carbon SE
-
Teijin Limited
-
Mitsubishi Chemical Group Corporation
-
Hexcel Corporation
-
BASF SE
-
Solvay
-
Lanxess AG
-
Voith GmbH & Co. KGaA
-
Nippon Carbon Co Ltd.
-
Formosa Plastics Corporation
-
DowAksa Advanced Composite Material Industries Limited Company
-
Formosa Taffeta Co., Ltd.
-
ZOLTEK Corporation
-
Hyosung Advanced Materials
Overall world revenue for Automotive Composites Market, 2024 to 2034 in terms of value the market will surpass US$11.44 billion in 2024, our work calculates. We predict strong revenue growth through to 2034. Our work identifies which organizations hold the greatest potential. Discover their capabilities, progress, and commercial prospects, helping you stay ahead.
How will the Automotive Composites Market, 2024 to 2034 report help you?
In summary, our 460-page report provides you with the following knowledge:
-
Revenue forecasts to 2034 for Automotive Composites Market, 2024 to 2034 Market, with forecasts for polymer type, fiber type, manufacturing process, vehicle engine type, and vehicle type, each forecast at a global and regional level – discover the industry’s prospects, finding the most lucrative places for investments and revenues.
-
Revenue forecasts to 2034 for five regional and 17 key national markets – See forecasts for the Automotive composites market, 2024 to 2034 market in North America, Europe, Asia-Pacific, Latin America, and MEA. Also forecasted is the market in the US, Canada, Mexico, Brazil, Germany, France, UK, Italy, China, India, Japan, and Australia among other prominent economies.
-
Prospects for established firms and those seeking to enter the market – including company profiles for 14 of the major companies involved in the automotive composites market, 2024 to 2034.
Find quantitative and qualitative analyses with independent predictions. Receive information that only our report contains, staying informed with invaluable business intelligence.
Information found nowhere else
With our new report, you are less likely to fall behind in knowledge or miss out on opportunities. See how our work could benefit your research, analyses, and decisions. Visiongain’s study is for everybody needing commercial analyses for the Automotive Composites Market, 2024 to 2034, market-leading companies. You will find data, trends and predictions.
ページTOPに戻る
Table of Contents
Table of Contents
1 Report Overview
1.1 Objectives of the Study
1.2 Introduction to Automotive Composites Market
1.3 What This Report Delivers
1.4 Why You Should Read This Report
1.5 Key Questions Answered by This Analytical Report
1.6 Who is This Report for?
1.7 Methodology
1.7.1 Market Definitions
1.7.2 Market Evaluation & Forecasting Methodology
1.7.3 Data Validation
1.7.3.1 Primary Research
1.7.3.2 Secondary Research
1.8 Frequently Asked Questions (FAQs)
1.9 Associated Visiongain Reports
1.10 About Visiongain
2 Executive Summary
3 Market Overview
3.1 Key Findings
3.2 Market Dynamics
3.2.1 Market Driving Factors
3.2.1.1 Growing Demand for Automotive Vehicles, Coupled with a Rebound in Performance
3.2.1.2 Double-Digit Growth in Sales of Electric Vehicles (EVs), Driving Demand for Innovative Materials
3.2.1.3 Increasing Market Preference for Lightweight and Fuel-efficient Vehicles
3.2.1.4 Stringent Government Regulations Aiming to Reduce Carbon Emissions from the Automotive Sector
3.2.2 Market Restraining Factors
3.2.2.1 High Processing and Manufacturing Costs Associated with Automotive Composites
3.2.2.2 Limited Technological Advancements in Composite Materials
3.2.2.3 Challenges in Recycling Composites
3.2.2.4 Availability of Alternative Lightweight Materials Impacting Composite Adoption
3.2.3 Market Opportunities
3.2.3.1 Ongoing Innovations in Automotive Composite Manufacturing Processes
3.2.3.2 Advancements in Technologies for the Recycling of Composite Materials
3.2.3.3 Growing Investments in Research and Development to Further Enhance Composite Applications in the Automotive Industry
3.3 COVID-19 Impact Analysis
3.4 Porter’s Five Forces Analysis
3.4.1 Bargaining Power of Suppliers - High
3.4.2 Bargaining Power of Buyers – Medium
3.4.3 Competitive Rivalry - Medium
3.4.4 Threat from Substitutes - Medium
3.4.5 Threat of New Entrants - High
3.5 PEST Analysis
4 Automotive Composites Market Analysis by Polymer Type
4.1 Key Findings
4.2 Polymer Type Segment: Market Attractiveness Index
4.3 Automotive Composites Market Size Estimation and Forecast by Polymer Type
4.4 Thermosetting Polymer-based Automotive Composites
4.4.1 Market Size by Region, 2024-2034 (US$ Billion)
4.4.2 Market Share by Region, 2024 & 2034 (%)
4.5 Thermoplastic Polymer-based Automotive Composites
4.5.1 Market Size by Region, 2024-2034 (US$ Billion)
4.5.2 Market Share by Region, 2024 & 2034 (%)
5 Automotive Composites Market Analysis by Fiber Type
5.1 Key Findings
5.2 Fiber Type Segment: Market Attractiveness Index
5.3 Automotive Composites Market Size Estimation and Forecast by Fiber Type
5.4 Carbon Fibre Based Automotive Composites
5.4.1 Market Size by Region, 2024-2034 (US$ Billion)
5.4.2 Market Share by Region, 2024 & 2034 (%)
5.5 Glass Fiber Based Automotive Composites
5.5.1 Market Size by Region, 2024-2034 (US$ Billion)
5.5.2 Market Share by Region, 2024 & 2034 (%)
5.6 Other Fibers Based Automotive Composites
5.6.1 Market Size by Region, 2024-2034 (US$ Billion)
5.6.2 Market Share by Region, 2024 & 2034 (%)
6 Automotive Composites Market Analysis by Application
6.1 Key Findings
6.2 Application Segment: Market Attractiveness Index
6.3 Automotive Composites Market Size Estimation and Forecast by Application
6.4 Interior Components
6.4.1 Market Size by Region, 2024-2034 (US$ Billion)
6.4.2 Market Share by Region, 2024 & 2034 (%)
6.5 Exterior Components
6.5.1 Market Size by Region, 2024-2034 (US$ Billion)
6.5.2 Market Share by Region, 2024 & 2034 (%)
6.6 Powertrain & Chassis
6.6.1 Market Size by Region, 2024-2034 (US$ Billion)
6.6.2 Market Share by Region, 2024 & 2034 (%)
6.7 Other Applications
6.7.1 Market Size by Region, 2024-2034 (US$ Billion)
6.7.2 Market Share by Region, 2024 & 2034 (%)
7 Automotive Composites Market Analysis by Manufacturing Process
7.1 Key Findings
7.2 Manufacturing Process Segment: Market Attractiveness Index
7.3 Automotive Composites Market Size Estimation and Forecast by Manufacturing Process
7.4 Compression Moulding
7.4.1 Market Size by Region, 2024-2034 (US$ Billion)
7.4.2 Market Share by Region, 2024 & 2034 (%)
7.5 Injection Moulding
7.5.1 Market Size by Region, 2024-2034 (US$ Billion)
7.5.2 Market Share by Region, 2024 & 2034 (%)
7.6 Resin Transfer Moulding (RTM)
7.6.1 Market Size by Region, 2024-2034 (US$ Billion)
7.6.2 Market Share by Region, 2024 & 2034 (%)
7.7 Other Manufacturing Processes
7.7.1 Market Size by Region, 2024-2034 (US$ Billion)
7.7.2 Market Share by Region, 2024 & 2034 (%)
8 Automotive Composites Market Analysis by Vehicle Engine Type
8.1 Key Findings
8.2 Vehicle Engine Type Segment: Market Attractiveness Index
8.3 Automotive Composites Market Size Estimation and Forecast by Vehicle Engine Type
8.4 Electric
8.4.1 Market Size by Region, 2024-2034 (US$ Billion)
8.4.2 Market Share by Region, 2024 & 2034 (%)
8.5 Non-electric
8.5.1 Market Size by Region, 2024-2034 (US$ Billion)
8.5.2 Market Share by Region, 2024 & 2034 (%)
9 Automotive Composites Market Analysis by Vehicle Type
9.1 Key Findings
9.2 Vehicle Type Segment: Market Attractiveness Index
9.3 Automotive Composites Market Size Estimation and Forecast by Vehicle Type
9.4 Passenger Vehicles
9.4.1 Market Size by Region, 2024-2034 (US$ Billion)
9.4.2 Market Share by Region, 2024 & 2034 (%)
9.5 Light Commercial Vehicles (LCV)
9.5.1 Market Size by Region, 2024-2034 (US$ Billion)
9.5.2 Market Share by Region, 2024 & 2034 (%)
9.6 Heavy Commercial Vehicles (HCV)
9.6.1 Market Size by Region, 2024-2034 (US$ Billion)
9.6.2 Market Share by Region, 2024 & 2034 (%)
10 Automotive Composites Market Analysis by Region
10.1 Key Findings
10.2 Regional Market Size Estimation and Forecast
11 North America Automotive Composites Market Analysis
11.1 Key Findings
11.2 North America Automotive Composites Market Attractiveness Index
11.3 North America Automotive Composites Market by Country, 2024, 2029 & 2034 (US$ Billion and Kilo Tons)
11.4 North America Automotive Composites Market Size Estimation and Forecast by Country
11.5 North America Automotive Composites Market Size Estimation and Forecast by Polymer Type
11.6 North America Automotive Composites Market Size Estimation and Forecast by Fiber Type
11.7 North America Automotive Composites Market Size Estimation and Forecast by Application
11.8 North America Automotive Composites Market Size Estimation and Forecast by Manufacturing Process
11.9 North America Automotive Composites Market Size Estimation and Forecast by Vehicle Engine Type
11.10 North America Automotive Composites Market Size Estimation and Forecast by Vehicle Type
11.11 U.S. Automotive Composites Market Analysis
11.12 Canada Automotive Composites Market Analysis
12 Europe Automotive Composites Market Analysis
12.1 Key Findings
12.2 Europe Automotive Composites Market Attractiveness Index
12.3 Europe Automotive Composites Market by Country, 2024, 2029 & 2034 (US$ Billion and Kilo Tons)
12.4 Europe Automotive Composites Market Size Estimation and Forecast by Country
12.5 Europe Automotive Composites Market Size Estimation and Forecast by Polymer Type
12.6 Europe Automotive Composites Market Size Estimation and Forecast by Fiber Type
12.7 Europe Automotive Composites Market Size Estimation and Forecast by Application
12.8 Europe Automotive Composites Market Size Estimation and Forecast by Manufacturing Process
12.9 Europe Automotive Composites Market Size Estimation and Forecast by Vehicle Engine Type
12.10 Europe Automotive Composites Market Size Estimation and Forecast by Vehicle Type
12.11 Germany Automotive Composites Market Analysis
12.12 UK Automotive Composites Market Analysis
12.13 France Automotive Composites Market Analysis
12.14 Italy Automotive Composites Market Analysis
12.15 Spain Automotive Composites Market Analysis
12.16 Russia Automotive Composites Market Analysis
12.17 Rest of Europe Automotive Composites Market Analysis
13 Asia Pacific Automotive Composites Market Analysis
13.1 Key Findings
13.2 Asia Pacific Automotive Composites Market Attractiveness Index
13.3 Asia Pacific Automotive Composites Market by Country, 2024, 2029 & 2034 (US$ Billion and Kilo Tons)
13.4 Asia Pacific Automotive Composites Market Size Estimation and Forecast by Country
13.5 Asia Pacific Automotive Composites Market Size Estimation and Forecast by Polymer Type
13.6 Asia Pacific Automotive Composites Market Size Estimation and Forecast by Fiber Type
13.7 Asia Pacific Automotive Composites Market Size Estimation and Forecast by Application
13.8 Asia Pacific Automotive Composites Market Size Estimation and Forecast by Manufacturing Process
13.9 Asia Pacific Automotive Composites Market Size Estimation and Forecast by Vehicle Engine Type
13.10 Asia Pacific Automotive Composites Market Size Estimation and Forecast by Vehicle Type
13.11 China Automotive Composites Market Analysis
13.12 Japan Automotive Composites Market Analysis
13.13 India Automotive Composites Market Analysis
13.14 South Korea Automotive Composites Market Analysis
13.15 Australia Automotive Composites Market Analysis
13.16 Rest of Asia Pacific Automotive Composites Market Analysis
14 Latin America Automotive Composites Market Analysis
14.1 Key Findings
14.2 Latin America Automotive Composites Market Attractiveness Index
14.3 Latin America Automotive Composites Market by Country, 2024, 2029 & 2034 (US$ Billion and Kilo Tons)
14.4 Latin America Automotive Composites Market Size Estimation and Forecast by Country
14.5 Latin America Automotive Composites Market Size Estimation and Forecast by Polymer Type
14.6 Latin America Automotive Composites Market Size Estimation and Forecast by Fiber Type
14.7 Latin America Automotive Composites Market Size Estimation and Forecast by Application
14.8 Latin America Automotive Composites Market Size Estimation and Forecast by Manufacturing Process
14.9 Latin America Automotive Composites Market Size Estimation and Forecast by Vehicle Engine Type
14.10 Latin America Automotive Composites Market Size Estimation and Forecast by Vehicle Type
14.11 Mexico Automotive Composites Market Analysis
14.12 Brazil Automotive Composites Market Analysis
14.13 Rest of Latin America Automotive Composites Market Analysis
15 Middle East & Africa Automotive Composites Market Analysis
15.1 Key Findings
15.2 Middle East & Africa Automotive Composites Market Attractiveness Index
15.3 Middle East & Africa Automotive Composites Market by Country, 2024, 2029 & 2034 (US$ Billion and Kilo Tons)
15.4 Middle East & Africa Automotive Composites Market Size Estimation and Forecast by Country
15.5 Middle East & Africa Automotive Composites Market Size Estimation and Forecast by Polymer Type
15.6 Middle East & Africa Automotive Composites Market Size Estimation and Forecast by Fiber Type
15.7 Middle East & Africa Automotive Composites Market Size Estimation and Forecast by Application
15.8 Middle East & Africa Automotive Composites Market Size Estimation and Forecast by Manufacturing Process
15.9 Middle East & Africa Automotive Composites Market Size Estimation and Forecast by Vehicle Engine Type
15.10 Middle East & Africa Automotive Composites Market Size Estimation and Forecast by Vehicle Type
15.11 GCC Automotive Composites Market Analysis
15.12 South Africa Automotive Composites Market Analysis
15.13 Rest of Middle East & Africa Automotive Composites Market Analysis
16 Company Profiles
16.1 Competitive Landscape, 2023
16.2 Strategic Outlook
16.3 Toray Industries, Inc.
16.3.1 Company Snapshot
16.3.2 Company Overview
16.3.3 Financial Analysis
16.3.3.1 Net Revenue, 2017-2023
16.3.3.2 R&D, 2018-2023
16.3.3.3 Regional Market Shares, 2023
16.3.3.4 Segmental Market Shares, 2023
16.3.4 Product Benchmarking
16.3.5 Strategic Outlook
16.4 SGL Carbon SE
16.4.1 Company Snapshot
16.4.2 Company Overview
16.4.3 Financial Analysis
16.4.3.1 Net Revenue, 2017-2022
16.4.3.2 R&D, 2017-2022
16.4.3.3 Segmental Market Shares, 2022
16.4.3.4 Regional Market Shares, 2022
16.4.4 Product Benchmarking
16.4.5 Strategic Outlook
16.5 Teijin Limited
16.5.1 Company Snapshot
16.5.2 Company Overview
16.5.3 Financial Analysis
16.5.3.1 Net Revenue, 2017-2022
16.5.3.2 R&D, 201&-2022
16.5.3.3 Regional Market Shares, 2022
16.5.3.4 Segmental Market Shares, 2022
16.5.4 Product Benchmarking
16.5.5 Strategic Outlook
16.6 Mitsubishi Chemical Group Corporation
16.6.1 Company Snapshot
16.6.2 Company Overview
16.6.3 Financial Analysis
16.6.3.1 Net Revenue, 2017-2022
16.6.3.2 Segmental Market Shares, 2022
16.6.4 Product Benchmarking
16.6.5 Strategic Outlook
16.7 Hexcel Corporation
16.7.1 Company Snapshot
16.7.2 Company Overview
16.7.3 Financial Analysis
16.7.3.1 Net Revenue, 2017-2023
16.7.3.2 R&T, 2017-2023
16.7.3.3 Regional Market Shares, 2023
16.7.3.4 Segmental Market Shares, 2022
16.7.4 Product Benchmarking
16.7.5 Strategic Outlook
16.8 BASF SE
16.8.1 Company Snapshot
16.8.2 Company Overview
16.8.3 Financial Analysis
16.8.3.1 Net Revenue, 2017-2023
16.8.3.2 R&D, 2017-2022
16.8.3.3 Regional Market Shares, 2022
16.8.3.4 Segmental Market Shares, 2022
16.8.4 Product Benchmarking
16.8.5 Strategic Outlook
16.9 Solvay
16.9.1 Company Snapshot
16.9.2 Company Overview
16.9.3 Financial Analysis
16.9.3.1 Net Revenue, 2017-2022
16.9.3.2 R&I, 2017-2022
16.9.3.3 Regional Market Shares, 2022
16.9.3.4 Segmental Market Shares, 2022
16.9.4 Product Benchmarking
16.9.5 Strategic Outlook
16.10 Lanxess AG
16.10.1 Company Snapshot
16.10.2 Company Overview
16.10.3 Financial Analysis
16.10.3.1 Net Revenue, 2018-2022
16.10.3.2 R&I, 2018-2022
16.10.3.3 Regional Market Shares, 2022
16.10.3.4 Segmental Market Shares, 2022
16.10.4 Product Benchmarking
16.10.5 Strategic Outlook
16.11 Voith GmbH & Co. KGaA
16.11.1 Company Snapshot
16.11.2 Company Overview
16.11.3 Financial Analysis
16.11.3.1 Net Revenue, 2019-2023
16.11.3.2 R&D, 2019-2023
16.11.3.3 Regional Market Shares, 2023
16.11.3.4 Segmental Market Shares, 2023
16.11.4 Product Benchmarking
16.11.5 Strategic Outlook
16.12 Nippon Carbon Co Ltd.
16.12.1 Company Snapshot
16.12.2 Company Overview
16.12.3 Financial Analysis
16.12.3.1 Net Revenue, 2018-2022
16.12.3.2 R&D, 2021-2022
16.12.3.3 Regional Market Shares, 2022
16.12.3.4 Segmental Market Shares, 2022
16.12.4 Product Benchmarking
16.13 Formosa Plastics Corporation
16.13.1 Company Snapshot
16.13.2 Company Overview
16.13.3 Financial Analysis
16.13.3.1 Net Revenue, 2017-2022
16.13.3.2 R&D, 2017-2022
16.13.4 Product Benchmarking
16.13.5 Strategic Outlook
16.14 DowAksa Advanced Composite Material Industries Limited Company
16.14.1 Company Snapshot
16.14.2 Company Overview
16.14.3 Product Benchmarking
16.14.4 Strategic Outlook
16.15 Formosa Taffeta Co., Ltd.
16.15.1 Company Snapshot
16.15.2 Company Overview
16.15.3 Financial Analysis
16.15.3.1 Net Revenue, 2017-2022
16.15.3.2 Segmental Market Shares, 2022
16.15.4 Product Benchmarking
16.16 ZOLTEK Corporation
16.16.1 Company Snapshot
16.16.2 Company Overview
16.16.3 Product Benchmarking
16.16.4 Strategic Outlook
16.17 Hyosung Advanced Materials
16.17.1 Company Snapshot
16.17.2 Company Overview
16.17.3 Financial Analysis
16.17.3.1 Net Revenue, 2018-2022
16.17.3.2 R&D, 2018-2022
16.17.4 Product Benchmarking
16.17.5 Strategic Outlook
17 Conclusion and Recommendations
17.1 Concluding Remarks from Visiongain
17.2 Recommendations for Market Players
ページTOPに戻る
Press Release
List of Tables
Table 1 Automotive Composites Market Snapshot, 2024 & 2034 (US$ Billion, Kilo Tons, CAGR %)
Table 2 Automotive Composites Market Revenue Forecast by Region, 2023-2033 (US$ Billion, AGR%, CAGR%): “V” Shaped Recovery Scenario
Table 3 Automotive Composites Market Revenue Forecast by Region, 2023-2033 (US$ Billion, AGR%, CAGR%): “U” Shaped Recovery Scenario
Table 4 Automotive Composites Market Revenue Forecast by Region, 2023-2033 (US$ Billion, AGR%, CAGR%): “W” Shaped Recovery Scenario
Table 5 Automotive Composites Market Revenue Forecast by Region, 2023-2033 (US$ Billion, AGR%, CAGR%): “L” Shaped Recovery Scenario
Table 6 Global Automotive Composites Market Revenue Forecast by Polymer Type, 2024-2034 (US$ Billion, AGR%, CAGR%)
Table 7 Thermosetting Polymer Based Automotive Composites Market Revenue Forecast by Region, 2024-2034 (US$ Billion, AGR%, CAGR%)
Table 8 Thermoplastic Polymer Based Automotive Composites Market Revenue Forecast by Region, 2024-2034 (US$ Billion, AGR%, CAGR%)
Table 9 Global Automotive Composites Market Revenue Forecast by Fiber Type, 2024-2034 (US$ Billion, AGR%, CAGR%)
Table 10 Carbon Fiber Based Automotive Composites Market Revenue Forecast by Region, 2024-2034 (US$ Billion, AGR%, CAGR%)
Table 11 Glass Fiber Based Automotive Composites Market Revenue Forecast by Region, 2024-2034 (US$ Billion, AGR%, CAGR%)
Table 12 Other Fibers Based Automotive Composites Market Revenue Forecast by Region, 2024-2034 (US$ Billion, AGR%, CAGR%)
Table 13 Global Automotive Composites Market Revenue Forecast By Application, 2024-2034 (US$ Billion, AGR%, CAGR%)
Table 14 Interior Components Automotive Composites Market Revenue Forecast by Region, 2024-2034 (US$ Billion, AGR%, CAGR%)
Table 15 Exterior Components Automotive Composites Market Revenue Forecast by Region, 2024-2034 (US$ Billion, AGR%, CAGR%)
Table 16 Powertrain & Chassis Automotive Composites Market Revenue Forecast by Region, 2024-2034 (US$ Billion, AGR%, CAGR%)
Table 17 Other Application Automotive Composites Market Revenue Forecast by Region, 2024-2034 (US$ Billion, AGR%, CAGR%)
Table 18 Global Automotive Composites Market Revenue Forecast by Manufacturing Process, 2024-2034 (US$ Billion, AGR%, CAGR%)
Table 19 Compression Moulding Automotive Composites Market Revenue Forecast by Region, 2024-2034 (US$ Billion, AGR%, CAGR%)
Table 20 Injection Moulding Automotive Composites Market Revenue Forecast by Region, 2024-2034 (US$ Billion, AGR%, CAGR%)
Table 21 Resin Transfer Molding (RTM) Automotive Composites Market Revenue Forecast by Region, 2024-2034 (US$ Billion, AGR%, CAGR%)
Table 22 Other Manufacturing Process Automotive Composites Market Revenue Forecast by Region, 2024-2034 (US$ Billion, AGR%, CAGR%)
Table 23 Global Automotive Composites Market Revenue Forecast by Vehicle Engine Type, 2024-2034 (US$ Billion, AGR%, CAGR%)
Table 24 Electric Automotive Composites Market Revenue Forecast by Region, 2024-2034 (US$ Billion, AGR%, CAGR%)
Table 25 Non-electric Automotive Composites Market Revenue Forecast by Region, 2024-2034 (US$ Billion, AGR%, CAGR%)
Table 26 Global Automotive Composites Market Revenue Forecast by Vehicle Type, 2024-2034 (US$ Billion, AGR%, CAGR%)
Table 27 Passenger Vehicles Automotive Composites Market Revenue Forecast by Region, 2024-2034 (US$ Billion, AGR%, CAGR%)
Table 28 Light Commercial Vehicles (LCV) Automotive Composites Market Revenue Forecast by Region, 2024-2034 (US$ Billion, AGR%, CAGR%)
Table 29 Heavy Commercial Vehicles (HCV) Automotive Composites Market Revenue Forecast by Region, 2024-2034 (US$ Billion, AGR%, CAGR%)
Table 30 Global Automotive Composites Market Revenue Forecast by Region, 2024-2034 (US$ Billion, AGR%, CAGR%)
Table 31 Global Automotive Composites Market Volume Forecast by Region, 2024-2034 (Kilo Tons, AGR%, CAGR%)
Table 32 North America Automotive Composites Market Revenue Forecast by Country, 2024-2034 (US$ Billion, AGR%, CAGR%)
Table 33 North America Automotive Composites Market Volume Forecast by Country, 2024-2034 (Kilo Tons, AGR%, CAGR%)
Table 34 North America Automotive Composites Market Revenue Forecast by Polymer Type, 2024-2034 (US$ Billion, AGR%, CAGR%)
Table 35 North America Automotive Composites Market Revenue Forecast by Fiber Type, 2024-2034 (US$ Billion, AGR%, CAGR%)
Table 36 North America Automotive Composites Market Revenue Forecast By Application, 2024-2034 (US$ Billion, AGR%, CAGR%)
Table 37 North America Automotive Composites Market Revenue Forecast by Manufacturing Process, 2024-2034 (US$ Billion, AGR%, CAGR%)
Table 38 North America Automotive Composites Market Revenue Forecast by Vehicle Engine Type, 2024-2034 (US$ Billion, AGR%, CAGR%)
Table 39 North America Automotive Composites Market Revenue Forecast by Vehicle Type, 2024-2034 (US$ Billion, AGR%, CAGR%)
Table 40 U.S. Automotive Composites Market Revenue Forecast, 2024-2034 (US$ Billion, AGR%, CAGR%)
Table 41 U.S. Automotive Composites Market Volume Forecast, 2024-2034 (Kilo Tons, AGR%, CAGR%)
Table 42 Canada Automotive Composites Market Revenue Forecast, 2024-2034 (US$ Billion, AGR%, CAGR%)
Table 43 Canada Automotive Composites Market Volume Forecast, 2024-2034 (Kilo Tons, AGR%, CAGR%)
Table 44 Europe Automotive Composites Market Revenue Forecast by Country, 2024-2034 (US$ Billion, AGR%, CAGR%)
Table 45 Europe Automotive Composites Market Volume Forecast by Country, 2024-2034 (Kilo Tons, AGR%, CAGR%)
Table 46 Europe Automotive Composites Market Revenue Forecast by Polymer Type, 2024-2034 (US$ Billion, AGR%, CAGR%)
Table 47 Europe Automotive Composites Market Revenue Forecast by Fiber Type, 2024-2034 (US$ Billion, AGR%, CAGR%)
Table 48 Europe Automotive Composites Market Revenue Forecast By Application, 2024-2034 (US$ Billion, AGR%, CAGR%)
Table 49 Europe Automotive Composites Market Revenue Forecast by Manufacturing Process, 2024-2034 (US$ Billion, AGR%, CAGR%)
Table 50 Europe Automotive Composites Market Revenue Forecast by Vehicle Engine Type, 2024-2034 (US$ Billion, AGR%, CAGR%)
Table 51 Europe Automotive Composites Market Revenue Forecast by Vehicle Type, 2024-2034 (US$ Billion, AGR%, CAGR%)
Table 52 Germany Automotive Composites Market Revenue Forecast, 2024-2034 (US$ Billion, AGR%, CAGR%)
Table 53 Germany Automotive Composites Market Volume Forecast, 2024-2034 (Kilo Tons, AGR%, CAGR%)
Table 54 UK Automotive Composites Market Revenue Forecast, 2024-2034 (US$ Billion, AGR%, CAGR%)
Table 55 UK Automotive Composites Market Volume Forecast, 2024-2034 (Kilo Tons, AGR%, CAGR%)
Table 56 France Automotive Composites Market Revenue Forecast, 2024-2034 (US$ Billion, AGR%, CAGR%)
Table 57 France Automotive Composites Market Volume Forecast, 2024-2034 (Kilo Tons, AGR%, CAGR%)
Table 58 Italy Automotive Composites Market Revenue Forecast, 2024-2034 (US$ Billion, AGR%, CAGR%)
Table 59 Italy Automotive Composites Market Volume Forecast, 2024-2034 (Kilo Tons, AGR%, CAGR%)
Table 60 Spain Automotive Composites Market Revenue Forecast, 2024-2034 (US$ Billion, AGR%, CAGR%)
Table 61 Spain Automotive Composites Market Volume Forecast, 2024-2034 (Kilo Tons, AGR%, CAGR%)
Table 62 Russia Automotive Composites Market Revenue Forecast, 2024-2034 (US$ Billion, AGR%, CAGR%)
Table 63 Russia Automotive Composites Market Volume Forecast, 2024-2034 (Kilo Tons, AGR%, CAGR%)
Table 64 Rest of Europe Automotive Composites Market Revenue Forecast, 2024-2034 (US$ Billion, AGR%, CAGR%)
Table 65 Rest of Europe Automotive Composites Market Volume Forecast, 2024-2034 (Kilo Tons, AGR%, CAGR%)
Table 66 Asia Pacific Automotive Composites Market Revenue Forecast by Country, 2024-2034 (US$ Billion, AGR%, CAGR%)
Table 67 Asia Pacific Automotive Composites Market Volume Forecast by Country, 2024-2034 (Kilo Tons, AGR%, CAGR%)
Table 68 Asia Pacific Automotive Composites Market Revenue Forecast by Polymer Type, 2024-2034 (US$ Billion, AGR%, CAGR%)
Table 69 Asia Pacific Automotive Composites Market Revenue Forecast by Fiber Type, 2024-2034 (US$ Billion, AGR%, CAGR%)
Table 70 Asia Pacific Automotive Composites Market Revenue Forecast By Application, 2024-2034 (US$ Billion, AGR%, CAGR%)
Table 71 Asia Pacific Automotive Composites Market Revenue Forecast by Manufacturing Process, 2024-2034 (US$ Billion, AGR%, CAGR%)
Table 72 Asia Pacific Automotive Composites Market Revenue Forecast by Vehicle Engine Type, 2024-2034 (US$ Billion, AGR%, CAGR%)
Table 73 Asia Pacific Automotive Composites Market Revenue Forecast by Vehicle Type, 2024-2034 (US$ Billion, AGR%, CAGR%)
Table 74 China Automotive Composites Market Revenue Forecast, 2024-2034 (US$ Billion, AGR%, CAGR%)
Table 75 China Automotive Composites Market Volume Forecast, 2024-2034 (Kilo Tons, AGR%, CAGR%)
Table 76 Japan Automotive Composites Market Revenue Forecast, 2024-2034 (US$ Billion, AGR%, CAGR%)
Table 77 Japan Automotive Composites Market Volume Forecast, 2024-2034 (Kilo Tons, AGR%, CAGR%)
Table 78 India Automotive Composites Market Revenue Forecast, 2024-2034 (US$ Billion, AGR%, CAGR%)
Table 79 India Automotive Composites Market Volume Forecast, 2024-2034 (Kilo Tons, AGR%, CAGR%)
Table 80 South Korea Automotive Composites Market Revenue Forecast, 2024-2034 (US$ Billion, AGR%, CAGR%)
Table 81 South Korea Automotive Composites Market Volume Forecast, 2024-2034 (Kilo Tons, AGR%, CAGR%)
Table 82 Australia Automotive Composites Market Revenue Forecast, 2024-2034 (US$ Billion, AGR%, CAGR%)
Table 83 Australia Automotive Composites Market Volume Forecast, 2024-2034 (Kilo Tons, AGR%, CAGR%)
Table 84 Rest of Asia Pacific Automotive Composites Market Revenue Forecast, 2024-2034 (US$ Billion, AGR%, CAGR%)
Table 85 Rest of Asia Pacific Automotive Composites Market Volume Forecast, 2024-2034 (Kilo Tons, AGR%, CAGR%)
Table 86 Latin America Automotive Composites Market Revenue Forecast by Country, 2024-2034 (US$ Billion, AGR%, CAGR%)
Table 87 Latin America Automotive Composites Market Volume Forecast by Country, 2024-2034 (Kilo Tons, AGR%, CAGR%)
Table 88 Latin America Automotive Composites Market Revenue Forecast by Polymer Type, 2024-2034 (US$ Billion, AGR%, CAGR%)
Table 89 Latin America Automotive Composites Market Revenue Forecast by Fiber Type, 2024-2034 (US$ Billion, AGR%, CAGR%)
Table 90 Latin America Automotive Composites Market Revenue Forecast By Application, 2024-2034 (US$ Billion, AGR%, CAGR%)
Table 91 Latin America Automotive Composites Market Revenue Forecast by Manufacturing Process, 2024-2034 (US$ Billion, AGR%, CAGR%)
Table 92 Latin America Automotive Composites Market Revenue Forecast by Vehicle Engine Type, 2024-2034 (US$ Billion, AGR%, CAGR%)
Table 93 Latin America Automotive Composites Market Revenue Forecast by Vehicle Type, 2024-2034 (US$ Billion, AGR%, CAGR%)
Table 94 Mexico Automotive Composites Market Revenue Forecast, 2024-2034 (US$ Billion, AGR%, CAGR%)
Table 95 Mexico Automotive Composites Market Volume Forecast, 2024-2034 (Kilo Tons, AGR%, CAGR%)
Table 96 Brazil Automotive Composites Market Revenue Forecast, 2024-2034 (US$ Billion, AGR%, CAGR%)
Table 97 Brazil Automotive Composites Market Volume Forecast, 2024-2034 (Kilo Tons, AGR%, CAGR%)
Table 98 Rest of Latin America Automotive Composites Market Revenue Forecast, 2024-2034 (US$ Billion, AGR%, CAGR%)
Table 99 Rest of Latin America Automotive Composites Market Volume Forecast, 2024-2034 (Kilo Tons, AGR%, CAGR%)
Table 100 Middle East & Africa Automotive Composites Market Revenue Forecast by Country, 2024-2034 (US$ Billion, AGR%, CAGR%)
Table 101 Middle East & Africa Automotive Composites Market Volume Forecast by Country, 2024-2034 (Kilo Tons, AGR%, CAGR%)
Table 102 Middle East & Africa Automotive Composites Market Revenue Forecast by Polymer Type, 2024-2034 (US$ Billion, AGR%, CAGR%)
Table 103 Middle East & Africa Automotive Composites Market Revenue Forecast by Fiber Type, 2024-2034 (US$ Billion, AGR%, CAGR%)
Table 104 Middle East & Africa Automotive Composites Market Revenue Forecast By Application, 2024-2034 (US$ Billion, AGR%, CAGR%)
Table 105 Middle East & Africa Automotive Composites Market Revenue Forecast by Manufacturing Process, 2024-2034 (US$ Billion, AGR%, CAGR%)
Table 106 Middle East & Africa Automotive Composites Market Revenue Forecast by Vehicle Engine Type, 2024-2034 (US$ Billion, AGR%, CAGR%)
Table 107 Middle East & Africa Automotive Composites Market Revenue Forecast by Vehicle Type, 2024-2034 (US$ Billion, AGR%, CAGR%)
Table 108 GCC Automotive Composites Market Revenue Forecast, 2024-2034 (US$ Billion, AGR%, CAGR%)
Table 109 GCC Automotive Composites Market Volume Forecast, 2024-2034 (Kilo Tons, AGR%, CAGR%)
Table 110 South Africa Automotive Composites Market Revenue Forecast, 2024-2034 (US$ Billion, AGR%, CAGR%)
Table 111 South Africa Automotive Composites Market Volume Forecast, 2024-2034 (Kilo Tons, AGR%, CAGR%)
Table 112 Rest of Middle East & Africa Automotive Composites Market Revenue Forecast, 2024-2034 (US$ Billion, AGR%, CAGR%)
Table 113 Rest of Middle East & Africa Automotive Composites Market Volume Forecast, 2024-2034 (Kilo Tons, AGR%, CAGR%)
Table 114 Automotive Composites Market: Company Ranking, 2023
Table 115 Strategic Outlook
Table 116 Toray Industries, Inc.: Key Details, (CEO, HQ, Revenue, Founded, No. of Employees, Company Type, Website, Business Segment)
Table 117 Toray Industries, Inc.: Product Benchmarking
Table 118 Toray Industries, Inc.: Strategic Outlook
Table 119 SGL Carbon SE: Key Details, (CEO, HQ, Revenue, Founded, No. of Employees, Company Type, Website, Business Segment)
Table 120 SGL Carbon SE: Product Benchmarking
Table 121 SGL Carbon SE: Strategic Outlook
Table 122 Teijin Limited: Key Details, (CEO, HQ, Revenue, Founded, No. of Employees, Company Type, Website, Business Segment)
Table 123 Teijin Limited: Product Benchmarking
Table 124 Teijin Limited: Strategic Outlook
Table 125 Mitsubishi Chemical Group Corporation: Key Details, (CEO, HQ, Revenue, Founded, No. of Employees, Company Type, Website, Business Segment)
Table 126 Mitsubishi Chemical Group Corporation: Product Benchmarking
Table 127 Mitsubishi Chemical Group Corporation: Strategic Outlook
Table 128 Hexcel Corporation: Key Details, (CEO, HQ, Revenue, Founded, No. of Employees, Company Type, Website, Business Segment)
Table 129 Hexcel Corporation: Product Benchmarking
Table 130 Hexcel Corporation: Strategic Outlook
Table 131 BASF SE: Key Details, (CEO, HQ, Revenue, Founded, No. of Employees, Company Type, Website, Business Segment)
Table 132 BASF SE: Product Benchmarking
Table 133 BASF SE: Strategic Outlook
Table 134 Solvay: Key Details, (CEO, HQ, Revenue, Founded, No. of Employees, Company Type, Website, Business Segment)
Table 135 Solvay: Product Benchmarking
Table 136 Solvay: Strategic Outlook
Table 137 Lanxess AG: Key Details, (CEO, HQ, Revenue, Founded, No. of Employees, Company Type, Website, Business Segment)
Table 138 Lanxess: Product Benchmarking
Table 139 Lanxess: Strategic Outlook
Table 140 Voith GmbH & Co. KGaA: Key Details, (CEO, HQ, Revenue, Founded, No. of Employees, Company Type, Website, Business Segment)
Table 141 Voith GmbH & Co. KGaA: Product Benchmarking
Table 142 Voith GmbH & Co. KGaA: Strategic Outlook
Table 143 Nippon Carbon Co Ltd.: Key Details, (CEO, HQ, Revenue, Founded, No. of Employees, Company Type, Website, Business Segment)
Table 144 Nippon Carbon Co Ltd.: Product Benchmarking
Table 145 Formosa Plastics Corporation: Key Details, (CEO, HQ, Revenue, Founded, No. of Employees, Company Type, Website, Business Segment)
Table 146 Formosa Plastics Corporation: Product Benchmarking
Table 147 Formosa Plastics Corporation: Strategic Outlook
Table 148 DowAksa Advanced Composite Material Industries Limited Company: Key Details, (CEO, HQ, Revenue, Founded, No. of Employees, Company Type, Website, Business Segment)
Table 149 DowAksa Advanced Composite Material Industries Limited Company: Product Benchmarking
Table 150 DowAksa Advanced Composite Material Industries Limited Company: Strategic Outlook
Table 151 Formosa Taffeta Co., Ltd.: Key Details, (CEO, HQ, Revenue, Founded, No. of Employees, Company Type, Website, Business Segment)
Table 152 Formosa Taffeta Co., Ltd.: Product Benchmarking
Table 153 ZOLTEK Corporation: Key Details, (CEO, HQ, Revenue, Founded, No. of Employees, Company Type, Website, Business Segment)
Table 154 ZOLTEK Corporation: Product Benchmarking
Table 155 ZOLTEK Corporation: Strategic Outlook
Table 156 Hyosung Advanced Materials: Key Details, (CEO, HQ, Revenue, Founded, No. of Employees, Company Type, Website, Business Segment)
Table 157 Hyosung Advanced Materials: Product Benchmarking
Table 158 Hyosung Advanced Materials: Strategic Outlook
List of Figures
Figure 1 Automotive Composites Market Segmentation
Figure 2 Automotive Composites Market by Polymer Type: Market Attractiveness Index
Figure 3 Automotive Composites Market by Fiber Type: Market Attractiveness Index
Figure 4 Automotive Composites Market by Application: Market Attractiveness Index
Figure 5 Automotive Composites Market by Manufacturing Process: Market Attractiveness Index
Figure 6 Automotive Composites Market by Vehicle Engine Type: Market Attractiveness Index
Figure 7 Automotive Composites Market by Vehicle Type: Market Attractiveness Index
Figure 8 Automotive Composites Market by Region: Market Attractiveness Index
Figure 9 Automotive Composites Market: Market Dynamics
Figure 10 Global Passenger Car and Light Commercial Vehicle Production, 2022-2038 (Million Units, AGR%)
Figure 11 Automotive Composites Market Revenue Forecast by Region, 2024-2034 (US$ Billion, AGR%): “V” Shaped Recovery Scenario
Figure 12 Automotive Composites Market Revenue Forecast by Region, 2024-2034 (US$ Billion, AGR%): “U” Shaped Recovery Scenario
Figure 13 Automotive Composites Market Revenue Forecast by Region, 2024-2034 (US$ Billion, AGR%): “W” Shaped Recovery Scenario
Figure 14 Automotive Composites Market Revenue Forecast by Region, 2024-2034 (US$ Billion, AGR%): “L” Shaped Recovery Scenario
Figure 15 Automotive Composites Market: Porter’s Five Forces Analysis
Figure 16 Automotive Composites Market: PEST Analysis
Figure 17 Automotive Composites Market by Polymer Type: Market Attractiveness Index
Figure 18 Automotive Composites Market Revenue Forecast by Polymer Type, 2024-2034 (US$ Billion, AGR %)
Figure 19 Automotive Composites Market Revenue Share Forecast by Polymer Type, 2024, 2029, 2034 (%)
Figure 20 Thermosetting Polymer Based Automotive Composites Market Revenue Forecast by Region, 2024-2034 (US$ Billion, AGR %)
Figure 21 Thermosetting Polymer Based Automotive Composites Market Revenue Share Forecast by Region, 2024 & 2034 (%)
Figure 22 Thermoplastic Polymer Based Automotive Composites Market Revenue Forecast by Region, 2024-2034 (US$ Billion, AGR %)
Figure 23 Thermoplastic Polymer Based Automotive Composites Market Revenue Share Forecast by Region, 2024 & 2034 (%)
Figure 24 Automotive Composites Market by Fiber Type: Market Attractiveness Index
Figure 25 Automotive Composites Market Revenue Forecast by Fiber Type, 2024-2034 (US$ Billion, AGR %)
Figure 26 Automotive Composites Market Revenue Share Forecast by Fiber Type, 2024, 2029, 2034 (%)
Figure 27 Carbon Fiber Based Automotive Composites Market Revenue Forecast by Region, 2024-2034 (US$ Billion, AGR %)
Figure 28 Carbon Fiber Based Automotive Composites Market Revenue Share Forecast by Region, 2024 & 2034 (%)
Figure 29 Glass Fiber Based Automotive Composites Market Revenue Forecast by Region, 2024-2034 (US$ Billion, AGR %)
Figure 30 Glass Fiber Based Automotive Composites Market Revenue Share Forecast by Region, 2024 & 2034 (%)
Figure 31 Other Fibers Based Automotive Composites Market Revenue Forecast by Region, 2024-2034 (US$ Billion, AGR %)
Figure 32 Other Fibers Based Automotive Composites Market Revenue Share Forecast by Region, 2024 & 2034 (%)
Figure 33 Automotive Composites Market by Application: Market Attractiveness Index
Figure 34 Automotive Composites Market Revenue Forecast by Application, 2024-2034 (US$ Billion, AGR %)
Figure 35 Automotive Composites Market Revenue Share Forecast by Application, 2024, 2029, 2034 (%)
Figure 36 Interior Components Automotive Composites Market Revenue Forecast by Region, 2024-2034 (US$ Billion, AGR %)
Figure 37 Interior Components Automotive Composites Market Revenue Share Forecast by Region, 2024 & 2034 (%)
Figure 38 Exterior Components Automotive Composites Market Revenue Forecast by Region, 2024-2034 (US$ Billion, AGR %)
Figure 39 Exterior Components Automotive Composites Market Revenue Share Forecast by Region, 2024 & 2034 (%)
Figure 40 Powertrain & Chassis Automotive Composites Market Revenue Forecast by Region, 2024-2034 (US$ Billion, AGR %)
Figure 41 Powertrain & Chassis Automotive Composites Market Revenue Share Forecast by Region, 2024 & 2034 (%)
Figure 42 Other Applications Automotive Composites Market Revenue Forecast by Region, 2024-2034 (US$ Billion, AGR %)
Figure 43 Other Applications Automotive Composites Market Revenue Share Forecast by Region, 2024 & 2034 (%)
Figure 44 Automotive Composites Market by Manufacturing Process: Market Attractiveness Index
Figure 45 Automotive Composites Market Revenue Forecast by Manufacturing Process, 2024-2034 (US$ Billion, AGR %)
Figure 46 Automotive Composites Market Revenue Share Forecast by Manufacturing Process, 2024, 2029, 2034 (%)
Figure 47 Compression Moulding Automotive Composites Market Revenue Forecast by Region, 2024-2034 (US$ Billion, AGR %)
Figure 48 Compression Moulding Automotive Composites Market Revenue Share Forecast by Region, 2024 & 2034 (%)
Figure 49 Injection Moulding Automotive Composites Market Revenue Forecast by Region, 2024-2034 (US$ Billion, AGR %)
Figure 50 Injection Moulding Automotive Composites Market Revenue Share Forecast by Region, 2024 & 2034 (%)
Figure 51 RTM Automotive Composites Market Revenue Forecast by Region, 2024-2034 (US$ Billion, AGR %)
Figure 52 RTM Automotive Composites Market Revenue Share Forecast by Region, 2024 & 2034 (%)
Figure 53 Other Manufacturing Processes Automotive Composites Market Revenue Forecast by Region, 2024-2034 (US$ Billion, AGR %)
Figure 54 Other Manufacturing Processes Automotive Composites Market Revenue Share Forecast by Region, 2024 & 2034 (%)
Figure 55 Automotive Composites Market by Vehicle Engine Type: Market Attractiveness Index
Figure 56 Automotive Composites Market Revenue Forecast by Vehicle Engine Type, 2024-2034 (US$ Billion, AGR %)
Figure 57 Automotive Composites Market Revenue Share Forecast by Vehicle Engine Type, 2024, 2029, 2034 (%)
Figure 58 Electric Automotive Composites Market Revenue Forecast by Region, 2024-2034 (US$ Billion, AGR %)
Figure 59 Electric Automotive Composites Market Revenue Share Forecast by Region, 2024 & 2034 (%)
Figure 60 Non-electric Automotive Composites Market Revenue Forecast by Region, 2024-2034 (US$ Billion, AGR %)
Figure 61 Non-electric Automotive Composites Market Revenue Share Forecast by Region, 2024 & 2034 (%)
Figure 62 Automotive Composites Market by Vehicle Type: Market Attractiveness Index
Figure 63 Automotive Composites Market Revenue Forecast by Vehicle Type, 2024-2034 (US$ Billion, AGR %)
Figure 64 Automotive Composites Market Revenue Share Forecast by Vehicle Type, 2024, 2029, 2034 (%)
Figure 65 Passenger Vehicles Automotive Composites Market Revenue Forecast by Region, 2024-2034 (US$ Billion, AGR %)
Figure 66 Passenger Vehicles Automotive Composites Market Revenue Share Forecast by Region, 2024 & 2034 (%)
Figure 67 Light Commercial Vehicles (LCV) Automotive Composites Market Revenue Forecast by Region, 2024-2034 (US$ Billion, AGR %)
Figure 68 Light Commercial Vehicles (LCV) Automotive Composites Market Revenue Share Forecast by Region, 2024 & 2034 (%)
Figure 69 Heavy Commercial Vehicles (HCV) Automotive Composites Market Revenue Forecast by Region, 2024-2034 (US$ Billion, AGR %)
Figure 70 Heavy Commercial Vehicles (HCV) Automotive Composites Market Revenue Share Forecast by Region, 2024 & 2034 (%)
Figure 71 Automotive Composites Market Revenue Forecast by Region 2024, 2029 & 2034 (US$ Billion, CAGR%)
Figure 72 Automotive Composites Market Revenue Share Forecast by Region 2024, 2029, 2034 (%)
Figure 73 Automotive Composites Market Volume Forecast by Region 2024, 2029 & 2034 (Kilo Tons, CAGR%)
Figure 74 Automotive Composites Market Volume Share Forecast by Region 2024, 2029, 2034 (%)
Figure 75 Automotive Composites Market Revenue by Region, 2024-2034 (US$ Billion, AGR %)
Figure 76 Automotive Composites Market Volume by Region, 2024-2034 (Kilo Tons, AGR %)
Figure 77 North America Automotive Composites Market Attractiveness Index
Figure 78 North America Automotive Composites Market Revenue by Country, 2024, 2029 & 2034 (US$ Billion)
Figure 79 North America Automotive Composites Market Volume by Country, 2024, 2029 & 2034 (Kilo Tons)
Figure 80 North America Automotive Composites Market Revenue Forecast by Country, 2024-2034 (US$ Billion, AGR %)
Figure 81 North America Automotive Composites Market Revenue Share Forecast by Country, 2024 & 2034 (%)
Figure 82 North America Automotive Composites Market Volume Forecast by Country, 2024-2034 (Kilo Tons, AGR %)
Figure 83 North America Automotive Composites Market Volume Share Forecast by Country, 2024 & 2034 (%)
Figure 84 North America Automotive Composites Market Revenue Forecast by Polymer Type, 2024-2034 (US$ Billion, AGR %)
Figure 85 North America Automotive Composites Market Revenue Share Forecast by Polymer Type, 2024 & 2034 (%)
Figure 86 North America Automotive Composites Market Revenue Forecast by Fiber Type, 2024-2034 (US$ Billion, AGR %)
Figure 87 North America Automotive Composites Market Revenue Share Forecast by Fiber Type, 2024 & 2034 (%)
Figure 88 North America Automotive Composites Market Revenue Forecast by Application, 2024-2034 (US$ Billion, AGR %)
Figure 89 North America Automotive Composites Market Revenue Share Forecast by Application, 2024 & 2034 (%)
Figure 90 North America Automotive Composites Market Revenue Forecast by Manufacturing Process, 2024-2034 (US$ Billion, AGR %)
Figure 91 North America Automotive Composites Market Revenue Share Forecast by Manufacturing Process, 2024 & 2034 (%)
Figure 92 North America Automotive Composites Market Revenue Forecast by Vehicle Engine Type, 2024-2034 (US$ Billion, AGR %)
Figure 93 North America Automotive Composites Market Revenue Share Forecast by Vehicle Engine Type, 2024 & 2034 (%)
Figure 94 North America Automotive Composites Market Revenue Forecast by Vehicle Type, 2024-2034 (US$ Billion, AGR %)
Figure 95 North America Automotive Composites Market Revenue Share Forecast by Vehicle Type, 2024 & 2034 (%)
Figure 96 U.S. Automotive Composites Market Revenue Forecast, 2024-2034 (US$ Billion, AGR %)
Figure 97 U.S. Automotive Composites Market Volume Forecast, 2024-2034 (Kilo Tons, AGR %)
Figure 98 Canada Automotive Composites Market Revenue Forecast, 2024-2034 (US$ Billion, AGR %)
Figure 99 Canada Automotive Composites Market Volume Forecast, 2024-2034 (Kilo Tons, AGR %)
Figure 100 Europe Automotive Composites Market Attractiveness Index
Figure 101 Europe Automotive Composites Market Revenue by Country, 2024, 2029 & 2034 (US$ Billion)
Figure 102 Europe Automotive Composites Market Volume by Country, 2024, 2029 & 2034 (Kilo Tons)
Figure 103 Europe Automotive Composites Market Revenue Forecast by Country, 2024-2034 (US$ Billion, AGR %)
Figure 104 Europe Automotive Composites Market Revenue Share Forecast by Country, 2024 & 2034 (%)
Figure 105 Europe Automotive Composites Market Volume Forecast by Country, 2024-2034 (Kilo Tons, AGR %)
Figure 106 Europe Automotive Composites Market Volume Share Forecast by Country, 2024 & 2034 (%)
Figure 107 Europe Automotive Composites Market Revenue Forecast by Polymer Type, 2024-2034 (US$ Billion, AGR %)
Figure 108 Europe Automotive Composites Market Revenue Share Forecast by Polymer Type, 2024 & 2034 (%)
Figure 109 Europe Automotive Composites Market Revenue Forecast by Fiber Type, 2024-2034 (US$ Billion, AGR %)
Figure 110 Europe Automotive Composites Market Revenue Share Forecast by Fiber Type, 2024 & 2034 (%)
Figure 111 Europe Automotive Composites Market Revenue Forecast by Application, 2024-2034 (US$ Billion, AGR %)
Figure 112 Europe Automotive Composites Market Revenue Share Forecast by Application, 2024 & 2034 (%)
Figure 113 Europe Automotive Composites Market Revenue Forecast by Manufacturing Process, 2024-2034 (US$ Billion, AGR %)
Figure 114 Europe Automotive Composites Market Revenue Share Forecast by Manufacturing Process, 2024 & 2034 (%)
Figure 115 Europe Automotive Composites Market Revenue Forecast by Vehicle Engine Type, 2024-2034 (US$ Billion, AGR %)
Figure 116 Europe Automotive Composites Market Revenue Share Forecast by Vehicle Engine Type, 2024 & 2034 (%)
Figure 117 Europe Automotive Composites Market Revenue Forecast by Vehicle Type, 2024-2034 (US$ Billion, AGR %)
Figure 118 Europe Automotive Composites Market Revenue Share Forecast by Vehicle Type, 2024 & 2034 (%)
Figure 119 Germany Automotive Composites Market Revenue Forecast, 2024-2034 (US$ Billion, AGR %)
Figure 120 Germany Automotive Composites Market Volume Forecast, 2024-2034 (Kilo Tons, AGR %)
Figure 121 UK Automotive Composites Market Revenue Forecast, 2024-2034 (US$ Billion, AGR %)
Figure 122 UK Automotive Composites Market Volume Forecast, 2024-2034 (Kilo Tons, AGR %)
Figure 123 France Automotive Composites Market Revenue Forecast, 2024-2034 (US$ Billion, AGR %)
Figure 124 France Automotive Composites Market Volume Forecast, 2024-2034 (Kilo Tons, AGR %)
Figure 125 Italy Automotive Composites Market Revenue Forecast, 2024-2034 (US$ Billion, AGR %)
Figure 126 Italy Automotive Composites Market Volume Forecast, 2024-2034 (Kilo Tons, AGR %)
Figure 127 Spain Automotive Composites Market Revenue Forecast, 2024-2034 (US$ Billion, AGR %)
Figure 128 Spain Automotive Composites Market Volume Forecast, 2024-2034 (Kilo Tons, AGR %)
Figure 129 Russia Automotive Composites Market Revenue Forecast, 2024-2034 (US$ Billion, AGR %)
Figure 130 Russia Automotive Composites Market Volume Forecast, 2024-2034 (Kilo Tons, AGR %)
Figure 131 Rest of Europe Automotive Composites Market Revenue Forecast, 2024-2034 (US$ Billion, AGR %)
Figure 132 Russia Automotive Composites Market Volume Forecast, 2024-2034 (Kilo Tons, AGR %)
Figure 133 Asia Pacific Automotive Composites Market Attractiveness Index
Figure 134 Asia Pacific Automotive Composites Market Revenue by Country, 2024, 2029 & 2034 (US$ Billion)
Figure 135 Asia Pacific Automotive Composites Market Volume by Country, 2024, 2029 & 2034 (Kilo Tons)
Figure 136 Asia Pacific Automotive Composites Market Revenue Forecast by Country, 2024-2034 (US$ Billion, AGR %)
Figure 137 Asia Pacific Automotive Composites Market Revenue Share Forecast by Country, 2024 & 2034 (%)
Figure 138 Asia Pacific Automotive Composites Market Volume Forecast by Country, 2024-2034 (Kilo Tons, AGR %)
Figure 139 Asia Pacific Automotive Composites Market Volume Share Forecast by Country, 2024 & 2034 (%)
Figure 140 Asia Pacific Automotive Composites Market Revenue Forecast by Polymer Type, 2024-2034 (US$ Billion, AGR %)
Figure 141 Asia Pacific Automotive Composites Market Revenue Share Forecast by Polymer Type, 2024 & 2034 (%)
Figure 142 Asia Pacific Automotive Composites Market Revenue Forecast by Fiber Type, 2024-2034 (US$ Billion, AGR %)
Figure 143 Asia Pacific Automotive Composites Market Revenue Share Forecast by Fiber Type, 2024 & 2034 (%)
Figure 144 Asia Pacific Automotive Composites Market Revenue Forecast by Application, 2024-2034 (US$ Billion, AGR %)
Figure 145 Asia Pacific Automotive Composites Market Revenue Share Forecast by Application, 2024 & 2034 (%)
Figure 146 Asia Pacific Automotive Composites Market Revenue Forecast by Manufacturing Process, 2024-2034 (US$ Billion, AGR %)
Figure 147 Asia Pacific Automotive Composites Market Revenue Share Forecast by Manufacturing Process, 2024 & 2034 (%)
Figure 148 Asia Pacific Automotive Composites Market Revenue Forecast by Vehicle Engine Type, 2024-2034 (US$ Billion, AGR %)
Figure 149 Europe Automotive Composites Market Revenue Share Forecast by Vehicle Engine Type, 2024 & 2034 (%)
Figure 150 Asia Pacific Automotive Composites Market Revenue Forecast by Vehicle Type, 2024-2034 (US$ Billion, AGR %)
Figure 151 Europe Automotive Composites Market Revenue Share Forecast by Vehicle Type, 2024 & 2034 (%)
Figure 152 China Automotive Composites Market Revenue Forecast, 2024-2034 (US$ Billion, AGR %)
Figure 153 China Automotive Composites Market Volume Forecast, 2024-2034 (Kilo Tons, AGR %)
Figure 154 Japan Automotive Composites Market Revenue Forecast, 2024-2034 (US$ Billion, AGR %)
Figure 155 Japan Automotive Composites Market Volume Forecast, 2024-2034 (Kilo Tons, AGR %)
Figure 156 India Automotive Composites Market Revenue Forecast, 2024-2034 (US$ Billion, AGR %)
Figure 157 India Automotive Composites Market Volume Forecast, 2024-2034 (Kilo Tons, AGR %)
Figure 158 South Korea Automotive Composites Market Revenue Forecast, 2024-2034 (US$ Billion, AGR %)
Figure 159 South Korea Automotive Composites Market Volume Forecast, 2024-2034 (Kilo Tons, AGR %)
Figure 160 Australia Automotive Composites Market Revenue Forecast, 2024-2034 (US$ Billion, AGR %)
Figure 161 Australia Automotive Composites Market Volume Forecast, 2024-2034 (Kilo Tons, AGR %)
Figure 162 Rest of APAC Automotive Composites Market Revenue Forecast, 2024-2034 (US$ Billion, AGR %)
Figure 163 Rest of Asia Pacific Automotive Composites Market Volume Forecast, 2024-2034 (Kilo Tons, AGR %)
Figure 164 Latin America Automotive Composites Market Attractiveness Index
Figure 165 Latin America Automotive Composites Market Revenue by Region, 2024, 2029 & 2034 (US$ Billion)
Figure 166 Latin America Automotive Composites Market Volume by Region, 2024, 2029 & 2034 (Kilo Tons)
Figure 167 Latin America Automotive Composites Market Revenue Forecast by Country, 2024-2034 (US$ Billion, AGR %)
Figure 168 Latin America Automotive Composites Market Revenue Share Forecast by Country, 2024 & 2034 (%)
Figure 169 Latin America Automotive Composites Market Volume Forecast by Country, 2024-2034 (Kilo Tons, AGR %)
Figure 170 Latin America Automotive Composites Market Volume Share Forecast by Country, 2024 & 2034 (%)
Figure 171 Latin America Automotive Composites Market Revenue Forecast by Polymer Type, 2024-2034 (US$ Billion, AGR %)
Figure 172 Latin America Automotive Composites Market Revenue Share Forecast by Polymer Type, 2024 & 2034 (%)
Figure 173 Latin America Automotive Composites Market Revenue Forecast by Fiber Type, 2024-2034 (US$ Billion, AGR %)
Figure 174 Latin America Automotive Composites Market Revenue Share Forecast by Fiber Type, 2024 & 2034 (%)
Figure 175 Latin America Automotive Composites Market Revenue Forecast by Application, 2024-2034 (US$ Billion, AGR %)
Figure 176 Latin America Automotive Composites Market Revenue Share Forecast by Application, 2024 & 2034 (%)
Figure 177 Latin America Automotive Composites Market Revenue Forecast by Manufacturing Process, 2024-2034 (US$ Billion, AGR %)
Figure 178 Latin America Automotive Composites Market Revenue Share Forecast by Manufacturing Process, 2024 & 2034 (%)
Figure 179 Latin America Automotive Composites Market Revenue Forecast by Vehicle Engine Type, 2024-2034 (US$ Billion, AGR %)
Figure 180 Latin America Automotive Composites Market Revenue Share Forecast by Vehicle Engine Type, 2024 & 2034 (%)
Figure 181 Latin America Automotive Composites Market Revenue Forecast by Vehicle Type, 2024-2034 (US$ Billion, AGR %)
Figure 182 Latin America Automotive Composites Market Revenue Share Forecast by Vehicle Type, 2024 & 2034 (%)
Figure 183 Mexico Automotive Composites Market Revenue Forecast, 2024-2034 (US$ Billion, AGR %)
Figure 184 Mexico Automotive Composites Market Volume Forecast, 2024-2034 (Kilo Tons, AGR %)
Figure 185 Brazil Automotive Composites Market Revenue Forecast, 2024-2034 (US$ Billion, AGR %)
Figure 186 Brazil Automotive Composites Market Volume Forecast, 2024-2034 (Kilo Tons, AGR %)
Figure 187 Rest of Latin America Automotive Composites Market Revenue Forecast, 2024-2034 (US$ Billion, AGR %)
Figure 188 Rest of Latin America Automotive Composites Market Volume Forecast, 2024-2034 (Kilo Tons, AGR %)
Figure 189 Middle East & Africa Automotive Composites Market Attractiveness Index
Figure 190 Middle East & Africa Automotive Composites Market Revenue by Country, 2024, 2029 & 2034 (US$ Billion)
Figure 191 Middle East & Africa Automotive Composites Market Volume by Country, 2024, 2029 & 2034 (Kilo Tons)
Figure 192 Middle East & Africa Automotive Composites Market Revenue Forecast by Country, 2024-2034 (US$ Billion, AGR %)
Figure 193 Middle East & Africa Automotive Composites Market Revenue Share Forecast by Country, 2024 & 2034 (%)
Figure 194 Middle East & Africa Automotive Composites Market Volume Forecast by Country, 2024-2034 (Kilo Tons, AGR %)
Figure 195 Middle East & Africa Automotive Composites Market Volume Share Forecast by Country, 2024 & 2034 (%)
Figure 196 Middle East & Africa Automotive Composites Market Revenue Forecast by Polymer Type, 2024-2034 (US$ Billion, AGR %)
Figure 197 Middle East & Africa Automotive Composites Market Revenue Share Forecast by Polymer Type, 2024 & 2034 (%)
Figure 198 Middle East & Africa Automotive Composites Market Revenue Forecast by Fiber Type, 2024-2034 (US$ Billion, AGR %)
Figure 199 Middle East & Africa Automotive Composites Market Revenue Share Forecast by Fiber Type, 2024 & 2034 (%)
Figure 200 Middle East & Africa Automotive Composites Market Revenue Forecast by Application, 2024-2034 (US$ Billion, AGR %)
Figure 201 Middle East & Africa Automotive Composites Market Revenue Share Forecast by Application, 2024 & 2034 (%)
Figure 202 Middle East & Africa Automotive Composites Market Revenue Forecast by Manufacturing Process, 2024-2034 (US$ Billion, AGR %)
Figure 203 Middle East & Africa Automotive Composites Market Revenue Share Forecast by Manufacturing Process, 2024 & 2034 (%)
Figure 204 Middle East & Africa Automotive Composites Market Revenue Forecast by Vehicle Engine Type, 2024-2034 (US$ Billion, AGR %)
Figure 205 Middle East & Africa Automotive Composites Market Revenue Share Forecast by Vehicle Engine Type, 2024 & 2034 (%)
Figure 206 Middle East & Africa Automotive Composites Market Revenue Forecast by Vehicle Type, 2024-2034 (US$ Billion, AGR %)
Figure 207 Middle East & Africa Automotive Composites Market Revenue Share Forecast by Vehicle Type, 2024 & 2034 (%)
Figure 208 GCC Automotive Composites Market Revenue Forecast, 2024-2034 (US$ Billion, AGR %)
Figure 209 GCC Automotive Composites Market Volume Forecast, 2024-2034 (Kilo Tons, AGR %)
Figure 210 South Africa Automotive Composites Market Revenue Forecast, 2024-2034 (US$ Billion, AGR %)
Figure 211 South Africa Automotive Composites Market Volume Forecast, 2024-2034 (Kilo Tons, AGR %)
Figure 212 Rest of Middle East & Africa Automotive Composites Market Revenue Forecast, 2024-2034 (US$ Billion, AGR %)
Figure 213 Rest of Middle East & Africa Automotive Composites Market Volume Forecast, 2024-2034 (Kilo Tons, AGR %)
Figure 214 Toray Industries, Inc.: Net Revenue, 2017-2023 (US$ Million, AGR%)
Figure 215 Toray Industries, Inc.: R&D, 2018-2023 (US$ Million, AGR%)
Figure 216 Toray Industries, Inc.: Regional Market Shares, 2023
Figure 217 Toray Industries, Inc.: Segmental Market Shares, 2023
Figure 218 SGL Carbon SE: Net Revenue, 2017-2022 (US$ Million, AGR%)
Figure 219 SGL Carbon SE: R&D, 2017-2022 (US$ Million, AGR%)
Figure 220 SGL Carbon SE: Segmental Market Shares, 2022
Figure 221 SGL Carbon SE: Regional Market Shares, 2022
Figure 222 Teijin Limited: Net Revenue, 2017-2022 (US$ Million, AGR%)
Figure 223 Teijin Limited: R&D, 2017-2022 (US$ Million, AGR%)
Figure 224 Teijin Limited: Regional Market Shares, 2022
Figure 225 Teijin Limited: Segmental Market Shares, 2022
Figure 226 Mitsubishi Chemical Group Corporation: Net Revenue, 2017-2022 (US$ Million, AGR%)
Figure 227 Mitsubishi Chemical Group Corporation: Segmental Market Shares, 2022
Figure 228 Hexcel Corporation: Net Revenue, 2017-2023 (US$ Million, AGR%)
Figure 229 Hexcel Corporation: R&T, 2017-2023 (US$ Million, AGR%)
Figure 230 Hexcel Corporation: Regional Market Shares, 2023
Figure 231 Hexcel Corporation: Segmental Market Shares, 2022
Figure 232 BASF SE: Net Revenue, 2017-2023 (US$ Million, AGR%)
Figure 233 BASF SE: R&D, 2017-2022 (US$ Million, AGR%)
Figure 234 BASF SE: Regional Market Shares, 2022
Figure 235 BASF SE: Segmental Market Shares, 2022
Figure 236 Solvay: Net Revenue, 2017-2022 (US$ Million, AGR%)
Figure 237 Solvay: R&I, 2017-2022 (US$ Million, AGR%)
Figure 238 Solvay: Regional Market Shares, 2022
Figure 239 Solvay: Segmental Market Shares, 2022
Figure 240 Lanxess: Net Revenue, 2018-2022 (US$ Million, AGR%)
Figure 241 Lanxess: R&D, 2018-2022 (US$ Million, AGR%)
Figure 242 Lanxess: Regional Market Shares, 2022
Figure 243 Lanxess: Segmental Market Shares, 2022
Figure 244 Voith GmbH & Co. KGaA: Net Revenue, 2019-2023 (US$ Million, AGR%)
Figure 245 Voith GmbH & Co. KGaA: R&D, 2019-2023 (US$ Million, AGR%)
Figure 246 Voith GmbH & Co. KGaA: Regional Market Shares, 2023
Figure 247 Voith GmbH & Co. KGaA: Segmental Market Shares, 2023
Figure 248 Nippon Carbon Co Ltd.: Net Revenue, 2018-2022 (US$ Million, AGR%)
Figure 249 Nippon Carbon Co Ltd.: R&D, 2021-2022 (US$ Million, AGR%)
Figure 250 Nippon Carbon Co Ltd.: Regional Market Shares, 2022
Figure 251 Nippon Carbon Co Ltd.: Segmental Market Shares, 2022
Figure 252 Formosa Plastics Corporation: Net Revenue, 2017-2022 (US$ Million, AGR%)
Figure 253 Formosa Plastics Corporation: R&D, 2017-2022 (US$ Million, AGR%)
Figure 254 Formosa Taffeta Co., Ltd.: Net Revenue, 2017-2022 (US$ Million, AGR%)
Figure 255 Formosa Taffeta Co., Ltd.: Segmental Market Shares, 2022
Figure 256 Hyosung Advanced Materials: Net Revenue, 2018-2022 (US$ Million, AGR%)
Figure 257 Hyosung Advanced Materials: R&D, 2018-2022 (US$ Million, AGR%)
ページTOPに戻る
よくあるご質問
Visiongain社はどのような調査会社ですか?
英国の調査会社ヴィジョンゲイン社(Visiongain)は、通信とエネルギーのほか、自動車や化学・医薬品、金属など、広範な市場を対象に調査を行っています。自動車市場については、市場全般に関する調査のほ... もっと見る
調査レポートの納品までの日数はどの程度ですか?
在庫のあるものは速納となりますが、平均的には 3-4日と見て下さい。
但し、一部の調査レポートでは、発注を受けた段階で内容更新をして納品をする場合もあります。
発注をする前のお問合せをお願いします。
注文の手続きはどのようになっていますか?
1)お客様からの御問い合わせをいただきます。
2)見積書やサンプルの提示をいたします。
3)お客様指定、もしくは弊社の発注書をメール添付にて発送してください。
4)データリソース社からレポート発行元の調査会社へ納品手配します。
5) 調査会社からお客様へ納品されます。最近は、pdfにてのメール納品が大半です。
お支払方法の方法はどのようになっていますか?
納品と同時にデータリソース社よりお客様へ請求書(必要に応じて納品書も)を発送いたします。
お客様よりデータリソース社へ(通常は円払い)の御振り込みをお願いします。
請求書は、納品日の日付で発行しますので、翌月最終営業日までの当社指定口座への振込みをお願いします。振込み手数料は御社負担にてお願いします。
お客様の御支払い条件が60日以上の場合は御相談ください。
尚、初めてのお取引先や個人の場合、前払いをお願いすることもあります。ご了承のほど、お願いします。
データリソース社はどのような会社ですか?
当社は、世界各国の主要調査会社・レポート出版社と提携し、世界各国の市場調査レポートや技術動向レポートなどを日本国内の企業・公官庁及び教育研究機関に提供しております。
世界各国の「市場・技術・法規制などの」実情を調査・収集される時には、データリソース社にご相談ください。
お客様の御要望にあったデータや情報を抽出する為のレポート紹介や調査のアドバイスも致します。
|
|


