電気自動車充電ステーション市場レポート:2023-2033
Electric Vehicle Charging Station Market Report 2023-2033
レポート詳細
電気自動車充電ステーション市場レポート 2023-2033年 :本レポートは、業界とその基礎となる原動力をより良く理解することを望むなら、新たな収益ポケットを目指す大手企業にとって貴... もっと見る
※上記価格は部署ライセンス(Departmental licence)価格です。
その他の価格についてはデータリソースまでお問合せください。
日本語のページは自動翻訳を利用し作成しています。
実際のレポートは英文のみでご納品いたします。

|

|
サマリー
レポート詳細
電気自動車充電ステーション市場レポート 2023-2033年:本レポートは、業界とその基礎となる原動力をより良く理解することを望むなら、新たな収益ポケットを目指す大手企業にとって貴重なものとなるでしょう。異業種への進出や新規地域での既存事業の拡大を目指す企業にも有用です。
電気自動車の普及促進において極めて重要な役割を果たす政府の支援
政府の支援は、電気自動車の導入を促進し、充電ステーション・インフラの成長を促進する上で極めて重要な役割を果たしている。世界中の多くの政府は、消費者が電気自動車に乗り換えることを奨励するインセンティブを提供している。こうしたインセンティブには、電気自動車の購入や充電ステーションの設置に対する税額控除、リベート、補助金、助成金などが含まれる。さらに、公共施設や商業ビルの駐車スペースの一定割合にEV充電インフラの設置を義務付ける規制を課している政府もある。このようなインセンティブや政策は、充電ステーション・プロジェクトへの投資に有利な環境を作り出し、充電ネットワークの拡大に対する民間・公的セクターの関心を駆り立てる。
自動車メーカーの電動モビリティへのコミットメント
大手自動車メーカー各社は、車両ラインナップの電動化という野心的な計画を発表し、電動モビリティへのコミットメントを強めている。いくつかの自動車メーカーは、今後10年間で全車種を電気自動車またはハイブリッド車に移行させるという目標を掲げている。これらの自動車メーカーが内燃エンジン車を廃止するにつれて、電気自動車への需要が高まり、電気自動車普及の急増に対応するための充電ステーション・インフラの拡大が必要となる。
市場調査レポートを購入する前にすべき質問とは?
- 電気自動車充電ステーション市場はどのように進化しているのか?
- 電気自動車充電ステーション市場を牽引しているもの、抑制しているものは何か?
- 各電気自動車充電ステーションサブマーケットセグメントは予測期間中にどのように成長し、2033年にどれくらいの売上を占めるのか?
- 2023年から2033年にかけて、電気自動車充電ステーションの各サブマーケットの市場シェアはどのように推移するのか?
- 2023年から2033年にかけての市場全体の主な牽引役は何か?
- 主要な電気自動車用充電ステーション市場はマクロ経済の動きに概ね追随するのか、それとも個々の国内市場が他を凌駕するのか。
- 2033年までに各国市場のシェアはどのように変化し、2033年に市場をリードするのはどの地域か?
- 主要プレーヤーは誰で、予測期間中の見通しは?
- これらの大手企業の電気自動車充電ステーション・プロジェクトとは?
- 2023年から2033年の間に、業界はどのように発展するのか?現在および今後10年間に実施される電気自動車充電ステーションプロジェクトにはどのような意味があるのか?
- 電気自動車充電ステーション市場をさらに拡大するために、製品化の必要性は高まっているのか?
- 電気自動車充電ステーション市場はどこに向かっているのか、そしてどのようにすれば市場の最前線に立てるのか?
- 新製品やサービスラインに対する最適な投資オプションは何か?
- 企業を新たな成長軌道に乗せ、C-suiteに移行させるための重要な展望とは?
このことが、現在、そして今後10年間の電気自動車充電ステーション市場にどのような影響を与えるかを見極める必要がある:
- 449ページにわたる本レポートでは、131の表と182の図表を掲載しています。
- 本レポートでは、業界における主要な有利分野を取り上げているため、今すぐターゲットを絞ることができます。
- 世界、地域、国の売上と成長に関する詳細な分析が含まれています。
- 競合他社が成功した主なトレンド、変化、収益予測をハイライトしています。
本レポートは、電気自動車充電ステーション市場が今後10年間でどのように発展するか、またCOVID-19の景気後退と好転の変動に合わせてどのように発展するかをお伝えします。この市場は、過去10年間のどの時点よりも今が重要です。
2033年までの予測やその他の分析から、商業的な展望が明らかになる
- 2033年までの収益予測に加え、直近の業績、成長率、市場シェアもご覧いただけます。
- ビジネスの展望と展開に関する独自の分析をご覧いただけます。
- 質的分析(市場力学、促進要因、機会、阻害要因、課題を含む)、コスト構造、電気自動車充電ステーション価格上昇の影響、最近の動向をご覧いただけます。
本レポートには、COVID-19が業界と貴社にどのような影響を与えるかについてのデータ分析と貴重な洞察が含まれている。本レポートでは、COVID-19の4つの回収パターンとその影響、すなわち「V」、「L」、「W」、「U」について論じている。
レポート対象セグメント
接続性による市場セグメント
- 非接続型充電ステーション
- スマートコネクテッド充電ステーション
充電タイプ別市場セグメント
- 低速充電ポイント
- 急速充電ポイント
- 超高速充電ポイント
運用別市場セグメント
- モード1
- モード2
- モード3
- モード4
エンドユーズ別市場セグメント
- 商業
- 住宅用
- 公共充電
- 高速道路充電
- その他の用途
コンポーネント別市場セグメント
- 充電スタンド
- AC-DCインバーター
- AC電源プラグ
- EV充電ケーブル
- EVプラグ
- 補助電気設備
世界市場全体とセグメント別の収益予測に加え、4つの地域と20の主要国市場の収益予測も掲載しています:
北米
- アメリカ
- カナダ
欧州
- ドイツ
- ノルウェー
- イギリス
- フランス
- オランダ
- その他の欧州
アジア太平洋
- 中国
- 日本
- インド
- オーストラリア
- 韓国
- その他のアジア太平洋地域
ラテンアメリカ
- ブラジル
- メキシコ
- その他のラテンアメリカ
中東・アフリカ
- GCC
- 南アフリカ
- その他の中東・アフリカ
本レポートには、電気自動車充電ステーション市場の2023年から2033年にかけての主要企業のプロファイルも含まれており、これらの企業の事業のこのセグメントに焦点を当てている。
主要企業と市場成長の可能性
・ ABB Ltd
・ Blink Charging Co.
・ Delta Electronics
・ EFACEC Power Solutions SGPS, S.A.
・ Electrify America LLC
・ Enel X
・ Engie SA
・ EVBox
・ Greenlots
・ Ionity
・ NewMotion
・ Schneider Electric SE
・ Siemens AG
・ Tesla, Inc.
・ Webasto SE
2023年から2033年までの電気自動車充電ステーション市場全体の世界売上高(金額ベース)は、2023年に188億米ドルを突破する。2033年まで力強い収益成長を予測。当調査では、最も大きな可能性を秘めた企業を特定しています。彼らの能力、進歩、商業的展望を発見し、一歩先を行くお手伝いをします。
電気自動車充電ステーション市場、2023-2033年レポートはどのように役立つのか?
要約すると、440ページを超えるこのレポートは、以下の知識を提供する:
- 電気自動車充電ステーション市場の2023年から2033年までの収益予測 接続性、充電タイプ、運用、最終用途、コンポーネント、企業規模の各予測を世界および地域レベルで掲載 - 業界の展望を発見し、投資と収益に最も有利な場所を見つけます。
- 4つの地域と20の主要国市場の2033年までの収益予測 - 北米、欧州、アジア太平洋、中南米、中東・アフリカの電気自動車充電ステーション市場2023年から2033年までの予測をご覧ください。また、米国、カナダ、ブラジル、ドイツ、フランス、英国、イタリア、中国、インド、日本、オーストラリアなどの著名経済圏の市場も予測しています。
- 既存企業および市場参入を目指す企業の展望 - 電気自動車充電ステーション市場に関わる主要企業15社の企業プロファイルを含む、2023年から2033年までの展望。
独自の予測による定量的・定性的分析をご覧ください。私たちのレポートだけに含まれる情報を入手し、貴重なビジネスインテリジェンスで情報を得ることができます。
他にはない情報
私たちの新しいレポートがあれば、知識に遅れをとったり、チャンスを逃したりする可能性が低くなります。弊社の調査レポートが貴社の調査、分析、意思決定にどのように役立つかをご覧ください。Visiongainの調査は、電気自動車充電ステーション市場、2023年から2033年、市場をリードする企業の商業分析を必要とするすべての人のためのものです。データ、トレンド、予測をご覧いただけます。
ページTOPに戻る
目次
目次
1 レポート概要
1.1 研究の目的
1.2 電気自動車充電ステーション市場の紹介
1.3 本レポートの内容
1.4 本レポートを読むべき理由
1.5 本分析レポートが回答する主な質問
1.6 本レポートは誰のためのものか?
1.7 調査方法
1.7.1 市場の定義
1.7.2 市場評価・予測手法
1.7.3 データ検証
1.7.3.1 一次調査
1.7.3.2 セカンダリーリサーチ
1.8 よくある質問(FAQ)
1.9 Visiongainの関連レポート
1.10 Visiongainについて
2 エグゼクティブ・サマリー
3 市場概要
3.1 主要な調査結果
3.2 市場ダイナミクス
3.2.1 市場促進要因
3.2.1.1 世界各国政府は、クリーンな輸送を促進し、二酸化炭素排出量を削減するために、厳しい規制を実施し、インセンティブを提供している。
3.2.1.2 充電ステーションのハードウェア、ソフトウェア、接続ソリューションの革新により、充電速度の高速化、効率の改善、ユーザー体験の向上が達成されつつある。
3.2.1.3 気候変動と従来の化石燃料自動車による環境への影響に対する懸念の高まりにより、持続可能な輸送が重視されるようになっている。
3.2.2 市場抑制要因
3.2.2.1 業界にとっての重大な阻害要因のひとつは、既存のインフラ格差と電気グリッドの限界
3.2.2.2 包括的な充電インフラ網の構築には多額の初期投資が必要
3.2.2.3 航続距離不安(走行中のバッテリー充電切れの恐れ)は、電気自動車所有者の懸念である。
3.2.2.4 標準化された充電プロトコルと異なる充電ネットワーク間の相互運用性の欠如は、電気自動車所有者に課題をもたらす可能性がある。
3.2.3 市場機会
3.2.3.1 EV充電ステーションへの投資とEV産業におけるインフラ拡大の機会
3.2.3.2 電気自動車は送電網の安定化と再生可能エネルギー利用のための貴重な資源となり得る
3.2.3.3 インテリジェント充電ソリューションを導入することで、業界は負荷管理、グリッド最適化、消費者と充電ステーション運営者のコスト削減の機会を引き出すことができる。
3.2.3.4 商用車両は予測可能なスケジュールと集中デポを持つ傾向があり、電化の理想的な候補となる
3.3 COVID-19影響分析
3.3.1 V字型回復シナリオ
3.3.2 W字型回復シナリオ
3.3.3 U字型回復シナリオ
3.3.4 L字型回収シナリオ
3.4 ポーターのファイブフォース分析
3.4.1 新規参入の脅威(中)
3.4.2 サプライヤーの交渉力(中)
3.4.3 買い手の交渉力(中~高)
3.4.4 代替品の脅威(低)
3.4.5 競争ライバルの激しさ(高)
3.5 PESTLE分析
3.5.1 政治的要因
3.5.2 経済的要因
3.5.3 社会的要因
3.5.4 技術的要因
3.5.5 法的要因
3.5.6 環境要因
3.6 SWOT分析
3.6.1 長所
3.6.2 弱点
3.6.3 機会
3.6.4 脅威
4 電気自動車充電ステーション市場分析:コネクティビティ別
4.1 主要調査結果
4.2 接続性セグメント 市場魅力度指数
4.2.1 電気自動車充電ステーションの接続性別市場
4.3 非接続型充電ステーション
4.3.1 2023〜2033年の地域別市場(US$ Bn)
4.3.2 地域別市場シェア、2023年・2033年(%)
4.4 スマートコネクテッド充電ステーション
4.4.1 2023〜2033年の地域別市場(US$ Bn)
4.4.2 地域別市場シェア、2023年・2033年(%)
5 電気自動車充電ステーション市場分析:充電タイプ別
5.1 主要調査結果
5.2 充電タイプセグメント 市場魅力度指数
5.2.1 充電タイプ別電気自動車充電ステーション市場
5.3 低速充電ポイント
5.3.1 2023〜2033年の地域別市場(US$ Bn)
5.3.2 地域別市場シェア、2023年・2033年(%)
5.4 急速充電ポイント
5.4.1 2023〜2033年の地域別市場(US$ Bn)
5.4.2 地域別市場シェア、2023年・2033年(%)
5.5 超高速充電ポイント
5.5.1 2023〜2033年の地域別市場(US$ Bn)
5.5.2 地域別市場シェア、2023年・2033年(%)
6 電気自動車充電ステーション市場分析:運用別
6.1 主要調査結果
6.2 運用セグメント別 市場魅力度指数
6.2.1 電気自動車充電ステーションの運用別市場
6.3 モード1
6.3.1 2023〜2033年の地域別市場(US$ Bn)
6.3.2 地域別市場シェア、2023年・2033年(%)
6.4 モード2
6.4.1 2023〜2033年の地域別市場(US$ Bn)
6.4.2 地域別市場シェア、2023年・2033年(%)
6.5 モード3
6.5.1 2023〜2033年の地域別市場(US$ Bn)
6.5.2 地域別市場シェア、2023年・2033年(%)
6.6 モード4
6.6.1 2023〜2033年の地域別市場(US$ Bn)
6.6.2 地域別市場シェア、2023年・2033年(%)
7 電気自動車充電ステーション市場分析:エンドユーズ別
7.1 主要調査結果
7.2 最終用途セグメント市場魅力度指数
7.2.1 電気自動車充電ステーション市場エンドユーズ別
7.3 業務用
7.3.1 2023〜2033年の地域別市場(US$ Bn)
7.3.2 地域別市場シェア、2023年・2033年(%)
7.4 住宅用
7.4.1 2023〜2033年の地域別市場(US$ Bn)
7.4.2 地域別市場シェア、2023年・2033年(%)
7.5 公共充電
7.5.1 2023〜2033年の地域別市場(US$ Bn)
7.5.2 地域別市場シェア、2023年・2033年(%)
7.6 高速道路充電
7.6.1 2023〜2033年の地域別市場(US$ Bn)
7.6.2 地域別市場シェア、2023年・2033年(%)
7.7 その他の最終用途
7.7.1 2023年~2033年の地域別市場(US$ Bn)
7.7.2 地域別市場シェア、2023年・2033年(%)
8 電気自動車充電ステーション市場分析:コンポーネント別
8.1 主要調査結果
8.2 コンポーネントセグメント 市場魅力度指数
8.2.1 電気自動車充電ステーションのコンポーネント別市場
8.3 充電スタンド
8.3.1 2023〜2033年の地域別市場(US$ Bn)
8.3.2 地域別市場シェア、2023年・2033年(%)
8.4 AC-DCインバータ
8.4.1 2023年~2033年の地域別市場(US$ Bn)
8.4.2 地域別市場シェア、2023年・2033年(%)
8.5 AC電源プラグ
8.5.1 2023〜2033年の地域別市場(US$ Bn)
8.5.2 地域別市場シェア、2023年・2033年(%)
8.6 EV充電ケーブル
8.6.1 2023〜2033年の地域別市場(US$ Bn)
8.6.2 地域別市場シェア、2023年・2033年(%)
8.7 EVプラグ
8.7.1 2023〜2033年の地域別市場(US$ Bn)
8.7.2 地域別市場シェア、2023年・2033年(%)
8.8 補助電気機器
8.8.1 2023〜2033年の地域別市場(US$ Bn)
8.8.2 地域別市場シェア、2023年・2033年(%)
9 電気自動車充電ステーション市場分析:地域別
9.1 主要調査結果
9.1.1 電気自動車充電ステーションの地域別市場
10 北米電気自動車充電ステーション市場分析
10.1 主要な調査結果
10.2 北米の電気自動車充電ステーション市場魅力度指数
10.3 北米の電気自動車充電ステーション市場:国別、2023年、2028年、2033年(US$ Billion)
10.4 北米の電気自動車充電ステーション市場:金額別
10.5 北米の電気自動車充電ステーション市場:国別
10.6 北米の電気自動車充電ステーション市場:接続性別
10.7 北米の電気自動車充電ステーション市場:充電タイプ別
10.8 北米の電気自動車充電ステーション市場:運用別
10.9 北米の電気自動車充電ステーション市場:エンドユーズ別
10.10 北米の電気自動車充電ステーション市場:コンポーネント別
10.11 米国の電気自動車充電ステーション市場分析
10.12 カナダの電気自動車充電スタンド市場分析
11 欧州の電気自動車充電ステーション市場分析
11.1 主要な調査結果
11.2 欧州の電気自動車充電ステーション市場魅力度指数
11.3 欧州の電気自動車充電ステーション市:場国別、2023年、2028年、2033年(US$ Billion)
11.4 欧州の電気自動車充電ステーション市場:金額ベース
11.5 欧州の電気自動車充電ステーション市場:国別
11.6 欧州の電気自動車充電ステーション市場:接続性別
11.7 欧州の電気自動車充電ステーション市場:充電タイプ別
11.8 欧州の電気自動車充電ステーション市場:運用別
11.9 欧州の電気自動車充電ステーション市場:エンドユーズ別
11.10 欧州の電気自動車充電ステーション市場:コンポーネント別
11.11 ドイツの電気自動車充電ステーション市場分析
11.12 イギリスの電気自動車充電ステーション市場分析
11.13 フランスの電気自動車充電ステーション市場分析
11.14 ノルウェーの電気自動車充電ステーション市場分析
11.15 オランダの電気自動車充電ステーション市場分析
11.16 その他の欧州の電気自動車充電ステーション市場分析
12 アジア太平洋地域の電気自動車充電ステーション市場分析
12.1 主要な調査結果
12.2 アジア太平洋地域の電気自動車充電ステーション市場魅力度指数
12.3 アジア太平洋地域の電気自動車充電ステーション市場:国別、2023年、2028年、2033年(US$ Billion)
12.4 アジア太平洋地域の電気自動車充電ステーション市場:金額ベース
12.5 アジア太平洋地域の電気自動車充電ステーション市場:国別
12.6 アジア太平洋地域の電気自動車充電ステーション市場:接続性別
12.7 アジア太平洋地域の電気自動車充電ステーション市場:充電タイプ別
12.8 アジア太平洋地域の電気自動車充電ステーション市場:運用別
12.9 アジア太平洋地域の電気自動車充電ステーション市場:エンドユーズ別
12.10 アジア太平洋地域の電気自動車充電ステーション市場:部品別
12.11 中国の電気自動車充電ステーション市場分析
12.12 インドの電気自動車充電ステーション市場分析
12.13 日本の電気自動車充電ステーション市場分析
12.14 韓国電気自動車充電ステーションの市場分析
12.15 オーストラリアの電気自動車充電スタンド市場分析
12.16 その他のアジア太平洋地域の電気自動車充電ステーション市場分析
13 中東・アフリカ電気自動車充電スタンド市場分析
13.1 主要な調査結果
13.2 中東・アフリカの電気自動車充電ステーション市場魅力度指数
13.3 中東・アフリカの電気自動車充電ステーション市場:国別、2023年、2028年、2033年(US$ Billion)
13.4 中東・アフリカの電気自動車充電ステーション市場:金額ベース
13.5 中東・アフリカの電気自動車充電ステーション市場:国別
13.6 中東・アフリカの電気自動車充電ステーション市場:接続性別
13.7 中東・アフリカの電気自動車充電ステーション市場:充電タイプ別
13.8 中東・アフリカの電気自動車充電ステーション市場:運用別
13.9 中東・アフリカの電気自動車充電ステーション市場:エンドユーズ別
13.10 中東・アフリカ電気自動車充電ステーション市場:コンポーネント別
13.11 GCC(湾岸協力会議)の電気自動車充電ステーション市場分析
13.12 南アフリカの電気自動車充電ステーション市場分析
13.13 その他の中東・アフリカ(MEA)の電気自動車充電ステーションの市場分析
14 ラテンアメリカの電気自動車充電ステーション市場分析
14.1 主要な調査結果
14.2 ラテンアメリカの電気自動車充電ステーション市場魅力度指数
14.3 ラテンアメリカの電気自動車充電ステーション国別市場:2023年、2028年、2033年(US$ Billion)
14.4 ラテンアメリカの電気自動車充電ステーション市場:金額ベース
14.5 ラテンアメリカの電気自動車充電ステーション市場:国別
14.6 ラテンアメリカの電気自動車充電ステーション市場:接続性別
14.7 ラテンアメリカの電気自動車充電ステーション市場:充電タイプ別
14.8 ラテンアメリカの電気自動車充電ステーション市場:運用別
14.9 ラテンアメリカの電気自動車充電ステーション市場:エンドユーズ別
14.10 ラテンアメリカの電気自動車充電ステーション市場:部品別
14.11 ブラジルの電気自動車充電ステーション市場分析
14.12 メキシコの電気自動車充電ステーション市場分析
14.13 その他のラテンアメリカの電気自動車充電ステーション市場分析
15 会社概要
15.1 競争環境、2022年
15.2 戦略的展望
15.2.1 主要事業戦略としての買収
15.2.2 主要事業戦略としての契約
15.2.3 主要事業戦略としての提携
15.2.4 主要事業戦略としての契約
15.2.5 主要事業戦略としての事業拡大
15.2.6 主要事業戦略としての投資
15.2.7 主要事業戦略としての合弁事業
15.2.8 主要事業戦略としての新製品上市
15.2.9 主要事業戦略としてのパートナーシップ
15.3 Tesla, Inc
15.3.1 会社概要
15.3.2 会社概要
15.3.3 財務分析
15.3.3.1 純収入、2018-2022年
15.3.3.2 R&D、2018-2022年
15.3.3.3 地域別収益シェア、2022年(%)
15.3.3.4 事業セグメント収益シェア、2022年(%)
15.3.4 製品ベンチマーク
15.3.5 戦略的展望
15.4 ABB Ltd
15.4.1 会社概要
15.4.2 会社概要
15.4.3 財務分析
15.4.3.1 純収入、2018-2022年
15.4.3.2 R&D、2018年~2022年
15.4.3.3 事業セグメント収益シェア、2022年(%)
15.4.4 製品ベンチマーク
15.4.5 戦略的展望
15.5 EVBox
15.5.1 会社概要
15.5.2 会社概要
15.5.3 製品ベンチマーク
15.5.4 戦略的展望
15.6 Schneider Electric SE
15.6.1 会社概要
15.6.2 会社概要
15.6.3 財務分析
15.6.3.1 純収入、2018-2022年
15.6.3.2 R&D、2018年〜2022年
15.6.3.3 地域別収益シェア、2022年(%)
15.6.3.4 事業セグメント収益シェア、2022年(%)
15.6.4 製品ベンチマーク
15.6.5 戦略的展望
15.7 Siemens AG
15.7.1 会社概要
15.7.2 会社概要
15.7.3 財務分析
15.7.3.1 純収入、2018-2022年
15.7.3.2 R&D、2018年~2022年
15.7.3.3 地域別収益シェア、2022年(%)
15.7.3.4 事業セグメント収益シェア、2022年(%)
15.7.4 製品ベンチマーク
15.7.5 戦略的展望
15.8 Engie SA
15.8.1 会社概要
15.8.2 会社概要
15.8.3 製品ベンチマーク
15.8.4 戦略的展望
15.9 Delta Electronics
15.9.1 会社概要
15.9.2 会社概要
15.9.3 製品ベンチマーク
15.9.4 戦略的展望
15.10 EFACEC Power Solutions SGPS, S.A.
15.10.1 会社概要
15.10.2 会社概要
15.10.3 製品ベンチマーク
15.10.4 戦略的展望
15.11 Blink Charging Co
15.11.1 会社概要
15.11.2 会社概要
15.11.3 財務分析
15.11.3.1 純収入、2018-2022年
15.11.3.2 地域別収益シェア、2022年(%)
15.11.4 製品ベンチマーク
15.11.5 戦略的展望
15.12 Webasto SE
15.12.1 会社概要
15.12.2 会社概要
15.12.3 製品ベンチマーク
15.12.4 戦略的展望
15.13 NewMotion
15.13.1 会社概要
15.13.2 会社概要
15.13.3 製品ベンチマーク
15.13.4 戦略的展望
15.14 Ionity
15.14.1 会社概要
15.14.2 会社概要
15.14.3 製品ベンチマーク
15.14.4 戦略的展望
15.15 Electrify America LLC
15.15.1 会社概要
15.15.2 会社概要
15.15.3 製品ベンチマーク
15.15.4 戦略的展望
15.16 Greenlots
15.16.1 会社概要
15.16.2 会社概要
15.16.3 製品ベンチマーク
15.16.4 戦略的展望
15.17 Enel X
15.17.1 会社概要
15.17.2 会社概要
15.17.3 財務分析
15.17.3.1 純収入、2018年~2022年
15.17.3.2 R&D、2018年~2022年
15.17.3.3 地域別売上シェア、2022年(%)
15.17.3.4 事業セグメント収益シェア、2022年(%)
15.17.4 製品ベンチマーク
15.17.5 戦略的展望
16 結論と提言
16.1 Visiongainからの結びの言葉
16.2 市場プレイヤーへの提言
ページTOPに戻る
図表リスト
表の一覧
Table 1 Electric Vehicle Charging Station Market Snapshot, 2023 & 2033 (US$ Billion, CAGR %)
Table 2 Electric Vehicle Charging Station Market by Region, 2023-2033 (US$ Bn, AGR (%), CAGR (%)) (V-Shaped Recovery Scenario)
Table 3 Electric Vehicle Charging Station Market by Region, 2023-2033 (US$ Bn, AGR (%), CAGR (%)) (W-Shaped Recovery Scenario)
Table 4 Electric Vehicle Charging Station Market by Region, 2023-2033 (US$ Bn, AGR (%), CAGR (%)) (U-Shaped Recovery Scenario)
Table 5 Electric Vehicle Charging Station Market by Region, 2023-2033 (US$ Bn, AGR (%), CAGR (%)) (L-Shaped Recovery Scenario)
Table 6 Electric Vehicle Charging Station Market by Connectivity, 2023-2033 (US$ Bn, AGR (%), CAGR (%))
Table 7 Non-connected Charging Stations Market by Region, 2023-2033 (US$ Bn, AGR (%), CAGR (%))
Table 8 Smart Connected Charging Stations Market by Region, 2023-2033 (US$ Bn, AGR (%), CAGR (%))
Table 9 Electric Vehicle Charging Station Market by Charging Type, 2023-2033 (US$ Bn, AGR (%), CAGR (%))
Table 10 Slow Charging Points Market by Region, 2023-2033 (US$ Bn, AGR (%), CAGR (%))
Table 11 Fast Charging Points Market by Region, 2023-2033 (US$ Bn, AGR (%), CAGR (%))
Table 12 Ultra-Fast Charging Points Market by Region, 2023-2033 (US$ Bn, AGR (%), CAGR (%))
Table 13 Electric Vehicle Charging Station Market by Operation, 2023-2033 (US$ Bn, AGR (%), CAGR (%))
Table 14 Mode 1 Market by Region, 2023-2033 (US$ Bn, AGR (%), CAGR (%))
Table 15 Mode 2 Market by Region, 2023-2033 (US$ Bn, AGR (%), CAGR (%))
Table 16 Mode 3 Market by Region, 2023-2033 (US$ Bn, AGR (%), CAGR (%))
Table 17 Mode 4 Market by Region, 2023-2033 (US$ Bn, AGR (%), CAGR (%))
Table 18 Electric Vehicle Charging Station Market by End-Use, 2023-2033 (US$ Bn, AGR (%), CAGR (%))
Table 19 Commercial Market by Region, 2023-2033 (US$ Bn, AGR (%), CAGR (%))
Table 20 Residential Market by Region, 2023-2033 (US$ Bn, AGR (%), CAGR (%))
Table 21 Public Charging Market by Region, 2023-2033 (US$ Bn, AGR (%), CAGR (%))
Table 22 Highway Charging Market by Region, 2023-2033 (US$ Bn, AGR (%), CAGR (%))
Table 23 Other End-Use Market by Region, 2023-2033 (US$ Bn, AGR (%), CAGR (%))
Table 24 Electric Vehicle Charging Station Market by Component, 2023-2033 (US$ Bn, AGR (%), CAGR (%))
Table 25 Charging Stall Market by Region, 2023-2033 (US$ Bn, AGR (%), CAGR (%))
Table 26 AC-to-DC Inverter Market by Region, 2023-2033 (US$ Bn, AGR (%), CAGR (%))
Table 27 AC power Source Plug Market by Region, 2023-2033 (US$ Bn, AGR (%), CAGR (%))
Table 28 EV Charging Cable Market by Region, 2023-2033 (US$ Bn, AGR (%), CAGR (%))
Table 29 EV Plug Market by Region, 2023-2033 (US$ Bn, AGR (%), CAGR (%))
Table 30 Auxiliary Electrical Equipment Market by Region, 2023-2033 (US$ Bn, AGR (%), CAGR (%))
Table 31 Electric Vehicle Charging Station Market by Region, 2023-2033 (US$ Bn, AGR (%), CAGR (%))
Table 32 North America Electric Vehicle Charging Station Market by Value, 2023-2033 (US$ Bn, AGR (%), CAGR (%))
Table 33 North America Electric Vehicle Charging Station Market by Country, 2023-2033 (US$ Bn, AGR (%), CAGR (%))
Table 34 North America Electric Vehicle Charging Station Market by Connectivity, 2023-2033 (US$ Bn, AGR (%), CAGR (%))
Table 35 North America Electric Vehicle Charging Station Market by Charging Type, 2023-2033 (US$ Bn, AGR (%), CAGR (%))
Table 36 North America Electric Vehicle Charging Station Market by Operation, 2023-2033 (US$ Bn, AGR (%), CAGR (%))
Table 37 North America Electric Vehicle Charging Station Market by End-Use, 2023-2033 (US$ Bn, AGR (%), CAGR (%))
Table 38 North America Electric Vehicle Charging Station Market by Component, 2023-2033 (US$ Bn, AGR (%), CAGR (%))
Table 39 US Electric Vehicle Charging Station Market by Value, 2023-2033 (US$ Bn, AGR (%), CAGR (%))
Table 40 Canada Electric Vehicle Charging Station Market by Value, 2023-2033 (US$ Bn, AGR (%), CAGR (%))
Table 41 Europe Electric Vehicle Charging Station Market by Value, 2023-2033 (US$ Bn, AGR (%), CAGR (%))
Table 42 Europe Electric Vehicle Charging Station Market by Country, 2023-2033 (US$ Bn, AGR (%), CAGR (%))
Table 43 Europe Electric Vehicle Charging Station Market by Connectivity, 2023-2033 (US$ Bn, AGR (%), CAGR (%))
Table 44 Europe Electric Vehicle Charging Station Market by Charging Type, 2023-2033 (US$ Bn, AGR (%), CAGR (%))
Table 45 Europe Electric Vehicle Charging Station Market by Operation, 2023-2033 (US$ Bn, AGR (%), CAGR (%))
Table 46 Europe Electric Vehicle Charging Station Market by End-Use, 2023-2033 (US$ Bn, AGR (%), CAGR (%))
Table 47 Europe Electric Vehicle Charging Station Market by Component, 2023-2033 (US$ Bn, AGR (%), CAGR (%))
Table 48 Germany Electric Vehicle Charging Station Market by Value, 2023-2033 (US$ Bn, AGR (%), CAGR (%))
Table 49 UK Electric Vehicle Charging Station Market by Value, 2023-2033 (US$ Bn, AGR (%), CAGR (%))
Table 50 France Electric Vehicle Charging Station Market by Value, 2023-2033 (US$ Bn, AGR (%), CAGR (%))
Table 51 Norway Electric Vehicle Charging Station Market by Value, 2023-2033 (US$ Bn, AGR (%), CAGR (%))
Table 52 Netherlands Electric Vehicle Charging Station Market by Value, 2023-2033 (US$ Bn, AGR (%), CAGR (%))
Table 53 Rest of Europe Electric Vehicle Charging Station Market by Value, 2023-2033 (US$ Bn, AGR (%), CAGR (%))
Table 54 Asia-Pacific Electric Vehicle Charging Station Market by Value, 2023-2033 (US$ Bn, AGR (%), CAGR (%))
Table 55 Asia-Pacific Electric Vehicle Charging Station Market by Country, 2023-2033 (US$ Bn, AGR (%), CAGR (%))
Table 56 Asia-Pacific Electric Vehicle Charging Station Market by Connectivity, 2023-2033 (US$ Bn, AGR (%), CAGR (%))
Table 57 Asia-Pacific Electric Vehicle Charging Station Market by Charging Type, 2023-2033 (US$ Bn, AGR (%), CAGR (%))
Table 58 Asia-Pacific Electric Vehicle Charging Station Market by Operation, 2023-2033 (US$ Bn, AGR (%), CAGR (%))
Table 59 Asia-Pacific Electric Vehicle Charging Station Market by End-Use, 2023-2033 (US$ Bn, AGR (%), CAGR (%))
Table 60 Asia-Pacific Electric Vehicle Charging Station Market by Component, 2023-2033 (US$ Bn, AGR (%), CAGR (%))
Table 61 China Electric Vehicle Charging Station Market by Value, 2023-2033 (US$ Bn, AGR (%), CAGR (%))
Table 62 India Electric Vehicle Charging Station Market by Value, 2023-2033 (US$ Bn, AGR (%), CAGR (%))
Table 63 Japan Electric Vehicle Charging Station Market by Value, 2023-2033 (US$ Bn, AGR (%), CAGR (%))
Table 64 South Korea Electric Vehicle Charging Station Market by Value, 2023-2033 (US$ Bn, AGR (%), CAGR (%))
Table 65 Australia Electric Vehicle Charging Station Market by Value, 2023-2033 (US$ Bn, AGR (%), CAGR (%))
Table 66 Rest of Asia-Pacific Electric Vehicle Charging Station Market by Value, 2023-2033 (US$ Bn, AGR (%), CAGR (%))
Table 67 Middle East & Africa Electric Vehicle Charging Station Market by Value, 2023-2033 (US$ Bn, AGR (%), CAGR (%))
Table 68 Middle East & Africa Electric Vehicle Charging Station Market by Country, 2023-2033 (US$ Bn, AGR (%), CAGR (%))
Table 69 Middle East & Africa Electric Vehicle Charging Station Market by Connectivity, 2023-2033 (US$ Bn, AGR (%), CAGR (%))
Table 70 Middle East & Africa Electric Vehicle Charging Station Market by Charging Type, 2023-2033 (US$ Bn, AGR (%), CAGR (%))
Table 71 Middle East & Africa Electric Vehicle Charging Station Market by Operation, 2023-2033 (US$ Bn, AGR (%), CAGR (%))
Table 72 Middle East & Africa Electric Vehicle Charging Station Market by End-Use, 2023-2033 (US$ Bn, AGR (%), CAGR (%))
Table 73 Middle East & Africa Electric Vehicle Charging Station Market by Component, 2023-2033 (US$ Bn, AGR (%), CAGR (%))
Table 74 GCC Electric Vehicle Charging Station Market by Value, 2023-2033 (US$ Bn, AGR (%), CAGR (%))
Table 75 South Africa Electric Vehicle Charging Station Market by Value, 2023-2033 (US$ Bn, AGR (%), CAGR (%))
Table 76 Rest of Middle East & Africa Electric Vehicle Charging Station Market by Value, 2023-2033 (US$ Bn, AGR (%), CAGR (%))
Table 77 Latin America Electric Vehicle Charging Station Market by Value, 2023-2033 (US$ Bn, AGR (%), CAGR (%))
Table 78 Latin America Electric Vehicle Charging Station Market by Country, 2023-2033 (US$ Bn, AGR (%), CAGR (%))
Table 79 Latin America Electric Vehicle Charging Station Market by Connectivity, 2023-2033 (US$ Bn, AGR (%), CAGR (%))
Table 80 Latin America Electric Vehicle Charging Station Market by Charging Type, 2023-2033 (US$ Bn, AGR (%), CAGR (%))
Table 81 Latin America Electric Vehicle Charging Station Market by Operation, 2023-2033 (US$ Bn, AGR (%), CAGR (%))
Table 82 Latin America Electric Vehicle Charging Station Market by End-Use, 2023-2033 (US$ Bn, AGR (%), CAGR (%))
Table 83 Latin America Electric Vehicle Charging Station Market by Component, 2023-2033 (US$ Bn, AGR (%), CAGR (%))
Table 84 Brazil Electric Vehicle Charging Station Market by Value, 2023-2033 (US$ Bn, AGR (%), CAGR (%))
Table 85 Mexico Electric Vehicle Charging Station Market by Value, 2023-2033 (US$ Bn, AGR (%), CAGR (%))
Table 86 Rest of Latin America Electric Vehicle Charging Station Market by Value, 2023-2033 (US$ Bn, AGR (%), CAGR (%))
Table 87 Tesla, Inc Key Details, (CEO, HQ, Revenue, Founded, No. of Employees, Company Type, Website, Business Segment)
Table 88 Tesla, Inc: Product Benchmarking
Table 89 Tesla, Inc: Strategic Outlook
Table 90 ABB Ltd Key Details, (CEO, HQ, Revenue, Founded, No. of Employees, Company Type, Website, Business Segment)
Table 91 ABB Ltd: Product Benchmarking
Table 92 ABB Ltd: Strategic Outlook
Table 93 EVBox Key Details, (CEO, HQ, Revenue, Founded, No. of Employees, Company Type, Website, Business Segment)
Table 94 EVBox: Product Benchmarking
Table 95 EVBox: Strategic Outlook
Table 96 Schneider Electric SE Key Details, (CEO, HQ, Revenue, Founded, No. of Employees, Company Type, Website, Business Segment)
Table 97 Schneider Electric SE: Product Benchmarking
Table 98 Schneider Electric SE: Strategic Outlook
Table 99 Siemens AG Key Details, (CEO, HQ, Revenue, Founded, No. of Employees, Company Type, Website, Business Segment)
Table 100 Siemens AG: Product Benchmarking
Table 101 Siemens AG: Strategic Outlook
Table 102 Engie SA Key Details, (CEO, HQ, Revenue, Founded, No. of Employees, Company Type, Website, Business Segment)
Table 103 Engie SA: Product Benchmarking
Table 104 Engie SA: Strategic Outlook
Table 105 Delta Electronics Key Details, (CEO, HQ, Revenue, Founded, No. of Employees, Company Type, Website, Business Segment)
Table 106 Delta Electronics: Product Benchmarking
Table 107 Delta Electronics: Strategic Outlook
Table 108 EFACEC Power Solutions SGPS, S.A. Key Details, (CEO, HQ, Revenue, Founded, No. of Employees, Company Type, Website, Business Segment)
Table 109 EFACEC Power Solutions SGPS, S.A.: Product Benchmarking
Table 110 EFACEC Power Solutions SGPS, S.A.: Strategic Outlook
Table 111 Blink Charging Co Key Details, (CEO, HQ, Revenue, Founded, No. of Employees, Company Type, Website, Business Segment)
Table 112 Blink Charging Co: Product Benchmarking
Table 113 Blink Charging Co: Strategic Outlook
Table 114 Webasto SE Key Details, (CEO, HQ, Revenue, Founded, No. of Employees, Company Type, Website, Business Segment)
Table 115 Webasto SE: Product Benchmarking
Table 116 Webasto SE: Strategic Outlook
Table 117 NewMotion Key Details, (CEO, HQ, Revenue, Founded, No. of Employees, Company Type, Website, Business Segment)
Table 118 NewMotion: Product Benchmarking
Table 119 NewMotion: Strategic Outlook
Table 120 Ionity Key Details, (CEO, HQ, Revenue, Founded, No. of Employees, Company Type, Website, Business Segment)
Table 121 Ionity: Product Benchmarking
Table 122 Ionity: Strategic Outlook
Table 123 Electrify America LLC Key Details, (CEO, HQ, Revenue, Founded, No. of Employees, Company Type, Website, Business Segment)
Table 124 Electrify America LLC: Product Benchmarking
Table 125 Electrify America LLC: Strategic Outlook
Table 126 GreenlotsKey Details, (CEO, HQ, Revenue, Founded, No. of Employees, Company Type, Website, Business Segment)
Table 127 Greenlots: Product Benchmarking
Table 128 Greenlots: Strategic Outlook
Table 129 Enel X Key Details, (CEO, HQ, Revenue, Founded, No. of Employees, Company Type, Website, Business Segment)
Table 130 Enel X: Product Benchmarking
Table 131 Enel X: Strategic Outlook
図の一覧
Figure 1 Electric Vehicle Charging Station Market Segmentation
Figure 2 Electric Vehicle Charging Station Market by Connectivity: Market Attractiveness Index
Figure 3 Electric Vehicle Charging Station Market by Charging Type: Market Attractiveness Index
Figure 4 Electric Vehicle Charging Station Market by Operation: Market Attractiveness Index
Figure 5 Electric Vehicle Charging Station Market by End-Use: Market Attractiveness Index
Figure 6 Electric Vehicle Charging Station Market by Component: Market Attractiveness Index
Figure 7 Electric Vehicle Charging Station Market Attractiveness Index by Region
Figure 8 Electric Vehicle Charging Station Market: Market Dynamics
Figure 9 Electric Vehicle Charging Station Market by Region, 2023-2033 (US$ Bn, AGR (%)) (V-Shaped Recovery Scenario)
Figure 10 Electric Vehicle Charging Station Market by Region, 2023-2033 (US$ Bn, AGR (%)) (W-Shaped Recovery Scenario
Figure 11 Electric Vehicle Charging Station Market by Region, 2023-2033 (US$ Bn, AGR (%)) (U-Shaped Recovery Scenario)
Figure 12 Electric Vehicle Charging Station Market by Region, 2023-2033 (US$ Bn, AGR (%)) (L-Shaped Recovery Scenario)
Figure 13 Electric Vehicle Charging Station Market: Porter’s Five Forces Analysis
Figure 14 Electric Vehicle Charging Station Market by Connectivity: Market Attractiveness Index
Figure 15 Electric Vehicle Charging Station Market by Connectivity, 2023-2033 (US$ Bn, AGR (%))
Figure 16 Non-connected Charging Stations Market by Region, 2023-2033 (US$ Bn, AGR (%))
Figure 17 Non-connected Charging Stations Segment Market Share Forecast by Region, 2023 & 2033 (%)
Figure 18 Smart Connected Charging Stations Market by Region, 2023-2033 (US$ Bn, AGR (%))
Figure 19 Smart Connected Charging Stations Segment Market Share Forecast by Region, 2023 & 2033 (%)
Figure 20 Electric Vehicle Charging Station Market by Charging Type: Market Attractiveness Index
Figure 21 Electric Vehicle Charging Station Market by Charging Type, 2023-2033 (US$ Bn, AGR (%))
Figure 22 Slow Charging Points Market by Region, 2023-2033 (US$ Bn, AGR (%))
Figure 23 Slow Charging Points Segment Market Share Forecast by Region, 2023 & 2033 (%)
Figure 24 Fast Charging Points Market by Region, 2023-2033 (US$ Bn, AGR (%))
Figure 25 Fast Charging Points Segment Market Share Forecast by Region, 2023 & 2033 (%)
Figure 26 Ultra-Fast Charging Points Market by Region, 2023-2033 (US$ Bn, AGR (%))
Figure 27 Ultra-Fast Charging Points Segment Market Share Forecast by Region, 2023 & 2033 (%)
Figure 28 Electric Vehicle Charging Station Market by Operation: Market Attractiveness Index
Figure 29 Global Electric Vehicle Charging Station Market by Operation, 2023-2033 (US$ Bn, AGR (%))
Figure 30 Mode 1 Market by Region, 2023-2033 (US$ Bn, AGR (%))
Figure 31 Mode 1 Segment Market Share Forecast by Region, 2023 & 2033 (%)
Figure 32 Mode 2 Market by Region, 2023-2033 (US$ Bn, AGR (%))
Figure 33 Mode 2 Segment Market Share Forecast by Region, 2023 & 2033 (%)
Figure 34 Mode 3 Market by Region, 2023-2033 (US$ Bn, AGR (%))
Figure 35 Mode 3 Segment Market Share Forecast by Region, 2023 & 2033 (%)
Figure 36 Mode 4 Market by Region, 2023-2033 (US$ Bn, AGR (%))
Figure 37 Mode 4 Segment Market Share Forecast by Region, 2023 & 2033 (%)
Figure 38 Electric Vehicle Charging Station Market by End-Use: Market Attractiveness Index
Figure 39 Electric Vehicle Charging Station Market by End-Use, 2023-2033 (US$ Bn, AGR (%))
Figure 40 Commercial Market by Region, 2023-2033 (US$ Bn, AGR (%))
Figure 41 Commercial Segment Market Share Forecast by Region, 2023 & 2033 (%)
Figure 42 Residential Market by Region, 2023-2033 (US$ Bn, AGR (%))
Figure 43 Residential Segment Market Share Forecast by Region, 2023 & 2033 (%)
Figure 44 Public Charging Market by Region, 2023-2033 (US$ Bn, AGR (%))
Figure 45 Public Charging Segment Market Share Forecast by Region, 2023 & 2033 (%)
Figure 46 Highway Charging Market by Region, 2023-2033 (US$ Bn, AGR (%))
Figure 47 Highway Charging Segment Market Share Forecast by Region, 2023 & 2033 (%)
Figure 48 Other End-Use Market by Region, 2023-2033 (US$ Bn, AGR (%))
Figure 49 Other End-Use Segment Market Share Forecast by Region, 2023 & 2033 (%)
Figure 50 Electric Vehicle Charging Station Market by Component: Market Attractiveness Index
Figure 51 Electric Vehicle Charging Station Market by Component, 2023-2033 (US$ Bn, AGR (%))
Figure 52 Charging Stall Market by Region, 2023-2033 (US$ Bn, AGR (%))
Figure 53 Charging Stall Segment Market Share Forecast by Region, 2023 & 2033 (%)
Figure 54 AC-to-DC Inverter Market by Region, 2023-2033 (US$ Bn, AGR (%))
Figure 55 AC-to-DC Inverter Segment Market Share Forecast by Region, 2023 & 2033 (%)
Figure 56 AC power Source Plug Market by Region, 2023-2033 (US$ Bn, AGR (%))
Figure 57 AC power Source Plug Segment Market Share Forecast by Region, 2023 & 2033 (%)
Figure 58 EV Charging Cable Market by Region, 2023-2033 (US$ Bn, AGR (%))
Figure 59 EV Charging Cable Segment Market Share Forecast by Region, 2023 & 2033 (%)
Figure 60 EV Plug Market by Region, 2023-2033 (US$ Bn, AGR (%))
Figure 61 EV Plug Segment Market Share Forecast by Region, 2023 & 2033 (%)
Figure 62 Auxiliary Electrical Equipment Market by Region, 2023-2033 (US$ Bn, AGR (%))
Figure 63 Auxiliary Electrical Equipment Segment Market Share Forecast by Region, 2023 & 2033 (%)
Figure 64 Electric Vehicle Charging Station Market Forecast by Region 2023 and 2033 (Revenue, CAGR%)
Figure 65 Electric Vehicle Charging Station Market by Region, 2023-2033 (US$ Bn, AGR (%))
Figure 66 North America Electric Vehicle Charging Station Market Attractiveness Index
Figure 67 North America Electric Vehicle Charging Station Market by Region, 2023, 2028 & 2033 (US$ Billion)
Figure 68 North America Electric Vehicle Charging Station Market by Value, 2023-2033 (US$ Bn, AGR (%))
Figure 69 North America Electric Vehicle Charging Station Market by Country, 2023-2033 (US$ Bn, AGR (%))
Figure 70 North America Electric Vehicle Charging Station Market Share Forecast by Country, 2023 & 2033 (%)
Figure 71 North America Electric Vehicle Charging Station Market by Connectivity, 2023-2033 (US$ Bn, AGR (%))
Figure 72 North America Electric Vehicle Charging Station Market Share Forecast by Connectivity, 2023 & 2033 (%)
Figure 73 North America Electric Vehicle Charging Station Market by Charging Type, 2023-2033 (US$ Bn, AGR (%))
Figure 74 North America Electric Vehicle Charging Station Market Share Forecast by Charging Type, 2023 & 2033 (%)
Figure 75 North America Electric Vehicle Charging Station Market by Operation, 2023-2033 (US$ Bn, AGR (%))
Figure 76 North America Electric Vehicle Charging Station Market Share Forecast by Operation, 2023 & 2033 (%)
Figure 77 North America Electric Vehicle Charging Station Market by End-Use, 2023-2033 (US$ Bn, AGR (%))
Figure 78 North America Electric Vehicle Charging Station Market Share Forecast by End-Use, 2023 & 2033 (%)
Figure 79 North America Electric Vehicle Charging Station Market by Component, 2023-2033 (US$ Bn, AGR (%))
Figure 80 North America Electric Vehicle Charging Station Market Share Forecast by Component, 2023 & 2033 (%)
Figure 81 US Electric Vehicle Charging Station Market by Value, 2023-2033 (US$ Bn, AGR (%))
Figure 82 Canada Electric Vehicle Charging Station Market by Value, 2023-2033 (US$ Bn, AGR (%))
Figure 83 Europe Electric Vehicle Charging Station Market Attractiveness Index
Figure 84 Europe Electric Vehicle Charging Station Market by Region, 2023, 2028 & 2033 (US$ Billion)
Figure 85 Europe Electric Vehicle Charging Station Market by Value, 2023-2033 (US$ Bn, AGR (%))
Figure 86 Europe Electric Vehicle Charging Station Market by Country, 2023-2033 (US$ Bn, AGR (%))
Figure 87 Europe Electric Vehicle Charging Station Market Share Forecast by Country, 2023 & 2033 (%)
Figure 88 Europe Electric Vehicle Charging Station Market by Connectivity, 2023-2033 (US$ Bn, AGR (%))
Figure 89 Europe Electric Vehicle Charging Station Market Share Forecast by Connectivity, 2023 & 2033 (%)
Figure 90 Europe Electric Vehicle Charging Station Market by Charging Type, 2023-2033 (US$ Bn, AGR (%))
Figure 91 Europe Electric Vehicle Charging Station Market Share Forecast by Charging Type, 2023 & 2033 (%)
Figure 92 Europe Electric Vehicle Charging Station Market by Operation, 2023-2033 (US$ Bn, AGR (%))
Figure 93 Europe Electric Vehicle Charging Station Market Share Forecast by Operations, 2023 & 2033 (%)
Figure 94 Europe Electric Vehicle Charging Station Market by End-Use, 2023-2033 (US$ Bn, AGR (%))
Figure 95 Europe Electric Vehicle Charging Station Market Share Forecast by End Use, 2023 & 2033 (%)
Figure 96 Europe Electric Vehicle Charging Station Market by Component, 2023-2033 (US$ Bn, AGR (%))
Figure 97 Europe Electric Vehicle Charging Station Market Share Forecast by Components, 2023 & 2033 (%)
Figure 98 Germany Electric Vehicle Charging Station Market by Value, 2023-2033 (US$ Bn, AGR (%))
Figure 99 UK Electric Vehicle Charging Station Market by Value, 2023-2033 (US$ Bn, AGR (%))
Figure 100 France Electric Vehicle Charging Station Market by Value, 2023-2033 (US$ Bn, AGR (%))
Figure 101 Norway Electric Vehicle Charging Station Market by Value, 2023-2033 (US$ Bn, AGR (%))
Figure 102 Netherlands Electric Vehicle Charging Station Market by Value, 2023-2033 (US$ Bn, AGR (%))
Figure 103 Rest of Europe Electric Vehicle Charging Station Market by Value, 2023-2033 (US$ Bn, AGR (%))
Figure 104 Asia Pacific Electric Vehicle Charging Station Market Attractiveness Index
Figure 105 Asia Pacific Electric Vehicle Charging Station Market by Region, 2023, 2028 & 2033 (US$ Billion)
Figure 106 Asia-Pacific Electric Vehicle Charging Station Market by Value, 2023-2033 (US$ Bn, AGR (%))
Figure 107 Asia-Pacific Electric Vehicle Charging Station Market by Country, 2023-2033 (US$ Bn, AGR (%))
Figure 108 Asia Pacific Electric Vehicle Charging Station Market Share Forecast by Country, 2023 & 2033 (%)
Figure 109 Asia-Pacific Electric Vehicle Charging Station Market by Connectivity, 2023-2033 (US$ Bn, AGR (%))
Figure 110 Asia Pacific Electric Vehicle Charging Station Market Share Forecast by Connectivity, 2023 & 2033 (%)
Figure 111 Asia-Pacific Electric Vehicle Charging Station Market by Charging Type, 2023-2033 (US$ Bn, AGR (%))
Figure 112 Asia Pacific Electric Vehicle Charging Station Market Share Forecast by Charging Type, 2023 & 2033 (%)
Figure 113 Asia-Pacific Electric Vehicle Charging Station Market by Operation, 2023-2033 (US$ Bn, AGR (%))
Figure 114 Asia Pacific Electric Vehicle Charging Station Market Share Forecast by Operations, 2023 & 2033 (%)
Figure 115 Asia-Pacific Electric Vehicle Charging Station Market by End-Use, 2023-2033 (US$ Bn, AGR (%))
Figure 116 Asia Pacific Electric Vehicle Charging Station Market Share Forecast by End Use, 2023 & 2033 (%)
Figure 117 Asia-Pacific Electric Vehicle Charging Station Market by Component, 2023-2033 (US$ Bn, AGR (%))
Figure 118 Asia Pacific Electric Vehicle Charging Station Market Share Forecast by Components, 2023 & 2033 (%)
Figure 119 China Electric Vehicle Charging Station Market by Value, 2023-2033 (US$ Bn, AGR (%))
Figure 120 India Electric Vehicle Charging Station Market by Value, 2023-2033 (US$ Bn, AGR (%))
Figure 121 Japan Electric Vehicle Charging Station Market by Value, 2023-2033 (US$ Bn, AGR (%))
Figure 122 South Korea Electric Vehicle Charging Station Market by Value, 2023-2033 (US$ Bn, AGR (%))
Figure 123 Australia Electric Vehicle Charging Station Market by Value, 2023-2033 (US$ Bn, AGR (%))
Figure 124 Rest of Asia-Pacific Electric Vehicle Charging Station Market by Value, 2023-2033 (US$ Bn, AGR (%))
Figure 125 Middle East & Africa Electric Vehicle Charging Station Market Attractiveness Index
Figure 126 Middle East & Africa Electric Vehicle Charging Station Market by Region, 2023, 2028 & 2033 (US$ Billion)
Figure 127 Middle East & Africa Electric Vehicle Charging Station Market by Value, 2023-2033 (US$ Bn, AGR (%))
Figure 128 Middle East & Africa Electric Vehicle Charging Station Market by Country, 2023-2033 (US$ Bn, AGR (%))
Figure 129 Middle East & Africa Electric Vehicle Charging Station Market Share Forecast by Country, 2023 & 2033 (%)
Figure 130 Middle East & Africa Electric Vehicle Charging Station Market by Connectivity, 2023-2033 (US$ Bn, AGR (%))
Figure 131 Middle East & Africa Electric Vehicle Charging Station Market Share Forecast by Connectivity, 2023 & 2033 (%)
Figure 132 Middle East & Africa Electric Vehicle Charging Station Market by Charging Type, 2023-2033 (US$ Bn, AGR (%))
Figure 133 Middle East & Africa Electric Vehicle Charging Station Market Share Forecast by Charging Type, 2023 & 2033 (%)
Figure 134 Middle East & Africa Electric Vehicle Charging Station Market by Operation, 2023-2033 (US$ Bn, AGR (%))
Figure 135 Middle East & Africa Electric Vehicle Charging Station Market Share Forecast by Operations, 2023 & 2033 (%)
Figure 136 Middle East & Africa Electric Vehicle Charging Station Market by End-Use, 2023-2033 (US$ Bn, AGR (%))
Figure 137 Middle East & Africa Electric Vehicle Charging Station Market Share Forecast by End Use, 2023 & 2033 (%)
Figure 138 Middle East & Africa Electric Vehicle Charging Station Market by Component, 2023-2033 (US$ Bn, AGR (%))
Figure 139 Middle East & Africa Electric Vehicle Charging Station Market Share Forecast by Components, 2023 & 2033 (%)
Figure 140 GCC Electric Vehicle Charging Station Market by Value, 2023-2033 (US$ Bn, AGR (%))
Figure 141 South Africa Electric Vehicle Charging Station Market by Value, 2023-2033 (US$ Bn, AGR (%))
Figure 142 Rest of Middle East & Africa Electric Vehicle Charging Station Market by Value, 2023-2033 (US$ Bn, AGR (%))
Figure 143 Latin America Electric Vehicle Charging Station Market Attractiveness Index
Figure 144 Latin America Electric Vehicle Charging Station Market by Region, 2023, 2028 & 2033 (US$ Billion)
Figure 145 Latin America Electric Vehicle Charging Station Market by Value, 2023-2033 (US$ Bn, AGR (%))
Figure 146 Latin America Electric Vehicle Charging Station Market by Country, 2023-2033 (US$ Bn, AGR (%))
Figure 147 Latin America Electric Vehicle Charging Station Market Share Forecast by Country, 2023 & 2033 (%)
Figure 148 Latin America Electric Vehicle Charging Station Market by Connectivity, 2023-2033 (US$ Bn, AGR (%))
Figure 149 Latin America Electric Vehicle Charging Station Market Share Forecast by Connectivity, 2023 & 2033 (%)
Figure 150 Latin America Electric Vehicle Charging Station Market by Charging Type, 2023-2033 (US$ Bn, AGR (%))
Figure 151 Latin America Electric Vehicle Charging Station Market Share Forecast by Charging Type, 2023 & 2033 (%)
Figure 152 Latin America Electric Vehicle Charging Station Market by Operation, 2023-2033 (US$ Bn, AGR (%))
Figure 153 Latin America Electric Vehicle Charging Station Market Share Forecast by Operations, 2023 & 2033 (%)
Figure 154 Latin America Electric Vehicle Charging Station Market by End-Use, 2023-2033 (US$ Bn, AGR (%))
Figure 155 Latin America Electric Vehicle Charging Station Market Share Forecast by End Use, 2023 & 2033 (%)
Figure 156 Latin America Electric Vehicle Charging Station Market by Component, 2023-2033 (US$ Bn, AGR (%))
Figure 157 Latin America Electric Vehicle Charging Station Market Share Forecast by Components, 2023 & 2033 (%)
Figure 158 Brazil Electric Vehicle Charging Station Market by Value, 2023-2033 (US$ Bn, AGR (%))
Figure 159 Mexico Electric Vehicle Charging Station Market by Value, 2023-2033 (US$ Bn, AGR (%))
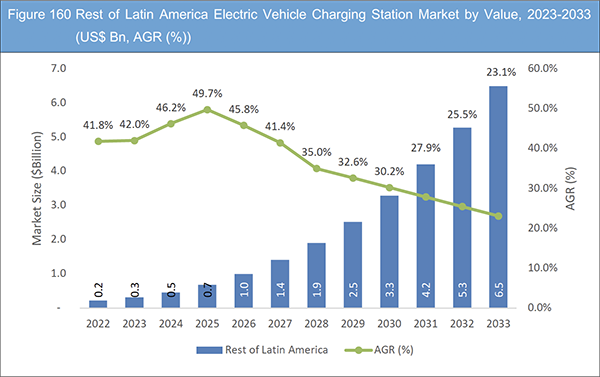
Figure 160 Rest of Latin America Electric Vehicle Charging Station Market by Value, 2023-2033 (US$ Bn, AGR (%))
Figure 161 Electric Vehicle Charging Station Market: Company Share, 2022
Figure 162 Tesla, Inc: Net Revenue, 2018-2022 (US$ Million, AGR%)
Figure 163 Tesla, Inc: R&D, 2018-2022 (US$ Million, AGR%)
Figure 164 Tesla, Inc: Regional Revenue Share, 2022 (%)
Figure 165 Tesla, Inc: Business Segment Revenue Share, 2022 (%)
Figure 166 ABB Ltd: Net Revenue, 2018-2022 (US$ Million, AGR%)
Figure 167 ABB Ltd: R&D, 2018-2022 (US$ Million, AGR%)
Figure 168 ABB Ltd: Business Segment Revenue Share, 2022 (%)
Figure 169 Schneider Electric SE: Net Revenue, 2018-2022 (US$ Million, AGR%)
Figure 170 Schneider Electric SE: R&D, 2018-2022 (US$ Million, AGR%)
Figure 171 Schneider Electric SE: Regional Revenue Share, 2022 (%)
Figure 172 Schneider Electric SE: Business Segment Revenue Share, 2022 (%)
Figure 173 Siemens AG: Net Revenue, 2018-2022 (US$ Million, AGR%)
Figure 174 Siemens AG: R&D, 2018-2022 (US$ Million, AGR%)
Figure 175 Siemens AG: Regional Revenue Share, 2022 (%)
Figure 176 Siemens AG: Business Segment Revenue Share, 2022 (%)
Figure 177 Blink Charging Co: Net Revenue, 2018-2022 (US$ Million, AGR%)
Figure 178 Blink Charging Co: Regional Revenue Share, 2022 (%)
Figure 179 Enel X: Net Revenue, 2018-2022 (US$ Million, AGR%)
Figure 180 Enel X: R&D, 2018-2022 (US$ Million, AGR%)
Figure 181 Enel X: Regional Revenue Share, 2022 (%)
Figure 182 Enel X: Business Segment Revenue Share, 2022 (%)
ページTOPに戻る
Summary
Report Details
The Electric Vehicle Charging Station Market Report 2023-2033: This report will prove invaluable to leading firms striving for new revenue pockets if they wish to better understand the industry and its underlying dynamics. It will be useful for companies that would like to expand into different industries or to expand their existing operations in a new region.
Government Support Plays a Pivotal Role in Promoting the Adoption of Electric Vehicles
Government support plays a pivotal role in promoting the adoption of electric vehicles and driving the growth of charging station infrastructure. Many governments around the world offer incentives to encourage consumers to switch to electric vehicles. These incentives may include tax credits, rebates, subsidies, or grants for purchasing EVs or installing charging stations. Additionally, some governments impose regulations that mandate a certain percentage of parking spaces in public places and commercial buildings to have EV charging infrastructure. These incentives and policies create a favourable environment for investment in charging station projects and spur private and public sector interest in expanding the charging network.
Automaker Commitment to Electric Mobility
Major automotive manufacturers are increasingly committing to electric mobility by announcing ambitious plans to electrify their vehicle offerings. Several automakers have set targets to transition their entire vehicle line-up to electric or hybrid models over the next decade. As these automakers phase out internal combustion engine vehicles, the demand for electric vehicles rises, necessitating a corresponding expansion of charging station infrastructure to accommodate the surge in EV adoption.
What Questions Should You Ask before Buying a Market Research Report?
• How is the electric vehicle charging station market evolving?
• What is driving and restraining the electric vehicle charging station market?
• How will each electric vehicle charging station submarket segment grow over the forecast period and how much revenue will these submarkets account for in 2033?
• How will the market shares for each electric vehicle charging station submarket develop from 2023 to 2033?
• What will be the main driver for the overall market from 2023 to 2033?
• Will leading electric vehicle charging station markets broadly follow the macroeconomic dynamics, or will individual national markets outperform others?
• How will the market shares of the national markets change by 2033 and which geographical region will lead the market in 2033?
• Who are the leading players and what are their prospects over the forecast period?
• What are the electric vehicle charging station projects for these leading companies?
• How will the industry evolve during the period between 2023 and 2033? What are the implications of electric vehicle charging station projects taking place now and over the next 10 years?
• Is there a greater need for product commercialisation to further scale the electric vehicle charging station market?
• Where is the electric vehicle charging station market heading and how can you ensure you are at the forefront of the market?
• What are the best investment options for new product and service lines?
• What are the key prospects for moving companies into a new growth path and C-suite?
You need to discover how this will impact the electric vehicle charging station market today, and over the next 10 years:
• Our 449-page report provides 131 tables and 182 charts/graphs exclusively to you.
• The report highlights key lucrative areas in the industry so you can target them – NOW.
• It contains in-depth analysis of global, regional and national sales and growth.
• It highlights for you the key successful trends, changes and revenue projections made by your competitors.
This report tells you TODAY how the electric vehicle charging station market will develop in the next 10 years, and in line with the variations in COVID-19 economic recession and bounce. This market is more critical now than at any point over the last 10 years.
Forecasts to 2033 and other analyses reveal commercial prospects
• In addition to revenue forecasting to 2033, our new study provides you with recent results, growth rates, and market shares.
• You will find original analyses, with business outlooks and developments.
• Discover qualitative analyses (including market dynamics, drivers, opportunities, restraints and challenges), cost structure, impact of rising electric vehicle charging station prices and recent developments.
This report includes data analysis and invaluable insight into how COVID-19 will affect the industry and your company. Four COVID-19 recovery patterns and their impact, namely, “V”, “L”, “W” and “U” are discussed in this report.
Segments Covered in the Report
Market Segment by Connectivity
• Non-connected Charging Stations
• Smart Connected Charging Stations
Market Segment by Charging Type
• Slow Charging Points
• Fast Charging Points
• Ultra-Fast Charging Points
Market Segment by Operation
• Mode 1
• Mode 2
• Mode 3
• Mode 4
Market Segment by End-Use
• Commercial
• Residential
• Public Charging
• Highway Charging
• Other End-Use
Market Segment by Component
• Charging Stall
• AC-to-DC Inverter
• AC power Source Plug
• EV Charging Cable
• EV Plug
• Auxiliary Electrical Equipment
In addition to the revenue predictions for the overall world market and segments, you will also find revenue forecasts for four regional and 20 leading national markets:
North America
• U.S.
• Canada
Europe
• Germany
• Norway
• United Kingdom
• France
• Netherlands
• Rest of Europe
Asia Pacific
• China
• Japan
• India
• Australia
• South Korea
• Rest of Asia Pacific
Latin America
• Brazil
• Mexico
• Rest of Latin America
Middle East & Africa
• GCC
• South Africa
• Rest of Middle East & Africa
The report also includes profiles and for some of the leading companies in the Electric Vehicle Charging Station Market, 2023 to 2033, with a focus on this segment of these companies’ operations.
Leading companies and the potential for market growth
• ABB Ltd
• Blink Charging Co.
• Delta Electronics
• EFACEC Power Solutions SGPS, S.A.
• Electrify America LLC
• Enel X
• Engie SA
• EVBox
• Greenlots
• Ionity
• NewMotion
• Schneider Electric SE
• Siemens AG
• Tesla, Inc.
• Webasto SE
Overall world revenue for Electric Vehicle Charging Station Market, 2023 to 2033 in terms of value the market will surpass US$18.8 billion in 2023, our work calculates. We predict strong revenue growth through to 2033. Our work identifies which organizations hold the greatest potential. Discover their capabilities, progress, and commercial prospects, helping you stay ahead.
How will the Electric Vehicle Charging Station Market, 2023 to 2033 report help you?
In summary, our 440+ page report provides you with the following knowledge:
• Revenue forecasts to 2033 for Electric Vehicle Charging Station Market, 2023 to 2033 Market, with forecasts for connectivity, charging type, operation, end-use, component and company size, each forecast at a global and regional level – discover the industry’s prospects, finding the most lucrative places for investments and revenues.
• Revenue forecasts to 2033 for four regional and 20 key national markets – See forecasts for the Electric Vehicle Charging Station Market, 2023 to 2033 market in North America, Europe, Asia-Pacific, Latin America and Middle East & Africa. Also forecasted is the market in the US, Canada, Brazil, Germany, France, UK, Italy, China, India, Japan, and Australia among other prominent economies.
• Prospects for established firms and those seeking to enter the market – including company profiles for 15 of the major companies involved in the Electric Vehicle Charging Station Market, 2023 to 2033.
Find quantitative and qualitative analyses with independent predictions. Receive information that only our report contains, staying informed with invaluable business intelligence.
Information found nowhere else
With our new report, you are less likely to fall behind in knowledge or miss out on opportunities. See how our work could benefit your research, analyses, and decisions. Visiongain’s study is for everybody needing commercial analyses for the Electric Vehicle Charging Station Market, 2023 to 2033, market-leading companies. You will find data, trends and predictions.
ページTOPに戻る
Table of Contents
Table of Contents
1 Report Overview
1.1 Objectives of the Study
1.2 Introduction to Electric Vehicle Charging Station Market
1.3 What This Report Delivers
1.4 Why You Should Read This Report
1.5 Key Questions Answered by This Analytical Report
1.6 Who Is This Report for?
1.7 Research Methodology
1.7.1 Market Definitions
1.7.2 Market Evaluation & Forecasting Methodology
1.7.3 Data Validation
1.7.3.1 Primary Research
1.7.3.2 Secondary Research
1.8 Frequently Asked Questions (FAQs)
1.9 Associated Visiongain Reports
1.10 About Visiongain
2 Executive Summary
3 Market Overview
3.1 Key Findings
3.2 Market Dynamics
3.2.1 Market Driving Factors
3.2.1.1 Governments Worldwide are Implementing Stringent Regulations and Offering Incentives to Promote Clean Transportation and Reduce Carbon Emissions
3.2.1.2 Faster Charging Speeds, Improved Efficiency, and Enhanced User Experience are Being Achieved Through Innovations in Charging Station Hardware, Software, and Connectivity Solutions
3.2.1.3 Growing Concerns About Climate Change and the Environmental Impact of Traditional Fossil Fuel-Powered Vehicles have Led to Increased Emphasis on Sustainable Transportation
3.2.2 Market Restraining Factors
3.2.2.1 One of the Significant Restraints for the Industry Is the Existing Infrastructure Gap and Limitations of the Electrical Grid
3.2.2.2 The Establishment of a Comprehensive Charging Infrastructure Network Requires a Significant Initial Capital Investment
3.2.2.3 Range Anxiety, the Fear of Running Out of Battery Charge While Driving, Is a Concern for Electric Vehicle Owners
3.2.2.4 The Lack of Standardized Charging Protocols and Interoperability Among Different Charging Networks Can Pose Challenges for EV Owners
3.2.3 Market Opportunities
3.2.3.1 Investing in EV Charging Stations and Infrastructure Expansion Opportunity in EV Industry
3.2.3.2 Electric Vehicles Can Serve as a Valuable Resource for Grid Stability and Renewable Energy Utilization
3.2.3.3 By Implementing Intelligent Charging Solutions, The Industry Can Unlock Opportunities for Load Management, Grid Optimization, and Cost Savings for Both Consumers and Charging Station Operators
3.2.3.4 Commercial Fleets Tend to have Predictable Schedules and Centralized Depots, Making them Ideal Candidates for Electrification
3.3 COVID-19 Impact Analysis
3.3.1 V-Shaped Recovery Scenario
3.3.2 W-Shaped Recovery Scenario
3.3.3 U-Shaped Recovery Scenario
3.3.4 L-Shaped Recovery Scenario
3.4 Porter’s Five Forces Analysis
3.4.1 Threat of New Entrants (Medium)
3.4.2 Bargaining Power of Suppliers (Medium)
3.4.3 Bargaining Power of Buyers (Medium to High)
3.4.4 Threat of Substitutes (Low)
3.4.5 Intensity of Competitive Rivalry (High)
3.5 PESTLE Analysis
3.5.1 Political Factors
3.5.2 Economic Factors
3.5.3 Social Factors
3.5.4 Technological Factors
3.5.5 Legal Factors
3.5.6 Environmental Factors
3.6 SWOT Analysis
3.6.1 Strengths
3.6.2 Weaknesses
3.6.3 Opportunities
3.6.4 Threats
4 Electric Vehicle Charging Station Market Analysis by Connectivity
4.1 Key Findings
4.2 Connectivity Segment: Market Attractiveness Index
4.2.1 Electric Vehicle Charging Station Market by Connectivity
4.3 Non-connected Charging Stations
4.3.1 Market by Region, 2023-2033 (US$ Bn)
4.3.2 Market Share by Region, 2023 & 2033 (%)
4.4 Smart Connected Charging Stations
4.4.1 Market by Region, 2023-2033 (US$ Bn)
4.4.2 Market Share by Region, 2023 & 2033 (%)
5 Electric Vehicle Charging Station Market Analysis by Charging Type
5.1 Key Findings
5.2 Charging Type Segment: Market Attractiveness Index
5.2.1 Electric Vehicle Charging Station Market by Charging Type
5.3 Slow Charging Points
5.3.1 Market by Region, 2023-2033 (US$ Bn)
5.3.2 Market Share by Region, 2023 & 2033 (%)
5.4 Fast Charging Points
5.4.1 Market by Region, 2023-2033 (US$ Bn)
5.4.2 Market Share by Region, 2023 & 2033 (%)
5.5 Ultra-Fast Charging Points
5.5.1 Market by Region, 2023-2033 (US$ Bn)
5.5.2 Market Share by Region, 2023 & 2033 (%)
6 Electric Vehicle Charging Station Market Analysis by Operation
6.1 Key Findings
6.2 Operation Segment: Market Attractiveness Index
6.2.1 Electric Vehicle Charging Station Market by Operation
6.3 Mode 1
6.3.1 Market by Region, 2023-2033 (US$ Bn)
6.3.2 Market Share by Region, 2023 & 2033 (%)
6.4 Mode 2
6.4.1 Market by Region, 2023-2033 (US$ Bn)
6.4.2 Market Share by Region, 2023 & 2033 (%)
6.5 Mode 3
6.5.1 Market by Region, 2023-2033 (US$ Bn)
6.5.2 Market Share by Region, 2023 & 2033 (%)
6.6 Mode 4
6.6.1 Market by Region, 2023-2033 (US$B)
6.6.2 Market Share by Region, 2023 & 2033 (%)
7 Electric Vehicle Charging Station Market Analysis by End-Use
7.1 Key Findings
7.2 End-Use Segment: Market Attractiveness Index
7.2.1 Electric Vehicle Charging Station Market by End-Use
7.3 Commercial
7.3.1 Market by Region, 2023-2033 (US$ Bn)
7.3.2 Market Share by Region, 2023 & 2033 (%)
7.4 Residential
7.4.1 Market by Region, 2023-2033 (US$ Bn)
7.4.2 Market Share by Region, 2023 & 2033 (%)
7.5 Public Charging
7.5.1 Market by Region, 2023-2033 (US$ Bn)
7.5.2 Market Share by Region, 2023 & 2033 (%)
7.6 Highway Charging
7.6.1 Market by Region, 2023-2033 (US$ Bn)
7.6.2 Market Share by Region, 2023 & 2033 (%)
7.7 Other End-Use
7.7.1 Market by Region, 2023-2033 (US$ Bn)
7.7.2 Market Share by Region, 2023 & 2033 (%)
8 Electric Vehicle Charging Station Market Analysis by Component
8.1 Key Findings
8.2 Component Segment: Market Attractiveness Index
8.2.1 Electric Vehicle Charging Station Market by Component
8.3 Charging Stall
8.3.1 Market by Region, 2023-2033 (US$ Bn)
8.3.2 Market Share by Region, 2023 & 2033 (%)
8.4 AC-to-DC Inverter
8.4.1 Market by Region, 2023-2033 (US$ Bn)
8.4.2 Market Share by Region, 2023 & 2033 (%)
8.5 AC power Source Plug
8.5.1 Market by Region, 2023-2033 (US$ Bn)
8.5.2 Market Share by Region, 2023 & 2033 (%)
8.6 EV Charging Cable
8.6.1 Market by Region, 2023-2033 (US$ Bn)
8.6.2 Market Share by Region, 2023 & 2033 (%)
8.7 EV Plug
8.7.1 Market by Region, 2023-2033 (US$ Bn)
8.7.2 Market Share by Region, 2023 & 2033 (%)
8.8 Auxiliary Electrical Equipment
8.8.1 Market by Region, 2023-2033 (US$ Bn)
8.8.2 Market Share by Region, 2023 & 2033 (%)
9 Electric Vehicle Charging Station Market Analysis by Region
9.1 Key Findings
9.1.1 Electric Vehicle Charging Station Market by Region
10 North America Electric Vehicle Charging Station Market Analysis
10.1 Key Findings
10.2 North America Electric Vehicle Charging Station Market Attractiveness Index
10.3 North America Electric Vehicle Charging Station Market by Country, 2023, 2028 & 2033 (US$ Billion)
10.4 North America Electric Vehicle Charging Station Market by Value
10.5 North America Electric Vehicle Charging Station Market by Country
10.6 North America Electric Vehicle Charging Station Market by Connectivity
10.7 North America Electric Vehicle Charging Station Market by Charging Type
10.8 North America Electric Vehicle Charging Station Market by Operation
10.9 North America Electric Vehicle Charging Station Market by End-Use
10.10 North America Electric Vehicle Charging Station Market by Component
10.11 U.S. Electric Vehicle Charging Station Market Analysis
10.12 Canada Electric Vehicle Charging Station Market Analysis
11 Europe Electric Vehicle Charging Station Market Analysis
11.1 Key Findings
11.2 Europe Electric Vehicle Charging Station Market Attractiveness Index
11.3 Europe Electric Vehicle Charging Station Market by Country, 2023, 2028 & 2033 (US$ Billion)
11.4 Europe Electric Vehicle Charging Station Market by Value
11.5 Europe Electric Vehicle Charging Station Market by Country
11.6 Europe Electric Vehicle Charging Station Market by Connectivity
11.7 Europe Electric Vehicle Charging Station Market by Charging Type
11.8 Europe Electric Vehicle Charging Station Market by Operation
11.9 Europe Electric Vehicle Charging Station Market by End-Use
11.10 Europe Electric Vehicle Charging Station Market by Component
11.11 Germany Electric Vehicle Charging Station Market Analysis
11.12 UK Electric Vehicle Charging Station Market Analysis
11.13 France Electric Vehicle Charging Station Market Analysis
11.14 Norway Electric Vehicle Charging Station Market Analysis
11.15 Netherlands Electric Vehicle Charging Station Market Analysis
11.16 Rest of Europe Electric Vehicle Charging Station Market Analysis
12 Asia Pacific Electric Vehicle Charging Station Market Analysis
12.1 Key Findings
12.2 Asia Pacific Electric Vehicle Charging Station Market Attractiveness Index
12.3 Asia Pacific Electric Vehicle Charging Station Market by Country, 2023, 2028 & 2033 (US$ Billion)
12.4 Asia-Pacific Electric Vehicle Charging Station Market by Value
12.5 Asia-Pacific Electric Vehicle Charging Station Market by Country
12.6 Asia-Pacific Electric Vehicle Charging Station Market by Connectivity
12.7 Asia-Pacific Electric Vehicle Charging Station Market by Charging Type
12.8 Asia-Pacific Electric Vehicle Charging Station Market by Operation
12.9 Asia-Pacific Electric Vehicle Charging Station Market by End-Use
12.10 Asia-Pacific Electric Vehicle Charging Station Market by Component
12.11 China Electric Vehicle Charging Station Market Analysis
12.12 India Electric Vehicle Charging Station Market Analysis
12.13 Japan Electric Vehicle Charging Station Market Analysis
12.14 South Korea Electric Vehicle Charging Station Market Analysis
12.15 Australia Electric Vehicle Charging Station Market Analysis
12.16 Rest of Asia Pacific Electric Vehicle Charging Station Market Analysis
13 Middle East & Africa Electric Vehicle Charging Station Market Analysis
13.1 Key Findings
13.2 Middle East & Africa Electric Vehicle Charging Station Market Attractiveness Index
13.3 Middle East & Africa Electric Vehicle Charging Station Market by Country, 2023, 2028 & 2033 (US$ Billion)
13.4 Middle East & Africa Electric Vehicle Charging Station Market by Value
13.5 Middle East & Africa Electric Vehicle Charging Station Market by Country
13.6 Middle East & Africa Electric Vehicle Charging Station Market by Connectivity
13.7 Middle East & Africa Electric Vehicle Charging Station Market by Charging Type
13.8 Middle East & Africa Electric Vehicle Charging Station Market by Operation
13.9 Middle East & Africa Electric Vehicle Charging Station Market by End-Use
13.10 Middle East & Africa Electric Vehicle Charging Station Market by Component
13.11 GCC (Gulf Cooperation Council) Electric Vehicle Charging Station Market Analysis
13.12 South Africa Electric Vehicle Charging Station Market Analysis
13.13 Rest of Middle East and Africa (MEA) Electric Vehicle Charging Station Market Analysis
14 Latin America Electric Vehicle Charging Station Market Analysis
14.1 Key Findings
14.2 Latin America Electric Vehicle Charging Station Market Attractiveness Index
14.3 Latin America Electric Vehicle Charging Station Market by Country, 2023, 2028 & 2033 (US$ Billion)
14.4 Latin America Electric Vehicle Charging Station Market by Value
14.5 Latin America Electric Vehicle Charging Station Market by Country
14.6 Latin America Electric Vehicle Charging Station Market by Connectivity
14.7 Latin America Electric Vehicle Charging Station Market by Charging Type
14.8 Latin America Electric Vehicle Charging Station Market by Operation
14.9 Latin America Electric Vehicle Charging Station Market by End-Use
14.10 Latin America Electric Vehicle Charging Station Market by Component
14.11 Brazil Electric Vehicle Charging Station Market Analysis
14.12 Mexico Electric Vehicle Charging Station Market Analysis
14.13 Rest of Latin America Electric Vehicle Charging Station Market Analysis
15 Company Profiles
15.1 Competitive Landscape, 2022
15.2 Strategic Outlook
15.2.1 Acquisitions as Key Business Strategy
15.2.2 Agreements as Key Business Strategy
15.2.3 Collaborations as Key Business Strategy
15.2.4 Contracts as Key Business Strategy
15.2.5 Expansions as Key Business Strategy
15.2.6 Investments as Key Business Strategy
15.2.7 Joint Venture as Key Business Strategy
15.2.8 New Product Launches as Key Business Strategy
15.2.9 Partnerships as Key Business Strategy
15.3 Tesla, Inc
15.3.1 Company Snapshot
15.3.2 Company Overview
15.3.3 Financial Analysis
15.3.3.1 Net Revenue, 2018-2022
15.3.3.2 R&D, 2018-2022
15.3.3.3 Regional Revenue Share, 2022 (%)
15.3.3.4 Business Segment Revenue Share, 2022 (%)
15.3.4 Product Benchmarking
15.3.5 Strategic Outlook
15.4 ABB Ltd
15.4.1 Company Snapshot
15.4.2 Company Overview
15.4.3 Financial Analysis
15.4.3.1 Net Revenue, 2018-2022
15.4.3.2 R&D, 2018-2022
15.4.3.3 Business Segment Revenue Share, 2022 (%)
15.4.4 Product Benchmarking
15.4.5 Strategic Outlook
15.5 EVBox
15.5.1 Company Snapshot
15.5.2 Company Overview
15.5.3 Product Benchmarking
15.5.4 Strategic Outlook
15.6 Schneider Electric SE
15.6.1 Company Snapshot
15.6.2 Company Overview.
15.6.3 Financial Analysis
15.6.3.1 Net Revenue, 2018-2022
15.6.3.2 R&D, 2018-2022
15.6.3.3 Regional Revenue Share, 2022 (%)
15.6.3.4 Business Segment Revenue Share, 2022 (%)
15.6.4 Product Benchmarking
15.6.5 Strategic Outlook
15.7 Siemens AG
15.7.1 Company Snapshot
15.7.2 Company Overview
15.7.3 Financial Analysis
15.7.3.1 Net Revenue, 2018-2022
15.7.3.2 R&D, 2018-2022
15.7.3.3 Regional Revenue Share, 2022 (%)
15.7.3.4 Business Segment Revenue Share, 2022 (%)
15.7.4 Product Benchmarking
15.7.5 Strategic Outlook
15.8 Engie SA
15.8.1 Company Snapshot
15.8.2 Company Overview
15.8.3 Product Benchmarking
15.8.4 Strategic Outlook
15.9 Delta Electronics
15.9.1 Company Snapshot
15.9.2 Company Overview
15.9.3 Product Benchmarking
15.9.4 Strategic Outlook
15.10 EFACEC Power Solutions SGPS, S.A.
15.10.1 Company Snapshot
15.10.2 Company Overview
15.10.3 Product Benchmarking
15.10.4 Strategic Outlook
15.11 Blink Charging Co
15.11.1 Company Snapshot
15.11.2 Company Overview
15.11.3 Financial Analysis
15.11.3.1 Net Revenue, 2018-2022
15.11.3.2 Regional Revenue Share, 2022 (%)
15.11.4 Product Benchmarking
15.11.5 Strategic Outlook
15.12 Webasto SE
15.12.1 Company Snapshot
15.12.2 Company Overview
15.12.3 Product Benchmarking
15.12.4 Strategic Outlook
15.13 NewMotion
15.13.1 Company Snapshot
15.13.2 Company Overview
15.13.3 Product Benchmarking
15.13.4 Strategic Outlook
15.14 Ionity
15.14.1 Company Snapshot
15.14.2 Company Overview
15.14.3 Product Benchmarking
15.14.4 Strategic Outlook
15.15 Electrify America LLC
15.15.1 Company Snapshot
15.15.2 Company Overview
15.15.3 Product Benchmarking
15.15.4 Strategic Outlook
15.16 Greenlots
15.16.1 Company Snapshot
15.16.2 Company Overview
15.16.3 Product Benchmarking
15.16.4 Strategic Outlook
15.17 Enel X
15.17.1 Company Snapshot
15.17.2 Company Overview
15.17.3 Financial Analysis
15.17.3.1 Net Revenue, 2018-2022
15.17.3.2 R&D, 2018-2022
15.17.3.3 Regional Revenue Share, 2022 (%)
15.17.3.4 Business Segment Revenue Share, 2022 (%)
15.17.4 Product Benchmarking
15.17.5 Strategic Outlook
16 Conclusion and Recommendations
16.1 Concluding Remarks from Visiongain
16.2 Recommendations for Market Players
ページTOPに戻る
List of Tables/Graphs
List of Tables
Table 1 Electric Vehicle Charging Station Market Snapshot, 2023 & 2033 (US$ Billion, CAGR %)
Table 2 Electric Vehicle Charging Station Market by Region, 2023-2033 (US$ Bn, AGR (%), CAGR (%)) (V-Shaped Recovery Scenario)
Table 3 Electric Vehicle Charging Station Market by Region, 2023-2033 (US$ Bn, AGR (%), CAGR (%)) (W-Shaped Recovery Scenario)
Table 4 Electric Vehicle Charging Station Market by Region, 2023-2033 (US$ Bn, AGR (%), CAGR (%)) (U-Shaped Recovery Scenario)
Table 5 Electric Vehicle Charging Station Market by Region, 2023-2033 (US$ Bn, AGR (%), CAGR (%)) (L-Shaped Recovery Scenario)
Table 6 Electric Vehicle Charging Station Market by Connectivity, 2023-2033 (US$ Bn, AGR (%), CAGR (%))
Table 7 Non-connected Charging Stations Market by Region, 2023-2033 (US$ Bn, AGR (%), CAGR (%))
Table 8 Smart Connected Charging Stations Market by Region, 2023-2033 (US$ Bn, AGR (%), CAGR (%))
Table 9 Electric Vehicle Charging Station Market by Charging Type, 2023-2033 (US$ Bn, AGR (%), CAGR (%))
Table 10 Slow Charging Points Market by Region, 2023-2033 (US$ Bn, AGR (%), CAGR (%))
Table 11 Fast Charging Points Market by Region, 2023-2033 (US$ Bn, AGR (%), CAGR (%))
Table 12 Ultra-Fast Charging Points Market by Region, 2023-2033 (US$ Bn, AGR (%), CAGR (%))
Table 13 Electric Vehicle Charging Station Market by Operation, 2023-2033 (US$ Bn, AGR (%), CAGR (%))
Table 14 Mode 1 Market by Region, 2023-2033 (US$ Bn, AGR (%), CAGR (%))
Table 15 Mode 2 Market by Region, 2023-2033 (US$ Bn, AGR (%), CAGR (%))
Table 16 Mode 3 Market by Region, 2023-2033 (US$ Bn, AGR (%), CAGR (%))
Table 17 Mode 4 Market by Region, 2023-2033 (US$ Bn, AGR (%), CAGR (%))
Table 18 Electric Vehicle Charging Station Market by End-Use, 2023-2033 (US$ Bn, AGR (%), CAGR (%))
Table 19 Commercial Market by Region, 2023-2033 (US$ Bn, AGR (%), CAGR (%))
Table 20 Residential Market by Region, 2023-2033 (US$ Bn, AGR (%), CAGR (%))
Table 21 Public Charging Market by Region, 2023-2033 (US$ Bn, AGR (%), CAGR (%))
Table 22 Highway Charging Market by Region, 2023-2033 (US$ Bn, AGR (%), CAGR (%))
Table 23 Other End-Use Market by Region, 2023-2033 (US$ Bn, AGR (%), CAGR (%))
Table 24 Electric Vehicle Charging Station Market by Component, 2023-2033 (US$ Bn, AGR (%), CAGR (%))
Table 25 Charging Stall Market by Region, 2023-2033 (US$ Bn, AGR (%), CAGR (%))
Table 26 AC-to-DC Inverter Market by Region, 2023-2033 (US$ Bn, AGR (%), CAGR (%))
Table 27 AC power Source Plug Market by Region, 2023-2033 (US$ Bn, AGR (%), CAGR (%))
Table 28 EV Charging Cable Market by Region, 2023-2033 (US$ Bn, AGR (%), CAGR (%))
Table 29 EV Plug Market by Region, 2023-2033 (US$ Bn, AGR (%), CAGR (%))
Table 30 Auxiliary Electrical Equipment Market by Region, 2023-2033 (US$ Bn, AGR (%), CAGR (%))
Table 31 Electric Vehicle Charging Station Market by Region, 2023-2033 (US$ Bn, AGR (%), CAGR (%))
Table 32 North America Electric Vehicle Charging Station Market by Value, 2023-2033 (US$ Bn, AGR (%), CAGR (%))
Table 33 North America Electric Vehicle Charging Station Market by Country, 2023-2033 (US$ Bn, AGR (%), CAGR (%))
Table 34 North America Electric Vehicle Charging Station Market by Connectivity, 2023-2033 (US$ Bn, AGR (%), CAGR (%))
Table 35 North America Electric Vehicle Charging Station Market by Charging Type, 2023-2033 (US$ Bn, AGR (%), CAGR (%))
Table 36 North America Electric Vehicle Charging Station Market by Operation, 2023-2033 (US$ Bn, AGR (%), CAGR (%))
Table 37 North America Electric Vehicle Charging Station Market by End-Use, 2023-2033 (US$ Bn, AGR (%), CAGR (%))
Table 38 North America Electric Vehicle Charging Station Market by Component, 2023-2033 (US$ Bn, AGR (%), CAGR (%))
Table 39 US Electric Vehicle Charging Station Market by Value, 2023-2033 (US$ Bn, AGR (%), CAGR (%))
Table 40 Canada Electric Vehicle Charging Station Market by Value, 2023-2033 (US$ Bn, AGR (%), CAGR (%))
Table 41 Europe Electric Vehicle Charging Station Market by Value, 2023-2033 (US$ Bn, AGR (%), CAGR (%))
Table 42 Europe Electric Vehicle Charging Station Market by Country, 2023-2033 (US$ Bn, AGR (%), CAGR (%))
Table 43 Europe Electric Vehicle Charging Station Market by Connectivity, 2023-2033 (US$ Bn, AGR (%), CAGR (%))
Table 44 Europe Electric Vehicle Charging Station Market by Charging Type, 2023-2033 (US$ Bn, AGR (%), CAGR (%))
Table 45 Europe Electric Vehicle Charging Station Market by Operation, 2023-2033 (US$ Bn, AGR (%), CAGR (%))
Table 46 Europe Electric Vehicle Charging Station Market by End-Use, 2023-2033 (US$ Bn, AGR (%), CAGR (%))
Table 47 Europe Electric Vehicle Charging Station Market by Component, 2023-2033 (US$ Bn, AGR (%), CAGR (%))
Table 48 Germany Electric Vehicle Charging Station Market by Value, 2023-2033 (US$ Bn, AGR (%), CAGR (%))
Table 49 UK Electric Vehicle Charging Station Market by Value, 2023-2033 (US$ Bn, AGR (%), CAGR (%))
Table 50 France Electric Vehicle Charging Station Market by Value, 2023-2033 (US$ Bn, AGR (%), CAGR (%))
Table 51 Norway Electric Vehicle Charging Station Market by Value, 2023-2033 (US$ Bn, AGR (%), CAGR (%))
Table 52 Netherlands Electric Vehicle Charging Station Market by Value, 2023-2033 (US$ Bn, AGR (%), CAGR (%))
Table 53 Rest of Europe Electric Vehicle Charging Station Market by Value, 2023-2033 (US$ Bn, AGR (%), CAGR (%))
Table 54 Asia-Pacific Electric Vehicle Charging Station Market by Value, 2023-2033 (US$ Bn, AGR (%), CAGR (%))
Table 55 Asia-Pacific Electric Vehicle Charging Station Market by Country, 2023-2033 (US$ Bn, AGR (%), CAGR (%))
Table 56 Asia-Pacific Electric Vehicle Charging Station Market by Connectivity, 2023-2033 (US$ Bn, AGR (%), CAGR (%))
Table 57 Asia-Pacific Electric Vehicle Charging Station Market by Charging Type, 2023-2033 (US$ Bn, AGR (%), CAGR (%))
Table 58 Asia-Pacific Electric Vehicle Charging Station Market by Operation, 2023-2033 (US$ Bn, AGR (%), CAGR (%))
Table 59 Asia-Pacific Electric Vehicle Charging Station Market by End-Use, 2023-2033 (US$ Bn, AGR (%), CAGR (%))
Table 60 Asia-Pacific Electric Vehicle Charging Station Market by Component, 2023-2033 (US$ Bn, AGR (%), CAGR (%))
Table 61 China Electric Vehicle Charging Station Market by Value, 2023-2033 (US$ Bn, AGR (%), CAGR (%))
Table 62 India Electric Vehicle Charging Station Market by Value, 2023-2033 (US$ Bn, AGR (%), CAGR (%))
Table 63 Japan Electric Vehicle Charging Station Market by Value, 2023-2033 (US$ Bn, AGR (%), CAGR (%))
Table 64 South Korea Electric Vehicle Charging Station Market by Value, 2023-2033 (US$ Bn, AGR (%), CAGR (%))
Table 65 Australia Electric Vehicle Charging Station Market by Value, 2023-2033 (US$ Bn, AGR (%), CAGR (%))
Table 66 Rest of Asia-Pacific Electric Vehicle Charging Station Market by Value, 2023-2033 (US$ Bn, AGR (%), CAGR (%))
Table 67 Middle East & Africa Electric Vehicle Charging Station Market by Value, 2023-2033 (US$ Bn, AGR (%), CAGR (%))
Table 68 Middle East & Africa Electric Vehicle Charging Station Market by Country, 2023-2033 (US$ Bn, AGR (%), CAGR (%))
Table 69 Middle East & Africa Electric Vehicle Charging Station Market by Connectivity, 2023-2033 (US$ Bn, AGR (%), CAGR (%))
Table 70 Middle East & Africa Electric Vehicle Charging Station Market by Charging Type, 2023-2033 (US$ Bn, AGR (%), CAGR (%))
Table 71 Middle East & Africa Electric Vehicle Charging Station Market by Operation, 2023-2033 (US$ Bn, AGR (%), CAGR (%))
Table 72 Middle East & Africa Electric Vehicle Charging Station Market by End-Use, 2023-2033 (US$ Bn, AGR (%), CAGR (%))
Table 73 Middle East & Africa Electric Vehicle Charging Station Market by Component, 2023-2033 (US$ Bn, AGR (%), CAGR (%))
Table 74 GCC Electric Vehicle Charging Station Market by Value, 2023-2033 (US$ Bn, AGR (%), CAGR (%))
Table 75 South Africa Electric Vehicle Charging Station Market by Value, 2023-2033 (US$ Bn, AGR (%), CAGR (%))
Table 76 Rest of Middle East & Africa Electric Vehicle Charging Station Market by Value, 2023-2033 (US$ Bn, AGR (%), CAGR (%))
Table 77 Latin America Electric Vehicle Charging Station Market by Value, 2023-2033 (US$ Bn, AGR (%), CAGR (%))
Table 78 Latin America Electric Vehicle Charging Station Market by Country, 2023-2033 (US$ Bn, AGR (%), CAGR (%))
Table 79 Latin America Electric Vehicle Charging Station Market by Connectivity, 2023-2033 (US$ Bn, AGR (%), CAGR (%))
Table 80 Latin America Electric Vehicle Charging Station Market by Charging Type, 2023-2033 (US$ Bn, AGR (%), CAGR (%))
Table 81 Latin America Electric Vehicle Charging Station Market by Operation, 2023-2033 (US$ Bn, AGR (%), CAGR (%))
Table 82 Latin America Electric Vehicle Charging Station Market by End-Use, 2023-2033 (US$ Bn, AGR (%), CAGR (%))
Table 83 Latin America Electric Vehicle Charging Station Market by Component, 2023-2033 (US$ Bn, AGR (%), CAGR (%))
Table 84 Brazil Electric Vehicle Charging Station Market by Value, 2023-2033 (US$ Bn, AGR (%), CAGR (%))
Table 85 Mexico Electric Vehicle Charging Station Market by Value, 2023-2033 (US$ Bn, AGR (%), CAGR (%))
Table 86 Rest of Latin America Electric Vehicle Charging Station Market by Value, 2023-2033 (US$ Bn, AGR (%), CAGR (%))
Table 87 Tesla, Inc Key Details, (CEO, HQ, Revenue, Founded, No. of Employees, Company Type, Website, Business Segment)
Table 88 Tesla, Inc: Product Benchmarking
Table 89 Tesla, Inc: Strategic Outlook
Table 90 ABB Ltd Key Details, (CEO, HQ, Revenue, Founded, No. of Employees, Company Type, Website, Business Segment)
Table 91 ABB Ltd: Product Benchmarking
Table 92 ABB Ltd: Strategic Outlook
Table 93 EVBox Key Details, (CEO, HQ, Revenue, Founded, No. of Employees, Company Type, Website, Business Segment)
Table 94 EVBox: Product Benchmarking
Table 95 EVBox: Strategic Outlook
Table 96 Schneider Electric SE Key Details, (CEO, HQ, Revenue, Founded, No. of Employees, Company Type, Website, Business Segment)
Table 97 Schneider Electric SE: Product Benchmarking
Table 98 Schneider Electric SE: Strategic Outlook
Table 99 Siemens AG Key Details, (CEO, HQ, Revenue, Founded, No. of Employees, Company Type, Website, Business Segment)
Table 100 Siemens AG: Product Benchmarking
Table 101 Siemens AG: Strategic Outlook
Table 102 Engie SA Key Details, (CEO, HQ, Revenue, Founded, No. of Employees, Company Type, Website, Business Segment)
Table 103 Engie SA: Product Benchmarking
Table 104 Engie SA: Strategic Outlook
Table 105 Delta Electronics Key Details, (CEO, HQ, Revenue, Founded, No. of Employees, Company Type, Website, Business Segment)
Table 106 Delta Electronics: Product Benchmarking
Table 107 Delta Electronics: Strategic Outlook
Table 108 EFACEC Power Solutions SGPS, S.A. Key Details, (CEO, HQ, Revenue, Founded, No. of Employees, Company Type, Website, Business Segment)
Table 109 EFACEC Power Solutions SGPS, S.A.: Product Benchmarking
Table 110 EFACEC Power Solutions SGPS, S.A.: Strategic Outlook
Table 111 Blink Charging Co Key Details, (CEO, HQ, Revenue, Founded, No. of Employees, Company Type, Website, Business Segment)
Table 112 Blink Charging Co: Product Benchmarking
Table 113 Blink Charging Co: Strategic Outlook
Table 114 Webasto SE Key Details, (CEO, HQ, Revenue, Founded, No. of Employees, Company Type, Website, Business Segment)
Table 115 Webasto SE: Product Benchmarking
Table 116 Webasto SE: Strategic Outlook
Table 117 NewMotion Key Details, (CEO, HQ, Revenue, Founded, No. of Employees, Company Type, Website, Business Segment)
Table 118 NewMotion: Product Benchmarking
Table 119 NewMotion: Strategic Outlook
Table 120 Ionity Key Details, (CEO, HQ, Revenue, Founded, No. of Employees, Company Type, Website, Business Segment)
Table 121 Ionity: Product Benchmarking
Table 122 Ionity: Strategic Outlook
Table 123 Electrify America LLC Key Details, (CEO, HQ, Revenue, Founded, No. of Employees, Company Type, Website, Business Segment)
Table 124 Electrify America LLC: Product Benchmarking
Table 125 Electrify America LLC: Strategic Outlook
Table 126 GreenlotsKey Details, (CEO, HQ, Revenue, Founded, No. of Employees, Company Type, Website, Business Segment)
Table 127 Greenlots: Product Benchmarking
Table 128 Greenlots: Strategic Outlook
Table 129 Enel X Key Details, (CEO, HQ, Revenue, Founded, No. of Employees, Company Type, Website, Business Segment)
Table 130 Enel X: Product Benchmarking
Table 131 Enel X: Strategic Outlook
List of Figures
Figure 1 Electric Vehicle Charging Station Market Segmentation
Figure 2 Electric Vehicle Charging Station Market by Connectivity: Market Attractiveness Index
Figure 3 Electric Vehicle Charging Station Market by Charging Type: Market Attractiveness Index
Figure 4 Electric Vehicle Charging Station Market by Operation: Market Attractiveness Index
Figure 5 Electric Vehicle Charging Station Market by End-Use: Market Attractiveness Index
Figure 6 Electric Vehicle Charging Station Market by Component: Market Attractiveness Index
Figure 7 Electric Vehicle Charging Station Market Attractiveness Index by Region
Figure 8 Electric Vehicle Charging Station Market: Market Dynamics
Figure 9 Electric Vehicle Charging Station Market by Region, 2023-2033 (US$ Bn, AGR (%)) (V-Shaped Recovery Scenario)
Figure 10 Electric Vehicle Charging Station Market by Region, 2023-2033 (US$ Bn, AGR (%)) (W-Shaped Recovery Scenario
Figure 11 Electric Vehicle Charging Station Market by Region, 2023-2033 (US$ Bn, AGR (%)) (U-Shaped Recovery Scenario)
Figure 12 Electric Vehicle Charging Station Market by Region, 2023-2033 (US$ Bn, AGR (%)) (L-Shaped Recovery Scenario)
Figure 13 Electric Vehicle Charging Station Market: Porter’s Five Forces Analysis
Figure 14 Electric Vehicle Charging Station Market by Connectivity: Market Attractiveness Index
Figure 15 Electric Vehicle Charging Station Market by Connectivity, 2023-2033 (US$ Bn, AGR (%))
Figure 16 Non-connected Charging Stations Market by Region, 2023-2033 (US$ Bn, AGR (%))
Figure 17 Non-connected Charging Stations Segment Market Share Forecast by Region, 2023 & 2033 (%)
Figure 18 Smart Connected Charging Stations Market by Region, 2023-2033 (US$ Bn, AGR (%))
Figure 19 Smart Connected Charging Stations Segment Market Share Forecast by Region, 2023 & 2033 (%)
Figure 20 Electric Vehicle Charging Station Market by Charging Type: Market Attractiveness Index
Figure 21 Electric Vehicle Charging Station Market by Charging Type, 2023-2033 (US$ Bn, AGR (%))
Figure 22 Slow Charging Points Market by Region, 2023-2033 (US$ Bn, AGR (%))
Figure 23 Slow Charging Points Segment Market Share Forecast by Region, 2023 & 2033 (%)
Figure 24 Fast Charging Points Market by Region, 2023-2033 (US$ Bn, AGR (%))
Figure 25 Fast Charging Points Segment Market Share Forecast by Region, 2023 & 2033 (%)
Figure 26 Ultra-Fast Charging Points Market by Region, 2023-2033 (US$ Bn, AGR (%))
Figure 27 Ultra-Fast Charging Points Segment Market Share Forecast by Region, 2023 & 2033 (%)
Figure 28 Electric Vehicle Charging Station Market by Operation: Market Attractiveness Index
Figure 29 Global Electric Vehicle Charging Station Market by Operation, 2023-2033 (US$ Bn, AGR (%))
Figure 30 Mode 1 Market by Region, 2023-2033 (US$ Bn, AGR (%))
Figure 31 Mode 1 Segment Market Share Forecast by Region, 2023 & 2033 (%)
Figure 32 Mode 2 Market by Region, 2023-2033 (US$ Bn, AGR (%))
Figure 33 Mode 2 Segment Market Share Forecast by Region, 2023 & 2033 (%)
Figure 34 Mode 3 Market by Region, 2023-2033 (US$ Bn, AGR (%))
Figure 35 Mode 3 Segment Market Share Forecast by Region, 2023 & 2033 (%)
Figure 36 Mode 4 Market by Region, 2023-2033 (US$ Bn, AGR (%))
Figure 37 Mode 4 Segment Market Share Forecast by Region, 2023 & 2033 (%)
Figure 38 Electric Vehicle Charging Station Market by End-Use: Market Attractiveness Index
Figure 39 Electric Vehicle Charging Station Market by End-Use, 2023-2033 (US$ Bn, AGR (%))
Figure 40 Commercial Market by Region, 2023-2033 (US$ Bn, AGR (%))
Figure 41 Commercial Segment Market Share Forecast by Region, 2023 & 2033 (%)
Figure 42 Residential Market by Region, 2023-2033 (US$ Bn, AGR (%))
Figure 43 Residential Segment Market Share Forecast by Region, 2023 & 2033 (%)
Figure 44 Public Charging Market by Region, 2023-2033 (US$ Bn, AGR (%))
Figure 45 Public Charging Segment Market Share Forecast by Region, 2023 & 2033 (%)
Figure 46 Highway Charging Market by Region, 2023-2033 (US$ Bn, AGR (%))
Figure 47 Highway Charging Segment Market Share Forecast by Region, 2023 & 2033 (%)
Figure 48 Other End-Use Market by Region, 2023-2033 (US$ Bn, AGR (%))
Figure 49 Other End-Use Segment Market Share Forecast by Region, 2023 & 2033 (%)
Figure 50 Electric Vehicle Charging Station Market by Component: Market Attractiveness Index
Figure 51 Electric Vehicle Charging Station Market by Component, 2023-2033 (US$ Bn, AGR (%))
Figure 52 Charging Stall Market by Region, 2023-2033 (US$ Bn, AGR (%))
Figure 53 Charging Stall Segment Market Share Forecast by Region, 2023 & 2033 (%)
Figure 54 AC-to-DC Inverter Market by Region, 2023-2033 (US$ Bn, AGR (%))
Figure 55 AC-to-DC Inverter Segment Market Share Forecast by Region, 2023 & 2033 (%)
Figure 56 AC power Source Plug Market by Region, 2023-2033 (US$ Bn, AGR (%))
Figure 57 AC power Source Plug Segment Market Share Forecast by Region, 2023 & 2033 (%)
Figure 58 EV Charging Cable Market by Region, 2023-2033 (US$ Bn, AGR (%))
Figure 59 EV Charging Cable Segment Market Share Forecast by Region, 2023 & 2033 (%)
Figure 60 EV Plug Market by Region, 2023-2033 (US$ Bn, AGR (%))
Figure 61 EV Plug Segment Market Share Forecast by Region, 2023 & 2033 (%)
Figure 62 Auxiliary Electrical Equipment Market by Region, 2023-2033 (US$ Bn, AGR (%))
Figure 63 Auxiliary Electrical Equipment Segment Market Share Forecast by Region, 2023 & 2033 (%)
Figure 64 Electric Vehicle Charging Station Market Forecast by Region 2023 and 2033 (Revenue, CAGR%)
Figure 65 Electric Vehicle Charging Station Market by Region, 2023-2033 (US$ Bn, AGR (%))
Figure 66 North America Electric Vehicle Charging Station Market Attractiveness Index
Figure 67 North America Electric Vehicle Charging Station Market by Region, 2023, 2028 & 2033 (US$ Billion)
Figure 68 North America Electric Vehicle Charging Station Market by Value, 2023-2033 (US$ Bn, AGR (%))
Figure 69 North America Electric Vehicle Charging Station Market by Country, 2023-2033 (US$ Bn, AGR (%))
Figure 70 North America Electric Vehicle Charging Station Market Share Forecast by Country, 2023 & 2033 (%)
Figure 71 North America Electric Vehicle Charging Station Market by Connectivity, 2023-2033 (US$ Bn, AGR (%))
Figure 72 North America Electric Vehicle Charging Station Market Share Forecast by Connectivity, 2023 & 2033 (%)
Figure 73 North America Electric Vehicle Charging Station Market by Charging Type, 2023-2033 (US$ Bn, AGR (%))
Figure 74 North America Electric Vehicle Charging Station Market Share Forecast by Charging Type, 2023 & 2033 (%)
Figure 75 North America Electric Vehicle Charging Station Market by Operation, 2023-2033 (US$ Bn, AGR (%))
Figure 76 North America Electric Vehicle Charging Station Market Share Forecast by Operation, 2023 & 2033 (%)
Figure 77 North America Electric Vehicle Charging Station Market by End-Use, 2023-2033 (US$ Bn, AGR (%))
Figure 78 North America Electric Vehicle Charging Station Market Share Forecast by End-Use, 2023 & 2033 (%)
Figure 79 North America Electric Vehicle Charging Station Market by Component, 2023-2033 (US$ Bn, AGR (%))
Figure 80 North America Electric Vehicle Charging Station Market Share Forecast by Component, 2023 & 2033 (%)
Figure 81 US Electric Vehicle Charging Station Market by Value, 2023-2033 (US$ Bn, AGR (%))
Figure 82 Canada Electric Vehicle Charging Station Market by Value, 2023-2033 (US$ Bn, AGR (%))
Figure 83 Europe Electric Vehicle Charging Station Market Attractiveness Index
Figure 84 Europe Electric Vehicle Charging Station Market by Region, 2023, 2028 & 2033 (US$ Billion)
Figure 85 Europe Electric Vehicle Charging Station Market by Value, 2023-2033 (US$ Bn, AGR (%))
Figure 86 Europe Electric Vehicle Charging Station Market by Country, 2023-2033 (US$ Bn, AGR (%))
Figure 87 Europe Electric Vehicle Charging Station Market Share Forecast by Country, 2023 & 2033 (%)
Figure 88 Europe Electric Vehicle Charging Station Market by Connectivity, 2023-2033 (US$ Bn, AGR (%))
Figure 89 Europe Electric Vehicle Charging Station Market Share Forecast by Connectivity, 2023 & 2033 (%)
Figure 90 Europe Electric Vehicle Charging Station Market by Charging Type, 2023-2033 (US$ Bn, AGR (%))
Figure 91 Europe Electric Vehicle Charging Station Market Share Forecast by Charging Type, 2023 & 2033 (%)
Figure 92 Europe Electric Vehicle Charging Station Market by Operation, 2023-2033 (US$ Bn, AGR (%))
Figure 93 Europe Electric Vehicle Charging Station Market Share Forecast by Operations, 2023 & 2033 (%)
Figure 94 Europe Electric Vehicle Charging Station Market by End-Use, 2023-2033 (US$ Bn, AGR (%))
Figure 95 Europe Electric Vehicle Charging Station Market Share Forecast by End Use, 2023 & 2033 (%)
Figure 96 Europe Electric Vehicle Charging Station Market by Component, 2023-2033 (US$ Bn, AGR (%))
Figure 97 Europe Electric Vehicle Charging Station Market Share Forecast by Components, 2023 & 2033 (%)
Figure 98 Germany Electric Vehicle Charging Station Market by Value, 2023-2033 (US$ Bn, AGR (%))
Figure 99 UK Electric Vehicle Charging Station Market by Value, 2023-2033 (US$ Bn, AGR (%))
Figure 100 France Electric Vehicle Charging Station Market by Value, 2023-2033 (US$ Bn, AGR (%))
Figure 101 Norway Electric Vehicle Charging Station Market by Value, 2023-2033 (US$ Bn, AGR (%))
Figure 102 Netherlands Electric Vehicle Charging Station Market by Value, 2023-2033 (US$ Bn, AGR (%))
Figure 103 Rest of Europe Electric Vehicle Charging Station Market by Value, 2023-2033 (US$ Bn, AGR (%))
Figure 104 Asia Pacific Electric Vehicle Charging Station Market Attractiveness Index
Figure 105 Asia Pacific Electric Vehicle Charging Station Market by Region, 2023, 2028 & 2033 (US$ Billion)
Figure 106 Asia-Pacific Electric Vehicle Charging Station Market by Value, 2023-2033 (US$ Bn, AGR (%))
Figure 107 Asia-Pacific Electric Vehicle Charging Station Market by Country, 2023-2033 (US$ Bn, AGR (%))
Figure 108 Asia Pacific Electric Vehicle Charging Station Market Share Forecast by Country, 2023 & 2033 (%)
Figure 109 Asia-Pacific Electric Vehicle Charging Station Market by Connectivity, 2023-2033 (US$ Bn, AGR (%))
Figure 110 Asia Pacific Electric Vehicle Charging Station Market Share Forecast by Connectivity, 2023 & 2033 (%)
Figure 111 Asia-Pacific Electric Vehicle Charging Station Market by Charging Type, 2023-2033 (US$ Bn, AGR (%))
Figure 112 Asia Pacific Electric Vehicle Charging Station Market Share Forecast by Charging Type, 2023 & 2033 (%)
Figure 113 Asia-Pacific Electric Vehicle Charging Station Market by Operation, 2023-2033 (US$ Bn, AGR (%))
Figure 114 Asia Pacific Electric Vehicle Charging Station Market Share Forecast by Operations, 2023 & 2033 (%)
Figure 115 Asia-Pacific Electric Vehicle Charging Station Market by End-Use, 2023-2033 (US$ Bn, AGR (%))
Figure 116 Asia Pacific Electric Vehicle Charging Station Market Share Forecast by End Use, 2023 & 2033 (%)
Figure 117 Asia-Pacific Electric Vehicle Charging Station Market by Component, 2023-2033 (US$ Bn, AGR (%))
Figure 118 Asia Pacific Electric Vehicle Charging Station Market Share Forecast by Components, 2023 & 2033 (%)
Figure 119 China Electric Vehicle Charging Station Market by Value, 2023-2033 (US$ Bn, AGR (%))
Figure 120 India Electric Vehicle Charging Station Market by Value, 2023-2033 (US$ Bn, AGR (%))
Figure 121 Japan Electric Vehicle Charging Station Market by Value, 2023-2033 (US$ Bn, AGR (%))
Figure 122 South Korea Electric Vehicle Charging Station Market by Value, 2023-2033 (US$ Bn, AGR (%))
Figure 123 Australia Electric Vehicle Charging Station Market by Value, 2023-2033 (US$ Bn, AGR (%))
Figure 124 Rest of Asia-Pacific Electric Vehicle Charging Station Market by Value, 2023-2033 (US$ Bn, AGR (%))
Figure 125 Middle East & Africa Electric Vehicle Charging Station Market Attractiveness Index
Figure 126 Middle East & Africa Electric Vehicle Charging Station Market by Region, 2023, 2028 & 2033 (US$ Billion)
Figure 127 Middle East & Africa Electric Vehicle Charging Station Market by Value, 2023-2033 (US$ Bn, AGR (%))
Figure 128 Middle East & Africa Electric Vehicle Charging Station Market by Country, 2023-2033 (US$ Bn, AGR (%))
Figure 129 Middle East & Africa Electric Vehicle Charging Station Market Share Forecast by Country, 2023 & 2033 (%)
Figure 130 Middle East & Africa Electric Vehicle Charging Station Market by Connectivity, 2023-2033 (US$ Bn, AGR (%))
Figure 131 Middle East & Africa Electric Vehicle Charging Station Market Share Forecast by Connectivity, 2023 & 2033 (%)
Figure 132 Middle East & Africa Electric Vehicle Charging Station Market by Charging Type, 2023-2033 (US$ Bn, AGR (%))
Figure 133 Middle East & Africa Electric Vehicle Charging Station Market Share Forecast by Charging Type, 2023 & 2033 (%)
Figure 134 Middle East & Africa Electric Vehicle Charging Station Market by Operation, 2023-2033 (US$ Bn, AGR (%))
Figure 135 Middle East & Africa Electric Vehicle Charging Station Market Share Forecast by Operations, 2023 & 2033 (%)
Figure 136 Middle East & Africa Electric Vehicle Charging Station Market by End-Use, 2023-2033 (US$ Bn, AGR (%))
Figure 137 Middle East & Africa Electric Vehicle Charging Station Market Share Forecast by End Use, 2023 & 2033 (%)
Figure 138 Middle East & Africa Electric Vehicle Charging Station Market by Component, 2023-2033 (US$ Bn, AGR (%))
Figure 139 Middle East & Africa Electric Vehicle Charging Station Market Share Forecast by Components, 2023 & 2033 (%)
Figure 140 GCC Electric Vehicle Charging Station Market by Value, 2023-2033 (US$ Bn, AGR (%))
Figure 141 South Africa Electric Vehicle Charging Station Market by Value, 2023-2033 (US$ Bn, AGR (%))
Figure 142 Rest of Middle East & Africa Electric Vehicle Charging Station Market by Value, 2023-2033 (US$ Bn, AGR (%))
Figure 143 Latin America Electric Vehicle Charging Station Market Attractiveness Index
Figure 144 Latin America Electric Vehicle Charging Station Market by Region, 2023, 2028 & 2033 (US$ Billion)
Figure 145 Latin America Electric Vehicle Charging Station Market by Value, 2023-2033 (US$ Bn, AGR (%))
Figure 146 Latin America Electric Vehicle Charging Station Market by Country, 2023-2033 (US$ Bn, AGR (%))
Figure 147 Latin America Electric Vehicle Charging Station Market Share Forecast by Country, 2023 & 2033 (%)
Figure 148 Latin America Electric Vehicle Charging Station Market by Connectivity, 2023-2033 (US$ Bn, AGR (%))
Figure 149 Latin America Electric Vehicle Charging Station Market Share Forecast by Connectivity, 2023 & 2033 (%)
Figure 150 Latin America Electric Vehicle Charging Station Market by Charging Type, 2023-2033 (US$ Bn, AGR (%))
Figure 151 Latin America Electric Vehicle Charging Station Market Share Forecast by Charging Type, 2023 & 2033 (%)
Figure 152 Latin America Electric Vehicle Charging Station Market by Operation, 2023-2033 (US$ Bn, AGR (%))
Figure 153 Latin America Electric Vehicle Charging Station Market Share Forecast by Operations, 2023 & 2033 (%)
Figure 154 Latin America Electric Vehicle Charging Station Market by End-Use, 2023-2033 (US$ Bn, AGR (%))
Figure 155 Latin America Electric Vehicle Charging Station Market Share Forecast by End Use, 2023 & 2033 (%)
Figure 156 Latin America Electric Vehicle Charging Station Market by Component, 2023-2033 (US$ Bn, AGR (%))
Figure 157 Latin America Electric Vehicle Charging Station Market Share Forecast by Components, 2023 & 2033 (%)
Figure 158 Brazil Electric Vehicle Charging Station Market by Value, 2023-2033 (US$ Bn, AGR (%))
Figure 159 Mexico Electric Vehicle Charging Station Market by Value, 2023-2033 (US$ Bn, AGR (%))
Figure 160 Rest of Latin America Electric Vehicle Charging Station Market by Value, 2023-2033 (US$ Bn, AGR (%))
Figure 161 Electric Vehicle Charging Station Market: Company Share, 2022
Figure 162 Tesla, Inc: Net Revenue, 2018-2022 (US$ Million, AGR%)
Figure 163 Tesla, Inc: R&D, 2018-2022 (US$ Million, AGR%)
Figure 164 Tesla, Inc: Regional Revenue Share, 2022 (%)
Figure 165 Tesla, Inc: Business Segment Revenue Share, 2022 (%)
Figure 166 ABB Ltd: Net Revenue, 2018-2022 (US$ Million, AGR%)
Figure 167 ABB Ltd: R&D, 2018-2022 (US$ Million, AGR%)
Figure 168 ABB Ltd: Business Segment Revenue Share, 2022 (%)
Figure 169 Schneider Electric SE: Net Revenue, 2018-2022 (US$ Million, AGR%)
Figure 170 Schneider Electric SE: R&D, 2018-2022 (US$ Million, AGR%)
Figure 171 Schneider Electric SE: Regional Revenue Share, 2022 (%)
Figure 172 Schneider Electric SE: Business Segment Revenue Share, 2022 (%)
Figure 173 Siemens AG: Net Revenue, 2018-2022 (US$ Million, AGR%)
Figure 174 Siemens AG: R&D, 2018-2022 (US$ Million, AGR%)
Figure 175 Siemens AG: Regional Revenue Share, 2022 (%)
Figure 176 Siemens AG: Business Segment Revenue Share, 2022 (%)
Figure 177 Blink Charging Co: Net Revenue, 2018-2022 (US$ Million, AGR%)
Figure 178 Blink Charging Co: Regional Revenue Share, 2022 (%)
Figure 179 Enel X: Net Revenue, 2018-2022 (US$ Million, AGR%)
Figure 180 Enel X: R&D, 2018-2022 (US$ Million, AGR%)
Figure 181 Enel X: Regional Revenue Share, 2022 (%)
Figure 182 Enel X: Business Segment Revenue Share, 2022 (%)
ページTOPに戻る
よくあるご質問
Visiongain社はどのような調査会社ですか?
英国の調査会社ヴィジョンゲイン社(Visiongain)は、通信とエネルギーのほか、自動車や化学・医薬品、金属など、広範な市場を対象に調査を行っています。自動車市場については、市場全般に関する調査のほ... もっと見る
調査レポートの納品までの日数はどの程度ですか?
在庫のあるものは速納となりますが、平均的には 3-4日と見て下さい。
但し、一部の調査レポートでは、発注を受けた段階で内容更新をして納品をする場合もあります。
発注をする前のお問合せをお願いします。
注文の手続きはどのようになっていますか?
1)お客様からの御問い合わせをいただきます。
2)見積書やサンプルの提示をいたします。
3)お客様指定、もしくは弊社の発注書をメール添付にて発送してください。
4)データリソース社からレポート発行元の調査会社へ納品手配します。
5) 調査会社からお客様へ納品されます。最近は、pdfにてのメール納品が大半です。
お支払方法の方法はどのようになっていますか?
納品と同時にデータリソース社よりお客様へ請求書(必要に応じて納品書も)を発送いたします。
お客様よりデータリソース社へ(通常は円払い)の御振り込みをお願いします。
請求書は、納品日の日付で発行しますので、翌月最終営業日までの当社指定口座への振込みをお願いします。振込み手数料は御社負担にてお願いします。
お客様の御支払い条件が60日以上の場合は御相談ください。
尚、初めてのお取引先や個人の場合、前払いをお願いすることもあります。ご了承のほど、お願いします。
データリソース社はどのような会社ですか?
当社は、世界各国の主要調査会社・レポート出版社と提携し、世界各国の市場調査レポートや技術動向レポートなどを日本国内の企業・公官庁及び教育研究機関に提供しております。
世界各国の「市場・技術・法規制などの」実情を調査・収集される時には、データリソース社にご相談ください。
お客様の御要望にあったデータや情報を抽出する為のレポート紹介や調査のアドバイスも致します。
|
|


