EV用バッテリー冷却システム市場レポート:2023-2033
Battery Cooling System for EV Market Report 2023-2033
レポート詳細
EV用バッテリー冷却システム市場レポート 2023-2033 :本レポートは、新たな収益の柱を目指す大手企業にとって、業界とその根底にある力学をより深く理解する上で貴重なものとなろう。異... もっと見る
※上記価格は部署ライセンス(Departmental licence)価格です。
その他の価格についてはデータリソースまでお問合せください。
日本語のページは自動翻訳を利用し作成しています。
実際のレポートは英文のみでご納品いたします。

|

|
サマリー
レポート詳細
EV用バッテリー冷却システム市場レポート 2023-2033:本レポートは、新たな収益の柱を目指す大手企業にとって、業界とその根底にある力学をより深く理解する上で貴重なものとなろう。異業種への進出や、新たな地域での既存事業の拡大を希望する企業にとっても有用であろう。
電気自動車(EV)の需要増加
電気自動車(EV)の急速な普及が自動車業界に革命をもたらしている。持続可能性を優先する消費者や政府が増えるにつれ、EV市場は急成長を遂げている。しかし、電気自動車の動力源であるリチウムイオン・バッテリーは、エネルギー密度が高いため、充放電サイクル中にかなりの熱を発生し、性能、安全性、寿命に潜在的な脅威をもたらします。そのため、効率的なバッテリー冷却システムは、バッテリーの温度を最適に維持し、バッテリーの寿命と信頼性を守るために不可欠となっています。
バッテリーの寿命と性能の向上
バッテリーの寿命と性能は、EV市場における基本的な関心事です。バッテリー冷却システムによる効果的な温度管理は、バッテリー寿命の延長と安定した性能の維持に大きく貢献します。温度が上昇すると、バッテリーの劣化やセル内の化学反応が促進され、時間の経過とともに容量が低下します。理想的な動作温度範囲を維持することで、冷却システムはバッテリーへの熱ストレスを緩和し、容量の損失を最小限に抑え、自動車の寿命を通じて信頼性の高い持続的な性能を確保します。
市場調査レポートを購入する前にすべき質問とは?
- バッテリー冷却システム市場はどのように進化しているのか?
- バッテリー冷却システム市場を牽引している要因、抑制している要因は何か?
- 各バッテリ冷却システムサブマーケットセグメントは予測期間中にどのように成長し、2033年にどれくらいの収益を占めるようになるのか?
- 2023年から2033年にかけて、各バッテリー冷却システムサブマーケットの市場シェアはどのように推移するのか?
- 2023年から2033年にかけて市場全体を牽引する主な要因は何か?
- 主要なバッテリー冷却システム市場はマクロ経済の動きに大枠で追随するのか、それとも個々の国内市場が他を凌駕するのか?
- 2033年までに各国市場のシェアはどのように変化し、2033年に市場をリードするのはどの地域か?
- 主要プレーヤーと予測期間中の見通しは?
- これら大手企業のバッテリー冷却システムプロジェクトとは?
- 2023年から2033年にかけて、産業はどのように発展していくのか?現在および今後10年間に実施されるバッテリー冷却システムプロジェクトにはどのような意味があるのでしょうか?
- バッテリー冷却システム市場をさらに拡大するために、製品化の必要性は高まっていますか?
- バッテリー冷却システム市場の方向性と、市場の最前線に立つための方法とは?
- 新製品やサービスラインへの最適な投資方法とは?
- 企業を新たな成長軌道に乗せ、C-suiteに移行させるための重要な展望とは?
このことが、現在、そして今後10年間のバッテリー冷却システム市場にどのような影響を与えるかを見極める必要がある:
- 420ページにわたる本レポートでは、128の表と195の図表を掲載しています。
- 本レポートは、業界における主要な有利分野にハイライトを当てているため、今すぐターゲットを絞ることができます。
- 世界、地域、国の売上と成長に関する詳細な分析が含まれています。
- 競合他社が成功した主なトレンド、変化、収益予測をハイライトしています。
本レポートは、バッテリー冷却システム市場が今後10年間でどのように発展するか、またCOVID-19の景気後退と好転の変動に合わせてどのように発展するかをお伝えします。この市場は、過去10年間のどの時点よりも今が重要です。
2033年までの予測やその他の分析から、商業的な展望が明らかになる
- 2033年までの収益予測に加え、直近の業績、成長率、市場シェアもご覧いただけます。
- ビジネスの展望と展開に関する独自の分析をご覧いただけます。
- 定性的分析(市場ダイナミクス、促進要因、機会、阻害要因、課題など)、コスト構造、バッテリー冷却システム価格上昇の影響、最近の動向などをご覧いただけます。
本レポートには、COVID-19が業界と貴社にどのような影響を与えるかについてのデータ分析と貴重な洞察が含まれている。本レポートでは、COVID-19の4つの回収パターンとその影響、すなわち「V」、「L」、「W」、「U」について論じている。
レポート対象セグメント
タイプ別市場セグメント
- 従来型電池
- 固体電池
車両タイプ別市場セグメント
- 乗用車
- 商用車
- その他の車両タイプ
容量別市場セグメント
- 100 kWh未満
- 100-200 kWh
- 200~500 kWh
- 500 kWh以上
推進力別市場セグメント
- バッテリー電気自動車(BEV)
- ハイブリッド電気自動車(HEV)
- プラグイン・ハイブリッド車(PHEV)
- 燃料電池車(FCV)
- その他の推進力
方式別市場セグメント
- 空冷
- 液体冷却
- 直接冷媒冷却
- 相変化材料冷却
- 熱電冷却
- ヒートパイプ冷却
世界市場全体とセグメント別の収益予測に加え、4つの地域と20の主要国市場の収益予測も掲載しています:
北米
- アメリカ
- カナダ
欧州
- ドイツ
- オランダ
- イギリス
- フランス
- ノルウェー
- その他の欧州
アジア太平洋
- 中国
- 日本
- インド
- オーストラリア
- 韓国
- その他のアジア太平洋地域
ラテンアメリカ
- ブラジル
- メキシコ
- その他のラテンアメリカ
中東・アフリカ
- GCC
- 南アフリカ
- その他の中東・アフリカ
本レポートには、バッテリー冷却システム市場の2023年から2033年にかけての主要企業のプロファイルと、これらの企業の事業のこのセグメントに焦点を当てています。
主要企業と市場成長の可能性
・ BorgWarner Inc.
・ CapTherm Systems Inc.
・ Continental AG
・ Dana Incorporated
・ Denso Corporation
・ Gentherm Incorporated
・ Koolance, Inc.
・ LG Chem Ltd
・ MAHLE GmbH
・ Marelli Holdings, Co., Ltd.
・ Robert Bosch GmbH
・ Samsung SDI Co., Ltd
・ Valeo S.A.
・ Voss Automotive
・ Webasto SE
2023年から2033年までのバッテリー冷却システム市場全体の世界売上高(金額ベース)は、2023年に18億2,670万米ドルを突破すると予測。2033年まで力強い収益成長を予測。当研究所では、最も大きな可能性を秘めた組織を特定する。彼らの能力、進歩、商業的展望を発見し、一歩先を行くお手伝いをします。
バッテリー冷却システム市場、2023-2033年レポートはどのようにお役に立ちますか?
要約すると、420ページに及ぶこのレポートは、以下のような知識を提供する:
- バッテリー冷却システム市場の2023年から2033年までの収益予測 自動車タイプ、タイプ、容量、推進力、方式、各予測を世界および地域レベルで掲載 - 業界の展望を発見し、投資と収益に最も有利な場所を見つけます。
- 4つの地域と20の主要国市場の2033年までの収益予測 - 北米、欧州、アジア太平洋、中南米、中東・アフリカのバッテリー冷却システム市場2023年から2033年までの予測をご覧ください。また、米国、カナダ、ブラジル、ドイツ、フランス、英国、ノルウェー、オランダ、中国、インド、日本、オーストラリアなど著名な経済圏の市場も予測しています。
- 既存企業および市場参入を目指す企業の展望 - バッテリー冷却システム市場に関わる主要企業15社の企業プロファイルを含む、2023年から2033年までの展望。
独自の予測による定量的・定性的分析をご覧ください。私たちのレポートだけに含まれる情報を入手し、貴重なビジネスインテリジェンスで情報を得ることができます。
他にはない情報
私たちの新しいレポートがあれば、知識に遅れをとったり、チャンスを逃したりする可能性が低くなります。弊社の調査レポートが貴社の調査、分析、意思決定にどのように役立つかをご覧ください。Visiongainの調査は、バッテリー冷却システム市場、2023年から2033年、市場をリードする企業の商業分析を必要とするすべての人のためのものです。データ、トレンド、予測をご覧いただけます。
ページTOPに戻る
目次
目次
1 レポート概要
1.1 調査の目的
1.2 EV用バッテリー冷却システム市場の紹介
1.3 本レポートの特徴
1.4 本レポートを読むべき理由
1.5 本分析レポートが回答する主な質問
1.6 本レポートは誰のためのものか?
1.7 方法論
1.7.1 市場の定義
1.7.2 市場評価・予測手法
1.7.3 データの検証
1.7.3.1 一次調査
1.7.3.2 セカンダリーリサーチ
1.8 よくある質問(FAQ)
1.9 Visiongainの関連レポート
1.10 Visiongainについて
2 エグゼクティブ・サマリー
3 市場概要
3.1 主要な調査結果
3.2 市場ダイナミクス
3.2.1 市場牽引要因
3.2.1.1 航続距離と充電速度による急速充電時の過熱リスクの低減
3.2.1.2 急成長するEV産業における素材企業、部品サプライヤー、車両設計者、その他のプレーヤーにとっての機会
3.2.1.3 効率的な冷却による電池寿命の向上が市場成長を牽引
3.2.2 市場抑制要因
3.2.2.1 莫大な資本コストとR&Dコストが市場成長を妨げる
3.2.2.2 冷却システム、特に液体冷却ソリューションは、重量を増加させ、車内のスペースを占有するため、市場の妨げになる可能性がある。
3.2.2.3 冷却システムはエネルギーを消費し、電気自動車の全体的な効率を低下させる
3.2.3 市場機会
3.2.3.1 EVバッテリーにおける新技術の採用増加
3.2.3.2 バッテリー設計の進化は市場のチャンス
3.2.3.3 環境に優しいEVソリューションに貢献するバッテリー冷却システム技術が競争優位になる
3.3 ポーターのファイブフォース分析
3.3.1 サプライヤーの交渉力(中)
3.3.2 買い手の交渉力(中~高)
3.3.3 競争上のライバル(高)
3.3.4 代替品による脅威(低)
3.3.5 新規参入の脅威(低)
3.4 COVID-19の影響分析
3.4.1 "V字型回復"
3.4.2 "U字型回復"
3.4.3 "W字型回復"
3.4.4 "L字型回復"
3.5 PEST分析
4 EV用バッテリー冷却システム市場分析:バッテリータイプ別
4.1 主要な調査結果
4.2 バッテリータイプ別セグメント 市場魅力度指数
4.3 EV用バッテリー冷却システムのバッテリータイプ別市場規模推定と予測
4.4 従来型バッテリー
4.4.1 2023〜2033年の地域別市場規模(US$ Million)
4.4.2 地域別市場シェア、2023年・2033年 (%)
4.5 固体電池
4.5.1 2023~2033年の地域別市場規模(US$ Million)
4.5.2 地域別市場シェア、2023年・2033年 (%)
5 EV用バッテリー冷却システム市場分析:車両タイプ別
5.1 主要調査結果
5.2 車両タイプ別セグメント 市場魅力度指数
5.3 EV用バッテリー冷却システムの車両タイプ別市場規模推定と予測
5.4 乗用車
5.4.1 2023〜2033年の地域別市場規模(US$ Million)
5.4.2 地域別市場シェア、2023年・2033年(%)
5.5 商用車
5.5.1 2023〜2033年の地域別市場規模(US$ Million)
5.5.2 地域別市場シェア、2023年・2033年(%)
5.6 その他の車両タイプ
5.6.1 2023〜2033年の地域別市場規模(US$ Million)
5.6.2 地域別市場シェア、2023年・2033年 (%)
6 EV用バッテリー冷却システム市場分析:バッテリー容量別
6.1 主要調査結果
6.2 バッテリー容量セグメント 市場魅力度指数
6.3 EV用バッテリー冷却システムの電池容量別市場規模推定と予測
6.4 500 kWh
6.7.1 2023〜2033年の地域別市場規模(US$ Million)
6.7.2 地域別市場シェア、2023年・2033年(%)
7 EV用バッテリー冷却システム市場分析:推進方式別
7.1 主要調査結果
7.2 推進力セグメント 市場魅力度指数
7.3 EV用バッテリー冷却システムの推進力別市場規模推定と予測
7.4 バッテリー電気自動車(BEV)
7.4.1 2023〜2033年の地域別市場規模(US$ Million)
7.4.2 地域別市場シェア、2023年・2033年 (%)
7.5 ハイブリッド車(HEV)
7.5.1 2023〜2033年の地域別市場規模(US$ Million)
7.5.2 地域別市場シェア、2023年・2033年 (%)
7.6 プラグインハイブリッド車(PHEV)
7.6.1 2023~2033年の地域別市場規模(US$ Million)
7.6.2 地域別市場シェア、2023年・2033年(%)
7.7 燃料電池自動車(FCV)
7.7.1 2023~2033年の地域別市場規模(US$ Million)
7.7.2 地域別市場シェア、2023年・2033年(%)
7.8 その他の推進力
7.8.1 2023~2033年の地域別市場規模(US$ Million)
7.8.2 地域別市場シェア、2023年~2033年(%)
8 EV用バッテリー冷却システム市場分析:冷却方式別
8.1 主要調査結果
8.2 方法セグメント 市場魅力度指数
8.3 EV用バッテリー冷却システムの推進方式別市場規模推定と予測
8.4 空冷
8.4.1 2023〜2033年の地域別市場規模(US$ Million)
8.4.2 地域別市場シェア、2023年・2033年(%)
8.5 液体冷却
8.5.1 2023~2033年の地域別市場規模(US$ Million)
8.5.2 地域別市場シェア、2023年・2033年(%)
8.6 直接冷媒冷却
8.6.1 2023~2033年の地域別市場規模(US$ Million)
8.6.2 地域別市場シェア、2023年・2033年(%)
8.7 相変化材料冷却
8.7.1 2023~2033年の地域別市場規模(US$ Million)
8.7.2 地域別市場シェア、2023年・2033年(%)
8.8 熱電冷却
8.8.1 2023~2033年の地域別市場規模(US$ Million)
8.8.2 地域別市場シェア、2023年・2033年(%)
8.9 ヒートパイプ冷却
8.9.1 2023~2033年の地域別市場規模(US$ Million)
8.9.2 地域別市場シェア、2023年・2033年(%)
9 EV用バッテリー冷却システム市場分析:地域別
9.1 主要な調査結果
9.2 地域別市場規模の推定と予測
10 北米のEV用バッテリー冷却システム市場分析
10.1 主要な調査結果
10.2 北米のEV用バッテリー冷却システム市場魅力度指数
10.3 北米のEV用バッテリー冷却システム国別市場:2023年、2028年、2033年(US$ Million)
10.4 北米のEV用バッテリー冷却システム市場規模の推定と予測
10.5 北米のEV用バッテリー冷却システム市場規模推定と予測:国別
10.6 北米のEV用バッテリー冷却システム市場規模推定と予測:バッテリータイプ別
10.7 北米のEV用バッテリー冷却システム市場規模推定と予測:車両タイプ別
10.8 北米のEV用バッテリー冷却システム市場規模推定と予測:バッテリー容量別
10.9 北米のEV用バッテリー冷却システム市場規模推定と予測:推進方式別
10.10 北米のEV用バッテリー冷却システム市場規模推定と予測:冷却方式別
10.11 アメリカのEV用バッテリー冷却システム市場分析
10.12 カナダのEV用バッテリー冷却システムの市場分析
11 欧州のEV用バッテリー冷却システム市場分析
11.1 主要な調査結果
11.2 欧州のEV用バッテリー冷却システム市場魅力度指数
11.3 欧州のEV用バッテリー冷却システム国別市場:2023年、2028年、2033年(US$ Million)
11.4 欧州のEV用バッテリー冷却システム市場規模推定と予測
11.5 欧州のEV用バッテリー冷却システム市場規模推定と予測:国別
11.6 欧州のEV用バッテリー冷却システム市場規模推定と予測:バッテリータイプ別
11.7 欧州のEV用バッテリー冷却システム市場規模推定と予測:車種別
11.8 欧州のEV用バッテリー冷却システム市場規模推定と予測:バッテリー容量別
11.9 欧州のEV用バッテリー冷却システム市場規模推定と予測:推進方式別
11.10 欧州のEV用バッテリー冷却システム市場規模推定と予測:冷却方式別
11.11 ドイツのEV用バッテリー冷却システム市場分析
11.12 イギリスのEV用バッテリー冷却システム市場分析
11.13 フランスのEV用バッテリー冷却システム市場分析
11.14 ノルウェーのEV用バッテリー冷却システム市場分析
11.15 オランダのEV用バッテリー冷却システム市場分析
11.16 その他の欧州のEV用バッテリー冷却システム市場分析
12 アジア太平洋地域のEV用バッテリー冷却システムの市場分析
12.1 主要な調査結果
12.2 アジア太平洋地域のEV用バッテリー冷却システム市場魅力度指数
12.3 アジア太平洋地域のEV用バッテリー冷却システムの国別市場:2023年、2028年、2033年(US$ Million)
12.4 アジア太平洋地域のEV用バッテリー冷却システム市場規模推定と予測
12.5 アジア太平洋地域のEV用バッテリー冷却システム市場規模推定と予測:国別
12.6 アジア太平洋地域のEV用バッテリー冷却システム市場規模推定と予測:バッテリータイプ別
12.7 アジア太平洋地域のEV用バッテリー冷却システム市場規模推定と予測:車両タイプ別
12.8 アジア太平洋地域のEV用バッテリー冷却システム市場規模推定と予測:バッテリー容量別
12.9 アジア太平洋地域のEV用バッテリー冷却システム市場規模推定と予測:推進方式別
12.10 アジア太平洋地域のEV用バッテリー冷却システム市場規模推定と予測:冷却方式別
12.11 中国のEV用バッテリー冷却システム市場分析
12.12 インドのEV用バッテリー冷却システム市場分析
12.13 日本のEV用バッテリー冷却システム市場分析
12.14 韓国のEV用バッテリー冷却システム市場分析
12.15 オーストラリアのEV用バッテリー冷却システム市場分析
12.16 その他のアジア太平洋地域のEV用バッテリー冷却システム市場分析
13 中東・アフリカのEV用バッテリー冷却システム市場分析
13.1 主要な調査結果
13.2 中東・アフリカのEV用バッテリー冷却システム市場魅力度指数
13.3 中東・アフリカのEV用バッテリー冷却システム国別市場:2023年、2028年、2033年(US$ Million)
13.4 中東・アフリカのEV用バッテリー冷却システム市場規模推定と予測
13.5 中東・アフリカのEV用バッテリー冷却システム市場規模推定と予測:国別
13.6 中東・アフリカのEV用バッテリー冷却システム市場規模推定と予測:バッテリータイプ別
13.7 中東・アフリカのEV用バッテリー冷却システム市場規模推定と予測:車両タイプ別
13.8 中東・アフリカのEV用バッテリー冷却システム市場規模推定と予測:バッテリー容量別
13.9 中東・アフリカのEV用バッテリー冷却システム市場規模推定と予測:推進方式別
13.10 中東アフリカのEV用バッテリー冷却システム市場規模推定と予測:冷却方式別
13.11 GCCのEV用バッテリー冷却システムの市場分析
13.12 南アフリカのEV用バッテリー冷却システムの市場分析
13.13 その他の中東・アフリカ地域のEV用バッテリー冷却システムの市場分析
14 ラテンアメリカのEV用バッテリー冷却システム市場分析
14.1 主要な調査結果
14.2 ラテンアメリカのEV用バッテリー冷却システム市場魅力度指数
14.3 ラテンアメリカのEV用バッテリー冷却システム国別市場:2023年、2028年、2033年(US$ Million)
14.4 ラテンアメリカのEV用バッテリー冷却システム市場規模推定と予測
14.5 ラテンアメリカのEV用バッテリー冷却システム市場規模推定と予測:国別
14.6 ラテンアメリカのEV用バッテリー冷却システム市場規模推定と予測:バッテリータイプ別
14.7 ラテンアメリカのEV用バッテリー冷却システム市場規模推定と予測:車両タイプ別
14.8 ラテンアメリカのEV用バッテリー冷却システム市場規模推定と予測:バッテリー容量別
14.9 ラテンアメリカのEV用バッテリー冷却システム市場規模推定と予測:推進方式別
14.10 ラテンアメリカのEV用バッテリー冷却システム市場規模推定と予測:冷却方式別
14.11 ブラジルのEV用バッテリー冷却システム市場分析
14.12 メキシコのEV用バッテリー冷却システムの市場分析
14.13 その他のラテンアメリカのEV用バッテリー冷却システムの市場分析
15 会社概要
15.1 競争環境、2022年
15.2 戦略的展望
15.3 LG Chem Ltd.
15.3.1 会社概要
15.3.2 会社概要
15.3.3 財務分析
15.3.3.1 純収入、2018-2022年
15.3.3.2 R&D、2018年~2022年
15.3.3.3 地域別収益シェア、2022年(%)
15.3.3.4 事業セグメント収益シェア、2022年(%)
15.3.4 製品ベンチマーク
15.3.5 戦略的展望
15.4 Continental AG
15.4.1 会社概要
15.4.2 会社概要
15.4.3 財務分析
15.4.3.1 純収入、2018-2022年
15.4.3.2 R&D、2018年~2022年
15.4.3.3 地域別収益シェア、2022年(%)
15.4.3.4 事業セグメント収益シェア、2022年(%)
15.4.4 製品ベンチマーク
15.4.5 戦略的展望
15.5 Gentherm Incorporated
15.5.1 会社概要
15.5.2 会社概要
15.5.3 財務分析
15.5.3.1 純収入、2018-2022年
15.5.3.2 R&D、2018-2022年
15.5.3.3 地域別収益シェア、2022年(%)
15.5.3.4 事業セグメント収益シェア、2022年(%)
15.5.4 製品ベンチマーク
15.5.5 戦略的展望
15.6 Robert Bosch GmbH
15.6.1 会社概要
15.6.2 会社概要
15.6.3 製品ベンチマーク
15.6.4 戦略的展望
15.7 Valeo S.A.
15.7.1 会社概要
15.7.2 会社概要
15.7.3 財務分析
15.7.3.1 純収入、2018-2022年
15.7.3.2 R&D、2018年~2022年
15.7.3.3 事業セグメント収益シェア、2022年(%)
15.7.4 製品ベンチマーク
15.7.5 戦略的展望
15.8 Marelli Holdings, Co.
15.8.1 会社概要
15.8.2 会社概要
15.8.3 製品ベンチマーク
15.8.4 戦略的展望
15.9 Dana Incorporated
15.9.1 会社概要
15.9.2 会社概要
15.9.3 財務分析
15.9.3.1 純収入、2018-2022年
15.9.3.2 R&D、2018-2022年
15.9.3.3 地域別収益シェア、2022年(%)
15.9.3.4 事業セグメント収益シェア、2022年(%)
15.9.4 製品ベンチマーク
15.10 Samsung SDI Co., Ltd
15.10.1 会社概要
15.10.2 会社概要
15.10.3 財務分析
15.10.3.1 純収入、2018-2022年
15.10.3.2 R&D、2018年~2022年
15.10.3.3 地域別収入シェア、2021年(%)
15.10.3.4 事業セグメント収益シェア、2021年(%)
15.10.4 製品ベンチマーク
15.10.5 戦略的展望
15.11 MAHLE GmbH
15.11.1 会社概要
15.11.2 会社概要
15.11.3 製品ベンチマーク
15.11.4 戦略的展望
15.12 Voss Automotive
15.12.1 会社概要
15.12.2 会社概要
15.12.3 製品ベンチマーク
15.12.4 戦略的展望
15.13 CapTherm Systems Inc.
15.13.1 会社概要
15.13.2 会社概要
15.13.3 製品ベンチマーク
15.14 BorgWarner Inc.
15.14.1 企業スナップショット
15.14.2 会社概要
15.14.3 財務分析
15.14.3.1 純収入、2018-2022年
15.14.3.2 R&D、2018年~2022年
15.14.4 製品ベンチマーク
15.14.5 戦略的展望
15.15 Denso Corporation
15.15.1 会社概要
15.15.2 会社概要
15.15.3 財務分析
15.15.3.1 純収入、2018-2022年
15.15.4 製品ベンチマーク
15.16 Webasto SE
15.16.1 会社概要
15.16.2 会社概要
15.16.3 製品ベンチマーク
15.16.4 戦略的展望
15.17 Koolance, Inc.
15.17.1 会社概要
15.17.2 会社概要
15.17.3 製品ベンチマーク
15.17.4 戦略的展望
16 結論と提言
16.1 Visiongainからの結びの言葉
16.2 市場プレイヤーへの提言
ページTOPに戻る
図表リスト
表の一覧
Table 1 Battery Cooling System for EV Market Snapshot, 2023 & 2033 (US$ Million, CAGR %)
Table 2 Global Battery Cooling System for EV Market by Region, 2023-2033 (US$ Mn, AGR (%), CAGR (%)) (V-Shaped Recovery Scenario)
Table 3 Global Battery Cooling System for EV Market by Region, 2023-2033 (US$ Mn, AGR (%), CAGR (%)) (U-Shaped Recovery Scenario)
Table 4 Global Battery Cooling System for EV Market by Region, 2023-2033 (US$ Mn, AGR (%), CAGR (%)) (W-Shaped Recovery Scenario)
Table 5 Global Battery Cooling System for EV Market by Region, 2023-2033 (US$ Mn, AGR (%), CAGR (%)) (L-Shaped Recovery Scenario)
Table 6 Global Battery Cooling System for EV Market by Type, 2023-2033 (US$ Mn, AGR (%), CAGR (%))
Table 7 Conventional Batteries Market by Region, 2023-2033 (US$ Mn, AGR (%), CAGR (%))
Table 8 Solid-State Batteries Market by Region, 2023-2033 (US$ Mn, AGR (%), CAGR (%))
Table 9 Global Battery Cooling System for EV Market by Vehicle Type, 2023-2033 (US$ Mn, AGR (%), CAGR (%))
Table 10 Passenger Vehicle Market by Region, 2023-2033 (US$ Mn, AGR (%), CAGR (%))
Table 11 Commercial Vehicle Market by Region, 2023-2033 (US$ Mn, AGR (%), CAGR (%))
Table 12 Other Vehicle Type Market by Region, 2023-2033 (US$ Mn, AGR (%), CAGR (%))
Table 13 Global Battery Cooling System for EV Market by Capacity, 2023-2033 (US$ Mn, AGR (%), CAGR (%))
Table 14 500 kWh Market by Region, 2023-2033 (US$ Mn, AGR (%), CAGR (%))
Table 18 Global Battery Cooling System for EV Market by Propulsion, 2023-2033 (US$ Mn, AGR (%), CAGR (%))
Table 19 Battery Electric Vehicle (BEV) Market by Region, 2023-2033 (US$ Mn, AGR (%), CAGR (%))
Table 20 Hybrid Electric Vehicle (HEV) Market by Region, 2023-2033 (US$ Mn, AGR (%), CAGR (%))
Table 21 Plug-in Hybrid Electric Vehicle (PHEV) Market by Region, 2023-2033 (US$ Mn, AGR (%), CAGR (%))
Table 22 Fuel Cell Vehicle (FCV) Market by Region, 2023-2033 (US$ Mn, AGR (%), CAGR (%))
Table 23 Other Propulsion Market by Region, 2023-2033 (US$ Mn, AGR (%), CAGR (%))
Table 24 Global Battery Cooling System for EV Market by Method, 2023-2033 (US$ Mn, AGR (%), CAGR (%))
Table 25 Air Cooling Market by Region, 2023-2033 (US$ Mn, AGR (%), CAGR (%))
Table 26 Liquid Cooling Market by Region, 2023-2033 (US$ Mn, AGR (%), CAGR (%))
Table 27 Direct Refrigerant Cooling Market by Region, 2023-2033 (US$ Mn, AGR (%), CAGR (%))
Table 28 Phase Change Material Cooling Market by Region, 2023-2033 (US$ Mn, AGR (%), CAGR (%))
Table 29 Thermoelectric Cooling Market by Region, 2023-2033 (US$ Mn, AGR (%), CAGR (%))
Table 30 Heat Pipe Cooling Market by Region, 2023-2033 (US$ Mn, AGR (%), CAGR (%))
Table 31 Global Battery Cooling System for EV Market Forecast, 2023-2033 (US$ Mn, AGR (%), CAGR (%))
Table 32 Battery Cooling System for EV Market Forecast by Region, 2023-2033 (US$ Million, AGR%, CAGR%)
Table 33 North America Battery Cooling System for EV Market by Value, 2023-2033 (US$ Mn, AGR (%), CAGR (%))
Table 34 North America Battery Cooling System for EV Market by Country, 2023-2033 (US$ Mn, AGR (%), CAGR (%))
Table 35 North America Battery Cooling System for EV Market by Type, 2023-2033 (US$ Mn, AGR (%), CAGR (%))
Table 36 North America Battery Cooling System for EV Market by Vehicle Type, 2023-2033 (US$ Mn, AGR (%), CAGR (%))
Table 37 North America Battery Cooling System for EV Market by Capacity, 2023-2033 (US$ Mn, AGR (%), CAGR (%))
Table 38 North America Battery Cooling System for EV Market by Propulsion, 2023-2033 (US$ Mn, AGR (%), CAGR (%))
Table 39 North America Battery Cooling System for EV Market by Method, 2023-2033 (US$ Mn, AGR (%), CAGR (%))
Table 40 US Battery Cooling System for EV Market by Value, 2023-2033 (US$ Mn, AGR (%), CAGR (%))
Table 41 Canada Battery Cooling System for EV Market by Value, 2023-2033 (US$ Mn, AGR (%), CAGR (%))
Table 42 Europe Battery Cooling System for EV Market by Value, 2023-2033 (US$ Mn, AGR (%), CAGR (%))
Table 43 Europe Battery Cooling System for EV Market by Country, 2023-2033 (US$ Mn, AGR (%), CAGR (%))
Table 44 Europe Battery Cooling System for EV Market by Type, 2023-2033 (US$ Mn, AGR (%), CAGR (%))
Table 45 Europe Battery Cooling System for EV Market by Vehicle Type, 2023-2033 (US$ Mn, AGR (%), CAGR (%))
Table 46 Europe Battery Cooling System for EV Market by Capacity, 2023-2033 (US$ Mn, AGR (%), CAGR (%))
Table 47 Europe Battery Cooling System for EV Market by Propulsion, 2023-2033 (US$ Mn, AGR (%), CAGR (%))
Table 48 Europe Battery Cooling System for EV Market by Method, 2023-2033 (US$ Mn, AGR (%), CAGR (%))
Table 49 Germany Battery Cooling System for EV Market by Value, 2023-2033 (US$ Mn, AGR (%), CAGR (%))
Table 50 UK Battery Cooling System for EV Market by Value, 2023-2033 (US$ Mn, AGR (%), CAGR (%))
Table 51 France Battery Cooling System for EV Market by Value, 2023-2033 (US$ Mn, AGR (%), CAGR (%))
Table 52 Norway Battery Cooling System for EV Market by Value, 2023-2033 (US$ Mn, AGR (%), CAGR (%))
Table 53 Netherlands Battery Cooling System for EV Market by Value, 2023-2033 (US$ Mn, AGR (%), CAGR (%))
Table 54 Rest of Europe Battery Cooling System for EV Market by Value, 2023-2033 (US$ Mn, AGR (%), CAGR (%))
Table 55 Asia-Pacific Battery Cooling System for EV Market by Value, 2023-2033 (US$ Mn, AGR (%), CAGR (%))
Table 56 Asia-Pacific Battery Cooling System for EV Market by Country, 2023-2033 (US$ Mn, AGR (%), CAGR (%))
Table 57 Asia-Pacific Battery Cooling System for EV Market by Type, 2023-2033 (US$ Mn, AGR (%), CAGR (%))
Table 58 Asia-Pacific Battery Cooling System for EV Market by Vehicle Type, 2023-2033 (US$ Mn, AGR (%), CAGR (%))
Table 59 Asia-Pacific Battery Cooling System for EV Market by Capacity, 2023-2033 (US$ Mn, AGR (%), CAGR (%))
Table 60 Asia-Pacific Battery Cooling System for EV Market by Propulsion, 2023-2033 (US$ Mn, AGR (%), CAGR (%))
Table 61 Asia-Pacific Battery Cooling System for EV Market by Method, 2023-2033 (US$ Mn, AGR (%), CAGR (%))
Table 62 China Battery Cooling System for EV Market by Value, 2023-2033 (US$ Mn, AGR (%), CAGR (%))
Table 63 India Battery Cooling System for EV Market by Value, 2023-2033 (US$ Mn, AGR (%), CAGR (%))
Table 64 Japan Battery Cooling System for EV Market by Value, 2023-2033 (US$ Mn, AGR (%), CAGR (%))
Table 65 South Korea Battery Cooling System for EV Market by Value, 2023-2033 (US$ Mn, AGR (%), CAGR (%))
Table 66 Australia Battery Cooling System for EV Market by Value, 2023-2033 (US$ Mn, AGR (%), CAGR (%))
Table 67 Rest of Asia-Pacific Battery Cooling System for EV Market by Value, 2023-2033 (US$ Mn, AGR (%), CAGR (%))
Table 68 Middle East & Africa Battery Cooling System for EV Market by Value, 2023-2033 (US$ Mn, AGR (%), CAGR (%))
Table 69 Middle East & Africa Battery Cooling System for EV Market by Country, 2023-2033 (US$ Mn, AGR (%), CAGR (%))
Table 70 Middle East & Africa Battery Cooling System for EV Market by Type, 2023-2033 (US$ Mn, AGR (%), CAGR (%))
Table 71 Middle East & Africa Battery Cooling System for EV Market by Vehicle Type, 2023-2033 (US$ Mn, AGR (%), CAGR (%))
Table 72 Middle East & Africa Battery Cooling System for EV Market by Capacity, 2023-2033 (US$ Mn, AGR (%), CAGR (%))
Table 73 Middle East & Africa Battery Cooling System for EV Market by Propulsion, 2023-2033 (US$ Mn, AGR (%), CAGR (%))
Table 74 Middle East & Africa Battery Cooling System for EV Market by Method, 2023-2033 (US$ Mn, AGR (%), CAGR (%))
Table 75 GCC Battery Cooling System for EV Market by Value, 2023-2033 (US$ Mn, AGR (%), CAGR (%))
Table 76 South Africa Battery Cooling System for EV Market by Value, 2023-2033 (US$ Mn, AGR (%), CAGR (%))
Table 77 Rest of Middle East & Africa Battery Cooling System for EV Market by Value, 2023-2033 (US$ Mn, AGR (%), CAGR (%))
Table 78 Latin America Battery Cooling System for EV Market by Value, 2023-2033 (US$ Mn, AGR (%), CAGR (%))
Table 79 Latin America Battery Cooling System for EV Market by Country, 2023-2033 (US$ Mn, AGR (%), CAGR (%))
Table 80 Latin America Battery Cooling System for EV Market by Type, 2023-2033 (US$ Mn, AGR (%), CAGR (%))
Table 81 Latin America Battery Cooling System for EV Market by Vehicle Type, 2023-2033 (US$ Mn, AGR (%), CAGR (%))
Table 82 Latin America Battery Cooling System for EV Market by Capacity, 2023-2033 (US$ Mn, AGR (%), CAGR (%))
Table 83 Latin America Battery Cooling System for EV Market by Propulsion, 2023-2033 (US$ Mn, AGR (%), CAGR (%))
Table 84 Brazil Battery Cooling System for EV Market by Value, 2023-2033 (US$ Mn, AGR (%), CAGR (%))
Table 85 Mexico Battery Cooling System for EV Market by Value, 2023-2033 (US$ Mn, AGR (%), CAGR (%))
Table 86 Rest of Latin America Battery Cooling System for EV Market by Value, 2023-2033 (US$ Mn, AGR (%), CAGR (%))
Table 87 Strategic Outlook - Contract
Table 88 LG Chem Ltd: Key Details, (CEO, HQ, Revenue, Founded, No. of Employees, Company Type, Website, Business Segment)
Table 89 LG Chem Ltd: Product Benchmarking
Table 90 LG Chem Ltd: Strategic Outlook
Table 91 Continental AG: Key Details, (CEO, HQ, Revenue, Founded, No. of Employees, Company Type, Website, Business Segment)
Table 92 Continental AG: Product Benchmarking
Table 93 Continental AG: Strategic Outlook
Table 94 Gentherm Incorporated: Key Details, (CEO, HQ, Revenue, Founded, No. of Employees, Company Type, Website, Business Segment)
Table 95 Gentherm Incorporated: Product Benchmarking
Table 96 Gentherm Incorporated: Strategic Outlook
Table 97 Robert Bosch GmbH: Key Details, (CEO, HQ, Revenue, Founded, No. of Employees, Company Type, Website, Business Segment)
Table 98 Robert Bosch GmbH: Product Benchmarking
Table 99 Robert Bosch GmbH: Strategic Outlook
Table 100 Valeo S.A: Key Details, (CEO, HQ, Revenue, Founded, No. of Employees, Company Type, Website, Business Segment)
Table 101 Valeo S.A: Product Benchmarking
Table 102 Valeo S.A: Strategic Outlook
Table 103 Marelli Holdings, Co., Ltd.: Key Details, (CEO, HQ, Revenue, Founded, No. of Employees, Company Type, Website, Business Segment)
Table 104 Marelli Holdings, Co., Ltd.: Product Benchmarking
Table 105 Marelli Holdings, Co., Ltd.: Strategic Outlook
Table 106 Dana Incorporated: Key Details, (CEO, HQ, Revenue, Founded, No. of Employees, Company Type, Website, Business Segment)
Table 107 Dana Incorporated: Product Benchmarking
Table 108 Samsung SDI Co., Ltd: Key Details, (CEO, HQ, Revenue, Founded, No. of Employees, Company Type, Website, Business Segment)
Table 109 Samsung SDI Co., Ltd: Product Benchmarking
Table 110 Samsung SDI Co., Ltd: Strategic Outlook
Table 111 MAHLE GmbH:Key Details, (CEO, HQ, Revenue, Founded, No. of Employees, Company Type, Website, Business Segment)
Table 112 MAHLE GmbH: Strategic Outlook
Table 113 Voss Automotive: Key Details, (CEO, HQ, Revenue, Founded, No. of Employees, Company Type, Website, Business Segment)
Table 114 Voss Automotive: Product Benchmarking
Table 115 Voss Automotive: Strategic Outlook
Table 116 CapTherm Systems Inc.:Key Details, (CEO, HQ, Revenue, Founded, No. of Employees, Company Type, Website, Business Segment)
Table 117 CapTherm Systems Inc.: Product Benchmarking
Table 118 BorgWarner Inc.: Key Details, (CEO, HQ, Revenue, Founded, No. of Employees, Company Type, Website, Business Segment)
Table 119 BorgWarner Inc: Product Benchmarking
Table 120 BorgWarner Inc: Strategic Outlook
Table 121 Denso Corporation: Key Details, (CEO, HQ, Revenue, Founded, No. of Employees, Company Type, Website, Business Segment)
Table 122 Denso Corporation: Product Benchmarking
Table 123 Webasto SE: Key Details, (CEO, HQ, Revenue, Founded, No. of Employees, Company Type, Website, Business Segment)
Table 124 Webasto SE : Product Benchmarking
Table 125 Webasto SE : Strategic Outlook
Table 126 Koolance, Inc.:Key Details, (CEO, HQ, Revenue, Founded, No. of Employees, Company Type, Website, Business Segment)
Table 127 Koolance, Inc.: Product Benchmarking
Table 128 Koolance, Inc.: Strategic Outlook
図の一覧
Figure 1 Battery Cooling System for EV Market Segmentation
Figure 2 Battery Cooling System for EV Market by Battery Type: Market Attractiveness Index
Figure 3 Battery Cooling System for EV Market by Vehicle Type: Market Attractiveness Index
Figure 4 Battery Cooling System for EV Market by Battery Capacity: Market Attractiveness Index
Figure 5 Battery Cooling System for EV Market by Propulsion: Market Attractiveness Index
Figure 6 Battery Cooling System for EV Market by Method: Market Attractiveness Index
Figure 7 Battery Cooling System for EV Market Attractiveness Index by Region
Figure 8 Battery Cooling System for EV Market: Market Dynamics
Figure 9 Battery Cooling System for EV Market: Porter’s Five Forces Analysis
Figure 10 Global Battery Cooling System for EV Market Share Forecast by COVID, 2023-2033 (%)
Figure 11 Global Battery Cooling System for EV Market by Region, 2023-2033 (US$ Mn, AGR (%)) (V-Shaped Recovery Scenario)
Figure 12 Global Battery Cooling System for EV Market by Region, 2023-2033 (US$ Mn, AGR (%)) (U-Shaped Recovery Scenario)
Figure 13 Global Battery Cooling System for EV Market by Region, 2023-2033 (US$ Mn, AGR (%)) (W-Shaped Recovery Scenario)
Figure 14 Global Battery Cooling System for EV Market by Region, 2023-2033 (US$ Mn, AGR (%)) (L-Shaped Recovery Scenario)
Figure 15 Battery Cooling System for EV Market: PEST Analysis
Figure 16 Battery Cooling System for EV Market by Battery Type: Market Attractiveness Index
Figure 17 Global Battery Cooling System for EV Market by Type, 2023-2033 (US$ Mn, AGR (%))
Figure 18 Battery Cooling System for EV Market Share Forecast by Battery Type, 2023, 2028, 2033 (%)
Figure 19 Conventional Batteries Market by Region, 2023-2033 (US$ Mn, AGR (%))
Figure 20 Conventional Batteries Market Share Forecast by Region, 2023 & 2033 (%)
Figure 21 Solid-State Batteries Market by Region, 2023-2033 (US$ Mn, AGR (%))
Figure 22 Solid-State Batteries Market Share Forecast by Region, 2023 & 2033 (%)
Figure 23 Battery Cooling System for EV Market by Vehicle Type: Market Attractiveness Index
Figure 24 Global Battery Cooling System for EV Market by Vehicle Type, 2023-2033 (US$ Mn, AGR (%))
Figure 25 Battery Cooling System for EV Market Share Forecast by Vehicle Type, 2023, 2028, 2033 (%)
Figure 26 Passenger Vehicle Market by Region, 2023-2033 (US$ Mn, AGR (%))
Figure 27 Passenger Vehicle Market Share Forecast by Region, 2023 & 2033 (%)
Figure 28 Commercial Vehicle Market by Region, 2023-2033 (US$ Mn, AGR (%))
Figure 29 Commercial Vehicle Market Share Forecast by Region, 2023 & 2033 (%)
Figure 30 Other Vehicle Type Market by Region, 2023-2033 (US$ Mn, AGR (%))
Figure 31 Other Vehicle Type Market Share Forecast by Region, 2023 & 2033 (%)
Figure 32 Battery Cooling System for EV Market by Battery Capacity: Market Attractiveness Index
Figure 33 Global Battery Cooling System for EV Market by Capacity, 2023-2033 (US$ Mn, AGR (%))
Figure 34 Battery Cooling System for EV Market Share Forecast by Battery Capacity, 2023, 2028, 2033 (%)
Figure 35 100 kWh Market by Region, 2023-2033 (US$ Mn, AGR (%))
Figure 36 500 kWh Market by Region, 2023-2033 (US$ Mn, AGR (%))
Figure 42 >500 kWh Market Share Forecast by Region, 2023 & 2033 (%)
Figure 43 Battery Cooling System for EV Market by Propulsion: Market Attractiveness Index
Figure 44 Global Battery Cooling System for EV Market by Propulsion, 2023-2033 (US$ Mn, AGR (%))
Figure 45 Battery Cooling System for EV Market Share Forecast by Propulsion, 2023, 2028, 2033 (%)
Figure 46 Battery Electric Vehicle (BEV) Market by Region, 2023-2033 (US$ Mn, AGR (%))
Figure 47 Battery Electric Vehicle (BEV) Market Share Forecast by Region, 2023 & 2033 (%)
Figure 48 Hybrid Electric Vehicle (HEV) Market by Region, 2023-2033 (US$ Mn, AGR (%))
Figure 49 Hybrid Electric Vehicle (HEV) Market Share Forecast by Region, 2023 & 2033 (%)
Figure 50 Plug-in Hybrid Electric Vehicle (PHEV) Market by Region, 2023-2033 (US$ Mn, AGR (%))
Figure 51 Plug-in Hybrid Electric Vehicle (PHEV) Market Share Forecast by Region, 2023 & 2033 (%)
Figure 52 Fuel Cell Vehicle (FCV) Market by Region, 2023-2033 (US$ Mn, AGR (%))
Figure 53 Fuel Cell Vehicle (FCV) Market Share Forecast by Region, 2023 & 2033 (%)
Figure 54 Other Propulsion Market by Region, 2023-2033 (US$ Mn, AGR (%))
Figure 55 Other Propulsion Market Share Forecast by Region, 2023 & 2033 (%)
Figure 56 Battery Cooling System for EV Market by Method: Market Attractiveness Index
Figure 57 Global Battery Cooling System for EV Market by Method, 2023-2033 (US$ Mn, AGR (%))
Figure 58 Battery Cooling System for EV Market Share Forecast by Method, 2023, 2028, 2033 (%)
Figure 59 Air Cooling Market by Region, 2023-2033 (US$ Mn, AGR (%))
Figure 60 Air Cooling Market Share Forecast by Region, 2023 & 2033 (%)
Figure 61 Liquid Cooling Market by Region, 2023-2033 (US$ Mn, AGR (%))
Figure 62 Liquid Cooling Market Share Forecast by Region, 2023 & 2033 (%)
Figure 63 Direct Refrigerant Cooling Market by Region, 2023-2033 (US$ Mn, AGR (%))
Figure 64 Direct Refrigerant Cooling Market Share Forecast by Region, 2023 & 2033 (%)
Figure 65 Phase Change Material Cooling Market by Region, 2023-2033 (US$ Mn, AGR (%))
Figure 66 Phase Change Material Cooling Market Share Forecast by Region, 2023 & 2033 (%)
Figure 67 Thermoelectric Cooling Market by Region, 2023-2033 (US$ Mn, AGR (%))
Figure 68 Thermoelectric Cooling Market Share Forecast by Region, 2023 & 2033 (%)
Figure 69 Heat Pipe Cooling Market by Region, 2023-2033 (US$ Mn, AGR (%))
Figure 70 Heat Pipe Cooling Market Share Forecast by Region, 2023 & 2033 (%)
Figure 71 Battery Cooling System for EV Market Forecast by Region 2023 and 2033 (Revenue, CAGR%)
Figure 72 Global Battery Cooling System for EV Market Forecast, 2023-2033 (US$ Mn, AGR (%))
Figure 73 Battery Cooling System for EV Market Share Forecast by Region 2023, 2028, 2033 (%)
Figure 74 Battery Cooling System for EV Market by Region, 2023-2033 (US$ Million, AGR %)
Figure 75 North America Battery Cooling System for EV Market Attractiveness Index
Figure 76 North America Battery Cooling System for EV Market by Region, 2023, 2028 & 2033 (US$ Million)
Figure 77 North America Battery Cooling System for EV Market by Value, 2023-2033 (US$ Mn, AGR (%))
Figure 78 North America Battery Cooling System for EV Market by Country, 2023-2033 (US$ Mn, AGR (%))
Figure 79 North America Battery Cooling System for EV Market Share Forecast by Country, 2023 & 2033 (%)
Figure 80 North America Battery Cooling System for EV Market by Type, 2023-2033 (US$ Mn, AGR (%))
Figure 81 North America Battery Cooling System for EV Market Share Forecast Battery Type, 2023 & 2033 (%)
Figure 82 North America Battery Cooling System for EV Market by Vehicle Type, 2023-2033 (US$ Mn, AGR (%))
Figure 83 North America Battery Cooling System for EV Market Share Forecast by Vehicle Type, 2023 & 2033 (%)
Figure 84 North America Battery Cooling System for EV Market by Capacity, 2023-2033 (US$ Mn, AGR (%))
Figure 85 North America Battery Cooling System for EV Market Share Forecast by Battery Capacity, 2023 & 2033 (%)
Figure 86 North America Battery Cooling System for EV Market by Propulsion, 2023-2033 (US$ Mn, AGR (%))
Figure 87 North America Battery Cooling System for EV Market Share Forecast by Propulsion, 2023 & 2033 (%)
Figure 88 North America Battery Cooling System for EV Market by Method, 2023-2033 (US$ Mn, AGR (%))
Figure 89 North America Battery Cooling System for EV Market Share Forecast by Method, 2023 & 2033 (%)
Figure 90 US Battery Cooling System for EV Market by Value, 2023-2033 (US$ Mn, AGR (%))
Figure 91 Canada Battery Cooling System for EV Market by Value, 2023-2033 (US$ Mn, AGR (%))
Figure 92 Europe Battery Cooling System for EV Market Attractiveness Index
Figure 93 Europe Battery Cooling System for EV Market by Region, 2023, 2028 & 2033 (US$ Million)
Figure 94 Europe Battery Cooling System for EV Market by Value, 2023-2033 (US$ Mn, AGR (%))
Figure 95 Europe Battery Cooling System for EV Market by Country, 2023-2033 (US$ Mn, AGR (%))
Figure 96 Europe Battery Cooling System for EV Market Share Forecast by Country, 2023 & 2033 (%)
Figure 97 Europe Battery Cooling System for EV Market by Type, 2023-2033 (US$ Mn, AGR (%))
Figure 98 Europe Battery Cooling System for EV Market Share Forecast Battery Type, 2023 & 2033 (%)
Figure 99 Europe Battery Cooling System for EV Market by Vehicle Type, 2023-2033 (US$ Mn, AGR (%))
Figure 100 Europe Battery Cooling System for EV Market Share Forecast by Vehicle Type, 2023 & 2033 (%)
Figure 101 Europe Battery Cooling System for EV Market by Capacity, 2023-2033 (US$ Mn, AGR (%))
Figure 102 Europe Battery Cooling System for EV Market Share Forecast by Battery Capacity, 2023 & 2033 (%)
Figure 103 Europe Battery Cooling System for EV Market by Propulsion, 2023-2033 (US$ Mn, AGR (%))
Figure 104 Europe Battery Cooling System for EV Market Share Forecast by Propulsion, 2023 & 2033 (%)
Figure 105 Europe Battery Cooling System for EV Market by Method, 2023-2033 (US$ Mn, AGR (%))
Figure 106 Europe Battery Cooling System for EV Market Share Forecast by Method, 2023 & 2033 (%)
Figure 107 Germany Battery Cooling System for EV Market by Value, 2023-2033 (US$ Mn, AGR (%))
Figure 108 UK Battery Cooling System for EV Market by Value, 2023-2033 (US$ Mn, AGR (%))
Figure 109 France Battery Cooling System for EV Market by Value, 2023-2033 (US$ Mn, AGR (%))
Figure 110 Norway Battery Cooling System for EV Market by Value, 2023-2033 (US$ Mn, AGR (%))
Figure 111 Netherlands Battery Cooling System for EV Market by Value, 2023-2033 (US$ Mn, AGR (%))
Figure 112 Rest of Europe Battery Cooling System for EV Market by Value, 2023-2033 (US$ Mn, AGR (%))
Figure 113 Asia-Pacific Battery Cooling System for EV Market Attractiveness Index
Figure 114 Asia-Pacific Battery Cooling System for EV Market by Region, 2023, 2028 & 2033 (US$ Million)
Figure 115 Asia-Pacific Battery Cooling System for EV Market by Value, 2023-2033 (US$ Mn, AGR (%))
Figure 116 Asia-Pacific Battery Cooling System for EV Market by Country, 2023-2033 (US$ Mn, AGR (%))
Figure 117 Asia-Pacific Battery Cooling System for EV Market Share Forecast by Country, 2023 & 2033 (%)
Figure 118 Asia-Pacific Battery Cooling System for EV Market by Type, 2023-2033 (US$ Mn, AGR (%))
Figure 119 Asia-Pacific Battery Cooling System for EV Market Share Forecast Battery Type, 2023 & 2033 (%)
Figure 120 Asia-Pacific Battery Cooling System for EV Market by Vehicle Type, 2023-2033 (US$ Mn, AGR (%))
Figure 121 Asia-Pacific Battery Cooling System for EV Market Share Forecast by Vehicle Type, 2023 & 2033 (%)
Figure 122 Asia-Pacific Battery Cooling System for EV Market by Capacity, 2023-2033 (US$ Mn, AGR (%))
Figure 123 Asia-Pacific Battery Cooling System for EV Market Share Forecast by Battery Capacity, 2023 & 2033 (%)
Figure 124 Asia-Pacific Battery Cooling System for EV Market by Propulsion, 2023-2033 (US$ Mn, AGR (%))
Figure 125 Asia-Pacific Battery Cooling System for EV Market Share Forecast by Propulsion, 2023 & 2033 (%)
Figure 126 Asia-Pacific Battery Cooling System for EV Market by Method, 2023-2033 (US$ Mn, AGR (%))
Figure 127 Asia-Pacific Battery Cooling System for EV Market Share Forecast by Method, 2023 & 2033 (%)
Figure 128 China Battery Cooling System for EV Market by Value, 2023-2033 (US$ Mn, AGR (%))
Figure 129 India Battery Cooling System for EV Market by Value, 2023-2033 (US$ Mn, AGR (%))
Figure 130 Japan Battery Cooling System for EV Market by Value, 2023-2033 (US$ Mn, AGR (%))
Figure 131 South Korea Battery Cooling System for EV Market by Value, 2023-2033 (US$ Mn, AGR (%))
Figure 132 Australia Battery Cooling System for EV Market by Value, 2023-2033 (US$ Mn, AGR (%))
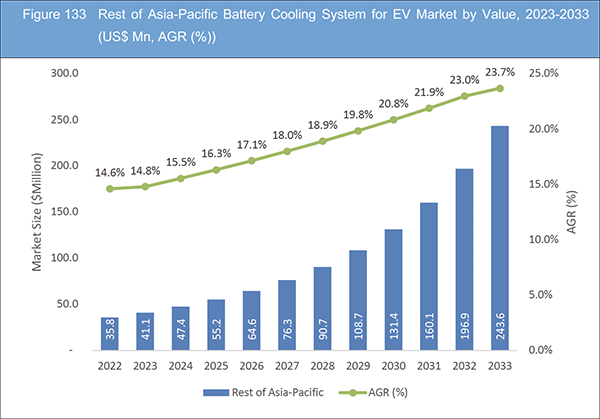
Figure 133 Rest of Asia-Pacific Battery Cooling System for EV Market by Value, 2023-2033 (US$ Mn, AGR (%))
Figure 134 Middle East and Africa Battery Cooling System for EV Market Attractiveness Index
Figure 135 Middle East and Africa Battery Cooling System for EV Market by Region, 2023, 2028 & 2033 (US$ Million)
Figure 136 Middle East & Africa Battery Cooling System for EV Market by Value, 2023-2033 (US$ Mn, AGR (%))
Figure 137 Middle East & Africa Battery Cooling System for EV Market by Country, 2023-2033 (US$ Mn, AGR (%))
Figure 138 Middle East and Africa Battery Cooling System for EV Market Share Forecast by Country, 2023 & 2033 (%)
Figure 139 Middle East & Africa Battery Cooling System for EV Market by Type, 2023-2033 (US$ Mn, AGR (%))
Figure 140 Middle East and Africa Battery Cooling System for EV Market Share Forecast Battery Type, 2023 & 2033 (%)
Figure 141 Middle East & Africa Battery Cooling System for EV Market by Vehicle Type, 2023-2033 (US$ Mn, AGR (%))
Figure 142 Middle East and Africa Battery Cooling System for EV Market Share Forecast by Vehicle Type, 2023 & 2033 (%)
Figure 143 Middle East & Africa Battery Cooling System for EV Market by Capacity, 2023-2033 (US$ Mn, AGR (%))
Figure 144 Middle East and Africa Battery Cooling System for EV Market Share Forecast by Battery Capacity, 2023 & 2033 (%)
Figure 145 Middle East & Africa Battery Cooling System for EV Market by Propulsion, 2023-2033 (US$ Mn, AGR (%))
Figure 146 Middle East and Africa Battery Cooling System for EV Market Share Forecast by Propulsion, 2023 & 2033 (%)
Figure 147 Middle East & Africa Battery Cooling System for EV Market by Method, 2023-2033 (US$ Mn, AGR (%))
Figure 148 Middle East and Africa Battery Cooling System for EV Market Share Forecast by Method, 2023 & 2033 (%)
Figure 149 GCC Battery Cooling System for EV Market by Value, 2023-2033 (US$ Mn, AGR (%))
Figure 150 South Africa Battery Cooling System for EV Market by Value, 2023-2033 (US$ Mn, AGR (%))
Figure 151 Rest of Middle East & Africa Battery Cooling System for EV Market by Value, 2023-2033 (US$ Mn, AGR (%))
Figure 152 Latin America Battery Cooling System for EV Market Attractiveness Index
Figure 153 Latin America Battery Cooling System for EV Market by Region, 2023, 2028 & 2033 (US$ Million)
Figure 154 Latin America Battery Cooling System for EV Market by Value, 2023-2033 (US$ Mn, AGR (%))
Figure 155 Latin America Battery Cooling System for EV Market by Country, 2023-2033 (US$ Mn, AGR (%))
Figure 156 Latin America Battery Cooling System for EV Market Share Forecast by Country, 2023 & 2033 (%)
Figure 157 Latin America Battery Cooling System for EV Market by Type, 2023-2033 (US$ Mn, AGR (%))
Figure 158 Latin America Battery Cooling System for EV Market Share Forecast Battery Type, 2023 & 2033 (%)
Figure 159 Latin America Battery Cooling System for EV Market by Vehicle Type, 2023-2033 (US$ Mn, AGR (%))
Figure 160 Latin America Battery Cooling System for EV Market Share Forecast by Vehicle Type, 2023 & 2033 (%)
Figure 161 Latin America Battery Cooling System for EV Market by Capacity, 2023-2033 (US$ Mn, AGR (%))
Figure 162 Latin America Battery Cooling System for EV Market Share Forecast by Battery Capacity, 2023 & 2033 (%)
Figure 163 Latin America Battery Cooling System for EV Market by Propulsion, 2023-2033 (US$ Mn, AGR (%))
Figure 164 Latin America Battery Cooling System for EV Market Share Forecast by Propulsion, 2023 & 2033 (%)
Figure 165 Latin America Battery Cooling System for EV Market Share Forecast by Method, 2023 & 2033 (%)
Figure 166 Brazil Battery Cooling System for EV Market by Value, 2023-2033 (US$ Mn, AGR (%))
Figure 167 Mexico Battery Cooling System for EV Market by Value, 2023-2033 (US$ Mn, AGR (%))
Figure 168 Rest of Latin America Battery Cooling System for EV Market by Value, 2023-2033 (US$ Mn, AGR (%))
Figure 169 Battery Cooling System for EV Market: Company Share, 2022
Figure 170 LG Chem Ltd.: Net Revenue, 2018-2022 (US$ Million, AGR%)
Figure 171 LG Chem Ltd.: R&D, 2018-2022 (US$ Million, AGR%)
Figure 172 LG Chem Ltd.: Regional Revenue Share, 2022 (%)
Figure 173 LG Chem Ltd.: Business Segment Revenue Share, 2022 (%)
Figure 174 Continental AG.: Net Revenue, 2018-2022 (US$ Million, AGR%)
Figure 175 Continental AG.: R&D, 2018-2022 (US$ Million, AGR%)
Figure 176 Continental AG.: Regional Revenue Share, 2022 (%)
Figure 177 Continental AG.: Business Segment Revenue Share, 2022 (%)
Figure 178 Gentherm Incorporated.: Net Revenue, 2018-2022 (US$ Million, AGR%)
Figure 179 Gentherm Incorporated.: R&D, 2018-2022 (US$ Million, AGR%)
Figure 180 Gentherm Incorporated.: Regional Revenue Share, 2022 (%)
Figure 181 Gentherm Incorporated.: Business Segment Revenue Share, 2022 (%)
Figure 182 Valeo S.A.: Net Revenue, 2018-2022 (US$ Million, AGR%)
Figure 183 Valeo S.A.: R&D, 2018-2022 (US$ Million, AGR%)
Figure 184 Valeo S.A.: Business Segment Revenue Share, 2022 (%)
Figure 185 Dana Incorporated.: Net Revenue, 2018-2022 (US$ Million, AGR%)
Figure 186 Dana Incorporated.: R&D, 2018-2022 (US$ Million, AGR%)
Figure 187 Dana Incorporated.: Regional Revenue Share, 2022 (%)
Figure 188 Dana Incorporated.: Business Segment Revenue Share, 2022 (%)
Figure 189 Samsung SDI Co., Ltd.: Net Revenue, 2018-2022 (US$ Million, AGR%)
Figure 190 Samsung SDI Co., Ltd.: R&D, 2018-2022 (US$ Million, AGR%)
Figure 191 Samsung SDI Co., Ltd.: Regional Revenue Share, 2021 (%)
Figure 192 Samsung SDI Co., Ltd.: Business Segment Revenue Share, 2021 (%)
Figure 193 BorgWarner Inc.: Net Revenue, 2018-2022 (US$ Million, AGR%)
Figure 194 BorgWarner Inc.: R&D, 2018-2022 (US$ Million, AGR%)
Figure 195 Denso Corporation.: Net Revenue, 2018-2022 (US$ Million, AGR%)
ページTOPに戻る
Summary
Report Details
The Battery Cooling System for EV Market Report 2023-2033: This report will prove invaluable to leading firms striving for new revenue pockets if they wish to better understand the industry and its underlying dynamics. It will be useful for companies that would like to expand into different industries or to expand their existing operations in a new region.
Increasing Demand for Electric Vehicles (EVs)
The surge in the adoption of electric vehicles (EVs) is revolutionizing the automotive industry. As more consumers and governments prioritize sustainability, the EV market is experiencing rapid growth. However, the enhanced energy density of lithium-ion batteries powering these vehicles generates considerable heat during charging and discharging cycles, posing a potential threat to their performance, safety, and lifespan. Consequently, an efficient battery cooling system has become imperative to maintain optimal battery temperature, safeguarding its longevity and reliability.
Extended Battery Life and Performance
Battery life and performance are fundamental concerns in the EV market. Effective temperature management through battery cooling systems significantly contributes to extending battery lifespan and maintaining consistent performance. Elevated temperatures accelerate battery degradation and chemical reactions within cells, reducing their capacity over time. By maintaining an ideal operating temperature range, the cooling system mitigates thermal stress on the battery, minimizing capacity loss and ensuring reliable, sustained performance throughout the vehicle’s lifespan.
What Questions Should You Ask before Buying a Market Research Report?
• How is the battery cooling system market evolving?
• What is driving and restraining the battery cooling system market?
• How will each battery cooling system submarket segment grow over the forecast period and how much revenue will these submarkets account for in 2033?
• How will the market shares for each battery cooling system submarket develop from 2023 to 2033?
• What will be the main driver for the overall market from 2023 to 2033?
• Will leading battery cooling system markets broadly follow the macroeconomic dynamics, or will individual national markets outperform others?
• How will the market shares of the national markets change by 2033 and which geographical region will lead the market in 2033?
• Who are the leading players and what are their prospects over the forecast period?
• What are the battery cooling system projects for these leading companies?
• How will the industry evolve during the period between 2023 and 2033? What are the implications of battery cooling system projects taking place now and over the next 10 years?
• Is there a greater need for product commercialisation to further scale the battery cooling system market?
• Where is the battery cooling system market heading and how can you ensure you are at the forefront of the market?
• What are the best investment options for new product and service lines?
• What are the key prospects for moving companies into a new growth path and C-suite?
You need to discover how this will impact the battery cooling system market today, and over the next 10 years:
• Our 420-page report provides 128 tables and 195 charts/graphs exclusively to you.
• The report highlights key lucrative areas in the industry so you can target them – NOW.
• It contains in-depth analysis of global, regional and national sales and growth.
• It highlights for you the key successful trends, changes and revenue projections made by your competitors.
This report tells you TODAY how the battery cooling system market will develop in the next 10 years, and in line with the variations in COVID-19 economic recession and bounce. This market is more critical now than at any point over the last 10 years.
Forecasts to 2033 and other analyses reveal commercial prospects
• In addition to revenue forecasting to 2033, our new study provides you with recent results, growth rates, and market shares.
• You will find original analyses, with business outlooks and developments.
• Discover qualitative analyses (including market dynamics, drivers, opportunities, restraints and challenges), cost structure, impact of rising battery cooling system prices and recent developments.
This report includes data analysis and invaluable insight into how COVID-19 will affect the industry and your company. Four COVID-19 recovery patterns and their impact, namely, “V”, “L”, “W” and “U” are discussed in this report.
Segments Covered in the Report
Market Segment by Type
• Conventional Batteries
• Solid-State Batteries
Market Segment by Vehicle Type
• Passenger Vehicle
• Commercial Vehicle
• Other Vehicle Type
Market Segment by Capacity
• <100 kWh
• 100-200 kWh
• 200-500 kWh
• >500 kWh
Market Segment by Propulsion
• Battery Electric Vehicle (BEV)
• Hybrid Electric Vehicle (HEV)
• Plug-in Hybrid Electric Vehicle (PHEV)
• Fuel Cell Vehicle (FCV)
• Other Propulsion
Market Segment by Method
• Air Cooling
• Liquid Cooling
• Direct Refrigerant Cooling
• Phase Change Material Cooling
• Thermoelectric Cooling
• Heat Pipe Cooling
In addition to the revenue predictions for the overall world market and segments, you will also find revenue forecasts for four regional and 20 leading national markets:
North America
• U.S.
• Canada
Europe
• Germany
• Netherlands
• United Kingdom
• France
• Norway
• Rest of Europe
Asia Pacific
• China
• Japan
• India
• Australia
• South Korea
• Rest of Asia Pacific
Latin America
• Brazil
• Mexico
• Rest of Latin America
Middle East & Africa
• GCC
• South Africa
• Rest of Middle East & Africa
The report also includes profiles and for some of the leading companies in the Battery Cooling System Market, 2023 to 2033, with a focus on this segment of these companies’ operations.
Leading companies and the potential for market growth
• BorgWarner Inc.
• CapTherm Systems Inc.
• Continental AG
• Dana Incorporated
• Denso Corporation
• Gentherm Incorporated
• Koolance, Inc.
• LG Chem Ltd
• MAHLE GmbH
• Marelli Holdings, Co., Ltd.
• Robert Bosch GmbH
• Samsung SDI Co., Ltd
• Valeo S.A.
• Voss Automotive
• Webasto SE
Overall world revenue for Battery Cooling System Market, 2023 to 2033 in terms of value the market will surpass US$1,826.7 million in 2023, our work calculates. We predict strong revenue growth through to 2033. Our work identifies which organizations hold the greatest potential. Discover their capabilities, progress, and commercial prospects, helping you stay ahead.
How will the Battery Cooling System Market, 2023 to 2033 report help you?
In summary, our 420-page report provides you with the following knowledge:
• Revenue forecasts to 2033 for Battery Cooling System Market, 2023 to 2033 Market, with forecasts for vehicle type, type, capacity, propulsion, method , each forecast at a global and regional level – discover the industry’s prospects, finding the most lucrative places for investments and revenues.
• Revenue forecasts to 2033 for four regional and 20 key national markets – See forecasts for the Battery Cooling System Market, 2023 to 2033 market in North America, Europe, Asia-Pacific, Latin America and Middle East & Africa. Also forecasted is the market in the US, Canada, Brazil, Germany, France, UK, Norway, Netherlands, China, India, Japan, and Australia among other prominent economies.
• Prospects for established firms and those seeking to enter the market – including company profiles for 15 of the major companies involved in the battery cooling system market, 2023 to 2033.
Find quantitative and qualitative analyses with independent predictions. Receive information that only our report contains, staying informed with invaluable business intelligence.
Information found nowhere else
With our new report, you are less likely to fall behind in knowledge or miss out on opportunities. See how our work could benefit your research, analyses, and decisions. Visiongain’s study is for everybody needing commercial analyses for the Battery Cooling System Market, 2023 to 2033, market-leading companies. You will find data, trends and predictions.
ページTOPに戻る
Table of Contents
Table of Contents
1 Report Overview
1.1 Objectives of the Study
1.2 Introduction to Battery Cooling System for EV Market
1.3 What This Report Delivers
1.4 Why You Should Read This Report
1.5 Key Questions Answered by This Analytical Report
1.6 Who Is This Report for?
1.7 Methodology
1.7.1 Market Definitions
1.7.2 Market Evaluation & Forecasting Methodology
1.7.3 Data Validation
1.7.3.1 Primary Research
1.7.3.2 Secondary Research
1.8 Frequently Asked Questions (FAQs)
1.9 Associated Visiongain Reports
1.10 About Visiongain
2 Executive Summary
3 Market Overview
3.1 Key Findings
3.2 Market Dynamics
3.2.1 Market Driving Factors
3.2.1.1 Range and Charging Speed Reduce the Risk of Overheating During Fast-Charging Sessions
3.2.1.2 Opportunities for Materials Companies, Component Suppliers, Vehicle Designers, and Other Players in the Rapidly Growing EV Industry
3.2.1.3 Efficient Cooling Leading to Improved Battery Life Driving the Market Growth
3.2.2 Market Restraining Factors
3.2.2.1 Huge Capital and R&D Cost Hinder the Market Growth
3.2.2.2 Cooling Systems, Particularly Liquid Cooling Solutions, Add Weight and Occupy Space Within the Vehicle Can Hinder the Market
3.2.2.3 Cooling Systems Consume Energy, Reducing the Overall Efficiency of the Electric Vehicle
3.2.3 Market Opportunities
3.2.3.1 Increasing Adoption of New Technologies in EV Batteries
3.2.3.2 Evolving Battery Designs are Opportunities for the Market
3.2.3.3 Battery Cooling System Technologies that Contribute to Greener EV Solutions Will have a Competitive Advantage
3.3 Porter’s Five Forces Analysis
3.3.1 Bargaining Power of Suppliers (Moderate)
3.3.2 Bargaining Power of Buyers (Moderate to High)
3.3.3 Competitive Rivalry (High)
3.3.4 Threat from Substitutes (Low)
3.3.5 Threat of New Entrants (Low)
3.4 COVID-19 Impact Analysis
3.4.1 “V-Shaped Recovery”
3.4.2 “U-Shaped Recovery”
3.4.3 “W-Shaped Recovery”
3.4.4 “L-Shaped Recovery”
3.5 PEST Analysis
4 Battery Cooling System for EV Market Analysis by Battery Type
4.1 Key Findings
4.2 Battery Type Segment: Market Attractiveness Index
4.3 Battery Cooling System for EV Market Size Estimation and Forecast by Battery Type
4.4 Conventional Batteries
4.4.1 Market Size by Region, 2023-2033 (US$ Million)
4.4.2 Market Share by Region, 2023 & 2033 (%)
4.5 Solid-State Batteries
4.5.1 Market Size by Region, 2023-2033 (US$ Million)
4.5.2 Market Share by Region, 2023 & 2033 (%)
5 Battery Cooling System for EV Market Analysis by Vehicle Type
5.1 Key Findings
5.2 Vehicle Type Segment: Market Attractiveness Index
5.3 Battery Cooling System for EV Market Size Estimation and Forecast by Vehicle Type
5.4 Passenger Vehicle
5.4.1 Market Size by Region, 2023-2033 (US$ Million)
5.4.2 Market Share by Region, 2023 & 2033 (%)
5.5 Commercial Vehicle
5.5.1 Market Size by Region, 2023-2033 (US$ Million)
5.5.2 Market Share by Region, 2023 & 2033 (%)
5.6 Other Vehicle Type
5.6.1 Market Size by Region, 2023-2033 (US$ Million)
5.6.2 Market Share by Region, 2023 & 2033 (%)
6 Battery Cooling System for EV Market Analysis by Battery Capacity
6.1 Key Findings
6.2 Battery Capacity Segment: Market Attractiveness Index
6.3 Battery Cooling System for EV Market Size Estimation and Forecast by Battery Capacity
6.4 500 kWh
6.7.1 Market Size by Region, 2023-2033 (US$ Million)
6.7.2 Market Share by Region, 2023 & 2033 (%)
7 Battery Cooling System for EV Market Analysis by Propulsion
7.1 Key Findings
7.2 Propulsion Segment: Market Attractiveness Index
7.3 Battery Cooling System for EV Market Size Estimation and Forecast by Propulsion
7.4 Battery Electric Vehicle (BEV)
7.4.1 Market Size by Region, 2023-2033 (US$ Million)
7.4.2 Market Share by Region, 2023 & 2033 (%)
7.5 Hybrid Electric Vehicle (HEV)
7.5.1 Market Size by Region, 2023-2033 (US$ Million)
7.5.2 Market Share by Region, 2023 & 2033 (%)
7.6 Plug-in Hybrid Electric Vehicle (PHEV)
7.6.1 Market Size by Region, 2023-2033 (US$ Million)
7.6.2 Market Share by Region, 2023 & 2033 (%)
7.7 Fuel Cell Vehicle (FCV)
7.7.1 Market Size by Region, 2023-2033 (US$ Million)
7.7.2 Market Share by Region, 2023 & 2033 (%)
7.8 Other Propulsion
7.8.1 Market Size by Region, 2023-2033 (US$ Million)
7.8.2 Market Share by Region, 2023 & 2033 (%)
8 Battery Cooling System for EV Market Analysis by Method
8.1 Key Findings
8.2 Method Segment: Market Attractiveness Index
8.3 Battery Cooling System for EV Market Size Estimation and Forecast by Propulsion
8.4 Air Cooling
8.4.1 Market Size by Region, 2023-2033 (US$ Million)
8.4.2 Market Share by Region, 2023 & 2033 (%)
8.5 Liquid Cooling
8.5.1 Market Size by Region, 2023-2033 (US$ Million)
8.5.2 Market Share by Region, 2023 & 2033 (%)
8.6 Direct Refrigerant Cooling
8.6.1 Market Size by Region, 2023-2033 (US$ Million)
8.6.2 Market Share by Region, 2023 & 2033 (%)
8.7 Phase Change Material Cooling
8.7.1 Market Size by Region, 2023-2033 (US$ Million)
8.7.2 Market Share by Region, 2023 & 2033 (%)
8.8 Thermoelectric Cooling
8.8.1 Market Size by Region, 2023-2033 (US$ Million)
8.8.2 Market Share by Region, 2023 & 2033 (%)
8.9 Heat Pipe Cooling
8.9.1 Market Size by Region, 2023-2033 (US$ Million)
8.9.2 Market Share by Region, 2023 & 2033 (%)
9 Battery Cooling System for EV Market Analysis by Region
9.1 Key Findings
9.2 Regional Market Size Estimation and Forecast
10 North America Battery Cooling System for EV Market Analysis
10.1 Key Findings
10.2 North America Battery Cooling System for EV Market Attractiveness Index
10.3 North America Battery Cooling System for EV Market by Country, 2023, 2028 & 2033 (US$ Million)
10.4 North America Battery Cooling System for EV Market Size Estimation and Forecast
10.5 North America Battery Cooling System for EV Market Size Estimation and Forecast by Country
10.6 North America Battery Cooling System for EV Market Size Estimation and Forecast by Battery Type
10.7 North America Battery Cooling System for EV Market Size Estimation and Forecast by Vehicle Type
10.8 North America Battery Cooling System for EV Market Size Estimation and Forecast by Battery Capacity
10.9 North America Battery Cooling System for EV Market Size Estimation and Forecast by Propulsion
10.10 North America Battery Cooling System for EV Market Size Estimation and Forecast by Method
10.11 U.S. Battery Cooling System for EV Market Analysis
10.12 Canada Battery Cooling System for EV Market Analysis
11 Europe Battery Cooling System for EV Market Analysis
11.1 Key Findings
11.2 Europe Battery Cooling System for EV Market Attractiveness Index
11.3 Europe Battery Cooling System for EV Market by Country, 2023, 2028 & 2033 (US$ Million)
11.4 Europe Battery Cooling System for EV Market Size Estimation and Forecast
11.5 Europe Battery Cooling System for EV Market Size Estimation and Forecast by Country
11.6 Europe Battery Cooling System for EV Market Size Estimation and Forecast by Battery Type
11.7 Europe Battery Cooling System for EV Market Size Estimation and Forecast by Vehicle Type
11.8 Europe Battery Cooling System for EV Market Size Estimation and Forecast by Battery Capacity
11.9 Europe Battery Cooling System for EV Market Size Estimation and Forecast by Propulsion
11.10 Europe Battery Cooling System for EV Market Size Estimation and Forecast by Method
11.11 Germany Battery Cooling System for EV Market Analysis
11.12 UK Battery Cooling System for EV Market Analysis
11.13 France Battery Cooling System for EV Market Analysis
11.14 Norway Battery Cooling System for EV Market Analysis
11.15 Netherlands Battery Cooling System for EV Market Analysis
11.16 Rest of Europe Battery Cooling System for EV Market Analysis
12 Asia-Pacific Battery Cooling System for EV Market Analysis
12.1 Key Findings
12.2 Asia-Pacific Battery Cooling System for EV Market Attractiveness Index
12.3 Asia-Pacific Battery Cooling System for EV Market by Country, 2023, 2028 & 2033 (US$ Million)
12.4 Asia-Pacific Battery Cooling System for EV Market Size Estimation and Forecast
12.5 Asia-Pacific Battery Cooling System for EV Market Size Estimation and Forecast by Country
12.6 Asia-Pacific Battery Cooling System for EV Market Size Estimation and Forecast by Battery Type
12.7 Asia-Pacific Battery Cooling System for EV Market Size Estimation and Forecast by Vehicle Type
12.8 Asia-Pacific Battery Cooling System for EV Market Size Estimation and Forecast by Battery Capacity
12.9 Asia-Pacific Battery Cooling System for EV Market Size Estimation and Forecast by Propulsion
12.10 Asia-Pacific Battery Cooling System for EV Market Size Estimation and Forecast by Method
12.11 China Battery Cooling System for EV Market Analysis
12.12 India Battery Cooling System for EV Market Analysis
12.13 Japan Battery Cooling System for EV Market Analysis
12.14 South Korea Battery Cooling System for EV Market Analysis
12.15 Australia Battery Cooling System for EV Market Analysis
12.16 Rest of Asia-Pacific Battery Cooling System for EV Market Analysis
13 Middle East and Africa Battery Cooling System for EV Market Analysis
13.1 Key Findings
13.2 Middle East and Africa Battery Cooling System for EV Market Attractiveness Index
13.3 Middle East and Africa Battery Cooling System for EV Market by Country, 2023, 2028 & 2033 (US$ Million)
13.4 Middle East and Africa Battery Cooling System for EV Market Size Estimation and Forecast
13.5 Middle East and Africa Battery Cooling System for EV Market Size Estimation and Forecast by Country
13.6 Middle East and Africa Battery Cooling System for EV Market Size Estimation and Forecast by Battery Type
13.7 Middle East and Africa Battery Cooling System for EV Market Size Estimation and Forecast by Vehicle Type
13.8 Middle East and Africa Battery Cooling System for EV Market Size Estimation and Forecast by Battery Capacity
13.9 Middle East and Africa Battery Cooling System for EV Market Size Estimation and Forecast by Propulsion
13.10 Middle East and Africa Battery Cooling System for EV Market Size Estimation and Forecast by Method
13.11 GCC Battery Cooling System for EV Market Analysis
13.12 South Africa Battery Cooling System for EV Market Analysis
13.13 Rest of Middle East & Africa Battery Cooling System for EV Market Analysis
14 Latin America Battery Cooling System for EV Market Analysis
14.1 Key Findings
14.2 Latin America Battery Cooling System for EV Market Attractiveness Index
14.3 Latin America Battery Cooling System for EV Market by Country, 2023, 2028 & 2033 (US$ Million)
14.4 Latin America Battery Cooling System for EV Market Size Estimation and Forecast
14.5 Latin America Battery Cooling System for EV Market Size Estimation and Forecast by Country
14.6 Latin America Battery Cooling System for EV Market Size Estimation and Forecast by Battery Type
14.7 Latin America Battery Cooling System for EV Market Size Estimation and Forecast by Vehicle Type
14.8 Latin America Battery Cooling System for EV Market Size Estimation and Forecast by Battery Capacity
14.9 Latin America Battery Cooling System for EV Market Size Estimation and Forecast by Propulsion
14.10 Latin America Battery Cooling System for EV Market Size Estimation and Forecast by Method
14.11 Brazil Battery Cooling System for EV Market Analysis
14.12 Mexico Battery Cooling System for EV Market Analysis
14.13 Rest of Latin America Battery Cooling System for EV Market Analysis
15 Company Profiles
15.1 Competitive Landscape, 2022
15.2 Strategic Outlook
15.3 LG Chem Ltd
15.3.1 Company Snapshot
15.3.2 Company Overview
15.3.3 Financial Analysis
15.3.3.1 Net Revenue, 2018-2022
15.3.3.2 R&D, 2018-2022
15.3.3.3 Regional Revenue Share, 2022 (%)
15.3.3.4 Business Segment Revenue Share, 2022 (%)
15.3.4 Product Benchmarking
15.3.5 Strategic Outlook
15.4 Continental AG
15.4.1 Company Snapshot
15.4.2 Company Overview
15.4.3 Financial Analysis
15.4.3.1 Net Revenue, 2018-2022
15.4.3.2 R&D, 2018-2022
15.4.3.3 Regional Revenue Share, 2022 (%)
15.4.3.4 Business Segment Revenue Share, 2022 (%)
15.4.4 Product Benchmarking
15.4.5 Strategic Outlook
15.5 Gentherm Incorporated
15.5.1 Company Snapshot
15.5.2 Company Overview
15.5.3 Financial Analysis
15.5.3.1 Net Revenue, 2018-2022
15.5.3.2 R&D, 2018-2022
15.5.3.3 Regional Revenue Share, 2022 (%)
15.5.3.4 Business Segment Revenue Share, 2022 (%)
15.5.4 Product Benchmarking
15.5.5 Strategic Outlook
15.6 Robert Bosch GmbH
15.6.1 Company Snapshot
15.6.2 Company Overview
15.6.3 Product Benchmarking
15.6.4 Strategic Outlook
15.7 Valeo S.A.
15.7.1 Company Snapshot
15.7.2 Company Overview
15.7.3 Financial Analysis
15.7.3.1 Net Revenue, 2018-2022
15.7.3.2 R&D, 2018-2022
15.7.3.3 Business Segment Revenue Share, 2022 (%)
15.7.4 Product Benchmarking
15.7.5 Strategic Outlook
15.8 Marelli Holdings, Co., Ltd.
15.8.1 Company Snapshot
15.8.2 Company Overview
15.8.3 Product Benchmarking
15.8.4 Strategic Outlook
15.9 Dana Incorporated
15.9.1 Company Snapshot
15.9.2 Company Overview
15.9.3 Financial Analysis
15.9.3.1 Net Revenue, 2018-2022
15.9.3.2 R&D, 2018-2022
15.9.3.3 Regional Revenue Share, 2022 (%)
15.9.3.4 Business Segment Revenue Share, 2022 (%)
15.9.4 Product Benchmarking
15.10 Samsung SDI Co., Ltd
15.10.1 Company Snapshot
15.10.2 Company Overview
15.10.3 Financial Analysis
15.10.3.1 Net Revenue, 2018-2022
15.10.3.2 R&D, 2018-2022
15.10.3.3 Regional Revenue Share, 2021 (%)
15.10.3.4 Business Segment Revenue Share, 2021 (%)
15.10.4 Product Benchmarking
15.10.5 Strategic Outlook
15.11 MAHLE GmbH
15.11.1 Company Snapshot
15.11.2 Company Overview
15.11.3 Product Benchmarking
15.11.4 Strategic Outlook
15.12 Voss Automotive
15.12.1 Company Snapshot
15.12.2 Company Overview
15.12.3 Product Benchmarking
15.12.4 Strategic Outlook
15.13 CapTherm Systems Inc.
15.13.1 Company Snapshot
15.13.2 Company Overview
15.13.3 Product Benchmarking
15.14 BorgWarner Inc.
15.14.1 Company Snapshot
15.14.2 Company Overview
15.14.3 Financial Analysis
15.14.3.1 Net Revenue, 2018-2022
15.14.3.2 R&D, 2018-2022
15.14.4 Product Benchmarking
15.14.5 Strategic Outlook
15.15 Denso Corporation
15.15.1 Company Snapshot
15.15.2 Company Overview
15.15.3 Financial Analysis
15.15.3.1 Net Revenue, 2018-2022
15.15.4 Product Benchmarking
15.16 Webasto SE
15.16.1 Company Snapshot
15.16.2 Company Overview
15.16.3 Product Benchmarking
15.16.4 Strategic Outlook
15.17 Koolance, Inc.
15.17.1 Company Snapshot
15.17.2 Company Overview
15.17.3 Product Benchmarking
15.17.4 Strategic Outlook
16 Conclusion and Recommendations
16.1 Concluding Remarks from Visiongain
16.2 Recommendations for Market Players
ページTOPに戻る
List of Tables/Graphs
List of Tables
Table 1 Battery Cooling System for EV Market Snapshot, 2023 & 2033 (US$ Million, CAGR %)
Table 2 Global Battery Cooling System for EV Market by Region, 2023-2033 (US$ Mn, AGR (%), CAGR (%)) (V-Shaped Recovery Scenario)
Table 3 Global Battery Cooling System for EV Market by Region, 2023-2033 (US$ Mn, AGR (%), CAGR (%)) (U-Shaped Recovery Scenario)
Table 4 Global Battery Cooling System for EV Market by Region, 2023-2033 (US$ Mn, AGR (%), CAGR (%)) (W-Shaped Recovery Scenario)
Table 5 Global Battery Cooling System for EV Market by Region, 2023-2033 (US$ Mn, AGR (%), CAGR (%)) (L-Shaped Recovery Scenario)
Table 6 Global Battery Cooling System for EV Market by Type, 2023-2033 (US$ Mn, AGR (%), CAGR (%))
Table 7 Conventional Batteries Market by Region, 2023-2033 (US$ Mn, AGR (%), CAGR (%))
Table 8 Solid-State Batteries Market by Region, 2023-2033 (US$ Mn, AGR (%), CAGR (%))
Table 9 Global Battery Cooling System for EV Market by Vehicle Type, 2023-2033 (US$ Mn, AGR (%), CAGR (%))
Table 10 Passenger Vehicle Market by Region, 2023-2033 (US$ Mn, AGR (%), CAGR (%))
Table 11 Commercial Vehicle Market by Region, 2023-2033 (US$ Mn, AGR (%), CAGR (%))
Table 12 Other Vehicle Type Market by Region, 2023-2033 (US$ Mn, AGR (%), CAGR (%))
Table 13 Global Battery Cooling System for EV Market by Capacity, 2023-2033 (US$ Mn, AGR (%), CAGR (%))
Table 14 500 kWh Market by Region, 2023-2033 (US$ Mn, AGR (%), CAGR (%))
Table 18 Global Battery Cooling System for EV Market by Propulsion, 2023-2033 (US$ Mn, AGR (%), CAGR (%))
Table 19 Battery Electric Vehicle (BEV) Market by Region, 2023-2033 (US$ Mn, AGR (%), CAGR (%))
Table 20 Hybrid Electric Vehicle (HEV) Market by Region, 2023-2033 (US$ Mn, AGR (%), CAGR (%))
Table 21 Plug-in Hybrid Electric Vehicle (PHEV) Market by Region, 2023-2033 (US$ Mn, AGR (%), CAGR (%))
Table 22 Fuel Cell Vehicle (FCV) Market by Region, 2023-2033 (US$ Mn, AGR (%), CAGR (%))
Table 23 Other Propulsion Market by Region, 2023-2033 (US$ Mn, AGR (%), CAGR (%))
Table 24 Global Battery Cooling System for EV Market by Method, 2023-2033 (US$ Mn, AGR (%), CAGR (%))
Table 25 Air Cooling Market by Region, 2023-2033 (US$ Mn, AGR (%), CAGR (%))
Table 26 Liquid Cooling Market by Region, 2023-2033 (US$ Mn, AGR (%), CAGR (%))
Table 27 Direct Refrigerant Cooling Market by Region, 2023-2033 (US$ Mn, AGR (%), CAGR (%))
Table 28 Phase Change Material Cooling Market by Region, 2023-2033 (US$ Mn, AGR (%), CAGR (%))
Table 29 Thermoelectric Cooling Market by Region, 2023-2033 (US$ Mn, AGR (%), CAGR (%))
Table 30 Heat Pipe Cooling Market by Region, 2023-2033 (US$ Mn, AGR (%), CAGR (%))
Table 31 Global Battery Cooling System for EV Market Forecast, 2023-2033 (US$ Mn, AGR (%), CAGR (%))
Table 32 Battery Cooling System for EV Market Forecast by Region, 2023-2033 (US$ Million, AGR%, CAGR%)
Table 33 North America Battery Cooling System for EV Market by Value, 2023-2033 (US$ Mn, AGR (%), CAGR (%))
Table 34 North America Battery Cooling System for EV Market by Country, 2023-2033 (US$ Mn, AGR (%), CAGR (%))
Table 35 North America Battery Cooling System for EV Market by Type, 2023-2033 (US$ Mn, AGR (%), CAGR (%))
Table 36 North America Battery Cooling System for EV Market by Vehicle Type, 2023-2033 (US$ Mn, AGR (%), CAGR (%))
Table 37 North America Battery Cooling System for EV Market by Capacity, 2023-2033 (US$ Mn, AGR (%), CAGR (%))
Table 38 North America Battery Cooling System for EV Market by Propulsion, 2023-2033 (US$ Mn, AGR (%), CAGR (%))
Table 39 North America Battery Cooling System for EV Market by Method, 2023-2033 (US$ Mn, AGR (%), CAGR (%))
Table 40 US Battery Cooling System for EV Market by Value, 2023-2033 (US$ Mn, AGR (%), CAGR (%))
Table 41 Canada Battery Cooling System for EV Market by Value, 2023-2033 (US$ Mn, AGR (%), CAGR (%))
Table 42 Europe Battery Cooling System for EV Market by Value, 2023-2033 (US$ Mn, AGR (%), CAGR (%))
Table 43 Europe Battery Cooling System for EV Market by Country, 2023-2033 (US$ Mn, AGR (%), CAGR (%))
Table 44 Europe Battery Cooling System for EV Market by Type, 2023-2033 (US$ Mn, AGR (%), CAGR (%))
Table 45 Europe Battery Cooling System for EV Market by Vehicle Type, 2023-2033 (US$ Mn, AGR (%), CAGR (%))
Table 46 Europe Battery Cooling System for EV Market by Capacity, 2023-2033 (US$ Mn, AGR (%), CAGR (%))
Table 47 Europe Battery Cooling System for EV Market by Propulsion, 2023-2033 (US$ Mn, AGR (%), CAGR (%))
Table 48 Europe Battery Cooling System for EV Market by Method, 2023-2033 (US$ Mn, AGR (%), CAGR (%))
Table 49 Germany Battery Cooling System for EV Market by Value, 2023-2033 (US$ Mn, AGR (%), CAGR (%))
Table 50 UK Battery Cooling System for EV Market by Value, 2023-2033 (US$ Mn, AGR (%), CAGR (%))
Table 51 France Battery Cooling System for EV Market by Value, 2023-2033 (US$ Mn, AGR (%), CAGR (%))
Table 52 Norway Battery Cooling System for EV Market by Value, 2023-2033 (US$ Mn, AGR (%), CAGR (%))
Table 53 Netherlands Battery Cooling System for EV Market by Value, 2023-2033 (US$ Mn, AGR (%), CAGR (%))
Table 54 Rest of Europe Battery Cooling System for EV Market by Value, 2023-2033 (US$ Mn, AGR (%), CAGR (%))
Table 55 Asia-Pacific Battery Cooling System for EV Market by Value, 2023-2033 (US$ Mn, AGR (%), CAGR (%))
Table 56 Asia-Pacific Battery Cooling System for EV Market by Country, 2023-2033 (US$ Mn, AGR (%), CAGR (%))
Table 57 Asia-Pacific Battery Cooling System for EV Market by Type, 2023-2033 (US$ Mn, AGR (%), CAGR (%))
Table 58 Asia-Pacific Battery Cooling System for EV Market by Vehicle Type, 2023-2033 (US$ Mn, AGR (%), CAGR (%))
Table 59 Asia-Pacific Battery Cooling System for EV Market by Capacity, 2023-2033 (US$ Mn, AGR (%), CAGR (%))
Table 60 Asia-Pacific Battery Cooling System for EV Market by Propulsion, 2023-2033 (US$ Mn, AGR (%), CAGR (%))
Table 61 Asia-Pacific Battery Cooling System for EV Market by Method, 2023-2033 (US$ Mn, AGR (%), CAGR (%))
Table 62 China Battery Cooling System for EV Market by Value, 2023-2033 (US$ Mn, AGR (%), CAGR (%))
Table 63 India Battery Cooling System for EV Market by Value, 2023-2033 (US$ Mn, AGR (%), CAGR (%))
Table 64 Japan Battery Cooling System for EV Market by Value, 2023-2033 (US$ Mn, AGR (%), CAGR (%))
Table 65 South Korea Battery Cooling System for EV Market by Value, 2023-2033 (US$ Mn, AGR (%), CAGR (%))
Table 66 Australia Battery Cooling System for EV Market by Value, 2023-2033 (US$ Mn, AGR (%), CAGR (%))
Table 67 Rest of Asia-Pacific Battery Cooling System for EV Market by Value, 2023-2033 (US$ Mn, AGR (%), CAGR (%))
Table 68 Middle East & Africa Battery Cooling System for EV Market by Value, 2023-2033 (US$ Mn, AGR (%), CAGR (%))
Table 69 Middle East & Africa Battery Cooling System for EV Market by Country, 2023-2033 (US$ Mn, AGR (%), CAGR (%))
Table 70 Middle East & Africa Battery Cooling System for EV Market by Type, 2023-2033 (US$ Mn, AGR (%), CAGR (%))
Table 71 Middle East & Africa Battery Cooling System for EV Market by Vehicle Type, 2023-2033 (US$ Mn, AGR (%), CAGR (%))
Table 72 Middle East & Africa Battery Cooling System for EV Market by Capacity, 2023-2033 (US$ Mn, AGR (%), CAGR (%))
Table 73 Middle East & Africa Battery Cooling System for EV Market by Propulsion, 2023-2033 (US$ Mn, AGR (%), CAGR (%))
Table 74 Middle East & Africa Battery Cooling System for EV Market by Method, 2023-2033 (US$ Mn, AGR (%), CAGR (%))
Table 75 GCC Battery Cooling System for EV Market by Value, 2023-2033 (US$ Mn, AGR (%), CAGR (%))
Table 76 South Africa Battery Cooling System for EV Market by Value, 2023-2033 (US$ Mn, AGR (%), CAGR (%))
Table 77 Rest of Middle East & Africa Battery Cooling System for EV Market by Value, 2023-2033 (US$ Mn, AGR (%), CAGR (%))
Table 78 Latin America Battery Cooling System for EV Market by Value, 2023-2033 (US$ Mn, AGR (%), CAGR (%))
Table 79 Latin America Battery Cooling System for EV Market by Country, 2023-2033 (US$ Mn, AGR (%), CAGR (%))
Table 80 Latin America Battery Cooling System for EV Market by Type, 2023-2033 (US$ Mn, AGR (%), CAGR (%))
Table 81 Latin America Battery Cooling System for EV Market by Vehicle Type, 2023-2033 (US$ Mn, AGR (%), CAGR (%))
Table 82 Latin America Battery Cooling System for EV Market by Capacity, 2023-2033 (US$ Mn, AGR (%), CAGR (%))
Table 83 Latin America Battery Cooling System for EV Market by Propulsion, 2023-2033 (US$ Mn, AGR (%), CAGR (%))
Table 84 Brazil Battery Cooling System for EV Market by Value, 2023-2033 (US$ Mn, AGR (%), CAGR (%))
Table 85 Mexico Battery Cooling System for EV Market by Value, 2023-2033 (US$ Mn, AGR (%), CAGR (%))
Table 86 Rest of Latin America Battery Cooling System for EV Market by Value, 2023-2033 (US$ Mn, AGR (%), CAGR (%))
Table 87 Strategic Outlook - Contract
Table 88 LG Chem Ltd: Key Details, (CEO, HQ, Revenue, Founded, No. of Employees, Company Type, Website, Business Segment)
Table 89 LG Chem Ltd: Product Benchmarking
Table 90 LG Chem Ltd: Strategic Outlook
Table 91 Continental AG: Key Details, (CEO, HQ, Revenue, Founded, No. of Employees, Company Type, Website, Business Segment)
Table 92 Continental AG: Product Benchmarking
Table 93 Continental AG: Strategic Outlook
Table 94 Gentherm Incorporated: Key Details, (CEO, HQ, Revenue, Founded, No. of Employees, Company Type, Website, Business Segment)
Table 95 Gentherm Incorporated: Product Benchmarking
Table 96 Gentherm Incorporated: Strategic Outlook
Table 97 Robert Bosch GmbH: Key Details, (CEO, HQ, Revenue, Founded, No. of Employees, Company Type, Website, Business Segment)
Table 98 Robert Bosch GmbH: Product Benchmarking
Table 99 Robert Bosch GmbH: Strategic Outlook
Table 100 Valeo S.A: Key Details, (CEO, HQ, Revenue, Founded, No. of Employees, Company Type, Website, Business Segment)
Table 101 Valeo S.A: Product Benchmarking
Table 102 Valeo S.A: Strategic Outlook
Table 103 Marelli Holdings, Co., Ltd.: Key Details, (CEO, HQ, Revenue, Founded, No. of Employees, Company Type, Website, Business Segment)
Table 104 Marelli Holdings, Co., Ltd.: Product Benchmarking
Table 105 Marelli Holdings, Co., Ltd.: Strategic Outlook
Table 106 Dana Incorporated: Key Details, (CEO, HQ, Revenue, Founded, No. of Employees, Company Type, Website, Business Segment)
Table 107 Dana Incorporated: Product Benchmarking
Table 108 Samsung SDI Co., Ltd: Key Details, (CEO, HQ, Revenue, Founded, No. of Employees, Company Type, Website, Business Segment)
Table 109 Samsung SDI Co., Ltd: Product Benchmarking
Table 110 Samsung SDI Co., Ltd: Strategic Outlook
Table 111 MAHLE GmbH:Key Details, (CEO, HQ, Revenue, Founded, No. of Employees, Company Type, Website, Business Segment)
Table 112 MAHLE GmbH: Strategic Outlook
Table 113 Voss Automotive: Key Details, (CEO, HQ, Revenue, Founded, No. of Employees, Company Type, Website, Business Segment)
Table 114 Voss Automotive: Product Benchmarking
Table 115 Voss Automotive: Strategic Outlook
Table 116 CapTherm Systems Inc.:Key Details, (CEO, HQ, Revenue, Founded, No. of Employees, Company Type, Website, Business Segment)
Table 117 CapTherm Systems Inc.: Product Benchmarking
Table 118 BorgWarner Inc.: Key Details, (CEO, HQ, Revenue, Founded, No. of Employees, Company Type, Website, Business Segment)
Table 119 BorgWarner Inc: Product Benchmarking
Table 120 BorgWarner Inc: Strategic Outlook
Table 121 Denso Corporation: Key Details, (CEO, HQ, Revenue, Founded, No. of Employees, Company Type, Website, Business Segment)
Table 122 Denso Corporation: Product Benchmarking
Table 123 Webasto SE: Key Details, (CEO, HQ, Revenue, Founded, No. of Employees, Company Type, Website, Business Segment)
Table 124 Webasto SE : Product Benchmarking
Table 125 Webasto SE : Strategic Outlook
Table 126 Koolance, Inc.:Key Details, (CEO, HQ, Revenue, Founded, No. of Employees, Company Type, Website, Business Segment)
Table 127 Koolance, Inc.: Product Benchmarking
Table 128 Koolance, Inc.: Strategic Outlook
List of Figures
Figure 1 Battery Cooling System for EV Market Segmentation
Figure 2 Battery Cooling System for EV Market by Battery Type: Market Attractiveness Index
Figure 3 Battery Cooling System for EV Market by Vehicle Type: Market Attractiveness Index
Figure 4 Battery Cooling System for EV Market by Battery Capacity: Market Attractiveness Index
Figure 5 Battery Cooling System for EV Market by Propulsion: Market Attractiveness Index
Figure 6 Battery Cooling System for EV Market by Method: Market Attractiveness Index
Figure 7 Battery Cooling System for EV Market Attractiveness Index by Region
Figure 8 Battery Cooling System for EV Market: Market Dynamics
Figure 9 Battery Cooling System for EV Market: Porter’s Five Forces Analysis
Figure 10 Global Battery Cooling System for EV Market Share Forecast by COVID, 2023-2033 (%)
Figure 11 Global Battery Cooling System for EV Market by Region, 2023-2033 (US$ Mn, AGR (%)) (V-Shaped Recovery Scenario)
Figure 12 Global Battery Cooling System for EV Market by Region, 2023-2033 (US$ Mn, AGR (%)) (U-Shaped Recovery Scenario)
Figure 13 Global Battery Cooling System for EV Market by Region, 2023-2033 (US$ Mn, AGR (%)) (W-Shaped Recovery Scenario)
Figure 14 Global Battery Cooling System for EV Market by Region, 2023-2033 (US$ Mn, AGR (%)) (L-Shaped Recovery Scenario)
Figure 15 Battery Cooling System for EV Market: PEST Analysis
Figure 16 Battery Cooling System for EV Market by Battery Type: Market Attractiveness Index
Figure 17 Global Battery Cooling System for EV Market by Type, 2023-2033 (US$ Mn, AGR (%))
Figure 18 Battery Cooling System for EV Market Share Forecast by Battery Type, 2023, 2028, 2033 (%)
Figure 19 Conventional Batteries Market by Region, 2023-2033 (US$ Mn, AGR (%))
Figure 20 Conventional Batteries Market Share Forecast by Region, 2023 & 2033 (%)
Figure 21 Solid-State Batteries Market by Region, 2023-2033 (US$ Mn, AGR (%))
Figure 22 Solid-State Batteries Market Share Forecast by Region, 2023 & 2033 (%)
Figure 23 Battery Cooling System for EV Market by Vehicle Type: Market Attractiveness Index
Figure 24 Global Battery Cooling System for EV Market by Vehicle Type, 2023-2033 (US$ Mn, AGR (%))
Figure 25 Battery Cooling System for EV Market Share Forecast by Vehicle Type, 2023, 2028, 2033 (%)
Figure 26 Passenger Vehicle Market by Region, 2023-2033 (US$ Mn, AGR (%))
Figure 27 Passenger Vehicle Market Share Forecast by Region, 2023 & 2033 (%)
Figure 28 Commercial Vehicle Market by Region, 2023-2033 (US$ Mn, AGR (%))
Figure 29 Commercial Vehicle Market Share Forecast by Region, 2023 & 2033 (%)
Figure 30 Other Vehicle Type Market by Region, 2023-2033 (US$ Mn, AGR (%))
Figure 31 Other Vehicle Type Market Share Forecast by Region, 2023 & 2033 (%)
Figure 32 Battery Cooling System for EV Market by Battery Capacity: Market Attractiveness Index
Figure 33 Global Battery Cooling System for EV Market by Capacity, 2023-2033 (US$ Mn, AGR (%))
Figure 34 Battery Cooling System for EV Market Share Forecast by Battery Capacity, 2023, 2028, 2033 (%)
Figure 35 100 kWh Market by Region, 2023-2033 (US$ Mn, AGR (%))
Figure 36 500 kWh Market by Region, 2023-2033 (US$ Mn, AGR (%))
Figure 42 >500 kWh Market Share Forecast by Region, 2023 & 2033 (%)
Figure 43 Battery Cooling System for EV Market by Propulsion: Market Attractiveness Index
Figure 44 Global Battery Cooling System for EV Market by Propulsion, 2023-2033 (US$ Mn, AGR (%))
Figure 45 Battery Cooling System for EV Market Share Forecast by Propulsion, 2023, 2028, 2033 (%)
Figure 46 Battery Electric Vehicle (BEV) Market by Region, 2023-2033 (US$ Mn, AGR (%))
Figure 47 Battery Electric Vehicle (BEV) Market Share Forecast by Region, 2023 & 2033 (%)
Figure 48 Hybrid Electric Vehicle (HEV) Market by Region, 2023-2033 (US$ Mn, AGR (%))
Figure 49 Hybrid Electric Vehicle (HEV) Market Share Forecast by Region, 2023 & 2033 (%)
Figure 50 Plug-in Hybrid Electric Vehicle (PHEV) Market by Region, 2023-2033 (US$ Mn, AGR (%))
Figure 51 Plug-in Hybrid Electric Vehicle (PHEV) Market Share Forecast by Region, 2023 & 2033 (%)
Figure 52 Fuel Cell Vehicle (FCV) Market by Region, 2023-2033 (US$ Mn, AGR (%))
Figure 53 Fuel Cell Vehicle (FCV) Market Share Forecast by Region, 2023 & 2033 (%)
Figure 54 Other Propulsion Market by Region, 2023-2033 (US$ Mn, AGR (%))
Figure 55 Other Propulsion Market Share Forecast by Region, 2023 & 2033 (%)
Figure 56 Battery Cooling System for EV Market by Method: Market Attractiveness Index
Figure 57 Global Battery Cooling System for EV Market by Method, 2023-2033 (US$ Mn, AGR (%))
Figure 58 Battery Cooling System for EV Market Share Forecast by Method, 2023, 2028, 2033 (%)
Figure 59 Air Cooling Market by Region, 2023-2033 (US$ Mn, AGR (%))
Figure 60 Air Cooling Market Share Forecast by Region, 2023 & 2033 (%)
Figure 61 Liquid Cooling Market by Region, 2023-2033 (US$ Mn, AGR (%))
Figure 62 Liquid Cooling Market Share Forecast by Region, 2023 & 2033 (%)
Figure 63 Direct Refrigerant Cooling Market by Region, 2023-2033 (US$ Mn, AGR (%))
Figure 64 Direct Refrigerant Cooling Market Share Forecast by Region, 2023 & 2033 (%)
Figure 65 Phase Change Material Cooling Market by Region, 2023-2033 (US$ Mn, AGR (%))
Figure 66 Phase Change Material Cooling Market Share Forecast by Region, 2023 & 2033 (%)
Figure 67 Thermoelectric Cooling Market by Region, 2023-2033 (US$ Mn, AGR (%))
Figure 68 Thermoelectric Cooling Market Share Forecast by Region, 2023 & 2033 (%)
Figure 69 Heat Pipe Cooling Market by Region, 2023-2033 (US$ Mn, AGR (%))
Figure 70 Heat Pipe Cooling Market Share Forecast by Region, 2023 & 2033 (%)
Figure 71 Battery Cooling System for EV Market Forecast by Region 2023 and 2033 (Revenue, CAGR%)
Figure 72 Global Battery Cooling System for EV Market Forecast, 2023-2033 (US$ Mn, AGR (%))
Figure 73 Battery Cooling System for EV Market Share Forecast by Region 2023, 2028, 2033 (%)
Figure 74 Battery Cooling System for EV Market by Region, 2023-2033 (US$ Million, AGR %)
Figure 75 North America Battery Cooling System for EV Market Attractiveness Index
Figure 76 North America Battery Cooling System for EV Market by Region, 2023, 2028 & 2033 (US$ Million)
Figure 77 North America Battery Cooling System for EV Market by Value, 2023-2033 (US$ Mn, AGR (%))
Figure 78 North America Battery Cooling System for EV Market by Country, 2023-2033 (US$ Mn, AGR (%))
Figure 79 North America Battery Cooling System for EV Market Share Forecast by Country, 2023 & 2033 (%)
Figure 80 North America Battery Cooling System for EV Market by Type, 2023-2033 (US$ Mn, AGR (%))
Figure 81 North America Battery Cooling System for EV Market Share Forecast Battery Type, 2023 & 2033 (%)
Figure 82 North America Battery Cooling System for EV Market by Vehicle Type, 2023-2033 (US$ Mn, AGR (%))
Figure 83 North America Battery Cooling System for EV Market Share Forecast by Vehicle Type, 2023 & 2033 (%)
Figure 84 North America Battery Cooling System for EV Market by Capacity, 2023-2033 (US$ Mn, AGR (%))
Figure 85 North America Battery Cooling System for EV Market Share Forecast by Battery Capacity, 2023 & 2033 (%)
Figure 86 North America Battery Cooling System for EV Market by Propulsion, 2023-2033 (US$ Mn, AGR (%))
Figure 87 North America Battery Cooling System for EV Market Share Forecast by Propulsion, 2023 & 2033 (%)
Figure 88 North America Battery Cooling System for EV Market by Method, 2023-2033 (US$ Mn, AGR (%))
Figure 89 North America Battery Cooling System for EV Market Share Forecast by Method, 2023 & 2033 (%)
Figure 90 US Battery Cooling System for EV Market by Value, 2023-2033 (US$ Mn, AGR (%))
Figure 91 Canada Battery Cooling System for EV Market by Value, 2023-2033 (US$ Mn, AGR (%))
Figure 92 Europe Battery Cooling System for EV Market Attractiveness Index
Figure 93 Europe Battery Cooling System for EV Market by Region, 2023, 2028 & 2033 (US$ Million)
Figure 94 Europe Battery Cooling System for EV Market by Value, 2023-2033 (US$ Mn, AGR (%))
Figure 95 Europe Battery Cooling System for EV Market by Country, 2023-2033 (US$ Mn, AGR (%))
Figure 96 Europe Battery Cooling System for EV Market Share Forecast by Country, 2023 & 2033 (%)
Figure 97 Europe Battery Cooling System for EV Market by Type, 2023-2033 (US$ Mn, AGR (%))
Figure 98 Europe Battery Cooling System for EV Market Share Forecast Battery Type, 2023 & 2033 (%)
Figure 99 Europe Battery Cooling System for EV Market by Vehicle Type, 2023-2033 (US$ Mn, AGR (%))
Figure 100 Europe Battery Cooling System for EV Market Share Forecast by Vehicle Type, 2023 & 2033 (%)
Figure 101 Europe Battery Cooling System for EV Market by Capacity, 2023-2033 (US$ Mn, AGR (%))
Figure 102 Europe Battery Cooling System for EV Market Share Forecast by Battery Capacity, 2023 & 2033 (%)
Figure 103 Europe Battery Cooling System for EV Market by Propulsion, 2023-2033 (US$ Mn, AGR (%))
Figure 104 Europe Battery Cooling System for EV Market Share Forecast by Propulsion, 2023 & 2033 (%)
Figure 105 Europe Battery Cooling System for EV Market by Method, 2023-2033 (US$ Mn, AGR (%))
Figure 106 Europe Battery Cooling System for EV Market Share Forecast by Method, 2023 & 2033 (%)
Figure 107 Germany Battery Cooling System for EV Market by Value, 2023-2033 (US$ Mn, AGR (%))
Figure 108 UK Battery Cooling System for EV Market by Value, 2023-2033 (US$ Mn, AGR (%))
Figure 109 France Battery Cooling System for EV Market by Value, 2023-2033 (US$ Mn, AGR (%))
Figure 110 Norway Battery Cooling System for EV Market by Value, 2023-2033 (US$ Mn, AGR (%))
Figure 111 Netherlands Battery Cooling System for EV Market by Value, 2023-2033 (US$ Mn, AGR (%))
Figure 112 Rest of Europe Battery Cooling System for EV Market by Value, 2023-2033 (US$ Mn, AGR (%))
Figure 113 Asia-Pacific Battery Cooling System for EV Market Attractiveness Index
Figure 114 Asia-Pacific Battery Cooling System for EV Market by Region, 2023, 2028 & 2033 (US$ Million)
Figure 115 Asia-Pacific Battery Cooling System for EV Market by Value, 2023-2033 (US$ Mn, AGR (%))
Figure 116 Asia-Pacific Battery Cooling System for EV Market by Country, 2023-2033 (US$ Mn, AGR (%))
Figure 117 Asia-Pacific Battery Cooling System for EV Market Share Forecast by Country, 2023 & 2033 (%)
Figure 118 Asia-Pacific Battery Cooling System for EV Market by Type, 2023-2033 (US$ Mn, AGR (%))
Figure 119 Asia-Pacific Battery Cooling System for EV Market Share Forecast Battery Type, 2023 & 2033 (%)
Figure 120 Asia-Pacific Battery Cooling System for EV Market by Vehicle Type, 2023-2033 (US$ Mn, AGR (%))
Figure 121 Asia-Pacific Battery Cooling System for EV Market Share Forecast by Vehicle Type, 2023 & 2033 (%)
Figure 122 Asia-Pacific Battery Cooling System for EV Market by Capacity, 2023-2033 (US$ Mn, AGR (%))
Figure 123 Asia-Pacific Battery Cooling System for EV Market Share Forecast by Battery Capacity, 2023 & 2033 (%)
Figure 124 Asia-Pacific Battery Cooling System for EV Market by Propulsion, 2023-2033 (US$ Mn, AGR (%))
Figure 125 Asia-Pacific Battery Cooling System for EV Market Share Forecast by Propulsion, 2023 & 2033 (%)
Figure 126 Asia-Pacific Battery Cooling System for EV Market by Method, 2023-2033 (US$ Mn, AGR (%))
Figure 127 Asia-Pacific Battery Cooling System for EV Market Share Forecast by Method, 2023 & 2033 (%)
Figure 128 China Battery Cooling System for EV Market by Value, 2023-2033 (US$ Mn, AGR (%))
Figure 129 India Battery Cooling System for EV Market by Value, 2023-2033 (US$ Mn, AGR (%))
Figure 130 Japan Battery Cooling System for EV Market by Value, 2023-2033 (US$ Mn, AGR (%))
Figure 131 South Korea Battery Cooling System for EV Market by Value, 2023-2033 (US$ Mn, AGR (%))
Figure 132 Australia Battery Cooling System for EV Market by Value, 2023-2033 (US$ Mn, AGR (%))
Figure 133 Rest of Asia-Pacific Battery Cooling System for EV Market by Value, 2023-2033 (US$ Mn, AGR (%))
Figure 134 Middle East and Africa Battery Cooling System for EV Market Attractiveness Index
Figure 135 Middle East and Africa Battery Cooling System for EV Market by Region, 2023, 2028 & 2033 (US$ Million)
Figure 136 Middle East & Africa Battery Cooling System for EV Market by Value, 2023-2033 (US$ Mn, AGR (%))
Figure 137 Middle East & Africa Battery Cooling System for EV Market by Country, 2023-2033 (US$ Mn, AGR (%))
Figure 138 Middle East and Africa Battery Cooling System for EV Market Share Forecast by Country, 2023 & 2033 (%)
Figure 139 Middle East & Africa Battery Cooling System for EV Market by Type, 2023-2033 (US$ Mn, AGR (%))
Figure 140 Middle East and Africa Battery Cooling System for EV Market Share Forecast Battery Type, 2023 & 2033 (%)
Figure 141 Middle East & Africa Battery Cooling System for EV Market by Vehicle Type, 2023-2033 (US$ Mn, AGR (%))
Figure 142 Middle East and Africa Battery Cooling System for EV Market Share Forecast by Vehicle Type, 2023 & 2033 (%)
Figure 143 Middle East & Africa Battery Cooling System for EV Market by Capacity, 2023-2033 (US$ Mn, AGR (%))
Figure 144 Middle East and Africa Battery Cooling System for EV Market Share Forecast by Battery Capacity, 2023 & 2033 (%)
Figure 145 Middle East & Africa Battery Cooling System for EV Market by Propulsion, 2023-2033 (US$ Mn, AGR (%))
Figure 146 Middle East and Africa Battery Cooling System for EV Market Share Forecast by Propulsion, 2023 & 2033 (%)
Figure 147 Middle East & Africa Battery Cooling System for EV Market by Method, 2023-2033 (US$ Mn, AGR (%))
Figure 148 Middle East and Africa Battery Cooling System for EV Market Share Forecast by Method, 2023 & 2033 (%)
Figure 149 GCC Battery Cooling System for EV Market by Value, 2023-2033 (US$ Mn, AGR (%))
Figure 150 South Africa Battery Cooling System for EV Market by Value, 2023-2033 (US$ Mn, AGR (%))
Figure 151 Rest of Middle East & Africa Battery Cooling System for EV Market by Value, 2023-2033 (US$ Mn, AGR (%))
Figure 152 Latin America Battery Cooling System for EV Market Attractiveness Index
Figure 153 Latin America Battery Cooling System for EV Market by Region, 2023, 2028 & 2033 (US$ Million)
Figure 154 Latin America Battery Cooling System for EV Market by Value, 2023-2033 (US$ Mn, AGR (%))
Figure 155 Latin America Battery Cooling System for EV Market by Country, 2023-2033 (US$ Mn, AGR (%))
Figure 156 Latin America Battery Cooling System for EV Market Share Forecast by Country, 2023 & 2033 (%)
Figure 157 Latin America Battery Cooling System for EV Market by Type, 2023-2033 (US$ Mn, AGR (%))
Figure 158 Latin America Battery Cooling System for EV Market Share Forecast Battery Type, 2023 & 2033 (%)
Figure 159 Latin America Battery Cooling System for EV Market by Vehicle Type, 2023-2033 (US$ Mn, AGR (%))
Figure 160 Latin America Battery Cooling System for EV Market Share Forecast by Vehicle Type, 2023 & 2033 (%)
Figure 161 Latin America Battery Cooling System for EV Market by Capacity, 2023-2033 (US$ Mn, AGR (%))
Figure 162 Latin America Battery Cooling System for EV Market Share Forecast by Battery Capacity, 2023 & 2033 (%)
Figure 163 Latin America Battery Cooling System for EV Market by Propulsion, 2023-2033 (US$ Mn, AGR (%))
Figure 164 Latin America Battery Cooling System for EV Market Share Forecast by Propulsion, 2023 & 2033 (%)
Figure 165 Latin America Battery Cooling System for EV Market Share Forecast by Method, 2023 & 2033 (%)
Figure 166 Brazil Battery Cooling System for EV Market by Value, 2023-2033 (US$ Mn, AGR (%))
Figure 167 Mexico Battery Cooling System for EV Market by Value, 2023-2033 (US$ Mn, AGR (%))
Figure 168 Rest of Latin America Battery Cooling System for EV Market by Value, 2023-2033 (US$ Mn, AGR (%))
Figure 169 Battery Cooling System for EV Market: Company Share, 2022
Figure 170 LG Chem Ltd.: Net Revenue, 2018-2022 (US$ Million, AGR%)
Figure 171 LG Chem Ltd.: R&D, 2018-2022 (US$ Million, AGR%)
Figure 172 LG Chem Ltd.: Regional Revenue Share, 2022 (%)
Figure 173 LG Chem Ltd.: Business Segment Revenue Share, 2022 (%)
Figure 174 Continental AG.: Net Revenue, 2018-2022 (US$ Million, AGR%)
Figure 175 Continental AG.: R&D, 2018-2022 (US$ Million, AGR%)
Figure 176 Continental AG.: Regional Revenue Share, 2022 (%)
Figure 177 Continental AG.: Business Segment Revenue Share, 2022 (%)
Figure 178 Gentherm Incorporated.: Net Revenue, 2018-2022 (US$ Million, AGR%)
Figure 179 Gentherm Incorporated.: R&D, 2018-2022 (US$ Million, AGR%)
Figure 180 Gentherm Incorporated.: Regional Revenue Share, 2022 (%)
Figure 181 Gentherm Incorporated.: Business Segment Revenue Share, 2022 (%)
Figure 182 Valeo S.A.: Net Revenue, 2018-2022 (US$ Million, AGR%)
Figure 183 Valeo S.A.: R&D, 2018-2022 (US$ Million, AGR%)
Figure 184 Valeo S.A.: Business Segment Revenue Share, 2022 (%)
Figure 185 Dana Incorporated.: Net Revenue, 2018-2022 (US$ Million, AGR%)
Figure 186 Dana Incorporated.: R&D, 2018-2022 (US$ Million, AGR%)
Figure 187 Dana Incorporated.: Regional Revenue Share, 2022 (%)
Figure 188 Dana Incorporated.: Business Segment Revenue Share, 2022 (%)
Figure 189 Samsung SDI Co., Ltd.: Net Revenue, 2018-2022 (US$ Million, AGR%)
Figure 190 Samsung SDI Co., Ltd.: R&D, 2018-2022 (US$ Million, AGR%)
Figure 191 Samsung SDI Co., Ltd.: Regional Revenue Share, 2021 (%)
Figure 192 Samsung SDI Co., Ltd.: Business Segment Revenue Share, 2021 (%)
Figure 193 BorgWarner Inc.: Net Revenue, 2018-2022 (US$ Million, AGR%)
Figure 194 BorgWarner Inc.: R&D, 2018-2022 (US$ Million, AGR%)
Figure 195 Denso Corporation.: Net Revenue, 2018-2022 (US$ Million, AGR%)
ページTOPに戻る
よくあるご質問
Visiongain社はどのような調査会社ですか?
英国の調査会社ヴィジョンゲイン社(Visiongain)は、通信とエネルギーのほか、自動車や化学・医薬品、金属など、広範な市場を対象に調査を行っています。自動車市場については、市場全般に関する調査のほ... もっと見る
調査レポートの納品までの日数はどの程度ですか?
在庫のあるものは速納となりますが、平均的には 3-4日と見て下さい。
但し、一部の調査レポートでは、発注を受けた段階で内容更新をして納品をする場合もあります。
発注をする前のお問合せをお願いします。
注文の手続きはどのようになっていますか?
1)お客様からの御問い合わせをいただきます。
2)見積書やサンプルの提示をいたします。
3)お客様指定、もしくは弊社の発注書をメール添付にて発送してください。
4)データリソース社からレポート発行元の調査会社へ納品手配します。
5) 調査会社からお客様へ納品されます。最近は、pdfにてのメール納品が大半です。
お支払方法の方法はどのようになっていますか?
納品と同時にデータリソース社よりお客様へ請求書(必要に応じて納品書も)を発送いたします。
お客様よりデータリソース社へ(通常は円払い)の御振り込みをお願いします。
請求書は、納品日の日付で発行しますので、翌月最終営業日までの当社指定口座への振込みをお願いします。振込み手数料は御社負担にてお願いします。
お客様の御支払い条件が60日以上の場合は御相談ください。
尚、初めてのお取引先や個人の場合、前払いをお願いすることもあります。ご了承のほど、お願いします。
データリソース社はどのような会社ですか?
当社は、世界各国の主要調査会社・レポート出版社と提携し、世界各国の市場調査レポートや技術動向レポートなどを日本国内の企業・公官庁及び教育研究機関に提供しております。
世界各国の「市場・技術・法規制などの」実情を調査・収集される時には、データリソース社にご相談ください。
お客様の御要望にあったデータや情報を抽出する為のレポート紹介や調査のアドバイスも致します。
|
|


