自動車電動化市場レポート:2022-2032
Auto Electrification Market Report 2022-2032
レポート詳細
自動車電動化市場レポート 2022-2032 :本レポートは、新たな収益の柱を目指すリーディングカンパニーが、業界とその背景にあるダイナミクスをより深く理解する上で、非常に有益なものと... もっと見る
※上記価格は部署ライセンス(Departmental licence)価格です。
その他の価格についてはデータリソースまでお問合せください。
日本語のページは自動翻訳を利用し作成しています。
実際のレポートは英文のみでご納品いたします。

|

|
サマリー
レポート詳細
自動車電動化市場レポート 2022-2032:本レポートは、新たな収益の柱を目指すリーディングカンパニーが、業界とその背景にあるダイナミクスをより深く理解する上で、非常に有益なものとなるでしょう。また、異業種への進出や新地域での既存事業の拡大を目指す企業にとっても有用なレポートです。
低燃費モビリティの増加、48V設計の需要増加、KWHあたりの電池価格の低下などが市場成長を促進
技術革新の面では、自動車産業は近年大きな変貌を遂げています。出力効率と軽量の特性を持つ電気部品は、増加する消費者ニーズに対応するため、OEMメーカーによって採用され、自動車の電動化は燃費の良い選択肢となっています。さらに、自動車の排ガスは健康や環境に影響を与える有害な温室効果ガスを排出するため、これは重要な問題である。そのため、世界各国の政府は、温室効果ガスの排出を制限するために自動車の排気ガス規制を実施しています。メーカーが排ガスレベルを規制する場合は、これらのルールに従わなければなりません。また、エンドユーザー/ドライバーは、運転体験を向上させるために、技術的に改良された電気システムやコンポーネントを求めています。
自動車の生産・販売台数の減少
この2年間、業界全体の成長が鈍化し、自動車の生産台数と販売台数が減少しました。これは、自動車生産基準の変更、排ガスや安全性に関する政府の法律の曖昧さによる自動車購入に対する国民の信頼の低下などが主な原因であり、これらはいずれも自動車のコストを押し上げる要因となっています。
マーケットリサーチレポートを購入する前に、どのような質問をすべきでしょうか?
- 自動車電動化市場はどのように進化しているのか?
- 自動車電動化市場の推進要因と抑制要因は何か?
- 各自動車電化サブマーケットセグメントは予測期間中にどのように成長し、2032年にどれだけの収益を占めるようになるのか?
- 2022年から2032年にかけて、各自動車電動化サブ市場の市場シェアはどのように推移するのか?
- 2022年から2032年にかけて、市場全体の主なドライバーは何になるのか?
- 主要な自動車電動化市場はマクロ経済のダイナミクスに概ね追随するのか、それとも個々の国別市場が他を凌駕するのか?
- 2032年までに各国市場のシェアはどのように変化し、どの地域が2032年の市場をリードするのか?
- 主要プレイヤーは誰か、また予測期間中の展望は?
- これらの主要企業の自動車電動化プロジェクトはどのようなものか?
- 2022年から2032年の間に、業界はどのように進化するのか?現在および今後10年間に実施される自動車電動化プロジェクトにはどのような意味があるのか?
- 自動車電動化市場の規模をさらに拡大するために、製品の商業化の必要性が高まっているのか?
- 自動車電動化市場の方向性と、市場の最前線に立つためにはどうすればよいか?
- 新製品・新サービスへの最適な投資方法とは?
- 企業を新たな成長軌道に乗せ、C-suiteに移行させるための重要な展望とは?
このことが、現在、そして今後10年間の自動車電動化市場にどのような影響を与えるかを知る必要があります。
- 290ページにわたる本レポートでは、125の表と198のグラフを独占的に提供します。
- このレポートでは、業界における主要な収益性の高い分野に焦点を当て、お客様が今すぐターゲットとできるような情報を提供しています。
- 世界、地域、国別の売上高と成長率を詳細に分析しています。
- 競合他社が成功した主なトレンド、変化、収益予測をハイライトしています。
本レポートは、自動車電動化市場が今後10年間にどのように発展し、COVID-19の景気後退と回復の変動に沿うものであるかを今日あなたに教えてくれます。この市場は、過去10年間のどの時点よりも今が重要なのです。
レポートでは、COVID-19のバリエーションや経済データなど、お客様の市場に特化した独自の情報をお届けしています。
2032年までの予測やその他の分析により、商業的な展望が見えてくる
- 2032年までの収益予測に加え、直近の実績、成長率、市場シェアもご覧いただけます。
- ビジネスの展望や展開など、独自の分析もご覧いただけます。
- 定性的分析(市場力学、ドライバー、機会、阻害要因、課題など)、コスト構造、自動車電動化価格上昇の影響、最近の動向などをご覧いただけます。
本レポートでは、COVID-19が業界と貴社にどのような影響を及ぼすかについて、データ分析と貴重な洞察を掲載しています。本レポートでは、COVID-19の4つの回収パターンとその影響、すなわち「V」、「L」、「W」、「U」について論じています。
報告書の対象セグメント
製品タイプ
- スターターモーター
- オルタネーター
- 電気自動車用モーター
- 電動ウォーターポンプ
- 電動オイルポンプ
- 電動バキュームポンプ
- 電動フューエルポンプ
- 電動パワーステアリング
- アクチュエータ
- スタート/ストップシステム
販売チャネル
- OEM
- アフターマーケット
車両タイプ
- 内燃機関自動車
- マイクロ&フルハイブリッド
- プラグインハイブリッド車(PHEV)&バッテリー電気自動車(BEV)
世界市場全体とセグメントの収益予測に加え、5つの地域と17の主要国市場の収益予測も掲載しています。
北米
- 米国
- カナダ
欧州
- ドイツ
- 英国
- フランス
- イタリア
- スペイン
- ロシア
- その他の欧州地域
アジア太平洋
- 日本
- 中国
- インド
- インドネシア
- 韓国
- その他のアジア太平洋地域
ラテンアメリカ
- ブラジル
- メキシコ
- その他のラテンアメリカ地域
MEA
- GCC
- 南アフリカ
- その他のMEA地域
自動車電動化市場の主要企業のプロファイルと2022年から2032年まで、これらの企業の事業のこのセグメントに焦点を当て、含まれています。
主要企業と市場成長の可能性
・ Aisin Seiki Co., Ltd.,
・ BorgWarner Inc.,
・ Robert Bosch GmbH
・ Continental AG
・ Denso Corporation
・ ZF Friedrichshafen AG
・ Johnson Electric Holdings Limited
・ Magna International Inc.,
・ Mitsubishi Electric Corporation
・ Valeo SA
・ Schaeffler AG
・ Mahle GmbH
・ American Axle & Manufacturing, Inc.,
・ JTEKT Corporation
自動車電動化市場の世界全体収益、2022年から2032年まで(金額ベース)は2022年に896億米ドルを超えると弊社は算出しています。また、2032年までの間に収益が大きく伸びると予測している。本調査では、最も大きな可能性を秘めた企業を特定しました。彼らの能力、進歩、商業的展望を知ることで、一歩先を行くことができます。
自動車の電動化市場、2022年から2032年までのレポートはどのように役立つのでしょうか?
要約すると、290ページにわたるレポートでは、以下のような知識を得ることができます。
- 自動車電動化市場の2032年までの収益予測、プロセス、上流、下流、タイプ、企業規模の各予測を世界と地域レベルで掲載 - 産業の展望を見出し、投資と収益に最も有利な場所を見つける。
- 5つの地域と17の主要国市場の2032年までの収益予測 - 北米、欧州、アジア太平洋、LAMEAの自動車電動化市場、2022年から2032年までの市場予測をご覧いただけます。また、米国、カナダ、ドイツ、フランス、英国、イタリア、中国、インド、日本、メキシコ、ブラジル、インドネシアなど、主要経済圏の市場も予測しています。
- 既存企業および市場参入を目指す企業の展望 - 自動車電化市場に関わる主要企業14社の企業プロファイルを含む、2022年から2032年までの展望。
定量的・定性的な分析と独自の予測をご覧いただけます。私たちのレポートだけが持つ情報を入手し、貴重なビジネスインテリジェンスを得ることができます。
他にはない情報
私たちの新しいレポートがあれば、知識の遅れを取り戻し、機会を逃す可能性が低くなります。私たちの研究が貴社の調査、分析、意思決定にどのように役立つかをご覧ください。Visiongainの研究は、自動車電動化市場、2022年から2032年、市場をリードする企業のための商業分析を必要とするすべての人のためのものです。データ、トレンド、予測をご覧いただけます。
ページTOPに戻る
目次
目次
1.レポートの概要
1.1.研究の目的
1.2.自動車電動化市場の紹介
1.3.本レポートが提供するもの
1.4.本レポートを読むべき理由
1.5.本分析レポートが回答する主な質問には以下が含まれます。
1.6.本レポートは誰のためのものなのか?
1.7.方法論
1.7.1.市場の定義
1.7.2.市場評価・予測手法
1.7.3.データバリデーション
1.7.3.1.プライマリーリサーチ
1.7.3.2.セカンダリーリサーチ
1.8.よくある質問(FAQ)
1.9.関連するVisiongainレポート
1.10.Visiongainについて
2.エグゼクティブサマリー
3.プレミアムインサイト
3.1.地域別スナップショット自動車電動化の世界市場
3.2.製品タイプ別セグメント:市場魅力度指数
3.3.販売チャネル別セグメント市場魅力度指数
3.4.車両タイプ別セグメント市場魅力度指数
4.市場の概要
4.1.主な調査結果
4.2.市場ダイナミクス
4.2.1.市場の推進要因
4.2.2.市場の抑制要因
4.2.3.市場機会
4.3.COVID-19インパクト分析
4.4.ポーターのファイブフォース分析
4.4.1.サプライヤーパワー
4.4.2.バイヤーパワー
4.4.3.競争力
4.4.4.代替品による脅威
4.4.5.新規参入の脅威
4.5.PEST分析
4.6.自動車用電池のパッケージング動向と展望
5.世界の自動車電動化市場分析:製品タイプ別
5.1.主な調査結果
5.2.製品タイプ別成長展望
5.3.自動車電動化の世界市場 製品タイプ別シェア(2022年、2027年、2032年)
5.4.スターターモーター
5.4.1.スターターモーター地域別市場予測、2022年~2032年 (億米ドル)
5.4.2.スターターモーター地域別市場シェア、2022-2032年(%)
5.5.電気自動車用モーター
5.5.1.電気自動車用モーター地域別市場予測、2022-2032年 (億米ドル)
5.5.2.電気自動車用モーター地域別市場シェア、2022年〜2032年 (%)
5.6.アクチュエーター
5.6.1.アクチュエーター地域別市場予測、2022-2032 (US$ Bn)
5.6.2.アクチュエーター地域別市場シェア、2022-2032年(%)
5.7.オルタネーター
5.7.1.オルタネーター地域別市場予測、2022-2032年 (億米ドル)
5.7.2.オルタネーター地域別市場シェア、2022年〜2032年 (%)
5.8.スタート/ストップシステム
5.8.1.スタート/ストップシステム地域別市場予測、2022-2032 (US$ Bn)
5.8.2.スタート/ストップシステムの地域別市場シェア、2022-2032年(%)
5.9.電動ウォーターポンプ
5.9.1.電動ウォーターポンプの地域別市場予測、2022年〜2032年(Bn$)
5.9.2.電動ウォーターポンプ地域別市場シェア、2022-2032年(%)
5.10.電動オイルポンプ
5.10.1.電動オイルポンプの地域別市場予測、2022年~2032年 (Bn米ドル)
5.10.2.電動オイルポンプ地域別市場シェア、2022年〜2032年 (%)
5.11.電動パワーステアリング
5.11.1.電動パワーステアリングの地域別市場予測、2022-2032年(Bn米ドル)
5.11.2.電動パワーステアリングの地域別市場シェア、2022-2032 (%)
5.12.電動フューエルポンプ
5.12.1.電動フューエルポンプの地域別市場予測、2022-2032年(Bn米ドル)
5.12.2.電動フューエルポンプの地域別市場シェア(2022-2032年)(%)
5.13.電動バキュームポンプ
5.13.1.電動バキュームポンプの地域別市場予測、2022-2032年(Bn米ドル)
5.13.2.電気真空ポンプの地域別市場シェア、2022-2032 (%)
5.14.自動車電装化の世界製品タイプ別市場規模推計・予測
6.世界の自動車電動化市場分析:販売チャネル別
6.1.主な調査結果
6.2.販売チャネル別成長見通し
6.3.自動車電動化世界市場の販売チャネル別シェア、2022年、2027年、2032年
6.4.OEM(Original Equipment Manufacturers:相手先ブランド製造)分野
6.4.1.相手先商標製品メーカー(OEM)地域別市場予測、2022年~2032年(10億米ドル)
6.4.2.相手先商標製品メーカー(OEM)地域別市場シェア(2022年~2032年)(%)
6.5.アフターマーケット
6.5.1.アフターマーケット地域別市場予測、2022年~2032年 (億米ドル)
6.5.2.アフターマーケット地域別市場シェア、2022-2032年(%)
6.6.自動車電動化の世界市場 販売チャネル別市場規模予測・予測
7.世界の自動車電動化市場分析:車両タイプ別
7.1.主な調査結果
7.2.車種別セグメントの成長展望
7.3.自動車電動化の世界市場、車両タイプ別シェア、2022年、2027年、2032年
7.4.内燃機関自動車
7.4.1.内燃機関自動車地域別市場予測、2022年~2032年 (億米ドル)
7.4.2.内燃機関自動車地域別市場シェア、2022-2032年 (%)
7.5.マイクロ&フルハイブリッド車
7.5.1.マイクロ&フルハイブリッド車地域別市場予測、2022-2032年(Bn$)
7.5.2.マイクロ&フルハイブリッド車地域別市場シェア(2022-2032年)(%)
7.6.プラグインハイブリッド車(PHEV)&バッテリー電気自動車(BEV)
7.6.1.プラグインハイブリッド車(PHEV)&バッテリー電気自動車(BEV)地域別市場予測、2022-2032 (US$ Bn)
7.6.2.プラグインハイブリッド車(PHEV)&バッテリー電気自動車(BEV)地域別市場シェア、2022-2032 (%)
7.7.自動車電動化の車両タイプ別世界市場規模予測・予測
8.世界の自動車電動化市場分析:地域別
8.1.主な調査結果
8.2.地域別市場規模の推計と予測
8.3.COVID-19影響度分析。回復シナリオ(V, U, W, L)
9.北米の自動車電動化市場分析
9.1.主な調査結果
9.2.北米の自動車電動化市場の魅力度指数
9.3.北米の自動車電動化国別市場、2022年、2027年&2032年(10億米ドル)
9.4.北米の自動車電動化国別市場規模予測・予想
9.5.北米の自動車電動化市場の製品タイプ別市場規模予測・予測
9.6.北米の自動車電動化市場の販売チャネル別市場規模予測・予想
9.7.北米の自動車電動化市場の車両タイプ別市場規模予測・予想
9.8.米国
9.8.1.米国自動車電動化市場の製品タイプ別推移
9.8.2.米国自動車電動化市場:販売チャネル別
9.8.3.米国自動車電動化市場:車両タイプ別
9.9.カナダ
9.9.1.カナダの自動車電動化市場:製品タイプ別
9.9.2.カナダの自動車電動化市場:販売チャネル別
9.9.3.カナダの自動車電動化市場:車両タイプ別
9.10.メキシコ
9.10.1.メキシコの自動車電動化市場:製品タイプ別
9.10.2.メキシコの自動車電動化市場:販売チャネル別
9.10.3.メキシコの自動車電動化市場:車両タイプ別
10.欧州の自動車電動化市場分析
10.1.主な調査結果
10.2.欧州自動車電動化市場魅力度指数
10.3.欧州自動車電動化国別市場、2022年、2027年&2032年 (10億米ドル)
10.4.欧州自動車電動化市場の国別市場規模予測・予測 5.
10.5.欧州自動車電動化市場の製品タイプ別市場規模予測・予測
10.6.欧州自動車電動化市場の販売チャネル別市場規模予測・予想
10.7.欧州自動車電動化市場の車両タイプ別市場規模予測・予測
10.8.ドイツ
10.8.1.ドイツ自動車電動化市場:製品タイプ別
10.8.2.ドイツの自動車電動化市場:販売チャネル別
10.8.3.ドイツの自動車電動化市場:車両タイプ別
10.9.スペイン
10.9.1.スペインの自動車電動化市場:製品タイプ別
10.9.2.スペインの自動車電動化市場:販売チャネル別
10.9.3.スペインの自動車電動化市場:車両タイプ別
10.10.イギリス
10.10.1.イギリスの自動車電動化市場:製品タイプ別
10.10.2.イギリスの自動車電動化市場:販売チャネル別
10.10.3.イギリスの自動車電動化市場:車両タイプ別
10.11.フランス
10.11.1.フランス自動車電動化市場:製品タイプ別
10.11.2.フランス自動車電動化市場:販売チャネル別
10.11.3.フランス自動車電動化市場:車両タイプ別
10.12.イタリア
10.12.1.イタリアの自動車電動化市場:製品タイプ別
10.12.2.イタリアの自動車電動化市場:販売チャネル別
10.12.3.イタリアの自動車電動化市場:車両タイプ別
10.13.その他の欧州地域
10.13.1.欧州の自動車電動化市場:製品タイプ別
10.13.2.欧州のその他の自動車電動化市場:販売チャネル別
10.13.3.欧州のその他の自動車電動化市場:車両タイプ別
11.アジア太平洋地域の自動車電動化市場分析
11.1.主な調査結果
11.2.アジア太平洋地域の自動車電動化市場の魅力度指標
11.3.アジア太平洋地域の自動車電動化国別市場、2022年、2027年、2032年 (10億米ドル)
11.4.アジア太平洋地域の国別自動車電動化市場規模予測・予想
11.5.アジア太平洋地域の自動車電動化市場 製品タイプ別市場規模予測・予測
11.6.アジア太平洋地域の自動車電動化市場の販売チャネル別市場規模予測・予想
11.7.アジア太平洋地域の自動車電動化市場の車両タイプ別市場規模予測・予想
11.8.中国
11.8.1.中国自動車電動化市場:製品タイプ別
11.8.2.中国自動車電動化市場:販売チャネル別
11.8.3.中国自動車電動化市場:車両タイプ別
11.9.日本
11.9.1.日本 自動車電動化市場:製品タイプ別
11.9.2.日本自動車電動化市場:販売チャネル別
11.9.3.日本自動車電動化市場:車両タイプ別
11.10.インド
11.10.1.インドの自動車電動化市場:製品タイプ別
11.10.2.インドの自動車電動化市場:販売チャネル別
11.10.3.インドの自動車電動化市場:車両タイプ別
11.11.オーストラリア
11.11.1.オーストラリアの自動車電動化市場:製品タイプ別
11.11.2.オーストラリアの自動車電動化市場:販売チャネル別
11.11.3.オーストラリアの自動車電動化市場:車両タイプ別
11.12.韓国
11.12.1.韓国の自動車電動化市場:製品タイプ別
11.12.2.韓国の自動車電動化市場:販売チャネル別
11.12.3.韓国の自動車電動化市場:車両タイプ別
11.13.その他のアジア太平洋地域
11.13.1.アジア太平洋地域の自動車電動化市場:製品タイプ別
11.13.2.アジア太平洋地域のその他の自動車電動化市場:販売チャネル別
11.13.3.アジア太平洋地域の自動車電動化市場:車両タイプ別
12.LAMEAの自動車電動化市場分析
12.1.主な調査結果
12.2.LAMEA自動車電動化市場魅力度指数
12.3.LAMEA自動車電動化市場:国別、2022年、2027年、2032年 (10億米ドル)
12.4.LAMEA自動車電動化市場の国別市場規模予測・予測
12.5.LAMEAの自動車電動化市場の製品タイプ別市場規模予測・予測
12.6.LAMEA自動電動化市場の販売チャネル別市場規模予測・予想
12.7.LAMEAの自動車電動化市場の車両タイプ別市場規模予測・予測
12.8.ブラジル
12.8.1.ブラジル自動車電動化市場:製品タイプ別
12.8.2.ブラジル自動車電動化市場:販売チャネル別
12.8.3.ブラジル自動車電動化市場:車両タイプ別
12.9.トルコ
12.9.1.トルコの自動車電動化市場:製品タイプ別
12.9.2.トルコの自動車電動化市場:販売チャネル別
12.9.3.トルコの自動車電動化市場:車両タイプ別
12.10.サウジアラビア
12.10.1.サウジアラビアの自動車電動化市場:製品タイプ別
12.10.2.サウジアラビアの自動車電動化市場:販売チャネル別
12.10.3.サウジアラビアの自動車電動化市場:車両タイプ別
12.11.南アフリカ共和国
12.11.1.南アフリカの自動車電動化市場:製品タイプ別
12.11.2.南アフリカの自動車電動化市場:販売チャネル別
12.11.3.南アフリカの自動車電動化市場:車両タイプ別
12.12.UAE
12.12.1.UAEの自動車電動化市場:製品タイプ別
12.12.2.UAEの自動車電動化市場:販売チャネル別
12.12.3.UAEの自動車電動化市場:車両タイプ別
12.13.その他の中南米地域
12.13.1.中南米その他の地域:自動車電動化市場:製品タイプ別
12.13.2.ラテンアメリカのその他の地域自動車電化市場:販売チャネル別
12.13.3.ラテンアメリカのその他の自動車電化市場:車両タイプ別
13.競合他社の状況
13.1.企業シェア分析
13.2.主要事業戦略分析
13.3.競合他社ダッシュボード
14.会社概要
14.1.アイシン精機
14.1.1.会社概要
14.1.2.会社概要
14.1.3.財務分析
14.1.3.1.純収益、2017-2021年
14.1.3.2.地域別市場シェア、2021年
14.1.3.3.売上総利益、2017年~2021年
14.1.3.4.R&D、2017年~2021年
14.1.4.製品ベンチマーク
14.1.5.戦略的展望
14.2.ボルグワーナー社
14.2.1.会社概要
14.2.2.会社概要
14.2.3.財務分析
14.2.3.1.純収益、2017-2021年
14.2.3.2.地域別市場シェア、2021年
14.2.3.3.売上総利益、2017年~2021年
14.2.3.4.R&D、2017年~2021年
14.2.4.製品ベンチマーク
14.2.5.戦略的展望
14.3.ボッシュ
14.3.1.会社概要
14.3.2.会社概要
14.3.3.財務分析
14.3.3.1.純収益、2017-2021年
14.3.3.2.地域別市場シェア、2021年
14.3.3.3.売上総利益、2017年~2021年
14.3.3.4.R&D、2017年~2021年
14.3.4.製品ベンチマーク
14.3.5.戦略的展望
14.4.コンチネンタルAG
14.4.1.会社概要
14.4.2.会社概要
14.4.3.財務分析
14.4.3.1.純収益、2017-2021年
14.4.3.2.地域別市場シェア、2021年
14.4.3.3.売上総利益、2017年-2021年
14.4.3.4.R&D、2017年~2021年
14.4.4.製品ベンチマーク
14.4.5.戦略的展望
14.5.デルファイ・テクノロジー
14.5.1.会社概要
14.5.2.会社概要
14.5.3.財務分析
14.5.3.1.純収益、2017-2021年
14.5.3.2.地域別市場シェア、2021年
14.5.3.3.売上総利益、2017年-2021年
14.5.3.4.R&D、2017年~2021年
14.5.4.製品ベンチマーク
14.5.5.戦略的展望
14.6.株式会社デンソー
14.6.1.会社概要
14.6.2.会社概要
14.6.3.財務分析
14.6.3.1.純収益、2017-2021年
14.6.3.2.地域別市場シェア、2021年
14.6.3.3.売上総利益、2017年-2021年
14.6.3.4.R&D、2017年~2021年
14.6.4.製品ベンチマーク
14.6.5.戦略的展望
14.7.ジョンソンコントロールズ
14.7.1.会社概要
14.7.2.会社概要
14.7.3.財務分析
14.7.3.1.純収益、2017-2021年
14.7.3.2.地域別市場シェア、2021年
14.7.3.3.売上総利益、2017年-2021年
14.7.3.4.R&D、2017年~2021年
14.7.4.製品ベンチマーク
14.7.5.戦略的展望
14.8.ジョンソン・エレクトリック
14.8.1.会社概要
14.8.2.会社概要
14.8.3.財務分析
14.8.3.1.純収益、2017-2021年
14.8.3.2.地域別市場シェア、2021年
14.8.3.3.売上総利益、2017年-2021年
14.8.3.4.R&D、2017年~2021年
14.8.4.製品ベンチマーク
14.8.5.戦略的展望
14.9.マグナ・インターナショナル・インク
14.9.1.会社概要
14.9.2.会社概要
14.9.3.財務分析
14.9.3.1.純収益、2017-2021年
14.9.3.2.地域別市場シェア、2021年
14.9.3.3.売上総利益、2017年-2021年
14.9.3.4.R&D、2017年~2021年
14.9.4.製品ベンチマーク
14.9.5.戦略的展望
14.10.三菱電機
14.10.1.会社概要
14.10.2.会社概要
14.10.3.財務分析
14.10.3.1.純収益、2017-2021年
14.10.3.2.地域別市場シェア、2021年
14.10.3.3.売上総利益、2017年-2021年
14.10.3.4.R&D、2017年~2021年
14.10.4.製品ベンチマーク
14.10.5.戦略的展望
15.結論と提言
15.1.ビジョンゲインからの結論
15.2.市場関係者への提言
表の一覧
Table 1 Global Auto Electrification Market Snapshot, 2022 & 2032 (US$ billion, CAGR %)
Table 2 Global Auto Electrification Market by Region, 2022-2032 (US$ bn, AGR (%), CAGR (%)): “V” Shaped Recovery Scenario
Table 3 Global Auto Electrification Market by Region, 2022-2032 (US$ bn, AGR (%), CAGR (%)): “U” Shaped Recovery Scenario
Table 4 Global Auto Electrification Market by Region, 2022-2032 (US$ bn, AGR (%), CAGR (%)): “W” Shaped Recovery Scenario
Table 5 Global Auto Electrification Market by Region, 2022-2032 (US$ bn, AGR (%), CAGR (%)): “L” Shaped Recovery Scenario
Table 6 Rechargeable Battery Applications, Level of Power Requirements, and Packaging
Table 7 Global Auto Electrification Market Forecast by Product Type, 2022-2032 (US$ bn, AGR%, CAGR%)
Table 8 Global Auto Electrification Market Volume Forecast by Product Type, 2022-2032 (Mn units, AGR%, CAGR%)
Table 9 Starter Motor Market Forecast by Region, 2022-2032 (US$ bn, AGR%, CAGR%)
Table 10 Starter Motor Market Volume Forecast by Region, 2022-2032 (Mn units, AGR%, CAGR%)
Table 11 Alternator Market Forecast by Region, 2022-2032 (US$ bn, AGR%, CAGR%)
Table 12 Alternator Market Volume Forecast by Region, 2022-2032 (Mn units, AGR%, CAGR%)
Table 13 Electric Car Motor Market Forecast by Region, 2022-2032 (US$ bn, AGR%, CAGR%)
Table 14 Electric Car Motor Market Volume Forecast by Region, 2022-2032 (Mn units, AGR%, CAGR%)
Table 15 Electric Water Pumps Market Forecast by Region, 2022-2032 (US$ bn, AGR%, CAGR%)
Table 16 Electric Water Pumps Market Volume Forecast by Region, 2022-2032 (Mn units, AGR%, CAGR%)
Table 17 Electric Oil Pump Market Forecast by Region, 2022-2032 (US$ bn, AGR%, CAGR%)
Table 18 Electric Oil Pump Market Volume Forecast by Region, 2022-2032 (Mn units, AGR%, CAGR%)
Table 19 Electric Vacuum Pump Market Forecast by Region, 2022-2032 (US$ bn, AGR%, CAGR%)
Table 20 Electric Vacuum Pump Market Forecast by Region, 2022-2032 (Mn units, AGR%, CAGR%)
Table 21 Electric Fuel Pump Market Forecast by Region, 2022-2032 (US$ bn, AGR%, CAGR%)
Table 22 Electric Fuel Pump Market Volume Forecast by Region, 2022-2032 (Mn units, AGR%, CAGR%)
Table 23 Electric Power Steering Market Forecast by Region, 2022-2032 (US$ bn, AGR%, CAGR%)
Table 24 Electric Power Steering Market Volume Forecast by Region, 2022-2032 (Mn units, AGR%, CAGR%)
Table 25 Actuators Market Forecast by Region, 2022-2032 (US$ bn, AGR%, CAGR%)
Table 26 Actuators Market Volume Forecast by Region, 2022-2032 (Mn units, AGR%, CAGR%)
Table 27 Start/ Stop System Market Forecast by Region, 2022-2032 (US$ bn, AGR%, CAGR%)
Table 28 Start/ Stop System Market Volume Forecast by Region, 2022-2032 (Mn units, AGR%, CAGR%)
Table 29 Global Auto Electrification Market Forecast by Sales Channel, 2022-2032 (US$ bn, AGR%, CAGR%)
Table 30 Original Equipment Manufacturers (OEM) Market Forecast by Region, 2022-2032 (US$ bn, AGR%, CAGR%)
Table 31 Aftermarket Market Forecast by Region, 2022-2032 (US$ bn, AGR%, CAGR%)
Table 32 Global Auto Electrification Market Forecast by Vehicle Type, 2022-2032 (US$ bn, AGR%, CAGR%)
Table 33 Internal Combustion Engine Vehicle Market Forecast by Region, 2022-2032 (US$ bn, AGR%, CAGR%)
Table 34 Micro & Full Hybrid Vehicle Market Forecast by Region, 2022-2032 (US$ bn, AGR%, CAGR%)
Table 35 Plug-in Hybrid Electric Vehicle (PHEV) & Battery Electric Vehicle (BEV) Market Forecast by Region, 2022-2032 (US$ bn, AGR%, CAGR%)
Table 36 Global Auto Electrification Market by Region, 2022-2032 (US$ bn, AGR (%), CAGR (%))
Table 37 North America Auto Electrification Market Forecast by Country, 2022-2032 (US$ bn, AGR%, CAGR%)
Table 38 North America Auto Electrification Market Forecast by Product Type, 2022-2032 (US$ bn, AGR%, CAGR%)
Table 39 North America Auto Electrification Market Volume Forecast by Product Type, 2022-2032 (Mn units, AGR%, CAGR%)
Table 40 North America Auto Electrification Market Forecast by Sales Channel, 2022-2032 (US$ bn, AGR%, CAGR%)
Table 41 North America Auto Electrification Market Forecast by Vehicle Type, 2022-2032 (US$ bn, AGR%, CAGR%)
Table 42 U.S. Auto Electrification Market Forecast, 2022-2032 (US$ bn, AGR%, CAGR%)
Table 43 Canada Auto Electrification Market Forecast, 2022-2032 (US$ bn, AGR%, CAGR%)
Table 44 Europe Auto Electrification Market Forecast by Country, 2022-2032 (US$ bn, AGR%, CAGR%)
Table 45 Europe Auto Electrification Market Forecast by Product Type, 2022-2032 (US$ bn, AGR%, CAGR%)
Table 46 Europe Auto Electrification Market Volume Forecast by Product Type, 2022-2032 (Mn units, AGR%, CAGR%)
Table 47 Europe Auto Electrification Market Forecast by Sales Channel, 2022-2032 (US$ bn, AGR%, CAGR%)
Table 48 Europe Auto Electrification Market Forecast by Vehicle Type, 2022-2032 (US$ bn, AGR%, CAGR%)
Table 49 Germany Auto Electrification Market Forecast, 2022-2032 (US$ bn, AGR%, CAGR%)
Table 50 UK Auto Electrification Market Forecast, 2022-2032 (US$ bn, AGR%, CAGR%)
Table 51 France Auto Electrification Market Forecast, 2022-2032 (US$ bn, AGR%, CAGR%)
Table 52 Italy Auto Electrification Market Forecast, 2022-2032 (US$ bn, AGR%, CAGR%)
Table 53 Spain Auto Electrification Market Forecast, 2022-2032 (US$ bn, AGR%, CAGR%)
Table 54 Russia Auto Electrification Market Forecast, 2022-2032 (US$ bn, AGR%, CAGR%)
Table 55 Rest of Europe Auto Electrification Market Forecast, 2022-2032 (US$ bn, AGR%, CAGR%)
Table 56 Asia Pacific Auto Electrification Market Forecast by Country, 2022-2032 (US$ bn, AGR%, CAGR%)
Table 57 Asia Pacific Auto Electrification Market Forecast by Product Type, 2022-2032 (US$ bn, AGR%, CAGR%)
Table 58 Asia Pacific Auto Electrification Market Volume Forecast by Product Type, 2022-2032 (Mn units, AGR%, CAGR%)
Table 59 Asia Pacific Auto Electrification Market Forecast by Sales Channel, 2022-2032 (US$ bn, AGR%, CAGR%)
Table 60 Asia Pacific Auto Electrification Market Forecast by Vehicle Type, 2022-2032 (US$ bn, AGR%, CAGR%)
Table 61 Japan Auto Electrification Market Forecast, 2022-2032 (US$ bn, AGR%, CAGR%)
Table 62 China Auto Electrification Market Forecast, 2022-2032 (US$ bn, AGR%, CAGR%)
Table 63 India Auto Electrification Market Forecast, 2022-2032 (US$ bn, AGR%, CAGR%)
Table 64 Indonesia Auto Electrification Market Forecast, 2022-2032 (US$ bn, AGR%, CAGR%)
Table 65 South Korea Auto Electrification Market Forecast, 2022-2032 (US$ bn, AGR%, CAGR%)
Table 66 Rest of Asia Pacific Auto Electrification Market Forecast, 2022-2032 (US$ bn, AGR%, CAGR%)
Table 67 Latin America Auto Electrification Market Forecast by Country, 2022-2032 (US$ bn, AGR%, CAGR%)
Table 68 Latin America Auto Electrification Market Forecast by Product Type, 2022-2032 (US$ bn, AGR%, CAGR%)
Table 69 Latin America Auto Electrification Market Volume Forecast by Product Type, 2022-2032 (Mn units, AGR%, CAGR%)
Table 70 Latin America Auto Electrification Market Forecast by Sales Channel, 2022-2032 (US$ bn, AGR%, CAGR%)
Table 71 Latin America Auto Electrification Market Forecast by Vehicle Type, 2022-2032 (US$ bn, AGR%, CAGR%)
Table 72 Brazil Auto Electrification Market Forecast, 2022-2032 (US$ bn, AGR%, CAGR%)
Table 73 Mexico Auto Electrification Market Forecast, 2022-2032 (US$ bn, AGR%, CAGR%)
Table 74 Rest of Latin America Auto Electrification Market Forecast, 2022-2032 (US$ bn, AGR%, CAGR%)
Table 75 MEA Auto Electrification Market Forecast by Country, 2022-2032 (US$ bn, AGR%, CAGR%)
Table 76 MEA Auto Electrification Market Forecast by Product Type, 2022-2032 (US$ bn, AGR%, CAGR%)
Table 77 MEA Auto Electrification Market Volume Forecast by Product Type, 2022-2032 (Mn units, AGR%, CAGR%)
Table 78 MEA Auto Electrification Market Forecast by Sales Channel, 2022-2032 (US$ bn, AGR%, CAGR%)
Table 79 MEA Auto Electrification Market Forecast by Vehicle Type, 2022-2032 (US$ bn, AGR%, CAGR%)
Table 80 GCC Auto Electrification Market Forecast, 2022-2032 (US$ bn, AGR%, CAGR%)
Table 81 South Africa Auto Electrification Market Forecast, 2022-2032 (US$ bn, AGR%, CAGR%)
Table 82 Rest of MEA Auto Electrification Market Forecast, 2022-2032 (US$ bn, AGR%, CAGR%)
Table 83 Homeland Security Market Recent Developments, 2017-2021
Table 84 Aisin Seiki Co., Ltd.: Key Details, (CEO, HQ, Revenue, Founded, No. of Employees, Company Type, Website, Business Segment)
Table 85 Aisin Seiki Co., Ltd.: Product Benchmarking
Table 86 Aisin Seiki Co., Ltd.: Strategic Outlook
Table 87 BorgWarner Inc, Key Details, (CEO, HQ, Revenue, Founded, No. of Employees, Company Type, Website, Business Segment)
Table 88 BorgWarner Inc: Product Benchmarking
Table 89 BorgWarner Inc: Strategic Outlook
Table 90 Robert Bosch GmbH: Key Details, (CEO, HQ, Revenue, Founded, No. of Employees, Company Type, Website, Business Segment)
Table 91 Robert Bosch GmbH: Product Benchmarking
Table 92 Robert Bosch GmbH: Strategic Outlook
Table 93 Continental AG: Key Details, (CEO, HQ, Revenue, Founded, No. of Employees, Company Type, Website, Business Segment)
Table 94 Continental AG: Product Benchmarking
Table 95 Continental AG: Strategic Outlook
Table 96 Denso Corporation: Key Details, (CEO, HQ, Revenue, Founded, No. of Employees, Company Type, Website, Business Segment)
Table 97 Denso Corporation: Product Benchmarking
Table 98 Denso Corporation: Strategic Outlook
Table 99 ZF Friedrichshafen AG: Key Details, (CEO, HQ, Revenue, Founded, No. of Employees, Company Type, Website, Business Segment)
Table 100 ZF Friedrichshafen AG: Product Benchmarking
Table 101 ZF Friedrichshafen AG: Strategic Outlook
Table 102 Johnson Electric Holdings Limited: Key Details, (CEO, HQ, Revenue, Founded, No. of Employees, Company Type, Website, Business Segment)
Table 103 Johnson Electric Holdings Limited: Product Benchmarking
Table 104 Johnson Electric Holdings Limited: Strategic Outlook
Table 105 Magna International Inc.: Key Details, (CEO, HQ, Revenue, Founded, No. of Employees, Company Type, Website, Business Segment)
Table 106 Magna International Inc.: Product Benchmarking
Table 107 Magna International Inc.: Strategic Outlook
Table 108 Mitsubishi Electric Corporation: Key Details, (CEO, HQ, Revenue, Founded, No. of Employees, Company Type, Website, Business Segment)
Table 109 Mitsubishi Electric Corporation: Product Benchmarking
Table 110 Mitsubishi Electric Corporation: Strategic Outlook
Table 111 Valeo SA: Key Details, (CEO, HQ, Revenue, Founded, No. of Employees, Company Type, Website, Business Segment)
Table 112 Valeo SA: Product Benchmarking
Table 113 Valeo SA: Strategic Outlook
Table 114 Schaeffler AG: Key Details, (CEO, HQ, Revenue, Founded, No. of Employees, Company Type, Website, Business Segment)
Table 115 Schaeffler AG: Product Benchmarking
Table 116 Schaeffler AG: Strategic Outlook
Table 117 Mahle GmbH: Key Details, (CEO, HQ, Revenue, Founded, No. of Employees, Company Type, Website, Business Segment)
Table 118 Mahle GmbH: Product Benchmarking
Table 119 Mahle GmbH: Strategic Outlook
Table 120 American Axle & Manufacturing, Inc.: Key Details, (CEO, HQ, Revenue, Founded, No. of Employees, Company Type, Website, Business Segment)
Table 121 American Axle & Manufacturing, Inc.: Product Benchmarking
Table 122 American Axle & Manufacturing, Inc.: Strategic Outlook
Table 123 JTEKT Corporation: Key Details, (CEO, HQ, Revenue, Founded, No. of Employees, Company Type, Website, Business Segment)
Table 124 JTEKT Corporation: Product Benchmarking
Table 125 JTEKT Corporation: Strategic Outlook
図の一覧
Figure 1 Global Auto Electrification Market Segmentation
Figure 2 Global Auto Electrification Market by Product Type: Market Attractiveness Index
Figure 3 Global Auto Electrification Market Attractiveness Index by Region
Figure 4 Global Auto Electrification Market: Market Dynamics
Figure 5 Global COVID Impact Analysis: Auto Electrification Market Recovery Scenarios
Figure 6 Global Auto Electrification Market by Region, 2022-2032 (US$ bn, AGR (%), CAGR (%)): “V” Shaped Recovery
Figure 7 Global Auto Electrification Market by Region, 2022-2032 (US$ bn, AGR (%), CAGR (%)): “U” Shaped Recovery
Figure 8 Global Auto Electrification Market by Region, 2022-2032 (US$ bn, AGR (%), CAGR (%)): “W” Shaped Recovery
Figure 9 Global Auto Electrification Market by Region, 2022-2032 (US$ bn, AGR (%), CAGR (%)): “L” Shaped Recovery
Figure 10 Global Auto Electrification Market: Porter’s Five Forces Analysis
Figure 11 Global Auto Electrification Market: PEST Analysis
Figure 12 Global Auto Electrification Market Attractiveness Index by Product Type
Figure 13 Global Auto Electrification Market Forecast by Product Type, 2022-2032 (US$ billion)
Figure 14 Global Auto Electrification Market Volume Forecast by Product Type, 2022-2032 (million units)
Figure 15 Global Auto Electrification Market Volume Share Forecast by Product Type, 2022, 2027, 2032 (%)
Figure 16 Starter Motor Market Forecast by Region, 2022-2032 (US$ billion)
Figure 17 Starter Motor Market Share Forecast by Region, 2022 & 2032 (%)
Figure 18 Starter Motor Market Volume Forecast by Region, 2022-2032 (million units)
Figure 19 Starter Motor Market Volume Share Forecast by Region, 2022 & 2032 (%)
Figure 20 Alternator Market Forecast by Region, 2022-2032 (US$ billion)
Figure 21 Alternator Market Share Forecast by Region, 2022 & 2032 (%)
Figure 22 Alternator Market Volume Forecast by Region, 2022-2032 (million units)
Figure 23 Alternator Market Volume Share Forecast by Region, 2022 & 2032 (%)
Figure 24 Electric Car Motor Market Forecast by Region, 2022-2032 (US$ billion)
Figure 25 Electric Car Motor Market Share Forecast by Region, 2022 & 2032 (%)
Figure 26 Electric Car Motor Market Volume Forecast by Region, 2022-2032 (million units)
Figure 27 Electric Car Motor Volume Market Share Forecast by Region, 2022 & 2032 (%)
Figure 28 Electric Water Pumps Market Forecast by Region, 2022-2032 (US$ billion)
Figure 29 Electric Water Pumps Market Share Forecast by Region, 2022 & 2032 (%)
Figure 30 Electric Water Pumps Market Volume Forecast by Region, 2022-2032 (million units)
Figure 31 Electric Water Pumps Market Volume Share Forecast by Region, 2022 & 2032 (%)
Figure 32 Electric Oil Pump Market Forecast by Region, 2022-2032 (US$ billion)
Figure 33 Electric Oil Pump Market Share Forecast by Region, 2022 & 2032 (%)
Figure 34 Electric Oil Pump Market Volume Forecast by Region, 2022-2032 (million units)
Figure 35 Electric Oil Pump Market Volume Share Forecast by Region, 2022 & 2032 (%)
Figure 36 Electric Vacuum Pump Market Forecast by Region, 2022-2032 (US$ billion)
Figure 37 Electric Vacuum Pump Market Share Forecast by Region, 2022 & 2032 (%)
Figure 38 Electric Vacuum Pump Market Volume Forecast by Region, 2022-2032 (million units)
Figure 39 Electric Vacuum Pump Market Volume Share Forecast by Region, 2022 & 2032 (%)
Figure 40 Electric Fuel Pump Market Forecast by Region, 2022-2032 (US$ billion)
Figure 41 Electric Fuel Pump Market Share Forecast by Region, 2022 & 2032 (%)
Figure 42 Electric Fuel Pump Market Volume Forecast by Region, 2022-2032 (million units)
Figure 43 Electric Fuel Pump Market Volume Share Forecast by Region, 2022 & 2032 (%)
Figure 44 Electric Power Steering Market Forecast by Region, 2022-2032 (US$ billion)
Figure 45 Electric Power Steering Market Share Forecast by Region, 2022 & 2032 (%)
Figure 46 Electric Power Steering Market Volume Forecast by Region, 2022-2032 (million units)
Figure 47 Electric Power Steering Market Volume Share Forecast by Region, 2022 & 2032 (%)
Figure 48 Actuators Market Forecast by Region, 2022-2032 (US$ billion)
Figure 49 Actuators Market Share Forecast by Region, 2022 & 2032 (%)
Figure 50 Actuators Market Volume Forecast by Region, 2022-2032 (million units)
Figure 51 Actuators Market Volume Share Forecast by Region, 2022 & 2032 (%)
Figure 52 Start/ Stop System Market Forecast by Region, 2022-2032 (US$ billion)
Figure 53 Start/ Stop System Market Share Forecast by Region, 2022 & 2032 (%)
Figure 54 Start/ Stop System Market Volume Forecast by Region, 2022-2032 (million units)
Figure 55 Start/ Stop System Market Volume Share Forecast by Region, 2022 & 2032 (%)
Figure 56 Global Auto Electrification Market Attractiveness Index by Sales Channel
Figure 57 Global Auto Electrification Market Forecast by Sales Channel, 2022-2032 (US$ billion)
Figure 58 Global Auto Electrification Market Share Forecast by Sales Channel, 2022, 2027, 2032 (%)
Figure 59 Original Equipment Manufacturers (OEM) Market Forecast by Region, 2022-2032 (US$ billion)
Figure 60 Original Equipment Manufacturers (OEM) Market Share Forecast by Region, 2022 & 2032 (%)
Figure 61 Aftermarket Market Forecast by Region, 2022-2032 (US$ billion)
Figure 62 Aftermarket Market Share Forecast by Region, 2022 & 2032 (%)
Figure 63 Global Auto Electrification Market Attractiveness by Vehicle Type
Figure 64 Global Auto Electrification Market Forecast by Vehicle Type, 2022-2032 (US$ billion)
Figure 65 Global Auto Electrification Market Share Forecast by Vehicle Type, 2022, 2027, 2032 (%)
Figure 66 Internal Combustion Engine Vehicle Market Forecast by Region, 2022-2032 (US$ billion)
Figure 67 Internal Combustion Engine Vehicle Market Share Forecast by Region, 2022 & 2032 (%)
Figure 68 Micro & Full Hybrid Vehicle Market Forecast by Region, 2022-2032 (US$ billion)
Figure 69 Micro & Full Hybrid Vehicle Market Share Forecast by Region, 2022 & 2032 (%)
Figure 70 Plug-in Hybrid Electric Vehicle (PHEV) & Battery Electric Vehicle (BEV) Market Forecast by Region, 2022-2032 (US$ billion)
Figure 71 Plug-in Hybrid Electric Vehicle (PHEV) & Battery Electric Vehicle (BEV) Market Share Forecast by Region, 2022 & 2032 (%)
Figure 72 Global Auto Electrification Market Forecast by Region 2022, 2027, 2032 (Revenue, CAGR%)
Figure 73 Global Auto Electrification Market Share Forecast by Region 2022, 2027, 2032(%)
Figure 74 Global Auto Electrification Market by Region, 2022-2032 (US$ bn, AGR (%), CAGR (%))
Figure 75 North America Auto Electrification Market Attractiveness Index
Figure 76 North America Auto Electrification Market by Country, 2022, 2027 & 2032 (US$ billion)
Figure 77 North America Auto Electrification Market Forecast by Country, 2022-2032 (US$ billion)
Figure 78 North America Auto Electrification Market Share Forecast by Country, 2022 & 2032 (%)
Figure 79 North America Auto Electrification Market Forecast by Product Type, 2022-2032 (US$ billion)
Figure 80 North America Auto Electrification Market Share Forecast by Product Type, 2022 & 2032 (%)
Figure 81 North America Auto Electrification Market Volume Forecast by Product Type, 2022-2032 (million units)
Figure 82 North America Auto Electrification Market Volume Share Forecast by Product Type, 2022 & 2032 (%)
Figure 83 North America Auto Electrification Market Forecast by Sales Channel, 2022-2032 (US$ billion)
Figure 84 North America Auto Electrification Market Share Forecast by Sales Channel, 2022 & 2032 (%)
Figure 85 North America Auto Electrification Market Forecast by Vehicle Type, 2022-2032 (US$ billion)
Figure 86 North America Auto Electrification Market Share Forecast by Vehicle Type, 2022 & 2032 (%)
Figure 87 U.S. Auto Electrification Market Forecast, 2022-2032 (US$ billion, AGR %)
Figure 88 Canada Auto Electrification Market Forecast, 2022-2032 (US$ billion, AGR %)
Figure 89 Europe Auto Electrification Market Attractiveness Index
Figure 90 Europe Auto Electrification Market by Region, 2022, 2027 & 2032 (US$ billion)
Figure 91 Europe Auto Electrification Market Forecast by Country, 2022-2032 (US$ billion)
Figure 92 Europe Auto Electrification Market Share Forecast by Country, 2022 & 2032 (%)
Figure 93 Europe Auto Electrification Market Forecast by Product Type, 2022-2032 (US$ billion)
Figure 94 Europe Auto Electrification Market Share Forecast by Product Type, 2022 & 2032 (%)
Figure 95 Europe Auto Electrification Market Volume Forecast by Product Type, 2022-2032 (million units)
Figure 96 Europe Auto Electrification Market Volume Share Forecast by Product Type, 2022 & 2032 (%)
Figure 97 Europe Auto Electrification Market Forecast by Sales Channel, 2022-2032 (US$ billion)
Figure 98 Europe Auto Electrification Market Share Forecast by Sales Channel, 2022 & 2032 (%)
Figure 99 Europe Auto Electrification Market Forecast by Vehicle Type, 2022-2032 (US$ billion)
Figure 100 Europe Auto Electrification Market Share Forecast by Vehicle Type, 2022 & 2032 (%)
Figure 101 Germany Auto Electrification Market Forecast, 2022-2032 (US$ billion, AGR %)
Figure 102 UK Auto Electrification Market Forecast, 2022-2032 (US$ billion, AGR %)
Figure 103 France Auto Electrification Market Forecast, 2022-2032 (US$ billion, AGR %)
Figure 104 Italy Auto Electrification Market Forecast, 2022-2032 (US$ billion, AGR %)
Figure 105 Spain Auto Electrification Market Forecast, 2022-2032 (US$ billion, AGR %)
Figure 106 Russia Auto Electrification Market Forecast, 2022-2032 (US$ billion, AGR %)
Figure 107 Rest of Europe Auto Electrification Market Forecast, 2022-2032 (US$ billion, AGR %)
Figure 108 Asia Pacific Auto Electrification Market Attractiveness Index
Figure 109 Asia Pacific Auto Electrification Market by Region, 2022, 2027 & 2032 (US$ billion)
Figure 110 Asia Pacific Auto Electrification Market Forecast by Country, 2022-2032 (US$ billion)
Figure 111 Asia Pacific Auto Electrification Market Share Forecast by Country, 2022 & 2032 (%)
Figure 112 Asia Pacific Auto Electrification Market Forecast by Product Type, 2022-2032 (US$ billion)
Figure 113 Asia Pacific Auto Electrification Market Share Forecast by Product Type, 2022 & 2032 (%)
Figure 114 Asia Pacific Auto Electrification Market Volume Forecast by Product Type, 2022-2032 (million units)
Figure 115 Asia Pacific Auto Electrification Market Volume Share Forecast by Product Type, 2022 & 2032 (%)
Figure 116 Asia Pacific Auto Electrification Market Forecast by Sales Channel, 2022-2032 (US$ billion)
Figure 117 Asia Pacific Auto Electrification Market Share Forecast by Sales Channel, 2022 & 2032 (%)
Figure 118 Asia Pacific Auto Electrification Market Forecast by Vehicle Type, 2022-2032 (US$ billion)
Figure 119 Asia Pacific Auto Electrification Market Share Forecast by Vehicle Type, 2022 & 2032 (%)
Figure 120 Japan Auto Electrification Market Forecast, 2022-2032 (US$ billion, AGR %)
Figure 121 China Auto Electrification Market Forecast, 2022-2032 (US$ billion, AGR %)
Figure 122 India Auto Electrification Market Forecast, 2022-2032 (US$ billion, AGR %)
Figure 123 Indonesia Auto Electrification Market Forecast, 2022-2032 (US$ billion, AGR %)
Figure 124 South Korea Auto Electrification Market Forecast, 2022-2032 (US$ billion, AGR %)
Figure 125 Rest of Asia Pacific Auto Electrification Market Forecast, 2022-2032 (US$ billion, AGR %)
Figure 126 Latin America Auto Electrification Market Attractiveness Index
Figure 127 Latin America Auto Electrification Market by Region, 2022, 2027 & 2032 (US$ billion)
Figure 128 Latin America Auto Electrification Market Forecast by Country, 2022-2032 (US$ billion)
Figure 129 Latin America Auto Electrification Market Share Forecast by Country, 2022 & 2032 (%)
Figure 130 Latin America Auto Electrification Market Forecast by Product Type, 2022-2032 (US$ billion)
Figure 131 Latin America Auto Electrification Market Share Forecast by Product Type, 2022 & 2032 (%)
Figure 132 Latin America Auto Electrification Market Volume Forecast by Product Type, 2022-2032 (million units)
Figure 133 Latin America Auto Electrification Market Volume Share Forecast by Product Type, 2022 & 2032 (%)
Figure 134 Latin America Auto Electrification Market Forecast by Sales Channel, 2022-2032 (US$ billion)
Figure 135 Latin America Auto Electrification Market Share Forecast by Sales Channel, 2022 & 2032 (%)
Figure 136 Latin America Auto Electrification Market Forecast by Vehicle Type, 2022-2032 (US$ billion)
Figure 137 Latin America Auto Electrification Market Share Forecast by Vehicle Type, 2022 & 2032 (%)
Figure 138 Brazil Auto Electrification Market Forecast, 2022-2032 (US$ billion, AGR %)
Figure 139 Mexico Auto Electrification Market Forecast, 2022-2032 (US$ billion, AGR %)
Figure 140 Rest of Latin America Auto Electrification Market Forecast, 2022-2032 (US$ billion, AGR %)
Figure 141 MEA Auto Electrification Market Attractiveness Index
Figure 142 MEA Auto Electrification Market by Region, 2022, 2027 & 2032 (US$ billion)
Figure 143 MEA Auto Electrification Market Forecast by Country, 2022-2032 (US$ billion)
Figure 144 MEA Auto Electrification Market Share Forecast by Country, 2022 & 2032 (%)
Figure 145 MEA Auto Electrification Market Forecast by Product Type, 2022-2032 (US$ billion)
Figure 146 MEA Auto Electrification Market Share Forecast by Product Type, 2022 & 2032 (%)
Figure 147 MEA Auto Electrification Market Volume Forecast by Product Type, 2022-2032 (million units)
Figure 148 MEA Auto Electrification Market Share Forecast by Product Type, 2022 & 2032 (%)
Figure 149 MEA Auto Electrification Market Forecast by Sales Channel, 2022-2032 (US$ billion)
Figure 150 MEA Auto Electrification Market Share Forecast by Sales Channel, 2022 & 2032 (%)
Figure 151 MEA Auto Electrification Market Forecast by Vehicle Type, 2022-2032 (US$ billion)
Figure 152 MEA Auto Electrification Market Share Forecast by Vehicle Type, 2022 & 2032 (%)
Figure 153 GCC Auto Electrification Market Forecast, 2022-2032 (US$ billion, AGR %)
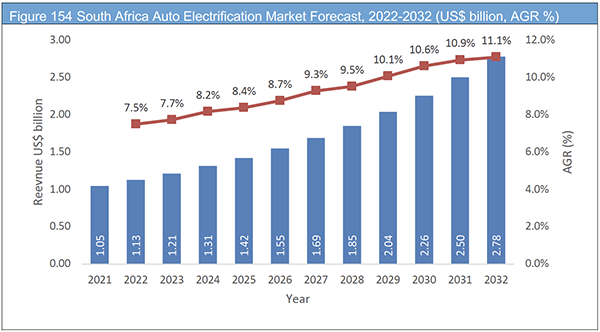
Figure 154 South Africa Auto Electrification Market Forecast, 2022-2032 (US$ billion, AGR %)
Figure 155 Rest of MEA Auto Electrification Market Forecast, 2022-2032 (US$ billion, AGR %)
Figure 156 Global Auto Electrification Market: Company Share/Ranking, 2021
Figure 157 Aisin Seiki Co., Ltd.: Net Revenue, 2017-2021 (US$ billion, AGR%)
Figure 158 Aisin Seiki Co., Ltd.: R&D, 2017-2021 (US$ billion, AGR%)
Figure 159 Aisin Seiki Co., Ltd.: Regional Market Shares, 2021
Figure 160 BorgWarner Inc: Net Revenue, 2017-2021 (US$ billion, AGR%)
Figure 161 BorgWarner Inc: R&D, 2017-2021 (US$ billion, AGR%)
Figure 162 BorgWarner Inc: Regional Market Shares, 2021
Figure 163 Robert Bosch GmbH: Net Revenue, 2017-2021 (US$ billion, AGR%)
Figure 164 Robert Bosch GmbH: R&D, 2017-2021 (US$ billion, AGR%)
Figure 165 Robert Bosch GmbH: Regional Market Shares, 2021
Figure 166 Continental AG: Net Revenue, 2017-2021 (US$ billion, AGR%)
Figure 167 Continental AG: R&D, 2017-2021 (US$ billion, AGR%)
Figure 168 Continental AG: Regional Market Shares, 2021
Figure 169 Denso Corporation: Net Revenue, 2017-2021 (US$ billion, AGR%)
Figure 170 Denso Corporation: R&D, 2017-2021 (US$ billion, AGR%)
Figure 171 Denso Corporation: Regional Market Shares, 2021
Figure 172 ZF Friedrichshafen AG: Net Revenue, 2017-2021 (US$ billion, AGR%)
Figure 173 ZF Friedrichshafen AG: R&D, 2017-2021 (US$ billion, AGR%)
Figure 174 ZF Friedrichshafen AG: Regional Market Shares, 2021
Figure 175 Johnson Electric Holdings Limited Net Revenue, 2017-2021 (US$ billion, AGR%)
Figure 176 Johnson Electric Holdings Limited: Regional Market Shares, 2021
Figure 177 Magna International Inc.: Net Revenue, 2017-2021 (US$ billion, AGR%)
Figure 178 Magna International Inc.: R&D, 2017-2021 (US$ billion, AGR%)
Figure 179 Magna International Inc.: Regional Market Shares, 2021
Figure 180 Mitsubishi Electric Corporation: Net Revenue, 2017-2021 (US$ billion, AGR%)
Figure 181 Mitsubishi Electric Corporation: R&D, 2017-2021 (US$ billion, AGR%)
Figure 182 Mitsubishi Electric Corporation: Regional Market Shares, 2021
Figure 183 Valeo SA: Net Revenue, 2017-2021 (US$ billion, AGR%)
Figure 184 Valeo SA: R&D, 2017-2021 (US$ billion, AGR%)
Figure 185 Valeo Sa: Regional Market Shares, 2021
Figure 186 Schaeffler AG: Net Revenue, 2017-2021 (US$ billion, AGR%)
Figure 187 Schaeffler AG: R&D, 2017-2021 (US$ billion, AGR%)
Figure 188 Schaeffler AG: Regional Market Shares, 2021
Figure 189 Mahle GmbH: Net Revenue, 2017-2021 (US$ billion, AGR%)
Figure 190 Mahle GmbH: R&D, 2017-2021 (US$ billion, AGR%)
Figure 191 Mahle GmbH: Regional Market Shares, 2021
Figure 192 American Axle & Manufacturing, Inc.: Net Revenue, 2017-2021 (US$ billion, AGR%)
Figure 193 American Axle & Manufacturing, Inc.: R&D, 2017-2021 (US$ billion, AGR%)
Figure 194 American Axle & Manufacturing, Inc.: Regional Market Shares, 2021
Figure 195 JTEKT Corporation: Net Revenue, 2017-2021 (US$ billion, AGR%)
Figure 196 JTEKT Corporation: R&D, 2017-2021 (US$ billion, AGR%)
Figure 197 JTEKT Corporation: Regional Market Shares, 2021
Figure 198 Global Auto Electrification Market Share by Region 2022 and 2032(%)
ページTOPに戻る
Summary
この調査レポートは世界の自動車電動化市場を調査し、製品タイプ別、販売チャネル別、車両タイプ別、地域別に2022年から2032年までの予測結果を掲載しています。また関連企業情報を提供しています。
主な掲載内容(目次より抜粋)
-
レポート概要
-
エグゼクティブサマリー
-
プレミアムインサイト
-
市場概要
-
世界の自動車電動化市場分析:製品タイプ別
-
世界の自動車電動化市場分析:販売チャネル別
-
世界の自動車電動化市場分析:車両タイプ別
-
世界の自動車電動化市場分析:地域別
-
北米の自動車電動化市場分析
-
欧州の自動車電動化市場分析
-
アジア太平洋地域の自動車電動化市場分析
-
LAMEAの自動車電動化市場分析
-
競争状況
-
主要企業のプロフィール
Report Details
The Auto Electrification Market Report 2022-2032: This report will prove invaluable to leading firms striving for new revenue pockets if they wish to better understand the industry and its underlying dynamics. It will be useful for companies that would like to expand into different industries or to expand their existing operations in a new region.
Factors Such As Increased Use of Fuel-Efficient Mobility Solutions, Increased Demand for 48V Design, and Reduction in Battery Prices per KWH Are Driving the Market Growth
In terms of technological innovation, the automotive industry has seen substantial transformation in recent years. Owing to their output efficiency and lightweight nature, electrical components are being adopted by OEMs to meet increasing consumer needs, making vehicle electrification a fuel-efficient option. Moreover, since car emissions emit harmful greenhouse gases that have health and environmental consequences, this is an important issue. Thus, governments across the globe are enforcing automobile emission standards to limit greenhouse gas emissions. These rules must be followed by manufacturers if they want to regulate the emission level. For instance, the Government of India established the BS6 emission standard in April 2020 to curb vehicle emissions of air pollutants.In addition, end users/drivers are looking for technologically improved electrical systems and components to improve the driving experience.
Reduced Automotive Production and Sales
The last two years have seen a fall in the industry’s overall growth, which has led to a decrease in both automobile production and sales. This is mostly related to changes in automotive production standards and a lack of public trust in the ability to purchase vehicles due to ambiguous government laws about emissions and safety, both of which drive up the cost of automobiles.
What Questions Should You Ask before Buying a Market Research Report?
• How is the auto electrification market evolving?
• What is driving and restraining the auto electrification market?
• How will each auto electrification submarket segment grow over the forecast period and how much revenue will these submarkets account for in 2032?
• How will the market shares for each auto electrification submarket develop from 2022 to 2032?
• What will be the main driver for the overall market from 2022 to 2032?
• Will leading auto electrification markets broadly follow the macroeconomic dynamics, or will individual national markets outperform others?
• How will the market shares of the national markets change by 2032 and which geographical region will lead the market in 2032?
• Who are the leading players and what are their prospects over the forecast period?
• What are the auto electrification projects for these leading companies?
• How will the industry evolve during the period between 2022 and 2032? What are the implications of auto electrification projects taking place now and over the next 10 years?
• Is there a greater need for product commercialisation to further scale the auto electrification market?
• Where is the auto electrification market heading and how can you ensure you are at the forefront of the market?
• What are the best investment options for new product and service lines?
• What are the key prospects for moving companies into a new growth path and C-suite?
You need to discover how this will impact the auto electrification market today, and over the next 10 years:
• Our 290-page report provides 125 tables and 198 charts/graphs exclusively to you.
• The report highlights key lucrative areas in the industry so you can target them – NOW.
• It contains in-depth analysis of global, regional and national sales and growth.
• It highlights for you the key successful trends, changes and revenue projections made by your competitors.
This report tells you TODAY how the auto electrification market will develop in the next 10 years, and in line with the variations in COVID-19 economic recession and bounce. This market is more critical now than at any point over the last 10 years.
The report delivers exclusive COVID-19 variations and economic data specific to your market.
Forecasts to 2032 and other analyses reveal commercial prospects
• In addition to revenue forecasting to 2032, our new study provides you with recent results, growth rates, and market shares.
• You will find original analyses, with business outlooks and developments.
• Discover qualitative analyses (including market dynamics, drivers, opportunities, restraints and challenges), cost structure, impact of rising auto electrification prices and recent developments.
This report includes data analysis and invaluable insight into how COVID-19 will affect the industry and your company. Four COVID-19 recovery patterns and their impact, namely, “V”, “L”, “W” and “U” are discussed in this report.
Segments Covered in the Report
Product Type
• Starter Motor
• Alternator
• Electric Car Motors
• Electric Water Pumps
• Electric Oil Pump
• Electric Vacuum Pump
• Electric Fuel Pump
• Electric Power Steering
• Actuators
• Start/ Stop System
Sales Channel
• Original Equipment Manufacturers (OEM)
• Aftermarket
Vehicle Type
• Internal Combustion Engine Vehicle
• Micro & Full Hybrid Vehicle
• Plug-In Hybrid Electric Vehicle (PHEV) & Battery Electric Vehicle (BEV)
In addition to the revenue predictions for the overall world market and segments, you will also find revenue forecasts for five regional and 17 leading national markets:
North America
• U.S.
• Canada
Europe
• Germany
• UK
• France
• Italy
• Spain
• Russia
• Rest of Europe
Asia Pacific
• Japan
• China
• India
• Indonesia
• South Korea
• Rest of Asia Pacific
Latin America
• Brazil
• Mexico
• Rest of Latin America Latin America
MEA
• GCC
• South Africa
• Rest of MEA
The report also includes profiles and for some of the leading companies in the Auto Electrification Market, 2022 to 2032, with a focus on this segment of these companies’ operations.
Leading companies and the potential for market growth
• Aisin Seiki Co., Ltd.,
• BorgWarner Inc.,
• Robert Bosch GmbH
• Continental AG
• Denso Corporation
• ZF Friedrichshafen AG
• Johnson Electric Holdings Limited
• Magna International Inc.,
• Mitsubishi Electric Corporation
• Valeo SA
• Schaeffler AG
• Mahle GmbH
• American Axle & Manufacturing, Inc.,
• JTEKT Corporation
Overall world revenue for Auto Electrification Market, 2022 to 2032 in terms of value the market will surpass US$89.6 billion in 2022, our work calculates. We predict strong revenue growth through to 2032. Our work identifies which organizations hold the greatest potential. Discover their capabilities, progress, and commercial prospects, helping you stay ahead.
How will the Auto Electrification Market, 2022 to 2032 report help you?
In summary, our 290-page report provides you with the following knowledge:
• Revenue forecasts to 2032 for Auto Electrification Market, 2022 to 2032 Market, with forecasts for process, upstream, downstream, type and company size, each forecast at a global and regional level – discover the industry’s prospects, finding the most lucrative places for investments and revenues.
• Revenue forecasts to 2032 for five regional and 17 key national markets – See forecasts for the Auto Electrification Market, 2022 to 2032 market in North America, Europe, Asia-Pacific and LAMEA. Also forecasted is the market in the US, Canada, Germany, France, UK, Italy, China, India, Japan, Mexico, Brazil, and Indonesia among other prominent economies.
• Prospects for established firms and those seeking to enter the market – including company profiles for 14 of the major companies involved in the Auto Electrification Market, 2022 to 2032.
Find quantitative and qualitative analyses with independent predictions. Receive information that only our report contains, staying informed with invaluable business intelligence.
Information found nowhere else
With our new report, you are less likely to fall behind in knowledge or miss out on opportunities. See how our work could benefit your research, analyses, and decisions. Visiongain’s study is for everybody needing commercial analyses for the Auto Electrification Market, 2022 to 2032, market-leading companies. You will find data, trends and predictions.
ページTOPに戻る
Table of Contents
Table of Contents
1. Report Overview
1.1. Objectives of the Study
1.2. Introduction to Auto Electrification Market
1.3. What This Report Delivers
1.4. Why You Should Read This Report
1.5. Key Questions Answered By This Analytical Report Include:
1.6. Who is This Report For?
1.7. Methodology
1.7.1. Market Definitions
1.7.2. Market Evaluation & Forecasting Methodology
1.7.3. Data Validation
1.7.3.1. Primary Research
1.7.3.2. Secondary Research
1.8. Frequently Asked Questions (FAQs)
1.9. Associated Visiongain Reports
1.10. About Visiongain
2. Executive Summary
3. Premium Insights
3.1. Geographical Snapshot: Global Auto Electrification Market
3.2. Product Type Segment: Market Attractiveness Index
3.3. Sales Channel Segment: Market Attractiveness Index
3.4. Vehicle Type Segment: Market Attractiveness Index
4. Market Overview
4.1. Key Findings
4.2. Market Dynamics
4.2.1. Market Driving Factors
4.2.2. Market Restraining Factors
4.2.3. Market Opportunities
4.3. COVID-19 Impact Analysis
4.4. Porter’s Five Forces Analysis
4.4.1. Supplier Power
4.4.2. Buyer Power
4.4.3. Competitive Rivalry
4.4.4. Threat from Substitutes
4.4.5. Threat of New Entrants
4.5. PEST Analysis
4.6. Automotive Batteries Packaging Trends and Outlook
5. Global Auto Electrification Market Analysis by Product Type
5.1. Key Findings
5.2. Product Type Segment Growth Prospects
5.3. Global Auto Electrification Market Share by Product Type, 2022, 2027, & 2032
5.4. Starter Motor
5.4.1. Starter Motor Market Forecast by Region, 2022-2032 (US$ Bn)
5.4.2. Starter Motor Market Share by Region, 2022-2032 (%)
5.5. Electric Car Motors
5.5.1. Electric Car Motors Market Forecast by Region, 2022-2032 (US$ Bn)
5.5.2. Electric Car Motors Market Share by Region, 2022-2032 (%)
5.6. Actuators
5.6.1. Actuators Market Forecast by Region, 2022-2032 (US$ Bn)
5.6.2. Actuators Market Share by Region, 2022-2032 (%)
5.7. Alternator
5.7.1. Alternator Market Forecast by Region, 2022-2032 (US$ Bn)
5.7.2. Alternator Market Share by Region, 2022-2032 (%)
5.8. Start/Stop System
5.8.1. Start/Stop System Market Forecast by Region, 2022-2032 (US$ Bn)
5.8.2. Start/Stop System Market Share by Region, 2022-2032 (%)
5.9. Electric Water Pumps
5.9.1. Electric Water Pumps Market Forecast by Region, 2022-2032 (US$ Bn)
5.9.2. Electric Water Pumps Market Share by Region, 2022-2032 (%)
5.10. Electric Oil Pump
5.10.1. Electric Oil Pump Market Forecast by Region, 2022-2032 (US$ Bn)
5.10.2. Electric Oil Pump Market Share by Region, 2022-2032 (%)
5.11. Electric Power Steering
5.11.1. Electric Power Steering Market Forecast by Region, 2022-2032 (US$ Bn)
5.11.2. Electric Power Steering Market Share by Region, 2022-2032 (%)
5.12. Electric Fuel Pump
5.12.1. Electric Fuel Pump Market Forecast by Region, 2022-2032 (US$ Bn)
5.12.2. Electric Fuel Pump Market Share by Region, 2022-2032 (%)
5.13. Electric Vacuum Pump
5.13.1. Electric Vacuum Pump Market Forecast by Region, 2022-2032 (US$ Bn)
5.13.2. Electric Vacuum Pump Market Share by Region, 2022-2032 (%)
5.14. Global Auto Electrification Market Size Estimation and Forecast by Product Type
6. Global Auto Electrification Market Analysis by Sales Channel
6.1. Key Findings
6.2. Sales Channel Segment Growth Prospects
6.3. Global Auto Electrification Market Share by Sales Channel, 2022, 2027, & 2032
6.4. Original Equipment Manufacturers (OEM)
6.4.1. Original Equipment Manufacturers (OEM) Market Forecast by Region, 2022-2032 (US$ Bn)
6.4.2. Original Equipment Manufacturers (OEM) Market Share by Region, 2022-2032 (%)
6.5. Aftermarket
6.5.1. Aftermarket Market Forecast by Region, 2022-2032 (US$ Bn)
6.5.2. Aftermarket Market Share by Region, 2022-2032 (%)
6.6. Global Auto Electrification Market Size Estimation and Forecast by Sales Channel
7. Global Auto Electrification Market Analysis by Vehicle Type
7.1. Key Findings
7.2. Vehicle Type Segment Growth Prospects
7.3. Global Auto Electrification Market Share by Vehicle Type, 2022, 2027, & 2032
7.4. Internal Combustion Engine Vehicle
7.4.1. Internal Combustion Engine Vehicle Market Forecast by Region, 2022-2032 (US$ Bn)
7.4.2. Internal Combustion Engine Vehicle Market Share by Region, 2022-2032 (%)
7.5. Micro & Full Hybrid Vehicle
7.5.1. Micro & Full Hybrid Vehicle Market Forecast by Region, 2022-2032 (US$ Bn)
7.5.2. Micro & Full Hybrid Vehicle Market Share by Region, 2022-2032 (%)
7.6. Plug-in Hybrid Electric Vehicle (PHEV) & Battery Electric Vehicle (BEV)
7.6.1. Plug-in Hybrid Electric Vehicle (PHEV) & Battery Electric Vehicle (BEV) Market Forecast by Region, 2022-2032 (US$ Bn)
7.6.2. Plug-in Hybrid Electric Vehicle (PHEV) & Battery Electric Vehicle (BEV) Market Share by Region, 2022-2032 (%)
7.7. Global Auto Electrification Market Size Estimation and Forecast by Vehicle Type
8. Global Auto Electrification Market Analysis by Region
8.1. Key Findings
8.2. Regional Market Size Estimation and Forecast
8.3. COVID-19 Impact Analysis: Recovery Scenarios (V, U, W, L)
9. North America Auto Electrification Market Analysis
9.1. Key Findings
9.2. North America Auto Electrification Market Attractiveness Index
9.3. North America Auto Electrification Market by Country, 2022, 2027 & 2032 (US$ bn)
9.4. North America Auto Electrification Market Size Estimation and Forecast by Country
9.5. North America Auto Electrification Market Size Estimation and Forecast by Product Type
9.6. North America Auto Electrification Market Size Estimation and Forecast by Sales Channel
9.7. North America Auto Electrification Market Size Estimation and Forecast by Vehicle Type
9.8. U.S.
9.8.1. U.S. Auto Electrification Market by Product Type
9.8.2. U.S. Auto Electrification Market by Sales Channel
9.8.3. U.S. Auto Electrification Market by Vehicle Type
9.9. Canada
9.9.1. Canada Auto Electrification Market by Product Type
9.9.2. Canada Auto Electrification Market by Sales Channel
9.9.3. Canada Auto Electrification Market by Vehicle Type
9.10. Mexico
9.10.1. Mexico Auto Electrification Market by Product Type
9.10.2. Mexico Auto Electrification Market by Sales Channel
9.10.3. Mexico Auto Electrification Market by Vehicle Type
10. Europe Auto Electrification Market Analysis
10.1. Key Findings
10.2. Europe Auto Electrification Market Attractiveness Index
10.3. Europe Auto Electrification Market by Country, 2022, 2027 & 2032 (US$ bn)
10.4. Europe Auto Electrification Market Size Estimation and Forecast by Country
10.5. Europe Auto Electrification Market Size Estimation and Forecast by Product Type
10.6. Europe Auto Electrification Market Size Estimation and Forecast by Sales Channel
10.7. Europe Auto Electrification Market Size Estimation and Forecast by Vehicle Type
10.8. Germany
10.8.1. Germany Auto Electrification Market by Product Type
10.8.2. Germany Auto Electrification Market by Sales Channel
10.8.3. Germany Auto Electrification Market by Vehicle Type
10.9. Spain
10.9.1. Spain Auto Electrification Market by Product Type
10.9.2. Spain Auto Electrification Market by Sales Channel
10.9.3. Spain Auto Electrification Market by Vehicle Type
10.10. UK
10.10.1. UK Auto Electrification Market by Product Type
10.10.2. UK Auto Electrification Market by Sales Channel
10.10.3. UK Auto Electrification Market by Vehicle Type
10.11. France
10.11.1. France Auto Electrification Market by Product Type
10.11.2. France Auto Electrification Market by Sales Channel
10.11.3. France Auto Electrification Market by Vehicle Type
10.12. Italy
10.12.1. Italy Auto Electrification Market by Product Type
10.12.2. Italy Auto Electrification Market by Sales Channel
10.12.3. Italy Auto Electrification Market by Vehicle Type
10.13. Rest of Europe
10.13.1. Rest of Europe Auto Electrification Market by Product Type
10.13.2. Rest of Europe Auto Electrification Market by Sales Channel
10.13.3. Rest of Europe Auto Electrification Market by Vehicle Type
11. Asia Pacific Auto Electrification Market Analysis
11.1. Key Findings
11.2. Asia Pacific Auto Electrification Market Attractiveness Index
11.3. Asia Pacific Auto Electrification Market by Country, 2022, 2027 & 2032 (US$ bn)
11.4. Asia Pacific Auto Electrification Market Size Estimation and Forecast by Country
11.5. Asia Pacific Auto Electrification Market Size Estimation and Forecast by Product Type
11.6. Asia Pacific Auto Electrification Market Size Estimation and Forecast by Sales Channel
11.7. Asia Pacific Auto Electrification Market Size Estimation and Forecast by Vehicle Type
11.8. China
11.8.1. China Auto Electrification Market by Product Type
11.8.2. China Auto Electrification Market by Sales Channel
11.8.3. China Auto Electrification Market by Vehicle Type
11.9. Japan
11.9.1. Japan Auto Electrification Market by Product Type
11.9.2. Japan Auto Electrification Market by Sales Channel
11.9.3. Japan Auto Electrification Market by Vehicle Type
11.10. India
11.10.1. India Auto Electrification Market by Product Type
11.10.2. India Auto Electrification Market by Sales Channel
11.10.3. India Auto Electrification Market by Vehicle Type
11.11. Australia
11.11.1. Australia Auto Electrification Market by Product Type
11.11.2. Australia Auto Electrification Market by Sales Channel
11.11.3. Australia Auto Electrification Market by Vehicle Type
11.12. South Korea
11.12.1. South Korea Auto Electrification Market by Product Type
11.12.2. South Korea Auto Electrification Market by Sales Channel
11.12.3. South Korea Auto Electrification Market by Vehicle Type
11.13. Rest of Asia Pacific
11.13.1. Rest of Asia Pacific Auto Electrification Market by Product Type
11.13.2. Rest of Asia Pacific Auto Electrification Market by Sales Channel
11.13.3. Rest of Asia Pacific Auto Electrification Market by Vehicle Type
12. LAMEA Auto Electrification Market Analysis
12.1. Key Findings
12.2. LAMEA Auto Electrification Market Attractiveness Index
12.3. LAMEA Auto Electrification Market by Country, 2022, 2027 & 2032 (US$ bn)
12.4. LAMEA Auto Electrification Market Size Estimation and Forecast by Country
12.5. LAMEA Auto Electrification Market Size Estimation and Forecast by Product Type
12.6. LAMEA Auto Electrification Market Size Estimation and Forecast by Sales Channel
12.7. LAMEA Auto Electrification Market Size Estimation and Forecast by Vehicle Type
12.8. Brazil
12.8.1. Brazil Auto Electrification Market by Product Type
12.8.2. Brazil Auto Electrification Market by Sales Channel
12.8.3. Brazil Auto Electrification Market by Vehicle Type
12.9. Turkey
12.9.1. Turkey Auto Electrification Market by Product Type
12.9.2. Turkey Auto Electrification Market by Sales Channel
12.9.3. Turkey Auto Electrification Market by Vehicle Type
12.10. Saudi Arabia
12.10.1. Saudi Arabia Auto Electrification Market by Product Type
12.10.2. Saudi Arabia Auto Electrification Market by Sales Channel
12.10.3. Saudi Arabia Auto Electrification Market by Vehicle Type
12.11. South Africa
12.11.1. South Africa Auto Electrification Market by Product Type
12.11.2. South Africa Auto Electrification Market by Sales Channel
12.11.3. South Africa Auto Electrification Market by Vehicle Type
12.12. UAE
12.12.1. UAE Auto Electrification Market by Product Type
12.12.2. UAE Auto Electrification Market by Sales Channel
12.12.3. UAE Auto Electrification Market by Vehicle Type
12.13. Rest of Latin America
12.13.1. Rest of Latin America Auto Electrification Market by Product Type
12.13.2. Rest of Latin America Auto Electrification Market by Sales Channel
12.13.3. Rest of Latin America Auto Electrification Market by Vehicle Type
13. Competitive Landscape
13.1. Company Share Analysis
13.2. Key Business Strategy Analysis
13.3. Competition Dashboard
14. Company Profiles
14.1. Aisin Seiki
14.1.1. Company Snapshot
14.1.2. Company Overview
14.1.3. Financial Analysis
14.1.3.1. Net Revenue, 2017-2021
14.1.3.2. Regional Market Shares, 2021
14.1.3.3. Gross Profit, 2017-2021
14.1.3.4. R&D, 2017-2021
14.1.4. Product Benchmarking
14.1.5. Strategic Outlook
14.2. BorgWarner Inc.
14.2.1. Company Snapshot
14.2.2. Company Overview
14.2.3. Financial Analysis
14.2.3.1. Net Revenue, 2017-2021
14.2.3.2. Regional Market Shares, 2021
14.2.3.3. Gross Profit, 2017-2021
14.2.3.4. R&D, 2017-2021
14.2.4. Product Benchmarking
14.2.5. Strategic Outlook
14.3. Bosch
14.3.1. Company Snapshot
14.3.2. Company Overview
14.3.3. Financial Analysis
14.3.3.1. Net Revenue, 2017-2021
14.3.3.2. Regional Market Shares, 2021
14.3.3.3. Gross Profit, 2017-2021
14.3.3.4. R&D, 2017-2021
14.3.4. Product Benchmarking
14.3.5. Strategic Outlook
14.4. Continental AG
14.4.1. Company Snapshot
14.4.2. Company Overview
14.4.3. Financial Analysis
14.4.3.1. Net Revenue, 2017-2021
14.4.3.2. Regional Market Shares, 2021
14.4.3.3. Gross Profit, 2017-2021
14.4.3.4. R&D, 2017-2021
14.4.4. Product Benchmarking
14.4.5. Strategic Outlook
14.5. Delphi Technologies
14.5.1. Company Snapshot
14.5.2. Company Overview
14.5.3. Financial Analysis
14.5.3.1. Net Revenue, 2017-2021
14.5.3.2. Regional Market Shares, 2021
14.5.3.3. Gross Profit, 2017-2021
14.5.3.4. R&D, 2017-2021
14.5.4. Product Benchmarking
14.5.5. Strategic Outlook
14.6. Denso Corporation
14.6.1. Company Snapshot
14.6.2. Company Overview
14.6.3. Financial Analysis
14.6.3.1. Net Revenue, 2017-2021
14.6.3.2. Regional Market Shares, 2021
14.6.3.3. Gross Profit, 2017-2021
14.6.3.4. R&D, 2017-2021
14.6.4. Product Benchmarking
14.6.5. Strategic Outlook
14.7. Johnson Controls
14.7.1. Company Snapshot
14.7.2. Company Overview
14.7.3. Financial Analysis
14.7.3.1. Net Revenue, 2017-2021
14.7.3.2. Regional Market Shares, 2021
14.7.3.3. Gross Profit, 2017-2021
14.7.3.4. R&D, 2017-2021
14.7.4. Product Benchmarking
14.7.5. Strategic Outlook
14.8. Johnson Electric
14.8.1. Company Snapshot
14.8.2. Company Overview
14.8.3. Financial Analysis
14.8.3.1. Net Revenue, 2017-2021
14.8.3.2. Regional Market Shares, 2021
14.8.3.3. Gross Profit, 2017-2021
14.8.3.4. R&D, 2017-2021
14.8.4. Product Benchmarking
14.8.5. Strategic Outlook
14.9. Magna International Inc.
14.9.1. Company Snapshot
14.9.2. Company Overview
14.9.3. Financial Analysis
14.9.3.1. Net Revenue, 2017-2021
14.9.3.2. Regional Market Shares, 2021
14.9.3.3. Gross Profit, 2017-2021
14.9.3.4. R&D, 2017-2021
14.9.4. Product Benchmarking
14.9.5. Strategic Outlook
14.10. Mitsubishi Electric
14.10.1. Company Snapshot
14.10.2. Company Overview
14.10.3. Financial Analysis
14.10.3.1. Net Revenue, 2017-2021
14.10.3.2. Regional Market Shares, 2021
14.10.3.3. Gross Profit, 2017-2021
14.10.3.4. R&D, 2017-2021
14.10.4. Product Benchmarking
14.10.5. Strategic Outlook
15. Conclusion and Recommendations
15.1. Concluding Remarks from Visiongain
15.2. Recommendations for Market Players
List of Tables
Table 1 Global Auto Electrification Market Snapshot, 2022 & 2032 (US$ billion, CAGR %)
Table 2 Global Auto Electrification Market by Region, 2022-2032 (US$ bn, AGR (%), CAGR (%)): “V” Shaped Recovery Scenario
Table 3 Global Auto Electrification Market by Region, 2022-2032 (US$ bn, AGR (%), CAGR (%)): “U” Shaped Recovery Scenario
Table 4 Global Auto Electrification Market by Region, 2022-2032 (US$ bn, AGR (%), CAGR (%)): “W” Shaped Recovery Scenario
Table 5 Global Auto Electrification Market by Region, 2022-2032 (US$ bn, AGR (%), CAGR (%)): “L” Shaped Recovery Scenario
Table 6 Rechargeable Battery Applications, Level of Power Requirements, and Packaging
Table 7 Global Auto Electrification Market Forecast by Product Type, 2022-2032 (US$ bn, AGR%, CAGR%)
Table 8 Global Auto Electrification Market Volume Forecast by Product Type, 2022-2032 (Mn units, AGR%, CAGR%)
Table 9 Starter Motor Market Forecast by Region, 2022-2032 (US$ bn, AGR%, CAGR%)
Table 10 Starter Motor Market Volume Forecast by Region, 2022-2032 (Mn units, AGR%, CAGR%)
Table 11 Alternator Market Forecast by Region, 2022-2032 (US$ bn, AGR%, CAGR%)
Table 12 Alternator Market Volume Forecast by Region, 2022-2032 (Mn units, AGR%, CAGR%)
Table 13 Electric Car Motor Market Forecast by Region, 2022-2032 (US$ bn, AGR%, CAGR%)
Table 14 Electric Car Motor Market Volume Forecast by Region, 2022-2032 (Mn units, AGR%, CAGR%)
Table 15 Electric Water Pumps Market Forecast by Region, 2022-2032 (US$ bn, AGR%, CAGR%)
Table 16 Electric Water Pumps Market Volume Forecast by Region, 2022-2032 (Mn units, AGR%, CAGR%)
Table 17 Electric Oil Pump Market Forecast by Region, 2022-2032 (US$ bn, AGR%, CAGR%)
Table 18 Electric Oil Pump Market Volume Forecast by Region, 2022-2032 (Mn units, AGR%, CAGR%)
Table 19 Electric Vacuum Pump Market Forecast by Region, 2022-2032 (US$ bn, AGR%, CAGR%)
Table 20 Electric Vacuum Pump Market Forecast by Region, 2022-2032 (Mn units, AGR%, CAGR%)
Table 21 Electric Fuel Pump Market Forecast by Region, 2022-2032 (US$ bn, AGR%, CAGR%)
Table 22 Electric Fuel Pump Market Volume Forecast by Region, 2022-2032 (Mn units, AGR%, CAGR%)
Table 23 Electric Power Steering Market Forecast by Region, 2022-2032 (US$ bn, AGR%, CAGR%)
Table 24 Electric Power Steering Market Volume Forecast by Region, 2022-2032 (Mn units, AGR%, CAGR%)
Table 25 Actuators Market Forecast by Region, 2022-2032 (US$ bn, AGR%, CAGR%)
Table 26 Actuators Market Volume Forecast by Region, 2022-2032 (Mn units, AGR%, CAGR%)
Table 27 Start/ Stop System Market Forecast by Region, 2022-2032 (US$ bn, AGR%, CAGR%)
Table 28 Start/ Stop System Market Volume Forecast by Region, 2022-2032 (Mn units, AGR%, CAGR%)
Table 29 Global Auto Electrification Market Forecast by Sales Channel, 2022-2032 (US$ bn, AGR%, CAGR%)
Table 30 Original Equipment Manufacturers (OEM) Market Forecast by Region, 2022-2032 (US$ bn, AGR%, CAGR%)
Table 31 Aftermarket Market Forecast by Region, 2022-2032 (US$ bn, AGR%, CAGR%)
Table 32 Global Auto Electrification Market Forecast by Vehicle Type, 2022-2032 (US$ bn, AGR%, CAGR%)
Table 33 Internal Combustion Engine Vehicle Market Forecast by Region, 2022-2032 (US$ bn, AGR%, CAGR%)
Table 34 Micro & Full Hybrid Vehicle Market Forecast by Region, 2022-2032 (US$ bn, AGR%, CAGR%)
Table 35 Plug-in Hybrid Electric Vehicle (PHEV) & Battery Electric Vehicle (BEV) Market Forecast by Region, 2022-2032 (US$ bn, AGR%, CAGR%)
Table 36 Global Auto Electrification Market by Region, 2022-2032 (US$ bn, AGR (%), CAGR (%))
Table 37 North America Auto Electrification Market Forecast by Country, 2022-2032 (US$ bn, AGR%, CAGR%)
Table 38 North America Auto Electrification Market Forecast by Product Type, 2022-2032 (US$ bn, AGR%, CAGR%)
Table 39 North America Auto Electrification Market Volume Forecast by Product Type, 2022-2032 (Mn units, AGR%, CAGR%)
Table 40 North America Auto Electrification Market Forecast by Sales Channel, 2022-2032 (US$ bn, AGR%, CAGR%)
Table 41 North America Auto Electrification Market Forecast by Vehicle Type, 2022-2032 (US$ bn, AGR%, CAGR%)
Table 42 U.S. Auto Electrification Market Forecast, 2022-2032 (US$ bn, AGR%, CAGR%)
Table 43 Canada Auto Electrification Market Forecast, 2022-2032 (US$ bn, AGR%, CAGR%)
Table 44 Europe Auto Electrification Market Forecast by Country, 2022-2032 (US$ bn, AGR%, CAGR%)
Table 45 Europe Auto Electrification Market Forecast by Product Type, 2022-2032 (US$ bn, AGR%, CAGR%)
Table 46 Europe Auto Electrification Market Volume Forecast by Product Type, 2022-2032 (Mn units, AGR%, CAGR%)
Table 47 Europe Auto Electrification Market Forecast by Sales Channel, 2022-2032 (US$ bn, AGR%, CAGR%)
Table 48 Europe Auto Electrification Market Forecast by Vehicle Type, 2022-2032 (US$ bn, AGR%, CAGR%)
Table 49 Germany Auto Electrification Market Forecast, 2022-2032 (US$ bn, AGR%, CAGR%)
Table 50 UK Auto Electrification Market Forecast, 2022-2032 (US$ bn, AGR%, CAGR%)
Table 51 France Auto Electrification Market Forecast, 2022-2032 (US$ bn, AGR%, CAGR%)
Table 52 Italy Auto Electrification Market Forecast, 2022-2032 (US$ bn, AGR%, CAGR%)
Table 53 Spain Auto Electrification Market Forecast, 2022-2032 (US$ bn, AGR%, CAGR%)
Table 54 Russia Auto Electrification Market Forecast, 2022-2032 (US$ bn, AGR%, CAGR%)
Table 55 Rest of Europe Auto Electrification Market Forecast, 2022-2032 (US$ bn, AGR%, CAGR%)
Table 56 Asia Pacific Auto Electrification Market Forecast by Country, 2022-2032 (US$ bn, AGR%, CAGR%)
Table 57 Asia Pacific Auto Electrification Market Forecast by Product Type, 2022-2032 (US$ bn, AGR%, CAGR%)
Table 58 Asia Pacific Auto Electrification Market Volume Forecast by Product Type, 2022-2032 (Mn units, AGR%, CAGR%)
Table 59 Asia Pacific Auto Electrification Market Forecast by Sales Channel, 2022-2032 (US$ bn, AGR%, CAGR%)
Table 60 Asia Pacific Auto Electrification Market Forecast by Vehicle Type, 2022-2032 (US$ bn, AGR%, CAGR%)
Table 61 Japan Auto Electrification Market Forecast, 2022-2032 (US$ bn, AGR%, CAGR%)
Table 62 China Auto Electrification Market Forecast, 2022-2032 (US$ bn, AGR%, CAGR%)
Table 63 India Auto Electrification Market Forecast, 2022-2032 (US$ bn, AGR%, CAGR%)
Table 64 Indonesia Auto Electrification Market Forecast, 2022-2032 (US$ bn, AGR%, CAGR%)
Table 65 South Korea Auto Electrification Market Forecast, 2022-2032 (US$ bn, AGR%, CAGR%)
Table 66 Rest of Asia Pacific Auto Electrification Market Forecast, 2022-2032 (US$ bn, AGR%, CAGR%)
Table 67 Latin America Auto Electrification Market Forecast by Country, 2022-2032 (US$ bn, AGR%, CAGR%)
Table 68 Latin America Auto Electrification Market Forecast by Product Type, 2022-2032 (US$ bn, AGR%, CAGR%)
Table 69 Latin America Auto Electrification Market Volume Forecast by Product Type, 2022-2032 (Mn units, AGR%, CAGR%)
Table 70 Latin America Auto Electrification Market Forecast by Sales Channel, 2022-2032 (US$ bn, AGR%, CAGR%)
Table 71 Latin America Auto Electrification Market Forecast by Vehicle Type, 2022-2032 (US$ bn, AGR%, CAGR%)
Table 72 Brazil Auto Electrification Market Forecast, 2022-2032 (US$ bn, AGR%, CAGR%)
Table 73 Mexico Auto Electrification Market Forecast, 2022-2032 (US$ bn, AGR%, CAGR%)
Table 74 Rest of Latin America Auto Electrification Market Forecast, 2022-2032 (US$ bn, AGR%, CAGR%)
Table 75 MEA Auto Electrification Market Forecast by Country, 2022-2032 (US$ bn, AGR%, CAGR%)
Table 76 MEA Auto Electrification Market Forecast by Product Type, 2022-2032 (US$ bn, AGR%, CAGR%)
Table 77 MEA Auto Electrification Market Volume Forecast by Product Type, 2022-2032 (Mn units, AGR%, CAGR%)
Table 78 MEA Auto Electrification Market Forecast by Sales Channel, 2022-2032 (US$ bn, AGR%, CAGR%)
Table 79 MEA Auto Electrification Market Forecast by Vehicle Type, 2022-2032 (US$ bn, AGR%, CAGR%)
Table 80 GCC Auto Electrification Market Forecast, 2022-2032 (US$ bn, AGR%, CAGR%)
Table 81 South Africa Auto Electrification Market Forecast, 2022-2032 (US$ bn, AGR%, CAGR%)
Table 82 Rest of MEA Auto Electrification Market Forecast, 2022-2032 (US$ bn, AGR%, CAGR%)
Table 83 Homeland Security Market Recent Developments, 2017-2021
Table 84 Aisin Seiki Co., Ltd.: Key Details, (CEO, HQ, Revenue, Founded, No. of Employees, Company Type, Website, Business Segment)
Table 85 Aisin Seiki Co., Ltd.: Product Benchmarking
Table 86 Aisin Seiki Co., Ltd.: Strategic Outlook
Table 87 BorgWarner Inc, Key Details, (CEO, HQ, Revenue, Founded, No. of Employees, Company Type, Website, Business Segment)
Table 88 BorgWarner Inc: Product Benchmarking
Table 89 BorgWarner Inc: Strategic Outlook
Table 90 Robert Bosch GmbH: Key Details, (CEO, HQ, Revenue, Founded, No. of Employees, Company Type, Website, Business Segment)
Table 91 Robert Bosch GmbH: Product Benchmarking
Table 92 Robert Bosch GmbH: Strategic Outlook
Table 93 Continental AG: Key Details, (CEO, HQ, Revenue, Founded, No. of Employees, Company Type, Website, Business Segment)
Table 94 Continental AG: Product Benchmarking
Table 95 Continental AG: Strategic Outlook
Table 96 Denso Corporation: Key Details, (CEO, HQ, Revenue, Founded, No. of Employees, Company Type, Website, Business Segment)
Table 97 Denso Corporation: Product Benchmarking
Table 98 Denso Corporation: Strategic Outlook
Table 99 ZF Friedrichshafen AG: Key Details, (CEO, HQ, Revenue, Founded, No. of Employees, Company Type, Website, Business Segment)
Table 100 ZF Friedrichshafen AG: Product Benchmarking
Table 101 ZF Friedrichshafen AG: Strategic Outlook
Table 102 Johnson Electric Holdings Limited: Key Details, (CEO, HQ, Revenue, Founded, No. of Employees, Company Type, Website, Business Segment)
Table 103 Johnson Electric Holdings Limited: Product Benchmarking
Table 104 Johnson Electric Holdings Limited: Strategic Outlook
Table 105 Magna International Inc.: Key Details, (CEO, HQ, Revenue, Founded, No. of Employees, Company Type, Website, Business Segment)
Table 106 Magna International Inc.: Product Benchmarking
Table 107 Magna International Inc.: Strategic Outlook
Table 108 Mitsubishi Electric Corporation: Key Details, (CEO, HQ, Revenue, Founded, No. of Employees, Company Type, Website, Business Segment)
Table 109 Mitsubishi Electric Corporation: Product Benchmarking
Table 110 Mitsubishi Electric Corporation: Strategic Outlook
Table 111 Valeo SA: Key Details, (CEO, HQ, Revenue, Founded, No. of Employees, Company Type, Website, Business Segment)
Table 112 Valeo SA: Product Benchmarking
Table 113 Valeo SA: Strategic Outlook
Table 114 Schaeffler AG: Key Details, (CEO, HQ, Revenue, Founded, No. of Employees, Company Type, Website, Business Segment)
Table 115 Schaeffler AG: Product Benchmarking
Table 116 Schaeffler AG: Strategic Outlook
Table 117 Mahle GmbH: Key Details, (CEO, HQ, Revenue, Founded, No. of Employees, Company Type, Website, Business Segment)
Table 118 Mahle GmbH: Product Benchmarking
Table 119 Mahle GmbH: Strategic Outlook
Table 120 American Axle & Manufacturing, Inc.: Key Details, (CEO, HQ, Revenue, Founded, No. of Employees, Company Type, Website, Business Segment)
Table 121 American Axle & Manufacturing, Inc.: Product Benchmarking
Table 122 American Axle & Manufacturing, Inc.: Strategic Outlook
Table 123 JTEKT Corporation: Key Details, (CEO, HQ, Revenue, Founded, No. of Employees, Company Type, Website, Business Segment)
Table 124 JTEKT Corporation: Product Benchmarking
Table 125 JTEKT Corporation: Strategic Outlook
List of Figures
Figure 1 Global Auto Electrification Market Segmentation
Figure 2 Global Auto Electrification Market by Product Type: Market Attractiveness Index
Figure 3 Global Auto Electrification Market Attractiveness Index by Region
Figure 4 Global Auto Electrification Market: Market Dynamics
Figure 5 Global COVID Impact Analysis: Auto Electrification Market Recovery Scenarios
Figure 6 Global Auto Electrification Market by Region, 2022-2032 (US$ bn, AGR (%), CAGR (%)): “V” Shaped Recovery
Figure 7 Global Auto Electrification Market by Region, 2022-2032 (US$ bn, AGR (%), CAGR (%)): “U” Shaped Recovery
Figure 8 Global Auto Electrification Market by Region, 2022-2032 (US$ bn, AGR (%), CAGR (%)): “W” Shaped Recovery
Figure 9 Global Auto Electrification Market by Region, 2022-2032 (US$ bn, AGR (%), CAGR (%)): “L” Shaped Recovery
Figure 10 Global Auto Electrification Market: Porter’s Five Forces Analysis
Figure 11 Global Auto Electrification Market: PEST Analysis
Figure 12 Global Auto Electrification Market Attractiveness Index by Product Type
Figure 13 Global Auto Electrification Market Forecast by Product Type, 2022-2032 (US$ billion)
Figure 14 Global Auto Electrification Market Volume Forecast by Product Type, 2022-2032 (million units)
Figure 15 Global Auto Electrification Market Volume Share Forecast by Product Type, 2022, 2027, 2032 (%)
Figure 16 Starter Motor Market Forecast by Region, 2022-2032 (US$ billion)
Figure 17 Starter Motor Market Share Forecast by Region, 2022 & 2032 (%)
Figure 18 Starter Motor Market Volume Forecast by Region, 2022-2032 (million units)
Figure 19 Starter Motor Market Volume Share Forecast by Region, 2022 & 2032 (%)
Figure 20 Alternator Market Forecast by Region, 2022-2032 (US$ billion)
Figure 21 Alternator Market Share Forecast by Region, 2022 & 2032 (%)
Figure 22 Alternator Market Volume Forecast by Region, 2022-2032 (million units)
Figure 23 Alternator Market Volume Share Forecast by Region, 2022 & 2032 (%)
Figure 24 Electric Car Motor Market Forecast by Region, 2022-2032 (US$ billion)
Figure 25 Electric Car Motor Market Share Forecast by Region, 2022 & 2032 (%)
Figure 26 Electric Car Motor Market Volume Forecast by Region, 2022-2032 (million units)
Figure 27 Electric Car Motor Volume Market Share Forecast by Region, 2022 & 2032 (%)
Figure 28 Electric Water Pumps Market Forecast by Region, 2022-2032 (US$ billion)
Figure 29 Electric Water Pumps Market Share Forecast by Region, 2022 & 2032 (%)
Figure 30 Electric Water Pumps Market Volume Forecast by Region, 2022-2032 (million units)
Figure 31 Electric Water Pumps Market Volume Share Forecast by Region, 2022 & 2032 (%)
Figure 32 Electric Oil Pump Market Forecast by Region, 2022-2032 (US$ billion)
Figure 33 Electric Oil Pump Market Share Forecast by Region, 2022 & 2032 (%)
Figure 34 Electric Oil Pump Market Volume Forecast by Region, 2022-2032 (million units)
Figure 35 Electric Oil Pump Market Volume Share Forecast by Region, 2022 & 2032 (%)
Figure 36 Electric Vacuum Pump Market Forecast by Region, 2022-2032 (US$ billion)
Figure 37 Electric Vacuum Pump Market Share Forecast by Region, 2022 & 2032 (%)
Figure 38 Electric Vacuum Pump Market Volume Forecast by Region, 2022-2032 (million units)
Figure 39 Electric Vacuum Pump Market Volume Share Forecast by Region, 2022 & 2032 (%)
Figure 40 Electric Fuel Pump Market Forecast by Region, 2022-2032 (US$ billion)
Figure 41 Electric Fuel Pump Market Share Forecast by Region, 2022 & 2032 (%)
Figure 42 Electric Fuel Pump Market Volume Forecast by Region, 2022-2032 (million units)
Figure 43 Electric Fuel Pump Market Volume Share Forecast by Region, 2022 & 2032 (%)
Figure 44 Electric Power Steering Market Forecast by Region, 2022-2032 (US$ billion)
Figure 45 Electric Power Steering Market Share Forecast by Region, 2022 & 2032 (%)
Figure 46 Electric Power Steering Market Volume Forecast by Region, 2022-2032 (million units)
Figure 47 Electric Power Steering Market Volume Share Forecast by Region, 2022 & 2032 (%)
Figure 48 Actuators Market Forecast by Region, 2022-2032 (US$ billion)
Figure 49 Actuators Market Share Forecast by Region, 2022 & 2032 (%)
Figure 50 Actuators Market Volume Forecast by Region, 2022-2032 (million units)
Figure 51 Actuators Market Volume Share Forecast by Region, 2022 & 2032 (%)
Figure 52 Start/ Stop System Market Forecast by Region, 2022-2032 (US$ billion)
Figure 53 Start/ Stop System Market Share Forecast by Region, 2022 & 2032 (%)
Figure 54 Start/ Stop System Market Volume Forecast by Region, 2022-2032 (million units)
Figure 55 Start/ Stop System Market Volume Share Forecast by Region, 2022 & 2032 (%)
Figure 56 Global Auto Electrification Market Attractiveness Index by Sales Channel
Figure 57 Global Auto Electrification Market Forecast by Sales Channel, 2022-2032 (US$ billion)
Figure 58 Global Auto Electrification Market Share Forecast by Sales Channel, 2022, 2027, 2032 (%)
Figure 59 Original Equipment Manufacturers (OEM) Market Forecast by Region, 2022-2032 (US$ billion)
Figure 60 Original Equipment Manufacturers (OEM) Market Share Forecast by Region, 2022 & 2032 (%)
Figure 61 Aftermarket Market Forecast by Region, 2022-2032 (US$ billion)
Figure 62 Aftermarket Market Share Forecast by Region, 2022 & 2032 (%)
Figure 63 Global Auto Electrification Market Attractiveness by Vehicle Type
Figure 64 Global Auto Electrification Market Forecast by Vehicle Type, 2022-2032 (US$ billion)
Figure 65 Global Auto Electrification Market Share Forecast by Vehicle Type, 2022, 2027, 2032 (%)
Figure 66 Internal Combustion Engine Vehicle Market Forecast by Region, 2022-2032 (US$ billion)
Figure 67 Internal Combustion Engine Vehicle Market Share Forecast by Region, 2022 & 2032 (%)
Figure 68 Micro & Full Hybrid Vehicle Market Forecast by Region, 2022-2032 (US$ billion)
Figure 69 Micro & Full Hybrid Vehicle Market Share Forecast by Region, 2022 & 2032 (%)
Figure 70 Plug-in Hybrid Electric Vehicle (PHEV) & Battery Electric Vehicle (BEV) Market Forecast by Region, 2022-2032 (US$ billion)
Figure 71 Plug-in Hybrid Electric Vehicle (PHEV) & Battery Electric Vehicle (BEV) Market Share Forecast by Region, 2022 & 2032 (%)
Figure 72 Global Auto Electrification Market Forecast by Region 2022, 2027, 2032 (Revenue, CAGR%)
Figure 73 Global Auto Electrification Market Share Forecast by Region 2022, 2027, 2032(%)
Figure 74 Global Auto Electrification Market by Region, 2022-2032 (US$ bn, AGR (%), CAGR (%))
Figure 75 North America Auto Electrification Market Attractiveness Index
Figure 76 North America Auto Electrification Market by Country, 2022, 2027 & 2032 (US$ billion)
Figure 77 North America Auto Electrification Market Forecast by Country, 2022-2032 (US$ billion)
Figure 78 North America Auto Electrification Market Share Forecast by Country, 2022 & 2032 (%)
Figure 79 North America Auto Electrification Market Forecast by Product Type, 2022-2032 (US$ billion)
Figure 80 North America Auto Electrification Market Share Forecast by Product Type, 2022 & 2032 (%)
Figure 81 North America Auto Electrification Market Volume Forecast by Product Type, 2022-2032 (million units)
Figure 82 North America Auto Electrification Market Volume Share Forecast by Product Type, 2022 & 2032 (%)
Figure 83 North America Auto Electrification Market Forecast by Sales Channel, 2022-2032 (US$ billion)
Figure 84 North America Auto Electrification Market Share Forecast by Sales Channel, 2022 & 2032 (%)
Figure 85 North America Auto Electrification Market Forecast by Vehicle Type, 2022-2032 (US$ billion)
Figure 86 North America Auto Electrification Market Share Forecast by Vehicle Type, 2022 & 2032 (%)
Figure 87 U.S. Auto Electrification Market Forecast, 2022-2032 (US$ billion, AGR %)
Figure 88 Canada Auto Electrification Market Forecast, 2022-2032 (US$ billion, AGR %)
Figure 89 Europe Auto Electrification Market Attractiveness Index
Figure 90 Europe Auto Electrification Market by Region, 2022, 2027 & 2032 (US$ billion)
Figure 91 Europe Auto Electrification Market Forecast by Country, 2022-2032 (US$ billion)
Figure 92 Europe Auto Electrification Market Share Forecast by Country, 2022 & 2032 (%)
Figure 93 Europe Auto Electrification Market Forecast by Product Type, 2022-2032 (US$ billion)
Figure 94 Europe Auto Electrification Market Share Forecast by Product Type, 2022 & 2032 (%)
Figure 95 Europe Auto Electrification Market Volume Forecast by Product Type, 2022-2032 (million units)
Figure 96 Europe Auto Electrification Market Volume Share Forecast by Product Type, 2022 & 2032 (%)
Figure 97 Europe Auto Electrification Market Forecast by Sales Channel, 2022-2032 (US$ billion)
Figure 98 Europe Auto Electrification Market Share Forecast by Sales Channel, 2022 & 2032 (%)
Figure 99 Europe Auto Electrification Market Forecast by Vehicle Type, 2022-2032 (US$ billion)
Figure 100 Europe Auto Electrification Market Share Forecast by Vehicle Type, 2022 & 2032 (%)
Figure 101 Germany Auto Electrification Market Forecast, 2022-2032 (US$ billion, AGR %)
Figure 102 UK Auto Electrification Market Forecast, 2022-2032 (US$ billion, AGR %)
Figure 103 France Auto Electrification Market Forecast, 2022-2032 (US$ billion, AGR %)
Figure 104 Italy Auto Electrification Market Forecast, 2022-2032 (US$ billion, AGR %)
Figure 105 Spain Auto Electrification Market Forecast, 2022-2032 (US$ billion, AGR %)
Figure 106 Russia Auto Electrification Market Forecast, 2022-2032 (US$ billion, AGR %)
Figure 107 Rest of Europe Auto Electrification Market Forecast, 2022-2032 (US$ billion, AGR %)
Figure 108 Asia Pacific Auto Electrification Market Attractiveness Index
Figure 109 Asia Pacific Auto Electrification Market by Region, 2022, 2027 & 2032 (US$ billion)
Figure 110 Asia Pacific Auto Electrification Market Forecast by Country, 2022-2032 (US$ billion)
Figure 111 Asia Pacific Auto Electrification Market Share Forecast by Country, 2022 & 2032 (%)
Figure 112 Asia Pacific Auto Electrification Market Forecast by Product Type, 2022-2032 (US$ billion)
Figure 113 Asia Pacific Auto Electrification Market Share Forecast by Product Type, 2022 & 2032 (%)
Figure 114 Asia Pacific Auto Electrification Market Volume Forecast by Product Type, 2022-2032 (million units)
Figure 115 Asia Pacific Auto Electrification Market Volume Share Forecast by Product Type, 2022 & 2032 (%)
Figure 116 Asia Pacific Auto Electrification Market Forecast by Sales Channel, 2022-2032 (US$ billion)
Figure 117 Asia Pacific Auto Electrification Market Share Forecast by Sales Channel, 2022 & 2032 (%)
Figure 118 Asia Pacific Auto Electrification Market Forecast by Vehicle Type, 2022-2032 (US$ billion)
Figure 119 Asia Pacific Auto Electrification Market Share Forecast by Vehicle Type, 2022 & 2032 (%)
Figure 120 Japan Auto Electrification Market Forecast, 2022-2032 (US$ billion, AGR %)
Figure 121 China Auto Electrification Market Forecast, 2022-2032 (US$ billion, AGR %)
Figure 122 India Auto Electrification Market Forecast, 2022-2032 (US$ billion, AGR %)
Figure 123 Indonesia Auto Electrification Market Forecast, 2022-2032 (US$ billion, AGR %)
Figure 124 South Korea Auto Electrification Market Forecast, 2022-2032 (US$ billion, AGR %)
Figure 125 Rest of Asia Pacific Auto Electrification Market Forecast, 2022-2032 (US$ billion, AGR %)
Figure 126 Latin America Auto Electrification Market Attractiveness Index
Figure 127 Latin America Auto Electrification Market by Region, 2022, 2027 & 2032 (US$ billion)
Figure 128 Latin America Auto Electrification Market Forecast by Country, 2022-2032 (US$ billion)
Figure 129 Latin America Auto Electrification Market Share Forecast by Country, 2022 & 2032 (%)
Figure 130 Latin America Auto Electrification Market Forecast by Product Type, 2022-2032 (US$ billion)
Figure 131 Latin America Auto Electrification Market Share Forecast by Product Type, 2022 & 2032 (%)
Figure 132 Latin America Auto Electrification Market Volume Forecast by Product Type, 2022-2032 (million units)
Figure 133 Latin America Auto Electrification Market Volume Share Forecast by Product Type, 2022 & 2032 (%)
Figure 134 Latin America Auto Electrification Market Forecast by Sales Channel, 2022-2032 (US$ billion)
Figure 135 Latin America Auto Electrification Market Share Forecast by Sales Channel, 2022 & 2032 (%)
Figure 136 Latin America Auto Electrification Market Forecast by Vehicle Type, 2022-2032 (US$ billion)
Figure 137 Latin America Auto Electrification Market Share Forecast by Vehicle Type, 2022 & 2032 (%)
Figure 138 Brazil Auto Electrification Market Forecast, 2022-2032 (US$ billion, AGR %)
Figure 139 Mexico Auto Electrification Market Forecast, 2022-2032 (US$ billion, AGR %)
Figure 140 Rest of Latin America Auto Electrification Market Forecast, 2022-2032 (US$ billion, AGR %)
Figure 141 MEA Auto Electrification Market Attractiveness Index
Figure 142 MEA Auto Electrification Market by Region, 2022, 2027 & 2032 (US$ billion)
Figure 143 MEA Auto Electrification Market Forecast by Country, 2022-2032 (US$ billion)
Figure 144 MEA Auto Electrification Market Share Forecast by Country, 2022 & 2032 (%)
Figure 145 MEA Auto Electrification Market Forecast by Product Type, 2022-2032 (US$ billion)
Figure 146 MEA Auto Electrification Market Share Forecast by Product Type, 2022 & 2032 (%)
Figure 147 MEA Auto Electrification Market Volume Forecast by Product Type, 2022-2032 (million units)
Figure 148 MEA Auto Electrification Market Share Forecast by Product Type, 2022 & 2032 (%)
Figure 149 MEA Auto Electrification Market Forecast by Sales Channel, 2022-2032 (US$ billion)
Figure 150 MEA Auto Electrification Market Share Forecast by Sales Channel, 2022 & 2032 (%)
Figure 151 MEA Auto Electrification Market Forecast by Vehicle Type, 2022-2032 (US$ billion)
Figure 152 MEA Auto Electrification Market Share Forecast by Vehicle Type, 2022 & 2032 (%)
Figure 153 GCC Auto Electrification Market Forecast, 2022-2032 (US$ billion, AGR %)
Figure 154 South Africa Auto Electrification Market Forecast, 2022-2032 (US$ billion, AGR %)
Figure 155 Rest of MEA Auto Electrification Market Forecast, 2022-2032 (US$ billion, AGR %)
Figure 156 Global Auto Electrification Market: Company Share/Ranking, 2021
Figure 157 Aisin Seiki Co., Ltd.: Net Revenue, 2017-2021 (US$ billion, AGR%)
Figure 158 Aisin Seiki Co., Ltd.: R&D, 2017-2021 (US$ billion, AGR%)
Figure 159 Aisin Seiki Co., Ltd.: Regional Market Shares, 2021
Figure 160 BorgWarner Inc: Net Revenue, 2017-2021 (US$ billion, AGR%)
Figure 161 BorgWarner Inc: R&D, 2017-2021 (US$ billion, AGR%)
Figure 162 BorgWarner Inc: Regional Market Shares, 2021
Figure 163 Robert Bosch GmbH: Net Revenue, 2017-2021 (US$ billion, AGR%)
Figure 164 Robert Bosch GmbH: R&D, 2017-2021 (US$ billion, AGR%)
Figure 165 Robert Bosch GmbH: Regional Market Shares, 2021
Figure 166 Continental AG: Net Revenue, 2017-2021 (US$ billion, AGR%)
Figure 167 Continental AG: R&D, 2017-2021 (US$ billion, AGR%)
Figure 168 Continental AG: Regional Market Shares, 2021
Figure 169 Denso Corporation: Net Revenue, 2017-2021 (US$ billion, AGR%)
Figure 170 Denso Corporation: R&D, 2017-2021 (US$ billion, AGR%)
Figure 171 Denso Corporation: Regional Market Shares, 2021
Figure 172 ZF Friedrichshafen AG: Net Revenue, 2017-2021 (US$ billion, AGR%)
Figure 173 ZF Friedrichshafen AG: R&D, 2017-2021 (US$ billion, AGR%)
Figure 174 ZF Friedrichshafen AG: Regional Market Shares, 2021
Figure 175 Johnson Electric Holdings Limited Net Revenue, 2017-2021 (US$ billion, AGR%)
Figure 176 Johnson Electric Holdings Limited: Regional Market Shares, 2021
Figure 177 Magna International Inc.: Net Revenue, 2017-2021 (US$ billion, AGR%)
Figure 178 Magna International Inc.: R&D, 2017-2021 (US$ billion, AGR%)
Figure 179 Magna International Inc.: Regional Market Shares, 2021
Figure 180 Mitsubishi Electric Corporation: Net Revenue, 2017-2021 (US$ billion, AGR%)
Figure 181 Mitsubishi Electric Corporation: R&D, 2017-2021 (US$ billion, AGR%)
Figure 182 Mitsubishi Electric Corporation: Regional Market Shares, 2021
Figure 183 Valeo SA: Net Revenue, 2017-2021 (US$ billion, AGR%)
Figure 184 Valeo SA: R&D, 2017-2021 (US$ billion, AGR%)
Figure 185 Valeo Sa: Regional Market Shares, 2021
Figure 186 Schaeffler AG: Net Revenue, 2017-2021 (US$ billion, AGR%)
Figure 187 Schaeffler AG: R&D, 2017-2021 (US$ billion, AGR%)
Figure 188 Schaeffler AG: Regional Market Shares, 2021
Figure 189 Mahle GmbH: Net Revenue, 2017-2021 (US$ billion, AGR%)
Figure 190 Mahle GmbH: R&D, 2017-2021 (US$ billion, AGR%)
Figure 191 Mahle GmbH: Regional Market Shares, 2021
Figure 192 American Axle & Manufacturing, Inc.: Net Revenue, 2017-2021 (US$ billion, AGR%)
Figure 193 American Axle & Manufacturing, Inc.: R&D, 2017-2021 (US$ billion, AGR%)
Figure 194 American Axle & Manufacturing, Inc.: Regional Market Shares, 2021
Figure 195 JTEKT Corporation: Net Revenue, 2017-2021 (US$ billion, AGR%)
Figure 196 JTEKT Corporation: R&D, 2017-2021 (US$ billion, AGR%)
Figure 197 JTEKT Corporation: Regional Market Shares, 2021
Figure 198 Global Auto Electrification Market Share by Region 2022 and 2032(%)
ページTOPに戻る
本レポートと同じKEY WORD(auto)の最新刊レポート
よくあるご質問
Visiongain社はどのような調査会社ですか?
英国の調査会社ヴィジョンゲイン社(Visiongain)は、通信とエネルギーのほか、自動車や化学・医薬品、金属など、広範な市場を対象に調査を行っています。自動車市場については、市場全般に関する調査のほ... もっと見る
調査レポートの納品までの日数はどの程度ですか?
在庫のあるものは速納となりますが、平均的には 3-4日と見て下さい。
但し、一部の調査レポートでは、発注を受けた段階で内容更新をして納品をする場合もあります。
発注をする前のお問合せをお願いします。
注文の手続きはどのようになっていますか?
1)お客様からの御問い合わせをいただきます。
2)見積書やサンプルの提示をいたします。
3)お客様指定、もしくは弊社の発注書をメール添付にて発送してください。
4)データリソース社からレポート発行元の調査会社へ納品手配します。
5) 調査会社からお客様へ納品されます。最近は、pdfにてのメール納品が大半です。
お支払方法の方法はどのようになっていますか?
納品と同時にデータリソース社よりお客様へ請求書(必要に応じて納品書も)を発送いたします。
お客様よりデータリソース社へ(通常は円払い)の御振り込みをお願いします。
請求書は、納品日の日付で発行しますので、翌月最終営業日までの当社指定口座への振込みをお願いします。振込み手数料は御社負担にてお願いします。
お客様の御支払い条件が60日以上の場合は御相談ください。
尚、初めてのお取引先や個人の場合、前払いをお願いすることもあります。ご了承のほど、お願いします。
データリソース社はどのような会社ですか?
当社は、世界各国の主要調査会社・レポート出版社と提携し、世界各国の市場調査レポートや技術動向レポートなどを日本国内の企業・公官庁及び教育研究機関に提供しております。
世界各国の「市場・技術・法規制などの」実情を調査・収集される時には、データリソース社にご相談ください。
お客様の御要望にあったデータや情報を抽出する為のレポート紹介や調査のアドバイスも致します。
|
|

