バッテリー電気自動車(BEV)市場レポート:2022-2032
Battery Electric Vehicle (BEV) Market Report 2022-2032
レポート詳細
バッテリー電気自動車(BEV)市場レポート 2022-2032 :本レポートは、新たな収益の柱を目指すリーディングカンパニーが、業界とその背景にあるダイナミクスをより深く理解する上で、非... もっと見る
※上記価格は部署ライセンス(Departmental licence)価格です。
その他の価格についてはデータリソースまでお問合せください。
日本語のページは自動翻訳を利用し作成しています。
実際のレポートは英文のみでご納品いたします。

|

|
サマリー
レポート詳細
バッテリー電気自動車(BEV)市場レポート 2022-2032:本レポートは、新たな収益の柱を目指すリーディングカンパニーが、業界とその背景にあるダイナミクスをより深く理解する上で、非常に有益なものとなるでしょう。また、異業種への進出や新地域での既存事業の拡大を目指す企業にとっても有用なレポートです。
電気自動車はメンテナンスが少なく、維持費が安い
電気自動車には、スパークプラグ、ギアボックス、ラジエーター、オイルフィルター、燃料フィルター、排気管など、内燃機関にしかない部品がほとんどありません。そのため、電気自動車はガソリン車よりも維持費が安く済みます。また、電気自動車の大半は回生ブレーキを搭載しており、電気モーターによる制動に大きく依存しています。また、電気自動車のブレーキローターやパッドは長持ちするため、メンテナンスコストを抑えることができます。内燃機関搭載のプラグインハイブリッド電気自動車を選択した場合でも、維持費は安くなります。PHEVのエンジンは、ガソリンエンジンに比べて稼働回数が少ないため、ダメージが少なく、オイルや冷却水の使用量も少なくて済みます。
電気自動車を購入する人にとって、電池のコストは切実な問題になりそうだ
電気自動車に搭載されているリチウムイオン電池の寿命は6〜7年、長くても8年程度です。これを過ぎると、電気自動車のオーナーは新しいバッテリーを購入する以外に選択肢がなくなり、そのコストは自動車全体の価格の3/4近くにもなる。この事実は、もはや秘密ではありません。電気自動車は市場にとっても消費者にとってもまだ新しい技術であるため、電池のコストは長い目で見てEVオーナーにとって大きな関心事となります。
マーケットリサーチレポートを購入する前に、どのような質問をすべきでしょうか?
- バッテリー電気自動車(BEV)市場はどのように進化しているのか?
- バッテリー電気自動車(BEV)市場の推進要因と抑制要因は何か?
- バッテリー電気自動車(BEV)サブマーケットの各セグメントは予測期間中にどのように成長し、2032年にはどれくらいの収益を占めるようになるのでしょうか?
- 2022年から2032年にかけて、各バッテリー電気自動車(BEV)サブマーケットの市場シェアはどのように推移するのでしょうか?
- 2022年から2032年にかけて、市場全体の主なドライバーは何になるのか?
- 主要なバッテリー電気自動車(BEV)市場はマクロ経済ダイナミクスに概ね追随するのか、それとも個々の国市場が他を凌駕するのか?
- 2032年までに各国市場のシェアはどのように変化し、どの地域が2032年の市場をリードするのでしょうか?
- 主要プレイヤーは誰か、また予測期間中の見通しは?
- これらの主要企業のバッテリー電気自動車(BEV)プロジェクトは?
- 2020年から2032年にかけて、業界はどのように進化するのか?現在および今後10年間に行われるBEVプロジェクトはどのような意味を持つのか?
- バッテリー電気自動車(BEV)市場をさらに拡大するために、製品の商業化の必要性は高いですか?
- バッテリー電気自動車(BEV)市場の方向性と、市場の最前線に立つための方法とは?
- 新製品やサービスラインに対する最適な投資方法とは?
- 企業を新たな成長軌道に乗せ、C-suiteに移行させるための重要な展望とは?
このことが、現在、そして今後10年間のバッテリー電気自動車(BEV)市場にどのような影響を与えるかを知る必要があります。
- 383ページにわたる本レポートでは、250の表と226のグラフを独占的に提供します。
- このレポートでは、業界における主要な収益性の高い分野に焦点を当て、お客様が今すぐターゲットとできるような情報を提供しています。
- 世界、地域、国別の売上高と成長率を詳細に分析しています。
- 競合他社が成功した主なトレンド、変化、収益予測をハイライトしています。
本レポートは、バッテリー電気自動車(BEV)市場が今後10年間にどのように発展し、COVID-19の景気後退と回復の変動に合わせて発展していくかを教えてくれるものです。この市場は、過去10年間のどの時点よりも今が重要なのです。。
レポートでは、COVID-19のバリエーションや経済データなど、お客様の市場に特化した独自の情報をお届けしています。
2032年までの予測やその他の分析により、商業的な展望が見えてくる
- 2032年までの収益予測に加え、直近の実績、成長率、市場シェアもご覧いただけます。
- ビジネスの展望や展開など、独自の分析もご覧いただけます。
- 定性的分析(市場力学、ドライバー、機会、阻害要因、課題など)、コスト構造、バッテリー電気自動車(BEV)価格上昇の影響、最近の動向などをご覧いただけます。
本レポートでは、COVID-19が業界と貴社にどのような影響を与えるかについて、データ分析と貴重な洞察を掲載しています。本レポートでは、COVID-19の4つの回収パターンとその影響、すなわち「V」、「L」、「W」、「U」について論じています。
報告書の対象セグメント
充電ポイントタイプ別市場セグメント
- 充電ポイントタイプ
- ノーマル充電
- スーパー充電
電池タイプ別市場セグメント
- リチウムイオン電池
- 鉛電池
- ニッケル水素電池
車両タイプ別市場セグメント
- 乗用車
- 小型商用車
- 大型商用車
- その他車両タイプ
車両接続性別市場セグメント
- Vehicle-to-Building/Home
- Vehicle-to-Grid (V2G)
- Vehicle-to-Vehicle (V2V)
- Vehicle-to-Everything (V2X)
- その他の接続性別
コンポーネント別市場セグメント
- バッテリーセル&パック
- オンボードチャージ
- モーター
- パワーコントロールユニット
- バッテリーマネジメントシステム
- その他のコンポーネント
世界市場全体およびセグメントの収益予測に加え、4地域および20の主要国市場の収益予測も掲載しています。
北米
- アメリカ
- カナダ
欧州
- ノルウェー
- オランダ
- ドイツ
- フランス
- 英国
- その他の地域
アジア太平洋地域
- 中国
- 日本
- インド
- オーストラリア
- 韓国
- その他のアジア太平洋地域
中東・アフリカ
- 南アフリカ
- サウジアラビア
- トルコ
- その他の中東・アフリカ地域
南米
- ブラジル
- メキシコ
-その他の南米地域
バッテリー電気自動車(BEV)市場の2022年から2032年までの主要企業のプロファイルと、これらの企業の事業のこのセグメントに焦点を当てたものも含まれています。
主要企業と市場成長の可能性
・ Audi AG
・ BAIC Group (officially Beijing Automotive Industry Holding Co., Ltd.)
・ Bayerische Motoren Werke AG (BMW)
・ Blue Bird Corporation
・ BYD COMPANY LTD.
・ Chery Automobile Co., Ltd.
・ Ford Motor Company
・ General Motors Company (GM)
・ Groupe Renault (legally Renault S.A.)
・ Hyundai Motor Company
・ Kia Motors Corporation
・ POLESTAR AB
・ Porsche Automobil Holding SE (Porsche SE)
・ SAIC MOTOR CORPORATION LIMITED
・ Tata Motors Group (Tata Motors)
・ Tesla, Inc.
・ The Nissan Motor Company, Ltd.,
・ Volkswagen AG
・ VOLVO CAR CORPORATION
・ ZHEJIANG GEELY HOLDING GROUP CO., LTD.
バッテリー電気自動車(BEV)市場の世界全体収益、2022年から2032年まで(金額ベース)は、2022年に761億300万米ドルを超えると当研究所は算出しています。また、2032年までの間に収益が大きく伸びると予測しています。本調査では、最も大きな可能性を秘めた企業を特定しました。彼らの能力、進歩、商業的展望を知ることで、一歩先を行くことができます。
バッテリー電気自動車(BEV)市場、2022年から2032年までのレポートはどのように役立つのでしょうか?
380ページを超えるレポートでは、要約すると以下のような知識を得ることができます。
- バッテリー電気自動車(BEV)市場の2032年までの収益予測、バッテリータイプ、充電ポイントタイプ、車両タイプ、車両接続性、部品、企業規模の各予測を世界と地域レベルで掲載 - 業界の展望を見出し、投資と収益に最も有利な場所を見つけることができます。
- 4つの地域と20の主要国市場の2032年までの収益予測 - 北米、欧州、アジア太平洋、LAMEAのバッテリー電気自動車(BEV)市場、2022年から2032年までの市場予測をご覧いただけます。また、米国、カナダ、ノルウェー、オランダ、ブラジル、ドイツ、中国、インド、日本、オーストラリアなど、著名な経済圏の市場も予測しています。
- バッテリー電気自動車(BEV)市場の2022年~2032年に関わる主要企業22社の企業プロファイルを含む。
定量的・定性的な分析と独自の予測をご覧いただけます。私たちのレポートだけが持つ情報を入手し、貴重なビジネスインテリジェンスを得ることができます。
他にはない情報
私たちの新しいレポートがあれば、知識の遅れを取り戻し、チャンスを逃す可能性が低くなります。私たちの研究が貴社の調査、分析、意思決定にどのように役立つかをご覧ください。Visiongainの研究は、バッテリー電気自動車(BEV)市場、2022年から2032年、市場の主要企業のための商業分析を必要とするすべての人のためのものです。データ、トレンド、予測をご覧いただけます。
ページTOPに戻る
目次
目次
1.レポートの概要
1.1 調査の目的
1.2 バッテリー電気自動車市場の紹介
1.2.1 ゼネラルモーターズによる初のBEV
1.2.2 テスラによる最初のBEV
1.3 本レポートの特徴
1.4 なぜ本レポートを読むべきなのか
1.5 本分析レポートが回答する主な質問には以下が含まれる。
1.6 本レポートは誰のためのものなのか?
1.7 方法論
1.8 市場の定義
1.9 市場の評価と予測方法
1.9.1 データの検証
1.10 よくある質問(FAQ)
1.11 関連するVisiongainのレポート
1.12 Visiongainについて
2 エグゼクティブサマリー
3 プレミアムインサイト
3.1 地域別スナップショットバッテリー式電気自動車の世界市場
3.2 充電ポイントタイプセグメント市場魅力度指数
3.3 バッテリータイプセグメント3 電池タイプセグメント:市場魅力度指標
3.4 車両タイプ別セグメント市場魅力度指標
3.5 車両コネクティビティセグメンテーション市場魅力度指標
3.6 コンポーネントセグメント市場魅力度指数
4 市場の概要
4.1 市場のダイナミクス
4.1.1 市場の推進要因
4.1.2 市場の抑制要因
4.1.3 市場機会
4.2 COVID-19のインパクト分析
4.2.1 "V字型リカバリー"
4.2.2 "W型リカバリー"
4.2.3 "U字型 "リカバリー
4.2.4 "L字回復"
4.3 SWOT分析
4.3.1 市場の強み
4.3.2 市場の弱点
4.3.3 市場の好機
4.3.4 市場における脅威
4.4 ポーターのファイブフォース分析
4.4.1 サプライヤーのバーゲニングパワー(低)
4.4.2 バイヤーパワーのバーゲニングパワー(高)
4.4.3 競争相手との競合-高い
4.4.4 代替品による脅威-高
4.4.5 新規参入の脅威-高
4.5 環境要因分析
4.5.1 政治的要因
4.5.2 経済的要因
4.5.3 社会的要因
4.5.4 技術的要因
4.5.5 環境要因
5 世界のバッテリー電気自動車市場分析:充電ポイントタイプ別
5.1 主な調査結果
5.2 充電ポイントタイプの成長展望
5.2.2 充電速度に影響を与える要因
5.3 充電ポイントタイプ地域別市場シェア(2022年~2032年)
5.4 バッテリー電気自動車の充電ポイントタイプ別世界市場シェア(2022年&2032年)
5.5 通常充電セグメント
5.5.1 通常充電の地域別市場予測、2022年~2032年 (US$ Mn)
5.6 スーパーチャージングセグメント
5.6.1 スーパーチャージング地域別市場予測、2022年~2032年 (US$ Mn)
5.7 バッテリー電気自動車の充電ポイントタイプ別世界市場規模推計・予測
6 世界のバッテリー電気自動車市場分析:電池タイプ別
6.1 主な調査結果
6.2 バッテリータイプの成長展望
6.3 バッテリー式電気自動車の世界セグメント別市場規模推定・予測
6.3.1 電池タイプ地域別市場シェア(2022年&2032年)(%)
6.3.2 バッテリー電気自動車世界市場バッテリータイプ別シェア (2022年&2032年)
6.4 リチウムイオン電池セグメント
6.4.1 リチウムイオン電池の地域別市場予測、2022年~2032年(US$ Mn)
6.5 鉛蓄電池セグメント
6.5.1 鉛蓄電池の地域別市場予測(2022年~2032年)(US$ Mn)
6.6 ニッケル水素電池セグメント
6.6.1 ニッケル水素電池の地域別市場予測、2022年~2032年 (US$ Mn)
7 世界のバッテリー電気自動車市場分析:車両タイプ別
7.1 主要な調査結果
7.2 車種別成長展望
7.2.1 バッテリー電気自動車の世界車種別市場規模推定・予測
7.2.2 車種別地域別市場シェア(2022年~2032年)(%)
7.2.3 バッテリー電気自動車世界市場車種別シェア(2022年&2032年)
7.3 乗用車セグメント
7.3.1 乗用車の地域別市場予測(2022年~2032年)(US$ Mn)
7.4 軽商用車セグメント
7.4.1 軽商用車の地域別市場予測(2022年~2032年) (US$ Mn)
7.5 大型商用車セグメント
7.5.1 大型商用車の地域別市場予測、2022-2032年 (US$ Mn)
7.6 その他の車両タイプ
7.6.1 その他車両タイプの地域別市場予測、2022年〜2032年 (US$ Mn)
8 世界のバッテリー電気自動車市場分析:車両接続性別
8.1 主な調査結果
8.2 車載コネクティビティの成長展望
8.2.1 バッテリー電気自動車の世界市場規模予測・予測:車両コネクティビティ別
8.2.2 車両接続性市場地域別シェア、2022-2032年(%)
8.2.3 バッテリー電気自動車の車両接続性別世界市場シェア(2022年&2032年)
8.3 Vehicle-to-Building/Homeセグメント
8.3.1 Vehicle-to-Building/Home(V2B/H)地域別市場予測、2022年~2032年(US$ Mn)
8.4 Vehicle-to-Grid(V2G)セグメント
8.4.1 Vehicle-to-Grid(V2G)地域別市場予測、2022年~2032年(US$ Mn)
8.5 Vehicle-to-Vehicle(V2V)セグメント
8.5.1 Vehicle-to-Vehicle(V2V)地域別市場予測、2022年~2032年(US$ Mn)
8.6 Vehicle-to-Everything(V2X)セグメント
8.6.1 Vehicle-to-Everything(V2X)地域別市場予測、2022年~2032年(US$ Mn)
8.7 その他のコネクティビティセグメント
8.7.1 その他のコネクティビティの地域別市場予測、2022年~2032年(US$ Mn)
9 世界のバッテリー電気自動車市場分析:コンポーネント別
9.1 主な調査結果
9.2 コンポーネントの成長展望
9.2.1 コンポーネントの地域別市場シェア(2022年~2032年)(%)
9.2.2 バッテリー電気自動車のコンポーネント別世界市場シェア(2022年&2032年)
9.2.3 バッテリー電気自動車のコンポーネント別世界市場規模推定・予測
9.3 バッテリーセル&パックセグメント
9.3.1 電池セル・パックの地域別市場予測、2022年~2032年 (US$ Mn)
9.4 車載充電器セグメント
9.4.1 車載充電器地域別市場予測、2022年~2032年 (US$ Mn)
9.5 モーターセグメント
9.5.1 モーターの地域別市場予測、2022年~2032年 (US$ Mn)
9.6 パワーコントロールユニットセグメント
9.6.1 パワーコントロールユニットの地域別市場予測、2022年〜2032年 (US$ Mn)
9.7 バッテリーマネジメントシステムセグメント
9.7.1 バッテリーマネジメントシステムの地域別市場予測、2022-2032年 (US$ Mn)
9.8 その他のコンポーネントセグメント
9.8.1 その他コンポーネントの地域別市場予測、2022年~2032年 (US$ Mn)
10 北米のバッテリー電気自動車市場分析
10.1 主な調査結果
10.2 北米のバッテリー電気自動車市場の魅力度指数
10.3 北米バッテリー電気自動車国別市場 2022年、2027年&2032年 (US$ Mn)
10.4 北米のバッテリー電気自動車(BEV)市場(金額別)
10.5 北米バッテリー電気自動車国別市場規模推計・予測
10.6 北米のバッテリー電気自動車市場規模予測・予測:充電ポイントタイプ別
10.7 北米バッテリー電気自動車市場バッテリータイプ別市場規模予測・予想
10.8 北米のバッテリー電気自動車市場規模予測・車種別予測
10.9 北米のバッテリー電気自動車市場規模予測・予測:車両接続性別
10.10 北米のバッテリー電気自動車市場 コンポーネント別市場規模予測・予測
10.11 米国のBEV市場分析
10.11.1 米国は、現在のサプライチェーン問題を解決しつつ、将来のバッテリーのための「ロードプラン」を策定する必要がある
10.12 カナダのBEV市場分析
10.12.1 オンタリオ州の新しい電気自動車用バッテリー部品工場は、良い雇用とクリーンな空気を提供する
10.12.2 カナダ政府、国内初の大規模な電気自動車用電池製造施設によるカナダ自動車産業への最大規模の投資を歓迎
10.12.3 VW、北米でのEV用電池の生産でカナダと合意
11 欧州のバッテリー電気自動車市場分析
11.1 主な調査結果
11.2 欧州電気自動車市場の魅力度指数
11.3 欧州バッテリー電気自動車国別市場 2022年、2027年&2032年 (US$ Mn)
11.4 欧州バッテリー電気自動車(BEV)市場(金額別)
11.5 欧州バッテリー電気自動車国別市場規模推計・予測
11.6 欧州バッテリー電気自動車の充電ポイントタイプ別市場規模予測・予測
11.7 欧州バッテリー電気自動車市場バッテリータイプ別市場規模予測・予想
11.8 欧州電気自動車バッテリー市場の車両タイプ別市場規模予測・予想
11.9 欧州電気自動車バッテリー市場の車両接続性別市場規模予測・予想
11.10 欧州BEVの部品別市場規模予測・予想
11.11 ノルウェーのBEV市場分析
11.11.1 ノルウェーのEV政策
11.11.2 ノルウェーがEVでリードする理由と安価な再生可能エネルギーが果たす役割
11.12 オランダBEV市場の分析
11.12.1 オランダは、税制とEV充電インフラでEV普及の世界的リーダーに
11.13 ドイツのBEV市場分析
11.13.1 電気自動車をグリッドに組み込むための大きな一歩を踏み出したドイツ
11.14 フランスのBEV市場分析
11.14.1 フランスは、月100ドルの電気自動車リース計画を準備中
11.14.2 フランスは、欧州のEVリーダーシップを取り戻し、雇用を促進するために40億ユーロを投じる。
11.15 英国BEV市場の分析
11.15.1 英国の企業は今年136億ポンドを電気自動車に投資する計画
11.16 欧州以外のBEV市場分析
11.16.1 スイス、Electromobility RoadmapでEV対策を強化
11.16.2 フィンランドではインセンティブを拡充し、EV普及率を高める
12 アジア太平洋地域のバッテリー式電気自動車市場分析
12.1 主な調査結果
12.2 アジア太平洋地域のバッテリー電気自動車市場の魅力度指数
12.3 アジア太平洋地域のバッテリー電気自動車市場:国別、2022年、2027年&2032年(US$ Mn)
12.4 アジア太平洋地域のバッテリー電気自動車(BEV)市場(金額別)
12.5 アジア太平洋地域のバッテリー電気自動車国別市場規模推計・予測
12.6 アジア太平洋地域のバッテリー電気自動車市場の充電ポイントタイプ別市場規模予測・予測
12.7 アジア太平洋地域のバッテリー電気自動車市場のバッテリータイプ別市場規模予測・予想
12.8 アジア太平洋地域のバッテリー電気自動車市場規模予測・車種別予測
12.9 アジア太平洋地域のバッテリー電気自動車市場の車両接続性による市場規模の推定と予測
12.10 アジア太平洋地域のバッテリー電気自動車市場 コンポーネント別市場規模予測・予測
12.11 中国BEVの市場分析
12.12 インドBEV市場の分析
12.12.1 インド独自のソリューションが必要
12.13 日本BEV市場の分析
12.13.1 日産自動車はNASAと共同で電気自動車用新型電池を開発中
12.14 韓国BEV市場の分析
12.15 オーストラリアのBEV市場分析
12.16 その他のアジア太平洋地域のBEV市場分析
12.16.1 現代コンソーシアムとBKPMの協業が進行中
12.16.2 東南アジア初のEV用電池工場が完成
13 中東・アフリカのバッテリー電気自動車市場分析
13.1 主な調査結果
13.2 中東・アフリカのバッテリー電気自動車市場の魅力度指数
13.3 中東・アフリカバッテリー電気自動車国別市場 2022年、2027年、2032年 (US$ Mn)
13.4 中東・アフリカバッテリー電気自動車(BEV)市場(金額別)
13.5 中東・アフリカバッテリー電気自動車国別市場規模予測・予想
13.6 中東・アフリカバッテリー電気自動車の充電ポイントタイプ別市場規模予測・予測
13.7 中東・アフリカバッテリー電気自動車市場電池タイプ別市場規模予測・予想
13.8 中東・アフリカバッテリー電気自動車の市場規模予測・車種別予測
13.9 中東・アフリカバッテリー電気自動車の市場規模予測・車両コネクティビティ別予測
13.10 中東・アフリカのバッテリー電気自動車市場 コンポーネント別市場規模予測・予測
13.11 南アフリカのBEV市場分析
13.12 サウジアラビアのBEV市場分析
13.13 トルコのBEV市場分析
13.14 その他の中東・アフリカ地域のBEV市場分析
14 南米のバッテリー電気自動車市場分析
14.1 主な調査結果
14.2 南米のバッテリー電気自動車市場の魅力度指数
14.3 南米のバッテリー電気自動車市場:国別、2022年、2027年&2032年(US$ Mn)
14.4 南米のバッテリー電気自動車(BEV)市場(金額別)
14.5 南米のバッテリー電気自動車市場の国別市場規模予測・予想
14.6 南米のバッテリー電気自動車市場規模予測・予測:充電ポイントタイプ別
14.7 南米のバッテリー電気自動車市場のバッテリータイプ別市場規模予測・予想
14.8 南米のバッテリー電気自動車市場規模予測・車種別予測
14.9 南米のバッテリー電気自動車市場の車両接続性別市場規模予測・予想
14.10 南米のバッテリー式電気自動車市場 コンポーネント別市場規模予測・予測
14.11 ブラジルBEV市場の分析
14.12 メキシコのBEV市場分析
14.13 その他の南米地域のBEV市場分析
14.13.1 アルゼンチン大統領、エレクトロモビリティ開発の新計画を発表
15 主要企業のプロフィール
15.1 TESLA, Inc.
15.1.1 会社概要
15.1.2 会社概要
15.1.3 財務分析
15.1.4 製品ベンチマーク
15.1.5 戦略的展望
15.2 日産自動車株式会社
15.2.1 会社概要
15.2.2 会社概要
15.2.3 財務分析
15.2.4 製品ベンチマーク
15.2.5 戦略的展望
15.3 ルノー(RENAULT S.A)
15.3.1 会社概要
15.3.2 会社概要
15.3.3 財務分析
15.3.4 製品ベンチマーク
15.3.5 戦略的展望
15.4 バイエルン モーレン ヴェルケ アグ
15.4.1 会社概要
15.4.2 会社概要
15.4.3 財務分析
15.4.4 製品ベンチマーク
15.4.5 戦略的な展望
15.5 北京汽車工業控股有限公司
15.5.1 会社概要
15.5.2 会社概要
15.5.3 製品ベンチマーク
15.6 奇瑞汽車股份有限公司
15.6.1 企業スナップショット
15.6.2 会社概要
15.6.3 製品ベンチマーク
15.6.4 戦略的な展望
15.7 フォルクスワーゲンAG
15.7.1 企業スナップショット
15.7.2 会社概要
15.7.3 財務分析
15.7.4 製品ベンチマーク
15.7.5 戦略的展望
15.8 上海汽車工業股份有限公司
15.8.1 会社概要
15.8.2 会社概要
15.8.3 製品ベンチマーク
15.8.4 戦略的展望
15.9 BYDカンパニー・リミテッド
15.9.1 企業スナップショット
15.9.2 会社概要
15.9.3 ベンチマーキング
15.9.4 戦略的展望
15.10 浙江吉利控股集団有限公司
15.10.1 企業スナップショット
15.10.2 会社概要
15.10.3 財務分析
15.10.4 製品ベンチマーク
15.10.5 戦略的な展望
15.11 ブルーバード社
15.11.1 企業スナップショット
15.11.2 会社概要
15.11.3 財務分析
15.11.4 製品ベンチマーク
15.11.5 戦略的展望
15.12 ボルボ・カー・コーポレーション
15.12.1 企業スナップショット
15.12.2 会社概要
15.12.3 財務分析
15.12.4 製品ベンチマーク
15.12.5 戦略的展望
15.13 KIA株式会社
15.13.1 企業スナップショット
15.13.2 会社概要
15.13.3 製品ベンチマーク
15.13.4 戦略的展望
15.14 ゼネラルモーターズ
15.14.1 企業スナップショット
15.14.2 会社概要
15.14.3 財務分析
15.14.4 製品ベンチマーク
15.14.5 戦略的な展望
15.15 AUDI AG
15.15.1 企業スナップショット
15.15.2 会社概要
15.15.3 製品ベンチマーク
15.15.4 戦略的展望
15.16 現代自動車
15.16.1 企業スナップショット
15.16.2 会社概要
15.16.3 製品ベンチマーク
15.16.4 戦略的展望
15.17 タタ・モーターズ
15.17.1 会社概要
15.17.2 会社概要
15.17.3 財務分析
15.17.4 製品ベンチマーク
15.17.5 戦略的展望
15.18 ポルシェオートモービルホールディングSE(ポルシェSE)
15.18.1 企業スナップショット
15.18.2 会社概要
15.18.3 製品ベンチマーク
15.18.4 戦略的展望
15.19 フォードモーターカンパニー
15.19.1 企業スナップショット
15.19.2 会社概要
15.19.3 財務分析
15.19.4 製品ベンチマーク
15.19.5 戦略的展望
15.20 ポレスター
15.20.1 会社概要
15.20.2 会社概要
15.20.3 ベンチマーキング
15.20.4 戦略的展望
16 結論と提言
16.1 ヴィジョンゲインからの結論
16.2 市場関係者への提言
表の一覧
Table 1 Global Battery Electric Vehicle Market Snapshot, 2022 & 2032 (US$ million, CAGR %)
Table 2 Global Battery Electric Vehicle (BEV) Market Forecast, 2022-2032 (USD Mn, AGR (%), CAGR(%)) (V-Shaped Recovery Scenario)
Table 3 Global Battery Electric Vehicle (BEV) Market by Region, 2022-2032 (USD Mn, AGR (%), CAGR(%)) (V-Shaped Recovery Scenario)
Table 4 Global Battery Electric Vehicle (BEV) Market Forecast, 2022-2032 (USD Mn, AGR (%), CAGR(%)) (W-Shaped Recovery Scenario)
Table 5 Global Battery Electric Vehicle (BEV) Market by Region, 2022-2032 (USD Mn, AGR (%), CAGR(%)) (W-Shaped Recovery Scenario)
Table 6 Global Battery Electric Vehicle (BEV) Market Forecast, 2022-2032 (USD Mn, AGR (%), CAGR(%)) (U-Shaped Recovery Scenario)
Table 7 Global Battery Electric Vehicle (BEV) Market by Region, 2022-2032 (USD Mn, AGR (%), CAGR(%)) (U-Shaped Recovery Scenario)
Table 8 Global Battery Electric Vehicle (BEV) Market Forecast, 2022-2032 (USD Mn, AGR (%), CAGR(%)) (L-Shaped Recovery Scenario)
Table 9 Global Battery Electric Vehicle (BEV) Market by Region, 2022-2032 (USD Mn, AGR (%), CAGR(%)) (L-Shaped Recovery Scenario)
Table 10 Global Normal Charging Market Forecast, 2022-2032 (USD Mn, AGR (%), CAGR(%))
Table 11 Global Normal Charging Market by Region, 2022-2032 (USD Mn, AGR (%), CAGR(%))
Table 12 Global Super Charging Market Forecast, 2022-2032 (USD Mn, AGR (%), CAGR(%))
Table 13 Global Super Charging Market by Region, 2022-2032 (USD Mn, AGR (%), CAGR(%))
Table 14 Global Battery Electric Vehicle (BEV) Market by Charging Point Type, 2022-2032 (USD Mn, AGR (%), CAGR(%))
Table 15 Global Battery Electric Vehicle (BEV) Market by Battery Type, 2022-2032 (USD Mn, AGR (%), CAGR(%))
Table 16 Global Lithium-ion Batteries Market Forecast, 2022-2032 (USD Mn, AGR (%), CAGR(%))
Table 17 Global Lithium-ion Batteries Market by Region, 2022-2032 (USD Mn, AGR (%), CAGR(%))
Table 18 Global Lead-acid Batteries Market Forecast, 2022-2032 (USD Mn, AGR (%), CAGR(%))
Table 19 Global Lead-acid Batteries Market by Region, 2022-2032 (USD Mn, AGR (%), CAGR(%))
Table 20 Global Nickel-metal Hydride Batteries Market Forecast, 2022-2032 (USD Mn, AGR (%), CAGR(%))
Table 21 Global Nickel-metal Hydride Batteries Market by Region, 2022-2032 (USD Mn, AGR(%), CAGR(%))
Table 22 Global Battery Electric Vehicle (BEV) Market by Vehicle Type, 2022-2032 (USD Mn, AGR (%), CAGR(%))
Table 23 Global Passenger Vehicles Market Forecast, 2022-2032 (USD Mn, AGR (%), CAGR(%))
Table 24 Global Passenger Vehicles Market by Region, 2022-2032 (USD Mn, AGR (%), CAGR(%))
Table 25 Global Light Commercial Vehicles Market Forecast, 2022-2032 (USD Mn, AGR (%), CAGR(%))
Table 26 Global Light Commercial Vehicles Market by Region, 2022-2032 (USD Mn, AGR (%), CAGR(%))
Table 27 Global Heavy Commercial Vehicles Market Forecast, 2022-2032 (USD Mn, AGR (%), CAGR(%))
Table 28 Global Heavy Commercial Vehicles Market by Region, 2022-2032 (USD Mn, AGR (%), CAGR(%))
Table 29 Global Other Vehicle Type Market Forecast, 2022-2032 (USD Mn, AGR (%), CAGR(%))
Table 30 Global Other Vehicle Type Market by Region, 2022-2032 (USD Mn, AGR (%), CAGR(%))
Table 31 Global Battery Electric Vehicle (BEV) Market by Vehicle Connectivity, 2022-2032 (USD Mn, AGR (%), CAGR(%))
Table 32 Global Vehicle-to-Building/Home (V2B/H) Market Forecast, 2022-2032 (USD Mn, AGR (%), CAGR(%))
Table 33 Global Vehicle-to-Building/Home (V2B/H) Market by Region, 2022-2032 (USD Mn, AGR (%), CAGR(%))
Table 34 Global Vehicle-to-Grid (V2G) Market Forecast, 2022-2032 (USD Mn, AGR (%), CAGR(%))
Table 35 Global Vehicle-to-Grid (V2G) Market by Region, 2022-2032 (USD Mn, AGR (%), CAGR(%))
Table 36 Global Vehicle-to-Vehicle (V2V) Market Forecast, 2022-2032 (USD Mn, AGR (%), CAGR(%))
Table 37 Global Vehicle-to-Vehicle (V2V) Market by Region, 2022-2032 (USD Mn, AGR (%), CAGR(%))
Table 38 Global Vehicle-to-Everything (V2X) Market Forecast, 2022-2032 (USD Mn, AGR (%), CAGR(%))
Table 39 Global Vehicle-to-Everything (V2X) Market by Region, 2022-2032 (USD Mn, AGR (%), CAGR(%))
Table 40 Global Other Connectivity Market Forecast, 2022-2032 (USD Mn, AGR (%), CAGR(%))
Table 41 Global Other Connectivity Market by Region, 2022-2032 (USD Mn, AGR (%), CAGR(%))
Table 42 Global Battery Electric Vehicle (BEV) Market by Components, 2022-2032 (USD Mn, AGR (%), CAGR(%))
Table 43 Global Battery Cells & Packs Market Forecast, 2022-2032 (USD Mn, AGR (%), CAGR(%))
Table 44 Global Battery Cells & Packs Market by Region, 2022-2032 (USD Mn, AGR (%), CAGR(%))
Table 45 Global On-Board Charge Market Forecast, 2022-2032 (USD Mn, AGR (%), CAGR(%))
Table 46 Global On-Board Charge Market by Region, 2022-2032 (USD Mn, AGR (%), CAGR(%))
Table 47 Global Motor Market Forecast, 2022-2032 (USD Mn, AGR (%), CAGR(%))
Table 48 Global Motor Market by Region, 2022-2032 (USD Mn, AGR (%), CAGR(%))
Table 49 Global Power Control Unit Market Forecast, 2022-2032 (USD Mn, AGR (%), CAGR(%))
Table 50 Global Power Control Unit Market by Region, 2022-2032 (USD Mn, AGR (%), CAGR(%))
Table 51 Global Battery Management System Market Forecast, 2022-2032 (USD Mn, AGR (%), CAGR(%))
Table 52 Global Battery Management System Market by Region, 2022-2032 (USD Mn, AGR (%), CAGR(%))
Table 53 Global Other Components Market Forecast, 2022-2032 (USD Mn, AGR (%), CAGR(%))
Table 54 Global Other Components Market by Region, 2022-2032 (USD Mn, AGR (%), CAGR(%))
Table 55 North America Battery Electric Vehicle (BEV) Market by Value, 2022-2032 (USD Mn, AGR (%), CAGR(%))
Table 56 North America Battery Electric Vehicle (BEV) Market by Country, 2022-2032 (USD Mn, AGR (%), CAGR(%))
Table 57 North America Battery Electric Vehicle (BEV) Market by Charging Point Type, 2022-2032 (USD Mn, AGR (%), CAGR (%))
Table 58 North America Battery Electric Vehicle (BEV) Market by Battery Type, 2022-2032 (USD Mn, AGR (%), CAGR(%))
Table 59 North America Battery Electric Vehicle (BEV) Market by Vehicle Type, 2022-2032 (USD Mn, AGR (%), CAGR (%))
Table 60 North America Battery Electric Vehicle (BEV) Market by Vehicle Connectivity, 2022-2032 (USD Mn, AGR (%), CAGR (%))
Table 61 North America Battery Electric Vehicle (BEV) Market by Components, 2022-2032 (USD Mn, AGR (%), CAGR (%))
Table 62 US Battery Electric Vehicle (BEV) Market by Value, 2022-2032 (USD Mn, AGR (%), CAGR(%))
Table 63 Canada Battery Electric Vehicle (BEV) Market by Value, 2022-2032 (USD Mn, AGR (%), CAGR(%))
Table 64 Europe Battery Electric Vehicle (BEV) Market by Value, 2022-2032 (USD Mn, AGR (%), CAGR(%))
Table 65 Europe Battery Electric Vehicle (BEV) Market by Country, 2022-2032 (USD Mn, AGR (%), CAGR(%))
Table 66 Europe Battery Electric Vehicle (BEV) Market by Charging Point Type, 2022-2032 (USD Mn, AGR (%), CAGR (%))
Table 67 Europe Battery Electric Vehicle (BEV) Market by Battery Type, 2022-2032 (USD Mn, AGR (%), CAGR(%))
Table 68 Europe Battery Electric Vehicle (BEV) Market by Vehicle Type, 2022-2032 (USD Mn, AGR (%), CAGR(%))
Table 69 Europe Battery Electric Vehicle (BEV) Market by Vehicle Connectivity, 2022-2032 (USD Mn, AGR (%), CAGR (%))
Table 70 Europe Battery Electric Vehicle (BEV) Market by Components, 2022-2032 (USD Mn, AGR (%), CAGR(%))
Table 71 Norway Battery Electric Vehicle (BEV) Market by Value, 2022-2032 (USD Mn, AGR (%), CAGR (%))
Table 72 Netherlands Battery Electric Vehicle (BEV) Market by Value, 2022-2032 (USD Mn, AGR (%), CAGR(%))
Table 73 Germany Battery Electric Vehicle (BEV) Market by Value, 2022-2032 (USD Mn, AGR (%), CAGR(%))
Table 74 France Battery Electric Vehicle (BEV) Market by Value, 2022-2032 (USD Mn, AGR (%), CAGR(%))
Table 75 UK Battery Electric Vehicle (BEV) Market by Value, 2022-2032 (USD Mn, AGR (%), CAGR(%))
Table 76 Rest of Europe Battery Electric Vehicle (BEV) Market by Value, 2022-2032 (USD Mn, AGR (%), CAGR(%))
Table 77 Asia-Pacific Battery Electric Vehicle (BEV) Market by Value, 2022-2032 (USD Mn, AGR (%), CAGR(%))
Table 78 Asia-Pacific Battery Electric Vehicle (BEV) Market by Country, 2022-2032 (USD Mn, AGR (%), CAGR(%))
Table 79 Asia-Pacific Battery Electric Vehicle (BEV) Market by Charging Point Type, 2022-2032 (USD Mn, AGR (%), CAGR(%))
Table 80 Asia-Pacific Battery Electric Vehicle (BEV) Market by Battery Type, 2022-2032 (USD Mn, AGR (%), CAGR(%))
Table 81 Asia-Pacific Battery Electric Vehicle (BEV) Market by Vehicle Type, 2022-2032 (USD Mn, AGR (%), CAGR(%))
Table 82 Asia-Pacific Battery Electric Vehicle (BEV) Market by Vehicle Connectivity, 2022-2032 (USD Mn, AGR (%), CAGR(%))
Table 83 Asia-Pacific Battery Electric Vehicle (BEV) Market by Components, 2022-2032 (USD Mn, AGR (%), CAGR (%))
Table 84 China Battery Electric Vehicle (BEV) Market by Value, 2022-2032 (USD Mn, AGR (%), CAGR(%))
Table 85 India Battery Electric Vehicle (BEV) Market by Value, 2022-2032 (USD Mn, AGR (%), CAGR(%))
Table 86 Japan Battery Electric Vehicle (BEV) Market by Value, 2022-2032 (USD Mn, AGR (%), CAGR(%))
Table 87 South Korea Battery Electric Vehicle (BEV) Market by Value, 2022-2032 (USD Mn, AGR (%), CAGR(%))
Table 88 Australia Battery Electric Vehicle (BEV) Market by Value, 2022-2032 (USD Mn, AGR (%), CAGR(%))
Table 89 Rest of Asia-Pacific Battery Electric Vehicle (BEV) Market by Value, 2022-2032 (USD Mn, AGR (%), CAGR(%))
Table 90 Middle East & Africa Battery Electric Vehicle (BEV) Market by Value, 2022-2032 (USD Mn, AGR (%), CAGR(%))
Table 91 Middle East & Africa Battery Electric Vehicle (BEV) Market by Country, 2022-2032 (USD Mn, AGR (%), CAGR (%))
Table 92 Middle East & Africa Battery Electric Vehicle (BEV) Market by Charging Point Type, 2022-2032 (USD Mn, AGR (%), CAGR(%))
Table 93 Middle East & Africa Battery Electric Vehicle (BEV) Market by Battery Type, 2022-2032 (USD Mn, AGR (%), CAGR(%))
Table 94 Middle East & Africa Battery Electric Vehicle (BEV) Market by Vehicle Type, 2022-2032 (USD Mn, AGR (%), CAGR(%))
Table 95 Middle East & Africa Battery Electric Vehicle (BEV) Market by Vehicle Connectivity, 2022-2032 (USD Mn, AGR (%), CAGR (%))
Table 96 Middle East & Africa Battery Electric Vehicle (BEV) Market by Components, 2022-2032 (USD Mn, AGR (%), CAGR(%))
Table 97 South Africa Battery Electric Vehicle (BEV) Market by Value, 2022-2032 (USD Mn, AGR (%), CAGR(%))
Table 98 Saudi Arabia Battery Electric Vehicle (BEV) Market by Value, 2022-2032 (USD Mn, AGR (%), CAGR(%))
Table 99 Turkey Battery Electric Vehicle (BEV) Market by Value, 2022-2032 (USD Mn, AGR (%), CAGR(%))
Table 100 Rest of Middle East & Africa Battery Electric Vehicle (BEV) Market by Value, 2022-2032 (USD Mn, AGR (%), CAGR(%))
Table 101 South America Battery Electric Vehicle (BEV) Market by Value, 2022-2032 (USD Mn, AGR (%), CAGR(%))
Table 102 South America Battery Electric Vehicle (BEV) Market by Country, 2022-2032 (USD Mn, AGR (%), CAGR (%))
Table 103 South America Battery Electric Vehicle (BEV) Market by Charging Point Type, 2022-2032 (USD Mn, AGR (%), CAGR(%))
Table 104 South America Battery Electric Vehicle (BEV) Market by Battery Type, 2022-2032 (USD Mn, AGR (%), CAGR(%))
Table 105 South America Battery Electric Vehicle (BEV) Market by Vehicle Type, 2022-2032 (USD Mn, AGR (%), CAGR(%))
Table 106 South America Battery Electric Vehicle (BEV) Market by Vehicle Connectivity, 2022-2032 (USD Mn, AGR (%), CAGR(%))
Table 107 South America Battery Electric Vehicle (BEV) Market by Components, 2022-2032 (USD Mn, AGR (%), CAGR(%))
Table 108 Brazil Battery Electric Vehicle (BEV) Market by Value, 2022-2032 (USD Mn, AGR (%), CAGR(%))
Table 109 Rest of South America Battery Electric Vehicle (BEV) Market by Value, 2022-2032 (USD Mn, AGR (%), CAGR(%))
Table 110 Tesla, Inc.: Key Details, (CEO, HQ, Revenue, Founded, No. of Employees, Company Type, Website, Business Segment)
Table 111 Tesla, Inc: Product Benchmarking
Table 112 Tesla, Inc: Strategic Outlook
Table 113 Nissan Motor Corporation: Key Details, (CEO, HQ, Revenue, Founded, No. of Employees, Company Type, Website, Business Segment)
Table 114 Nissan Motor Corporation: Product Benchmarking
Table 115 Nissan Motor Corporation: Strategic Outlook
Table 116 Renault S.A: Key Details, (CEO, HQ, Revenue, Founded, No. of Employees, Company Type, Website, Business Segment)
Table 117 Renault S.A: Product Benchmarking
Table 118 Renault S.A: Strategic Outlook
Table 119 Bayerische Motoren Werke AG: Key Details, (CEO, HQ, Revenue, Founded, No. of Employees, Company Type, Website, Business Segment)
Table 120 Bayerische Motoren Werke AG: Product Benchmarking
Table 121 Bayerische Motoren Werke AG: Strategic Outlook
Table 122 Beijing Automotive Industry Holding Co., Ltd: Key Details, (CEO, HQ, Revenue, Founded, No. of Employees, Company Type, Website, Business Segment)
Table 123 Beijing Automotive Industry Holding Co., Ltd: Product Benchmarking
Table 124 Chery Automobile Co., Ltd.: Key Details, (CEO, HQ, Revenue, Founded, No. of Employees, Company Type, Website, Business Segment)
Table 125 Chery Automobile Co., Ltd.: Product Benchmarking
Table 126 Chery Automobile Co., Ltd.: Strategic Outlook
Table 127 Volkswagen AG: Key Details, (CEO, HQ, Revenue, Founded, No. of Employees, Company Type, Website, Business Segment)
Table 128 Volkswagen AG: Product Benchmarking
Table 129 Volkswagen AG: Strategic Outlook
Table 130 SAIC Motor Corporation Limited: Key Details, (CEO, HQ, Revenue, Founded, No. of Employees, Company Type, Website, Business Segment)
Table 131 SAIC Motor Corporation Limited: Product Benchmarking
Table 132 SAIC Motor Corporation Limited: Strategic Outlook
Table 133 BYD Company Ltd: Key Details, (CEO, HQ, Revenue, Founded, No. of Employees, Company Type, Website, Business Segment)
Table 134 BYD Company Ltd: Product Benchmarking
Table 135 BYD Company Ltd: Strategic Outlook
Table 136 Zhejiang Geely Holding Group Co., Ltd: Key Details, (CEO, HQ, Revenue, Founded, No. of Employees, Company Type, Website, Business Segment)
Table 137 Zhejiang Geely Holding Group Co., Ltd: Product Benchmarking
Table 138 Zhejiang Geely Holding Group Co., Ltd: Strategic Outlook
Table 139 Blue Bird Corporation: Key Details, (CEO, HQ, Revenue, Founded, No. of Employees, Company Type, Website, Business Segment)
Table 140 Blue Bird Corporation: Product Benchmarking
Table 141 Blue Bird Corporation: Strategic Outlook
Table 142 Volvo Car Corporation: Key Details, (CEO, HQ, Revenue, Founded, No. of Employees, Company Type, Website, Business Segment)
Table 143 Volvo Car Corporation: Product Benchmarking
Table 144 Volvo Car Corporation: Strategic Outlook
Table 145 Kia Corporation: Key Details, (CEO, HQ, Revenue, Founded, No. of Employees, Company Type, Website, Business Segment)
Table 146 Kia Corporation: Product Benchmarking
Table 147 Kia Corporation: Strategic Outlook
Table 148 General Motors Company: Key Details, (CEO, HQ, Revenue, Founded, No. of Employees, Company Type, Website, Business Segment)
Table 149 General Motors Company: Product Benchmarking
Table 150 General Motors Company: Strategic Outlook
Table 151 Audi AG: Key Details, (CEO, HQ, Revenue, Founded, No. of Employees, Company Type, Website, Business Segment)
Table 152 Audi AG: Product Benchmarking
Table 153 Audi AG: Strategic Outlook
Table 154 Hyundai Motor: Key Details, (CEO, HQ, Revenue, Founded, No. of Employees, Company Type, Website, Business Segment)
Table 155 Hyundai Motor: Product Benchmarking
Table 156 Hyundai Motor: Strategic Outlook
Table 157 Tata Motors Limited: Key Details, (CEO, HQ, Revenue, Founded, No. of Employees, Company Type, Website, Business Segment)
Table 158 Tata Motors Limited: Product Benchmarking
Table 159 Tata Motors Limited: Strategic Outlook
Table 160 Tata Motors Limited: Key Details, (CEO, HQ, Revenue, Founded, No. of Employees, Company Type, Website, Business Segment)
Table 161 Tata Motors Limited: Product Benchmarking
Table 162 Tata Motors Limited: Strategic Outlook
Table 163 Ford Motor Company: Key Details, (CEO, HQ, Revenue, Founded, No. of Employees, Company Type, Website, Business Segment)
Table 164 Ford Motor Company: Product Benchmarking
Table 165 Ford Motor Company: Strategic Outlook
Table 166 Polestar AB: Key Details, (CEO, HQ, Revenue, Founded, No. of Employees, Company Type, Website, Business Segment)
Table 167 Polestar AB: Product Benchmarking
Table 168 Polestar AB: Strategic Outlook
図の一覧
Figure 1 Global Battery Electric Vehicle Market Segmentation
Figure 2 Global Battery Electric Vehicle Market Forecast by Region: Market Attractiveness Index
Figure 3 Global Battery Electric Vehicle Market by Battery Type: Market Attractiveness Index
Figure 4 Global Battery Electric Vehicle Market by Vehicle Type : Market Attractiveness Index
Figure 5 Global Battery Electric Vehicle Market by Vehicle Type: Market Attractiveness Index
Figure 6 Global Battery Electric Vehicle Market by Vehicle Connectivity: Market Attractiveness Index
Figure 7 Global Battery Electric Vehicle Market by Components: Market Attractiveness Index
Figure 8 Global Battery Electric Vehicle Market: Market Dynamics
Figure 9 Global Battery Electric Vehicle (BEV) Market Forecast, 2022-2032 (USD Mn, AGR (%)) (V-Shaped Recovery Scenario)
Figure 10 Global Battery Electric Vehicle (BEV) Market by Region, 2022-2032 (USD Mn, AGR (%)) (V-Shaped Recovery Scenario)
Figure 11 Global Battery Electric Vehicle (BEV) Market Forecast, 2022-2032 (USD Mn, AGR (%)) (W-Shaped Recovery Scenario)
Figure 12 Global Battery Electric Vehicle (BEV) Market by Region, 2022-2032 (USD Mn, AGR (%)) (W-Shaped Recovery Scenario)
Figure 13 Global Battery Electric Vehicle (BEV) Market Forecast, 2022-2032 (USD Mn, AGR (%)) (U-Shaped Recovery Scenario)
Figure 14 Global Battery Electric Vehicle (BEV) Market by Region, 2022-2032 (USD Mn, AGR (%)) (U-Shaped Recovery Scenario)
Figure 15 Global Battery Electric Vehicle (BEV) Market Forecast, 2022-2032 (USD Mn, AGR (%)) (L-Shaped Recovery Scenario)
Figure 16 Global Battery Electric Vehicle (BEV) Market by Region, 2022-2032 (USD Mn, AGR (%)) (L-Shaped Recovery Scenario)
Figure 17 Global Battery Electric Vehicle Market: Porter’s Five Forces Analysis
Figure 18 Global Battery Electric Vehicle Market: PESTLE Analysis
Figure 19 Global Battery Electric Vehicle Market Forecast by Charging Point Type 2022, 2027, 2032 (Revenue, CAGR%)
Figure 20 Segment02 Market Share Forecast by Region, 2022-2032 (%)
Figure 21 Global Battery Electric Vehicle Market Share Forecast by Charging Point Type, 2022, 2032 (%)
Figure 22 Global Normal Charging Market Forecast, 2022-2032 (USD Mn, AGR (%))
Figure 23 Global Normal Charging Market by Region, 2022-2032 (USD Mn, AGR (%))
Figure 24 Global Super Charging Market Forecast, 2022-2032 (USD Mn, AGR (%))
Figure 25 Global Super Charging Market by Region, 2022-2032 (USD Mn, AGR (%))
Figure 26 Global Battery Electric Vehicle (BEV) Market by Charging Point Type, 2022-2032 (USD Mn, AGR (%))
Figure 27 Global Battery Electric Vehicle (BEV) Market by Battery Type, 2022-2032 (USD Mn, AGR (%))
Figure 28 Global Battery Electric Vehicle Market Forecast by Battery Type 2022, 2027, 2032 (Revenue)
Figure 29 Segment02 Market Share Forecast by Region, 2022-2032 (%)
Figure 30 Global Battery Electric Vehicle Market Share Forecast by Battery Type , 2022, 2032 (%)
Figure 31 Global Lithium-ion Batteries Market Forecast, 2022-2032 (USD Mn, AGR (%))
Figure 32 Global Lithium-ion Batteries Market by Region, 2022-2032 (USD Mn, AGR (%))
Figure 33 Global Lead-acid Batteries Market Forecast, 2022-2032 (USD Mn, AGR (%))
Figure 34 Global Lead-acid Batteries Market by Region, 2022-2032 (USD Mn, AGR (%))
Figure 35 Global Nickel-metal Hydride Batteries Market Forecast, 2022-2032 (USD Mn, AGR (%))
Figure 36 Global Nickel-metal Hydride Batteries Market by Region, 2022-2032 (USD Mn, AGR (%))
Figure 37 Global Battery Electric Vehicle (BEV) Market by Vehicle Type, 2022-2032 (USD Mn, AGR (%))
Figure 38 Global Battery Electric Vehicle Market Forecast by Vehicle Type 2022, 2027, 2032 (Revenue, CAGR%)
Figure 39 Vehicle Type Market Share Forecast by Region, 2022-2032 (%)
Figure 40 Global Battery Electric Vehicle Market Share Forecast by Vehicle Type, 2022, 2032 (%)
Figure 41 Global Passenger Vehicles Market Forecast, 2022-2032 (USD Mn, AGR (%))
Figure 42 Global Passenger Vehicles Market by Region, 2022-2032 (USD Mn, AGR (%))
Figure 43 Global Light Commercial Vehicles Market Forecast, 2022-2032 (USD Mn, AGR (%))
Figure 44 Global Light Commercial Vehicles Market by Region, 2022-2032 (USD Mn, AGR (%))
Figure 45 Global Heavy Commercial Vehicles Market Forecast, 2022-2032 (USD Mn, AGR (%))
Figure 46 Global Heavy Commercial Vehicles Market by Region, 2022-2032 (USD Mn, AGR (%))
Figure 47 Global Other Vehicle Type Market Forecast, 2022-2032 (USD Mn, AGR (%))
Figure 48 Global Other Vehicle Type Market by Region, 2022-2032 (USD Mn, AGR (%))
Figure 49 Global Battery Electric Vehicle (BEV) Market by Vehicle Connectivity, 2022-2032 (USD Mn, AGR (%))
Figure 50 Global Battery Electric Vehicle Market Forecast by Vehicle Connectivity2022, 2027, 2032 (Revenue, CAGR%)
Figure 51 Segment02 Market Share Forecast by Region, 2022-2032 (%)
Figure 52 Global Battery Electric Vehicle Market Share Forecast by Vehicle Connectivity, 2022, 2032 (%)
Figure 53 Global Vehicle-to-Building/Home (V2B/H) Market Forecast, 2022-2032 (USD Mn, AGR (%))
Figure 54 Global Vehicle-to-Building/Home (V2B/H) Market by Region, 2022-2032 (USD Mn, AGR (%))
Figure 55 Global Vehicle-to-Grid (V2G) Market Forecast, 2022-2032 (USD Mn, AGR (%))
Figure 56 Global Vehicle-to-Grid (V2G) Market by Region, 2022-2032 (USD Mn, AGR (%))
Figure 57 Global Vehicle-to-Vehicle (V2V) Market Forecast, 2022-2032 (USD Mn, AGR (%))
Figure 58 Global Vehicle-to-Vehicle (V2V) Market by Region, 2022-2032 (USD Mn, AGR (%))
Figure 59 Global Vehicle-to-Everything (V2X) Market Forecast, 2022-2032 (USD Mn, AGR (%))
Figure 60 Global Vehicle-to-Everything (V2X) Market by Region, 2022-2032 (USD Mn, AGR (%))
Figure 61 Global Other Connectivity Market Forecast, 2022-2032 (USD Mn, AGR (%))
Figure 62 Global Other Connectivity Market by Region, 2022-2032 (USD Mn, AGR (%))
Figure 63 Global Battery Electric Vehicle Market Forecast by Components 2022, 2027, 2032 (Revenue, CAGR%)
Figure 64 Segment02 Market Share Forecast by Region, 2022-2032 (%)
Figure 65 Global Battery Electric Vehicle Market Share Forecast by Component, 2022, 2032 (%)
Figure 66 Global Battery Electric Vehicle (BEV) Market by Components, 2022-2032 (USD Mn, AGR (%))
Figure 67 Global Battery Cells & Packs Market Forecast, 2022-2032 (USD Mn, AGR (%))
Figure 68 Global Battery Cells & Packs Market by Region, 2022-2032 (USD Mn, AGR (%))
Figure 69 Global On-Board Charge Market Forecast, 2022-2032 (USD Mn, AGR (%))
Figure 70 Global On-Board Charge Market by Region, 2022-2032 (USD Mn, AGR (%))
Figure 71 Global Motor Market Forecast, 2022-2032 (USD Mn, AGR (%))
Figure 72 Global Motor Market by Region, 2022-2032 (USD Mn, AGR (%))
Figure 73 Global Power Control Unit Market Forecast, 2022-2032 (USD Mn, AGR (%))
Figure 74 Global Power Control Unit Market by Region, 2022-2032 (USD Mn, AGR (%))
Figure 75 Global Battery Management System Market Forecast, 2022-2032 (USD Mn, AGR (%))
Figure 76 Global Battery Management System Market by Region, 2022-2032 (USD Mn, AGR (%))
Figure 77 Global Other Components Market Forecast, 2022-2032 (USD Mn, AGR (%))
Figure 78 Global Other Components Market by Region, 2022-2032 (USD Mn, AGR (%))
Figure 79 North America Battery Electric Vehicle Market Attractiveness Index
Figure 80 North America Battery Electric Vehicle Market by Region, 2022, 2027 & 2032 (US$million)
Figure 81 North America Battery Electric Vehicle (BEV) Market by Value, 2022-2032 (USD Mn, AGR (%))
Figure 82 North America Battery Electric Vehicle (BEV) Market by Country, 2022-2032 (USD Mn, AGR (%))
Figure 83 North America Battery Electric Vehicle Market Share Forecast by Country, 2022 & 2032 (%)
Figure 84 North America Battery Electric Vehicle (BEV) Market by Charging Point Type, 2022-2032 (USD Mn, AGR (%))
Figure 85 North America Battery Electric Vehicle Market Share Forecast by Charging Point Type, 2022 & 2032 (%)
Figure 86 North America Battery Electric Vehicle (BEV) Market by Battery Type, 2022-2032 (USD Mn, AGR (%))
Figure 87 North America Battery Electric Vehicle Market Share Forecast by Battery Type , 2022 & 2032 (%)
Figure 88 North America Battery Electric Vehicle (BEV) Market by Vehicle Type, 2022-2032 (USD Mn, AGR (%))
Figure 89 North America Battery Electric Vehicle Market Share Forecast by Vehicle Type, 2022 & 2032 (%)
Figure 90 North America Battery Electric Vehicle (BEV) Market by Vehicle Connectivity, 2022-2032 (USD Mn, AGR (%))
Figure 91 North America Battery Electric Vehicle Market Share Forecast by Vehicle Connectivity, 2022 & 2032 (%)
Figure 92 North America Battery Electric Vehicle (BEV) Market by Components, 2022-2032 (USD Mn, AGR (%))
Figure 93 North America Battery Electric Vehicle Market Share Forecast by Components, 2022 & 2032 (%)
Figure 94 US Battery Electric Vehicle (BEV) Market by Value, 2022-2032 (USD Mn, AGR (%))
Figure 95 Canada Battery Electric Vehicle (BEV) Market by Value, 2022-2032 (USD Mn, AGR (%))
Figure 96 Europe Battery Electric Vehicle Market Attractiveness Index
Figure 97 Europe Battery Electric Vehicle Market by Region, 2022, 2027 & 2032 (US$million)
Figure 98 Europe Battery Electric Vehicle (BEV) Market by Value, 2022-2032 (USD Mn, AGR (%))
Figure 99 Europe Battery Electric Vehicle (BEV) Market by Country, 2022-2032 (USD Mn, AGR (%))
Figure 100 Europe Battery Electric Vehicle Market Share Forecast by Country, 2022 & 2032 (%)
Figure 101 Europe Battery Electric Vehicle (BEV) Market by Charging Point Type, 2022-2032 (USD Mn, AGR (%))
Figure 102 Europe Battery Electric Vehicle Market Share Forecast by Charging Point Type, 2022 & 2032 (%)
Figure 103 Europe Battery Electric Vehicle (BEV) Market by Battery Type, 2022-2032 (USD Mn, AGR (%))
Figure 104 Europe Battery Electric Vehicle Market Share Forecast by Battery Type, 2022 & 2032 (%)
Figure 105 Europe Battery Electric Vehicle (BEV) Market by Vehicle Type, 2022-2032 (USD Mn, AGR (%))
Figure 106 Europe Battery Electric Vehicle Market Share Forecast by Vehicle Type , 2022 & 2032 (%)
Figure 107 Europe Battery Electric Vehicle (BEV) Market by Vehicle Connectivity, 2022-2032 (USD Mn, AGR (%))
Figure 108 Europe Battery Electric Vehicle Market Share Forecast by Vehicle Connectivity, 2022 & 2032 (%)
Figure 109 Europe Battery Electric Vehicle (BEV) Market by Components, 2022-2032 (USD Mn, AGR (%))
Figure 110 Europe Battery Electric Vehicle Market Share Forecast by Components, 2022 & 2032 (%)
Figure 111 Norway Battery Electric Vehicle (BEV) Market by Value, 2022-2032 (USD Mn, AGR (%))
Figure 112 Netherlands Battery Electric Vehicle (BEV) Market by Value, 2022-2032 (USD Mn, AGR (%))
Figure 113 Germany Battery Electric Vehicle (BEV) Market by Value, 2022-2032 (USD Mn, AGR (%))
Figure 114 France Battery Electric Vehicle (BEV) Market by Value, 2022-2032 (USD Mn, AGR (%))
Figure 115 UK Battery Electric Vehicle (BEV) Market by Value, 2022-2032 (USD Mn, AGR (%))
Figure 116 Rest of Europe Battery Electric Vehicle (BEV) Market by Value, 2022-2032 (USD Mn, AGR (%))
Figure 117 Asia-Pacific Battery Electric Vehicle Market Attractiveness Index
Figure 118 Asia-Pacific Battery Electric Vehicle Market by Region, 2022, 2027 & 2032 (US$million)
Figure 119 Asia-Pacific Battery Electric Vehicle (BEV) Market by Value, 2022-2032 (USD Mn, AGR (%))
Figure 120 Asia-Pacific Battery Electric Vehicle (BEV) Market by Country, 2022-2032 (USD Mn, AGR (%))
Figure 121 Asia-Pacific Battery Electric Vehicle Market Share Forecast by Country, 2022 & 2032 (%)
Figure 122 Asia-Pacific Battery Electric Vehicle (BEV) Market by Charging Point Type, 2022-2032 (USD Mn, AGR (%))
Figure 123 Asia-Pacific Battery Electric Vehicle Market Share Forecast by Charging Point Type, 2022 & 2032 (%)
Figure 124 Asia-Pacific Battery Electric Vehicle (BEV) Market by Battery Type, 2022-2032 (USD Mn, AGR (%))
Figure 125 Asia-Pacific Battery Electric Vehicle Market Share Forecast by Battery Type, 2022 & 2032 (%)
Figure 126 Asia-Pacific Battery Electric Vehicle (BEV) Market by Vehicle Type, 2022-2032 (USD Mn, AGR (%))
Figure 127 Asia-Pacific Battery Electric Vehicle Market Share Forecast by Vehicle Type , 2022 & 2032 (%)
Figure 128 Asia-Pacific Battery Electric Vehicle (BEV) Market by Vehicle Connectivity, 2022-2032 (USD Mn, AGR (%))
Figure 129 Asia-Pacific Battery Electric Vehicle Market Share Forecast by Vehicle Connectivity, 2022 & 2032 (%)
Figure 130 Asia-Pacific Battery Electric Vehicle (BEV) Market by Components, 2022-2032 (USD Mn, AGR (%))
Figure 131 Asia-Pacific Battery Electric Vehicle Market Share Forecast by Components, 2022 & 2032 (%)
Figure 132 China Battery Electric Vehicle (BEV) Market by Value, 2022-2032 (USD Mn, AGR (%))
Figure 133 India Battery Electric Vehicle (BEV) Market by Value, 2022-2032 (USD Mn, AGR (%))
Figure 134 Japan Battery Electric Vehicle (BEV) Market by Value, 2022-2032 (USD Mn, AGR (%))
Figure 135 South Korea Battery Electric Vehicle (BEV) Market by Value, 2022-2032 (USD Mn, AGR (%))
Figure 136 Australia Battery Electric Vehicle (BEV) Market by Value, 2022-2032 (USD Mn, AGR (%))
Figure 137 Rest of Asia-Pacific Battery Electric Vehicle (BEV) Market by Value, 2022-2032 (USD Mn, AGR (%))
Figure 138 Middle East and Africa Battery Electric Vehicle Market Attractiveness Index
Figure 139 Middle East and Africa Battery Electric Vehicle Market by Region, 2022, 2027 & 2032 (US$million)
Figure 140 Middle East & Africa Battery Electric Vehicle (BEV) Market by Value, 2022-2032 (USD Mn, AGR (%))
Figure 141 Middle East & Africa Battery Electric Vehicle (BEV) Market by Country, 2022-2032 (USD Mn, AGR (%))
Figure 142 Middle East and Africa Battery Electric Vehicle Market Share Forecast by Country, 2022 & 2032 (%)
Figure 143 Middle East & Africa Battery Electric Vehicle (BEV) Market by Charging Point Type, 2022-2032 (USD Mn, AGR (%))
Figure 144 Middle East and Africa Battery Electric Vehicle Market Share Forecast by Charging Point Type, 2022 & 2032 (%)
Figure 145 Middle East & Africa Battery Electric Vehicle (BEV) Market by Battery Type, 2022-2032 (USD Mn, AGR (%))
Figure 146 Middle East and Africa Battery Electric Vehicle Market Share Forecast by Battery Type, 2022 & 2032 (%)
Figure 147 Middle East & Africa Battery Electric Vehicle (BEV) Market by Vehicle Type, 2022-2032 (USD Mn, AGR (%))
Figure 148 Middle East and Africa Battery Electric Vehicle Market Share Forecast by Vehicle Type, 2022 & 2032 (%)
Figure 149 Middle East & Africa Battery Electric Vehicle (BEV) Market by Vehicle Connectivity, 2022-2032 (USD Mn, AGR (%))
Figure 150 Middle East and Africa Battery Electric Vehicle Market Share Forecast by Vehicle Connectivity, 2022 & 2032 (%)
Figure 151 Middle East & Africa Battery Electric Vehicle (BEV) Market by Components, 2022-2032 (USD Mn, AGR (%))
Figure 152 Middle East and Africa Battery Electric Vehicle Market Share Forecast by Components, 2022 & 2032 (%)
Figure 153 South Africa Battery Electric Vehicle (BEV) Market by Value, 2022-2032 (USD Mn, AGR (%))
Figure 154 Saudi Arabia Battery Electric Vehicle (BEV) Market by Value, 2022-2032 (USD Mn, AGR (%))
Figure 155 Turkey Battery Electric Vehicle (BEV) Market by Value, 2022-2032 (USD Mn, AGR (%))
Figure 156 Rest of Middle East & Africa Battery Electric Vehicle (BEV) Market by Value, 2022-2032 (USD Mn, AGR (%))
Figure 157 South America Battery Electric Vehicle Market Attractiveness Index
Figure 158 South America Battery Electric Vehicle Market by Region, 2022, 2027 & 2032 (US$million)
Figure 159 South America Battery Electric Vehicle (BEV) Market by Value, 2022-2032 (USD Mn, AGR (%))
Figure 160 South America Battery Electric Vehicle (BEV) Market by Country, 2022-2032 (USD Mn, AGR (%))
Figure 161 South America Battery Electric Vehicle Market Share Forecast by Country, 2022 & 2032 (%)
Figure 162 South America Battery Electric Vehicle (BEV) Market by Charging Point Type, 2022-2032 (USD Mn, AGR (%))
Figure 163 South America Battery Electric Vehicle Market Share Forecast by Charging Point Type, 2022 & 2032 (%)
Figure 164 South America Battery Electric Vehicle (BEV) Market by Battery Type, 2022-2032 (USD Mn, AGR (%))
Figure 165 South America Battery Electric Vehicle Market Share Forecast by Battery Type, 2022 & 2032 (%)
Figure 166 South America Battery Electric Vehicle (BEV) Market by Vehicle Type, 2022-2032 (USD Mn, AGR (%))
Figure 167 South America Battery Electric Vehicle Market Share Forecast by Vehicle Type, 2022 & 2032 (%)
Figure 168 South America Battery Electric Vehicle (BEV) Market by Vehicle Connectivity, 2022-2032 (USD Mn, AGR (%))
Figure 169 South America Battery Electric Vehicle Market Share Forecast by Vehicle Connectivity, 2022 & 2032 (%)
Figure 170 South America Battery Electric Vehicle (BEV) Market by Components, 2022-2032 (USD Mn, AGR (%))
Figure 171 South America Battery Electric Vehicle Market Share Forecast by Components, 2022 & 2032 (%)
Figure 172 Brazil Battery Electric Vehicle (BEV) Market by Value, 2022-2032 (USD Mn, AGR (%))
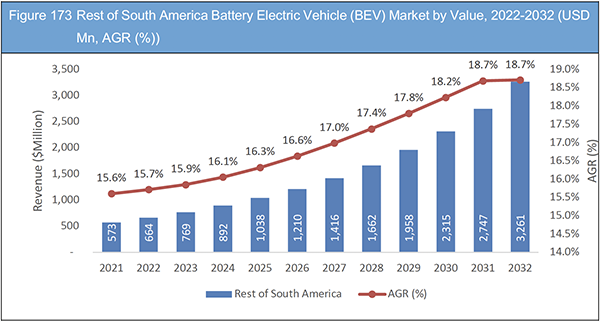
Figure 173 Rest of South America Battery Electric Vehicle (BEV) Market by Value, 2022-2032 (USD Mn, AGR (%))
Figure 174 Tesla, Inc : Net Revenue, 2017-2021 (US$million, AGR%)
Figure 175 Tesla, Inc: Gross Profit, 2017-2021 (US$million, AGR%)
Figure 176 Tesla, Inc: R&D Expences 2017-2021 (US$million, AGR%)
Figure 177 Tesla, Inc: EBITDA, 2017-2021 (US$million, AGR%)
Figure 178 Nissan Motor Corporation: Net Revenue, 2017-2021 (US$million, AGR%)
Figure 179 Nissan Motor Corporation: Gross Profit, 2017-2021 (US$million, AGR%)
Figure 180 Nissan Motor Corporation: R&D Expences 2017-2021 (US$million, AGR%)
Figure 181 Nissan Motor Corporation : EBITDA, 2017-2021 (US$million, AGR%)
Figure 182 Renault S.A: Net Revenue, 2017-2021 (US$million, AGR%)
Figure 183 Renault S.A: Gross Profit, 2017-2021 (US$million, AGR%)
Figure 184 Renault S.A: R&D Expences: 2017-2021 (US$million, AGR%)
Figure 185 Renault S.A: EBITDA, 2017-2021 (US$million, AGR%)
Figure 186 Bayerische Motoren Werke AG: Net Revenue, 2017-2021 (US$million, AGR%)
Figure 187 Bayerische Motoren Werke AG: Gross Profit, 2017-2021 (US$million, AGR%)
Figure 188 Bayerische Motoren Werke AG: R&D Expences 2017-2021 (US$million, AGR%)
Figure 189 Bayerische Motoren Werke AG: EBITDA, 2017-2021 (US$million, AGR%)
Figure 190 Volkswagen AG: Net Revenue, 2017-2021 (US$million, AGR%)
Figure 191 Volkswagen AG: Gross Profit, 2017-2021 (US$million, AGR%)
Figure 192 Volkswagen AG: Net Profit 2017-2021 (US$million, AGR%)
Figure 193 Volkswagen AG: EBITDA, 2017-2021 (US$million, AGR%)
Figure 194 Zhejiang Geely Holding Group Co., Ltd: Net Revenue, 2017-2021 (US$million, AGR%)
Figure 195 Zhejiang Geely Holding Group Co., Ltd: Gross Profit, 2017-2021 (US$million, AGR%)
Figure 196 Zhejiang Geely Holding Group Co., Ltd R&D Expenses 2017-2021 (US$million, AGR%)
Figure 197 Zhejiang Geely Holding Group Co., Ltd: EBITDA, 2017-2021 (US$million, AGR%)
Figure 198 Blue Bird Corporation: Net Revenue, 2017-2021 (US$million, AGR%)
Figure 199 Blue Bird Corporation: Gross Profit, 2017-2021 (US$million, AGR%)
Figure 200 Blue Bird Corporation: Net Profit 2017-2021 (US$million, AGR%)
Figure 201 Blue Bird Corporation: EBITDA, 2017-2021 (US$million, AGR%)
Figure 202 Volvo Car Corporation: Net Revenue, 2017-2021 (US$million, AGR%)
Figure 203 Volvo Car Corporation: Gross Profit, 2017-2021 (US$million, AGR%)
Figure 204 Volvo Car Corporation: Net Profit 2017-2021 (US$million, AGR%)
Figure 205 Volvo Car Corporation: EBITDA, 2017-2021 (US$million, AGR%)
Figure 206 General Motors Company: Net Revenue, 2017-2021 (US$million, AGR%)
Figure 207 General Motors Company: Gross Profit, 2017-2021 (US$million, AGR%)
Figure 208 General Motors Company: Net Profit 2017-2021 (US$million, AGR%)
Figure 209 General Motors Company: EBITDA, 2017-2021 (US$million, AGR%)
Figure 210 Tata Motors Limited: Net Revenue, 2017-2021 (US$million, AGR%)
Figure 211 Tata Motors Limited: Gross Profit, 2017-2021 (US$million, AGR%)
Figure 212 Tata Motors Limited: Net Profit 2017-2021 (US$million, AGR%)
Figure 213 Tata Motors Limited: EBITDA, 2017-2021 (US$million, AGR%)
Figure 214 Ford Motor Company: Net Revenue, 2017-2021 (US$million, AGR%)
Figure 215 Ford Motor Company: Gross Profit, 2017-2021 (US$million, AGR%)
Figure 216 Ford Motor Company: Net Profit 2017-2021 (US$million, AGR%)
Figure 217 Ford Motor Company: EBITDA, 2017-2021 (US$million, AGR%)
ページTOPに戻る
Summary
この調査レポートは世界のバッテリー電気自動車(BEV)市場を調査し、充電ポイントタイプ別、電池タイプ別、車両タイプ別、車両接続性別、コンポーネント別、地域別に2022年から2032年までの予測結果を掲載しています。また関連企業情報を提供しています。
主な掲載内容(目次より抜粋)
-
レポート概要
-
エグゼクティブサマリー
-
プレミアムインサイト
-
市場概要
-
世界のバッテリー電気自動車市場分析:充電ポイントタイプ別
-
世界のバッテリー電気自動車市場分析:電池タイプ別
-
世界のバッテリー電気自動車市場分析:車両タイプ別
-
世界のバッテリー電気自動車市場分析:車両接続性別
-
世界のバッテリー電気自動車市場分析:コンポーネント別
-
北米のバッテリー電気自動車市場分析
-
欧州のバッテリー電気自動車市場分析
-
アジア太平洋地域のバッテリー電気自動車市場分析
-
中東・アフリカのバッテリー電気自動車市場分析
-
南米のバッテリー電気自動車市場分析
-
主要企業のプロフィール
Report Details
The Battery Electric Vehicle (BEV) Market Report 2022-2032: This report will prove invaluable to leading firms striving for new revenue pockets if they wish to better understand the industry and its underlying dynamics. It will be useful for companies that would like to expand into different industries or to expand their existing operations in a new region.
Electric Cars Have Fewer Maintenance Requirements and Lower Maintenance Costs
Spark plugs, gearboxes, radiators, oil and fuel filters, exhausts, and other parts only found in internal combustion engines are mostly absent from all-electric vehicles. As a result, maintaining an electric car is less expensive than one fueled by gasoline. The majority of electric vehicles also include regenerative braking, which largely relies on the electric motor to conduct the brakes. Additionally lowering maintenance costs, this helps electric car braking rotors and pads last longer. Maintenance expenses will be cheaper even if you select a plug-in hybrid electric car with an internal combustion engine. Because PHEV engines operate less often than gasoline-powered engines, they endure less damage and use less oil and coolant.
Battery Cost Is Going to be a Pressing Issue for the EV Buyers
The Li-ion battery in electric vehicles is designed to live for 6-7 years, or just 8 years. After this time, the owner of an electric vehicle is left with no other option than to purchase a new battery, which costs close to 3/4 of the price of the entire vehicle. This fact is no longer a secret. Because electric cars are still a relatively new technology for both the market and consumers, the cost of batteries will be a significant concern for EV owners in the long run.
What Questions Should You Ask before Buying a Market Research Report?
• How is the battery electric vehicle (BEV) market evolving?
• What is driving and restraining the battery electric vehicle (BEV) market?
• How will each battery electric vehicle (BEV) submarket segment grow over the forecast period and how much revenue will these submarkets account for in 2032?
• How will the market shares for each battery electric vehicle (BEV) submarket develop from 2022 to 2032?
• What will be the main driver for the overall market from 2022 to 2032?
• Will leading battery electric vehicle (BEV) markets broadly follow the macroeconomic dynamics, or will individual national markets outperform others?
• How will the market shares of the national markets change by 2032 and which geographical region will lead the market in 2032?
• Who are the leading players and what are their prospects over the forecast period?
• What are the battery electric vehicle (BEV) projects for these leading companies?
• How will the industry evolve during the period between 2020 and 2032? What are the implications of battery electric vehicle (BEV) projects taking place now and over the next 10 years?
• Is there a greater need for product commercialisation to further scale the battery electric vehicle (BEV) market?
• Where is the battery electric vehicle (BEV) market heading and how can you ensure you are at the forefront of the market?
• What are the best investment options for new product and service lines?
• What are the key prospects for moving companies into a new growth path and C-suite?
You need to discover how this will impact the battery electric vehicle (BEV) market today, and over the next 10 years:
• Our 383-page report provides 250 tables and 226 charts/graphs exclusively to you.
• The report highlights key lucrative areas in the industry so you can target them – NOW.
• It contains in-depth analysis of global, regional and national sales and growth.
• It highlights for you the key successful trends, changes and revenue projections made by your competitors.
This report tells you TODAY how the battery electric vehicle (BEV) market will develop in the next 10 years, and in line with the variations in COVID-19 economic recession and bounce. This market is more critical now than at any point over the last 10 years.
The report delivers exclusive COVID-19 variations and economic data specific to your market.
Forecasts to 2032 and other analyses reveal commercial prospects
• In addition to revenue forecasting to 2032, our new study provides you with recent results, growth rates, and market shares.
• You will find original analyses, with business outlooks and developments.
• Discover qualitative analyses (including market dynamics, drivers, opportunities, restraints and challenges), cost structure, impact of rising battery electric vehicle (BEV) prices and recent developments.
This report includes data analysis and invaluable insight into how COVID-19 will affect the industry and your company. Four COVID-19 recovery patterns and their impact, namely, “V”, “L”, “W” and “U” are discussed in this report.
Segments Covered in the Report
Market Segment by Charging Point Type
• Charging Point Type
• Normal Charging
• Super Charging
Market Segment by Battery Type
• Lithium-ion Batteries
• Lead-acid Batteries
• Nickel-metal Hydride Batteries
Market Segment by Vehicle Type
• Passenger Vehicles
• Light Commercial Vehicles
• Heavy Commercial Vehicles
• Other Vehicle Type
Market Segment by Vehicle Connectivity
• Vehicle-to-Building/Home
• Vehicle-to-Grid (V2G)
• Vehicle-to-Vehicle (V2V)
• Vehicle-to-Everything (V2X)
• Other Connectivity
Market Segment by Components
• Battery Cells & Packs
• On-Board Charge
• Motor
• Power Control Unit
• Battery Management System
• Other Components
In addition to the revenue predictions for the overall world market and segments, you will also find revenue forecasts for four regional and 20 leading national markets:
North America
• U.S.
• Canada
Europe
• Norway
• Netherlands
• Germany
• France
• UK
• Rest of Europe
Asia Pacific
• China
• Japan
• India
• Australia
• South Korea
• Rest of Asia Pacific
Middle East & Africa
• South Africa
• Saudi Arabia
• Turkey
• Rest of Middle East & Africa
South America
• Brazil
• Mexico
• Rest of South America
The report also includes profiles and for some of the leading companies in the Battery Electric Vehicle (BEV) Market, 2022 to 2032, with a focus on this segment of these companies’ operations.
Leading companies and the potential for market growth
• Audi AG
• BAIC Group (officially Beijing Automotive Industry Holding Co., Ltd.)
• Bayerische Motoren Werke AG (BMW)
• Blue Bird Corporation
• BYD COMPANY LTD.
• Chery Automobile Co., Ltd.
• Ford Motor Company
• General Motors Company (GM)
• Groupe Renault (legally Renault S.A.)
• Hyundai Motor Company
• Kia Motors Corporation
• POLESTAR AB
• Porsche Automobil Holding SE (Porsche SE)
• SAIC MOTOR CORPORATION LIMITED
• Tata Motors Group (Tata Motors)
• Tesla, Inc.
• The Nissan Motor Company, Ltd.,
• Volkswagen AG
• VOLVO CAR CORPORATION
• ZHEJIANG GEELY HOLDING GROUP CO., LTD.
Overall world revenue for Battery Electric Vehicle (BEV) Market, 2022 to 2032 in terms of value the market will surpass US$76,103 million in 2022, our work calculates. We predict strong revenue growth through to 2032. Our work identifies which organizations hold the greatest potential. Discover their capabilities, progress, and commercial prospects, helping you stay ahead.
How will the Battery Electric Vehicle (BEV) Market, 2022 to 2032 report help you?
In summary, our 380+ page report provides you with the following knowledge:
• Revenue forecasts to 2032 for Battery Electric Vehicle (BEV) Market, 2022 to 2032 Market, with forecasts for battery type, charging point type, vehicle type, vehicle connectivity, components and company size, each forecast at a global and regional level – discover the industry’s prospects, finding the most lucrative places for investments and revenues.
• Revenue forecasts to 2032 for four regional and 20 key national markets – See forecasts for the Battery Electric Vehicle (BEV) Market, 2022 to 2032 market in North America, Europe, Asia-Pacific and LAMEA. Also forecasted is the market in the US, Canada, Norway, Netherlands, Brazil, Germany, China, India, Japan, and Australia among other prominent economies.
• Prospects for established firms and those seeking to enter the market – including company profiles for 22 of the major companies involved in the Battery Electric Vehicle (BEV) Market, 2022 to 2032.
Find quantitative and qualitative analyses with independent predictions. Receive information that only our report contains, staying informed with invaluable business intelligence.
Information found nowhere else
With our new report, you are less likely to fall behind in knowledge or miss out on opportunities. See how our work could benefit your research, analyses, and decisions. Visiongain’s study is for everybody needing commercial analyses for the Battery Electric Vehicle (BEV) Market, 2022 to 2032, market-leading companies. You will find data, trends and predictions.
ページTOPに戻る
Table of Contents
Table of Contents
1. Report Overview
1.1 Objectives of the Study
1.2 Introduction to Battery Electric Vehicle Market
1.2.1 First BEV by General Motors
1.2.2 First BEV by Tesla
1.3 What this Report Delivers
1.4 Why You Should Read this Report
1.5 Key Questions Answered by this Analytical Report Include:
1.6 Who is this Report for?
1.7 Methodology
1.8 Market Definitions
1.9 Market Evaluation & Forecasting Methodology
1.9.1 Data Validation
1.10 Frequently Asked Questions (FAQs)
1.11 Associated Visiongain Reports
1.12 About Visiongain
2 Executive Summary
3 Premium Insights
3.1 Geographical Snapshot: Global Battery Electric Vehicle Market
3.2 Charging Point Type Segment: Market Attractiveness Index
3.3 Battery Type Segment: Market Attractiveness Index
3.4 Vehicle Type Segment: Market Attractiveness Index
3.5 Vehicle Connectivity Segment: Market Attractiveness Index
3.6 Components Segment: Market Attractiveness Index
4 Market Overview
4.1 Market Dynamics
4.1.1 Market Driving Factors
4.1.2 Market Restraining Factors
4.1.3 Market Opportunities
4.2 COVID-19 Impact Analysis
4.2.1 “V-Shaped Recovery”
4.2.2 “W-Shaped Recovery”
4.2.3 “U-Shaped Recovery”
4.2.4 “L-Shaped Recovery”
4.3 SWOT Analysis
4.3.1 Market Strengths
4.3.2 Market Weaknesses
4.3.3 Market Opportunities
4.3.4 Threats in the Market
4.4 Porter’s Five Forces Analysis
4.4.1 Bargaining Power of Supplier Power- Low
4.4.2 Bargaining Power of Buyer Power- High
4.4.3 Competitive Rivalry-Higher
4.4.4 Threat from Substitutes- High
4.4.5 Threat of New Entrants-High
4.5 PESTLE Analysis
4.5.1 Political Factors
4.5.2 Economic Factors
4.5.3 Social Factors
4.5.4 Technology Factors
4.5.5 Environmental Factors
5 Global Battery Electric Vehicle Market Analysis by Charging Point Type
5.1 Key Findings
5.2 Charging Point Type Growth Prospects
5.2.2 Factors That Affect Charging Speed
5.3 Charging Point Type Market Share by Region, 2022-2032 (%)
5.4 Global Battery Electric Vehicle Market Share by Charging Point Type, 2022 & 2032
5.5 Normal Charging Segment
5.5.1 Normal Charging Market Forecast by Region, 2022-2032 (US$ Mn)
5.6 Super Charging Segment
5.6.1 Super Charging Market Forecast by Region, 2022-2032 (US$ Mn)
5.7 Global Battery Electric Vehicle Market Size Estimation and Forecast by Charging Point Type
6 Global Battery Electric Vehicle Market Analysis by Battery Type
6.1 Key Findings
6.2 Battery Type Growth Prospects
6.3 Global Battery Electric Vehicle Market Size Estimation and Forecast by Segment
6.3.1 Battery Type Market Share by Region, 2022-2032 (%)
6.3.2 Global Battery Electric Vehicle Market Share by Battery Type 2022 & 2032
6.4 Lithium-ion Batteries Segment
6.4.1 Lithium-ion Batteries Market Forecast by Region, 2022-2032 (US$ Mn)
6.5 Lead-acid Batteries Segment
6.5.1 Lead-acid Batteries Market Forecast by Region, 2022-2032 (US$ Mn)
6.6 Nickel-metal Hydride Batteries Segment
6.6.1 Nickel-metal Hydride Market Forecast by Region, 2022-2032 (US$ Mn)
7 Global Battery Electric Vehicle Market Analysis by Vehicle Type
7.1 Key Findings
7.2 Vehicle Type Growth Prospects
7.2.1 Global Battery Electric Vehicle Market Size Estimation and Forecast by Vehicle Type
7.2.2 Vehicle Type Market Share by Region, 2022-2032 (%)
7.2.3 Global Battery Electric Vehicle Market Share by Vehicle Type, 2022 & 2032
7.3 Passenger Vehicles Segment
7.3.1 Passenger Vehicles Market Forecast by Region, 2022-2032 (US$ Mn)
7.4 Light Commercial Vehicles Segment
7.4.1 Light Commercial Vehicles Market Forecast by Region, 2022-2032 (US$ Mn)
7.5 Heavy Commercial Vehicles Segment
7.5.1 Heavy Commercial Vehicles Market Forecast by Region, 2022-2032 (US$ Mn)
7.6 Other Vehicle Type
7.6.1 Other Vehicle Type Market Forecast by Region, 2022-2032 (US$ Mn)
8 Global Battery Electric Vehicle Market Analysis by Vehicle Connectivity
8.1 Key Findings
8.2 Vehicle Connectivity Growth Prospects
8.2.1 Global Battery Electric Vehicle Market Size Estimation and Forecast by Vehicle Connectivity
8.2.2 Vehicle Connectivity Market Share by Region, 2022-2032 (%)
8.2.3 Global Battery Electric Vehicle Market Share by Vehicle Connectivity, 2022 & 2032
8.3 Vehicle-to-Building/Home Segment
8.3.1 Vehicle-to-Building/Home (V2B/H) Market Forecast by Region, 2022-2032 (US$ Mn)
8.4 Vehicle-to-Grid (V2G) Segment
8.4.1 Vehicle-to-Grid (V2G)Market Forecast by Region, 2022-2032 (US$ Mn)
8.5 Vehicle-to-Vehicle (V2V) Segment
8.5.1 Vehicle-to-Vehicle (V2V) Market Forecast by Region, 2022-2032 (US$ Mn)
8.6 Vehicle-to-Everything (V2X) Segment
8.6.1 Vehicle-to-Everything (V2X) Market Forecast by Region, 2022-2032 (US$ Mn)
8.7 Other Connectivity Segment
8.7.1 Other Connectivity Market Forecast by Region, 2022-2032 (US$ Mn)
9 Global Battery Electric Vehicle Market Analysis by Component
9.1 Key Findings
9.2 Component Growth Prospects
9.2.1 Component Market Share by Region, 2022-2032 (%)
9.2.2 Global Battery Electric Vehicle Market Share by Component, 2022 & 2032
9.2.3 Global Battery Electric Vehicle Market Size Estimation and Forecast by Components
9.3 Battery Cells & Packs Segment
9.3.1 Battery Cells & Packs Market Forecast by Region, 2022-2032 (US$ Mn)
9.4 On-Board Charge Segment
9.4.1 On-Board Charge Market Forecast by Region, 2022-2032 (US$ Mn)
9.5 Motor Segment
9.5.1 Motor Market Forecast by Region, 2022-2032 (US$ Mn)
9.6 Power Control Unit Segment
9.6.1 Power Control Unit Market Forecast by Region, 2022-2032 (US$ Mn)
9.7 Battery Management System Segment
9.7.1 Battery Management System Market Forecast by Region, 2022-2032 (US$ Mn)
9.8 Other Components Segment
9.8.1 Other Components Market Forecast by Region, 2022-2032 (US$ Mn)
10 North America Battery Electric Vehicle Market Analysis
10.1 Key Findings
10.2 North America Battery Electric Vehicle Market Attractiveness Index
10.3 North America Battery Electric Vehicle Market by Country, 2022, 2027 & 2032 (US$ Mn)
10.4 North America Battery Electric Vehicle (BEV) Market by Value
10.5 North America Battery Electric Vehicle Market Size Estimation and Forecast by Country
10.6 North America Battery Electric Vehicle Market Size Estimation and Forecast by Charging Point Type
10.7 North America Battery Electric Vehicle Market Size Estimation and Forecast by Battery Type
10.8 North America Battery Electric Vehicle Market Size Estimation and Forecast by Vehicle Type
10.9 North America Battery Electric Vehicle Market Size Estimation and Forecast by Vehicle Connectivity
10.10 North America Battery Electric Vehicle Market Size Estimation and Forecast by Components
10.11 U.S. BEV Market Analysis
10.11.1 The United States Must Develop a "Road Plan" for the Batteries of the Future While Also Resolving Current Supply Chain Problems
10.12 Canada BEV Market Analysis
10.12.1 Delivering Good Jobs and Clean Air With a New Electric Vehicle Battery Components Facility In Ontario
10.12.2 Government of Canada Welcomes Largest Investment in Canada’s Auto Industry with the First Large-Scale Domestic EV Battery Manufacturing Facility
10.12.3 VW Strikes a Deal with Canada to Build EV Batteries in North America
11 Europe Battery Electric Vehicle Market Analysis
11.1 Key Findings
11.2 Europe Battery Electric Vehicle Market Attractiveness Index
11.3 Europe Battery Electric Vehicle Market by Country, 2022, 2027 & 2032 (US$ Mn)
11.4 Europe Battery Electric Vehicle (BEV) Market by Value
11.5 Europe Battery Electric Vehicle Market Size Estimation and Forecast by Country
11.6 Europe Battery Electric Vehicle Market Size Estimation and Forecast by Charging Point Type
11.7 Europe Battery Electric Vehicle Market Size Estimation and Forecast by Battery Type
11.8 Europe Battery Electric Vehicle Market Size Estimation and Forecast by Vehicle Type
11.9 Europe Battery Electric Vehicle Market Size Estimation and Forecast by Vehicle Connectivity
11.10 Europe Battery Electric Vehicle Market Size Estimation and Forecast by Components
11.11 Norway BEV Market Analysis
11.11.1 Norwegian EV policy
11.11.2 Why Norway Leads in EVs and the Role Played by Cheap Renewable Electricity
11.12 Netherlands BEV Market Analysis
11.12.1 The Netherlands Is the World’s Leader in EV Adoption Thanks to its Taxation Policies and EV Charging Infrastructure
11.13 Germany BEV Market Analysis
11.13.1 Germany Takes Big Step Towards Integrating Electric Cars into Grid
11.14 France BEV Market Analysis
11.14.1 France Prepares Subsidised Electric-Car Leasing Plan at $100 Per Month
11.14.2 France to Throw €4 Billion to Regain Europe’s EV Leadership, Boost Jobs
11.15 UK BEV Market Analysis
11.15.1 UK Businesses Planning to Invest £13.6bn in Electric Vehicles this Year
11.16 Rest of Europe BEV Market Analysis
11.16.1 Switzerland Enhances EV Measures with Electromobility Roadmap
11.16.2 Expansion of Incentives to Drive EV Adoption Rates Higher in Finland
12 Asia-Pacific Battery Electric Vehicle Market Analysis
12.1 Key Findings
12.2 Asia-Pacific Battery Electric Vehicle Market Attractiveness Index
12.3 Asia-Pacific Battery Electric Vehicle Market by Country, 2022, 2027 & 2032 (US$ Mn)
12.4 Asia-Pacific Battery Electric Vehicle (BEV) Market by Value
12.5 Asia-Pacific Battery Electric Vehicle Market Size Estimation and Forecast by Country
12.6 Asia-Pacific Battery Electric Vehicle Market Size Estimation and Forecast by Charging Point Type
12.7 Asia-Pacific Battery Electric Vehicle Market Size Estimation and Forecast by Battery Type
12.8 Asia-Pacific Battery Electric Vehicle Market Size Estimation and Forecast by Vehicle Type
12.9 Asia-Pacific Battery Electric Vehicle Market Size Estimation and Forecast by Vehicle Connectivity
12.10 Asia-Pacific Battery Electric Vehicle Market Size Estimation and Forecast by Components
12.11 China BEV Market Analysis
12.12 India BEV Market Analysis
12.12.1 Uniquely Indian Solutions Are Necessary
12.13 Japan BEV Market Analysis
12.13.1 Nissan is Working with Nasa on A New Type Of Battery For Electric Vehicles
12.14 South Korea BEV Market Analysis
12.15 Australia BEV Market Analysis
12.16 Rest of Asia-Pacific BEV Market Analysis
12.16.1 Hyundai Consortium and BKPM Collaboration Progress
12.16.2 The First EV Battery Factory in Southeast Asia
13 Middle East and Africa Battery Electric Vehicle Market Analysis
13.1 Key Findings
13.2 Middle East and Africa Battery Electric Vehicle Market Attractiveness Index
13.3 Middle East and Africa Battery Electric Vehicle Market by Country, 2022, 2027 & 2032 (US$ Mn)
13.4 Middle East & Africa Battery Electric Vehicle (BEV) Market by Value
13.5 Middle East and Africa Battery Electric Vehicle Market Size Estimation and Forecast by Country
13.6 Middle East and Africa Battery Electric Vehicle Market Size Estimation and Forecast by Charging Point Type
13.7 Middle East and Africa Battery Electric Vehicle Market Size Estimation and Forecast by Battery Type
13.8 Middle East and Africa Battery Electric Vehicle Market Size Estimation and Forecast by Vehicle Type
13.9 Middle East and Africa Battery Electric Vehicle Market Size Estimation and Forecast by Vehicle Connectivity
13.10 Middle East and Africa Battery Electric Vehicle Market Size Estimation and Forecast by Components
13.11 South Africa BEV Market Analysis
13.12 Saudi Arabia BEV Market Analysis
13.13 Turkey BEV Market Analysis
13.14 Rest of Middle East and Africa BEV Market Analysis
14 South America Battery Electric Vehicle Market Analysis
14.1 Key Findings
14.2 South America Battery Electric Vehicle Market Attractiveness Index
14.3 South America Battery Electric Vehicle Market by Country, 2022, 2027 & 2032 (US$ Mn)
14.4 South America Battery Electric Vehicle (BEV) Market by Value
14.5 South America Battery Electric Vehicle Market Size Estimation and Forecast by Country
14.6 South America Battery Electric Vehicle Market Size Estimation and Forecast by Charging Point Type
14.7 South America Battery Electric Vehicle Market Size Estimation and Forecast by Battery Type
14.8 South America Battery Electric Vehicle Market Size Estimation and Forecast by Vehicle Type
14.9 South America Battery Electric Vehicle Market Size Estimation and Forecast by Vehicle Connectivity
14.10 South America Battery Electric Vehicle Market Size Estimation and Forecast by Components
14.11 Brazil BEV Market Analysis
14.12 Mexico BEV Market Analysis
14.13 Rest of South America BEV Market Analysis
14.13.1 President of Argentina Announces New Plans to Develop Electromobility
15 Company Profiling
15.1 TESLA, Inc.
15.1.1 Company Snapshot
15.1.2 Company Overview
15.1.3 Financial Analysis
15.1.4 Product Benchmarking
15.1.5 Strategic Outlook
15.2 NISSAN MOTOR CORPORATION
15.2.1 Company Snapshot
15.2.2 Company Overview
15.2.3 Financial Analysis
15.2.4 Product Benchmarking
15.2.5 Strategic Outlook
15.3 RENAULT S.A
15.3.1 Company Snapshot
15.3.2 Company Overview
15.3.3 Financial Analysis
15.3.4 Product Benchmarking
15.3.5 Strategic Outlook
15.4 BAYERISCHE MOTOREN WERKE AG
15.4.1 Company Snapshot
15.4.2 Company Overview
15.4.3 Financial Analysis
15.4.4 Product Benchmarking
15.4.5 Strategic Outlook
15.5 BEIJING AUTOMOTIVE INDUSTRY HOLDING CO., LTD
15.5.1 Company Snapshot
15.5.2 Company Overview
15.5.3 Product Benchmarking
15.6 CHERY AUTOMOBILE CO., LTD.
15.6.1 Company Snapshot
15.6.2 Company Overview
15.6.3 Product Benchmarking
15.6.4 Strategic Outlook
15.7 VOLKSWAGEN AG
15.7.1 Company Snapshot
15.7.2 Company Overview
15.7.3 Financial Analysis
15.7.4 Product Benchmarking
15.7.5 Strategic Outlook
15.8 SAIC Motor Corporation Limited
15.8.1 Company Snapshot
15.8.2 Company Overview
15.8.3 Product Benchmarking
15.8.4 Strategic Outlook
15.9 BYD Company Ltd.
15.9.1 Company Snapshot
15.9.2 Company Overview
15.9.3 Product Benchmarking
15.9.4 Strategic Outlook
15.10 Zhejiang Geely Holding Group Co., Ltd.
15.10.1 Company Snapshot
15.10.2 Company Overview
15.10.3 Financial Analysis
15.10.4 Product Benchmarking
15.10.5 Strategic Outlook
15.11 Blue Bird Corporation
15.11.1 Company Snapshot
15.11.2 Company Overview
15.11.3 Financial Analysis
15.11.4 Product Benchmarking
15.11.5 Strategic Outlook
15.12 VOLVO Car Corporation
15.12.1 Company Snapshot
15.12.2 Company Overview
15.12.3 Financial Analysis
15.12.4 Product Benchmarking
15.12.5 Strategic Outlook
15.13 KIA Corporation
15.13.1 Company Snapshot
15.13.2 Company Overview
15.13.3 Product Benchmarking
15.13.4 Strategic Outlook
15.14 GENERAL MOTORS COMPANY
15.14.1 Company Snapshot
15.14.2 Company Overview
15.14.3 Financial Analysis
15.14.4 Product Benchmarking
15.14.5 Strategic Outlook
15.15 AUDI AG
15.15.1 Company Snapshot
15.15.2 Company Overview
15.15.3 Product Benchmarking
15.15.4 Strategic Outlook
15.16 Hyundai Motor Company
15.16.1 Company Snapshot
15.16.2 Company Overview
15.16.3 Product Benchmarking
15.16.4 Strategic Outlook
15.17 TATA MOTORS LIMITED
15.17.1 Company Snapshot
15.17.2 Company Overview
15.17.3 Financial Analysis
15.17.4 Product Benchmarking
15.17.5 Strategic Outlook
15.18 Porsche Automobil Holding SE (Porsche SE)
15.18.1 Company Snapshot
15.18.2 Company Overview
15.18.3 Product Benchmarking
15.18.4 Strategic Outlook
15.19 Ford Motor Company
15.19.1 Company Snapshot
15.19.2 Company Overview
15.19.3 Financial Analysis
15.19.4 Product Benchmarking
15.19.5 Strategic Outlook
15.20 POLESTAR AB
15.20.1 Company Snapshot
15.20.2 Company Overview
15.20.3 Product Benchmarking
15.20.4 Strategic Outlook
16 Conclusion and Recommendations
16.1 Concluding Remarks from Visiongain
16.2 Recommendations for Market Players
List of Tables
Table 1 Global Battery Electric Vehicle Market Snapshot, 2022 & 2032 (US$ million, CAGR %)
Table 2 Global Battery Electric Vehicle (BEV) Market Forecast, 2022-2032 (USD Mn, AGR (%), CAGR(%)) (V-Shaped Recovery Scenario)
Table 3 Global Battery Electric Vehicle (BEV) Market by Region, 2022-2032 (USD Mn, AGR (%), CAGR(%)) (V-Shaped Recovery Scenario)
Table 4 Global Battery Electric Vehicle (BEV) Market Forecast, 2022-2032 (USD Mn, AGR (%), CAGR(%)) (W-Shaped Recovery Scenario)
Table 5 Global Battery Electric Vehicle (BEV) Market by Region, 2022-2032 (USD Mn, AGR (%), CAGR(%)) (W-Shaped Recovery Scenario)
Table 6 Global Battery Electric Vehicle (BEV) Market Forecast, 2022-2032 (USD Mn, AGR (%), CAGR(%)) (U-Shaped Recovery Scenario)
Table 7 Global Battery Electric Vehicle (BEV) Market by Region, 2022-2032 (USD Mn, AGR (%), CAGR(%)) (U-Shaped Recovery Scenario)
Table 8 Global Battery Electric Vehicle (BEV) Market Forecast, 2022-2032 (USD Mn, AGR (%), CAGR(%)) (L-Shaped Recovery Scenario)
Table 9 Global Battery Electric Vehicle (BEV) Market by Region, 2022-2032 (USD Mn, AGR (%), CAGR(%)) (L-Shaped Recovery Scenario)
Table 10 Global Normal Charging Market Forecast, 2022-2032 (USD Mn, AGR (%), CAGR(%))
Table 11 Global Normal Charging Market by Region, 2022-2032 (USD Mn, AGR (%), CAGR(%))
Table 12 Global Super Charging Market Forecast, 2022-2032 (USD Mn, AGR (%), CAGR(%))
Table 13 Global Super Charging Market by Region, 2022-2032 (USD Mn, AGR (%), CAGR(%))
Table 14 Global Battery Electric Vehicle (BEV) Market by Charging Point Type, 2022-2032 (USD Mn, AGR (%), CAGR(%))
Table 15 Global Battery Electric Vehicle (BEV) Market by Battery Type, 2022-2032 (USD Mn, AGR (%), CAGR(%))
Table 16 Global Lithium-ion Batteries Market Forecast, 2022-2032 (USD Mn, AGR (%), CAGR(%))
Table 17 Global Lithium-ion Batteries Market by Region, 2022-2032 (USD Mn, AGR (%), CAGR(%))
Table 18 Global Lead-acid Batteries Market Forecast, 2022-2032 (USD Mn, AGR (%), CAGR(%))
Table 19 Global Lead-acid Batteries Market by Region, 2022-2032 (USD Mn, AGR (%), CAGR(%))
Table 20 Global Nickel-metal Hydride Batteries Market Forecast, 2022-2032 (USD Mn, AGR (%), CAGR(%))
Table 21 Global Nickel-metal Hydride Batteries Market by Region, 2022-2032 (USD Mn, AGR(%), CAGR(%))
Table 22 Global Battery Electric Vehicle (BEV) Market by Vehicle Type, 2022-2032 (USD Mn, AGR (%), CAGR(%))
Table 23 Global Passenger Vehicles Market Forecast, 2022-2032 (USD Mn, AGR (%), CAGR(%))
Table 24 Global Passenger Vehicles Market by Region, 2022-2032 (USD Mn, AGR (%), CAGR(%))
Table 25 Global Light Commercial Vehicles Market Forecast, 2022-2032 (USD Mn, AGR (%), CAGR(%))
Table 26 Global Light Commercial Vehicles Market by Region, 2022-2032 (USD Mn, AGR (%), CAGR(%))
Table 27 Global Heavy Commercial Vehicles Market Forecast, 2022-2032 (USD Mn, AGR (%), CAGR(%))
Table 28 Global Heavy Commercial Vehicles Market by Region, 2022-2032 (USD Mn, AGR (%), CAGR(%))
Table 29 Global Other Vehicle Type Market Forecast, 2022-2032 (USD Mn, AGR (%), CAGR(%))
Table 30 Global Other Vehicle Type Market by Region, 2022-2032 (USD Mn, AGR (%), CAGR(%))
Table 31 Global Battery Electric Vehicle (BEV) Market by Vehicle Connectivity, 2022-2032 (USD Mn, AGR (%), CAGR(%))
Table 32 Global Vehicle-to-Building/Home (V2B/H) Market Forecast, 2022-2032 (USD Mn, AGR (%), CAGR(%))
Table 33 Global Vehicle-to-Building/Home (V2B/H) Market by Region, 2022-2032 (USD Mn, AGR (%), CAGR(%))
Table 34 Global Vehicle-to-Grid (V2G) Market Forecast, 2022-2032 (USD Mn, AGR (%), CAGR(%))
Table 35 Global Vehicle-to-Grid (V2G) Market by Region, 2022-2032 (USD Mn, AGR (%), CAGR(%))
Table 36 Global Vehicle-to-Vehicle (V2V) Market Forecast, 2022-2032 (USD Mn, AGR (%), CAGR(%))
Table 37 Global Vehicle-to-Vehicle (V2V) Market by Region, 2022-2032 (USD Mn, AGR (%), CAGR(%))
Table 38 Global Vehicle-to-Everything (V2X) Market Forecast, 2022-2032 (USD Mn, AGR (%), CAGR(%))
Table 39 Global Vehicle-to-Everything (V2X) Market by Region, 2022-2032 (USD Mn, AGR (%), CAGR(%))
Table 40 Global Other Connectivity Market Forecast, 2022-2032 (USD Mn, AGR (%), CAGR(%))
Table 41 Global Other Connectivity Market by Region, 2022-2032 (USD Mn, AGR (%), CAGR(%))
Table 42 Global Battery Electric Vehicle (BEV) Market by Components, 2022-2032 (USD Mn, AGR (%), CAGR(%))
Table 43 Global Battery Cells & Packs Market Forecast, 2022-2032 (USD Mn, AGR (%), CAGR(%))
Table 44 Global Battery Cells & Packs Market by Region, 2022-2032 (USD Mn, AGR (%), CAGR(%))
Table 45 Global On-Board Charge Market Forecast, 2022-2032 (USD Mn, AGR (%), CAGR(%))
Table 46 Global On-Board Charge Market by Region, 2022-2032 (USD Mn, AGR (%), CAGR(%))
Table 47 Global Motor Market Forecast, 2022-2032 (USD Mn, AGR (%), CAGR(%))
Table 48 Global Motor Market by Region, 2022-2032 (USD Mn, AGR (%), CAGR(%))
Table 49 Global Power Control Unit Market Forecast, 2022-2032 (USD Mn, AGR (%), CAGR(%))
Table 50 Global Power Control Unit Market by Region, 2022-2032 (USD Mn, AGR (%), CAGR(%))
Table 51 Global Battery Management System Market Forecast, 2022-2032 (USD Mn, AGR (%), CAGR(%))
Table 52 Global Battery Management System Market by Region, 2022-2032 (USD Mn, AGR (%), CAGR(%))
Table 53 Global Other Components Market Forecast, 2022-2032 (USD Mn, AGR (%), CAGR(%))
Table 54 Global Other Components Market by Region, 2022-2032 (USD Mn, AGR (%), CAGR(%))
Table 55 North America Battery Electric Vehicle (BEV) Market by Value, 2022-2032 (USD Mn, AGR (%), CAGR(%))
Table 56 North America Battery Electric Vehicle (BEV) Market by Country, 2022-2032 (USD Mn, AGR (%), CAGR(%))
Table 57 North America Battery Electric Vehicle (BEV) Market by Charging Point Type, 2022-2032 (USD Mn, AGR (%), CAGR (%))
Table 58 North America Battery Electric Vehicle (BEV) Market by Battery Type, 2022-2032 (USD Mn, AGR (%), CAGR(%))
Table 59 North America Battery Electric Vehicle (BEV) Market by Vehicle Type, 2022-2032 (USD Mn, AGR (%), CAGR (%))
Table 60 North America Battery Electric Vehicle (BEV) Market by Vehicle Connectivity, 2022-2032 (USD Mn, AGR (%), CAGR (%))
Table 61 North America Battery Electric Vehicle (BEV) Market by Components, 2022-2032 (USD Mn, AGR (%), CAGR (%))
Table 62 US Battery Electric Vehicle (BEV) Market by Value, 2022-2032 (USD Mn, AGR (%), CAGR(%))
Table 63 Canada Battery Electric Vehicle (BEV) Market by Value, 2022-2032 (USD Mn, AGR (%), CAGR(%))
Table 64 Europe Battery Electric Vehicle (BEV) Market by Value, 2022-2032 (USD Mn, AGR (%), CAGR(%))
Table 65 Europe Battery Electric Vehicle (BEV) Market by Country, 2022-2032 (USD Mn, AGR (%), CAGR(%))
Table 66 Europe Battery Electric Vehicle (BEV) Market by Charging Point Type, 2022-2032 (USD Mn, AGR (%), CAGR (%))
Table 67 Europe Battery Electric Vehicle (BEV) Market by Battery Type, 2022-2032 (USD Mn, AGR (%), CAGR(%))
Table 68 Europe Battery Electric Vehicle (BEV) Market by Vehicle Type, 2022-2032 (USD Mn, AGR (%), CAGR(%))
Table 69 Europe Battery Electric Vehicle (BEV) Market by Vehicle Connectivity, 2022-2032 (USD Mn, AGR (%), CAGR (%))
Table 70 Europe Battery Electric Vehicle (BEV) Market by Components, 2022-2032 (USD Mn, AGR (%), CAGR(%))
Table 71 Norway Battery Electric Vehicle (BEV) Market by Value, 2022-2032 (USD Mn, AGR (%), CAGR (%))
Table 72 Netherlands Battery Electric Vehicle (BEV) Market by Value, 2022-2032 (USD Mn, AGR (%), CAGR(%))
Table 73 Germany Battery Electric Vehicle (BEV) Market by Value, 2022-2032 (USD Mn, AGR (%), CAGR(%))
Table 74 France Battery Electric Vehicle (BEV) Market by Value, 2022-2032 (USD Mn, AGR (%), CAGR(%))
Table 75 UK Battery Electric Vehicle (BEV) Market by Value, 2022-2032 (USD Mn, AGR (%), CAGR(%))
Table 76 Rest of Europe Battery Electric Vehicle (BEV) Market by Value, 2022-2032 (USD Mn, AGR (%), CAGR(%))
Table 77 Asia-Pacific Battery Electric Vehicle (BEV) Market by Value, 2022-2032 (USD Mn, AGR (%), CAGR(%))
Table 78 Asia-Pacific Battery Electric Vehicle (BEV) Market by Country, 2022-2032 (USD Mn, AGR (%), CAGR(%))
Table 79 Asia-Pacific Battery Electric Vehicle (BEV) Market by Charging Point Type, 2022-2032 (USD Mn, AGR (%), CAGR(%))
Table 80 Asia-Pacific Battery Electric Vehicle (BEV) Market by Battery Type, 2022-2032 (USD Mn, AGR (%), CAGR(%))
Table 81 Asia-Pacific Battery Electric Vehicle (BEV) Market by Vehicle Type, 2022-2032 (USD Mn, AGR (%), CAGR(%))
Table 82 Asia-Pacific Battery Electric Vehicle (BEV) Market by Vehicle Connectivity, 2022-2032 (USD Mn, AGR (%), CAGR(%))
Table 83 Asia-Pacific Battery Electric Vehicle (BEV) Market by Components, 2022-2032 (USD Mn, AGR (%), CAGR (%))
Table 84 China Battery Electric Vehicle (BEV) Market by Value, 2022-2032 (USD Mn, AGR (%), CAGR(%))
Table 85 India Battery Electric Vehicle (BEV) Market by Value, 2022-2032 (USD Mn, AGR (%), CAGR(%))
Table 86 Japan Battery Electric Vehicle (BEV) Market by Value, 2022-2032 (USD Mn, AGR (%), CAGR(%))
Table 87 South Korea Battery Electric Vehicle (BEV) Market by Value, 2022-2032 (USD Mn, AGR (%), CAGR(%))
Table 88 Australia Battery Electric Vehicle (BEV) Market by Value, 2022-2032 (USD Mn, AGR (%), CAGR(%))
Table 89 Rest of Asia-Pacific Battery Electric Vehicle (BEV) Market by Value, 2022-2032 (USD Mn, AGR (%), CAGR(%))
Table 90 Middle East & Africa Battery Electric Vehicle (BEV) Market by Value, 2022-2032 (USD Mn, AGR (%), CAGR(%))
Table 91 Middle East & Africa Battery Electric Vehicle (BEV) Market by Country, 2022-2032 (USD Mn, AGR (%), CAGR (%))
Table 92 Middle East & Africa Battery Electric Vehicle (BEV) Market by Charging Point Type, 2022-2032 (USD Mn, AGR (%), CAGR(%))
Table 93 Middle East & Africa Battery Electric Vehicle (BEV) Market by Battery Type, 2022-2032 (USD Mn, AGR (%), CAGR(%))
Table 94 Middle East & Africa Battery Electric Vehicle (BEV) Market by Vehicle Type, 2022-2032 (USD Mn, AGR (%), CAGR(%))
Table 95 Middle East & Africa Battery Electric Vehicle (BEV) Market by Vehicle Connectivity, 2022-2032 (USD Mn, AGR (%), CAGR (%))
Table 96 Middle East & Africa Battery Electric Vehicle (BEV) Market by Components, 2022-2032 (USD Mn, AGR (%), CAGR(%))
Table 97 South Africa Battery Electric Vehicle (BEV) Market by Value, 2022-2032 (USD Mn, AGR (%), CAGR(%))
Table 98 Saudi Arabia Battery Electric Vehicle (BEV) Market by Value, 2022-2032 (USD Mn, AGR (%), CAGR(%))
Table 99 Turkey Battery Electric Vehicle (BEV) Market by Value, 2022-2032 (USD Mn, AGR (%), CAGR(%))
Table 100 Rest of Middle East & Africa Battery Electric Vehicle (BEV) Market by Value, 2022-2032 (USD Mn, AGR (%), CAGR(%))
Table 101 South America Battery Electric Vehicle (BEV) Market by Value, 2022-2032 (USD Mn, AGR (%), CAGR(%))
Table 102 South America Battery Electric Vehicle (BEV) Market by Country, 2022-2032 (USD Mn, AGR (%), CAGR (%))
Table 103 South America Battery Electric Vehicle (BEV) Market by Charging Point Type, 2022-2032 (USD Mn, AGR (%), CAGR(%))
Table 104 South America Battery Electric Vehicle (BEV) Market by Battery Type, 2022-2032 (USD Mn, AGR (%), CAGR(%))
Table 105 South America Battery Electric Vehicle (BEV) Market by Vehicle Type, 2022-2032 (USD Mn, AGR (%), CAGR(%))
Table 106 South America Battery Electric Vehicle (BEV) Market by Vehicle Connectivity, 2022-2032 (USD Mn, AGR (%), CAGR(%))
Table 107 South America Battery Electric Vehicle (BEV) Market by Components, 2022-2032 (USD Mn, AGR (%), CAGR(%))
Table 108 Brazil Battery Electric Vehicle (BEV) Market by Value, 2022-2032 (USD Mn, AGR (%), CAGR(%))
Table 109 Rest of South America Battery Electric Vehicle (BEV) Market by Value, 2022-2032 (USD Mn, AGR (%), CAGR(%))
Table 110 Tesla, Inc.: Key Details, (CEO, HQ, Revenue, Founded, No. of Employees, Company Type, Website, Business Segment)
Table 111 Tesla, Inc: Product Benchmarking
Table 112 Tesla, Inc: Strategic Outlook
Table 113 Nissan Motor Corporation: Key Details, (CEO, HQ, Revenue, Founded, No. of Employees, Company Type, Website, Business Segment)
Table 114 Nissan Motor Corporation: Product Benchmarking
Table 115 Nissan Motor Corporation: Strategic Outlook
Table 116 Renault S.A: Key Details, (CEO, HQ, Revenue, Founded, No. of Employees, Company Type, Website, Business Segment)
Table 117 Renault S.A: Product Benchmarking
Table 118 Renault S.A: Strategic Outlook
Table 119 Bayerische Motoren Werke AG: Key Details, (CEO, HQ, Revenue, Founded, No. of Employees, Company Type, Website, Business Segment)
Table 120 Bayerische Motoren Werke AG: Product Benchmarking
Table 121 Bayerische Motoren Werke AG: Strategic Outlook
Table 122 Beijing Automotive Industry Holding Co., Ltd: Key Details, (CEO, HQ, Revenue, Founded, No. of Employees, Company Type, Website, Business Segment)
Table 123 Beijing Automotive Industry Holding Co., Ltd: Product Benchmarking
Table 124 Chery Automobile Co., Ltd.: Key Details, (CEO, HQ, Revenue, Founded, No. of Employees, Company Type, Website, Business Segment)
Table 125 Chery Automobile Co., Ltd.: Product Benchmarking
Table 126 Chery Automobile Co., Ltd.: Strategic Outlook
Table 127 Volkswagen AG: Key Details, (CEO, HQ, Revenue, Founded, No. of Employees, Company Type, Website, Business Segment)
Table 128 Volkswagen AG: Product Benchmarking
Table 129 Volkswagen AG: Strategic Outlook
Table 130 SAIC Motor Corporation Limited: Key Details, (CEO, HQ, Revenue, Founded, No. of Employees, Company Type, Website, Business Segment)
Table 131 SAIC Motor Corporation Limited: Product Benchmarking
Table 132 SAIC Motor Corporation Limited: Strategic Outlook
Table 133 BYD Company Ltd: Key Details, (CEO, HQ, Revenue, Founded, No. of Employees, Company Type, Website, Business Segment)
Table 134 BYD Company Ltd: Product Benchmarking
Table 135 BYD Company Ltd: Strategic Outlook
Table 136 Zhejiang Geely Holding Group Co., Ltd: Key Details, (CEO, HQ, Revenue, Founded, No. of Employees, Company Type, Website, Business Segment)
Table 137 Zhejiang Geely Holding Group Co., Ltd: Product Benchmarking
Table 138 Zhejiang Geely Holding Group Co., Ltd: Strategic Outlook
Table 139 Blue Bird Corporation: Key Details, (CEO, HQ, Revenue, Founded, No. of Employees, Company Type, Website, Business Segment)
Table 140 Blue Bird Corporation: Product Benchmarking
Table 141 Blue Bird Corporation: Strategic Outlook
Table 142 Volvo Car Corporation: Key Details, (CEO, HQ, Revenue, Founded, No. of Employees, Company Type, Website, Business Segment)
Table 143 Volvo Car Corporation: Product Benchmarking
Table 144 Volvo Car Corporation: Strategic Outlook
Table 145 Kia Corporation: Key Details, (CEO, HQ, Revenue, Founded, No. of Employees, Company Type, Website, Business Segment)
Table 146 Kia Corporation: Product Benchmarking
Table 147 Kia Corporation: Strategic Outlook
Table 148 General Motors Company: Key Details, (CEO, HQ, Revenue, Founded, No. of Employees, Company Type, Website, Business Segment)
Table 149 General Motors Company: Product Benchmarking
Table 150 General Motors Company: Strategic Outlook
Table 151 Audi AG: Key Details, (CEO, HQ, Revenue, Founded, No. of Employees, Company Type, Website, Business Segment)
Table 152 Audi AG: Product Benchmarking
Table 153 Audi AG: Strategic Outlook
Table 154 Hyundai Motor: Key Details, (CEO, HQ, Revenue, Founded, No. of Employees, Company Type, Website, Business Segment)
Table 155 Hyundai Motor: Product Benchmarking
Table 156 Hyundai Motor: Strategic Outlook
Table 157 Tata Motors Limited: Key Details, (CEO, HQ, Revenue, Founded, No. of Employees, Company Type, Website, Business Segment)
Table 158 Tata Motors Limited: Product Benchmarking
Table 159 Tata Motors Limited: Strategic Outlook
Table 160 Tata Motors Limited: Key Details, (CEO, HQ, Revenue, Founded, No. of Employees, Company Type, Website, Business Segment)
Table 161 Tata Motors Limited: Product Benchmarking
Table 162 Tata Motors Limited: Strategic Outlook
Table 163 Ford Motor Company: Key Details, (CEO, HQ, Revenue, Founded, No. of Employees, Company Type, Website, Business Segment)
Table 164 Ford Motor Company: Product Benchmarking
Table 165 Ford Motor Company: Strategic Outlook
Table 166 Polestar AB: Key Details, (CEO, HQ, Revenue, Founded, No. of Employees, Company Type, Website, Business Segment)
Table 167 Polestar AB: Product Benchmarking
Table 168 Polestar AB: Strategic Outlook
List of Figures
Figure 1 Global Battery Electric Vehicle Market Segmentation
Figure 2 Global Battery Electric Vehicle Market Forecast by Region: Market Attractiveness Index
Figure 3 Global Battery Electric Vehicle Market by Battery Type: Market Attractiveness Index
Figure 4 Global Battery Electric Vehicle Market by Vehicle Type : Market Attractiveness Index
Figure 5 Global Battery Electric Vehicle Market by Vehicle Type: Market Attractiveness Index
Figure 6 Global Battery Electric Vehicle Market by Vehicle Connectivity: Market Attractiveness Index
Figure 7 Global Battery Electric Vehicle Market by Components: Market Attractiveness Index
Figure 8 Global Battery Electric Vehicle Market: Market Dynamics
Figure 9 Global Battery Electric Vehicle (BEV) Market Forecast, 2022-2032 (USD Mn, AGR (%)) (V-Shaped Recovery Scenario)
Figure 10 Global Battery Electric Vehicle (BEV) Market by Region, 2022-2032 (USD Mn, AGR (%)) (V-Shaped Recovery Scenario)
Figure 11 Global Battery Electric Vehicle (BEV) Market Forecast, 2022-2032 (USD Mn, AGR (%)) (W-Shaped Recovery Scenario)
Figure 12 Global Battery Electric Vehicle (BEV) Market by Region, 2022-2032 (USD Mn, AGR (%)) (W-Shaped Recovery Scenario)
Figure 13 Global Battery Electric Vehicle (BEV) Market Forecast, 2022-2032 (USD Mn, AGR (%)) (U-Shaped Recovery Scenario)
Figure 14 Global Battery Electric Vehicle (BEV) Market by Region, 2022-2032 (USD Mn, AGR (%)) (U-Shaped Recovery Scenario)
Figure 15 Global Battery Electric Vehicle (BEV) Market Forecast, 2022-2032 (USD Mn, AGR (%)) (L-Shaped Recovery Scenario)
Figure 16 Global Battery Electric Vehicle (BEV) Market by Region, 2022-2032 (USD Mn, AGR (%)) (L-Shaped Recovery Scenario)
Figure 17 Global Battery Electric Vehicle Market: Porter’s Five Forces Analysis
Figure 18 Global Battery Electric Vehicle Market: PESTLE Analysis
Figure 19 Global Battery Electric Vehicle Market Forecast by Charging Point Type 2022, 2027, 2032 (Revenue, CAGR%)
Figure 20 Segment02 Market Share Forecast by Region, 2022-2032 (%)
Figure 21 Global Battery Electric Vehicle Market Share Forecast by Charging Point Type, 2022, 2032 (%)
Figure 22 Global Normal Charging Market Forecast, 2022-2032 (USD Mn, AGR (%))
Figure 23 Global Normal Charging Market by Region, 2022-2032 (USD Mn, AGR (%))
Figure 24 Global Super Charging Market Forecast, 2022-2032 (USD Mn, AGR (%))
Figure 25 Global Super Charging Market by Region, 2022-2032 (USD Mn, AGR (%))
Figure 26 Global Battery Electric Vehicle (BEV) Market by Charging Point Type, 2022-2032 (USD Mn, AGR (%))
Figure 27 Global Battery Electric Vehicle (BEV) Market by Battery Type, 2022-2032 (USD Mn, AGR (%))
Figure 28 Global Battery Electric Vehicle Market Forecast by Battery Type 2022, 2027, 2032 (Revenue)
Figure 29 Segment02 Market Share Forecast by Region, 2022-2032 (%)
Figure 30 Global Battery Electric Vehicle Market Share Forecast by Battery Type , 2022, 2032 (%)
Figure 31 Global Lithium-ion Batteries Market Forecast, 2022-2032 (USD Mn, AGR (%))
Figure 32 Global Lithium-ion Batteries Market by Region, 2022-2032 (USD Mn, AGR (%))
Figure 33 Global Lead-acid Batteries Market Forecast, 2022-2032 (USD Mn, AGR (%))
Figure 34 Global Lead-acid Batteries Market by Region, 2022-2032 (USD Mn, AGR (%))
Figure 35 Global Nickel-metal Hydride Batteries Market Forecast, 2022-2032 (USD Mn, AGR (%))
Figure 36 Global Nickel-metal Hydride Batteries Market by Region, 2022-2032 (USD Mn, AGR (%))
Figure 37 Global Battery Electric Vehicle (BEV) Market by Vehicle Type, 2022-2032 (USD Mn, AGR (%))
Figure 38 Global Battery Electric Vehicle Market Forecast by Vehicle Type 2022, 2027, 2032 (Revenue, CAGR%)
Figure 39 Vehicle Type Market Share Forecast by Region, 2022-2032 (%)
Figure 40 Global Battery Electric Vehicle Market Share Forecast by Vehicle Type, 2022, 2032 (%)
Figure 41 Global Passenger Vehicles Market Forecast, 2022-2032 (USD Mn, AGR (%))
Figure 42 Global Passenger Vehicles Market by Region, 2022-2032 (USD Mn, AGR (%))
Figure 43 Global Light Commercial Vehicles Market Forecast, 2022-2032 (USD Mn, AGR (%))
Figure 44 Global Light Commercial Vehicles Market by Region, 2022-2032 (USD Mn, AGR (%))
Figure 45 Global Heavy Commercial Vehicles Market Forecast, 2022-2032 (USD Mn, AGR (%))
Figure 46 Global Heavy Commercial Vehicles Market by Region, 2022-2032 (USD Mn, AGR (%))
Figure 47 Global Other Vehicle Type Market Forecast, 2022-2032 (USD Mn, AGR (%))
Figure 48 Global Other Vehicle Type Market by Region, 2022-2032 (USD Mn, AGR (%))
Figure 49 Global Battery Electric Vehicle (BEV) Market by Vehicle Connectivity, 2022-2032 (USD Mn, AGR (%))
Figure 50 Global Battery Electric Vehicle Market Forecast by Vehicle Connectivity2022, 2027, 2032 (Revenue, CAGR%)
Figure 51 Segment02 Market Share Forecast by Region, 2022-2032 (%)
Figure 52 Global Battery Electric Vehicle Market Share Forecast by Vehicle Connectivity, 2022, 2032 (%)
Figure 53 Global Vehicle-to-Building/Home (V2B/H) Market Forecast, 2022-2032 (USD Mn, AGR (%))
Figure 54 Global Vehicle-to-Building/Home (V2B/H) Market by Region, 2022-2032 (USD Mn, AGR (%))
Figure 55 Global Vehicle-to-Grid (V2G) Market Forecast, 2022-2032 (USD Mn, AGR (%))
Figure 56 Global Vehicle-to-Grid (V2G) Market by Region, 2022-2032 (USD Mn, AGR (%))
Figure 57 Global Vehicle-to-Vehicle (V2V) Market Forecast, 2022-2032 (USD Mn, AGR (%))
Figure 58 Global Vehicle-to-Vehicle (V2V) Market by Region, 2022-2032 (USD Mn, AGR (%))
Figure 59 Global Vehicle-to-Everything (V2X) Market Forecast, 2022-2032 (USD Mn, AGR (%))
Figure 60 Global Vehicle-to-Everything (V2X) Market by Region, 2022-2032 (USD Mn, AGR (%))
Figure 61 Global Other Connectivity Market Forecast, 2022-2032 (USD Mn, AGR (%))
Figure 62 Global Other Connectivity Market by Region, 2022-2032 (USD Mn, AGR (%))
Figure 63 Global Battery Electric Vehicle Market Forecast by Components 2022, 2027, 2032 (Revenue, CAGR%)
Figure 64 Segment02 Market Share Forecast by Region, 2022-2032 (%)
Figure 65 Global Battery Electric Vehicle Market Share Forecast by Component, 2022, 2032 (%)
Figure 66 Global Battery Electric Vehicle (BEV) Market by Components, 2022-2032 (USD Mn, AGR (%))
Figure 67 Global Battery Cells & Packs Market Forecast, 2022-2032 (USD Mn, AGR (%))
Figure 68 Global Battery Cells & Packs Market by Region, 2022-2032 (USD Mn, AGR (%))
Figure 69 Global On-Board Charge Market Forecast, 2022-2032 (USD Mn, AGR (%))
Figure 70 Global On-Board Charge Market by Region, 2022-2032 (USD Mn, AGR (%))
Figure 71 Global Motor Market Forecast, 2022-2032 (USD Mn, AGR (%))
Figure 72 Global Motor Market by Region, 2022-2032 (USD Mn, AGR (%))
Figure 73 Global Power Control Unit Market Forecast, 2022-2032 (USD Mn, AGR (%))
Figure 74 Global Power Control Unit Market by Region, 2022-2032 (USD Mn, AGR (%))
Figure 75 Global Battery Management System Market Forecast, 2022-2032 (USD Mn, AGR (%))
Figure 76 Global Battery Management System Market by Region, 2022-2032 (USD Mn, AGR (%))
Figure 77 Global Other Components Market Forecast, 2022-2032 (USD Mn, AGR (%))
Figure 78 Global Other Components Market by Region, 2022-2032 (USD Mn, AGR (%))
Figure 79 North America Battery Electric Vehicle Market Attractiveness Index
Figure 80 North America Battery Electric Vehicle Market by Region, 2022, 2027 & 2032 (US$million)
Figure 81 North America Battery Electric Vehicle (BEV) Market by Value, 2022-2032 (USD Mn, AGR (%))
Figure 82 North America Battery Electric Vehicle (BEV) Market by Country, 2022-2032 (USD Mn, AGR (%))
Figure 83 North America Battery Electric Vehicle Market Share Forecast by Country, 2022 & 2032 (%)
Figure 84 North America Battery Electric Vehicle (BEV) Market by Charging Point Type, 2022-2032 (USD Mn, AGR (%))
Figure 85 North America Battery Electric Vehicle Market Share Forecast by Charging Point Type, 2022 & 2032 (%)
Figure 86 North America Battery Electric Vehicle (BEV) Market by Battery Type, 2022-2032 (USD Mn, AGR (%))
Figure 87 North America Battery Electric Vehicle Market Share Forecast by Battery Type , 2022 & 2032 (%)
Figure 88 North America Battery Electric Vehicle (BEV) Market by Vehicle Type, 2022-2032 (USD Mn, AGR (%))
Figure 89 North America Battery Electric Vehicle Market Share Forecast by Vehicle Type, 2022 & 2032 (%)
Figure 90 North America Battery Electric Vehicle (BEV) Market by Vehicle Connectivity, 2022-2032 (USD Mn, AGR (%))
Figure 91 North America Battery Electric Vehicle Market Share Forecast by Vehicle Connectivity, 2022 & 2032 (%)
Figure 92 North America Battery Electric Vehicle (BEV) Market by Components, 2022-2032 (USD Mn, AGR (%))
Figure 93 North America Battery Electric Vehicle Market Share Forecast by Components, 2022 & 2032 (%)
Figure 94 US Battery Electric Vehicle (BEV) Market by Value, 2022-2032 (USD Mn, AGR (%))
Figure 95 Canada Battery Electric Vehicle (BEV) Market by Value, 2022-2032 (USD Mn, AGR (%))
Figure 96 Europe Battery Electric Vehicle Market Attractiveness Index
Figure 97 Europe Battery Electric Vehicle Market by Region, 2022, 2027 & 2032 (US$million)
Figure 98 Europe Battery Electric Vehicle (BEV) Market by Value, 2022-2032 (USD Mn, AGR (%))
Figure 99 Europe Battery Electric Vehicle (BEV) Market by Country, 2022-2032 (USD Mn, AGR (%))
Figure 100 Europe Battery Electric Vehicle Market Share Forecast by Country, 2022 & 2032 (%)
Figure 101 Europe Battery Electric Vehicle (BEV) Market by Charging Point Type, 2022-2032 (USD Mn, AGR (%))
Figure 102 Europe Battery Electric Vehicle Market Share Forecast by Charging Point Type, 2022 & 2032 (%)
Figure 103 Europe Battery Electric Vehicle (BEV) Market by Battery Type, 2022-2032 (USD Mn, AGR (%))
Figure 104 Europe Battery Electric Vehicle Market Share Forecast by Battery Type, 2022 & 2032 (%)
Figure 105 Europe Battery Electric Vehicle (BEV) Market by Vehicle Type, 2022-2032 (USD Mn, AGR (%))
Figure 106 Europe Battery Electric Vehicle Market Share Forecast by Vehicle Type , 2022 & 2032 (%)
Figure 107 Europe Battery Electric Vehicle (BEV) Market by Vehicle Connectivity, 2022-2032 (USD Mn, AGR (%))
Figure 108 Europe Battery Electric Vehicle Market Share Forecast by Vehicle Connectivity, 2022 & 2032 (%)
Figure 109 Europe Battery Electric Vehicle (BEV) Market by Components, 2022-2032 (USD Mn, AGR (%))
Figure 110 Europe Battery Electric Vehicle Market Share Forecast by Components, 2022 & 2032 (%)
Figure 111 Norway Battery Electric Vehicle (BEV) Market by Value, 2022-2032 (USD Mn, AGR (%))
Figure 112 Netherlands Battery Electric Vehicle (BEV) Market by Value, 2022-2032 (USD Mn, AGR (%))
Figure 113 Germany Battery Electric Vehicle (BEV) Market by Value, 2022-2032 (USD Mn, AGR (%))
Figure 114 France Battery Electric Vehicle (BEV) Market by Value, 2022-2032 (USD Mn, AGR (%))
Figure 115 UK Battery Electric Vehicle (BEV) Market by Value, 2022-2032 (USD Mn, AGR (%))
Figure 116 Rest of Europe Battery Electric Vehicle (BEV) Market by Value, 2022-2032 (USD Mn, AGR (%))
Figure 117 Asia-Pacific Battery Electric Vehicle Market Attractiveness Index
Figure 118 Asia-Pacific Battery Electric Vehicle Market by Region, 2022, 2027 & 2032 (US$million)
Figure 119 Asia-Pacific Battery Electric Vehicle (BEV) Market by Value, 2022-2032 (USD Mn, AGR (%))
Figure 120 Asia-Pacific Battery Electric Vehicle (BEV) Market by Country, 2022-2032 (USD Mn, AGR (%))
Figure 121 Asia-Pacific Battery Electric Vehicle Market Share Forecast by Country, 2022 & 2032 (%)
Figure 122 Asia-Pacific Battery Electric Vehicle (BEV) Market by Charging Point Type, 2022-2032 (USD Mn, AGR (%))
Figure 123 Asia-Pacific Battery Electric Vehicle Market Share Forecast by Charging Point Type, 2022 & 2032 (%)
Figure 124 Asia-Pacific Battery Electric Vehicle (BEV) Market by Battery Type, 2022-2032 (USD Mn, AGR (%))
Figure 125 Asia-Pacific Battery Electric Vehicle Market Share Forecast by Battery Type, 2022 & 2032 (%)
Figure 126 Asia-Pacific Battery Electric Vehicle (BEV) Market by Vehicle Type, 2022-2032 (USD Mn, AGR (%))
Figure 127 Asia-Pacific Battery Electric Vehicle Market Share Forecast by Vehicle Type , 2022 & 2032 (%)
Figure 128 Asia-Pacific Battery Electric Vehicle (BEV) Market by Vehicle Connectivity, 2022-2032 (USD Mn, AGR (%))
Figure 129 Asia-Pacific Battery Electric Vehicle Market Share Forecast by Vehicle Connectivity, 2022 & 2032 (%)
Figure 130 Asia-Pacific Battery Electric Vehicle (BEV) Market by Components, 2022-2032 (USD Mn, AGR (%))
Figure 131 Asia-Pacific Battery Electric Vehicle Market Share Forecast by Components, 2022 & 2032 (%)
Figure 132 China Battery Electric Vehicle (BEV) Market by Value, 2022-2032 (USD Mn, AGR (%))
Figure 133 India Battery Electric Vehicle (BEV) Market by Value, 2022-2032 (USD Mn, AGR (%))
Figure 134 Japan Battery Electric Vehicle (BEV) Market by Value, 2022-2032 (USD Mn, AGR (%))
Figure 135 South Korea Battery Electric Vehicle (BEV) Market by Value, 2022-2032 (USD Mn, AGR (%))
Figure 136 Australia Battery Electric Vehicle (BEV) Market by Value, 2022-2032 (USD Mn, AGR (%))
Figure 137 Rest of Asia-Pacific Battery Electric Vehicle (BEV) Market by Value, 2022-2032 (USD Mn, AGR (%))
Figure 138 Middle East and Africa Battery Electric Vehicle Market Attractiveness Index
Figure 139 Middle East and Africa Battery Electric Vehicle Market by Region, 2022, 2027 & 2032 (US$million)
Figure 140 Middle East & Africa Battery Electric Vehicle (BEV) Market by Value, 2022-2032 (USD Mn, AGR (%))
Figure 141 Middle East & Africa Battery Electric Vehicle (BEV) Market by Country, 2022-2032 (USD Mn, AGR (%))
Figure 142 Middle East and Africa Battery Electric Vehicle Market Share Forecast by Country, 2022 & 2032 (%)
Figure 143 Middle East & Africa Battery Electric Vehicle (BEV) Market by Charging Point Type, 2022-2032 (USD Mn, AGR (%))
Figure 144 Middle East and Africa Battery Electric Vehicle Market Share Forecast by Charging Point Type, 2022 & 2032 (%)
Figure 145 Middle East & Africa Battery Electric Vehicle (BEV) Market by Battery Type, 2022-2032 (USD Mn, AGR (%))
Figure 146 Middle East and Africa Battery Electric Vehicle Market Share Forecast by Battery Type, 2022 & 2032 (%)
Figure 147 Middle East & Africa Battery Electric Vehicle (BEV) Market by Vehicle Type, 2022-2032 (USD Mn, AGR (%))
Figure 148 Middle East and Africa Battery Electric Vehicle Market Share Forecast by Vehicle Type, 2022 & 2032 (%)
Figure 149 Middle East & Africa Battery Electric Vehicle (BEV) Market by Vehicle Connectivity, 2022-2032 (USD Mn, AGR (%))
Figure 150 Middle East and Africa Battery Electric Vehicle Market Share Forecast by Vehicle Connectivity, 2022 & 2032 (%)
Figure 151 Middle East & Africa Battery Electric Vehicle (BEV) Market by Components, 2022-2032 (USD Mn, AGR (%))
Figure 152 Middle East and Africa Battery Electric Vehicle Market Share Forecast by Components, 2022 & 2032 (%)
Figure 153 South Africa Battery Electric Vehicle (BEV) Market by Value, 2022-2032 (USD Mn, AGR (%))
Figure 154 Saudi Arabia Battery Electric Vehicle (BEV) Market by Value, 2022-2032 (USD Mn, AGR (%))
Figure 155 Turkey Battery Electric Vehicle (BEV) Market by Value, 2022-2032 (USD Mn, AGR (%))
Figure 156 Rest of Middle East & Africa Battery Electric Vehicle (BEV) Market by Value, 2022-2032 (USD Mn, AGR (%))
Figure 157 South America Battery Electric Vehicle Market Attractiveness Index
Figure 158 South America Battery Electric Vehicle Market by Region, 2022, 2027 & 2032 (US$million)
Figure 159 South America Battery Electric Vehicle (BEV) Market by Value, 2022-2032 (USD Mn, AGR (%))
Figure 160 South America Battery Electric Vehicle (BEV) Market by Country, 2022-2032 (USD Mn, AGR (%))
Figure 161 South America Battery Electric Vehicle Market Share Forecast by Country, 2022 & 2032 (%)
Figure 162 South America Battery Electric Vehicle (BEV) Market by Charging Point Type, 2022-2032 (USD Mn, AGR (%))
Figure 163 South America Battery Electric Vehicle Market Share Forecast by Charging Point Type, 2022 & 2032 (%)
Figure 164 South America Battery Electric Vehicle (BEV) Market by Battery Type, 2022-2032 (USD Mn, AGR (%))
Figure 165 South America Battery Electric Vehicle Market Share Forecast by Battery Type, 2022 & 2032 (%)
Figure 166 South America Battery Electric Vehicle (BEV) Market by Vehicle Type, 2022-2032 (USD Mn, AGR (%))
Figure 167 South America Battery Electric Vehicle Market Share Forecast by Vehicle Type, 2022 & 2032 (%)
Figure 168 South America Battery Electric Vehicle (BEV) Market by Vehicle Connectivity, 2022-2032 (USD Mn, AGR (%))
Figure 169 South America Battery Electric Vehicle Market Share Forecast by Vehicle Connectivity, 2022 & 2032 (%)
Figure 170 South America Battery Electric Vehicle (BEV) Market by Components, 2022-2032 (USD Mn, AGR (%))
Figure 171 South America Battery Electric Vehicle Market Share Forecast by Components, 2022 & 2032 (%)
Figure 172 Brazil Battery Electric Vehicle (BEV) Market by Value, 2022-2032 (USD Mn, AGR (%))
Figure 173 Rest of South America Battery Electric Vehicle (BEV) Market by Value, 2022-2032 (USD Mn, AGR (%))
Figure 174 Tesla, Inc : Net Revenue, 2017-2021 (US$million, AGR%)
Figure 175 Tesla, Inc: Gross Profit, 2017-2021 (US$million, AGR%)
Figure 176 Tesla, Inc: R&D Expences 2017-2021 (US$million, AGR%)
Figure 177 Tesla, Inc: EBITDA, 2017-2021 (US$million, AGR%)
Figure 178 Nissan Motor Corporation: Net Revenue, 2017-2021 (US$million, AGR%)
Figure 179 Nissan Motor Corporation: Gross Profit, 2017-2021 (US$million, AGR%)
Figure 180 Nissan Motor Corporation: R&D Expences 2017-2021 (US$million, AGR%)
Figure 181 Nissan Motor Corporation : EBITDA, 2017-2021 (US$million, AGR%)
Figure 182 Renault S.A: Net Revenue, 2017-2021 (US$million, AGR%)
Figure 183 Renault S.A: Gross Profit, 2017-2021 (US$million, AGR%)
Figure 184 Renault S.A: R&D Expences: 2017-2021 (US$million, AGR%)
Figure 185 Renault S.A: EBITDA, 2017-2021 (US$million, AGR%)
Figure 186 Bayerische Motoren Werke AG: Net Revenue, 2017-2021 (US$million, AGR%)
Figure 187 Bayerische Motoren Werke AG: Gross Profit, 2017-2021 (US$million, AGR%)
Figure 188 Bayerische Motoren Werke AG: R&D Expences 2017-2021 (US$million, AGR%)
Figure 189 Bayerische Motoren Werke AG: EBITDA, 2017-2021 (US$million, AGR%)
Figure 190 Volkswagen AG: Net Revenue, 2017-2021 (US$million, AGR%)
Figure 191 Volkswagen AG: Gross Profit, 2017-2021 (US$million, AGR%)
Figure 192 Volkswagen AG: Net Profit 2017-2021 (US$million, AGR%)
Figure 193 Volkswagen AG: EBITDA, 2017-2021 (US$million, AGR%)
Figure 194 Zhejiang Geely Holding Group Co., Ltd: Net Revenue, 2017-2021 (US$million, AGR%)
Figure 195 Zhejiang Geely Holding Group Co., Ltd: Gross Profit, 2017-2021 (US$million, AGR%)
Figure 196 Zhejiang Geely Holding Group Co., Ltd R&D Expenses 2017-2021 (US$million, AGR%)
Figure 197 Zhejiang Geely Holding Group Co., Ltd: EBITDA, 2017-2021 (US$million, AGR%)
Figure 198 Blue Bird Corporation: Net Revenue, 2017-2021 (US$million, AGR%)
Figure 199 Blue Bird Corporation: Gross Profit, 2017-2021 (US$million, AGR%)
Figure 200 Blue Bird Corporation: Net Profit 2017-2021 (US$million, AGR%)
Figure 201 Blue Bird Corporation: EBITDA, 2017-2021 (US$million, AGR%)
Figure 202 Volvo Car Corporation: Net Revenue, 2017-2021 (US$million, AGR%)
Figure 203 Volvo Car Corporation: Gross Profit, 2017-2021 (US$million, AGR%)
Figure 204 Volvo Car Corporation: Net Profit 2017-2021 (US$million, AGR%)
Figure 205 Volvo Car Corporation: EBITDA, 2017-2021 (US$million, AGR%)
Figure 206 General Motors Company: Net Revenue, 2017-2021 (US$million, AGR%)
Figure 207 General Motors Company: Gross Profit, 2017-2021 (US$million, AGR%)
Figure 208 General Motors Company: Net Profit 2017-2021 (US$million, AGR%)
Figure 209 General Motors Company: EBITDA, 2017-2021 (US$million, AGR%)
Figure 210 Tata Motors Limited: Net Revenue, 2017-2021 (US$million, AGR%)
Figure 211 Tata Motors Limited: Gross Profit, 2017-2021 (US$million, AGR%)
Figure 212 Tata Motors Limited: Net Profit 2017-2021 (US$million, AGR%)
Figure 213 Tata Motors Limited: EBITDA, 2017-2021 (US$million, AGR%)
Figure 214 Ford Motor Company: Net Revenue, 2017-2021 (US$million, AGR%)
Figure 215 Ford Motor Company: Gross Profit, 2017-2021 (US$million, AGR%)
Figure 216 Ford Motor Company: Net Profit 2017-2021 (US$million, AGR%)
Figure 217 Ford Motor Company: EBITDA, 2017-2021 (US$million, AGR%)
ページTOPに戻る
よくあるご質問
Visiongain社はどのような調査会社ですか?
英国の調査会社ヴィジョンゲイン社(Visiongain)は、通信とエネルギーのほか、自動車や化学・医薬品、金属など、広範な市場を対象に調査を行っています。自動車市場については、市場全般に関する調査のほ... もっと見る
調査レポートの納品までの日数はどの程度ですか?
在庫のあるものは速納となりますが、平均的には 3-4日と見て下さい。
但し、一部の調査レポートでは、発注を受けた段階で内容更新をして納品をする場合もあります。
発注をする前のお問合せをお願いします。
注文の手続きはどのようになっていますか?
1)お客様からの御問い合わせをいただきます。
2)見積書やサンプルの提示をいたします。
3)お客様指定、もしくは弊社の発注書をメール添付にて発送してください。
4)データリソース社からレポート発行元の調査会社へ納品手配します。
5) 調査会社からお客様へ納品されます。最近は、pdfにてのメール納品が大半です。
お支払方法の方法はどのようになっていますか?
納品と同時にデータリソース社よりお客様へ請求書(必要に応じて納品書も)を発送いたします。
お客様よりデータリソース社へ(通常は円払い)の御振り込みをお願いします。
請求書は、納品日の日付で発行しますので、翌月最終営業日までの当社指定口座への振込みをお願いします。振込み手数料は御社負担にてお願いします。
お客様の御支払い条件が60日以上の場合は御相談ください。
尚、初めてのお取引先や個人の場合、前払いをお願いすることもあります。ご了承のほど、お願いします。
データリソース社はどのような会社ですか?
当社は、世界各国の主要調査会社・レポート出版社と提携し、世界各国の市場調査レポートや技術動向レポートなどを日本国内の企業・公官庁及び教育研究機関に提供しております。
世界各国の「市場・技術・法規制などの」実情を調査・収集される時には、データリソース社にご相談ください。
お客様の御要望にあったデータや情報を抽出する為のレポート紹介や調査のアドバイスも致します。
|
|


