小型衛星市場レポート:2023-2033
Small Satellite Market Report 2023-2033
レポート詳細
小型衛星市場レポート 2023-2033 :本レポートは、新たな収益の柱を目指す大手企業にとって、業界とその根底にある力学をより深く理解する上で貴重なものとなろう。異業種への進出や、新... もっと見る
※上記価格は部署ライセンス(Departmental licence)価格です。
その他の価格についてはデータリソースまでお問合せください。
日本語のページは自動翻訳を利用し作成しています。
実際のレポートは英文のみでご納品いたします。
サマリー
レポート詳細
小型衛星市場レポート 2023-2033:本レポートは、新たな収益の柱を目指す大手企業にとって、業界とその根底にある力学をより深く理解する上で貴重なものとなろう。異業種への進出や、新たな地域での既存事業の拡大を希望する企業にとっても有用であろう。
技術革新が業界の成長を促進すると予想される
宇宙産業の技術革新のほとんどは、衛星の技術開発によって実現されている。衛星技術における最も重要な開発は、小型衛星(スモールサット)、特にナノサットであり、これらは衛星能力の次の波を促進します。さらに、小型衛星の製造コストが低いことから、衛星の大量生産の道が開かれつつあります。衛星モノのインターネット(IoT)は、産業界全体で比類のないコネクティビティを実現し、5Gと今後の6G機能を可能にするもう1つの重要なトレンドである衛星通信です。同時に、軌道サービスも地上局も、衛星メーカーや衛星運用会社がもたらした技術的進歩の恩恵を受けています。推進力の自動化システム、デジタル・ペイロード、人工知能(AI)により、衛星はますます高度なタスクを自ら実行できるようになりました。インテリジェント衛星の新時代は、衛星の製造、運用、サービスに特化した新興企業によって築かれようとしています。
業界の成長を抑制しそうな財政的持続可能性と資金調達
小型衛星市場のプレーヤーにとって、財務的な持続可能性と資金調達もまた複雑な課題です。小型衛星の開発・打ち上げコストは、大型衛星に比べて一般的に低いが、衛星のライフサイクルの様々な段階における資金確保は、特に新興企業や小規模企業にとっては依然としてハードルが高い。収益創出の予測不可能な性質は、資本への限られたアクセスと相まって、長期的な投資戦略や成長戦略に不確実性をもたらしかねない。この難題を乗り切るために、プレーヤーは政府補助金、ベンチャーキャピタル、パートナーシップ、商業契約などの多様な資金源を模索する必要があります。衛星ソリューションの経済的実行可能性を実証し、強固なビジネスモデルを構築することは、持続的な財政支援を呼び込む上で極めて重要です。
市場調査レポートを購入する前にすべき質問とは?
- 小型衛星市場はどのように進化しているのか?
- 小型衛星市場の推進要因と抑制要因は何か?
- 小型衛星の各サブ市場セグメントは予測期間中にどのように成長し、2033年にこれらのサブ市場の売上はどの程度になるのか?
- 2023年から2033年にかけて、各小型衛星サブマーケットの市場シェアはどのように推移するのか?
- 2023年から2033年にかけての市場全体の主な牽引役は何か?
- 主要な小型衛星市場はマクロ経済の動きに概ね追随するのか、それとも個々の国別市場が他を凌駕するのか。
- 2033 年までに各国市場のシェアはどのように変化し、2033 年にはどの地域が市場をリードするのか?
- 主要プレイヤーは誰で、予測期間中の見通しは?
- これらの大手企業の小型衛星プロジェクトとは?
- 2023 年から 2033 年の間に、業界はどのように発展していくのか?小型衛星プロジェクトが現在、そして今後
現在および今後 10 年間の小型衛星プロジェクトにはどのような意味があるのか?
- 小型衛星市場をさらに拡大するために、製品の商業化の必要性は高まっているのか?
- 小型衛星市場はどこに向かっているのか、そしてどのようにすれば市場の最前線に立つことができるのか?
- 新製品やサービスラインに対する最適な投資オプションは何か?
- 企業を新たな成長軌道に乗せ、C-suiteに移行させるための重要な展望とは?
現在、そして今後10年間、小型衛星市場にどのような影響を与えるかを見極める必要がある:- 266ページにわたる本レポートは、106の表と137の図表で構成されています。
- 本レポートでは、業界における主要な有利分野を取り上げているため、今すぐターゲットを絞ることができます。
- 本レポートには、世界、地域、国の売上と成長に関する詳細な分析が含まれています。
- 競合他社が成功した主なトレンド、変化、収益予測をハイライトしています。
本レポートは、小型衛星市場が今後10年間でどのように発展するか、またCOVID-19の景気後退と好転の変動に合わせてTODAYを伝えます。この市場は、過去10年間のどの時点よりも今が重要です。
2033年までの予測やその他の分析から、商業的な展望が明らかになる
- 2033年までの収益予測に加え、直近の業績、成長率、市場シェアもご覧いただけます。
- ビジネスの展望と展開に関する独自の分析をご覧いただけます。
- 定性的分析(市場ダイナミクス、促進要因、機会、阻害要因など)、ポーターのファイブフォース分析、PEST分析、最近の動向をご覧いただけます。
本レポートには、COVID-19が業界と貴社にどのような影響を与えるかについてのデータ分析と貴重な洞察が含まれている。本レポートでは、COVID-19の4つの回収パターンとその影響、すなわち「V」、「L」、「W」、「U」について論じている。
レポート対象セグメント
タイプ
- ナノサテライト
- マイクロサテライト
- ミニサテライト
- その他
用途
- 航法
- 通信
- 地球観測
- 科学研究
- その他
エンドユーザー
- 商業
- 政府・軍関係
- その他
世界市場全体と各分野の収益予測に加え、5つの地域と22の主要国市場の収益予測も掲載している:
北米
- アメリカ
- カナダ
欧州
- ドイツ
- 英国
- フランス
- イタリア
- スペイン
- ロシア
- その他の欧州
アジア太平洋
- 日本
- 中国
- インド
- オーストラリア
- 韓国
- その他のアジア太平洋地域
ラテンアメリカ
- ブラジル
- メキシコ
- その他のラテンアメリカ
MEA
- GCC
- 南アフリカ
- その他のMEA
またレポートには、2023年から2033年までの小型衛星市場の主要企業のプロファイルと、これらの企業の事業のこのセグメントに焦点を当てている。
主要企業と市場成長の可能性
・ Airbus
・ Axelspace Corporation
・ Ball Corporation
・ Blue Canyon Technologies
・ Boeing
・ Gomspace
・ L3Harris Technologies, Inc.
・ Lockheed Martin Corporation
・ Maxar Technologies
・ Northrop Grumman Corporation
・ OHB SE
・ Planet Labs PBC
・ Sierra Nevada Corporation
・ Space Exploration Technologies Corp. (SPACEX)
・ Surrey Satellite Technology Ltd.
・ Thales Group (Thales Alenia Space)
2023年から2033年にかけての小型衛星市場全体の世界売上高は、金額ベースで2023年に28億8400万米ドルを突破する。2033年まで力強い収益成長を予測。当調査では、最も大きな可能性を秘めた企業を特定しています。彼らの能力、進歩、商業的展望を発見し、一歩先を行くお手伝いをします。
小型衛星市場、2023-2033年レポートはどのように役立ちますか?
要約すると、260ページを超えるこのレポートは、以下の知識を提供する:
- 小型衛星市場の2023年から2033年までの収益予測(タイプ、用途、エンドユーザー別、それぞれ世界レベルと地域レベルで予測) - 業界の展望を発見し、投資と収益に最も有利な場所を見つけることができます。
- 5つの地域と22の主要国市場の2033年までの収益予測 - 北米、欧州、アジア太平洋、ラテンアメリカ、MEAの小型衛星市場2023年から2033年までの市場予測をご覧ください。また、米国、カナダ、メキシコ、ブラジル、ドイツ、フランス、英国、イタリア、中国、インド、日本、オーストラリアなどの主要国の市場も予測しています。
- 既存企業や市場参入を目指す企業の展望 - 小型衛星市場に関わる主要企業16社の企業プロファイルを含む、2023年から2033年までの市場。
独自の予測による定量的・定性的分析をご覧ください。私たちのレポートだけに含まれる情報を入手し、貴重なビジネスインテリジェンスで情報を得ることができます。
他にはない情報
私たちの新しいレポートがあれば、知識に遅れをとったり、チャンスを逃したりする可能性が低くなります。弊社のレポートが貴社の調査、分析、意思決定にどのように役立つかをご覧ください。Visiongainの調査は、小型衛星市場2023年から2033年、市場をリードする企業の商業分析を必要とするすべての人のためのものです。データ、トレンド、予測をご覧いただけます。
ページTOPに戻る
目次
目次
1 レポート概要
1.1 調査の目的
1.2 小型衛星市場の紹介
1.3 本レポートの内容
1.4 本レポートを読むべき理由
1.5 本分析レポートが回答する主な質問は以下の通り:
1.6 本レポートは誰のためのものか?
1.7 方法論
1.7.1 市場の定義
1.7.2 市場評価・予測手法
1.7.3 データの検証
1.7.3.1 一次調査
1.7.3.2 セカンダリーリサーチ
1.8 よくある質問(FAQ)
1.9 Visiongainの関連レポート
1.10 Visiongainについて
2 エグゼクティブ・サマリー
3 市場概要
3.1 主要な調査結果
3.2 市場ダイナミクス
3.2.1 市場促進要因
3.2.1.1 LEOベースの衛星に対する需要の増加
3.2.1.2 世界的な高解像度画像サービス需要の高まり
3.2.1.3 費用対効果と軽量化
3.2.1.4 業界の成長を後押しすると予想される技術革新
3.2.1.5 柔軟な打上げサービスが産業の成長に拍車をかける
3.2.2 市場抑制要因
3.2.2.1 オービタルデブリと宇宙空間の混雑の増大が産業成長を妨げる可能性が高い
3.2.2.2 各国における標準的な規制や政府政策の欠如が産業の成長を抑制する見込み
3.2.2.3 財政的持続可能性と資金調達が業界の成長を抑制する可能性が高い
3.2.3 市場機会
3.2.3.1 小型衛星による世界的なIoTコネクティビティ
3.2.3.2 3Dプリンティングはコスト削減と軌道上製造により小型衛星市場を強化する
3.2.3.3 テレメトリ、トラッキング、コマンド・ツー・コントロール衛星の革新が有利な成長展望をもたらす
3.3 COVID-19インパクト分析
4 小型衛星市場分析:タイプ別
4.1 主要な調査結果
4.2 タイプ別セグメント 市場魅力度指数
4.3 小型衛星のタイプ別市場規模推定と予測
4.4 超小型衛星
4.4.1 2023~2033年の地域別市場予測(US$ Mn, AGR %)
4.4.2 地域別市場シェア、2023年・2033年 (%)
4.5 超小型衛星
4.5.1 2023~2033年の地域別市場予測 (US$ Mn, AGR %)
4.5.2 地域別市場シェア、2023年・2033年 (%)
4.6 超小型衛星
4.6.1 2023~2033年の地域別市場予測 (US$ Mn, AGR %)
4.6.2 地域別市場シェア、2023年・2033年 (%)
4.7 その他
4.7.1 2023〜2033年の地域別市場予測 (US$ Mn, AGR %)
4.7.2 地域別市場シェア、2023年・2033年 (%)
5 小型衛星市場分析:用途別
5.1 主な調査結果
5.2 アプリケーションセグメント 市場魅力度指数
5.3 小型衛星の用途別市場規模推定と予測
5.4 ナビゲーション
5.4.1 2023~2033年の地域別市場予測(単位:百万米ドル、AGR)
5.4.2 地域別市場シェア、2023年・2033年 (%)
5.5 通信
5.5.1 2023~2033年の地域別市場予測(単位:百万米ドル、AGR)
5.5.2 地域別市場シェア、2023年・2033年 (%)
5.6 地球観測
5.6.1 2023~2033年の地域別市場予測 (US$ Mn, AGR %)
5.6.2 地域別市場シェア、2023年・2033年 (%)
5.7 科学研究
5.7.1 2023〜2033年の地域別市場予測 (US$ Mn, AGR %)
5.7.2 地域別市場シェア、2023年・2033年 (%)
5.8 その他
5.8.1 2023〜2033年の地域別市場予測 (US$ Mn, AGR %)
5.8.2 地域別市場シェア、2023年・2033年 (%)
6 小型衛星市場分析:エンドユーザー別
6.1 主要な調査結果
6.2 エンドユーザーセグメント 市場魅力度指数
6.3 エンドユーザー別小型衛星市場規模の推定と予測
6.4 商用
6.4.1 2023〜2033年の地域別市場予測(US$ Mn, AGR %)
6.4.2 地域別市場シェア、2023年・2033年 (%)
6.5 政府・軍需
6.5.1 2023〜2033年の地域別市場予測 (US$ Mn, AGR %)
6.5.2 地域別市場シェア、2023年・2033年 (%)
6.6 その他
6.6.1 2023〜2033年の地域別市場予測 (US$ Mn, AGR %)
6.6.2 地域別市場シェア、2023年・2033年 (%)
7 小型衛星市場分析:地域別
7.1 主要な調査結果
7.2 地域別市場規模の推定と予測
8 北米の小型衛星市場分析
8.1 主要な調査結果
8.2 北米の小型衛星市場魅力度指数
8.3 北米の小型衛星市場:国別、2023年、2028年、2033年(US$ Million)
8.4 北米の小型衛星市場規模推定と予測:国別、2023年〜2033年(US$ Mn)
8.5 北米の小型衛星市場規模推定と予測:タイプ別
8.6 北米の小型衛星市場規模推定と予測:用途別
8.7 北米の小型衛星市場規模推定と予測:エンドユーザー別
8.8 アメリカの小型衛星市場分析
8.9 カナダの小型衛星市場の分析
9 欧州の小型衛星市場分析
9.1 主要な調査結果
9.2 欧州の小型衛星市場魅力度指数
9.3 欧州の小型衛星市場規模:国別、2023年、2028年、2033年(US$ Million)
9.4 欧州の小型衛星市場規模推定と予測:国別
9.5 欧州の小型衛星市場規模推定と予測:タイプ別
9.6 欧州の小型衛星市場規模推定と予測:用途別
9.7 欧州の小型衛星市場規模推定と予測:エンドユーザー別
9.8 ドイツの小型衛星市場分析
9.9 イギリスの小型衛星市場分析
9.10 フランスの小型衛星市場分析
9.11 イタリアの小型衛星市場分析
9.12 スペインの小型衛星市場分析
9.13 ロシアの小型衛星市場分析
9.14 その他の欧州の小型衛星市場分析
10 アジア太平洋地域の小型衛星市場分析
10.1 主要な調査結果
10.2 アジア太平洋地域の小型衛星市場魅力度指数
10.3 アジア太平洋地域の小型衛星市場規模:国別、2023年、2028年、2033年(US$ Million)
10.4 アジア太平洋地域の小型衛星市場規模推定と予測:国別
10.5 アジア太平洋地域の小型衛星市場規模推定と予測:タイプ別
10.6 アジア太平洋地域の小型衛星市場規模推定と予測:用途別
10.7 アジア太平洋地域の小型衛星市場規模推定と予測:エンドユーザー別
10.8 日本の小型衛星市場分析
10.9 中国の小型衛星市場分析
10.10 インドの小型衛星市場分析
10.11 オーストラリアの小型衛星市場分析
10.12 韓国の小型衛星市場分析
10.13 東南アジアの小型衛星市場分析
10.14 その他のアジア太平洋地域の小型衛星市場分析
11 ラテンアメリカの小型衛星市場分析
11.1 主要な調査結果
11.2 ラテンアメリカの小型衛星市場魅力度指数
11.3 ラテンアメリカの小型衛星市場規模:国別、2023年、2028年、2033年 (US$ Million)
11.4 ラテンアメリカの小型衛星市場規模推定と予測:国別
11.5 ラテンアメリカの小型衛星市場規模推定と予測:タイプ別
11.6 ラテンアメリカの小型衛星市場規模推定と予測:用途別
11.7 ラテンアメリカの小型衛星市場規模推定と予測:エンドユーザー別
11.8 ブラジルの小型衛星市場分析
11.9 メキシコの小型衛星市場分析
11.10 その他のラテンアメリカの小型衛星市場分析
12 MEAの小型衛星市場分析
12.1 主要な調査結果
12.2 MEAの小型衛星市場魅力度指数
12.3 MEAの小型衛星市場規模:国別、2023年、2028年、2033年(US$ Million)
12.4 MEAの小型衛星市場規模推定と予測:国別
12.5 MEAの小型衛星市場規模推定と予測:タイプ別
12.6 MEAの小型衛星市場規模推定と予測:用途別
12.7 MEAの小型衛星市場規模推定と予測:エンドユーザー別
12.8 GCCの小型衛星市場分析
12.9 南アフリカの小型衛星市場分析
12.10 その他のMEAの小型衛星市場分析
13 企業のプロフィール
13.1 企業ランキング分析
13.2 戦略的展望
13.3 Airbus
13.3.1 会社概要
13.3.2 会社概要
13.3.3 財務分析
13.3.3.1 純収入、2017-2022年
13.3.3.2 地域別市場シェア、2022年
13.3.3.3 事業セグメント市場シェア、2022年
13.3.3.4 R&D、2017-2022年
13.3.4 製品ベンチマーク
13.4 Axelspace Corporation
13.4.1 会社概要
13.4.2 会社概要
13.4.3 製品ベンチマーク
13.4.4 戦略的展望
13.5 Ball Corporation
13.5.1 会社概要
13.5.2 会社概要
13.5.3 財務分析
13.5.3.1 純収入、2017-2022年
13.5.4 製品ベンチマーク
13.6 Blue Canyon Technologies (Raytheon)
13.6.1 会社概要
13.6.2 会社概要
13.6.3 製品ベンチマーク
13.6.4 戦略的展望
13.7 Boeing
13.7.1 会社概要
13.7.2 会社概要
13.7.3 財務分析
13.7.3.1 純収入、2017-2022年
13.7.3.2 地域別市場シェア、2022年
13.7.3.3 事業セグメント市場シェア、2022年
13.7.3.4 R&D、2017年〜2022年
13.7.4 製品ベンチマーク
13.8 Gomspace
13.8.1 会社概要
13.8.2 会社概要
13.8.3 製品ベンチマーク
13.8.4 戦略的展望
13.9 L3Harris Technologies, Inc.
13.9.1 会社概要
13.9.2 会社概要
13.9.3 財務分析
13.9.3.1 純収入、2017-2022年
13.9.3.2 事業セグメント市場シェア、2022年
13.9.4 製品ベンチマーク
13.10 Northrop Grumman Corporation
13.10.1 会社概要
13.10.2 会社概要
13.10.3 財務分析
13.10.3.1 純収入、2017年~2022年
13.10.3.2 地域別市場シェア、2022年
13.10.3.1 事業セグメント市場シェア、2022年
13.10.4 製品ベンチマーク
13.10.5 戦略的展望
13.11 OHB SE
13.11.1 会社概要
13.11.2 会社概要
13.11.3 製品ベンチマーク
13.11.4 戦略的展望
13.12 Planet Labs PBC
13.12.1 会社概要
13.12.2 会社概要
13.12.3 製品ベンチマーク
13.13 Surrey Satellite Technology Ltd
13.13.1 会社概要
13.13.2 会社概要
13.13.3 製品ベンチマーク
13.14 Lockheed Martin Corporation (Delete)
13.14.1 会社概要
13.14.2 会社概要
13.14.3 財務分析
13.14.3.1 純収入、2017年〜2022年
13.14.3.2 地域市場シェア、2022年
13.14.4 製品ベンチマーク
13.14.5 戦略的展望
13.15 Maxar Technologies
13.15.1 会社概要
13.15.2 会社概要
13.15.3 製品ベンチマーク
13.15.4 戦略的展望
13.16 Space Exploration Technologies Corp. (SPACEX)
13.16.1 会社概要
13.16.2 会社概要
13.16.3 製品ベンチマーク
13.16.4 戦略的展望
13.17 Sierra Nevada Corporation
13.17.1 会社概要
13.17.2 会社概要
13.17.3 製品ベンチマーク
13.18 Thales Group (Thales Alenia Space)
13.18.1 会社概要
13.18.2 会社概要
13.18.3 財務分析
13.18.3.1 純収入、2017年〜2022年
13.18.4 製品ベンチマーク
13.18.5 戦略的展望
14 結論と提言
14.1 Visiongainからの結びの言葉
14.2 市場プレイヤーへの提言
ページTOPに戻る
図表リスト
表の一覧
Table 1 Small Satellite Market Snapshot, 2023 & 2033 (US$ million, CAGR %)
Table 2 Small Satellite Market Forecast by Region, 2023-2033 (US$ Million, AGR%, CAGR%): "V" Shaped Recovery
Table 3 Small Satellite Market Forecast by Region, 2023-2033 (US$ Million, AGR%, CAGR%): "U" Shaped Recovery
Table 4 Small Satellite Market Forecast by Region, 2023-2033 (US$ Million, AGR%, CAGR%): "W" Shaped Recovery
Table 5 Small Satellite Market Forecast by Region, 2023-2033 (US$ Million, AGR%, CAGR%): "L" Shaped Recovery
Table 6 Small Satellite Market Forecast by Type, 2023-2033 (US$ Million, AGR%, CAGR%)
Table 7 Nanosatellite Segment Market Forecast by Region, 2023-2033 (US$ Million, AGR%, CAGR%)
Table 8 Microsatellite Segment Market Forecast by Region, 2023-2033 (US$ Million, AGR%, CAGR%)
Table 9 Minisatellite Segment Market Forecast by Region, 2023-2033 (US$ Million, AGR%, CAGR%)
Table 10 Others Segment Market Forecast by Region, 2023-2033 (US$ Million, AGR%, CAGR%)
Table 11 Small Satellite Market Forecast by Application, 2023-2033 (US$ Million, AGR%, CAGR%)
Table 12 Navigation Segment Market Forecast by Region, 2023-2033 (US$ Million, AGR%, CAGR%)
Table 13 Communication Segment Market Forecast by Region, 2023-2033 (US$ Million, AGR%, CAGR%)
Table 14 Earth Observation Segment Market Forecast by Region, 2023-2033 (US$ Million, AGR%, CAGR%)
Table 15 Scientific Research Segment Market Forecast by Region, 2023-2033 (US$ Million, AGR%, CAGR%)
Table 16 Others Segment Market Forecast by Region, 2023-2033 (US$ Million, AGR%, CAGR%)
Table 17 Small Satellite Market Forecast by End-users, 2023-2033 (US$ Million, AGR%, CAGR%)
Table 18 Commercial Segment Market Forecast by Region, 2023-2033 (US$ Million, AGR%, CAGR%)
Table 19 Government & Military Segment Market Forecast by Region, 2023-2033 (US$ Million, AGR%, CAGR%)
Table 20 Others Segment Market Forecast by Region, 2023-2033 (US$ Million, AGR%, CAGR%)
Table 21 Small Satellite Market Forecast by Region, 2023-2033 (US$ Million, AGR%, CAGR%)
Table 22 North America Small Satellite Market Forecast by Country, 2023-2033 (US$ Million, AGR%, CAGR%)
Table 23 North America Small Satellite Market Forecast by Type, 2023-2033 (US$ Million, AGR%, CAGR%)
Table 24 North America Small Satellite Market Forecast by Application, 2023-2033 (US$ Million, AGR%, CAGR%)
Table 25 North America Small Satellite Market Forecast by End-users, 2023-2033 (US$ Million, AGR%, CAGR%)
Table 26 U.S. Small Satellite Market Forecast, 2023-2033 (US$ Million, AGR%, CAGR%)
Table 27 Canada Small Satellite Market Forecast, 2023-2033 (US$ Million, AGR%, CAGR%)
Table 28 Europe Small Satellite Market Forecast by Country, 2023-2033 (US$ Million, AGR%, CAGR%)
Table 29 Europe Small Satellite Market Forecast by Type, 2023-2033 (US$ Million, AGR%, CAGR%)
Table 30 Europe Small Satellite Market Forecast by Application, 2023-2033 (US$ Million, AGR%, CAGR%)
Table 31 Europe Small Satellite Market Forecast by End-users, 2023-2033 (US$ Million, AGR%, CAGR%)
Table 32 Germany Small Satellite Market Forecast, 2023-2033 (US$ Million, AGR%, CAGR%)
Table 33 UK Small Satellite Market Forecast, 2023-2033 (US$ Million, AGR%, CAGR%)
Table 34 France Small Satellite Market Forecast, 2023-2033 (US$ Million, AGR%, CAGR%)
Table 35 Italy Small Satellite Market Forecast, 2023-2033 (US$ Million, AGR%, CAGR%)
Table 36 Spain Small Satellite Market Forecast, 2023-2033 (US$ Million, AGR%, CAGR%)
Table 37 Russia Small Satellite Market Forecast, 2023-2033 (US$ Million, AGR%, CAGR%)
Table 38 Rest of Europe Small Satellite Market Forecast, 2023-2033 (US$ Million, AGR%, CAGR%)
Table 39 Asia Pacific Small Satellite Market Forecast by Country, 2023-2033 (US$ Million, AGR%, CAGR%)
Table 40 Asia Pacific Small Satellite Market Forecast by Type, 2023-2033 (US$ Million, AGR%, CAGR%)
Table 41 Asia Pacific Small Satellite Market Forecast by Application, 2023-2033 (US$ Million, AGR%, CAGR%)
Table 42 Asia Pacific Small Satellite Market Forecast by End-users, 2023-2033 (US$ Million, AGR%, CAGR%)
Table 43 Japan Small Satellite Market Forecast, 2023-2033 (US$ Million, AGR%, CAGR%)
Table 44 China Small Satellite Market Forecast, 2023-2033 (US$ Million, AGR%, CAGR%)
Table 45 India Small Satellite Market Forecast, 2023-2033 (US$ Million, AGR%, CAGR%)
Table 46 Australia Small Satellite Market Forecast, 2023-2033 (US$ Million, AGR%, CAGR%)
Table 47 South Korea Small Satellite Market Forecast, 2023-2033 (US$ Million, AGR%, CAGR%)
Table 48 South-East Asia Small Satellite Market Forecast, 2023-2033 (US$ Million, AGR%, CAGR%)
Table 49 Rest of Asia Pacific Small Satellite Market Forecast, 2023-2033 (US$ Million, AGR%, CAGR%)
Table 50 Latin America Small Satellite Market Forecast by Country, 2023-2033 (US$ Million, AGR%, CAGR%)
Table 51 Latin America Small Satellite Market Forecast by Type, 2023-2033 (US$ Million, AGR%, CAGR%)
Table 52 Latin America Small Satellite Market Forecast by Application, 2023-2033 (US$ Million, AGR%, CAGR%)
Table 53 Latin America Small Satellite Market Forecast by End-users, 2023-2033 (US$ Million, AGR%, CAGR%)
Table 54 Brazil Small Satellite Market Forecast, 2023-2033 (US$ Million, AGR%, CAGR%)
Table 55 Mexico Small Satellite Market Forecast, 2023-2033 (US$ Million, AGR%, CAGR%)
Table 56 Rest of Latin America Small Satellite Market Forecast, 2023-2033 (US$ Million, AGR%, CAGR%)
Table 57 MEA Small Satellite Market Forecast by Country, 2023-2033 (US$ Million, AGR%, CAGR%)
Table 58 MEA Small Satellite Market Forecast by Type, 2023-2033 (US$ Million, AGR%, CAGR%)
Table 59 MEA Small Satellite Market Forecast by Application, 2023-2033 (US$ Million, AGR%, CAGR%)
Table 60 MEA Small Satellite Market Forecast by End-users, 2023-2033 (US$ Million, AGR%, CAGR%)
Table 61 GCC Small Satellite Market Forecast, 2023-2033 (US$ Million, AGR%, CAGR%)
Table 62 South Africa Small Satellite Market Forecast, 2023-2033 (US$ Million, AGR%, CAGR%)
Table 63 Rest of MEA Small Satellite Market Forecast, 2023-2033 (US$ Million, AGR%, CAGR%)
Table 64 Small Satellite: Company Ranking
Table 65 Small Satellite: Strategic Outlook
Table 66 Airbus: Key Details, (CEO, HQ, Revenue, Founded, No. of Employees, Company Type, Website, Business Segment)
Table 67 Airbus: Product Benchmarking
Table 68 Axelspace Corporation: Key Details, (CEO, HQ, Revenue, Founded, No. of Employees, Company Type, Website, Business Segment)
Table 69 Axelspace Corporation: Product Benchmarking
Table 70 Axelspace Corporation: Strategic Outlook
Table 71 Ball Corporation: Key Details, (CEO, HQ, Revenue, Founded, No. of Employees, Company Type, Website, Business Segment)
Table 72 Ball Corporation: Product Benchmarking
Table 73 Blue Canyon Technologies: Key Details, (CEO, HQ, Revenue, Founded, No. of Employees, Company Type, Website, Business Segment)
Table 74 Blue Canyon Technologies: Product Benchmarking
Table 75 Blue Canyon Technologies: Strategic Outlook
Table 76 Boeing: Key Details, (CEO, HQ, Revenue, Founded, No. of Employees, Company Type, Website, Business Segment)
Table 77 Boeing: Product Benchmarking
Table 78 Gomspace: Key Details, (CEO, HQ, Revenue, Founded, No. of Employees, Company Type, Website, Business Segment)
Table 79 Gomspace: Product Benchmarking
Table 80 Gomspace: Strategic Outlook
Table 81 L3Harris Technologies, Inc.: Key Details, (CEO, HQ, Revenue, Founded, No. of Employees, Company Type, Website, Business Segment)
Table 82 L3Harris Technologies, Inc.: Product Benchmarking
Table 83 Northrop Grumman Corporation: Key Details, (CEO, HQ, Revenue, Founded, No. of Employees, Company Type, Website, Business Segment)
Table 84 Northrop Grumman Corporation: Product Benchmarking
Table 85 Northrop Grumman Corporation: Strategic Outlook
Table 86 OHB SE: Key Details, (CEO, HQ, Revenue, Founded, No. of Employees, Company Type, Website, Business Segment)
Table 87 OHB SE: Product Benchmarking
Table 88 OHB SE: Strategic Outlook
Table 89 Planet Labs PBC: Key Details, (CEO, HQ, Revenue, Founded, No. of Employees, Company Type, Website, Business Segment)
Table 90 Planet Labs PBC: Product Benchmarking
Table 91 Surrey Satellite Technology Ltd: Key Details, (CEO, HQ, Revenue, Founded, No. of Employees, Company Type, Website, Business Segment)
Table 92 SURREY SATELLITE TECHNOLOGY LTD: Product Benchmarking
Table 93 Lockheed Martin Corporation: Key Details, (CEO, HQ, Revenue, Founded, No. of Employees, Company Type, Website, Business Segment)
Table 94 Lockheed Martin Corporation: Product Benchmarking
Table 95 Lockheed Martin Corporation: Strategic Outlook
Table 96 Maxar Technologies: Key Details, (CEO, HQ, Revenue, Founded, No. of Employees, Company Type, Website, Business Segment)
Table 97 Maxar Technologies: Product Benchmarking
Table 98 Maxar Technologies: Strategic Outlook
Table 99 Space Exploration Technologies Corp. (SPACEX): Key Details, (CEO, HQ, Revenue, Founded, No. of Employees, Company Type, Website, Business Segment)
Table 100 Space Exploration Technologies Corp. (SPACEX): Product Benchmarking
Table 101 Space Exploration Technologies Corp. (SPACEX): Strategic Outlook
Table 102 Sierra Nevada Corporation: Key Details, (CEO, HQ, Revenue, Founded, No. of Employees, Company Type, Website, Business Segment)
Table 103 Sierra Nevada Corporation: Product Benchmarking
Table 104 Thales Group: Key Details, (CEO, HQ, Revenue, Founded, No. of Employees, Company Type, Website, Business Segment)
Table 105 Thales Group: Product Benchmarking
Table 106 Thales Group: Strategic Outlook
図の一覧
Figure 1 Small Satellite Market Segmentation
Figure 2 Small Satellite Market by Type: Market Attractiveness Index
Figure 3 Small Satellite Market by Application: Market Attractiveness Index
Figure 4 Small Satellite Market by End-users: Market Attractiveness Index
Figure 5 Small Satellite Market Attractiveness Index by Region
Figure 6 Small Satellite Market: Market Dynamics
Figure 7 Debris Breakdown Since Q2 2021
Figure 8 Small/Non-constellation, Large Constellation, Debris, and Rocket Body Counts by Quarter
Figure 9 Small Satellite Market by Region, 2023-2033 (US$ Mn, AGR %): “V” Shaped Recovery
Figure 10 Small Satellite Market by Region, 2023-2033 (US$ Mn, AGR %): “U” Shaped Recovery
Figure 11 Small Satellite Market by Region, 2023-2033 (US$ Mn, AGR %): “W” Shaped Recovery
Figure 12 Small Satellite Market by Region, 2023-2033 (US$ Mn, AGR %): “L” Shaped Recovery
Figure 13 Small Satellite Market Attractiveness Index by Type
Figure 14 Small Satellite Market Forecast by Type, 2023-2033 (US$ Million, AGR %)
Figure 15 Small Satellite Market Share Forecast by Type, 2023, 2028, 2033 (%)
Figure 16 Nanosatellite Segment Market Forecast by Region, 2023-2033 (US$ Million, AGR %)
Figure 17 Nanosatellite Segment Market Share Forecast by Region, 2023 & 2033 (%)
Figure 18 Microsatellite Segment Market Forecast by Region, 2023-2033 (US$ Million, AGR %)
Figure 19 Microsatellite Segment Market Share Forecast by Region, 2023 & 2033 (%)
Figure 20 Minisatellite Segment Market Forecast by Region, 2023-2033 (US$ Million, AGR %)
Figure 21 Minisatellite Segment Market Share Forecast by Region, 2023 & 2033 (%)
Figure 22 Others Segment Market Forecast by Region, 2023-2033 (US$ Million, AGR %)
Figure 23 Others Segment Market Share Forecast by Region, 2023 & 2033 (%)
Figure 24 Small Satellite Market Attractiveness Index by Type
Figure 25 Small Satellite Market Forecast by Application, 2023-2033 (US$ Million, AGR %)
Figure 26 Small Satellite Market Share Forecast by Application, 2023, 2028, 2033 (%)
Figure 27 Navigation Segment Market Forecast by Region, 2023-2033 (US$ Million, AGR %)
Figure 28 Navigation Segment Market Share Forecast by Region, 2023 & 2033 (%)
Figure 29 Communication Segment Market Forecast by Region, 2023-2033 (US$ Million, AGR %)
Figure 30 Communication Segment Market Share Forecast by Region, 2023 & 2033 (%)
Figure 31 Earth Observation Segment Market Forecast by Region, 2023-2033 (US$ Million, AGR %)
Figure 32 Earth Observation Segment Market Share Forecast by Region, 2023 & 2033 (%)
Figure 33 Scientific Research Segment Market Forecast by Region, 2023-2033 (US$ Million, AGR %)
Figure 34 Scientific Research Segment Market Share Forecast by Region, 2023 & 2033 (%)
Figure 35 Others Segment Market Forecast by Region, 2023-2033 (US$ Million, AGR %)
Figure 36 Others Segment Market Share Forecast by Region, 2023 & 2033 (%)
Figure 37 Small Satellite Market Attractiveness Index by End-users
Figure 38 Small Satellite Market Forecast by End-users, 2023-2033 (US$ Million, AGR %)
Figure 39 Small Satellite Market Share Forecast by End-users, 2023, 2028, 2033 (%)
Figure 40 Commercial Segment Market Forecast by Region, 2023-2033 (US$ Million, AGR %)
Figure 41 Commercial Segment Market Share Forecast by Region, 2023 & 2033 (%)
Figure 42 Government & Military Segment Market Forecast by Region, 2023-2033 (US$ Million, AGR %)
Figure 43 Government & Military Segment Market Share Forecast by Region, 2023 & 2033 (%)
Figure 44 Others Segment Market Forecast by Region, 2023-2033 (US$ Million, AGR %)
Figure 45 Others Segment Market Share Forecast by Region, 2023 & 2033 (%)
Figure 46 Small Satellite Market Forecast by Region 2023 and 2033 (Revenue, CAGR%)
Figure 47 Small Satellite Market Share Forecast by Region 2023, 2028, 2033 (%)
Figure 48 Small Satellite Market by Region, 2023-2033 (US$ Mn)
Figure 49 North America Small Satellite Market Attractiveness Index
Figure 50 North America Small Satellite Market by Country, 2023, 2028 & 2033 (US$ Million)
Figure 51 North America Small Satellite Market Forecast by Country, 2023-2033 (US$ Million, AGR %)
Figure 52 North America Small Satellite Market Share Forecast by Country, 2023 & 2033 (%)
Figure 53 North America Small Satellite Market Forecast by Type, 2023-2033 (US$ Million, AGR %)
Figure 54 North America Small Satellite Market Share Forecast by Type, 2023 & 2033 (%)
Figure 55 North America Small Satellite Market Forecast by Application, 2023-2033 (US$ Million, AGR %)
Figure 56 North America Small Satellite Market Share Forecast by Application, 2023 & 2033 (%)
Figure 57 North America Small Satellite Market Forecast by End-users, 2023-2033 (US$ Million, AGR %)
Figure 58 North America Small Satellite Market Share Forecast by End-users, 2023 & 2033 (%)
Figure 59 U.S. Small Satellite Market Forecast, 2023-2033 (US$ Million, AGR %)
Figure 60 Canada Small Satellite Market Forecast, 2023-2033 (US$ Million, AGR %)
Figure 61 Europe Small Satellite Market Attractiveness Index
Figure 62 Europe Small Satellite Market by Country, 2023, 2028 & 2033 (US$ Million)
Figure 63 Europe Small Satellite Market Forecast by Country, 2023-2033 (US$ Million, AGR %)
Figure 64 Europe Small Satellite Market Share Forecast by Country, 2023 & 2033 (%)
Figure 65 Europe Small Satellite Market Forecast by Type, 2023-2033 (US$ Million, AGR %)
Figure 66 Europe Small Satellite Market Share Forecast by Type, 2023 & 2033 (%)
Figure 67 Europe Small Satellite Market Forecast by Application, 2023-2033 (US$ Million, AGR %)
Figure 68 Europe Small Satellite Market Share Forecast by Application, 2023 & 2033 (%)
Figure 69 Europe Small Satellite Market Forecast by End-users, 2023-2033 (US$ Million, AGR %)
Figure 70 Europe Small Satellite Market Share Forecast by End-users, 2023 & 2033 (%)
Figure 71 Germany Small Satellite Market Forecast, 2023-2033 (US$ Million, AGR %)
Figure 72 UK Small Satellite Market Forecast, 2023-2033 (US$ Million, AGR %)
Figure 73 France Small Satellite Market Forecast, 2023-2033 (US$ Million, AGR %)
Figure 74 Italy Small Satellite Market Forecast, 2023-2033 (US$ Million, AGR %)
Figure 75 Spain Small Satellite Market Forecast, 2023-2033 (US$ Million, AGR %)
Figure 76 Russia Small Satellite Market Forecast, 2023-2033 (US$ Million, AGR %)
Figure 77 Rest of Europe Small Satellite Market Forecast, 2023-2033 (US$ Million, AGR %)
Figure 78 Asia Pacific Small Satellite Market Attractiveness Index
Figure 79 Asia Pacific Small Satellite Market by Country, 2023, 2028 & 2033 (US$ Million)
Figure 80 Asia Pacific Small Satellite Market Forecast by Country, 2023-2033 (US$ Million, AGR %)
Figure 81 Asia Pacific Small Satellite Market Share Forecast by Country, 2023 & 2033 (%)
Figure 82 Asia Pacific Small Satellite Market Forecast by Type, 2023-2033 (US$ Million, AGR %)
Figure 83 Asia Pacific Small Satellite Market Share Forecast by Type, 2023 & 2033 (%)
Figure 84 Asia Pacific Small Satellite Market Forecast by Application, 2023-2033 (US$ Million, AGR %)
Figure 85 Asia Pacific Small Satellite Market Share Forecast by Application, 2023 & 2033 (%)
Figure 86 Asia Pacific Small Satellite Market Forecast by End-users, 2023-2033 (US$ Million, AGR %)
Figure 87 Asia Pacific Small Satellite Market Share Forecast by End-users, 2023 & 2033 (%)
Figure 88 Japan Small Satellite Market Forecast, 2023-2033 (US$ Million, AGR %)
Figure 89 China Small Satellite Market Forecast, 2023-2033 (US$ Million, AGR %)
Figure 90 India Small Satellite Market Forecast, 2023-2033 (US$ Million, AGR %)
Figure 91 Australia Small Satellite Market Forecast, 2023-2033 (US$ Million, AGR %)
Figure 92 South Korea Small Satellite Market Forecast, 2023-2033 (US$ Million, AGR %)
Figure 93 South-East Asia Satellite Market Forecast, 2023-2033 (US$ Million, AGR %)
Figure 94 Rest of Asia Pacific Small Satellite Market Forecast, 2023-2033 (US$ Million, AGR %)
Figure 95 Latin America Small Satellite Market Attractiveness Index
Figure 96 Latin America Small Satellite Market by Country, 2023, 2028 & 2033 (US$ Million)
Figure 97 Latin America Small Satellite Market Forecast by Country, 2023-2033 (US$ Million, AGR %)
Figure 98 Latin America Small Satellite Market Share Forecast by Country, 2023 & 2033 (%)
Figure 99 Latin America Small Satellite Market Forecast by Type, 2023-2033 (US$ Million, AGR %)
Figure 100 Latin America Small Satellite Market Share Forecast by Type, 2023 & 2033 (%)
Figure 101 Latin America Small Satellite Market Forecast by Application, 2023-2033 (US$ Million, AGR %)
Figure 102 Latin America Small Satellite Market Share Forecast by Application, 2023 & 2033 (%)
Figure 103 Latin America Small Satellite Market Forecast by End-users, 2023-2033 (US$ Million, AGR %)
Figure 104 Latin America Small Satellite Market Share Forecast by End-users, 2023 & 2033 (%)
Figure 105 Brazil Small Satellite Market Forecast, 2023-2033 (US$ Million, AGR %)
Figure 106 Mexico Small Satellite Market Forecast, 2023-2033 (US$ Million, AGR %)
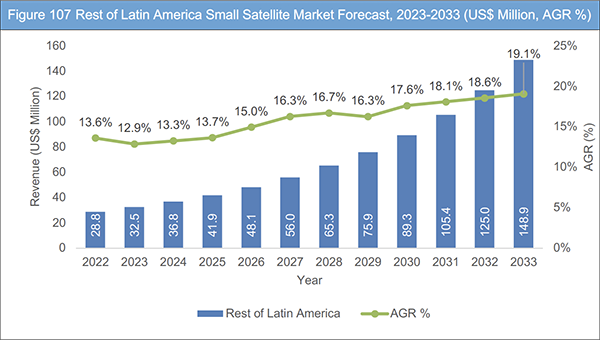
Figure 107 Rest of Latin America Small Satellite Market Forecast, 2023-2033 (US$ Million, AGR %)
Figure 108 MEA Small Satellite Market Attractiveness Index
Figure 109 MEA Small Satellite Market by Country, 2023, 2028 & 2033 (US$ Million)
Figure 110 MEA Small Satellite Market Forecast by Country, 2023-2033 (US$ Million, AGR %)
Figure 111 MEA Small Satellite Market Share Forecast by Country, 2023 & 2033 (%)
Figure 112 MEA Small Satellite Market Forecast by Type, 2023-2033 (US$ Million, AGR %)
Figure 113 MEA Small Satellite Market Share Forecast by Type, 2023 & 2033 (%)
Figure 114 MEA Small Satellite Market Forecast by Application, 2023-2033 (US$ Million, AGR %)
Figure 115 MEA Small Satellite Market Share Forecast by Application, 2023 & 2033 (%)
Figure 116 MEA Small Satellite Market Forecast by End-users, 2023-2033 (US$ Million, AGR %)
Figure 117 MEA Small Satellite Market Share Forecast by End-users, 2023 & 2033 (%)
Figure 118 GCC Small Satellite Market Forecast, 2023-2033 (US$ Million, AGR %)
Figure 119 South Africa Small Satellite Market Forecast, 2023-2033 (US$ Million, AGR %)
Figure 120 Rest of MEA Small Satellite Market Forecast, 2023-2033 (US$ Million, AGR %)
Figure 121 Airbus: Net Revenue, 2017-2022 (US$ Million, AGR%)
Figure 122 Airbus: Regional Market Shares (%), 2022
Figure 123 Airbus: Business Segment Market Shares (%), 2022
Figure 124 Airbus: R&D, 2017-2022 (US$ Million, AGR%)
Figure 125 Ball Corporation: Net Revenue, 2017-2022 (US$ Million, AGR%)
Figure 126 Boeing: Net Revenue, 2017-2022 (US$ Million, AGR%)
Figure 127 Boeing: Regional Market Shares (%), 2022
Figure 128 Boeing: Business Segment Market Shares (%), 2022
Figure 129 Boeing: R&D, 2017-2022 (US$ Million, AGR%)
Figure 130 L3Harris Technologies, Inc.: Net Revenue, 2017-2022 (US$ Million, AGR%)
Figure 131 L3Harris Technologies, Inc.: Business Segment Market Shares (%), 2022
Figure 132 Northrop Grumman Corporation: Net Revenue, 2017-2022 (US$ Million, AGR%)
Figure 133 Northrop Grumman Corporation: Regional Market Shares (%), 2022
Figure 134 Northrop Grumman Corporation: Business Segment Market Shares (%), 2022
Figure 135 Lockheed Martin Corporation: Net Revenue, 2017-2022 (US$ Million, AGR%)
Figure 136 Lockheed Martin Corporation: Regional Market Shares (%), 2022
Figure 137 Thales Group: Net Revenue, 2017-2022 (US$ Million, AGR%)
ページTOPに戻る
Summary
Report Details
The Small Satellite Market Report 2023-2033: This report will prove invaluable to leading firms striving for new revenue pockets if they wish to better understand the industry and its underlying dynamics. It will be useful for companies that would like to expand into different industries or to expand their existing operations in a new region.
Technological Innovations Anticipated to Boost Industry Growth
Most of the space industry’s innovation is made possible by technological developments in satellites. The most important developments in satellite technology are small satellites, or smallsats, particularly NanoSats, which power the next wave of satellite capabilities. Moreover, the low cost of manufacturing for smallsats is opening the door for satellite mass production. Satellite Internet of Things (IoT) is another significant trend that is enabling unparalleled connectivity across industries and enabling 5G and upcoming 6G capabilities is the satellite communications. Concurrently, both orbital services and ground stations are benefiting from technological advancements brought about by satellite manufacturers and operators. Automated systems for propulsion, digital payloads, and artificial intelligence (AI) allow satellites to carry out increasingly sophisticated tasks on their own. A new era of intelligent satellites is being laid by start-ups focused on satellite manufacturing, operations, and services, which are made possible by growing government and private investments.
Financial Sustainability and Funding Likely to Restrain Industry Growth
Financial sustainability and funding present another complex challenge for small satellite market players. While the development and launch costs for small satellites are typically lower compared to their larger counterparts, securing funding for various stages of the satellite’s lifecycle remains a hurdle, especially for start-ups and smaller companies. The unpredictable nature of revenue generation, combined with limited access to capital, can create uncertainties in long-term investment and growth strategies. To navigate this challenge, players need to explore diverse funding sources such as government grants, venture capital, partnerships, and commercial contracts. Demonstrating the economic viability of their satellite solutions and building a robust business model are pivotal for attracting sustained financial support.
What Questions Should You Ask before Buying a Market Research Report?
• How is the small satellite market evolving?
• What is driving and restraining the small satellite market?
• How will each small satellite submarket segment grow over the forecast period and how much revenue will these submarkets account for in 2033?
• How will the market shares for each small satellite submarket develop from 2023 to 2033?
• What will be the main driver for the overall market from 2023 to 2033?
• Will leading small satellite markets broadly follow the macroeconomic dynamics, or will individual national markets outperform others?
• How will the market shares of the national markets change by 2033 and which geographical region will lead the market in 2033?
• Who are the leading players and what are their prospects over the forecast period?
• What are the small satellite projects for these leading companies?
• How will the industry evolve during the period between 2023 and 2033? What are the implications of
small satellite projects taking place now and over the next 10 years?
• Is there a greater need for product commercialisation to further scale the small satellite market?
• Where is the small satellite market heading and how can you ensure you are at the forefront of the market?
• What are the best investment options for new product and service lines?
• What are the key prospects for moving companies into a new growth path and C-suite?
You need to discover how this will impact the small satellite market today, and over the next 10 years:
• Our 266-page report provides 106 tables and 137 charts/graphs exclusively to you.
• The report highlights key lucrative areas in the industry so you can target them – NOW.
• It contains in-depth analysis of global, regional and national sales and growth.
• It highlights for you the key successful trends, changes and revenue projections made by your competitors.
This report tells you TODAY how the small satellite market will develop in the next 10 years, and in line with the variations in COVID-19 economic recession and bounce. This market is more critical now than at any point over the last 10 years.
Forecasts to 2033 and other analyses reveal commercial prospects
• In addition to revenue forecasting to 2033, our new study provides you with recent results, growth rates, and market shares.
• You will find original analyses, with business outlooks and developments.
• Discover qualitative analyses (including market dynamics, drivers, opportunities, and restraints), Porter’s Five Forces Analysis, PEST Analysis and recent developments.
This report includes data analysis and invaluable insight into how COVID-19 will affect the industry and your company. Four COVID-19 recovery patterns and their impact, namely, “V”, “L”, “W” and “U” are discussed in this report.
Segments Covered in the Report
Type
• Nanosatellite
• Microsatellite
• Minisatellite
• Others
Application
• Navigation
• Communication
• Earth Observation
• Scientific Research
• Others
End-users
• Commercial
• Government & Military
• Others
In addition to the revenue predictions for the overall world market and segments, you will also find revenue forecasts for five regional and 22 leading national markets:
North America
• U.S.
• Canada
Europe
• Germany
• UK
• France
• Italy
• Spain
• Russia
• Rest of Europe
Asia Pacific
• Japan
• China
• India
• Australia
• South Korea
• Rest of Asia Pacific
Latin America
• Brazil
• Mexico
• Rest of Latin America
MEA
• GCC
• South Africa
• Rest of MEA
The report also includes profiles and for some of the leading companies in the Small Satellite Market, 2023 to 2033, with a focus on this segment of these companies’ operations.
Leading companies and the potential for market growth
• Airbus
• Axelspace Corporation
• Ball Corporation
• Blue Canyon Technologies
• Boeing
• Gomspace
• L3Harris Technologies, Inc.
• Lockheed Martin Corporation
• Maxar Technologies
• Northrop Grumman Corporation
• OHB SE
• Planet Labs PBC
• Sierra Nevada Corporation
• Space Exploration Technologies Corp. (SPACEX)
• Surrey Satellite Technology Ltd.
• Thales Group (Thales Alenia Space)
Overall world revenue for Small Satellite Market, 2023 to 2033 in terms of value the market will surpass US$2,884 million in 2023, our work calculates. We predict strong revenue growth through to 2033. Our work identifies which organizations hold the greatest potential. Discover their capabilities, progress, and commercial prospects, helping you stay ahead.
How will the Small Satellite Market, 2023 to 2033 report help you?
In summary, our 260+ page report provides you with the following knowledge:
• Revenue forecasts to 2033 for Small Satellite Market 2023 to 2033, with forecasts for type, application, and end-users, each forecast at a global and regional level – discover the industry’s prospects, finding the most lucrative places for investments and revenues.
• Revenue forecasts to 2033 for five regional and 22 key national markets – See forecasts for the Small Satellite Market, 2023 to 2033 market in North America, Europe, Asia-Pacific, Latin America, and MEA. Also forecasted is the market in the US, Canada, Mexico, Brazil, Germany, France, UK, Italy, China, India, Japan, and Australia among other prominent economies.
• Prospects for established firms and those seeking to enter the market – including company profiles for 16 of the major companies involved in the Small Satellite Market, 2023 to 2033.
Find quantitative and qualitative analyses with independent predictions. Receive information that only our report contains, staying informed with invaluable business intelligence.
Information found nowhere else
With our new report, you are less likely to fall behind in knowledge or miss out on opportunities. See how our work could benefit your research, analyses, and decisions. Visiongain’s study is for everybody needing commercial analyses for the Small Satellite Market 2023 to 2033, market-leading companies. You will find data, trends and predictions.
ページTOPに戻る
Table of Contents
Table of Contents
1 Report Overview
1.1 Objectives of the Study
1.2 Introduction to Small Satellite Market
1.3 What This Report Delivers
1.4 Why You Should Read This Report
1.5 Key Questions Answered by This Analytical Report Include:
1.6 Who is This Report For?
1.7 Methodology
1.7.1 Market Definitions
1.7.2 Market Evaluation & Forecasting Methodology
1.7.3 Data Validation
1.7.3.1 Primary Research
1.7.3.2 Secondary Research
1.8 Frequently Asked Questions (FAQs)
1.9 Associated Visiongain Reports
1.10 About Visiongain
2 Executive Summary
3 Market Overview
3.1 Key Findings
3.2 Market Dynamics
3.2.1 Market Driving Factors
3.2.1.1 Increasing Demand for LEO-based Satellites
3.2.1.2 Rising Demand for High-resolution Imaging Services Globally
3.2.1.3 Cost-effectiveness and Lightweight
3.2.1.4 Technological Innovations Anticipated to Boost Industry Growth
3.2.1.5 Flexible Launch Services to Spur Industry Growth
3.2.2 Market Restraining Factors
3.2.2.1 Growing Issue of Orbital Debris and Space Congestion Likely to Hamper Industry Growth
3.2.2.2 Lack of Standard Regulations and Government Policies Across Nations Projected to Restrain Industry Growth
3.2.2.3 Financial Sustainability and Funding Likely to Restrain Industry Growth
3.2.3 Market Opportunities
3.2.3.1 Global IoT Connectivity Through Small Satellites
3.2.3.2 3D Printing Empowers Small Satellite Market with Cost Reduction and In-Orbit Manufacturing
3.2.3.3 Innovations in Telemetry, Tracking and Command-to-Control Satellites to Offer Lucrative Growth Prospects
3.3 COVID-19 Impact Analysis
4 Small Satellite Market Analysis by Type
4.1 Key Findings
4.2 Type Segment: Market Attractiveness Index
4.3 Small Satellite Market Size Estimation and Forecast by Type
4.4 Nanosatellite
4.4.1 Market Forecast by Region, 2023-2033 (US$ Mn, AGR %)
4.4.2 Market Share by Region, 2023 & 2033 (%)
4.5 Microsatellite
4.5.1 Market Forecast by Region, 2023-2033 (US$ Mn, AGR %)
4.5.2 Market Share by Region, 2023 & 2033 (%)
4.6 Minisatellite
4.6.1 Market Forecast by Region, 2023-2033 (US$ Mn, AGR %)
4.6.2 Market Share by Region, 2023 & 2033 (%)
4.7 Others
4.7.1 Market Forecast by Region, 2023-2033 (US$ Mn, AGR %)
4.7.2 Market Share by Region, 2023 & 2033 (%)
5 Small Satellite Market Analysis by Application
5.1 Key Findings
5.2 Application Segment: Market Attractiveness Index
5.3 Small Satellite Market Size Estimation and Forecast by Application
5.4 Navigation
5.4.1 Market Forecast by Region, 2023-2033 (US$ Mn, AGR %)
5.4.2 Market Share by Region, 2023 & 2033 (%)
5.5 Communication
5.5.1 Market Forecast by Region, 2023-2033 (US$ Mn, AGR %)
5.5.2 Market Share by Region, 2023 & 2033 (%)
5.6 Earth Observation
5.6.1 Market Forecast by Region, 2023-2033 (US$ Mn, AGR %)
5.6.2 Market Share by Region, 2023 & 2033 (%)
5.7 Scientific Research
5.7.1 Market Forecast by Region, 2023-2033 (US$ Mn, AGR %)
5.7.2 Market Share by Region, 2023 & 2033 (%)
5.8 Others
5.8.1 Market Forecast by Region, 2023-2033 (US$ Mn, AGR %)
5.8.2 Market Share by Region, 2023 & 2033 (%)
6 Small Satellite Market Analysis by End-users
6.1 Key Findings
6.2 End-users Segment: Market Attractiveness Index
6.3 Small Satellite Market Size Estimation and Forecast by End-users
6.4 Commercial
6.4.1 Market Forecast by Region, 2023-2033 (US$ Mn, AGR %)
6.4.2 Market Share by Region, 2023 & 2033 (%)
6.5 Government & Military
6.5.1 Market Forecast by Region, 2023-2033 (US$ Mn, AGR %)
6.5.2 Market Share by Region, 2023 & 2033 (%)
6.6 Others
6.6.1 Market Forecast by Region, 2023-2033 (US$ Mn, AGR %)
6.6.2 Market Share by Region, 2023 & 2033 (%)
7 Small Satellite Market Analysis by Region
7.1 Key Findings
7.2 Regional Market Size Estimation and Forecast
8 North America Small Satellite Market Analysis
8.1 Key Findings
8.2 North America Small Satellite Market Attractiveness Index
8.3 North America Small Satellite Market by Country, 2023, 2028 & 2033 (US$ Million)
8.4 North America Small Satellite Market Size Estimation and Forecast by Country, 2023-2033 (US$ Mn)
8.5 North America Small Satellite Market Size Estimation and Forecast by Type
8.6 North America Small Satellite Market Size Estimation and Forecast by Application
8.7 North America Small Satellite Market Size Estimation and Forecast by End-users
8.8 U.S. Small Satellite Market Analysis
8.9 Canada Small Satellite Market Analysis
9 Europe Small Satellite Market Analysis
9.1 Key Findings
9.2 Europe Small Satellite Market Attractiveness Index
9.3 Europe Small Satellite Market Size by Country, 2023, 2028 & 2033 (US$ Million)
9.4 Europe Small Satellite Market Size Estimation and Forecast by Country
9.5 Europe Small Satellite Market Size Estimation and Forecast by Type
9.6 Europe Small Satellite Market Size Estimation and Forecast by Application
9.7 Europe Small Satellite Market Size Estimation and Forecast by End-users
9.8 Germany Small Satellite Market Analysis
9.9 UK Small Satellite Market Analysis
9.10 France Small Satellite Market Analysis
9.11 Italy Small Satellite Market Analysis
9.12 Spain Small Satellite Market Analysis
9.13 Russia Small Satellite Market Analysis
9.14 Rest of Europe Small Satellite Market Analysis
10 Asia Pacific Small Satellite Market Analysis
10.1 Key Findings
10.2 Asia Pacific Small Satellite Market Attractiveness Index
10.3 Asia Pacific Small Satellite Market Size by Country, 2023, 2028 & 2033 (US$ Million)
10.4 Asia Pacific Small Satellite Market Size Estimation and Forecast by Country
10.5 Asia Pacific Small Satellite Market Size Estimation and Forecast by Type
10.6 Asia Pacific Small Satellite Market Size Estimation and Forecast by Application
10.7 Asia Pacific Small Satellite Market Size Estimation and Forecast by End-users
10.8 Japan Small Satellite Market Analysis
10.9 China Small Satellite Market Analysis
10.10 India Small Satellite Market Analysis
10.11 Australia Small Satellite Market Analysis
10.12 South Korea Small Satellite Market Analysis
10.13 South-East Asia Small Satellite Market Analysis
10.14 Rest of Asia Pacific Small Satellite Market Analysis
11 Latin America Small Satellite Market Analysis
11.1 Key Findings
11.2 Latin America Small Satellite Market Attractiveness Index
11.3 Latin America Small Satellite Market Size by Country, 2023, 2028 & 2033 (US$ Million)
11.4 Latin America Small Satellite Market Size Estimation and Forecast by Country
11.5 Latin America Small Satellite Market Size Estimation and Forecast by Type
11.6 Latin America Small Satellite Market Size Estimation and Forecast by Application
11.7 Latin America Small Satellite Market Size Estimation and Forecast by End-users
11.8 Brazil Small Satellite Market Analysis
11.9 Mexico Small Satellite Market Analysis
11.10 Rest of Latin America Small Satellite Market Analysis
12 MEA Small Satellite Market Analysis
12.1 Key Findings
12.2 MEA Small Satellite Market Attractiveness Index
12.3 MEA Small Satellite Market Size by Country, 2023, 2028 & 2033 (US$ Million)
12.4 MEA Small Satellite Market Size Estimation and Forecast by Country
12.5 MEA Small Satellite Market Size Estimation and Forecast by Type
12.6 MEA Small Satellite Market Size Estimation and Forecast by Application
12.7 MEA Small Satellite Market Size Estimation and Forecast by End-users
12.8 GCC Small Satellite Market Analysis
12.9 South Africa Small Satellite Market Analysis
12.10 Rest of MEA Small Satellite Market Analysis
13 Company Profiles
13.1 Company Ranking Analysis
13.2 Strategic Outlook
13.3 Airbus
13.3.1 Company Snapshot
13.3.2 Company Overview
13.3.3 Financial Analysis
13.3.3.1 Net Revenue, 2017-2022
13.3.3.2 Regional Market Shares, 2022
13.3.3.3 Business Segment Market Shares, 2022
13.3.3.4 R&D, 2017-2022
13.3.4 Product Benchmarking
13.4 Axelspace Corporation
13.4.1 Company Snapshot
13.4.2 Company Overview
13.4.3 Product Benchmarking
13.4.4 Strategic Outlook
13.5 Ball Corporation
13.5.1 Company Snapshot
13.5.2 Company Overview
13.5.3 Financial Analysis
13.5.3.1 Net Revenue, 2017-2022
13.5.4 Product Benchmarking
13.6 Blue Canyon Technologies (Raytheon)
13.6.1 Company Snapshot
13.6.2 Company Overview
13.6.3 Product Benchmarking
13.6.4 Strategic Outlook
13.7 Boeing
13.7.1 Company Snapshot
13.7.2 Company Overview
13.7.3 Financial Analysis
13.7.3.1 Net Revenue, 2017-2022
13.7.3.2 Regional Market Shares, 2022
13.7.3.3 Business Segment Market Shares, 2022
13.7.3.4 R&D, 2017-2022
13.7.4 Product Benchmarking
13.8 Gomspace
13.8.1 Company Snapshot
13.8.2 Company Overview
13.8.3 Product Benchmarking
13.8.4 Strategic Outlook
13.9 L3Harris Technologies, Inc.
13.9.1 Company Snapshot
13.9.2 Company Overview
13.9.3 Financial Analysis
13.9.3.1 Net Revenue, 2017-2022
13.9.3.2 Business Segment Market Shares, 2022
13.9.4 Product Benchmarking
13.10 Northrop Grumman Corporation
13.10.1 Company Snapshot
13.10.2 Company Overview
13.10.3 Financial Analysis
13.10.3.1 Net Revenue, 2017-2022
13.10.3.2 Regional Market Shares, 2022
13.10.3.1 Business Segment Market Shares, 2022
13.10.4 Product Benchmarking
13.10.5 Strategic Outlook
13.11 OHB SE
13.11.1 Company Snapshot
13.11.2 Company Overview
13.11.3 Product Benchmarking
13.11.4 Strategic Outlook
13.12 Planet Labs PBC
13.12.1 Company Snapshot
13.12.2 Company Overview
13.12.3 Product Benchmarking
13.13 Surrey Satellite Technology Ltd
13.13.1 Company Snapshot
13.13.2 Company Overview
13.13.3 Product Benchmarking
13.14 Lockheed Martin Corporation (Delete)
13.14.1 Company Snapshot
13.14.2 Company Overview
13.14.3 Financial Analysis
13.14.3.1 Net Revenue, 2017-2022
13.14.3.2 Regional Market Shares, 2022
13.14.4 Product Benchmarking
13.14.5 Strategic Outlook
13.15 Maxar Technologies
13.15.1 Company Snapshot
13.15.2 Company Overview
13.15.3 Product Benchmarking
13.15.4 Strategic Outlook
13.16 Space Exploration Technologies Corp. (SPACEX)
13.16.1 Company Snapshot
13.16.2 Company Overview
13.16.3 Product Benchmarking
13.16.4 Strategic Outlook
13.17 Sierra Nevada Corporation
13.17.1 Company Snapshot
13.17.2 Company Overview
13.17.3 Product Benchmarking
13.18 Thales Group (Thales Alenia Space)
13.18.1 Company Snapshot
13.18.2 Company Overview
13.18.3 Financial Analysis
13.18.3.1 Net Revenue, 2017-2022
13.18.4 Product Benchmarking
13.18.5 Strategic Outlook
14 Conclusion and Recommendations
14.1 Concluding Remarks from Visiongain
14.2 Recommendations for Market Players
ページTOPに戻る
List of Tables/Graphs
List of Tables
Table 1 Small Satellite Market Snapshot, 2023 & 2033 (US$ million, CAGR %)
Table 2 Small Satellite Market Forecast by Region, 2023-2033 (US$ Million, AGR%, CAGR%): "V" Shaped Recovery
Table 3 Small Satellite Market Forecast by Region, 2023-2033 (US$ Million, AGR%, CAGR%): "U" Shaped Recovery
Table 4 Small Satellite Market Forecast by Region, 2023-2033 (US$ Million, AGR%, CAGR%): "W" Shaped Recovery
Table 5 Small Satellite Market Forecast by Region, 2023-2033 (US$ Million, AGR%, CAGR%): "L" Shaped Recovery
Table 6 Small Satellite Market Forecast by Type, 2023-2033 (US$ Million, AGR%, CAGR%)
Table 7 Nanosatellite Segment Market Forecast by Region, 2023-2033 (US$ Million, AGR%, CAGR%)
Table 8 Microsatellite Segment Market Forecast by Region, 2023-2033 (US$ Million, AGR%, CAGR%)
Table 9 Minisatellite Segment Market Forecast by Region, 2023-2033 (US$ Million, AGR%, CAGR%)
Table 10 Others Segment Market Forecast by Region, 2023-2033 (US$ Million, AGR%, CAGR%)
Table 11 Small Satellite Market Forecast by Application, 2023-2033 (US$ Million, AGR%, CAGR%)
Table 12 Navigation Segment Market Forecast by Region, 2023-2033 (US$ Million, AGR%, CAGR%)
Table 13 Communication Segment Market Forecast by Region, 2023-2033 (US$ Million, AGR%, CAGR%)
Table 14 Earth Observation Segment Market Forecast by Region, 2023-2033 (US$ Million, AGR%, CAGR%)
Table 15 Scientific Research Segment Market Forecast by Region, 2023-2033 (US$ Million, AGR%, CAGR%)
Table 16 Others Segment Market Forecast by Region, 2023-2033 (US$ Million, AGR%, CAGR%)
Table 17 Small Satellite Market Forecast by End-users, 2023-2033 (US$ Million, AGR%, CAGR%)
Table 18 Commercial Segment Market Forecast by Region, 2023-2033 (US$ Million, AGR%, CAGR%)
Table 19 Government & Military Segment Market Forecast by Region, 2023-2033 (US$ Million, AGR%, CAGR%)
Table 20 Others Segment Market Forecast by Region, 2023-2033 (US$ Million, AGR%, CAGR%)
Table 21 Small Satellite Market Forecast by Region, 2023-2033 (US$ Million, AGR%, CAGR%)
Table 22 North America Small Satellite Market Forecast by Country, 2023-2033 (US$ Million, AGR%, CAGR%)
Table 23 North America Small Satellite Market Forecast by Type, 2023-2033 (US$ Million, AGR%, CAGR%)
Table 24 North America Small Satellite Market Forecast by Application, 2023-2033 (US$ Million, AGR%, CAGR%)
Table 25 North America Small Satellite Market Forecast by End-users, 2023-2033 (US$ Million, AGR%, CAGR%)
Table 26 U.S. Small Satellite Market Forecast, 2023-2033 (US$ Million, AGR%, CAGR%)
Table 27 Canada Small Satellite Market Forecast, 2023-2033 (US$ Million, AGR%, CAGR%)
Table 28 Europe Small Satellite Market Forecast by Country, 2023-2033 (US$ Million, AGR%, CAGR%)
Table 29 Europe Small Satellite Market Forecast by Type, 2023-2033 (US$ Million, AGR%, CAGR%)
Table 30 Europe Small Satellite Market Forecast by Application, 2023-2033 (US$ Million, AGR%, CAGR%)
Table 31 Europe Small Satellite Market Forecast by End-users, 2023-2033 (US$ Million, AGR%, CAGR%)
Table 32 Germany Small Satellite Market Forecast, 2023-2033 (US$ Million, AGR%, CAGR%)
Table 33 UK Small Satellite Market Forecast, 2023-2033 (US$ Million, AGR%, CAGR%)
Table 34 France Small Satellite Market Forecast, 2023-2033 (US$ Million, AGR%, CAGR%)
Table 35 Italy Small Satellite Market Forecast, 2023-2033 (US$ Million, AGR%, CAGR%)
Table 36 Spain Small Satellite Market Forecast, 2023-2033 (US$ Million, AGR%, CAGR%)
Table 37 Russia Small Satellite Market Forecast, 2023-2033 (US$ Million, AGR%, CAGR%)
Table 38 Rest of Europe Small Satellite Market Forecast, 2023-2033 (US$ Million, AGR%, CAGR%)
Table 39 Asia Pacific Small Satellite Market Forecast by Country, 2023-2033 (US$ Million, AGR%, CAGR%)
Table 40 Asia Pacific Small Satellite Market Forecast by Type, 2023-2033 (US$ Million, AGR%, CAGR%)
Table 41 Asia Pacific Small Satellite Market Forecast by Application, 2023-2033 (US$ Million, AGR%, CAGR%)
Table 42 Asia Pacific Small Satellite Market Forecast by End-users, 2023-2033 (US$ Million, AGR%, CAGR%)
Table 43 Japan Small Satellite Market Forecast, 2023-2033 (US$ Million, AGR%, CAGR%)
Table 44 China Small Satellite Market Forecast, 2023-2033 (US$ Million, AGR%, CAGR%)
Table 45 India Small Satellite Market Forecast, 2023-2033 (US$ Million, AGR%, CAGR%)
Table 46 Australia Small Satellite Market Forecast, 2023-2033 (US$ Million, AGR%, CAGR%)
Table 47 South Korea Small Satellite Market Forecast, 2023-2033 (US$ Million, AGR%, CAGR%)
Table 48 South-East Asia Small Satellite Market Forecast, 2023-2033 (US$ Million, AGR%, CAGR%)
Table 49 Rest of Asia Pacific Small Satellite Market Forecast, 2023-2033 (US$ Million, AGR%, CAGR%)
Table 50 Latin America Small Satellite Market Forecast by Country, 2023-2033 (US$ Million, AGR%, CAGR%)
Table 51 Latin America Small Satellite Market Forecast by Type, 2023-2033 (US$ Million, AGR%, CAGR%)
Table 52 Latin America Small Satellite Market Forecast by Application, 2023-2033 (US$ Million, AGR%, CAGR%)
Table 53 Latin America Small Satellite Market Forecast by End-users, 2023-2033 (US$ Million, AGR%, CAGR%)
Table 54 Brazil Small Satellite Market Forecast, 2023-2033 (US$ Million, AGR%, CAGR%)
Table 55 Mexico Small Satellite Market Forecast, 2023-2033 (US$ Million, AGR%, CAGR%)
Table 56 Rest of Latin America Small Satellite Market Forecast, 2023-2033 (US$ Million, AGR%, CAGR%)
Table 57 MEA Small Satellite Market Forecast by Country, 2023-2033 (US$ Million, AGR%, CAGR%)
Table 58 MEA Small Satellite Market Forecast by Type, 2023-2033 (US$ Million, AGR%, CAGR%)
Table 59 MEA Small Satellite Market Forecast by Application, 2023-2033 (US$ Million, AGR%, CAGR%)
Table 60 MEA Small Satellite Market Forecast by End-users, 2023-2033 (US$ Million, AGR%, CAGR%)
Table 61 GCC Small Satellite Market Forecast, 2023-2033 (US$ Million, AGR%, CAGR%)
Table 62 South Africa Small Satellite Market Forecast, 2023-2033 (US$ Million, AGR%, CAGR%)
Table 63 Rest of MEA Small Satellite Market Forecast, 2023-2033 (US$ Million, AGR%, CAGR%)
Table 64 Small Satellite: Company Ranking
Table 65 Small Satellite: Strategic Outlook
Table 66 Airbus: Key Details, (CEO, HQ, Revenue, Founded, No. of Employees, Company Type, Website, Business Segment)
Table 67 Airbus: Product Benchmarking
Table 68 Axelspace Corporation: Key Details, (CEO, HQ, Revenue, Founded, No. of Employees, Company Type, Website, Business Segment)
Table 69 Axelspace Corporation: Product Benchmarking
Table 70 Axelspace Corporation: Strategic Outlook
Table 71 Ball Corporation: Key Details, (CEO, HQ, Revenue, Founded, No. of Employees, Company Type, Website, Business Segment)
Table 72 Ball Corporation: Product Benchmarking
Table 73 Blue Canyon Technologies: Key Details, (CEO, HQ, Revenue, Founded, No. of Employees, Company Type, Website, Business Segment)
Table 74 Blue Canyon Technologies: Product Benchmarking
Table 75 Blue Canyon Technologies: Strategic Outlook
Table 76 Boeing: Key Details, (CEO, HQ, Revenue, Founded, No. of Employees, Company Type, Website, Business Segment)
Table 77 Boeing: Product Benchmarking
Table 78 Gomspace: Key Details, (CEO, HQ, Revenue, Founded, No. of Employees, Company Type, Website, Business Segment)
Table 79 Gomspace: Product Benchmarking
Table 80 Gomspace: Strategic Outlook
Table 81 L3Harris Technologies, Inc.: Key Details, (CEO, HQ, Revenue, Founded, No. of Employees, Company Type, Website, Business Segment)
Table 82 L3Harris Technologies, Inc.: Product Benchmarking
Table 83 Northrop Grumman Corporation: Key Details, (CEO, HQ, Revenue, Founded, No. of Employees, Company Type, Website, Business Segment)
Table 84 Northrop Grumman Corporation: Product Benchmarking
Table 85 Northrop Grumman Corporation: Strategic Outlook
Table 86 OHB SE: Key Details, (CEO, HQ, Revenue, Founded, No. of Employees, Company Type, Website, Business Segment)
Table 87 OHB SE: Product Benchmarking
Table 88 OHB SE: Strategic Outlook
Table 89 Planet Labs PBC: Key Details, (CEO, HQ, Revenue, Founded, No. of Employees, Company Type, Website, Business Segment)
Table 90 Planet Labs PBC: Product Benchmarking
Table 91 Surrey Satellite Technology Ltd: Key Details, (CEO, HQ, Revenue, Founded, No. of Employees, Company Type, Website, Business Segment)
Table 92 SURREY SATELLITE TECHNOLOGY LTD: Product Benchmarking
Table 93 Lockheed Martin Corporation: Key Details, (CEO, HQ, Revenue, Founded, No. of Employees, Company Type, Website, Business Segment)
Table 94 Lockheed Martin Corporation: Product Benchmarking
Table 95 Lockheed Martin Corporation: Strategic Outlook
Table 96 Maxar Technologies: Key Details, (CEO, HQ, Revenue, Founded, No. of Employees, Company Type, Website, Business Segment)
Table 97 Maxar Technologies: Product Benchmarking
Table 98 Maxar Technologies: Strategic Outlook
Table 99 Space Exploration Technologies Corp. (SPACEX): Key Details, (CEO, HQ, Revenue, Founded, No. of Employees, Company Type, Website, Business Segment)
Table 100 Space Exploration Technologies Corp. (SPACEX): Product Benchmarking
Table 101 Space Exploration Technologies Corp. (SPACEX): Strategic Outlook
Table 102 Sierra Nevada Corporation: Key Details, (CEO, HQ, Revenue, Founded, No. of Employees, Company Type, Website, Business Segment)
Table 103 Sierra Nevada Corporation: Product Benchmarking
Table 104 Thales Group: Key Details, (CEO, HQ, Revenue, Founded, No. of Employees, Company Type, Website, Business Segment)
Table 105 Thales Group: Product Benchmarking
Table 106 Thales Group: Strategic Outlook
List of Figures
Figure 1 Small Satellite Market Segmentation
Figure 2 Small Satellite Market by Type: Market Attractiveness Index
Figure 3 Small Satellite Market by Application: Market Attractiveness Index
Figure 4 Small Satellite Market by End-users: Market Attractiveness Index
Figure 5 Small Satellite Market Attractiveness Index by Region
Figure 6 Small Satellite Market: Market Dynamics
Figure 7 Debris Breakdown Since Q2 2021
Figure 8 Small/Non-constellation, Large Constellation, Debris, and Rocket Body Counts by Quarter
Figure 9 Small Satellite Market by Region, 2023-2033 (US$ Mn, AGR %): “V” Shaped Recovery
Figure 10 Small Satellite Market by Region, 2023-2033 (US$ Mn, AGR %): “U” Shaped Recovery
Figure 11 Small Satellite Market by Region, 2023-2033 (US$ Mn, AGR %): “W” Shaped Recovery
Figure 12 Small Satellite Market by Region, 2023-2033 (US$ Mn, AGR %): “L” Shaped Recovery
Figure 13 Small Satellite Market Attractiveness Index by Type
Figure 14 Small Satellite Market Forecast by Type, 2023-2033 (US$ Million, AGR %)
Figure 15 Small Satellite Market Share Forecast by Type, 2023, 2028, 2033 (%)
Figure 16 Nanosatellite Segment Market Forecast by Region, 2023-2033 (US$ Million, AGR %)
Figure 17 Nanosatellite Segment Market Share Forecast by Region, 2023 & 2033 (%)
Figure 18 Microsatellite Segment Market Forecast by Region, 2023-2033 (US$ Million, AGR %)
Figure 19 Microsatellite Segment Market Share Forecast by Region, 2023 & 2033 (%)
Figure 20 Minisatellite Segment Market Forecast by Region, 2023-2033 (US$ Million, AGR %)
Figure 21 Minisatellite Segment Market Share Forecast by Region, 2023 & 2033 (%)
Figure 22 Others Segment Market Forecast by Region, 2023-2033 (US$ Million, AGR %)
Figure 23 Others Segment Market Share Forecast by Region, 2023 & 2033 (%)
Figure 24 Small Satellite Market Attractiveness Index by Type
Figure 25 Small Satellite Market Forecast by Application, 2023-2033 (US$ Million, AGR %)
Figure 26 Small Satellite Market Share Forecast by Application, 2023, 2028, 2033 (%)
Figure 27 Navigation Segment Market Forecast by Region, 2023-2033 (US$ Million, AGR %)
Figure 28 Navigation Segment Market Share Forecast by Region, 2023 & 2033 (%)
Figure 29 Communication Segment Market Forecast by Region, 2023-2033 (US$ Million, AGR %)
Figure 30 Communication Segment Market Share Forecast by Region, 2023 & 2033 (%)
Figure 31 Earth Observation Segment Market Forecast by Region, 2023-2033 (US$ Million, AGR %)
Figure 32 Earth Observation Segment Market Share Forecast by Region, 2023 & 2033 (%)
Figure 33 Scientific Research Segment Market Forecast by Region, 2023-2033 (US$ Million, AGR %)
Figure 34 Scientific Research Segment Market Share Forecast by Region, 2023 & 2033 (%)
Figure 35 Others Segment Market Forecast by Region, 2023-2033 (US$ Million, AGR %)
Figure 36 Others Segment Market Share Forecast by Region, 2023 & 2033 (%)
Figure 37 Small Satellite Market Attractiveness Index by End-users
Figure 38 Small Satellite Market Forecast by End-users, 2023-2033 (US$ Million, AGR %)
Figure 39 Small Satellite Market Share Forecast by End-users, 2023, 2028, 2033 (%)
Figure 40 Commercial Segment Market Forecast by Region, 2023-2033 (US$ Million, AGR %)
Figure 41 Commercial Segment Market Share Forecast by Region, 2023 & 2033 (%)
Figure 42 Government & Military Segment Market Forecast by Region, 2023-2033 (US$ Million, AGR %)
Figure 43 Government & Military Segment Market Share Forecast by Region, 2023 & 2033 (%)
Figure 44 Others Segment Market Forecast by Region, 2023-2033 (US$ Million, AGR %)
Figure 45 Others Segment Market Share Forecast by Region, 2023 & 2033 (%)
Figure 46 Small Satellite Market Forecast by Region 2023 and 2033 (Revenue, CAGR%)
Figure 47 Small Satellite Market Share Forecast by Region 2023, 2028, 2033 (%)
Figure 48 Small Satellite Market by Region, 2023-2033 (US$ Mn)
Figure 49 North America Small Satellite Market Attractiveness Index
Figure 50 North America Small Satellite Market by Country, 2023, 2028 & 2033 (US$ Million)
Figure 51 North America Small Satellite Market Forecast by Country, 2023-2033 (US$ Million, AGR %)
Figure 52 North America Small Satellite Market Share Forecast by Country, 2023 & 2033 (%)
Figure 53 North America Small Satellite Market Forecast by Type, 2023-2033 (US$ Million, AGR %)
Figure 54 North America Small Satellite Market Share Forecast by Type, 2023 & 2033 (%)
Figure 55 North America Small Satellite Market Forecast by Application, 2023-2033 (US$ Million, AGR %)
Figure 56 North America Small Satellite Market Share Forecast by Application, 2023 & 2033 (%)
Figure 57 North America Small Satellite Market Forecast by End-users, 2023-2033 (US$ Million, AGR %)
Figure 58 North America Small Satellite Market Share Forecast by End-users, 2023 & 2033 (%)
Figure 59 U.S. Small Satellite Market Forecast, 2023-2033 (US$ Million, AGR %)
Figure 60 Canada Small Satellite Market Forecast, 2023-2033 (US$ Million, AGR %)
Figure 61 Europe Small Satellite Market Attractiveness Index
Figure 62 Europe Small Satellite Market by Country, 2023, 2028 & 2033 (US$ Million)
Figure 63 Europe Small Satellite Market Forecast by Country, 2023-2033 (US$ Million, AGR %)
Figure 64 Europe Small Satellite Market Share Forecast by Country, 2023 & 2033 (%)
Figure 65 Europe Small Satellite Market Forecast by Type, 2023-2033 (US$ Million, AGR %)
Figure 66 Europe Small Satellite Market Share Forecast by Type, 2023 & 2033 (%)
Figure 67 Europe Small Satellite Market Forecast by Application, 2023-2033 (US$ Million, AGR %)
Figure 68 Europe Small Satellite Market Share Forecast by Application, 2023 & 2033 (%)
Figure 69 Europe Small Satellite Market Forecast by End-users, 2023-2033 (US$ Million, AGR %)
Figure 70 Europe Small Satellite Market Share Forecast by End-users, 2023 & 2033 (%)
Figure 71 Germany Small Satellite Market Forecast, 2023-2033 (US$ Million, AGR %)
Figure 72 UK Small Satellite Market Forecast, 2023-2033 (US$ Million, AGR %)
Figure 73 France Small Satellite Market Forecast, 2023-2033 (US$ Million, AGR %)
Figure 74 Italy Small Satellite Market Forecast, 2023-2033 (US$ Million, AGR %)
Figure 75 Spain Small Satellite Market Forecast, 2023-2033 (US$ Million, AGR %)
Figure 76 Russia Small Satellite Market Forecast, 2023-2033 (US$ Million, AGR %)
Figure 77 Rest of Europe Small Satellite Market Forecast, 2023-2033 (US$ Million, AGR %)
Figure 78 Asia Pacific Small Satellite Market Attractiveness Index
Figure 79 Asia Pacific Small Satellite Market by Country, 2023, 2028 & 2033 (US$ Million)
Figure 80 Asia Pacific Small Satellite Market Forecast by Country, 2023-2033 (US$ Million, AGR %)
Figure 81 Asia Pacific Small Satellite Market Share Forecast by Country, 2023 & 2033 (%)
Figure 82 Asia Pacific Small Satellite Market Forecast by Type, 2023-2033 (US$ Million, AGR %)
Figure 83 Asia Pacific Small Satellite Market Share Forecast by Type, 2023 & 2033 (%)
Figure 84 Asia Pacific Small Satellite Market Forecast by Application, 2023-2033 (US$ Million, AGR %)
Figure 85 Asia Pacific Small Satellite Market Share Forecast by Application, 2023 & 2033 (%)
Figure 86 Asia Pacific Small Satellite Market Forecast by End-users, 2023-2033 (US$ Million, AGR %)
Figure 87 Asia Pacific Small Satellite Market Share Forecast by End-users, 2023 & 2033 (%)
Figure 88 Japan Small Satellite Market Forecast, 2023-2033 (US$ Million, AGR %)
Figure 89 China Small Satellite Market Forecast, 2023-2033 (US$ Million, AGR %)
Figure 90 India Small Satellite Market Forecast, 2023-2033 (US$ Million, AGR %)
Figure 91 Australia Small Satellite Market Forecast, 2023-2033 (US$ Million, AGR %)
Figure 92 South Korea Small Satellite Market Forecast, 2023-2033 (US$ Million, AGR %)
Figure 93 South-East Asia Satellite Market Forecast, 2023-2033 (US$ Million, AGR %)
Figure 94 Rest of Asia Pacific Small Satellite Market Forecast, 2023-2033 (US$ Million, AGR %)
Figure 95 Latin America Small Satellite Market Attractiveness Index
Figure 96 Latin America Small Satellite Market by Country, 2023, 2028 & 2033 (US$ Million)
Figure 97 Latin America Small Satellite Market Forecast by Country, 2023-2033 (US$ Million, AGR %)
Figure 98 Latin America Small Satellite Market Share Forecast by Country, 2023 & 2033 (%)
Figure 99 Latin America Small Satellite Market Forecast by Type, 2023-2033 (US$ Million, AGR %)
Figure 100 Latin America Small Satellite Market Share Forecast by Type, 2023 & 2033 (%)
Figure 101 Latin America Small Satellite Market Forecast by Application, 2023-2033 (US$ Million, AGR %)
Figure 102 Latin America Small Satellite Market Share Forecast by Application, 2023 & 2033 (%)
Figure 103 Latin America Small Satellite Market Forecast by End-users, 2023-2033 (US$ Million, AGR %)
Figure 104 Latin America Small Satellite Market Share Forecast by End-users, 2023 & 2033 (%)
Figure 105 Brazil Small Satellite Market Forecast, 2023-2033 (US$ Million, AGR %)
Figure 106 Mexico Small Satellite Market Forecast, 2023-2033 (US$ Million, AGR %)
Figure 107 Rest of Latin America Small Satellite Market Forecast, 2023-2033 (US$ Million, AGR %)
Figure 108 MEA Small Satellite Market Attractiveness Index
Figure 109 MEA Small Satellite Market by Country, 2023, 2028 & 2033 (US$ Million)
Figure 110 MEA Small Satellite Market Forecast by Country, 2023-2033 (US$ Million, AGR %)
Figure 111 MEA Small Satellite Market Share Forecast by Country, 2023 & 2033 (%)
Figure 112 MEA Small Satellite Market Forecast by Type, 2023-2033 (US$ Million, AGR %)
Figure 113 MEA Small Satellite Market Share Forecast by Type, 2023 & 2033 (%)
Figure 114 MEA Small Satellite Market Forecast by Application, 2023-2033 (US$ Million, AGR %)
Figure 115 MEA Small Satellite Market Share Forecast by Application, 2023 & 2033 (%)
Figure 116 MEA Small Satellite Market Forecast by End-users, 2023-2033 (US$ Million, AGR %)
Figure 117 MEA Small Satellite Market Share Forecast by End-users, 2023 & 2033 (%)
Figure 118 GCC Small Satellite Market Forecast, 2023-2033 (US$ Million, AGR %)
Figure 119 South Africa Small Satellite Market Forecast, 2023-2033 (US$ Million, AGR %)
Figure 120 Rest of MEA Small Satellite Market Forecast, 2023-2033 (US$ Million, AGR %)
Figure 121 Airbus: Net Revenue, 2017-2022 (US$ Million, AGR%)
Figure 122 Airbus: Regional Market Shares (%), 2022
Figure 123 Airbus: Business Segment Market Shares (%), 2022
Figure 124 Airbus: R&D, 2017-2022 (US$ Million, AGR%)
Figure 125 Ball Corporation: Net Revenue, 2017-2022 (US$ Million, AGR%)
Figure 126 Boeing: Net Revenue, 2017-2022 (US$ Million, AGR%)
Figure 127 Boeing: Regional Market Shares (%), 2022
Figure 128 Boeing: Business Segment Market Shares (%), 2022
Figure 129 Boeing: R&D, 2017-2022 (US$ Million, AGR%)
Figure 130 L3Harris Technologies, Inc.: Net Revenue, 2017-2022 (US$ Million, AGR%)
Figure 131 L3Harris Technologies, Inc.: Business Segment Market Shares (%), 2022
Figure 132 Northrop Grumman Corporation: Net Revenue, 2017-2022 (US$ Million, AGR%)
Figure 133 Northrop Grumman Corporation: Regional Market Shares (%), 2022
Figure 134 Northrop Grumman Corporation: Business Segment Market Shares (%), 2022
Figure 135 Lockheed Martin Corporation: Net Revenue, 2017-2022 (US$ Million, AGR%)
Figure 136 Lockheed Martin Corporation: Regional Market Shares (%), 2022
Figure 137 Thales Group: Net Revenue, 2017-2022 (US$ Million, AGR%)
ページTOPに戻る
本レポートと同分野(ネットワーク)の最新刊レポート
Visiongain社の航空・海事分野での最新刊レポート
本レポートと同じKEY WORD(satellite)の最新刊レポート
よくあるご質問
Visiongain社はどのような調査会社ですか?
英国の調査会社ヴィジョンゲイン社(Visiongain)は、通信とエネルギーのほか、自動車や化学・医薬品、金属など、広範な市場を対象に調査を行っています。自動車市場については、市場全般に関する調査のほ... もっと見る
調査レポートの納品までの日数はどの程度ですか?
在庫のあるものは速納となりますが、平均的には 3-4日と見て下さい。
但し、一部の調査レポートでは、発注を受けた段階で内容更新をして納品をする場合もあります。
発注をする前のお問合せをお願いします。
注文の手続きはどのようになっていますか?
1)お客様からの御問い合わせをいただきます。
2)見積書やサンプルの提示をいたします。
3)お客様指定、もしくは弊社の発注書をメール添付にて発送してください。
4)データリソース社からレポート発行元の調査会社へ納品手配します。
5) 調査会社からお客様へ納品されます。最近は、pdfにてのメール納品が大半です。
お支払方法の方法はどのようになっていますか?
納品と同時にデータリソース社よりお客様へ請求書(必要に応じて納品書も)を発送いたします。
お客様よりデータリソース社へ(通常は円払い)の御振り込みをお願いします。
請求書は、納品日の日付で発行しますので、翌月最終営業日までの当社指定口座への振込みをお願いします。振込み手数料は御社負担にてお願いします。
お客様の御支払い条件が60日以上の場合は御相談ください。
尚、初めてのお取引先や個人の場合、前払いをお願いすることもあります。ご了承のほど、お願いします。
データリソース社はどのような会社ですか?
当社は、世界各国の主要調査会社・レポート出版社と提携し、世界各国の市場調査レポートや技術動向レポートなどを日本国内の企業・公官庁及び教育研究機関に提供しております。
世界各国の「市場・技術・法規制などの」実情を調査・収集される時には、データリソース社にご相談ください。
お客様の御要望にあったデータや情報を抽出する為のレポート紹介や調査のアドバイスも致します。
|
|

