航空機用コンピュータ市場レポート:2024-2034
Aircraft Computers Market Report 2024-2034
レポート詳細
航空機用コンピュータ市場レポート 2024-2034年 :この調査レポートは、業界とその基礎となる原動力をより良く理解することを望むなら、新たな収益ポケットを目指す大手企業にとって貴... もっと見る
※上記価格は部署ライセンス(Departmental licence)価格です。
その他の価格についてはデータリソースまでお問合せください。
日本語のページは自動翻訳を利用し作成しています。
実際のレポートは英文のみでご納品いたします。
サマリー
レポート詳細
航空機用コンピュータ市場レポート 2024-2034年:この調査レポートは、業界とその基礎となる原動力をより良く理解することを望むなら、新たな収益ポケットを目指す大手企業にとって貴重なものとなるでしょう。異業種への進出や新規地域での既存事業の拡大を目指す企業にも有用です。
UAVの適応拡大が市場成長に拍車をかける
無人航空機(UAV)の普及は、航空機コンピュータ市場にとって戦略的な機会となっている。一般にドローンとして知られるUAVは、防衛、農業、監視、ロジスティクスなど、さまざまな分野で展開されている。先進的な航空機コンピュータは、UAVの誘導、ナビゲーション、制御システムで極めて重要な役割を果たし、正確で自律的な動作を保証します。UAVの需要がその多様な用途に後押しされて上昇を続ける中、航空機コンピュータ市場は、無人システム特有の要件に合わせた特殊なコンピューティング・ソリューションを提供することで、この傾向を活用することができます。これによってイノベーションの道が開かれ、市場内にニッチが形成され、航空機用コンピュータ産業のより広範な拡大に貢献する。
サイバー攻撃によるリスク増大と厳しい航空基準が市場成長の妨げに
航空業界は、高度なデジタル技術や相互接続システムへの依存度を高めているため、サイバー攻撃のリスクが高まっており、市場成長の大きな抑制要因となっている。航空機システムが高度化し、相互接続が進むにつれて、サイバーセキュリティの脅威に対する脆弱性も高まっている。アビオニクスのデジタル化が進み、機内Wi-Fiや航空機と地上システム間のデータ共有などの接続機能が組み込まれることで、悪意のある行為者にとって潜在的な侵入口が生まれる。
厳しく進化する航空基準や規制は、航空機用コンピュータ市場の抑制要因となっている。航空業界は、連邦航空局(FAA)や欧州連合航空安全機関(EASA)などの規制機関が課す厳しい安全基準やコンプライアンス基準の下で運営されている。これらの基準は、航空機システムの安全性と信頼性を確保するために不可欠である一方、メーカーやオペレータにとっては課題でもあります。
市場調査レポートを購入する前にすべき質問とは?
-
航空機用コンピュータ市場はどのように進化しているのか?
-
航空機用コンピュータ市場の牽引役と阻害要因は何か?
-
航空機用コンピュータの各サブマーケットは予測期間中にどのように成長し、2034年にはどれくらいの売上を占めるようになるのか?
-
2024年から2034年にかけて、航空機用コンピューターの各サブマーケットの市場シェアはどのように推移するのか?
-
2024年から2034年にかけて、市場全体を牽引する主な要因は何か?
-
主要な航空機用コンピュータ市場はマクロ経済の動きに幅広く追随するのか、それとも個々の国の市場が他国を凌駕するのか。
-
2034年までに各国市場のシェアはどのように変化し、どの地域が2034年の市場をリードするのか。
-
主要プレーヤーと予測期間中の見通しは?
-
これらの大手企業にとって、航空機用コンピューターはどのようなプロジェクトなのだろうか?
-
2024年から2034年にかけて、航空機産業はどのように進化するのか?現在および今後10年間に実施される航空機コンピュータ・プロジェクトにはどのような影響があるのか?
-
航空機用コンピュータの市場規模をさらに拡大するために、製品化の必要性は高まっているのでしょうか?
-
航空機用コンピュータ市場はどこに向かっているのか、また、どのようにすれば市場の最前線に立てるのか。
-
新商品や新サービスに最適な投資方法とは?
-
企業を新たな成長軌道に乗せ、C-suiteに移行させるための重要な展望とは?
このことが、現在、そして今後10年間の航空機用コンピューター市場にどのような影響を与えるかを見極める必要がある:
-
335ページに及ぶ本レポートでは、117の表と202の図表を掲載している。
-
本レポートでは、業界における主要な有利分野を取り上げているため、今すぐターゲットを絞ることができる。
-
世界、地域、国の売上高と成長に関する詳細な分析が含まれている。
-
競合他社が成功した主なトレンド、変化、収益予測をハイライトします。
2034年までの予測やその他の分析から、商業的な展望が明らかになる
-
2034年までの収益予測に加え、最近の実績、成長率、市場シェアも提供している。
-
ビジネスの展望や展開など、独自の分析が掲載されている。
-
定性的分析(市場ダイナミクス、促進要因、機会、阻害要因、課題など)、コスト構造、航空機用コンピュータの価格上昇の影響、最近の動向などをご覧いただけます。
レポート対象セグメント
コンポーネント
タイプ
-
フライトコントロール
-
エンジン制御
-
フライト・マネジメント・コンピューター
-
ミッション・コンピューター
-
ユーティリティ・コントロール
プラットフォーム
申し込み
エンドユーザー
世界市場全体と各分野の収益予測に加え、5つの地域と15の主要国市場の収益予測も掲載している:
北米
欧州
-
ドイツ
-
英国
-
フランス
-
スペイン
-
イタリア
-
その他の欧州地域
アジア太平洋
-
中国
-
日本
-
インド
-
オーストラリア
-
韓国
-
その他のアジア太平洋地域
ラテンアメリカ
MEA
このレポートには、2024年から2034年までの航空機用コンピューター市場における主要企業のプロフィールも含まれており、これらの企業の事業のこのセグメントに重点を置いています。
報告書に掲載されている主要企業
-
BAE Systems plc
-
Cobham Limited
-
Curtiss-Wright Corporation
-
Elbit Systems Ltd.
-
General Dynamics Corporation
-
General Electric Company
-
Honeywell International
-
L3Harris Technologies
-
Leonardo S.p.A.
-
Northrop Grumman Corporation
-
Parker Meggitt
-
Raytheon Technologies Corporation
-
Safran Electronics & Defence
-
Teledyne Technologies Incorporated
-
Thales Group
2024年から2034年までの航空機用コンピュータ市場全体の世界売上高(金額ベース)は、2024年に86億米ドルを突破すると弊社は算出した。2034年まで力強い収益成長を予測。当調査では、最も大きな可能性を秘めた企業を特定しています。各組織の能力、進捗状況、商業的展望を把握することで、常に一歩先を行くことができます。
航空機用コンピュータ市場、2024-2034年レポートはどのようにお役に立つでしょうか?
要約すると、330ページを超えるこのレポートは、以下のような知識を提供する:
-
航空機用コンピュータ市場の2024年から2034年までの収益予測:タイプ、コンポーネント、プラットフォーム、アプリケーション、エンドユーザー別の予測を世界および地域レベルで掲載。
-
5つの地域と15の主要国市場の2034年までの収益予測 - 北米、欧州、アジア太平洋、中南米、MEAの航空機用コンピュータ市場の2024年から2034年までの予測をご覧ください。また、米国、カナダ、メキシコ、ブラジル、ドイツ、フランス、英国、イタリア、中国、インド、日本、オーストラリアなど著名な経済圏の市場も予測しています。
-
2024年から2034年までの航空機用コンピュータ市場に関わる主要企業15社の企業プロファイルを含む。
独自の予測による定量的・定性的分析をご覧ください。私たちのレポートだけに含まれる情報を入手し、貴重なビジネスインテリジェンスで情報を得ることができます。
他にはない情報
私たちの新しいレポートがあれば、知識に遅れをとったり、チャンスを逃したりする可能性が低くなります。弊社の調査レポートが貴社の調査、分析、意思決定にどのように役立つかをご覧ください。Visiongainの調査は、航空機用コンピュータ市場、2024年から2034年、市場をリードする企業の商業分析を必要とするすべての人のためのものです。データ、トレンド、予測をご覧いただけます。
ページTOPに戻る
目次
1 レポート概要
1.1 研究の目的
1.2 航空機用コンピュータ市場の紹介
1.3 本レポートの内容
1.4 本レポートを読むべき理由
1.5 本分析レポートが回答する主な質問
1.6 本レポートは誰のためのものか?
1.7 方法論
1.7.1 市場の定義
1.7.2 市場評価・予測手法
1.7.3 データの検証
1.7.3.1 一次調査
1.7.3.2 セカンダリーリサーチ
1.8 よくある質問(FAQ)
1.9 Visiongainの関連レポート
1.10 Visiongainについて
2 エグゼクティブ・サマリー
3 市場概要
3.1 主要な調査結果
3.2 市場ダイナミクス
3.3 影響分析
3.3.1 市場牽引要因
3.3.1.1 市場成長を牽引する航空機納入の増加
3.3.1.2 既存航空機の近代化が市場成長を牽引
3.3.1.3 航空機の安全性重視の高まりが市場成長を促進
3.3.2 市場抑制要因
3.3.2.1 サイバー攻撃によるリスクの増大が市場成長を妨げる
3.3.2.2 厳しい航空規格が市場成長を妨げる
3.3.2.3 既存の航空機納入遅延が市場成長の妨げに
3.3.3 市場機会
3.3.3.1 機内エンターテイメントシステムの展開は市場成長のチャンスとなり得る
3.3.3.2 新興市場における急速な経済発展が市場成長のチャンスとなる
3.3.3.3 UAVの適応拡大が航空機コンピュータ市場にとっての機会
3.4 サプライチェーン分析
3.5 規制の枠組み
3.6 新興市場とメガトレンド
3.7 ポーターのファイブフォース分析
3.7.1 供給者の交渉力(中)
3.7.2 買い手の交渉力(中)
3.7.3 競争力(中)
3.7.4 代替品の脅威(低)
3.7.5 新規参入の脅威(低)
3.8 PEST分析
4 航空機用コンピュータ市場分析:タイプ別
4.1 主要な調査結果
4.2 タイプ別セグメント 市場魅力度指数
4.3 航空機用コンピュータのタイプ別市場規模推定と予測
4.4 フライトコントロール
4.4.1 2024〜2034年の地域別市場規模(US$ Million)
4.4.2 地域別市場シェア、2024年・2034年 (%)
4.5 エンジン制御
4.5.1 2024〜2034年の地域別市場規模(US$ Million)
4.5.2 地域別市場シェア、2024年・2034年 (%)
4.6 フライトマネジメントコンピュータ
4.6.1 2024〜2034年の地域別市場規模(US$ Million)
4.6.2 地域別市場シェア、2024年・2034年 (%)
4.7 ミッションコンピュータ
4.7.1 2024~2034年地域別市場規模(US$ Million)
4.7.2 地域別市場シェア、2024年・2034年 (%)
4.8 ユーティリティ制御機器
4.8.1 2024~2034年の地域別市場規模(US$ Million)
4.8.2 地域別市場シェア、2024年・2034年 (%)
5 航空機用コンピュータ市場分析:プラットフォーム別
5.1 主要調査結果
5.2 プラットフォームセグメント 市場魅力度指数
5.3 プラットフォーム別航空機用コンピュータ市場規模推定と予測
5.4 固定翼
5.4.1 2024〜2034年の地域別市場規模(US$ Million)
5.4.2 地域別市場シェア、2024年・2034年(%)
5.5 回転翼
5.5.1 2024年~2034年の地域別市場規模(US$ Million)
5.5.2 地域別市場シェア、2024年・2034年(%)
5.6 UAV
5.6.1 2024〜2034年の地域別市場規模(US$ Million)
5.6.2 地域別市場シェア、2024年・2034年(%)
6 航空機用コンピュータ市場分析:コンポーネント別
6.1 主要な調査結果
6.2 コンポーネントセグメント 市場魅力度指数
6.3 航空機用コンピュータのコンポーネント別市場規模推定と予測
6.4 ハードウェア
6.4.1 2024〜2034年の地域別市場規模(US$ Million)
6.4.2 地域別市場シェア、2024年・2034年(%)
6.5 ソフトウェア
6.5.1 2024~2034年の地域別市場規模(US$ Million)
6.5.2 地域別市場シェア、2024年・2034年(%)
7 航空機用コンピュータ市場分析:エンドユーザー別
7.1 主要調査結果
7.2 エンドユーザーセグメント 市場魅力度指数
7.3 エンドユーザー別航空機用コンピュータ市場規模推定と予測
7.4 OEM
7.4.1 2024〜2034年の地域別市場規模(US$ Million)
7.4.2 地域別市場シェア、2024年・2034年(%)
7.5 アフターマーケット
7.5.1 2024-2034年地域別市場規模(US$ Million)
7.5.2 地域別市場シェア、2024年・2034年(%)
8 航空機用コンピュータ市場分析:用途別
8.1 主要な調査結果
8.2 アプリケーションセグメント 市場魅力度指数
8.3 航空機用コンピュータの用途別市場規模推定と予測
8.4 業務用
8.4.1 2024〜2034年の地域別市場規模(US$ Million)
8.4.2 地域別市場シェア、2024年・2034年(%)
8.5 軍用
8.5.1 2024年~2034年の地域別市場規模(US$ Million)
8.5.2 地域別市場シェア、2024年・2034年(%)
8.6 準軍事
8.6.1 2024~2034年の地域別市場規模(US$ Million)
8.6.2 地域別市場シェア、2024年・2034年(%)
9 航空機用コンピュータ市場分析:地域別
9.1 主要な調査結果
9.2 地域別市場規模の推定と予測
10 北米の航空機用コンピュータ市場分析
10.1 主要な調査結果
10.2 北米の航空機用コンピュータ市場魅力度指数
10.3 北米の航空機用コンピュータ市場:国別、2024年、2029年、2034年(US$ Million)
10.4 北米の航空機用コンピュータ市場規模推定と予測:国別
10.5 北米の航空機用コンピュータ市場規模推定と予測:タイプ別
10.6 北米の航空機用コンピュータ市場規模推定と予測:プラットフォーム別
10.7 北米の航空機用コンピュータ市場規模推定と予測:コンポーネント別
10.8 北米の航空機用コンピュータ市場規模推定と予測:エンドユーザー別
10.9 北米の航空機用コンピュータ市場規模推定と用途別予測
10.10 アメリカの航空機用コンピューター市場分析
10.11 カナダの航空機用コンピューター市場分析
11 欧州の航空機用コンピュータ市場分析
11.1 主要な調査結果
11.2 欧州の航空機用コンピュータ市場魅力度指数
11.3 欧州の航空機用コンピュータ国別市場、2024年、2029年、2034年(US$ Million)
11.4 欧州の航空機用コンピュータ市場規模推定と予測:国別
11.5 欧州の航空機用コンピュータ市場規模推定と予測:タイプ別
11.6 欧州の航空機用コンピュータ市場規模推定と予測:プラットフォーム別
11.7 欧州の航空機用コンピュータ市場規模推定と予測:コンポーネント別
11.8 欧州の航空機用コンピュータ市場規模推定と予測:エンドユーザー別
11.9 欧州の航空機用コンピュータ市場規模推定と予測:用途別
11.10 ドイツの航空機用コンピュータ市場分析
11.11 イギリスの航空機用コンピュータ市場分析
11.12 フランスの航空機用コンピュータ市場分析
11.13 イタリアの航空機用コンピュータ市場分析
11.14 スペインの航空機用コンピュータ市場分析
11.15 その他の欧州の航空機用コンピュータ市場分析
12 アジア太平洋地域の航空機用コンピュータ市場分析
12.1 主要な調査結果
12.2 アジア太平洋地域の航空機用コンピュータ市場魅力度指数
12.3 アジア太平洋地域の航空機用コンピュータ国別市場:2024年、2029年、2034年(US$ Million)
12.4 アジア太平洋地域の航空機用コンピュータ市場規模推定と予測:国別
12.5 アジア太平洋地域の航空機用コンピュータ市場規模推定と予測:タイプ別
12.6 アジア太平洋地域の航空機用コンピュータ市場規模推定と予測:プラットフォーム別
12.7 アジア太平洋地域の航空機用コンピュータ市場規模推定と予測:コンポーネント別
12.8 アジア太平洋地域の航空機用コンピュータ市場規模推定と予測:エンドユーザー別
12.9 アジア太平洋地域の航空機用コンピュータ市場規模推定と予測:用途別
12.10 中国の航空機用コンピュータ市場分析
12.11 インドの航空機用コンピュータ市場分析
12.12 日本の航空機コンピュータ市場分析
12.13 韓国の航空機用コンピューター市場分析
12.14 オーストラリアの航空機用コンピュータ市場分析
12.15 その他のアジア太平洋地域の航空機用コンピュータ市場分析
13 中東・アフリカの航空機用コンピュータ市場分析
13.1 主要な調査結果
13.2 中東・アフリカの航空機用コンピュータ市場魅力度指数
13.3 中東・アフリカの航空機用コンピュータの国別市場、2024年、2029年、2034年(US$ Million)
13.4 中東・アフリカの航空機用コンピュータ市場規模推定と予測:国別
13.5 中東・アフリカの航空機用コンピュータ市場規模推定と予測:タイプ別
13.6 中東・アフリカの航空機用コンピュータ市場規模推定と予測:プラットフォーム別
13.7 中東・アフリカの航空機用コンピュータ市場規模推定と予測:コンポーネント別
13.8 中東・アフリカの航空機用コンピュータ市場規模推定と予測:エンドユーザー別
13.9 中東・アフリカの航空機用コンピュータ市場規模推定と予測:用途別
13.10 GCCの航空機用コンピュータ市場分析
13.11 南アフリカの航空機用コンピュータ市場分析
13.12 その他の中東・アフリカ地域の航空機用コンピュータ市場分析
14 ラテンアメリカの航空機用コンピュータ市場分析
14.1 主要な調査結果
14.2 ラテンアメリカの航空機用コンピュータ市場魅力度指数
14.3 ラテンアメリカの航空機用コンピュータ市場規模推定と予測:国別
14.4 ラテンアメリカの航空機用コンピュータ市場規模推定と予測:タイプ別
14.5 ラテンアメリカの航空機用コンピュータ市場規模推定と予測:プラットフォーム別
14.6 ラテンアメリカの航空機用コンピュータ市場規模推定と予測:コンポーネント別
14.7 ラテンアメリカの航空機用コンピュータ市場規模推定と予測:エンドユーザー別
14.8 ラテンアメリカの航空機用コンピュータ市場規模推定と予測:用途別
14.9 ブラジルの航空機用コンピューター市場分析
14.10 メキシコの航空機用コンピューター市場分析
14.11 その他のラテンアメリカの航空機用コンピュータ市場の分析
15 会社概要
15.1 競争環境
15.2 戦略的展望
15.3 Honeywell International Inc
15.3.1 会社概要
15.3.2 会社概要
15.3.3 財務分析
15.3.3.1 純収入、2019-2023年
15.3.3.2 事業セグメントの市場シェア(2023年
15.3.3.3 航空宇宙セグメントの市場シェア(2023年
15.3.3.4 ハネウェル・ビルディング・テクノロジーズ・セグメント市場シェア(2023年
15.3.3.5 機能材料・技術セグメントの市場シェア(2023年
15.3.3.6 安全性と生産性ソリューションセグメントの市場シェア、2023年
15.3.4 製品ベンチマーク
15.3.5 戦略的展望
15.3.6 SWOT分析
15.4 Thales Group
15.4.1 会社概要
15.4.2 会社概要
15.4.3 財務分析
15.4.3.1 純収入、2019-2023年
15.4.3.2 地域別市場シェア(2023年
15.4.3.3 事業セグメント市場シェア(2023年
15.4.4 製品ベンチマーク
15.4.5 戦略的展望
15.4.6 SWOT分析
15.5 BAE Systems plc
15.5.1 会社概要
15.5.2 会社概要
15.5.3 財務分析
15.5.3.1 純収入、2019-2023年
15.5.3.2 地域別市場シェア(2023年
15.5.3.3 事業セグメント市場シェア(2023年
15.5.4 製品ベンチマーク
15.5.5 戦略的展望
15.5.6 SWOT分析
15.6 Raytheon Technologies Corporation
15.6.1 会社概要
15.6.2 会社概要
15.6.3 財務分析
15.6.3.1 純収入、2019年~2023年
15.6.3.2 地域別市場シェア(2023年
15.6.3.3 事業セグメント市場シェア(2023年
15.6.4 製品ベンチマーク
15.6.5 戦略的展望
15.6.6 SWOT分析
15.7 Curtiss-Wright Corporation
15.7.1 会社概要
15.7.2 会社概要
15.7.3 財務分析
15.7.3.1 純収入、2019-2023年
15.7.3.2 事業セグメント市場シェア、2023年
15.7.4 製品ベンチマーク
15.7.5 戦略的展望
15.7.6 SWOT分析
15.8 Elbit Systems Ltd.
15.8.1 会社概要
15.8.2 会社概要
15.8.3 財務分析
15.8.3.1 純収入、2019年~2023年
15.8.3.2 地域別市場シェア、2023年
15.8.3.3 事業セグメント市場シェア(2023年
15.8.4 製品ベンチマーク
15.8.5 戦略的展望
15.8.6 SWOT分析
15.9 L3Harris Technologies Inc.
15.9.1 会社概要
15.9.2 会社概要
15.9.3 財務分析
15.9.3.1 純収入、2019-2023年
15.9.3.2 事業セグメント市場シェア(2023年
15.9.3.3 地域別市場シェア(2023年
15.9.3.4 事業セグメント市場シェア、2023年
15.9.4 製品ベンチマーク
15.9.5 戦略的展望
15.9.6 SWOT分析
15.10 Northrop Grumman Corporation
15.10.1 会社概要
15.10.2 会社概要
15.10.3 財務分析
15.10.3.1 純収入、2019年~2023年
15.10.3.2 顧客市場シェア(2023年
15.10.3.3 セグメント市場シェア、2023年
15.10.3.4 事業セグメント市場シェア(2023年
15.10.4 製品ベンチマーク
15.10.5 戦略的展望
15.10.6 SWOT分析
15.11 Leonardo S.p.A.
15.11.1 会社概要
15.11.2 会社概要
15.11.3 財務分析
15.11.3.1 純収入、2019-2023年
15.11.3.2 地域別市場シェア(2023年
15.11.3.3 事業セグメントの市場シェア(2023年
15.11.4 製品ベンチマーク
15.11.5 戦略的展望
15.11.6 SWOT分析
15.12 General Dynamics Corporation
15.12.1 会社概要
15.12.2 会社概要
15.12.3 財務分析
15.12.3.1 純収入、2019年~2023年
15.12.3.2 セグメント市場シェア、2023年
15.12.3.3 地域別市場シェア(2023年
15.12.3.4 事業セグメント市場シェア、2023年
15.12.4 製品ベンチマーク
15.12.5 戦略的展望
15.13 Teledyne Technologies Incorporated
15.13.1 会社概要
15.13.2 会社概要
15.13.3 財務分析
15.13.3.1 純収入、2019-2023年
15.13.3.2 地域別市場シェア(2023年
15.13.3.3 事業セグメント市場シェア(2023年
15.13.4 製品ベンチマーク
15.13.5 戦略的展望
15.14 Cobham Limited
15.14.1 会社概要
15.14.2 会社概要
15.14.3 製品ベンチマーク
15.15 Safran Electronics & Defence
15.15.1 会社概要
15.15.2 会社概要
15.15.3 財務分析
15.15.3.1 純売上高、2019年~2023年
15.15.3.2 事業セグメントの市場シェア(2023年
15.15.4 製品ベンチマーク
15.15.5 戦略的展望
15.16 Parker Meggitt
15.16.1 会社概要
15.16.2 会社概要
15.16.3 製品ベンチマーク
15.16.4 戦略的展望
15.17 General Electric Company
15.17.1 会社概要
15.17.2 会社概要
15.17.3 財務分析
15.17.3.1 純収入、2019-2023年
15.17.3.2 事業セグメント市場シェア(2023年
15.17.4 製品ベンチマーク
15.17.5 戦略的展望
16 結論と提言
16.1 Visiongainからの結びの言葉
16.2 市場プレイヤーへの提言
ページTOPに戻る
図表リスト
表の一覧
表1 航空機用コンピュータ市場のスナップショット、2024年〜2034年(百万米ドル、CAGR)
表2 航空機用コンピュータのタイプ別市場予測、2024〜2034年(百万米ドル、AGR%、CAGR)
表3 フライトコントロールセグメントの地域別市場予測、2024〜2034年(百万米ドル、AGR%、CAGR)
表4 エンジン制御機器セグメントの地域別市場予測、2024-2034年(百万米ドル、AGR%、CAGR)
表5 フライトマネジメントコンピュータセグメントの地域別市場予測、2024-2034年(百万米ドル、AGR%、CAGR)
表6 ミッションコンピューターセグメント地域別市場予測、2024-2034年(百万米ドル、AGR%、CAGR)
表7 ユーティリティ制御機器セグメントの地域別市場予測、2024-2034年(百万米ドル、AGR%、CAGR)
表8 航空機用コンピュータのプラットフォーム別市場予測、2024〜2034年(百万米ドル、AGR%、CAGR)
表9 固定翼セグメントの地域別市場予測、2024-2034年(百万米ドル、AGR%、CAGR)
表10 回転翼セグメントの地域別市場予測、2024~2034年(百万米ドル、AGR%、CAGR)
表11 UAVsセグメントの地域別市場予測、2024-2034年(百万米ドル、AGR%、CAGR)
表12 航空機用コンピュータのコンポーネント別市場予測、2024-2034年(百万米ドル、AGR%、CAGR)
表13 ハードウェアセグメントの地域別市場予測:2024-2034年(百万米ドル、AGR%、CAGR)
表14 ソフトウェアセグメントの地域別市場予測、2024-2034年 (百万米ドル、AGR%、CAGR%)
表15 航空機用コンピュータのエンドユーザー別市場予測、2024-2034年(百万米ドル、AGR%、CAGR)
表16 OEMセグメントの地域別市場予測、2024〜2034年(百万米ドル、AGR%、CAGR)
表17 アフターマーケットセグメントの地域別市場予測、2024-2034年 (百万米ドル、AGR%、CAGR%)
表18 航空機用コンピュータの用途別市場予測、2024-2034年 (百万米ドル、AGR%、CAGR%)
表19 商用セグメントの地域別市場予測:2024-2034年(百万米ドル、AGR%、CAGR)
表20 軍用セグメントの地域別市場予測、2024-2034年(百万米ドル、AGR%、CAGR)
表21 挺身隊セグメントの地域別市場予測、2024-2034年 (百万米ドル、AGR%、CAGR%)
表22 航空機用コンピュータの地域別市場予測、2024-2034年 (百万米ドル、AGR%、CAGR%)
表23 北米の航空機用コンピュータの国別市場予測、2024-2034年 (百万米ドル、AGR%、CAGR%)
表24 北米の航空機用コンピュータのタイプ別市場予測、2024-2034年 (百万米ドル、AGR%、CAGR%)
表25 北米の航空機用コンピュータ市場の予測:プラットフォーム別、2024-2034年(百万米ドル、AGR%、CAGR)
表26 北米の航空機用コンピュータ市場の予測:コンポーネント別、2024-2034年(百万米ドル、AGR%、CAGR)
表27 北米の航空機用コンピュータ市場の予測:エンドユーザー別、2024-2034年(百万米ドル、AGR%、CAGR)
表28 北米の航空機用コンピュータ市場の用途別予測、2024〜2034年 (百万米ドル、AGR%、CAGR%)
表29 米国の航空機用コンピュータ市場の予測、2024-2034年 (百万米ドル、AGR%、CAGR%)
表30 カナダの航空機用コンピュータの市場予測、2024-2034年 (百万米ドル、AGR%、CAGR%)
表31 欧州の航空機用コンピュータの国別市場予測、2024-2034年 (百万米ドル、AGR%、CAGR%)
表32 航空機用コンピュータのヨーロッパ市場タイプ別予測、2024-2034年 (百万米ドル、AGR%、CAGR%)
表33 欧州の航空機用コンピュータの市場予測:プラットフォーム別、2024〜2034年(百万米ドル、AGR%、CAGR)
表34 欧州の航空機用コンピュータの市場予測:コンポーネント別、2024〜2034年(百万米ドル、AGR%、CAGR)
表35 欧州の航空機用コンピュータの市場予測:エンドユーザー別、2024〜2034年(百万米ドル、AGR%、CAGR)
表36 欧州の航空機用コンピュータの用途別市場予測、2024〜2034年 (百万米ドル、AGR%、CAGR%)
表37 ドイツの航空機用コンピュータの市場予測、2024-2034年 (百万米ドル、AGR%、CAGR%)
表 38 イギリスの航空機用コンピュータの市場予測、2024-2034 年 (100 万米ドル、AGR%、CAGR)
表 39 フランスの航空機用コンピュータの市場予測、2024~2034年 (百万米ドル、AGR%、CAGR%)
表40 イタリア航空機用コンピュータの市場予測、2024-2034年 (百万米ドル、AGR%、CAGR%)
表41 スペインの航空機用コンピュータの市場予測、2024-2034年 (百万米ドル、AGR%、CAGR%)
表42 その他のヨーロッパの航空機用コンピュータの市場予測、2024-2034年 (百万米ドル、AGR%、CAGR%)
表43 アジア太平洋地域の航空機用コンピュータの国別市場予測、2024-2034年 (百万米ドル、AGR%、CAGR%)
表44 アジア太平洋地域の航空機用コンピュータのタイプ別市場予測、2024〜2034年 (百万米ドル、AGR%、CAGR%)
表45 アジア太平洋地域の航空機用コンピュータのプラットフォーム別市場予測、2024〜2034年(百万米ドル、AGR%、CAGR)
表46 アジア太平洋地域の航空機用コンピュータの市場予測:コンポーネント別(百万米ドル、AGR%、CAGR)
表47 アジア太平洋地域の航空機用コンピュータのエンドユーザー別市場予測:2024-2034年(百万米ドル、AGR%、CAGR)
表48 アジア太平洋地域の航空機用コンピュータの用途別市場予測、2024-2034年 (百万米ドル、AGR%、CAGR%)
表49 中国の航空機用コンピュータ市場の予測、2024-2034年 (百万米ドル、AGR%、CAGR%)
表50 インド航空機用コンピュータの市場予測、2024-2034年 (百万米ドル、AGR%、CAGR%)
表51 日本航空機用コンピュータの市場予測、2024-2034年 (百万米ドル、AGR%、CAGR%)
表 52 韓国の航空機用コンピュータの市場予測、2024~2034年 (百万米ドル、AGR%、CAGR%)
表 53 オーストラリアの航空機用コンピュータの市場予測、2024~2034年 (百万米ドル、AGR%、CAGR%)
表 54 その他のアジア太平洋地域の航空機用コンピュータの市場予測、2024-2034 年 (100 万米ドル、AGR%、CAGR)
表 55 中東・アフリカの航空機用コンピュータの国別市場予測、2024~2034年 (百万米ドル、AGR%、CAGR%)
表56 中東・アフリカ航空機用コンピュータのタイプ別市場予測、2024-2034年 (百万米ドル、AGR%、CAGR%)
表57 中東・アフリカ航空機用コンピュータのプラットフォーム別市場予測、2024~2034年 (百万米ドル、AGR%、CAGR%)
表58 中東・アフリカの航空機用コンピュータのコンポーネント別市場予測、2024~2034年 (百万米ドル、AGR%、CAGR%)
表59 中東・アフリカ航空機用コンピュータのエンドユーザー別市場予測 2024-2034 (百万米ドル、AGR%、CAGR%)
表60 中東・アフリカ航空機用コンピュータの用途別市場予測、2024-2034年 (百万米ドル、AGR%、CAGR)
表61 GCCの航空機用コンピュータの市場予測、2024-2034年 (百万米ドル、AGR%、CAGR%)
表62 南アフリカの航空機用コンピュータの市場予測、2024~2034年 (百万米ドル、AGR%、CAGR%)
表 63 中東・アフリカの残りの地域の航空機用コンピュータの市場予測、2024~2034年 (百万米ドル、AGR%、CAGR)
表64 中南米の航空機用コンピュータの国別市場予測、2024-2034年 (百万米ドル、AGR%、CAGR%)
表65 中南米の航空機用コンピュータのタイプ別市場予測、2024〜2034年 (百万米ドル、AGR%、CAGR%)
表66 中南米の航空機用コンピュータのプラットフォーム別市場予測、2024〜2034年 (百万米ドル、AGR%、CAGR%)
表67 中南米の航空機用コンピュータのコンポーネント別市場予測、2024〜2034年 (百万米ドル、AGR%、CAGR%)
表68 中南米の航空機用コンピュータの市場予測:エンドユーザー別(2024〜2034年、100万米ドル、AGR%、CAGR)
表69 中南米の航空機用コンピュータの用途別市場予測、2024〜2034年 (百万米ドル、AGR%、CAGR%)
表70 ブラジル航空機用コンピュータの市場予測、2024-2034年 (百万米ドル、AGR%、CAGR%)
表71 メキシコ航空機用コンピュータの市場予測、2024-2034年 (百万米ドル、AGR%、CAGR%)
表72 その他のラテンアメリカの航空機用コンピュータ市場の予測、2024-2034年 (百万米ドル、AGR%、CAGR%)
表 73 航空機コンピュータ産業:戦略的展望
表 74 ハネウェル・インターナショナル主な詳細(CEO, 本社, 売上高, 設立, 従業員数, 企業タイプ, ウェブサイト, 事業セグメント)
表 75 ハネウェル・インターナショナルInc:製品ベンチマーク
表 76 ハネウェル・インターナショナルInc:戦略的展望
表77 タレスグループ主な詳細(CEO, 本社, 売上高, 設立, 従業員数, 企業タイプ, ウェブサイト, 事業セグメント)
表 78 タレスグループ製品ベンチマーク
表79 タレスグループ戦略的展望
表 80 BAE Systems plc:主な詳細(CEO, 本社, 売上高, 設立, 従業員数, 企業タイプ, ウェブサイト, 事業セグメント)
表 81 BAE Systems plc:製品ベンチマーク
表82 BAEシステムズplc:戦略的展望
表83 レイセオン・テクノロジーズ・コーポレーション主な詳細 (CEO, 本社, 売上高, 設立, 従業員数, 企業タイプ, ウェブサイト, 事業セグメント)
表 84 レイセオン・テクノロジーズ・コーポレーション製品ベンチマーク
表 85 レイセオン・テクノロジーズ・コーポレーション戦略的展望
表 86 カーティスライトコーポレーション主な詳細(CEO, 本社, 売上高, 設立, 従業員数, 企業タイプ, ウェブサイト, 事業セグメント)
表 87 カーティスライト コーポレーション製品ベンチマーク
表 88 カーティスライト コーポレーション戦略的展望
表89 エルビット・システムズ社: 主要詳細(CEO, 本社, 売上高, 設立, 従業員数, 企業タイプ, ウェブサイト, 事業セグメント)
表 90 エルビット・システムズ製品ベンチマーク
表91 エルビット・システムズ:戦略的展望
表 92 L3Harris Technologies Inc:主な詳細(CEO, 本社, 売上高, 設立, 従業員数, 企業タイプ, ウェブサイト, 事業セグメント)
表 93 L3Harris Technologies Inc:製品ベンチマーク
表94 L3Harris Technologies Inc:戦略的展望
表95 ノースロップ・グラマン・コーポレーション主な詳細(CEO, 本社, 売上高, 設立, 従業員数, 企業タイプ, ウェブサイト, 事業セグメント)
表 96 ノースロップ・グラマン・コーポレーション製品ベンチマーク
表 97 ノースロップ・グラマン・コーポレーション戦略的展望
表98 Leonardo S.p.A.:主要詳細(CEO、本社、売上高、設立、従業員数、企業タイプ、ウェブサイト、事業セグメント)
表99 Leonardo S.p.A.: 製品ベンチマーク
表100 レオナルドS.p.A.: 戦略的展望
表 101 ゼネラル・ダイナミクス・コーポレーション主な詳細(CEO, 本社, 売上高, 設立, 従業員数, 企業タイプ, ウェブサイト, 事業セグメント)
表 102 ゼネラルダイナミクス社製品ベンチマーク
表 103 ゼネラルダイナミクス社戦略的展望
表104 Teledyne Technologies Incorporated:主な詳細(CEO, 本社, 売上高, 設立, 従業員数, 企業タイプ, ウェブサイト, 事業セグメント)
表105 Teledyne Technologies Incorporated:製品ベンチマーク
表106 テレダイン・テクノロジーズ・インコーポレーテッド:戦略的展望戦略的展望
表 107 コブハム社主な詳細(CEO, 本社, 売上高, 設立, 従業員数, 企業タイプ, ウェブサイト, 事業セグメント)
表 108 コブハム社製品ベンチマーク
表109 サフラン・エレクトロニクス&ディフェンス主な詳細(CEO, 本社, 売上高, 設立, 従業員数, 企業タイプ, ウェブサイト, 事業セグメント)
表110 サフラン・エレクトロニクス&ディフェンス製品ベンチマーク
表111 サフラン・エレクトロニクス&ディフェンス戦略的展望
表112 パーカー・メジット:主要詳細(CEO、本社、売上高、設立、従業員数、企業タイプ、ウェブサイト、事業セグメント)
表 113 パーカー・メジット製品ベンチマーク
表114 パーカー・メジット:戦略的展望
表115 ゼネラル・エレクトリック社主な詳細(CEO、本社、売上高、設立、従業員数、会社タイプ、ウェブサイト、事業セグメント)
表 116 ゼネラル・エレクトリック社製品ベンチマーク
表 117 ゼネラル・エレクトリック社戦略的展望
図の一覧
図1 航空機用コンピュータ市場のセグメント化
図2 航空機用コンピュータの用途別市場:市場魅力度指数
図3 航空機用コンピューターの表示別市場:市場魅力度指数航空機用コンピュータ市場:市場魅力度指数
図4 航空機用コンピュータのタイプ別市場:市場魅力度指数航空機用コンピュータ市場:市場魅力度指数
図5 航空機用コンピュータのプラットフォーム別市場:市場魅力度指数航空機用コンピュータ市場:市場魅力度指数
図6 航空機用コンピュータの表示別市場:市場魅力度指数航空機用コンピュータ市場:市場魅力度指数
図7 航空機用コンピュータ市場:地域別魅力度指数
図8 航空機用コンピュータ市場市場ダイナミクス
図9 航空機用コンピュータ市場:市場ダイナミクスインパクト分析
図 10 2020 年から 2023 年までの世界のエアバス航空機納入数
図 11 2023 年から 2042 年までの世界の民間航空機納入予測数(単位)
図 12 航空機用コンピュータ産業:サプライチェーン分析
図 13 航空機用コンピュータ市場:ポーターのファイブフォース分析
図 14 航空機用コンピュータ市場:PEST 分析PEST分析
図15 航空機用コンピュータ市場:タイプ別市場魅力度指数
図16 航空機用コンピュータのタイプ別市場予測、2024年~2034年 (百万米ドル、AGR %)
図17 航空機用コンピュータのタイプ別市場予測、2024年、2029年、2034年(%)
図 18 フライトコントロール・セグメントの地域別市場予測、2024~2034年 (百万米ドル、AGR %)
図 19 飛行制御機器セグメントの地域別市場予測、2024 年/2034 年(%)
図 20 エンジン制御機器セグメントの地域別市場予測、2024~2034 年 (百万米ドル、AGR)
図 21 2024-2034 年におけるエンジン制御機器セグメントの地域別市場シェア予測 (%)
図 22 フライトマネジメントコンピュータセグメントの地域別市場予測、2024~2034 年 (百万米ドル、AGR)
図 23 フライト管理コンピュータの地域別市場シェア予測、2024 年~2034 年 (%)
図 24 2024-2034 年におけるミッションコンピュータの地域別市場予測(百万米ドル、AGR)
図 25 2024-2034 地域別ミッションコンピューターセグメント市場シェア予測 (%)
図 26 ユーティリティ制御機器セグメントの地域別市場予測、2024~2034 年 (百万米ドル、AGR)
図 27 2024-2034 年ユーティリティ制御機器セグメントの地域別市場シェア予測 (%)
図28 プラットフォーム別航空機用コンピュータ市場市場魅力度指数
図 29 プラットフォーム別航空機用コンピュータ市場予測、2024~2034 年 (百万米ドル、AGR)
図30 プラットフォーム別航空機用コンピュータ市場予測:2024年、2029年、2034年(%)
図31 固定翼セグメントの地域別市場予測、2024~2034年 (百万米ドル、AGR %)
図 32 固定翼セグメントの地域別市場予測、2024 年~2034 年(%)
図 33 2024-2034 年における回転翼セグメントの地域別市場予測(百万米ドル、AGR)
図 34 2024-2034 年における回転翼セグメントの地域別市場シェア予測 (%)
図 35 2024-2034 年におけるUAVセグメントの地域別市場予測(百万米ドル、AGR)
図 36 2024-2034 年におけるUAVセグメントの地域別市場シェア予測 (%)
図 37 航空機用コンピューターのコンポーネント別市場市場魅力度指数
図 38 航空機用コンピュータのコンポーネント別市場予測、2024~2034 年 (百万米ドル、AGR)
図39 航空機用コンピュータのコンポーネント別市場予測、2024年、2029年、2034年(%)
図 40 2024-2034 年地域別ハードウェアセグメント市場予測(百万米ドル、AGR)
図 41 地域別ハードウェアセグメント市場予測、2024 年& 2034 年(%)
図 42 2024-2034 年地域別ソフトウェアセグメント市場予測(百万米ドル、AGR)
図43 2024〜2034年地域別ソフトウェアセグメント市場シェア予測(%)
図44 航空機用コンピュータ市場:エンドユーザー別市場魅力度指数
図45 航空機用コンピュータのエンドユーザー別市場予測、2024年~2034年 (百万米ドル、AGR %)
図46 エンドユーザー別航空機用コンピュータ市場予測:2024年、2029年、2034年(%)
図 47 OEM セグメントの地域別市場予測、2024~2034 年 (100 万米ドル、AGR %)
図 48 OEM セグメントの地域別市場シェア予測、2024 年&2034 年(%)
図 49 2024-2034 年地域別アフターマーケットセグメント市場予測(百万米ドル、AGR)
図 50 2024-2034 年地域別アフターマーケットセグメント市場シェア予測 (%)
図51 航空機用コンピュータの用途別市場市場魅力度指数
図 52 航空機用コンピュータの用途別市場予測、2024~2034 年 (百万米ドル、AGR)
図53 航空機用コンピュータの用途別市場予測(2024年、2029年、2034年) (%)
図 54 2024~2034年の地域別商用セグメント市場予測(百万米ドル、AGR)
図 55 地域別商用セグメント市場予測、2024年&2034年(%)
図 56 軍用セグメントの地域別市場予測、2024~2034年(百万米ドル、AGR)
図 57 軍用セグメントの地域別市場シェア予測、2024年~2034年(%)
図58 挺身隊セグメントの地域別市場展望、2024~2034年 (百万米ドル、AGR %)
図 59 挺身隊セグメントの地域別市場シェア予測、2024~2034 年(%)
図60 航空機用コンピュータの地域別市場予測(2024年、2034年) (売上高, CAGR%)
図 61 2024年、2029年、2034年の地域別航空機用コンピュータ市場シェア予測(%)
図 62 2024-2034 年の地域別航空機用コンピュータ市場予測(百万米ドル、AGR)
図 63 北米の航空機用コンピュータ市場魅力度指数
図 64 北米の航空機用コンピュータ地域別市場(2024 年、2029 年、2034 年)(百万米ドル
図 65 北米の航空機用コンピュータの国別市場予測、2024~2034 (百万米ドル、AGR %)
図 66 北米の航空機用コンピュータの国別市場占有率予測、2024 年~2034 年 (%)
図67 北米の航空機用コンピュータのタイプ別市場予測、2024~2034年 (百万米ドル、AGR %)
図68 北米の航空機用コンピュータ市場タイプ別シェア予測、2024年〜2034年 (%)
図69 北米の航空機用コンピュータ市場のプラットフォーム別予測、2024~2034年 (百万米ドル、AGR %)
図70 北米の航空機用コンピュータ市場:プラットフォーム別シェア予測、2024年〜2034年 (%)
図71 2024~2034年の北米航空機用コンピュータのコンポーネント別市場予測 (百万米ドル、AGR %)
図 72 2024-2034 コンポーネント別北米航空機用コンピュータ市場シェア予測 (%)
図73 北米の航空機用コンピュータ市場のエンドユーザー別予測、2024年~2034年 (百万米ドル、AGR %)
図 74 2024-2034 エンドユーザー別航空機用コンピュータ北米市場シェア予測 (%)
図75 北米の航空機用コンピュータ市場の用途別予測、2024年~2034年 (百万米ドル、AGR %)
図 76 北米の航空機用コンピュータの用途別市場展望、2024~2034 年 (%)
図 77 米国の航空機用コンピュータ市場の予測、2024~2034 年 (100 万米ドル、AGR %)
図 78 カナダの航空機用コンピュータの市場予測、2024~2034 年 (100 万米ドル、AGR %)
図 79 欧州の航空機用コンピュータ市場魅力度指数
図 80 欧州の航空機用コンピュータ市場(地域別)、2024 年、2029 年&2034 年(百万米ドル
図 81 航空機用コンピュータのヨーロッパ国別市場予測、2024~2034 年 (百万ドル、AGR %)
図 82 2024-2034 年の欧州航空機用コンピュータの国別市場シェア予測 (%)
図83 航空機用コンピュータのヨーロッパ市場タイプ別予測、2024~2034年 (百万米ドル、AGR %)
図84 航空機用コンピュータの欧州市場タイプ別シェア予測、2024年〜2034年 (%)
図 85 プラットフォーム別航空機用コンピュータのヨーロッパ市場予測、2024-2034 年 (100 万米ドル、AGR %)
図 86 2024-2034 年における欧州航空機用コンピュータのプラットフォーム別市場シェア予測 (%)
図 87 2024-2034 コンポーネント別航空機用コンピュータのヨーロッパ市場予測 (百万米ドル, AGR %)
図 88 2024-2034 コンポーネント別欧州航空機用コンピュータ市場シェア予測 (%)
図89 航空機用コンピュータのヨーロッパ市場予測:エンドユーザー別(2024年~2034年、百万米ドル、AGR)
図 90 2024-2034 エンドユーザー別航空機用コンピュータ市場シェア予測 (%)
図91 航空機用コンピュータのヨーロッパ市場用途別予測、2024年~2034年 (百万米ドル、AGR %)
図 92 2024-2034 年の欧州航空機用コンピュータ市場用途別シェア予測 (%)
図 93 ドイツの航空機用コンピュータの市場予測、2024~2034 年 (100 万米ドル、AGR %)
図 94 イギリスの航空機用コンピュータの市場予測、2024~2034 年 (100 万米ドル、AGR %)
図 95 フランス航空機用コンピュータの市場展望、2024~2034 年 (100 万米ドル、AGR %)
図 96 イタリア航空機用コンピュータの市場展望、2024~2034 年 (100 万米ドル、AGR %)
図 97 スペインの航空機用コンピュータの市場展望、2024~2034 年 (100 万米ドル、AGR %)
図 98 その他のヨーロッパの航空機用コンピュータ市場の予測、2024-2034 年 (100 万米ドル、AGR %)
図 99 アジア太平洋地域の航空機用コンピュータ市場魅力度指数
図 100 アジア太平洋地域の航空機用コンピュータ市場の地域別予測(2024 年、2029 年、2034 年)(百万米ドル
図101 アジア太平洋地域の航空機用コンピュータの国別市場予測、2024~2034年(百万米ドル、AGR)
図 102 アジア太平洋地域の航空機用コンピュータの国別市場占有率予測、2024年~2034年 (%)
図103 アジア太平洋地域の航空機用コンピュータのタイプ別市場予測、2024~2034年 (百万米ドル、AGR %)
図104 アジア太平洋地域の航空機用コンピュータのタイプ別市場展望、2024年~2034年 (%)
図105 アジア太平洋地域の航空機用コンピュータのプラットフォーム別市場予測、2024~2034年 (百万米ドル、AGR %)
図106 アジア太平洋地域の航空機用コンピュータのプラットフォーム別市場展望、2024年〜2034年 (%)
図107 アジア太平洋地域の航空機用コンピュータのコンポーネント別市場予測、2024年~2034年 (百万米ドル、AGR %)
図108 アジア太平洋地域の航空機用コンピュータのコンポーネント別市場予測、2024年~2034年 (%)
図109 アジア太平洋地域の航空機用コンピュータのエンドユーザー別市場予測、2024年~2034年 (百万米ドル、AGR %)
図110 アジア太平洋地域の航空機用コンピュータのエンドユーザー別市場予測、2024年~2034年 (%)
図111 アジア太平洋地域の航空機用コンピュータの用途別市場予測、2024年~2034年 (百万米ドル、AGR %)
図112 アジア太平洋地域の航空機用コンピュータ市場の用途別シェア予測、2024年~2034年 (%)
図 113 中国の航空機用コンピュータ市場の予測、2024~2034 年 (100 万米ドル、AGR %)
図 114 インド航空機用コンピュータの市場展望、2024~2034 年 (100 万米ドル、AGR %)
図 115 日本の航空機用コンピュータ市場の予測、2024-2034 年 (100 万米ドル、AGR %)
図 116 韓国の航空機用コンピュータの市場展望、2024~2034 年 (100 万米ドル、AGR %)
図 117 オーストラリアの航空機用コンピュータの市場展望、2024~2034 年 (100 万米ドル、AGR %)
図 118 その他のアジア太平洋地域の航空機用コンピュータ市場の予測、2024-2034 年 (100 万米ドル、AGR %)
図 119 中東・アフリカの航空機用コンピュータ市場魅力度指数
図 120 中東・アフリカの地域別航空機用コンピュータ市場(2024 年、2029 年、2034 年)(百万米ドル
図 121 中東・アフリカ航空機用コンピュータの国別市場予測(2024~2034 年)(百万ドル、AGR
図 122 中東・アフリカの国別航空機用コンピュータ市場予測、2024~2034 年 (%)
図 123 中東・アフリカの航空機用コンピュータのタイプ別市場展望、2024~2034 年 (100 万米ドル、AGR %)
図 124 中東・アフリカの航空機用コンピュータのタイプ別市場展望、2024~2034 年 (%)
図 125 中東・アフリカの航空機用コンピュータのプラットフォーム別市場予測、2024~2034 年 (100 万米ドル、AGR %)
図 126 2024-2034 年における中東・アフリカの航空機用コンピュータのプラットフォーム別 市場シェア予測(%)
図 127 2024-2034 コンポーネント別中東・アフリカ航空機用コンピュータ市場予測 (百万米ドル、AGR)
図 128 2024-2034 コンポーネント別中東・アフリカ航空機用コンピュータ市場シェア予測 (%)
図 129 中東・アフリカ航空機用コンピュータのエンドユーザー別市場予測、2024~2034 年 (100 万米ドル、AGR %)
図 130 2024-2034 エンドユーザー別中東・アフリカ航空機用コンピュータ市場シェア予測 (%)
図131 中東・アフリカ航空機用コンピュータの用途別市場予測、2024~2034年 (百万米ドル、AGR %)
図 132 2024-2034 年の中東・アフリカ航空機用コンピュータ市場用途別シェア予測 (%)
図 133 GCC 航空機用コンピュータの市場予測、2024~2034 年 (100 万米ドル、AGR %)
図 134 南アフリカの航空機用コンピュータの市場予測、2024~2034 年 (100 万米ドル、AGR %)
図 135 中東・アフリカの残りの地域の航空機用コンピュータの市場予測、2024~2034 年 (100 万米ドル、AGR %)
図 136 中南米の航空機用コンピュータ市場魅力度指数
図 137 中南米の航空機用コンピュータの国別市場予測、2024~2034 年(百万米ドル、AGR)
図 138 中南米の航空機用コンピュータの国別市場シェア予測(2024 年/2034 年)
図139 中南米の航空機用コンピュータのタイプ別市場予測、2024~2034年 (百万米ドル、AGR %)
図140 中南米の航空機用コンピュータのタイプ別市場シェア予測、2024年〜2034年 (%)
図141 中南米の航空機用コンピュータのプラットフォーム別市場予測、2024~2034年 (百万米ドル、AGR %)
図142 中南米の航空機用コンピュータ市場:プラットフォーム別シェア予測、2024年〜2034年 (%)
図143 中南米の航空機用コンピュータのコンポーネント別市場予測、2024~2034年 (百万米ドル、AGR %)
図 144 2024-2034 コンポーネント別中南米航空機用コンピュータ市場シェア予測 (%)
図 145 中南米の航空機用コンピュータ市場のエンドユーザー別予測、2024~2034年 (百万米ドル、AGR %)
図 146 中南米の航空機用コンピュータのエンドユーザー別市場展望、2024~2034 年 (%)
図147 中南米の航空機用コンピュータの用途別市場予測、2024~2034年 (百万米ドル、AGR %)
図 148 中南米の航空機用コンピュータの用途別市場展望、2024~2034 年 (%)
図 149 ブラジルの航空機用コンピュータの市場予測、2024~2034 年 (100 万米ドル、AGR %)
図 150 メキシコの航空機用コンピュータの市場予測、2024~2034 年 (100 万米ドル、AGR %)
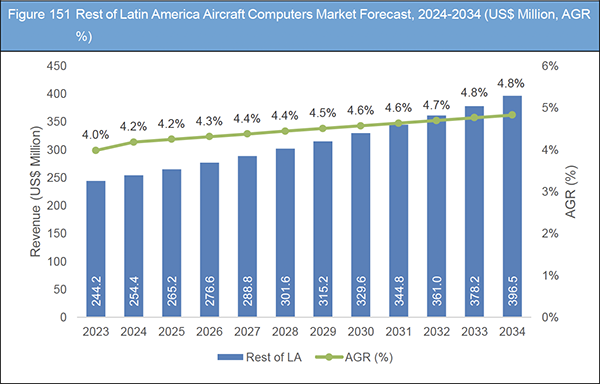
図 151 その他のラテンアメリカの航空機用コンピュータ市場の予測、2024-2034 (百万米ドル、AGR %)
図 152 ハネウェル・インターナショナル純収入、2019年~2023年(百万米ドル、AGR)
図 153 ハネウェル・インターナショナル Inc:事業セグメント市場シェア、2023 年
図 154 ハネウェル・インターナショナルInc:航空宇宙セグメントの市場シェア(2023 年
図 155 ハネウェル・インターナショナルInc:ハネウェル・ビルテクノロジーズセグメント市場シェア、2023 年
図 156 ハネウェル・インターナショナルInc:性能材料および技術セグメントの市場シェア、2023 年
図 157 ハネウェル・インターナショナルInc:安全性と生産性ソリューションセグメント市場シェア、2023 年
図 158 ハネウェル・インターナショナルInc:SWOT 分析
図 159 タレス・グループ純収入、2019年~2023年(百万米ドル、AGR)
図 160 タレスグループ地域別市場シェア(2023年
図 161 タレスグループ:事業セグメント別市場シェア(2023年
図 162 タレスグループSWOT分析
図 163 BAE Systems plc:純収入, 2019-2023 (百万米ドル, AGR%)
図 164 BAE Systems plc:地域別市場シェア(2023 年
図 165 BAE Systems plc:事業セグメント別市場シェア(2023
図 166 BAE システムズ plc:SWOT 分析
図 167 レイセオン・テクノロジーズ・コーポレーション純収入、2019 年~2023 年(百万米ドル、AGR)
図 168 レイセオン・テクノロジーズ・コーポレーション地域別市場シェア(2023 年
図 169 レイセオン・テクノロジーズ・コーポレーション事業セグメント別市場シェア(2023 年
図 170 レイセオン・テクノロジーズ・コーポレーションSWOT 分析
図 171 カーティス・ライト・コーポレーション純収入、2019 年~2023 年(百万米ドル、AGR)
図 172 カーティス・ライト社:事業セグメント別市場シェア(2023 年
図 173 カーティス・ライト社:SWOT 分析
図 174 エルビット・システムズ社:純収入、2019 年~2023 年(百万米ドル、AGR)
図 175 Elbit Systems Ltd.:地域別市場シェア(2023年
図 176 エルビット・システムズ社:事業セグメント別市場シェア(2023年
図 177 エルビット・システムズ社:SWOT 分析
図 178 L3Harris Technologies Inc:純収入、2019 年~2023 年(百万米ドル、AGR)
図 179 L3Harris Technologies Inc:事業セグメントの市場シェア(2023 年
図 180 L3Harris Technologies Inc:地域別市場シェア、2023年
図 181 L3Harris Technologies Inc:事業セグメント別市場シェア、2023 年
図 182 L3Harris Technologies Inc:SWOT 分析
図 183 ノースロップ・グラマン・コーポレーション純収入、2019年~2023年(百万米ドル、AGR)
図 184 ノースロップ・グラマン・コーポレーション顧客市場シェア(2023年
図 185 ノースロップ・グラマン・コーポレーションセグメント別市場シェア(2023 年
図 186 ノースロップ・グラマン・コーポレーション:事業セグメント市場シェア、2023 年
図 187 ノースロップ・グラマン・コーポレーション:SWOT 分析
図 188 レオナルド S.p.A.:純収入、2019 年~2023 年(百万米ドル、AGR)
図 189 レオナルド S.p.A.:地域別市場シェア、2023 年
図190 レオナルドS.p.A.:事業セグメント別市場シェア(2023年
図 191 レオナルド S.p.A.:SWOT分析
図 192 ゼネラル・ダイナミクス・コーポレーション純収入、2019年-2023年(百万米ドル、AGR)
図 193 ゼネラル・ダイナミクス・コーポレーションセグメント別市場シェア(2023年
図 194 ゼネラル・ダイナミクス・コーポレーション地域別市場シェア(2023 年
図 195 ゼネラル・ダイナミクス・コーポレーション事業セグメント別市場シェア、2023 年
図 196 Teledyne Technologies Incorporated:純収入、2019年~2023年(百万米ドル、AGR)
図 197 Teledyne Technologies Incorporated:地域別市場シェア、2023年
図 198 Teledyne Technologies Incorporated:事業セグメント別市場シェア、2023 年
図 199 サフラン・エレクトロニクス&ディフェンス純収入、2019 年~2023 年(百万米ドル、AGR)
図 200 サフラン・エレクトロニクス&ディフェンス事業セグメント別市場シェア、2023 年
図 201 ゼネラル・エレクトリック社純収入、2019年~2023年(百万米ドル、AGR)
図 202 ゼネラル・エレクトリック社事業セグメント別市場シェア(2023 年
ページTOPに戻る
Summary
Report Details
The Aircraft Computers Market Report 2024-2034: This report will prove invaluable to leading firms striving for new revenue pockets if they wish to better understand the industry and its underlying dynamics. It will be useful for companies that would like to expand into different industries or to expand their existing operations in a new region.
Increasing Adaptation of UAVs to Spur Market Growth
The increasing adaptation of Unmanned Aerial Vehicles (UAVs) represents a strategic opportunity for the aircraft computer market. UAVs, commonly known as drones, are being deployed across various sectors, including defence, agriculture, surveillance, and logistics. Advanced aircraft computers play a pivotal role in the guidance, navigation, and control systems of UAVs, ensuring precise and autonomous operation. As the demand for UAVs continues to rise, driven by their diverse applications, the aircraft computer market can leverage this trend by providing specialized computing solutions tailored to the unique requirements of unmanned systems. This opens avenues for innovation, creating a niche within the market and contributing to the broader expansion of the aircraft computer industry.
Increasing Risk from Cyberattacks Coupled with Stringent Aviation Standards to Hamper Market Growth
The aviation industry’s growing reliance on advanced digital technologies and interconnected systems exposes it to an elevated risk of cyberattacks, acting as a significant restraining factor for market growth. As aircraft systems become more sophisticated and interconnected, they also become more vulnerable to cybersecurity threats. The increasing digitization of avionics and the incorporation of connectivity features, such as in-flight Wi-Fi and data sharing between aircraft and ground systems, create potential entry points for malicious actors.
Stringent and evolving aviation standards and regulations represent a restraining factor for the aircraft computers market. The aviation industry operates under strict safety and compliance standards imposed by regulatory bodies such as the Federal Aviation Administration (FAA) and the European Union Aviation Safety Agency (EASA). While these standards are essential for ensuring the safety and reliability of aircraft systems, they also pose challenges for manufacturers and operators.
What Questions Should You Ask before Buying a Market Research Report?
-
How is the aircraft computers market evolving?
-
What is driving and restraining the aircraft computers market?
-
How will each aircraft computers submarket segment grow over the forecast period and how much revenue will these submarkets account for in 2034?
-
How will the market shares for each aircraft computers submarket develop from 2024 to 2034?
-
What will be the main driver for the overall market from 2024 to 2034?
-
Will leading aircraft computers markets broadly follow the macroeconomic dynamics, or will individual national markets outperform others?
-
How will the market shares of the national markets change by 2034 and which geographical region will lead the market in 2034?
-
Who are the leading players and what are their prospects over the forecast period?
-
What are the aircraft computers projects for these leading companies?
-
How will the industry evolve during the period between 2024 and 2034? What are the implications of aircraft computers projects taking place now and over the next 10 years?
-
Is there a greater need for product commercialisation to further scale the aircraft computers market?
-
Where is the aircraft computers market heading and how can you ensure you are at the forefront of the market?
-
What are the best investment options for new product and service lines?
-
What are the key prospects for moving companies into a new growth path and C-suite?
You need to discover how this will impact the aircraft computers market today, and over the next 10 years:
-
Our 335-page report provides 117 tables and 202 charts/graphs exclusively to you.
-
The report highlights key lucrative areas in the industry so you can target them – NOW.
-
It contains in-depth analysis of global, regional and national sales and growth.
-
It highlights for you the key successful trends, changes and revenue projections made by your competitors.
Forecasts to 2034 and other analyses reveal commercial prospects
-
In addition to revenue forecasting to 2034, our new study provides you with recent results, growth rates, and market shares.
-
You will find original analyses, with business outlooks and developments.
-
Discover qualitative analyses (including market dynamics, drivers, opportunities, restraints and challenges), cost structure, impact of rising aircraft computers prices and recent developments.
Segments Covered in the Report
Component
Type
-
Flight Controls
-
Engine Controls
-
Flight Management Computers
-
Mission Computers
-
Utility Controls
Platform
-
Fixed Wing
-
Rotary Wing
-
UAVs
Application
-
Commercial
-
Military
-
Para-military
End-user
In addition to the revenue predictions for the overall world market and segments, you will also find revenue forecasts for five regional and 15 leading national markets:
North America
Europe
-
Germany
-
UK
-
France
-
Spain
-
Italy
-
Rest of Europe
Asia Pacific
-
China
-
Japan
-
India
-
Australia
-
South Korea
-
Rest of Asia Pacific
Latin America
-
Brazil
-
Mexico
-
Rest of Latin America
MEA
-
GCC
-
South Africa
-
Rest of MEA
The report also includes profiles and for some of the leading companies in the Aircraft Computers Market, 2024 to 2034, with a focus on this segment of these companies’ operations.
Leading companies profiled in the report
-
BAE Systems plc
-
Cobham Limited
-
Curtiss-Wright Corporation
-
Elbit Systems Ltd.
-
General Dynamics Corporation
-
General Electric Company
-
Honeywell International
-
L3Harris Technologies
-
Leonardo S.p.A.
-
Northrop Grumman Corporation
-
Parker Meggitt
-
Raytheon Technologies Corporation
-
Safran Electronics & Defence
-
Teledyne Technologies Incorporated
-
Thales Group
Overall world revenue for Aircraft Computers Market, 2024 to 2034 in terms of value the market will surpass US$8,600 million in 2024, our work calculates. We predict strong revenue growth through to 2034. Our work identifies which organizations hold the greatest potential. Discover their capabilities, progress, and commercial prospects, helping you stay ahead.
How will the Aircraft Computers Market, 2024 to 2034 report help you?
In summary, our 330+ page report provides you with the following knowledge:
-
Revenue forecasts to 2034 for Aircraft Computers Market, 2024 to 2034 Market, with forecasts for type, component, platform, application and end user, each forecast at a global and regional level – discover the industry’s prospects, finding the most lucrative places for investments and revenues.
-
Revenue forecasts to 2034 for five regional and 15 key national markets – See forecasts for the Aircraft Computers Market, 2024 to 2034 market in North America, Europe, Asia-Pacific, Latin America, and MEA. Also forecasted is the market in the US, Canada, Mexico, Brazil, Germany, France, UK, Italy, China, India, Japan, and Australia among other prominent economies.
-
Prospects for established firms and those seeking to enter the market – including company profiles for 15 of the major companies involved in the Aircraft Computers Market, 2024 to 2034.
Find quantitative and qualitative analyses with independent predictions. Receive information that only our report contains, staying informed with invaluable business intelligence.
Information found nowhere else
With our new report, you are less likely to fall behind in knowledge or miss out on opportunities. See how our work could benefit your research, analyses, and decisions. Visiongain’s study is for everybody needing commercial analyses for the Aircraft Computers Market, 2024 to 2034, market-leading companies. You will find data, trends and predictions.
ページTOPに戻る
Table of Contents
1 Report Overview
1.1 Objectives of the Study
1.2 Introduction to Aircraft Computers Market
1.3 What This Report Delivers
1.4 Why You Should Read This Report
1.5 Key Questions Answered by This Analytical Report
1.6 Who is This Report for?
1.7 Methodology
1.7.1 Market Definitions
1.7.2 Market Evaluation & Forecasting Methodology
1.7.3 Data Validation
1.7.3.1 Primary Research
1.7.3.2 Secondary Research
1.8 Frequently Asked Questions (FAQs)
1.9 Associated Visiongain Reports
1.10 About Visiongain
2 Executive Summary
3 Market Overview
3.1 Key Findings
3.2 Market Dynamics
3.3 Impact Analysis
3.3.1 Market Driving Factors
3.3.1.1 Increasing Aircraft Deliveries Driving the Market Growth
3.3.1.2 Modernization of Existing Aircraft Fleet Driving the Market Growth
3.3.1.3 Growing Emphasis on Aircraft Safety Driving the Market Growth
3.3.2 Market Restraining Factors
3.3.2.1 Increasing Risk from Cyberattacks Hinder the Market Growth
3.3.2.2 Stringent Aviation Standards Hinder the Market Growth
3.3.2.3 Existing Backlogs in Aircraft Deliveries Hinder the Market Growth
3.3.3 Market Opportunities
3.3.3.1 Deployment of Inflight Entertainment Systems Can be Opportunities for the Market Growth
3.3.3.2 Rapid Economic Development in Emerging Market Opportunities for Market Growth
3.3.3.3 Increasing Adaptation of UAVs Opportunities for the Aircraft Computer Market
3.4 Supply Chain Analysis
3.5 Regulatory Framework
3.6 Emerging Markets and Megatrends
3.7 Porter’s Five Forces Analysis
3.7.1 Bargaining Power of Suppliers (Medium)
3.7.2 Bargaining Power of Buyers (Medium – High)
3.7.3 Competitive Rivalry (Medium – High)
3.7.4 Threat of Substitutes (Low)
3.7.5 Threat of New Entrants (Low)
3.8 PEST Analysis
4 Aircraft Computers Market Analysis by Type
4.1 Key Findings
4.2 Type Segment: Market Attractiveness Index
4.3 Aircraft Computers Market Size Estimation and Forecast by Type
4.4 Flight Controls
4.4.1 Market Size by Region, 2024-2034 (US$ Million)
4.4.2 Market Share by Region, 2024 & 2034 (%)
4.5 Engine Controls
4.5.1 Market Size by Region, 2024-2034 (US$ Million)
4.5.2 Market Share by Region, 2024 & 2034 (%)
4.6 Flight Management Computers
4.6.1 Market Size by Region, 2024-2034 (US$ Million)
4.6.2 Market Share by Region, 2024 & 2034 (%)
4.7 Mission Computers
4.7.1 Market Size by Region, 2024-2034 (US$ Million)
4.7.2 Market Share by Region, 2024 & 2034 (%)
4.8 Utility Controls
4.8.1 Market Size by Region, 2024-2034 (US$ Million)
4.8.2 Market Share by Region, 2024 & 2034 (%)
5 Aircraft Computers Market Analysis by Platform
5.1 Key Findings
5.2 Platform Segment: Market Attractiveness Index
5.3 Aircraft Computers Market Size Estimation and Forecast by Platform
5.4 Fixed Wing
5.4.1 Market Size by Region, 2024-2034 (US$ Million)
5.4.2 Market Share by Region, 2024 & 2034 (%)
5.5 Rotary Wing
5.5.1 Market Size by Region, 2024-2034 (US$ Million)
5.5.2 Market Share by Region, 2024 & 2034 (%)
5.6 UAVs
5.6.1 Market Size by Region, 2024-2034 (US$ Million)
5.6.2 Market Share by Region, 2024 & 2034 (%)
6 Aircraft Computers Market Analysis by Component
6.1 Key Findings
6.2 Component Segment: Market Attractiveness Index
6.3 Aircraft Computers Market Size Estimation and Forecast by Component
6.4 Hardware
6.4.1 Market Size by Region, 2024-2034 (US$ Million)
6.4.2 Market Share by Region, 2024 & 2034 (%)
6.5 Software
6.5.1 Market Size by Region, 2024-2034 (US$ Million)
6.5.2 Market Share by Region, 2024 & 2034 (%)
7 Aircraft Computers Market Analysis by End User
7.1 Key Findings
7.2 End User Segment: Market Attractiveness Index
7.3 Aircraft Computers Market Size Estimation and Forecast by End User
7.4 OEM
7.4.1 Market Size by Region, 2024-2034 (US$ Million)
7.4.2 Market Share by Region, 2024 & 2034 (%)
7.5 Aftermarket
7.5.1 Market Size by Region, 2024-2034 (US$ Million)
7.5.2 Market Share by Region, 2024 & 2034 (%)
8 Aircraft Computers Market Analysis by Application
8.1 Key Findings
8.2 Application Segment: Market Attractiveness Index
8.3 Aircraft Computers Market Size Estimation and Forecast by Application
8.4 Commercial
8.4.1 Market Size by Region, 2024-2034 (US$ Million)
8.4.2 Market Share by Region, 2024 & 2034 (%)
8.5 Military
8.5.1 Market Size by Region, 2024-2034 (US$ Million)
8.5.2 Market Share by Region, 2024 & 2034 (%)
8.6 Para-military
8.6.1 Market Size by Region, 2024-2034 (US$ Million)
8.6.2 Market Share by Region, 2024 & 2034 (%)
9 Aircraft Computers Market Analysis by Region
9.1 Key Findings
9.2 Regional Market Size Estimation and Forecast
10 North America Aircraft Computers Market Analysis
10.1 Key Findings
10.2 North America Aircraft Computers Market Attractiveness Index
10.3 North America Aircraft Computers Market by Country, 2024, 2029 & 2034 (US$ Million)
10.4 North America Aircraft Computers Market Size Estimation and Forecast by Country
10.5 North America Aircraft Computers Market Size Estimation and Forecast by Type
10.6 North America Aircraft Computers Market Size Estimation and Forecast by Platform
10.7 North America Aircraft Computers Market Size Estimation and Forecast by Component
10.8 North America Aircraft Computers Market Size Estimation and Forecast by End User
10.9 North America Aircraft Computers Market Size Estimation and Forecast by Application
10.10 U.S. Aircraft Computers Market Analysis
10.11 Canada Aircraft Computers Market Analysis
11 Europe Aircraft Computers Market Analysis
11.1 Key Findings
11.2 Europe Aircraft Computers Market Attractiveness Index
11.3 Europe Aircraft Computers Market by Country, 2024, 2029 & 2034 (US$ Million)
11.4 Europe Aircraft Computers Market Size Estimation and Forecast by Country
11.5 Europe Aircraft Computers Market Size Estimation and Forecast by Type
11.6 Europe Aircraft Computers Market Size Estimation and Forecast by Platform
11.7 Europe Aircraft Computers Market Size Estimation and Forecast by Component
11.8 Europe Aircraft Computers Market Size Estimation and Forecast by End User
11.9 Europe Aircraft Computers Market Size Estimation and Forecast by Application
11.10 Germany Aircraft Computers Market Analysis
11.11 UK Aircraft Computers Market Analysis
11.12 France Aircraft Computers Market Analysis
11.13 Italy Aircraft Computers Market Analysis
11.14 Spain Aircraft Computers Market Analysis
11.15 Rest of Europe Aircraft Computers Market Analysis
12 Asia Pacific Aircraft Computers Market Analysis
12.1 Key Findings
12.2 Asia Pacific Aircraft Computers Market Attractiveness Index
12.3 Asia Pacific Aircraft Computers Market by Country, 2024, 2029 & 2034 (US$ Million)
12.4 Asia Pacific Aircraft Computers Market Size Estimation and Forecast by Country
12.5 Asia Pacific Aircraft Computers Market Size Estimation and Forecast by Type
12.6 Asia Pacific Aircraft Computers Market Size Estimation and Forecast by Platform
12.7 Asia Pacific Aircraft Computers Market Size Estimation and Forecast by Component
12.8 Asia Pacific Aircraft Computers Market Size Estimation and Forecast by End User
12.9 Asia Pacific Aircraft Computers Market Size Estimation and Forecast by Application
12.10 China Aircraft Computers Market Analysis
12.11 India Aircraft Computers Market Analysis
12.12 Japan Aircraft Computers Market Analysis
12.13 South Korea Aircraft Computers Market Analysis
12.14 Australia Aircraft Computers Market Analysis
12.15 Rest of Asia Pacific Aircraft Computers Market Analysis
13 Middle East & Africa Aircraft Computers Market Analysis
13.1 Key Findings
13.2 Middle East & Africa Aircraft Computers Market Attractiveness Index
13.3 Middle East & Africa Aircraft Computers Market by Country, 2024, 2029 & 2034 (US$ Million)
13.4 Middle East & Africa Aircraft Computers Market Size Estimation and Forecast by Country
13.5 Middle East & Africa Aircraft Computers Market Size Estimation and Forecast by Type
13.6 Middle East & Africa Aircraft Computers Market Size Estimation and Forecast by Platform
13.7 Middle East & Africa Aircraft Computers Market Size Estimation and Forecast by Component
13.8 Middle East & Africa Aircraft Computers Market Size Estimation and Forecast by End User
13.9 Middle East & Africa Aircraft Computers Market Size Estimation and Forecast by Application
13.10 GCC Aircraft Computers Market Analysis
13.11 South Africa Aircraft Computers Market Analysis
13.12 Rest of Middle East & Africa Aircraft Computers Market Analysis
14 Latin America Aircraft Computers Market Analysis
14.1 Key Findings
14.2 Latin America Aircraft Computers Market Attractiveness Index
14.3 Latin America Aircraft Computers Market Size Estimation and Forecast by Country
14.4 Latin America Aircraft Computers Market Size Estimation and Forecast by Type
14.5 Latin America Aircraft Computers Market Size Estimation and Forecast by Platform
14.6 Latin America Aircraft Computers Market Size Estimation and Forecast by Component
14.7 Latin America Aircraft Computers Market Size Estimation and Forecast by End User
14.8 Latin America Aircraft Computers Market Size Estimation and Forecast by Application
14.9 Brazil Aircraft Computers Market Analysis
14.10 Mexico Aircraft Computers Market Analysis
14.11 Rest of Latin America Aircraft Computers Market Analysis
15 Company Profiles
15.1 Competitive Landscape
15.2 Strategic Outlook
15.3 Honeywell International Inc
15.3.1 Company Snapshot
15.3.2 Company Overview
15.3.3 Financial Analysis
15.3.3.1 Net Revenue, 2019-2023
15.3.3.2 Business Segment Market Shares, 2023
15.3.3.3 Aerospace Segment Market Shares, 2023
15.3.3.4 Honeywell Building Technologies Segment Market Shares, 2023
15.3.3.5 Performance Materials and Technologies Segment Market Shares, 2023
15.3.3.6 Safety and Productivity Solutions Segment Market Shares, 2023
15.3.4 Product Benchmarking
15.3.5 Strategic Outlook
15.3.6 SWOT Analysis
15.4 Thales Group
15.4.1 Company Snapshot
15.4.2 Company Overview
15.4.3 Financial Analysis
15.4.3.1 Net Revenue, 2019-2023
15.4.3.2 Regional Market Shares, 2023
15.4.3.3 Business Segment Market Shares, 2023
15.4.4 Product Benchmarking
15.4.5 Strategic Outlook
15.4.6 SWOT Analysis
15.5 BAE Systems plc
15.5.1 Company Snapshot
15.5.2 Company Overview
15.5.3 Financial Analysis
15.5.3.1 Net Revenue, 2019-2023
15.5.3.2 Regional Market Shares, 2023
15.5.3.3 Business Segment Market Shares, 2023
15.5.4 Product Benchmarking
15.5.5 Strategic Outlook
15.5.6 SWOT Analysis
15.6 Raytheon Technologies Corporation
15.6.1 Company Snapshot
15.6.2 Company Overview
15.6.3 Financial Analysis
15.6.3.1 Net Revenue, 2019-2023
15.6.3.2 Regional Market Shares, 2023
15.6.3.3 Business Segment Market Shares, 2023
15.6.4 Product Benchmarking
15.6.5 Strategic Outlook
15.6.6 SWOT Analysis
15.7 Curtiss-Wright Corporation
15.7.1 Company Snapshot
15.7.2 Company Overview
15.7.3 Financial Analysis
15.7.3.1 Net Revenue, 2019-2023
15.7.3.2 Business Segment Market Shares, 2023
15.7.4 Product Benchmarking
15.7.5 Strategic Outlook
15.7.6 SWOT Analysis
15.8 Elbit Systems Ltd.
15.8.1 Company Snapshot
15.8.2 Company Overview
15.8.3 Financial Analysis
15.8.3.1 Net Revenue, 2019-2023
15.8.3.2 Regional Market Shares, 2023
15.8.3.3 Business Segment Market Shares, 2023
15.8.4 Product Benchmarking
15.8.5 Strategic Outlook
15.8.6 SWOT Analysis
15.9 L3Harris Technologies Inc.
15.9.1 Company Snapshot
15.9.2 Company Overview
15.9.3 Financial Analysis
15.9.3.1 Net Revenue, 2019-2023
15.9.3.2 Business Segment Market Shares, 2023
15.9.3.3 Regional Market Shares, 2023
15.9.3.4 Business Segment Market Shares, 2023
15.9.4 Product Benchmarking
15.9.5 Strategic Outlook
15.9.6 SWOT Analysis
15.10 Northrop Grumman Corporation
15.10.1 Company Snapshot
15.10.2 Company Overview
15.10.3 Financial Analysis
15.10.3.1 Net Revenue, 2019-2023
15.10.3.2 Customer Market Shares, 2023
15.10.3.3 Segment Market Shares, 2023
15.10.3.4 Business Segment Market Shares, 2023
15.10.4 Product Benchmarking
15.10.5 Strategic Outlook
15.10.6 SWOT Analysis
15.11 Leonardo S.p.A.
15.11.1 Company Snapshot
15.11.2 Company Overview
15.11.3 Financial Analysis
15.11.3.1 Net Revenue, 2019-2023
15.11.3.2 Regional Market Shares, 2023
15.11.3.3 Business Segment Market Shares, 2023
15.11.4 Product Benchmarking
15.11.5 Strategic Outlook
15.11.6 SWOT Analysis
15.12 General Dynamics Corporation
15.12.1 Company Snapshot
15.12.2 Company Overview
15.12.3 Financial Analysis
15.12.3.1 Net Revenue, 2019-2023
15.12.3.2 Segment Market Shares, 2023
15.12.3.3 Regional Market Shares, 2023
15.12.3.4 Business Segment Market Shares, 2023
15.12.4 Product Benchmarking
15.12.5 Strategic Outlook
15.13 Teledyne Technologies Incorporated
15.13.1 Company Snapshot
15.13.2 Company Overview
15.13.3 Financial Analysis
15.13.3.1 Net Revenue, 2019-2023
15.13.3.2 Regional Market Shares, 2023
15.13.3.3 Business Segment Market Shares, 2023
15.13.4 Product Benchmarking
15.13.5 Strategic Outlook
15.14 Cobham Limited
15.14.1 Company Snapshot
15.14.2 Company Overview
15.14.3 Product Benchmarking
15.15 Safran Electronics & Defence
15.15.1 Company Snapshot
15.15.2 Company Overview
15.15.3 Financial Analysis
15.15.3.1 Net Revenue, 2019-2023
15.15.3.2 Business Segment Market Shares, 2023
15.15.4 Product Benchmarking
15.15.5 Strategic Outlook
15.16 Parker Meggitt
15.16.1 Company Snapshot
15.16.2 Company Overview
15.16.3 Product Benchmarking
15.16.4 Strategic Outlook
15.17 General Electric Company
15.17.1 Company Snapshot
15.17.2 Company Overview
15.17.3 Financial Analysis
15.17.3.1 Net Revenue, 2019-2023
15.17.3.2 Business Segment Market Shares, 2023
15.17.4 Product Benchmarking
15.17.5 Strategic Outlook
16 Conclusion and Recommendations
16.1 Concluding Remarks from Visiongain
16.2 Recommendations for Market Players
ページTOPに戻る
List of Tables/Graphs
List of Tables
Table 1 Aircraft Computers Market Snapshot, 2024 & 2034 (US$ Million, CAGR %)
Table 2 Aircraft Computers Market Forecast by Type, 2024-2034 (US$ Million, AGR%, CAGR%)
Table 3 Flight Controls Segment Market Forecast by Region, 2024-2034 (US$ Million, AGR%, CAGR%)
Table 4 Engine Controls Segment Market Forecast by Region, 2024-2034 (US$ Million, AGR%, CAGR%)
Table 5 Flight Management Computers Segment Market Forecast by Region, 2024-2034 (US$ Million, AGR%, CAGR%)
Table 6 Mission Computers Segment Market Forecast by Region, 2024-2034 (US$ Million, AGR%, CAGR%)
Table 7 Utility Controls Segment Market Forecast by Region, 2024-2034 (US$ Million, AGR%, CAGR%)
Table 8 Aircraft Computers Market Forecast by Platform, 2024-2034 (US$ Million, AGR%, CAGR%)
Table 9 Fixed Wing Segment Market Forecast by Region, 2024-2034 (US$ Million, AGR%, CAGR%)
Table 10 Rotary Wing Segment Market Forecast by Region, 2024-2034 (US$ Million, AGR%, CAGR%)
Table 11 UAVs Segment Market Forecast by Region, 2024-2034 (US$ Million, AGR%, CAGR%)
Table 12 Aircraft Computers Market Forecast by Component, 2024-2034 (US$ Million, AGR%, CAGR%)
Table 13 Hardware Segment Market Forecast by Region, 2024-2034 (US$ Million, AGR%, CAGR%)
Table 14 Software Segment Market Forecast by Region, 2024-2034 (US$ Million, AGR%, CAGR%)
Table 15 Aircraft Computers Market Forecast by End User, 2024-2034 (US$ Million, AGR%, CAGR%)
Table 16 OEM Segment Market Forecast by Region, 2024-2034 (US$ Million, AGR%, CAGR%)
Table 17 Aftermarket Segment Market Forecast by Region, 2024-2034 (US$ Million, AGR%, CAGR%)
Table 18 Aircraft Computers Market Forecast by Application, 2024-2034 (US$ Million, AGR%, CAGR%)
Table 19 Commercial Segment Market Forecast by Region, 2024-2034 (US$ Million, AGR%, CAGR%)
Table 20 Military Segment Market Forecast by Region, 2024-2034 (US$ Million, AGR%, CAGR%)
Table 21 Para-military Segment Market Forecast by Region, 2024-2034 (US$ Million, AGR%, CAGR%)
Table 22 Aircraft Computers Market Forecast by Region, 2024-2034 (US$ Million, AGR%, CAGR%)
Table 23 North America Aircraft Computers Market Forecast by Country, 2024-2034 (US$ Million, AGR%, CAGR%)
Table 24 North America Aircraft Computers Market Forecast by Type, 2024-2034 (US$ Million, AGR%, CAGR%)
Table 25 North America Aircraft Computers Market Forecast by Platform, 2024-2034 (US$ Million, AGR%, CAGR%)
Table 26 North America Aircraft Computers Market Forecast by Component, 2024-2034 (US$ Million, AGR%, CAGR%)
Table 27 North America Aircraft Computers Market Forecast by End User, 2024-2034 (US$ Million, AGR%, CAGR%)
Table 28 North America Aircraft Computers Market Forecast by Application, 2024-2034 (US$ Million, AGR%, CAGR%)
Table 29 U.S. Aircraft Computers Market Forecast, 2024-2034 (US$ Million, AGR%, CAGR%)
Table 30 Canada Aircraft Computers Market Forecast, 2024-2034 (US$ Million, AGR%, CAGR%)
Table 31 Europe Aircraft Computers Market Forecast by Country, 2024-2034 (US$ Million, AGR%, CAGR%)
Table 32 Europe Aircraft Computers Market Forecast by Type, 2024-2034 (US$ Million, AGR%, CAGR%)
Table 33 Europe Aircraft Computers Market Forecast by Platform, 2024-2034 (US$ Million, AGR%, CAGR%)
Table 34 Europe Aircraft Computers Market Forecast by Component, 2024-2034 (US$ Million, AGR%, CAGR%)
Table 35 Europe Aircraft Computers Market Forecast by End User, 2024-2034 (US$ Million, AGR%, CAGR%)
Table 36 Europe Aircraft Computers Market Forecast by Application, 2024-2034 (US$ Million, AGR%, CAGR%)
Table 37 Germany Aircraft Computers Market Forecast, 2024-2034 (US$ Million, AGR%, CAGR%)
Table 38 UK Aircraft Computers Market Forecast, 2024-2034 (US$ Million, AGR%, CAGR%)
Table 39 France Aircraft Computers Market Forecast, 2024-2034 (US$ Million, AGR%, CAGR%)
Table 40 Italy Aircraft Computers Market Forecast, 2024-2034 (US$ Million, AGR%, CAGR%)
Table 41 Spain Aircraft Computers Market Forecast, 2024-2034 (US$ Million, AGR%, CAGR%)
Table 42 Rest of Europe Aircraft Computers Market Forecast, 2024-2034 (US$ Million, AGR%, CAGR%)
Table 43 Asia Pacific Aircraft Computers Market Forecast by Country, 2024-2034 (US$ Million, AGR%, CAGR%)
Table 44 Asia Pacific Aircraft Computers Market Forecast by Type, 2024-2034 (US$ Million, AGR%, CAGR%)
Table 45 Asia Pacific Aircraft Computers Market Forecast by Platform, 2024-2034 (US$ Million, AGR%, CAGR%)
Table 46 Asia Pacific Aircraft Computers Market Forecast by Component, 2024-2034 (US$ Million, AGR%, CAGR%)
Table 47 Asia Pacific Aircraft Computers Market Forecast by End User, 2024-2034 (US$ Million, AGR%, CAGR%)
Table 48 Asia Pacific Aircraft Computers Market Forecast by Application, 2024-2034 (US$ Million, AGR%, CAGR%)
Table 49 China Aircraft Computers Market Forecast, 2024-2034 (US$ Million, AGR%, CAGR%)
Table 50 India Aircraft Computers Market Forecast, 2024-2034 (US$ Million, AGR%, CAGR%)
Table 51 Japan Aircraft Computers Market Forecast, 2024-2034 (US$ Million, AGR%, CAGR%)
Table 52 South Korea Aircraft Computers Market Forecast, 2024-2034 (US$ Million, AGR%, CAGR%)
Table 53 Australia Aircraft Computers Market Forecast, 2024-2034 (US$ Million, AGR%, CAGR%)
Table 54 Rest of Asia Pacific Aircraft Computers Market Forecast, 2024-2034 (US$ Million, AGR%, CAGR%)
Table 55 Middle East & Africa Aircraft Computers Market Forecast by Country, 2024-2034 (US$ Million, AGR%, CAGR%)
Table 56 Middle East & Africa Aircraft Computers Market Forecast by Type, 2024-2034 (US$ Million, AGR%, CAGR%)
Table 57 Middle East & Africa Aircraft Computers Market Forecast by Platform, 2024-2034 (US$ Million, AGR%, CAGR%)
Table 58 Middle East & Africa Aircraft Computers Market Forecast by Component, 2024-2034 (US$ Million, AGR%, CAGR%)
Table 59 Middle East & Africa Aircraft Computers Market Forecast by End User, 2024-2034 (US$ Million, AGR%, CAGR%)
Table 60 Middle East & Africa Aircraft Computers Market Forecast by Application, 2024-2034 (US$ Million, AGR%, CAGR%)
Table 61 GCC Aircraft Computers Market Forecast, 2024-2034 (US$ Million, AGR%, CAGR%)
Table 62 South Africa Aircraft Computers Market Forecast, 2024-2034 (US$ Million, AGR%, CAGR%)
Table 63 Rest of Middle East & Africa Aircraft Computers Market Forecast, 2024-2034 (US$ Million, AGR%, CAGR%)
Table 64 Latin America Aircraft Computers Market Forecast by Country, 2024-2034 (US$ Million, AGR%, CAGR%)
Table 65 Latin America Aircraft Computers Market Forecast by Type, 2024-2034 (US$ Million, AGR%, CAGR%)
Table 66 Latin America Aircraft Computers Market Forecast by Platform, 2024-2034 (US$ Million, AGR%, CAGR%)
Table 67 Latin America Aircraft Computers Market Forecast by Component, 2024-2034 (US$ Million, AGR%, CAGR%)
Table 68 Latin America Aircraft Computers Market Forecast by End User, 2024-2034 (US$ Million, AGR%, CAGR%)
Table 69 Latin America Aircraft Computers Market Forecast by Application, 2024-2034 (US$ Million, AGR%, CAGR%)
Table 70 Brazil Aircraft Computers Market Forecast, 2024-2034 (US$ Million, AGR%, CAGR%)
Table 71 Mexico Aircraft Computers Market Forecast, 2024-2034 (US$ Million, AGR%, CAGR%)
Table 72 Rest of Latin America Aircraft Computers Market Forecast, 2024-2034 (US$ Million, AGR%, CAGR%)
Table 73 Aircraft Computer Industry: Strategic Outlook
Table 74 Honeywell International Inc: Key Details, (CEO, HQ, Revenue, Founded, No. of Employees, Company Type, Website, Business Segment)
Table 75 Honeywell International Inc: Product Benchmarking
Table 76 Honeywell International Inc: Strategic Outlook
Table 77 Thales Group: Key Details, (CEO, HQ, Revenue, Founded, No. of Employees, Company Type, Website, Business Segment)
Table 78 Thales Group: Product Benchmarking
Table 79 Thales Group: Strategic Outlook
Table 80 BAE Systems plc: Key Details, (CEO, HQ, Revenue, Founded, No. of Employees, Company Type, Website, Business Segment)
Table 81 BAE Systems plc: Product Benchmarking
Table 82 BAE Systems plc: Strategic Outlook
Table 83 Raytheon Technologies Corporation: Key Details, (CEO, HQ, Revenue, Founded, No. of Employees, Company Type, Website, Business Segment)
Table 84 Raytheon Technologies Corporation: Product Benchmarking
Table 85 Raytheon Technologies Corporation: Strategic Outlook
Table 86 Curtiss-Wright Corporation: Key Details, (CEO, HQ, Revenue, Founded, No. of Employees, Company Type, Website, Business Segment)
Table 87 Curtiss-Wright Corporation: Product Benchmarking
Table 88 Curtiss-Wright Corporation: Strategic Outlook
Table 89 Elbit Systems Ltd.: Key Details, (CEO, HQ, Revenue, Founded, No. of Employees, Company Type, Website, Business Segment)
Table 90 Elbit Systems Ltd.: Product Benchmarking
Table 91 Elbit Systems Ltd.: Strategic Outlook
Table 92 L3Harris Technologies Inc.: Key Details, (CEO, HQ, Revenue, Founded, No. of Employees, Company Type, Website, Business Segment)
Table 93 L3Harris Technologies Inc.: Product Benchmarking
Table 94 L3Harris Technologies Inc.: Strategic Outlook
Table 95 Northrop Grumman Corporation: Key Details, (CEO, HQ, Revenue, Founded, No. of Employees, Company Type, Website, Business Segment)
Table 96 Northrop Grumman Corporation: Product Benchmarking
Table 97 Northrop Grumman Corporation: Strategic Outlook
Table 98 Leonardo S.p.A.: Key Details, (CEO, HQ, Revenue, Founded, No. of Employees, Company Type, Website, Business Segment)
Table 99 Leonardo S.p.A.: Product Benchmarking
Table 100 Leonardo S.p.A.: Strategic Outlook
Table 101 General Dynamics Corporation: Key Details, (CEO, HQ, Revenue, Founded, No. of Employees, Company Type, Website, Business Segment)
Table 102 General Dynamics Corporation: Product Benchmarking
Table 103 General Dynamics Corporation: Strategic Outlook
Table 104 Teledyne Technologies Incorporated: Key Details, (CEO, HQ, Revenue, Founded, No. of Employees, Company Type, Website, Business Segment)
Table 105 Teledyne Technologies Incorporated: Product Benchmarking
Table 106 Teledyne Technologies Incorporated: Strategic Outlook
Table 107 Cobham Limited: Key Details, (CEO, HQ, Revenue, Founded, No. of Employees, Company Type, Website, Business Segment)
Table 108 Cobham Limited: Product Benchmarking
Table 109 Safran Electronics & Defence: Key Details, (CEO, HQ, Revenue, Founded, No. of Employees, Company Type, Website, Business Segment)
Table 110 Safran Electronics & Defence: Product Benchmarking
Table 111 Safran Electronics & Defence: Strategic Outlook
Table 112 Parker Meggitt: Key Details, (CEO, HQ, Revenue, Founded, No. of Employees, Company Type, Website, Business Segment)
Table 113 Parker Meggitt: Product Benchmarking
Table 114 Parker Meggitt: Strategic Outlook
Table 115 General Electric Company: Key Details, (CEO, HQ, Revenue, Founded, No. of Employees, Company Type, Website, Business Segment)
Table 116 General Electric Company: Product Benchmarking
Table 117 General Electric Company: Strategic Outlook
List of Figures
Figure 1 Aircraft Computers Market Segmentation
Figure 2 Aircraft Computers Market by Application: Market Attractiveness Index
Figure 3 Aircraft Computers Market by Indication: Market Attractiveness Index
Figure 4 Aircraft Computers Market by Type: Market Attractiveness Index
Figure 5 Aircraft Computers Market by Platform: Market Attractiveness Index
Figure 6 Aircraft Computers Market by Indication: Market Attractiveness Index
Figure 7 Aircraft Computers Market Attractiveness Index by Region
Figure 8 Aircraft Computers Market: Market Dynamics
Figure 9 Aircraft Computers Market: Impact Analysis
Figure 10 Worldwide number of Airbus aircraft deliveries from 2020 to 2023
Figure 11 Projected Deliveries in the Global Commercial Aircraft Fleet, 2023 – 2042 (Units)
Figure 12 Aircraft Computers Industry: Supply Chain Analysis
Figure 13 Aircraft Computers Market: Porter’s Five Forces Analysis
Figure 14 Aircraft Computers Market: PEST Analysis
Figure 15 Aircraft Computers Market by Type: Market Attractiveness Index
Figure 16 Aircraft Computers Market Forecast by Type, 2024-2034 (US$ Million, AGR %)
Figure 17 Aircraft Computers Market Share Forecast by Type, 2024, 2029, 2034 (%)
Figure 18 Flight Controls Segment Market Forecast by Region, 2024-2034 (US$ Million, AGR %)
Figure 19 Flight Controls Segment Market Share Forecast by Region, 2024 & 2034 (%)
Figure 20 Engine Controls Segment Market Forecast by Region, 2024-2034 (US$ Million, AGR %)
Figure 21 Engine Controls Segment Market Share Forecast by Region, 2024 & 2034 (%)
Figure 22 Flight Management Computers Segment Market Forecast by Region, 2024-2034 (US$ Million, AGR %)
Figure 23 Flight Management Computers Segment Market Share Forecast by Region, 2024 & 2034 (%)
Figure 24 Mission Computers Segment Market Forecast by Region, 2024-2034 (US$ Million, AGR %)
Figure 25 Mission Computers Segment Market Share Forecast by Region, 2024 & 2034 (%)
Figure 26 Utility Controls Segment Market Forecast by Region, 2024-2034 (US$ Million, AGR %)
Figure 27 Utility Controls Segment Market Share Forecast by Region, 2024 & 2034 (%)
Figure 28 Aircraft Computers Market by Platform: Market Attractiveness Index
Figure 29 Aircraft Computers Market Forecast by Platform, 2024-2034 (US$ Million, AGR %)
Figure 30 Aircraft Computers Market Share Forecast by Platform, 2024, 2029, 2034 (%)
Figure 31 Fixed Wing Segment Market Forecast by Region, 2024-2034 (US$ Million, AGR %)
Figure 32 Fixed Wing Segment Market Share Forecast by Region, 2024 & 2034 (%)
Figure 33 Rotary Wing Segment Market Forecast by Region, 2024-2034 (US$ Million, AGR %)
Figure 34 Rotary Wing Segment Market Share Forecast by Region, 2024 & 2034 (%)
Figure 35 UAVs Segment Market Forecast by Region, 2024-2034 (US$ Million, AGR %)
Figure 36 UAVs Segment Market Share Forecast by Region, 2024 & 2034 (%)
Figure 37 Aircraft Computers Market by Component: Market Attractiveness Index
Figure 38 Aircraft Computers Market Forecast by Component, 2024-2034 (US$ Million, AGR %)
Figure 39 Aircraft Computers Market Share Forecast by Component, 2024, 2029, 2034 (%)
Figure 40 Hardware Segment Market Forecast by Region, 2024-2034 (US$ Million, AGR %)
Figure 41 Hardware Segment Market Share Forecast by Region, 2024 & 2034 (%)
Figure 42 Software Segment Market Forecast by Region, 2024-2034 (US$ Million, AGR %)
Figure 43 Software Segment Market Share Forecast by Region, 2024 & 2034 (%)
Figure 44 Aircraft Computers Market by End User: Market Attractiveness Index
Figure 45 Aircraft Computers Market Forecast by End User, 2024-2034 (US$ Million, AGR %)
Figure 46 Aircraft Computers Market Share Forecast by End User, 2024, 2029, 2034 (%)
Figure 47 OEM Segment Market Forecast by Region, 2024-2034 (US$ Million, AGR %)
Figure 48 OEM Segment Market Share Forecast by Region, 2024 & 2034 (%)
Figure 49 Aftermarket Segment Market Forecast by Region, 2024-2034 (US$ Million, AGR %)
Figure 50 Aftermarket Segment Market Share Forecast by Region, 2024 & 2034 (%)
Figure 51 Aircraft Computers Market by Application: Market Attractiveness Index
Figure 52 Aircraft Computers Market Forecast by Application, 2024-2034 (US$ Million, AGR %)
Figure 53 Aircraft Computers Market Share Forecast by Application, 2024, 2029, 2034 (%)
Figure 54 Commercial Segment Market Forecast by Region, 2024-2034 (US$ Million, AGR %)
Figure 55 Commercial Segment Market Share Forecast by Region, 2024 & 2034 (%)
Figure 56 Military Segment Market Forecast by Region, 2024-2034 (US$ Million, AGR %)
Figure 57 Military Segment Market Share Forecast by Region, 2024 & 2034 (%)
Figure 58 Para-military Segment Market Forecast by Region, 2024-2034 (US$ Million, AGR %)
Figure 59 Para-military Segment Market Share Forecast by Region, 2024 & 2034 (%)
Figure 60 Aircraft Computers Market Forecast by Region 2024 and 2034 (Revenue, CAGR%)
Figure 61 Aircraft Computers Market Share Forecast by Region 2024, 2029, 2034 (%)
Figure 62 Aircraft Computers Market by Region, 2024-2034 (US$ Million, AGR %)
Figure 63 North America Aircraft Computers Market Attractiveness Index
Figure 64 North America Aircraft Computers Market by Region, 2024, 2029 & 2034 (US$ Million)
Figure 65 North America Aircraft Computers Market Forecast by Country, 2024-2034 (US$ Million, AGR %)
Figure 66 North America Aircraft Computers Market Share Forecast by Country, 2024 & 2034 (%)
Figure 67 North America Aircraft Computers Market Forecast by Type, 2024-2034 (US$ Million, AGR %)
Figure 68 North America Aircraft Computers Market Share Forecast by Type, 2024 & 2034 (%)
Figure 69 North America Aircraft Computers Market Forecast by Platform, 2024-2034 (US$ Million, AGR %)
Figure 70 North America Aircraft Computers Market Share Forecast by Platform, 2024 & 2034 (%)
Figure 71 North America Aircraft Computers Market Forecast by Component, 2024-2034 (US$ Million, AGR %)
Figure 72 North America Aircraft Computers Market Share Forecast by Component, 2024 & 2034 (%)
Figure 73 North America Aircraft Computers Market Forecast by End User, 2024-2034 (US$ Million, AGR %)
Figure 74 North America Aircraft Computers Market Share Forecast by End User, 2024 & 2034 (%)
Figure 75 North America Aircraft Computers Market Forecast by Application, 2024-2034 (US$ Million, AGR %)
Figure 76 North America Aircraft Computers Market Share Forecast by Application, 2024 & 2034 (%)
Figure 77 U.S. Aircraft Computers Market Forecast, 2024-2034 (US$ Million, AGR %)
Figure 78 Canada Aircraft Computers Market Forecast, 2024-2034 (US$ Million, AGR %)
Figure 79 Europe Aircraft Computers Market Attractiveness Index
Figure 80 Europe Aircraft Computers Market by Region, 2024, 2029 & 2034 (US$ Million)
Figure 81 Europe Aircraft Computers Market Forecast by Country, 2024-2034 (US$ Million, AGR %)
Figure 82 Europe Aircraft Computers Market Share Forecast by Country, 2024 & 2034 (%)
Figure 83 Europe Aircraft Computers Market Forecast by Type, 2024-2034 (US$ Million, AGR %)
Figure 84 Europe Aircraft Computers Market Share Forecast by Type, 2024 & 2034 (%)
Figure 85 Europe Aircraft Computers Market Forecast by Platform, 2024-2034 (US$ Million, AGR %)
Figure 86 Europe Aircraft Computers Market Share Forecast by Platform, 2024 & 2034 (%)
Figure 87 Europe Aircraft Computers Market Forecast by Component, 2024-2034 (US$ Million, AGR %)
Figure 88 Europe Aircraft Computers Market Share Forecast by Component, 2024 & 2034 (%)
Figure 89 Europe Aircraft Computers Market Forecast by End User, 2024-2034 (US$ Million, AGR %)
Figure 90 Europe Aircraft Computers Market Share Forecast by End User, 2024 & 2034 (%)
Figure 91 Europe Aircraft Computers Market Forecast by Application, 2024-2034 (US$ Million, AGR %)
Figure 92 Europe Aircraft Computers Market Share Forecast by Application, 2024 & 2034 (%)
Figure 93 Germany Aircraft Computers Market Forecast, 2024-2034 (US$ Million, AGR %)
Figure 94 UK Aircraft Computers Market Forecast, 2024-2034 (US$ Million, AGR %)
Figure 95 France Aircraft Computers Market Forecast, 2024-2034 (US$ Million, AGR %)
Figure 96 Italy Aircraft Computers Market Forecast, 2024-2034 (US$ Million, AGR %)
Figure 97 Spain Aircraft Computers Market Forecast, 2024-2034 (US$ Million, AGR %)
Figure 98 Rest of Europe Aircraft Computers Market Forecast, 2024-2034 (US$ Million, AGR %)
Figure 99 Asia Pacific Aircraft Computers Market Attractiveness Index
Figure 100 Asia Pacific Aircraft Computers Market by Region, 2024, 2029 & 2034 (US$ Million)
Figure 101 Asia Pacific Aircraft Computers Market Forecast by Country, 2024-2034 (US$ Million, AGR %)
Figure 102 Asia Pacific Aircraft Computers Market Share Forecast by Country, 2024 & 2034 (%)
Figure 103 Asia Pacific Aircraft Computers Market Forecast by Type, 2024-2034 (US$ Million, AGR %)
Figure 104 Asia Pacific Aircraft Computers Market Share Forecast by Type, 2024 & 2034 (%)
Figure 105 Asia Pacific Aircraft Computers Market Forecast by Platform, 2024-2034 (US$ Million, AGR %)
Figure 106 Asia Pacific Aircraft Computers Market Share Forecast by Platform, 2024 & 2034 (%)
Figure 107 Asia Pacific Aircraft Computers Market Forecast by Component, 2024-2034 (US$ Million, AGR %)
Figure 108 Asia Pacific Aircraft Computers Market Share Forecast by Component, 2024 & 2034 (%)
Figure 109 Asia Pacific Aircraft Computers Market Forecast by End User, 2024-2034 (US$ Million, AGR %)
Figure 110 Asia Pacific Aircraft Computers Market Share Forecast by End User, 2024 & 2034 (%)
Figure 111 Asia Pacific Aircraft Computers Market Forecast by Application, 2024-2034 (US$ Million, AGR %)
Figure 112 Asia Pacific Aircraft Computers Market Share Forecast by Application, 2024 & 2034 (%)
Figure 113 China Aircraft Computers Market Forecast, 2024-2034 (US$ Million, AGR %)
Figure 114 India Aircraft Computers Market Forecast, 2024-2034 (US$ Million, AGR %)
Figure 115 Japan Aircraft Computers Market Forecast, 2024-2034 (US$ Million, AGR %)
Figure 116 South Korea Aircraft Computers Market Forecast, 2024-2034 (US$ Million, AGR %)
Figure 117 Australia Aircraft Computers Market Forecast, 2024-2034 (US$ Million, AGR %)
Figure 118 Rest of Asia Pacific Aircraft Computers Market Forecast, 2024-2034 (US$ Million, AGR %)
Figure 119 Middle East & Africa Aircraft Computers Market Attractiveness Index
Figure 120 Middle East & Africa Aircraft Computers Market by Region, 2024, 2029 & 2034 (US$ Million)
Figure 121 Middle East & Africa Aircraft Computers Market Forecast by Country, 2024-2034 (US$ Million, AGR %)
Figure 122 Middle East & Africa Aircraft Computers Market Share Forecast by Country, 2024 & 2034 (%)
Figure 123 Middle East & Africa Aircraft Computers Market Forecast by Type, 2024-2034 (US$ Million, AGR %)
Figure 124 Middle East & Africa Aircraft Computers Market Share Forecast by Type, 2024 & 2034 (%)
Figure 125 Middle East & Africa Aircraft Computers Market Forecast by Platform, 2024-2034 (US$ Million, AGR %)
Figure 126 Middle East & Africa Aircraft Computers Market Share Forecast by Platform, 2024 & 2034 (%)
Figure 127 Middle East & Africa Aircraft Computers Market Forecast by Component, 2024-2034 (US$ Million, AGR %)
Figure 128 Middle East & Africa Aircraft Computers Market Share Forecast by Component, 2024 & 2034 (%)
Figure 129 Middle East & Africa Aircraft Computers Market Forecast by End User, 2024-2034 (US$ Million, AGR %)
Figure 130 Middle East & Africa Aircraft Computers Market Share Forecast by End User, 2024 & 2034 (%)
Figure 131 Middle East & Africa Aircraft Computers Market Forecast by Application, 2024-2034 (US$ Million, AGR %)
Figure 132 Middle East & Africa Aircraft Computers Market Share Forecast by Application, 2024 & 2034 (%)
Figure 133 GCC Aircraft Computers Market Forecast, 2024-2034 (US$ Million, AGR %)
Figure 134 South Africa Aircraft Computers Market Forecast, 2024-2034 (US$ Million, AGR %)
Figure 135 Rest of Middle East & Africa Aircraft Computers Market Forecast, 2024-2034 (US$ Million, AGR %)
Figure 136 Latin America Aircraft Computers Market Attractiveness Index
Figure 137 Latin America Aircraft Computers Market Forecast by Country, 2024-2034 (US$ Million, AGR %)
Figure 138 Latin America Aircraft Computers Market Share Forecast by Country, 2024 & 2034 (%)
Figure 139 Latin America Aircraft Computers Market Forecast by Type, 2024-2034 (US$ Million, AGR %)
Figure 140 Latin America Aircraft Computers Market Share Forecast by Type, 2024 & 2034 (%)
Figure 141 Latin America Aircraft Computers Market Forecast by Platform, 2024-2034 (US$ Million, AGR %)
Figure 142 Latin America Aircraft Computers Market Share Forecast by Platform, 2024 & 2034 (%)
Figure 143 Latin America Aircraft Computers Market Forecast by Component, 2024-2034 (US$ Million, AGR %)
Figure 144 Latin America Aircraft Computers Market Share Forecast by Component, 2024 & 2034 (%)
Figure 145 Latin America Aircraft Computers Market Forecast by End User, 2024-2034 (US$ Million, AGR %)
Figure 146 Latin America Aircraft Computers Market Share Forecast by End User, 2024 & 2034 (%)
Figure 147 Latin America Aircraft Computers Market Forecast by Application, 2024-2034 (US$ Million, AGR %)
Figure 148 Latin America Aircraft Computers Market Share Forecast by Application, 2024 & 2034 (%)
Figure 149 Brazil Aircraft Computers Market Forecast, 2024-2034 (US$ Million, AGR %)
Figure 150 Mexico Aircraft Computers Market Forecast, 2024-2034 (US$ Million, AGR %)
Figure 151 Rest of Latin America Aircraft Computers Market Forecast, 2024-2034 (US$ Million, AGR %)
Figure 152 Honeywell International Inc: Net Revenue, 2019-2023 (US$ Million, AGR%)
Figure 153 Honeywell International Inc: Business Segment Market Shares, 2023
Figure 154 Honeywell International Inc: Aerospace Segment Market Shares, 2023
Figure 155 Honeywell International Inc: Honeywell Building Technologies Segment Market Shares, 2023
Figure 156 Honeywell International Inc: Performance Materials and Technologies Segment Market Shares, 2023
Figure 157 Honeywell International Inc: Safety and Productivity Solutions Segment Market Shares, 2023
Figure 158 Honeywell International Inc: SWOT Analysis
Figure 159 Thales Group: Net Revenue, 2019-2023 (US$ Million, AGR%)
Figure 160 Thales Group: Regional Market Shares, 2023
Figure 161 Thales Group: Business Segment Market Shares, 2023
Figure 162 Thales Group: SWOT Analysis
Figure 163 BAE Systems plc: Net Revenue, 2019-2023 (US$ Million, AGR%)
Figure 164 BAE Systems plc: Regional Market Shares, 2023
Figure 165 BAE Systems plc: Business Segment Market Shares, 2023
Figure 166 BAE Systems plc: SWOT Analysis
Figure 167 Raytheon Technologies Corporation: Net Revenue, 2019-2023 (US$ Million, AGR%)
Figure 168 Raytheon Technologies Corporation: Regional Market Shares, 2023
Figure 169 Raytheon Technologies Corporation: Business Segment Market Shares, 2023
Figure 170 Raytheon Technologies Corporation: SWOT Analysis
Figure 171 Curtiss-Wright Corporation: Net Revenue, 2019-2023 (US$ Million, AGR%)
Figure 172 Curtiss-Wright Corporation: Business Segment Market Shares, 2023
Figure 173 Curtiss-Wright Corporation: SWOT Analysis
Figure 174 Elbit Systems Ltd.: Net Revenue, 2019-2023 (US$ Million, AGR%)
Figure 175 Elbit Systems Ltd.: Regional Market Shares, 2023
Figure 176 Elbit Systems Ltd.: Business Segment Market Shares, 2023
Figure 177 Elbit Systems Ltd.: SWOT Analysis
Figure 178 L3Harris Technologies Inc.: Net Revenue, 2019-2023 (US$ Million, AGR%)
Figure 179 L3Harris Technologies Inc.: Business Segment Market Shares, 2023
Figure 180 L3Harris Technologies Inc.: Regional Market Shares, 2023
Figure 181 L3Harris Technologies Inc.: Business Segment Market Shares, 2023
Figure 182 L3Harris Technologies Inc.: SWOT Analysis
Figure 183 Northrop Grumman Corporation: Net Revenue, 2019-2023 (US$ Million, AGR%)
Figure 184 Northrop Grumman Corporation: Customer Market Shares, 2023
Figure 185 Northrop Grumman Corporation: Segment Market Shares, 2023
Figure 186 Northrop Grumman Corporation: Business Segment Market Shares, 2023
Figure 187 Northrop Grumman Corporation: SWOT Analysis
Figure 188 Leonardo S.p.A.: Net Revenue, 2019-2023 (US$ Million, AGR%)
Figure 189 Leonardo S.p.A.: Regional Market Shares, 2023
Figure 190 Leonardo S.p.A.: Business Segment Market Shares, 2023
Figure 191 Leonardo S.p.A.: SWOT Analysis
Figure 192 General Dynamics Corporation: Net Revenue, 2019-2023 (US$ Million, AGR%)
Figure 193 General Dynamics Corporation: Segment Market Shares, 2023
Figure 194 General Dynamics Corporation: Regional Market Shares, 2023
Figure 195 General Dynamics Corporation: Business Segment Market Shares, 2023
Figure 196 Teledyne Technologies Incorporated: Net Revenue, 2019-2023 (US$ Million, AGR%)
Figure 197 Teledyne Technologies Incorporated: Regional Market Shares, 2023
Figure 198 Teledyne Technologies Incorporated: Business Segment Market Shares, 2023
Figure 199 Safran Electronics & Defence: Net Revenue, 2019-2023 (US$ Million, AGR%)
Figure 200 Safran Electronics & Defence: Business Segment Market Shares, 2023
Figure 201 General Electric Company: Net Revenue, 2019-2023 (US$ Million, AGR%)
Figure 202 General Electric Company: Business Segment Market Shares, 2023
ページTOPに戻る
Visiongain社の航空・海事分野での最新刊レポート
本レポートと同じKEY WORD(aircraft)の最新刊レポート
よくあるご質問
Visiongain社はどのような調査会社ですか?
英国の調査会社ヴィジョンゲイン社(Visiongain)は、通信とエネルギーのほか、自動車や化学・医薬品、金属など、広範な市場を対象に調査を行っています。自動車市場については、市場全般に関する調査のほ... もっと見る
調査レポートの納品までの日数はどの程度ですか?
在庫のあるものは速納となりますが、平均的には 3-4日と見て下さい。
但し、一部の調査レポートでは、発注を受けた段階で内容更新をして納品をする場合もあります。
発注をする前のお問合せをお願いします。
注文の手続きはどのようになっていますか?
1)お客様からの御問い合わせをいただきます。
2)見積書やサンプルの提示をいたします。
3)お客様指定、もしくは弊社の発注書をメール添付にて発送してください。
4)データリソース社からレポート発行元の調査会社へ納品手配します。
5) 調査会社からお客様へ納品されます。最近は、pdfにてのメール納品が大半です。
お支払方法の方法はどのようになっていますか?
納品と同時にデータリソース社よりお客様へ請求書(必要に応じて納品書も)を発送いたします。
お客様よりデータリソース社へ(通常は円払い)の御振り込みをお願いします。
請求書は、納品日の日付で発行しますので、翌月最終営業日までの当社指定口座への振込みをお願いします。振込み手数料は御社負担にてお願いします。
お客様の御支払い条件が60日以上の場合は御相談ください。
尚、初めてのお取引先や個人の場合、前払いをお願いすることもあります。ご了承のほど、お願いします。
データリソース社はどのような会社ですか?
当社は、世界各国の主要調査会社・レポート出版社と提携し、世界各国の市場調査レポートや技術動向レポートなどを日本国内の企業・公官庁及び教育研究機関に提供しております。
世界各国の「市場・技術・法規制などの」実情を調査・収集される時には、データリソース社にご相談ください。
お客様の御要望にあったデータや情報を抽出する為のレポート紹介や調査のアドバイスも致します。
|
|

