水素インフラ市場レポート:2024-2034
Hydrogen Infrastructure Market Report 2024-2034
レポート詳細
水素インフラ市場レポート 2024-2034 :この調査レポートは、業界とその基礎となるダイナミクスをより良く理解することを望むなら、新たな収益ポケットを目指す大手企業にとって貴重な... もっと見る
※上記価格は部署ライセンス(Departmental licence)価格です。
その他の価格についてはデータリソースまでお問合せください。
日本語のページは自動翻訳を利用し作成しています。
実際のレポートは英文のみでご納品いたします。
サマリー
レポート詳細
水素インフラ市場レポート 2024-2034:この調査レポートは、業界とその基礎となるダイナミクスをより良く理解することを望むなら、新たな収益ポケットを目指す大手企業にとって貴重なものとなるでしょう。異業種への進出や新規地域での既存事業の拡大を目指す企業にも有用です。
政府の政策とインセンティブが水素インフラ開発を促進
世界の水素インフラ市場の主な促進要因の一つは、政府による支援政策とインセンティブの実施である。様々な国々がクリーンエネルギーとしての水素の可能性を認識し、その採用を促進するために有利な政策を導入しつつある。例えば欧州連合(EU)は、2030年までに水素技術の大規模展開を促進することを目的とした「欧州クリーン水素アライアンス」を発足させた。
さらに米国には、2030年までにクリーンな水素のコストを80%削減することを目指す「水素エネルギー・アースショット」構想がある。こうしたイニシアティブには通常、水素インフラ・プロジェクトに対する補助金、税額控除、助成金が含まれており、企業が水素製造、貯蔵、流通施設に投資することを経済的に可能にしている。こうした政策の直接的な影響は、水素充填ステーションの急速な拡大や、各地域での水素製造プラントの開発に見られる。
水素のコストは従来のエネルギー・オプションよりも高い
水素製造コストは、依然として市場成長の大きな阻害要因となっている。主な課題のひとつは、水素のコストが従来のエネルギー・オプションに比べて高く、製造業者と消費者の双方にとって経済的な制約となっていることである。特に電気分解や水蒸気メタン改質のような方法で水素を製造するプロセスには、多大なエネルギー投入が必要であり、これが高コストの一因となっている。さらに、水素の貯蔵、輸送、流通のためのインフラ・コストが、全体的な費用をさらに押し上げる。このような水素のコスト高が、従来の化石燃料との競争力を低下させ、さまざまな分野での普及を妨げている。
市場調査レポートを購入する前にすべき質問とは?
-
水素インフラ市場はどのように進化しているのか?
-
何が水素インフラ市場を牽引し、何が阻害しているのか?
-
水素インフラ・サブマーケットの各セグメントは、予測期間中にどのように成長し、2034年にはどれくらいの収益を占めるようになるのか。
-
2024年から2034年にかけて、各水素インフラ・サブマーケットの市場シェアはどのように推移するのか?
-
2024年から2034年にかけて、市場全体を牽引する主な要因は何か?
-
主要な水素インフラ市場は、マクロ経済の動きに幅広く追随するのか、それとも個々の国の市場が他を凌駕するのか。
-
2034年までに各国市場のシェアはどのように変化し、どの地域が2034年の市場をリードするのか。
-
主要プレーヤーと予測期間中の見通しは?
-
これらの大手企業にとっての水素インフラ・プロジェクトとは?
-
2024年から2034年の間に、業界はどのように進化するのか?現在および今後10年間に行われる水素インフラ・プロジェクトは、どのような意味を持つのか?
-
水素インフラ市場をさらに拡大するためには、製品の商業化がより必要なのでしょうか?
-
水素インフラ市場はどこに向かっているのか、また、どのようにすれば市場の最前線に立つことができるのか。
-
新商品や新サービスに最適な投資方法とは?
-
企業を新たな成長軌道に乗せ、C-suiteに移行させるための重要な展望とは?
このことが、現在、そして今後10年間の水素インフラ市場にどのような影響を与えるかを見極める必要がある:
-
132の表と213の図表で構成される433ページのレポート。
-
本レポートでは、業界における主要な有利分野を取り上げているため、今すぐターゲットを絞ることができる。
-
世界、地域、国の売上高と成長に関する詳細な分析が含まれている。
-
競合他社が成功した主なトレンド、変化、収益予測をハイライトします。
本レポートは、COVID-19の景気後退と好転の変動に合わせて、今後10年間に水素インフラ市場がどのように発展するかをTODAYでお伝えする。この市場は、過去10年間のどの時点よりも今が重要である。
2034年までの予測やその他の分析から、商業的な展望が明らかになる
-
2034年までの収益予測に加え、最近の実績、成長率、市場シェアも提供している。
-
ビジネスの展望や展開など、独自の分析が掲載されている。
-
定性的分析(市場ダイナミクス、促進要因、機会、阻害要因、課題を含む)、コスト構造、水素インフラ価格上昇の影響、最近の動向をご覧いただけます。
本レポートには、COVID-19が業界と貴社にどのような影響を与えるかについてのデータ分析と貴重な洞察が含まれている。本レポートでは、COVID-19の4つの回復パターンとその影響、すなわち「V」、「L」、「W」、「U」について論じている。
レポート対象セグメント
市場規模別セグメント
純度別市場セグメント
-
高純度水素(99.999)
-
中純度水素 (95-99%)
-
低純度水素(95%以下)
コンポーネント別市場セグメント
-
電解槽
-
水素タンク
-
パイプライン
-
水素ディスペンサー
タイプ別市場セグメント
-
水素製造施設
-
水素貯蔵施設
-
水素輸送インフラ
-
水素ステーション
-
その他のインフラ
世界市場全体とセグメント別の収益予測に加え、4つの地域と20の主要国市場の収益予測も掲載しています:
北米
欧州
-
ドイツ
-
スペイン
-
イギリス
-
フランス
-
イタリア
-
その他の欧州地域
アジア太平洋
-
中国
-
日本
-
インド
-
オーストラリア
-
韓国
-
その他のアジア太平洋地域
ラテンアメリカ
中東・アフリカ
また、2024年から2034年までの水素インフラ市場の主要企業のプロファイルも掲載している。
報告書に掲載されている主要企業
-
Air Liquide SA
-
Air Products and Chemicals, Inc.
-
Ballard Power Systems Inc.
-
Cummins Inc.
-
Engie SA
-
Fuel Cell Energy, Inc.
-
H2 MOBILITY Deutschland GmbH & Co. KG
-
ITM Power plc
-
Kawasaki Heavy Industries, Ltd.
-
Linde plc
-
McPhy Energy SA
-
Mitsubishi Power, Ltd
-
Nel ASA
-
Plug Power Inc.
-
Siemens Energy AG
2024年から2034年までの水素インフラ市場全体の世界売上高は、金額ベースで2024年に67.1億米ドルを突破する。2034年まで力強い収益成長を予測。当調査では、最も大きな可能性を秘めた組織を特定しています。彼らの能力、進歩、商業的展望を発見し、あなたが一歩先を行くのを支援します。
2024年から2034年までの水素インフラ市場」レポートはどのようにお役に立ちますか?
要約すると、430ページを超えるこのレポートは、以下のような知識を提供する:
-
水素インフラ市場、2024年から2034年までの収益予測 世界および地域レベルでの規模、純度、コンポーネント、タイプ、最終用途の各予測を掲載 - 業界の展望を発見し、投資と収益に最も有利な場所を見つけます。
-
4つの地域と20の主要国市場の2034年までの収益予測 - 北米、欧州、アジア太平洋、中南米、中東・アフリカの水素インフラ市場2024年から2034年までの市場予測をご覧ください。また、米国、カナダ、ブラジル、ドイツ、フランス、英国、イタリア、中国、インド、日本、オーストラリアなどの主要経済圏の市場も予測しています。
-
2024年から2034年までの水素インフラ市場に関わる主要企業15社の企業プロファイルを含む。
独自の予測による定量的・定性的分析をご覧ください。私たちのレポートだけに含まれる情報を入手し、貴重なビジネスインテリジェンスで情報を得ることができます。
他にはない情報
私たちの新しいレポートがあれば、知識に遅れをとったり、チャンスを逃したりする可能性が低くなります。弊社の調査レポートが貴社の調査、分析、意思決定にどのように役立つかをご覧ください。Visiongainのこの調査レポートは、水素インフラ市場(2024年~2034年)、市場リーダー企業の商業分析を必要とするすべての方々を対象としています。データ、トレンド、予測をご覧いただけます。
ページTOPに戻る
目次
1 レポート概要
1.1 研究の目的
1.2 水素インフラ市場の紹介
1.3 本レポートの内容
1.4 本レポートを読むべき理由
1.5 本分析レポートが回答する主な質問
1.6 本レポートは誰のためのものか?
1.7 方法論
1.7.1 市場の定義
1.7.2 市場評価・予測手法
1.7.3 データの検証
1.7.3.1 一次調査
1.7.3.2 セカンダリーリサーチ
1.8 よくある質問(FAQ)
1.9 Visiongainの関連レポート
1.10 Visiongainについて
2 エグゼクティブ・サマリー
3 市場概要
3.1 主要な調査結果
3.2 市場ダイナミクス
3.2.1 市場牽引要因
3.2.1.1 水素の幅広い用途が市場成長を牽引
3.2.1.2 水素は脱炭素ソリューションを提供し、市場成長を促進する
3.2.1.3 グリーン水素とエネルギー産業のデジタル変革が市場成長を牽引
3.2.2 市場抑制要因
3.2.2.1 水素のコストは従来のエネルギー・オプションよりも高い
3.2.2.2 設計慣行への理解不足と未熟練労働者が市場成長を抑制する可能性がある
3.2.2.3 エネルギー損失が市場成長を妨げる
3.2.3 市場機会
3.2.3.1 水素市場への投資と協力の高まりが市場プレーヤーのチャンスとなる
3.2.3.2 世界各国政府はグリーン水素の導入を促進する政策とインセンティブを実施中
3.2.3.3 国際的な気候協定は市場成長のチャンス
3.3 ポーターのファイブフォース分析
3.3.1 サプライヤーの交渉力(低~中)
3.3.2 買い手の交渉力(中〜高)
3.3.3 競争力(中〜高)
3.3.4 代替品による脅威(低)
3.3.5 新規参入企業の脅威(高)
3.4 COVID-19の影響分析
3.4.1 "V字型回復"
3.4.2 "U字型回復"
3.4.3 "W字型回復"
3.4.4 "L字型回復"
3.5 PEST分析
4 水素インフラ市場分析:規模別
4.1 主要調査結果
4.2 規模セグメント 市場魅力度指数
4.3 水素インフラ市場規模別推定と予測
4.4 小規模/中規模インフラ
4.4.1 2024〜2034年の地域別市場規模(US$ Billion)
4.4.2 地域別市場シェア、2024年・2034年(%)
4.5 大規模インフラ
4.5.1 2024〜2034年の地域別市場規模(US$ Billion)
4.5.2 地域別市場シェア、2024年・2034年(%)
5 水素インフラ市場の純度別分析
5.1 主要調査結果
5.2 純度セグメント 市場魅力度指数
5.3 水素インフラの純度別市場規模推定と予測
5.4 高純度水素(99.999)
5.4.1 2024~2034年の地域別市場規模(US$ Billion)
5.4.2 地域別市場シェア、2024年・2034年(%)
5.5 中純度水素(95~99)
5.5.1 2024~2034年の地域別市場規模(US$ Billion)
5.5.2 地域別市場シェア、2024年・2034年(%)
5.6 低純度水素(95%未満)
5.6.1 2024~2034年の地域別市場規模(US$ Billion)
5.6.2 地域別市場シェア、2024年・2034年(%)
6 水素インフラ市場分析:コンポーネント別
6.1 主要な調査結果
6.2 コンポーネントセグメント 市場魅力度指数
6.3 水素インフラ:コンポーネント別市場規模の推定と予測
6.4 電解槽
6.4.1 2024〜2034年の地域別市場規模(US$ Billion)
6.4.2 地域別市場シェア、2024年・2034年(%)
6.5 水素タンク
6.5.1 2024~2034年の地域別市場規模(US$ Billion)
6.5.2 地域別市場シェア、2024年・2034年(%)
6.6 パイプライン
6.6.1 2024~2034年の地域別市場規模(US$ Billion)
6.6.2 地域別市場シェア、2024年・2034年(%)
6.7 水素ディスペンサー
6.7.1 2024~2034年の地域別市場規模(US$ Billion)
6.7.2 地域別市場シェア、2024年・2034年(%)
7 水素インフラ市場分析:タイプ別
7.1 主要な調査結果
7.2 タイプ別セグメント 市場魅力度指数
7.3 水素インフラのタイプ別市場規模推定と予測
7.4 水素製造設備
7.4.1 2024〜2034年の地域別市場規模(US$ Billion)
7.4.2 地域別市場シェア、2024年・2034年(%)
7.5 水素貯蔵施設
7.5.1 2024~2034年の地域別市場規模(US$ Billion)
7.5.2 地域別市場シェア、2024年・2034年(%)
7.6 水素輸送インフラ
7.6.1 2024~2034年の地域別市場規模(US$ Billion)
7.6.2 地域別市場シェア、2024年・2034年(%)
7.7 水素補給ステーション
7.7.1 2024~2034年の地域別市場規模(US$ Billion)
7.7.2 地域別市場シェア、2024年・2034年(%)
7.8 その他のインフラ
7.8.1 2024〜2034年の地域別市場規模(US$ Billion)
7.8.2 地域別市場シェア、2024年・2034年(%)
8 水素インフラ市場分析:用途別
8.1 主要調査結果
8.2 最終用途セグメント: 市場魅力度指数
8.3 エンドユーザー別水素インフラ市場規模推定と予測
8.4 輸送
8.4.1 2024〜2034年の地域別市場規模(US$ Million)
8.4.2 地域別市場シェア、2024年・2034年(%)
8.5 産業用
8.5.1 2024年~2034年の地域別市場規模(US$ Million)
8.5.2 地域別市場シェア、2024年・2034年(%)
8.6 エネルギー貯蔵
8.6.1 2024年~2034年の地域別市場規模(US$ Million)
8.6.2 地域別市場シェア、2024年・2034年(%)
8.7 住宅用および商業用暖房
8.7.1 2024〜2034年の地域別市場規模(US$ Million)
8.7.2 地域別市場シェア、2024年・2034年(%)
8.8 エネルギー変換
8.8.1 2024年~2034年の地域別市場規模(US$ Million)
8.8.2 地域別市場シェア、2024年・2034年(%)
8.9 その他の最終用途
8.9.1 2024〜2034年の地域別市場規模(US$ Million)
8.9.2 地域別市場シェア、2024年・2034年(%)
9 水素インフラ市場分析:地域別
9.1 主要な調査結果
9.2 地域別市場規模の推定と予測
10 北米の水素インフラ市場分析
10.1 主要な調査結果
10.2 北米の水素インフラ市場魅力度指数
10.3 北米の水素インフラ国別市場、2024年、2029年、2034年(US$ Billion)
10.4 北米の水素インフラ市場規模推定と予測
10.5 北米の水素インフラ市場規模推定と予測:国別
10.6 北米の水素インフラ市場規模推定と予測:規模別
10.7 北米の水素インフラ市場規模推定と予測:純度別
10.8 北米の水素インフラ市場規模推定と予測:成分別
10.9 北米の水素インフラ市場規模推定と予測:タイプ別
10.10 北米の水素インフラ市場規模推定と予測:用途別
10.11 米国の水素インフラ市場分析
10.12 カナダの水素インフラ市場分析
11 欧州の水素インフラ市場分析
11.1 主要な調査結果
11.2 欧州水素インフラ市場魅力度指数
11.3 欧州の水素インフラ国別市場、2024年、2029年、2034年(US$ Billion)
11.4 欧州の水素インフラ市場規模推定と予測
11.5 欧州の水素インフラ市場規模推定と予測:国別
11.6 欧州の水素インフラ市場規模推定と予測:規模別
11.7 欧州の水素インフラ市場規模推定と予測:純度別
11.8 欧州の水素インフラ市場規模推定と予測:成分別
11.9 欧州の水素インフラ市場規模推定と予測:タイプ別
11.10 欧州の水素インフラ市場規模推定と予測:用途別
11.11 ドイツの水素インフラ市場分析
11.12 イギリスの水素インフラ市場分析
11.13 フランスの水素インフラ市場分析
11.14 イタリアの水素インフラ市場分析
11.15 スペインの水素インフラ市場分析
11.16 その他の欧州の水素インフラ市場分析
12 アジア太平洋地域の水素インフラ市場分析
12.1 主要な調査結果
12.2 アジア太平洋地域の水素インフラ市場魅力度指数
12.3 アジア太平洋地域の水素インフラ国別市場、2024年、2029年、2034年(US$ Billion)
12.4 アジア太平洋地域の水素インフラ市場規模推定と予測
12.5 アジア太平洋地域の水素インフラ市場規模推定と予測:国別
12.6 アジア太平洋地域の水素インフラ市場規模推定と予測:規模別
12.7 アジア太平洋地域の水素インフラ市場規模推定と予測:純度別
12.8 アジア太平洋地域の水素インフラ市場規模推定と予測:成分別
12.9 アジア太平洋地域の水素インフラ市場規模推定と予測:タイプ別
12.10 アジア太平洋地域の水素インフラ市場規模推定と予測:用途別
12.11 中国の水素インフラ市場分析
12.12 インドの水素インフラ市場分析
12.13 日本の水素インフラ市場分析
12.14 韓国の水素インフラ市場分析
12.15 オーストラリアの水素インフラ市場分析
12.16 その他のアジア太平洋地域の水素インフラ市場分析
13 中東・アフリカの水素インフラ市場分析
13.1 主要な調査結果
13.2 中東・アフリカの水素インフラ市場魅力度指数
13.3 中東・アフリカの国別水素インフラ市場、2024年、2029年、2034年(US$ Billion)
13.4 中東・アフリカの水素インフラ市場規模推定と予測
13.5 中東・アフリカの水素インフラ市場規模推定と予測:国別
13.6 中東・アフリカの水素インフラ市場規模推定と予測:規模別
13.7 中東・アフリカの水素インフラ市場規模推定と予測:純度別
13.8 中東・アフリカの水素インフラ市場規模推定と予測:成分別
13.9 中東・アフリカの水素インフラ市場規模推定と予測:タイプ別
13.10 中東・アフリカの水素インフラ市場規模推定と予測:用途別
13.11 GCCの水素インフラ市場分析
13.12 南アフリカの水素インフラ市場分析
13.13 その他の中東・アフリカ地域の水素インフラ市場分析
14 ラテンアメリカの水素インフラ市場分析
14.1 主要な調査結果
14.2 ラテンアメリカの水素インフラ市場魅力度指数
14.3 ラテンアメリカの水素インフラ国別市場、2024年、2029年、2034年(US$ Billion)
14.4 ラテンアメリカの水素インフラ市場規模推定と予測
14.5 ラテンアメリカの水素インフラ市場規模推定と予測:国別
14.6 ラテンアメリカの水素インフラ市場規模推定と予測:規模別
14.7 ラテンアメリカの水素インフラ市場規模推定と予測:純度別
14.8 ラテンアメリカの水素インフラ市場規模推定と予測:成分別
14.9 ラテンアメリカの水素インフラ市場規模推定と予測:タイプ別
14.10 ラテンアメリカの水素インフラ市場規模推定と予測:用途別
14.11 ブラジルの水素インフラ市場分析
14.12 メキシコの水素インフラ市場分析
14.13 その他のラテンアメリカの水素インフラ市場分析
15 会社概要
15.1 競争環境、2022年
15.2 戦略的展望
15.3 Liquide SA
15.3.1 会社概要
15.3.2 会社概要
15.3.3 財務分析
15.3.3.1 純収入、2019-2023年
15.3.3.2 R&D、2019-2023年
15.3.3.3 地域別収益シェア、2023年(%)
15.3.3.4 事業セグメント収益シェア、2023年(%)
15.3.4 製品ベンチマーク
15.3.5 戦略的展望
15.4 Cummins Inc
15.4.1 会社概要
15.4.2 会社概要
15.4.3 財務分析
15.4.3.1 純収入、2019-2023年
15.4.3.2 売上高、2019-2023年
15.4.4 製品ベンチマーク
15.4.5 戦略的展望
15.5 Mitsubishi Power, Ltd
15.5.1 会社概要
15.5.2 会社概要
15.5.3 財務分析
15.5.3.1 純収入(2019-2023年
15.5.3.2 売上高、2019-2023年
15.5.3.3 地域別収益シェア、2023年(%)
15.5.3.4 事業セグメント収益シェア、2023年(%)
15.5.4 製品ベンチマーク
15.5.5 戦略的展望
15.6 Siemens Energy AG
15.6.1 会社概要
15.6.2 会社概要
15.6.3 財務分析
15.6.3.1 純収入、2019-2023年
15.6.3.2 R&D、2019-2023年
15.6.3.3 地域別収益シェア、2023年(%)
15.6.3.4 事業セグメント収益シェア、2023年(%)
15.6.4 製品ベンチマーク
15.6.5 戦略的展望
15.7 Engie SA
15.7.1 会社概要
15.7.2 会社概要
15.7.3 財務分析
15.7.3.1 純収入、2019-2023年
15.7.3.2 地域別収益シェア、2023年(%)
15.7.3.3 事業セグメント収益シェア、2023年(%)
15.7.4 製品ベンチマーク
15.7.5 戦略的展望
15.8 Plug Power Inc
15.8.1 会社概要
15.8.2 会社概要
15.8.3 財務分析
15.8.3.1 純収入、2019-2023年
15.8.3.2 R&D、2019-2023年
15.8.3.3 地域別収益シェア、2023年(%)
15.8.4 製品ベンチマーク
15.8.5 戦略的展望
15.9 Ballard Power Systems Inc
15.9.1 会社概要
15.9.2 会社概要
15.9.3 財務分析
15.9.3.1 純収入、2019-2023年
15.9.3.2 R&D、2019-2023年
15.9.3.3 地域別売上高シェア(2023年)
15.9.4 製品ベンチマーク
15.9.5 戦略的展望
15.10 Nel ASA
15.10.1 会社概要
15.10.2 会社概要
15.10.3 財務分析
15.10.3.1 純収入、2019-2023年
15.10.3.2 R&D、2019-2023年
15.10.3.3 地域別収益シェア、2023年(%)
15.10.3.4 事業セグメント収益シェア、2023年(%)
15.10.4 製品ベンチマーク
15.10.5 戦略的展望
15.11 Fuel Cell Energy, Inc
15.11.1 会社概要
15.11.2 会社概要
15.11.3 財務分析
15.11.3.1 純収入、2019-2023年
15.11.3.2 R&D、2019-2023年
15.11.3.3 地域別売上高シェア(2023年)
15.11.4 製品ベンチマーク
15.11.5 戦略的展望
15.12 ITM Power plc
15.12.1 会社概要
15.12.2 会社概要
15.12.3 財務分析
15.12.3.1 純収入、2019-2023年
15.12.3.2 R&D、2019-2023年
15.12.3.3 地域別収益シェア、2023年(%)
15.12.3.4 事業セグメント収益シェア、2023年(%)
15.12.4 製品ベンチマーク
15.12.5 戦略的展望
15.13 Linde plc
15.13.1 会社概要
15.13.2 会社概要
15.13.3 財務分析
15.13.3.1 純収入、2019-2023年
15.13.3.2 R&D、2019-2023年
15.13.3.3 地域別売上高シェア, 2023 (%)
15.13.3.4 事業セグメント収益シェア、2023年(%)
15.13.4 製品ベンチマーク
15.13.5 戦略的展望
15.14 H2 MOBILITY Deutschland GmbH & Co.KG
15.14.1 会社概要
15.14.2 会社概要
15.14.3 製品ベンチマーク
15.14.4 戦略的展望
15.15 Air Products and Chemicals, Inc
15.15.1 会社概要
15.15.2 会社概要
15.15.3 財務分析
15.15.3.1 純収入、2019-2023年
15.15.3.2 R&D、2019-2023年
15.15.3.3 地域別収益シェア、2023年(%)
15.15.3.4 事業セグメント収益シェア、2023年(%)
15.15.4 製品ベンチマーク
15.15.5 戦略的展望
15.16 Kawasaki Heavy Industries, Ltd.
15.16.1 会社概要
15.16.2 会社概要
15.16.3 財務分析
15.16.3.1 純収入(2019-2023年
15.16.3.2 売上高、2019年-2023年
15.16.4 製品ベンチマーク
15.16.5 戦略的展望
15.17 McPhy Energy SA
15.17.1 会社概要
15.17.2 会社概要
15.17.3 財務分析
15.17.3.1 純収入、2019-2023年
15.17.4 製品ベンチマーク
15.17.5 戦略的展望
16 結論と提言
16.1 ビジョンゲインからの結びの言葉
16.2 市場プレイヤーへの提言
ページTOPに戻る
図表リスト
表の一覧
表1 水素インフラ市場のスナップショット、2024年~2034年(10億米ドル、CAGR %)
表2 水素インフラの世界地域別市場:2024~2034年(10億米ドル、AGR(%)、CAGR(%))(V字回復シナリオ)
表3 水素インフラの世界地域別市場:2024~2034年(10億米ドル、AGR(%)、CAGR(%))(U字回復シナリオ)
表4 水素インフラの世界地域別市場:2024~2034年(10億米ドル、AGR(%)、CAGR(%))(W字型回復シナリオ)
表5 水素インフラの世界地域別市場:2024~2034年(億米ドル、AGR(%)、CAGR(%))(L字型回復シナリオ)
表6 水素インフラの世界市場規模別市場:2024年~2034年(億米ドル、AGR(%)、CAGR(%)
表7 小規模/中規模インフラ市場:地域別市場規模(2024-2034年、10億米ドル、AGR (%)、CAGR (%)
表8 大規模インフラ市場:地域別、2024年~2034年(10億米ドル、AGR (%)、CAGR (%)
表9 水素インフラの世界市場:純度別、2024~2034年(億米ドル、AGR (%)、CAGR (%)
表10 高純度水素(99.999%)の地域別市場、2024-2034年(億米ドル、AGR (%)、CAGR (%)
表11 中純度水素(95~99%)の地域別市場、2024~2034年 (億米ドル、AGR (%)、CAGR (%))
表12 低純度水素(95%未満)の地域別市場、2024~2034年(億米ドル、AGR (%)、CAGR (%)
表13 水素インフラの世界市場:コンポーネント別(2024-2034年、10億米ドル、AGR (%)、CAGR (%)
表14 電解槽の地域別市場:2024~2034年(億米ドル、AGR (%)、CAGR (%)
表15 水素タンクの地域別市場:2024-2034年(億米ドル、AGR (%)、CAGR (%)
表16 パイプライン地域別市場:2024-2034年(億米ドル、AGR (%)、CAGR (%)
表17 水素ディスペンサーの地域別市場:2024-2034年(億米ドル、AGR (%)、CAGR (%)
表18 水素インフラの世界市場:タイプ別、2024-2034年(億米ドル、AGR (%)、CAGR (%)
表19 水素製造施設の地域別市場:2024~2034年(億米ドル、AGR (%)、CAGR (%)
表20 水素貯蔵施設の地域別市場:2024~2034年(億米ドル、AGR (%)、CAGR (%)
表21 水素輸送インフラ地域別市場:2024-2034年(億米ドル、AGR (%)、CAGR (%)
表22 水素補給ステーション地域別市場:2024-2034年(億米ドル、AGR (%)、CAGR (%)
表23 その他のインフラ市場:地域別、2024-2034年(億米ドル、AGR (%)、CAGR (%)
表24 水素インフラの世界市場:用途別、2024-2034年(億米ドル、AGR (%)、CAGR (%)
表25 運輸市場:地域別、2024年~2034年(億米ドル、AGR (%)、CAGR (%)
表26 地域別産業市場:2024-2034年(億米ドル、AGR (%)、CAGR (%)
表27 地域別エネルギー貯蔵市場:2024-2034年(億米ドル、AGR (%)、CAGR (%)
表28 地域別住宅・商業用暖房市場:2024-2034年(億米ドル、AGR (%)、CAGR (%)
表29 地域別エネルギー変換市場:2024-2034年(億米ドル、AGR (%)、CAGR (%)
表30 その他の最終用途市場の地域別市場規模、2024年~2034年(億米ドル、AGR (%)、CAGR (%)
表31 水素インフラの世界地域別市場:2024-2034年(億米ドル、AGR (%)、CAGR (%)
表32 北米の水素インフラ市場:金額ベース、2024-2034年(億米ドル、AGR (%)、CAGR (%)
表33 北米の水素インフラ市場:国別、2024-2034年(億米ドル、AGR (%)、CAGR (%)
表34 北米の水素インフラ市場規模別:2024-2034年(億米ドル、AGR (%)、CAGR (%)
表35 北米の水素インフラ市場:純度別、2024-2034年(億米ドル、AGR (%)、CAGR (%)
表36 北米の水素インフラ市場:構成要素別(2024-2034年:億米ドル、AGR (%)、CAGR (%)
表37 北米の水素インフラ市場:タイプ別(2024~2034年、億米ドル、AGR (%)、CAGR (%)
表38 北米の水素インフラ市場:用途別(2024~2034年、億米ドル、AGR (%)、CAGR (%)
表39 米国の水素インフラ市場:金額ベース、2024年~2034年(億米ドル、AGR (%)、CAGR (%)
表40 カナダの水素インフラ市場:金額ベース、2024~2034年(億米ドル、AGR (%)、CAGR (%)
表41 欧州の水素インフラ市場:金額ベース、2024~2034年(億米ドル、AGR (%)、CAGR (%)
表42 欧州の水素インフラ市場:国別(2024~2034年、10億米ドル、AGR (%)、CAGR (%)
表43 欧州の水素インフラ市場規模別:2024~2034年(億米ドル、AGR (%)、CAGR (%)
表44 欧州の水素インフラ市場:純度別、2024-2034年(億米ドル、AGR (%)、CAGR (%)
表45 欧州の水素インフラ市場:構成要素別(2024-2034年:億米ドル、AGR (%)、CAGR (%)
表46 欧州の水素インフラ市場:タイプ別(2024~2034年、10億米ドル、AGR (%)、CAGR (%)
表47 欧州の水素インフラ市場:用途別(2024~2034年、億米ドル、AGR (%)、CAGR (%)
表48 ドイツの水素インフラ市場:金額ベース、2024年~2034年(億米ドル、AGR (%)、CAGR (%)
表49 イギリスの水素インフラ市場:金額ベース、2024~2034年(億米ドル、AGR (%)、CAGR (%)
表50 フランスの水素インフラ市場:金額 2024-2034 (億米ドル、AGR (%)、CAGR (%))
表51 イタリアの水素インフラ市場:金額 2024-2034 (億米ドル、AGR (%)、CAGR (%))
表 52 スペインの水素インフラ市場:金額(億米ドル、AGR (%)、CAGR (%)
表 53 残りのヨーロッパの水素インフラ市場:金額ベース、2024~2034年(億米ドル、AGR (%)、CAGR (%)
表54 アジア太平洋地域の水素インフラ市場:金額ベース(2024~2034年、10億米ドル、AGR (%)、CAGR (%)
表55 アジア太平洋地域の水素インフラ市場:国別(2024~2034年、10億米ドル、AGR (%)、CAGR (%)
表56 アジア太平洋地域の水素インフラ市場規模別:2024~2034年(億米ドル、AGR (%)、CAGR (%)
表57 アジア太平洋地域の水素インフラ市場:純度別、2024年~2034年(億米ドル、AGR (%)、CAGR (%)
表58 アジア太平洋地域の水素インフラ市場:構成要素別(2024~2034年、10億米ドル、AGR (%)、CAGR (%)
表59 アジア太平洋地域の水素インフラ市場:タイプ別(2024~2034年、10億米ドル、AGR (%)、CAGR (%)
表60 アジア太平洋地域の水素インフラ市場:用途別(2024~2034年、億米ドル、AGR (%)、CAGR (%)
表61 中国の水素インフラ市場:金額ベース、2024年~2034年(億米ドル、AGR (%)、CAGR (%)
表62 インドの水素インフラ市場:金額ベース、2024~2034年(億米ドル、AGR (%)、CAGR (%)
表63 日本の水素インフラ市場:金額ベース、2024~2034年(億米ドル、AGR (%)、CAGR (%)
表64 韓国の水素インフラ市場:金額ベース、2024~2034年(億米ドル、AGR (%)、CAGR (%)
表65 オーストラリアの水素インフラ市場:金額ベース、2024~2034年(億米ドル、AGR (%)、CAGR (%)
表 66 その他のアジア太平洋地域の水素インフラ市場:金額ベース(2024~2034年、10億米ドル、AGR (%)、CAGR (%)
表 67 中東・アフリカの水素インフラ市場:金額 2024-2034 (億米ドル、AGR (%)、CAGR (%))
表68 中東・アフリカ水素インフラ国別市場:2024-2034年(億米ドル、AGR (%)、CAGR (%)
表69 中東・アフリカの水素インフラ市場規模別:2024~2034年(億米ドル、AGR (%)、CAGR (%)
表70 中東・アフリカの水素インフラ市場:純度別(2024~2034年、10億米ドル、AGR (%)、CAGR (%)
表71 中東・アフリカの水素インフラ市場:構成要素別(2024-2034年:億米ドル、AGR (%)、CAGR (%)
表72 中東・アフリカの水素インフラ市場:タイプ別(2024~2034年、億米ドル、AGR (%)、CAGR (%)
表73 中東・アフリカの水素インフラ市場:用途別(2024~2034年、億米ドル、AGR (%)、CAGR (%)
表74 GCCの水素インフラ市場:金額ベース、2024年~2034年(億米ドル、AGR (%)、CAGR (%)
表75 南アフリカの水素インフラ市場:金額(億米ドル、AGR (%)、CAGR (%)
表76 中東・アフリカの残りの地域の水素インフラ市場:金額(億米ドル、AGR (%)、CAGR (%)
表77 中南米の水素インフラ市場:2024-2034年(億米ドル、AGR (%)、CAGR (%)
表78 中南米の水素インフラ市場:国別(2024-2034年、億米ドル、AGR (%)、CAGR (%)
表79 ラテンアメリカの水素インフラ市場規模別:2024-2034年(億米ドル、AGR (%)、CAGR (%)
表80 中南米の水素インフラ市場:純度別、2024-2034年 (億米ドル、AGR (%)、CAGR (%))
表81 ラテンアメリカの水素インフラ市場:構成要素別(2024-2034年:億米ドル、AGR (%)、CAGR (%)
表82 ラテンアメリカの水素インフラ市場:タイプ別(2024-2034年、10億米ドル、AGR (%)、CAGR (%)
表83 中南米の水素インフラ市場:用途別(2024~2034年、億米ドル、AGR (%)、CAGR (%)
表84 ブラジルの水素インフラ市場:金額ベース、2024-2034年 (億米ドル、AGR (%)、CAGR (%))
表85 メキシコの水素インフラ市場:金額ベース、2024~2034年(億米ドル、AGR (%)、CAGR (%)
表86 その他のラテンアメリカの水素インフラ市場:金額ベース、2024~2034年(億米ドル、AGR (%)、CAGR (%)
表87 戦略的展望 - 契約
表88 Air Liquide SA: 主要詳細(CEO, 本社, 売上高, 設立, 従業員数, 企業タイプ, ウェブサイト, 事業セグメント)
表89 エア・リキードSA: 製品ベンチマーク
表90 エア・リキードSA: 戦略的展望
表91 カミンズ社主な詳細(CEO、本社、売上高、設立、従業員数、企業タイプ、ウェブサイト、事業セグメント)
表 92 カミンズ社製品ベンチマーク
表 93 カミンズInc:戦略的展望
表94 三菱電機:主要業績(CEO, 本社, 売上高, 設立, 従業員数, 企業タイプ, ウェブサイト, 事業セグメント)
表 95 三菱電機:戦略的展望製品ベンチマーク
表96 三菱電機:戦略的展望
表97 シーメンス・エナジーAG: 主要詳細(CEO, 本社, 売上高, 設立, 従業員数, 企業タイプ, ウェブサイト, 事業セグメント)
表 98 シーメンス・エナジーAG: 製品ベンチマーク
表99 シーメンス・エナジーAG:戦略的展望
表100 エンギーSA: 主要詳細(CEO, 本社, 売上高, 設立, 従業員数, 企業タイプ, ウェブサイト, 事業セグメント)
表 101 Engie SA: 製品ベンチマーク
表102 エンギーSA:戦略的展望
表103 プラグパワー社主な詳細(CEO, 本社, 売上高, 設立, 従業員数, 企業タイプ, ウェブサイト, 事業セグメント)
表 104 プラグパワー社製品ベンチマーク
表105 プラグパワー社戦略的展望
表106 バラード・パワー・システムズ社主な詳細(CEO, 本社, 売上高, 設立, 従業員数, 企業タイプ, ウェブサイト, 事業セグメント)
表 107 バラード・パワー・システムズ社製品ベンチマーク
表 108 バラード・パワー・システムズ社戦略的展望
表 109 ネル ASA:主な詳細(CEO, 本社, 売上高, 設立, 従業員数, 企業タイプ, ウェブサイト, 事業セグメント)
表 110 ネル ASA:製品ベンチマーク
表111 ネルASA:戦略的展望
表112 燃料電池エネルギー社主な詳細(CEO, 本社, 売上高, 設立, 従業員数, 企業タイプ, ウェブサイト, 事業セグメント)
表 113 フュエルセル・エナジー社製品ベンチマーク
表114 フュエルセル・エナジー社:戦略的展望戦略的展望
表115 ITM Power plc:主な詳細(CEO, 本社, 売上高, 設立, 従業員数, 企業タイプ, ウェブサイト, 事業セグメント)
表 116 ITM Power plc:製品ベンチマーク
表 117 ITM Power plc:戦略的展望
表118 リンデplc:主な詳細(CEO, 本社, 売上高, 設立, 従業員数, 企業タイプ, ウェブサイト, 事業セグメント)
表 119 リンデ plc:製品のベンチマーク
表 120 リンデ plc:戦略的展望
表121 H2 MOBILITY Deutschland GmbH & Co.KG:主要詳細(CEO, 本社, 売上高, 設立, 従業員数, 企業タイプ, ウェブサイト, 事業セグメント)
表 122 H2 MOBILITY Deutschland GmbH & Co.KG: 製品ベンチマーク
表 123 H2 MOBILITY Deutschland GmbH & Co.KG: 戦略的展望
表 124 エアープロダクツ・アンド・ケミカルズ(Air Products and Chemicals, Inc:主な詳細(CEO, 本社, 売上高, 設立, 従業員数, 企業タイプ, ウェブサイト, 事業セグメント)
表 125 エアープロダクツ・アンド・ケミカルズ, Inc:製品ベンチマーク
表 126 エアープロダクツ・アンド・ケミカルズ:戦略的展望戦略的展望
表127 川崎重工業:主要詳細(CEO、本社、売上高、設立、従業員数、企業タイプ、ウェブサイト、事業セグメント)
表 128 川崎重工業製品ベンチマーク
表129 川崎重工業:戦略的展望
表130 McPhy Energy SA: 主要詳細(CEO、本社、売上高、設立、従業員数、企業タイプ、ウェブサイト、事業セグメント)
表 131 McPhy Energy SA: 製品ベンチマーク
表 132 McPhy Energy SA: 戦略的展望
図の一覧
図 1 水素インフラ市場のセグメント化
図2 水素インフラ市場規模別:市場魅力度指数
図3 水素インフラ市場:純度別:市場魅力度指数
図4 水素インフラ市場:構成要素別:市場魅力度指数市場魅力度指数
図5 水素インフラ市場:タイプ別:市場魅力度指数市場魅力度指数
図6 水素インフラ市場:エンドユーザー別市場魅力度指数
図7 水素インフラ市場:地域別市場魅力度指数
図8 水素インフラ市場市場ダイナミクス
図9 水素インフラ市場:市場ダイナミクスポーターのファイブフォース分析
図10 水素インフラの世界地域別市場:2024年~2034年(10億米ドル、AGR (%))(V字回復シナリオ)
図11 水素インフラの世界地域別市場:2024年~2034年(10億米ドル、AGR (%))(U字回復シナリオ)
図12 水素インフラの世界地域別市場:2024~2034年(10億米ドル、AGR (%))(W字型回復シナリオ)
図13 水素インフラの世界地域別市場:2024~2034年(10億米ドル、AGR (%))(L字型回復シナリオ)
図14 水素インフラ市場PEST分析
図15 水素インフラ市場:規模別:市場魅力度指数
図16 水素インフラの世界市場規模別:2024年~2034年(億米ドル、AGR (%)
図17 水素インフラ市場規模別シェア予測(2024年、2029年、2034年)
図18 2024~2034年の地域別中小規模インフラ市場(10億米ドル、AGR (%)
図19 中小規模インフラ市場地域別シェア予測、2024年&2034年(%)
図20 2024~2034年の大規模インフラ地域別市場予測(億米ドル、AGR (%)
図 21 2024-2034 年の大規模インフラ地域別市場シェア予測 (%)
図22 水素インフラの純度別市場:市場魅力度指数
図23 水素インフラの世界市場(純度別):2024年~2034年(億米ドル、AGR (%)
図24 水素インフラ市場:純度別シェア予測(2024年、2029年、2034年)
図 25 高純度水素(99.999%)の地域別市場予測(2024~2034 年、10 億米ドル、AGR (%)
図 26 高純度水素(99.999%)の地域別市場シェア予測、2024 年~2034 年(%)
図 27 中純度水素(95~99%)の地域別市場予測、2024~2034 年(10 億米ドル、AGR (%)
図 28 中純度水素(95~99%)の地域別市場シェア予測、2024 年~2034 年 (%)
図 29 低純度水素(95%未満)地域別市場予測、2024~2034 年(10 億米ドル、AGR (%)
図 30 低純度水素(95%未満)の地域別市場シェア予測、2024 年~2034 年 (%)
図31 構成要素別水素インフラ市場:市場魅力度指数
図32 水素インフラの世界市場:構成要素別、2024年~2034年(億米ドル、AGR (%)
図33 水素インフラ市場:コンポーネント別シェア予測(2024年、2029年、2034年)
図 34 電解槽の地域別市場予測(2024~2034 年、10 億米ドル、AGR (%)
図 35 電解槽の地域別市場シェア予測、2024 年& 2034 年 (%)
図 36 水素タンクの地域別市場:2024~2034 年(億米ドル、AGR (%)
図 37 水素タンクの地域別市場シェア予測、2024 年~2034 年 (%)
図 38 パイプラインの地域別市場規模予測(2024~2034 年、10 億米ドル、AGR (%)
図 39 パイプラインの地域別市場シェア予測、2024 年~2034 年 (%)
図40 水素ディスペンサー地域別市場:2024~2034年(億米ドル、AGR (%)
図 41 水素ディスペンサーの地域別市場シェア予測、2024 年~2034 年 (%)
図 42 タイプ別水素インフラ市場:市場魅力度指数
図43 水素インフラの世界市場:タイプ別(2024年~2034年、10億米ドル、AGR (%)
図44 水素インフラ市場タイプ別シェア予測(2024年、2029年、2034年)
図 45 2024-2034 年の水素製造施設地域別市場(億米ドル、AGR (%)
図 46 水素製造施設の地域別市場シェア予測、2024 年& 2034 年 (%)
図 47 2024-2034 水素貯蔵施設地域別市場予測(億米ドル、AGR (%)
図 48 水素貯蔵施設の地域別市場シェア予測、2024 年~2034 年 (%)
図 49 水素輸送インフラ地域別市場:2024~2034年(億米ドル、AGR (%)
図 50 水素輸送インフラ地域別市場シェア予測、2024 年~2034 年 (%)
図51 水素補給ステーション地域別市場:2024~2034年(億米ドル、AGR (%)
図 52 水素補給ステーション地域別市場シェア予測、2024年~2034年 (%)
図53 その他のインフラ市場:地域別予測(2024~2034年、10億米ドル、AGR (%)
図 54 その他のインフラ市場地域別シェア予測、2024 年~2034 年(%)
図55 エンドユーズ別水素インフラ市場:市場魅力度指数
図56 水素インフラの世界市場(用途別):2024年~2034年(億米ドル、AGR (%)
図57 エンドユーズ別水素インフラ市場シェア予測(2024年、2029年、2034年)
図 58 輸送市場の地域別予測(2024~2034 年、10 億米ドル、AGR (%)
図59 地域別運輸市場シェア予測、2024年&2034年(%)
図60 2024〜2034年の地域別産業市場(億米ドル、AGR (%)
図61 地域別産業市場シェア予測、2024年&2034年(%)
図62 地域別エネルギー貯蔵市場:2024~2034年(億米ドル、AGR (%)
図 63 地域別エネルギー貯蔵市場シェア予測、2024年&2034年 (%)
図64 地域別住宅・商業用暖房機器市場、2024~2034年(億米ドル、AGR (%)
図65 地域別住宅・商業用暖房機器市場シェア予測、2024年~2034年(%)
図66 地域別エネルギー変換市場:2024~2034年(億米ドル、AGR (%)
図 67 地域別エネルギー変換市場シェア予測、2024年&2034年(%)
図 68 その他の最終用途市場の地域別予測(2024~2034年、10億米ドル、AGR (%)
図 69 その他の最終用途市場の地域別シェア予測、2024 年~2034 年(%)
図 70 2024 年と 2034 年の地域別水素インフラ市場予測(売上高、CAGR)
図71 2024年、2029年、2034年の水素インフラ地域別市場シェア予測(%)
図72 水素インフラの世界地域別市場予測(2024年~2034年、10億米ドル、AGR (%)
図73 北米の水素インフラ市場魅力度指数
図74 北米の水素インフラ地域別市場(2024年、2029年&2034年)(億米ドル
図75 北米の水素インフラ市場:金額ベース(2024~2034年、10億米ドル、AGR (%)
図 76 北米の水素インフラ市場:国別(2024~2034 年)(億米ドル、AGR (%)
図77 北米の水素インフラ国別市場シェア予測、2024年&2034年(%)
図78 北米の水素インフラ市場規模別予測(2024~2034年、10億米ドル、AGR (%)
図79 北米の水素インフラ市場規模別シェア予測、2024年&2034年(%)
図80 北米の水素インフラ市場:純度別(2024~2034年、10億米ドル、AGR (%)
図81 北米の水素インフラ市場:純度別シェア予測、2024年~2034年(%)
図 82 北米の水素インフラ市場:構成要素別(2024~2034年、10億ドル、AGR (%)
図 83 北米の水素インフラ市場:構成要素別シェア予測、2024 年~2034 年(%)
図84 北米の水素インフラ市場:タイプ別(2024~2034年、10億米ドル、AGR (%)
図85 北米の水素インフラ市場タイプ別シェア予測、2024年&2034年(%)
図86 北米の水素インフラ市場:用途別(2024年~2034年、10億米ドル、AGR (%)
図 87 北米の水素インフラ市場:用途別シェア予測、2024 年~2034 年 (%)
図 88 米国の水素インフラ市場:金額ベース(2024~2034 年)(億米ドル、AGR (%)
図 89 カナダの水素インフラ市場:金額ベース(2024~2034 年)(億米ドル、AGR (%)
図 90 欧州水素インフラ市場魅力度指数
図91 欧州の水素インフラ市場(地域別):2024年、2029年&2034年(10億米ドル
図 92 欧州の水素インフラ市場:金額ベース(2024~2034年、10億米ドル、AGR (%)
図 93 欧州の水素インフラ市場:国別(2024~2034 年)(億米ドル、AGR (%)
図94 欧州水素インフラ市場国別シェア予測、2024年&2034年(%)
図95 欧州の水素インフラ市場規模別予測(2024~2034年、10億米ドル、AGR (%)
図96 欧州水素インフラ市場規模別シェア予測、2024年&2034年(%)
図 97 欧州の水素インフラ市場:純度別(2024~2034年、10億ドル、AGR (%)
図98 欧州水素インフラ市場:純度別シェア予測、2024年~2034年(%)
図 99 欧州の水素インフラ市場:構成要素別(2024~2034年、10億米ドル、AGR (%)
図 100 欧州の水素インフラ市場:構成要素別シェア予測、2024 年~2034 年(%)
図101 欧州の水素インフラ市場:タイプ別(2024~2034年、10億米ドル、AGR (%)
図 102 欧州の水素インフラ市場タイプ別シェア予測、2024年~2034年 (%)
図103 欧州の水素インフラ市場:用途別予測(2024~2034年、10億米ドル、AGR (%)
図 104 欧州水素インフラ市場:用途別シェア予測、2024~2034 年 (%)
図 105 ドイツの水素インフラ市場:金額ベース(2024~2034年、10億米ドル、AGR (%)
図 106 イギリスの水素インフラ市場:金額(億米ドル、AGR (%)
図 107 フランスの水素インフラ市場:2024-2034年(億米ドル、AGR (%)
図 108 イタリアの水素インフラ市場:2024~2034年(億米ドル、AGR (%)
図 109 スペインの水素インフラ市場:金額(億米ドル、AGR (%)
図 110 その他のヨーロッパの水素インフラ市場:金額ベース(2024~2034年、10億米ドル、AGR (%)
図 111 アジア太平洋地域の水素インフラ市場魅力度指数
図112 アジア太平洋地域の水素インフラ市場(地域別):2024年、2029年&2034年(10億米ドル
図113 アジア太平洋地域の水素インフラ市場:金額ベース(2024~2034年、10億米ドル、AGR (%)
図114 アジア太平洋地域の水素インフラ市場:国別(2024~2034年、10億米ドル、AGR (%)
図115 アジア太平洋地域の水素インフラ国別市場シェア予測、2024年~2034年 (%)
図116 アジア太平洋地域の水素インフラ市場規模別予測(2024~2034年、10億米ドル、AGR (%)
図 117 アジア太平洋地域の水素インフラ市場規模別シェア予測、2024年~2034年(%)
図118 アジア太平洋地域の水素インフラ市場:純度別(2024~2034年、10億米ドル、AGR (%)
図 119 アジア太平洋地域の水素インフラ市場:純度別シェア予測、2024年~2034年 (%)
図 120 アジア太平洋地域の水素インフラ市場:構成要素別(2024~2034年、10億米ドル、AGR (%)
図 121 アジア太平洋地域の水素インフラ市場:構成要素別シェア予測、2024年~2034年 (%)
図122 アジア太平洋地域の水素インフラ市場:タイプ別予測(2024~2034年、10億ドル、AGR (%)
図 123 アジア太平洋地域の水素インフラ市場タイプ別シェア予測、2024年~2034年 (%)
図124 アジア太平洋地域の水素インフラ市場:用途別予測(2024~2034年、10億米ドル、AGR (%)
図 125 アジア太平洋地域の水素インフラ市場:用途別シェア予測、2024 年~2034 年 (%)
図 126 中国の水素インフラ市場:金額ベース(2024~2034 年)(億米ドル、AGR (%)
図 127 インドの水素インフラ市場:金額(億米ドル、AGR (%)
図 128 日本の水素インフラ市場:金額ベース(2024~2034 年)(億米ドル、AGR (%)
図 129 韓国の水素インフラ市場:金額(億米ドル、AGR (%)
図 130 オーストラリアの水素インフラ市場:金額(億米ドル、AGR (%)
図 131 その他のアジア太平洋地域の水素インフラ市場:金額(億米ドル、AGR (%)
図 132 中東・アフリカの水素インフラ市場魅力度指数
図133 中東・アフリカの水素インフラ地域別市場(2024年、2029年&2034年)(億米ドル
図 134 中東・アフリカの水素インフラ市場:金額ベース(2024~2034年、10億ドル、AGR (%)
図 135 中東・アフリカの水素インフラ国別市場:2024~2034年(億米ドル、AGR (%)
図 136 中東・アフリカの水素インフラ国別市場シェア予測、2024~2034 年 (%)
図 137 中東・アフリカの水素インフラ市場規模別予測、2024~2034年 (億米ドル、AGR (%))
図 138 中東・アフリカ水素インフラ市場規模別シェア予測、2024 年~2034 年(%)
図 139 中東・アフリカの水素インフラ市場:純度別(2024~2034 年)(億米ドル、AGR (%)
図 140 中東・アフリカの水素インフラ市場:純度別シェア予測、2024~2034 年 (%)
図 141 中東・アフリカの水素インフラ市場:構成要素別予測(2024~2034年、10億ドル、AGR (%)
図 142 中東・アフリカの水素インフラ市場:構成要素別シェア予測、2024~2034 年 (%)
図 143 中東・アフリカの水素インフラ市場タイプ別予測:2024~2034年(億米ドル、AGR (%)
図 144 中東・アフリカの水素インフラ市場タイプ別シェア予測、2024~2034 年 (%)
図 145 中東・アフリカの水素インフラ市場:用途別予測(2024~2034 年)(億米ドル、AGR (%)
図 146 中東・アフリカの水素インフラ市場:用途別シェア予測(2024 年/2034 年)
図 147 GCC 水素インフラ市場:金額ベース(2024~2034 年)(億米ドル、AGR (%)
図 148 南アフリカの水素インフラ市場:金額(億米ドル、AGR (%)
図 149 中東・アフリカの残りの地域の水素インフラ市場:金額(億米ドル、AGR (%)
図 150 中南米の水素インフラ市場魅力度指数
図151 中南米の水素インフラ地域別市場(2024年、2029年、2034年)(億米ドル
図152 中南米の水素インフラ市場:金額ベース(2024~2034年、10億ドル、AGR (%)
図 153 ラテンアメリカの水素インフラ市場:国別(2024~2034年、10億米ドル、AGR (%)
図154 中南米の水素インフラ国別市場シェア予測、2024年~2034年 (%)
図155 中南米の水素インフラ市場規模別予測(2024~2034年、10億米ドル、AGR (%)
図156 中南米の水素インフラ市場規模別シェア予測、2024年~2034年(%)
図157 中南米の水素インフラ市場:純度別(2024~2034年、10億米ドル、AGR (%)
図 158 ラテンアメリカの水素インフラ市場:純度別シェア予測、2024年~2034年(%)
図 159 中南米の水素インフラ市場:構成要素別(2024~2034年、10億ドル、AGR (%)
図 160 中南米の水素インフラ市場:構成要素別シェア予測、2024~2034 年(%)
図161 中南米の水素インフラ市場:タイプ別(2024~2034年、10億ドル、AGR (%)
図 162 中南米の水素インフラ市場タイプ別シェア予測、2024~2034 年 (%)
図163 ラテンアメリカの水素インフラ市場:用途別予測(2024~2034年、10億米ドル、AGR (%)
図 164 ラテンアメリカの水素インフラ市場:用途別シェア予測(2024 年/2034 年)
図 165 ブラジルの水素インフラ市場:金額ベース(2024~2034 年)(億米ドル、AGR (%)
図 166 メキシコの水素インフラ市場:金額(億米ドル、AGR (%)
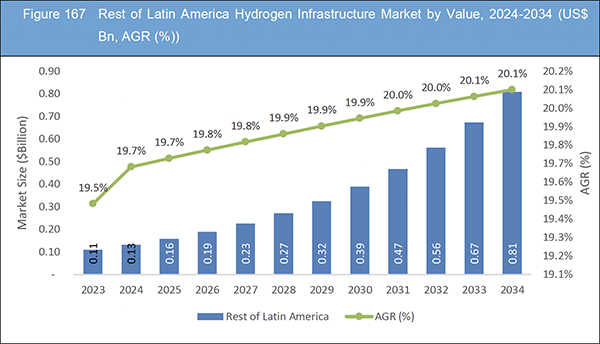
図 167 その他のラテンアメリカの水素インフラ市場:金額(億米ドル、AGR (%)
図 168 水素インフラ市場企業シェア(2022
図 169 Air Liquide SA.:純収入、2019年~2023年(百万米ドル、AGR)
図170 Air Liquide SA.:R&D、2019年-2023年(百万米ドル、AGR)
図171 エア・リキードSA.:地域別売上高シェア、2023年(%)
図 172 エア・リキード SA.:事業別売上高シェア、2023 年(%)
図 173 Cummins Inc:純収入、2019年~2023年(百万米ドル、AGR)
図 174 Cummins Inc:R&D, 2019-2023 (百万米ドル, AGR%)
図 175 三菱電機:純収入、2019~2023 年(百万米ドル、AGR)
図 176 三菱電機(株): 純収入, 2019-2023 (US$ Million, AGR%)R&D, 2019-2023 (百万米ドル, AGR%)
図 177 三菱電機:地域別売上高シェア地域別売上高シェア、2023 年
図 178 三菱電機:事業別売上高シェア、2023 年(%)
図 179 シーメンス・エナジー AG.:純収入、2019 年~2023 年(百万米ドル、AGR)
図 180 Siemens Energy AG.:R&D、2019-2023 年(百万米ドル、AGR)
図 181 シーメンス・エナジー AG.:地域別売上高シェア、2023 年 (%)
図 182 シーメンス・エナジー AG.:事業セグメント別売上高シェア、2023 年
図 183 Engie SA.:純収入、2019 年~2023 年(百万米ドル、AGR)
図 184 Engie SA.:地域別収益シェア、2023 年(%)
図 185 Engie SA.:事業別収益シェア、2023 年(%)
図 186 プラグパワー社:純収入、2019年~2023年(百万米ドル、AGR)
図 187 プラグパワー社:R&D, 2019-2023 (百万米ドル, AGR%)
図 188 プラグパワー社地域別売上高シェア、2023 年
図 189 バラード・パワー・システムズ社:純収入、2019 年~2023 年(百万米ドル、AGR%)
図 190 バラード・パワー・システムズ社:R&D, 2019-2023 (百万米ドル, AGR%)
図 191 Ballard Power Systems Inc:地域別売上高シェア、2023 年 (%)
図192 Nel ASA.:純収入、2019年~2023年(百万米ドル、AGR)
図 193 Nel ASA.:R&D、2019年~2023年(百万米ドル、AGR)
図194 ネルASA.:地域別収益シェア、2023年(%)
図195 ネルASA.:事業別売上高シェア、2023年(%)
図 196 Fuel Cell Energy, Inc:純収入、2019年~2023年(百万米ドル、AGR)
図 197 Fuel Cell Energy, Inc:R&D、2019年~2023年(百万米ドル、AGR)
図 198 Fuel Cell Energy, Inc:地域別売上高シェア(%)
図 199 ITM Power plc.:純収入、2019年~2023年(百万米ドル、AGR)
図 200 ITM Power plc.:R&D、2019年~2023年(百万米ドル、AGR)
図 201 ITM Power plc.:地域別収益シェア、2023 年(%)
図 202 ITM Power plc.:事業別売上高シェア、2023 年(%)
図 203 リンデ plc.:純収入、2019 年~2023 年(百万米ドル、AGR)
図 204 リンデ plc.:R&D、2019年~2023年(百万米ドル、AGR)
図 205 リンデ plc.:地域別収益シェア、2023 年(%)
図 206 リンデ plc.:事業別売上高シェア、2023 年(%)
図 207 エアープロダクツ・アンド・ケミカルズ, Inc:純収入、2019 年~2023 年(百万米ドル、AGR)
図 208 エアープロダクツ・アンド・ケミカルズ社:R&D、2019年~2023年(百万米ドル、AGR)
図 209 エアープロダクツ・アンド・ケミカルズ, Inc:地域別売上高シェア(%)
図 210 エアープロダクツ・アンド・ケミカルズ, Inc:事業別売上高シェア、2023 年(%)
図 211 川崎重工業:純収入、2019 年~2023 年(百万米ドル、AGR)
図 212 川崎重工業(株):R&D, 2019-2023 (百万米ドル, AGR%)
図 213 McPhy Energy SA.:純収入、2019~2023 年(百万米ドル、AGR)
ページTOPに戻る
Summary
Report Details
The Hydrogen Infrastructure Market Report 2024-2034: This report will prove invaluable to leading firms striving for new revenue pockets if they wish to better understand the industry and its underlying dynamics. It will be useful for companies that would like to expand into different industries or to expand their existing operations in a new region.
Government Policies and Incentives Propel Hydrogen Infrastructure Development
One of the primary drivers of the global hydrogen infrastructure market is the implementation of supportive government policies and incentives. Various countries are increasingly recognising the potential of hydrogen as a clean energy source and are introducing favourable policies to encourage its adoption. For example, the European Union has launched the European Clean Hydrogen Alliance, aiming to facilitate large-scale deployment of hydrogen technologies by 2030.
Additionally, the United States has the Hydrogen Energy Earthshot initiative, which aims to reduce the cost of clean hydrogen by 80% by 2030. These initiatives typically include subsidies, tax credits, and grants for hydrogen infrastructure projects, making it financially viable for companies to invest in hydrogen production, storage, and distribution facilities. The direct impact of these policies is seen in the rapid expansion of hydrogen refuelling stations and the development of hydrogen production plants across various regions.
The Cost of Hydrogen is Higher Than Conventional Energy Options
The cost of hydrogen production remains a significant restraining factor in the market’s growth trajectory. One primary challenge is that the cost of hydrogen is higher compared to conventional energy options, presenting a substantial financial constraint for both producers and consumers. The process of producing hydrogen, particularly through methods like electrolysis or steam methane reforming, requires significant energy input, which contributes to its high cost. Additionally, infrastructure costs for hydrogen storage, transportation, and distribution further add to the overall expense. This elevated cost of hydrogen makes it less competitive with conventional fossil fuels, deterring widespread adoption across various sectors.
What Questions Should You Ask before Buying a Market Research Report?
-
How is the hydrogen infrastructure market evolving?
-
What is driving and restraining the hydrogen infrastructure market?
-
How will each hydrogen infrastructure submarket segment grow over the forecast period and how much revenue will these submarkets account for in 2034?
-
How will the market shares for each hydrogen infrastructure submarket develop from 2024 to 2034?
-
What will be the main driver for the overall market from 2024 to 2034?
-
Will leading hydrogen infrastructure markets broadly follow the macroeconomic dynamics, or will individual national markets outperform others?
-
How will the market shares of the national markets change by 2034 and which geographical region will lead the market in 2034?
-
Who are the leading players and what are their prospects over the forecast period?
-
What are the hydrogen infrastructure projects for these leading companies?
-
How will the industry evolve during the period between 2024 and 2034? What are the implications of hydrogen infrastructure projects taking place now and over the next 10 years?
-
Is there a greater need for product commercialisation to further scale the hydrogen infrastructure market?
-
Where is the hydrogen infrastructure market heading and how can you ensure you are at the forefront of the market?
-
What are the best investment options for new product and service lines?
-
What are the key prospects for moving companies into a new growth path and C-suite?
You need to discover how this will impact the hydrogen infrastructure market today, and over the next 10 years:
-
Our 433-page report provides 132 tables and 213 charts/graphs exclusively to you.
-
The report highlights key lucrative areas in the industry so you can target them – NOW.
-
It contains in-depth analysis of global, regional and national sales and growth.
-
It highlights for you the key successful trends, changes and revenue projections made by your competitors.
This report tells you TODAY how the hydrogen infrastructure market will develop in the next 10 years, and in line with the variations in COVID-19 economic recession and bounce. This market is more critical now than at any point over the last 10 years.
Forecasts to 2034 and other analyses reveal commercial prospects
-
In addition to revenue forecasting to 2034, our new study provides you with recent results, growth rates, and market shares.
-
You will find original analyses, with business outlooks and developments.
-
Discover qualitative analyses (including market dynamics, drivers, opportunities, restraints and challenges), cost structure, impact of rising hydrogen infrastructure prices and recent developments.
This report includes data analysis and invaluable insight into how COVID-19 will affect the industry and your company. Four COVID-19 recovery patterns and their impact, namely, “V”, “L”, “W” and “U” are discussed in this report.
Segments Covered in the Report
Market Segment by Size
-
Small/Mid-Scale Infrastructure
-
Large Scale Infrastructure
Market Segment by Purity
-
High Purity Hydrogen (99.999%)
-
Medium Purity Hydrogen (95-99%)
-
Low Purity Hydrogen (Below 95%)
Market Segment by Component
-
Electrolysers
-
Hydrogen Tanks
-
Pipelines
-
Hydrogen Dispensers
Market Segment by Type
-
Hydrogen Production Facilities
-
Hydrogen Storage Facilities
-
Hydrogen Transportation Infrastructure
-
Hydrogen Refuelling Stations
-
Other Infrastructures
In addition to the revenue predictions for the overall world market and segments, you will also find revenue forecasts for four regional and 20 leading national markets:
North America
Europe
-
Germany
-
Spain
-
United Kingdom
-
France
-
Italy
-
Rest of Europe
Asia Pacific
-
China
-
Japan
-
India
-
Australia
-
South Korea
-
Rest of Asia Pacific
Latin America
-
Brazil
-
Mexico
-
Rest of Latin America
Middle East & Africa
-
GCC
-
South Africa
-
Rest of Middle East & Africa
The report also includes profiles and for some of the leading companies in the Hydrogen Infrastructure Market, 2024 to 2034, with a focus on this segment of these companies’ operations.
Leading companies profiled in the report
-
Air Liquide SA
-
Air Products and Chemicals, Inc.
-
Ballard Power Systems Inc.
-
Cummins Inc.
-
Engie SA
-
Fuel Cell Energy, Inc.
-
H2 MOBILITY Deutschland GmbH & Co. KG
-
ITM Power plc
-
Kawasaki Heavy Industries, Ltd.
-
Linde plc
-
McPhy Energy SA
-
Mitsubishi Power, Ltd
-
Nel ASA
-
Plug Power Inc.
-
Siemens Energy AG
Overall world revenue for Hydrogen Infrastructure Market, 2024 to 2034 in terms of value the market will surpass US$6.71 billion in 2024, our work calculates. We predict strong revenue growth through to 2034. Our work identifies which organizations hold the greatest potential. Discover their capabilities, progress, and commercial prospects, helping you stay ahead.
How will the Hydrogen Infrastructure Market, 2024 to 2034 report help you?
In summary, our 430+ page report provides you with the following knowledge:
-
Revenue forecasts to 2034 for Hydrogen Infrastructure Market, 2024 to 2034 Market, with forecasts for size, purity, component, type, and end-use, each forecast at a global and regional level – discover the industry’s prospects, finding the most lucrative places for investments and revenues.
-
Revenue forecasts to 2034 for four regional and 20 key national markets – See forecasts for the Hydrogen Infrastructure Market, 2024 to 2034 market in North America, Europe, Asia-Pacific, Latin America and Middle East & Africa. Also forecasted is the market in the US, Canada, Brazil, Germany, France, UK, Italy, China, India, Japan, and Australia among other prominent economies.
-
Prospects for established firms and those seeking to enter the market – including company profiles for 15 of the major companies involved in the Hydrogen Infrastructure Market, 2024 to 2034.
Find quantitative and qualitative analyses with independent predictions. Receive information that only our report contains, staying informed with invaluable business intelligence.
Information found nowhere else
With our new report, you are less likely to fall behind in knowledge or miss out on opportunities. See how our work could benefit your research, analyses, and decisions. Visiongain’s study is for everybody needing commercial analyses for the Hydrogen Infrastructure Market, 2024 to 2034, market-leading companies. You will find data, trends and predictions.
ページTOPに戻る
Table of Contents
1 Report Overview
1.1 Objectives of the Study
1.2 Introduction to Hydrogen Infrastructure Market
1.3 What This Report Delivers
1.4 Why You Should Read This Report
1.5 Key Questions Answered by This Analytical Report
1.6 Who Is This Report for?
1.7 Methodology
1.7.1 Market Definitions
1.7.2 Market Evaluation & Forecasting Methodology
1.7.3 Data Validation
1.7.3.1 Primary Research
1.7.3.2 Secondary Research
1.8 Frequently Asked Questions (FAQs)
1.9 Associated Visiongain Reports
1.10 About Visiongain
2 Executive Summary
3 Market Overview
3.1 Key Findings
3.2 Market Dynamics
3.2.1 Market Driving Factors
3.2.1.1 Wide Application of Hydrogen Driving the Market Growth
3.2.1.2 Hydrogen Offers a Decarbonization Solution Driving the Market Growth
3.2.1.3 Green Hydrogen and the Digital Transformation of the Energy Industry Driving the Market Growth
3.2.2 Market Restraining Factors
3.2.2.1 The Cost of Hydrogen is Higher Than Conventional Energy Options
3.2.2.2 Limited Understanding of the Design Practices and unskilled Labour can restrain the Market Growth
3.2.2.3 Energy Losses Hinder the Market Growth
3.2.3 Market Opportunities
3.2.3.1 Rising Investment and Collaboration in Hydrogen Market Opportunities for the Market Players
3.2.3.2 Governments Worldwide are Implementing Policies and Incentives to Promote the Adoption of Green Hydrogen
3.2.3.3 International Climate Agreements Opportunities for the Market Growth
3.3 Porter’s Five Forces Analysis
3.3.1 Bargaining Power of Suppliers (Low to Medium)
3.3.2 Bargaining Power of Buyers (Medium to High)
3.3.3 Competitive Rivalry (Medium to High)
3.3.4 Threat from Substitutes (Low)
3.3.5 Threat of New Entrants (High)
3.4 COVID-19 Impact Analysis
3.4.1 “V-Shaped Recovery”
3.4.2 “U-Shaped Recovery”
3.4.3 “W-Shaped Recovery”
3.4.4 “L-Shaped Recovery”
3.5 PEST Analysis
4 Hydrogen Infrastructure Market Analysis by Size
4.1 Key Findings
4.2 Size Segment: Market Attractiveness Index
4.3 Hydrogen Infrastructure Market Size Estimation and Forecast by Size
4.4 Small/Mid-Scale Infrastructure
4.4.1 Market Size by Region, 2024-2034 (US$ Billion)
4.4.2 Market Share by Region, 2024 & 2034 (%)
4.5 Large Scale Infrastructure
4.5.1 Market Size by Region, 2024-2034 (US$ Billion)
4.5.2 Market Share by Region, 2024 & 2034 (%)
5 Hydrogen Infrastructure Market Analysis by Purity
5.1 Key Findings
5.2 Purity Segment: Market Attractiveness Index
5.3 Hydrogen Infrastructure Market Size Estimation and Forecast by Purity
5.4 High Purity Hydrogen (99.999%)
5.4.1 Market Size by Region, 2024-2034 (US$ Billion)
5.4.2 Market Share by Region, 2024 & 2034 (%)
5.5 Medium Purity Hydrogen (95-99%)
5.5.1 Market Size by Region, 2024-2034 (US$ Billion)
5.5.2 Market Share by Region, 2024 & 2034 (%)
5.6 Low Purity Hydrogen (Below 95%)
5.6.1 Market Size by Region, 2024-2034 (US$ Billion)
5.6.2 Market Share by Region, 2024 & 2034 (%)
6 Hydrogen Infrastructure Market Analysis by Component
6.1 Key Findings
6.2 Component Segment: Market Attractiveness Index
6.3 Hydrogen Infrastructure Market Size Estimation and Forecast by Component
6.4 Electrolysers
6.4.1 Market Size by Region, 2024-2034 (US$ Billion)
6.4.2 Market Share by Region, 2024 & 2034 (%)
6.5 Hydrogen Tanks
6.5.1 Market Size by Region, 2024-2034 (US$ Billion)
6.5.2 Market Share by Region, 2024 & 2034 (%)
6.6 Pipelines
6.6.1 Market Size by Region, 2024-2034 (US$ Billion)
6.6.2 Market Share by Region, 2024 & 2034 (%)
6.7 Hydrogen Dispensers
6.7.1 Market Size by Region, 2024-2034 (US$ Billion)
6.7.2 Market Share by Region, 2024 & 2034 (%)
7 Hydrogen Infrastructure Market Analysis by Type
7.1 Key Findings
7.2 Type Segment: Market Attractiveness Index
7.3 Hydrogen Infrastructure Market Size Estimation and Forecast by Type
7.4 Hydrogen Production Facilities
7.4.1 Market Size by Region, 2024-2034 (US$ Billion)
7.4.2 Market Share by Region, 2024 & 2034 (%)
7.5 Hydrogen Storage Facilities
7.5.1 Market Size by Region, 2024-2034 (US$ Billion)
7.5.2 Market Share by Region, 2024 & 2034 (%)
7.6 Hydrogen Transportation Infrastructure
7.6.1 Market Size by Region, 2024-2034 (US$ Billion)
7.6.2 Market Share by Region, 2024 & 2034 (%)
7.7 Hydrogen Refuelling Stations
7.7.1 Market Size by Region, 2024-2034 (US$ Billion)
7.7.2 Market Share by Region, 2024 & 2034 (%)
7.8 Other Infrastructures
7.8.1 Market Size by Region, 2024-2034 (US$ Billion)
7.8.2 Market Share by Region, 2024 & 2034 (%)
8 Hydrogen Infrastructure Market Analysis by End-Use
8.1 Key Findings
8.2 End-Use Segment: Market Attractiveness Index
8.3 Hydrogen Infrastructure Market Size Estimation and Forecast by End-Use
8.4 Transportation
8.4.1 Market Size by Region, 2024-2034 (US$ Million)
8.4.2 Market Share by Region, 2024 & 2034 (%)
8.5 Industrial
8.5.1 Market Size by Region, 2024-2034 (US$ Million)
8.5.2 Market Share by Region, 2024 & 2034 (%)
8.6 Energy Storage
8.6.1 Market Size by Region, 2024-2034 (US$ Million)
8.6.2 Market Share by Region, 2024 & 2034 (%)
8.7 Residential and Commercial Heating
8.7.1 Market Size by Region, 2024-2034 (US$ Million)
8.7.2 Market Share by Region, 2024 & 2034 (%)
8.8 Energy Conversion
8.8.1 Market Size by Region, 2024-2034 (US$ Million)
8.8.2 Market Share by Region, 2024 & 2034 (%)
8.9 Other End-Use
8.9.1 Market Size by Region, 2024-2034 (US$ Million)
8.9.2 Market Share by Region, 2024 & 2034 (%)
9 Hydrogen Infrastructure Market Analysis by Region
9.1 Key Findings
9.2 Regional Market Size Estimation and Forecast
10 North America Hydrogen Infrastructure Market Analysis
10.1 Key Findings
10.2 North America Hydrogen Infrastructure Market Attractiveness Index
10.3 North America Hydrogen Infrastructure Market by Country, 2024, 2029 & 2034 (US$ Billion)
10.4 North America Hydrogen Infrastructure Market Size Estimation and Forecast
10.5 North America Hydrogen Infrastructure Market Size Estimation and Forecast by Country
10.6 North America Hydrogen Infrastructure Market Size Estimation and Forecast by Size
10.7 North America Hydrogen Infrastructure Market Size Estimation and Forecast by Purity
10.8 North America Hydrogen Infrastructure Market Size Estimation and Forecast by Component
10.9 North America Hydrogen Infrastructure Market Size Estimation and Forecast by Type
10.10 North America Hydrogen Infrastructure Market Size Estimation and Forecast by End-Use
10.11 U.S. Hydrogen Infrastructure Market Analysis
10.12 Canada Hydrogen Infrastructure Market Analysis
11 Europe Hydrogen Infrastructure Market Analysis
11.1 Key Findings
11.2 Europe Hydrogen Infrastructure Market Attractiveness Index
11.3 Europe Hydrogen Infrastructure Market by Country, 2024, 2029 & 2034 (US$ Billion)
11.4 Europe Hydrogen Infrastructure Market Size Estimation and Forecast
11.5 Europe Hydrogen Infrastructure Market Size Estimation and Forecast by Country
11.6 Europe Hydrogen Infrastructure Market Size Estimation and Forecast by Size
11.7 Europe Hydrogen Infrastructure Market Size Estimation and Forecast by Purity
11.8 Europe Hydrogen Infrastructure Market Size Estimation and Forecast by Component
11.9 Europe Hydrogen Infrastructure Market Size Estimation and Forecast by Type
11.10 Europe Hydrogen Infrastructure Market Size Estimation and Forecast by End-Use
11.11 Germany Hydrogen Infrastructure Market Analysis
11.12 UK Hydrogen Infrastructure Market Analysis
11.13 France Hydrogen Infrastructure Market Analysis
11.14 Italy Hydrogen Infrastructure Market Analysis
11.15 Spain Hydrogen Infrastructure Market Analysis
11.16 Rest of Europe Hydrogen Infrastructure Market Analysis
12 Asia-Pacific Hydrogen Infrastructure Market Analysis
12.1 Key Findings
12.2 Asia-Pacific Hydrogen Infrastructure Market Attractiveness Index
12.3 Asia-Pacific Hydrogen Infrastructure Market by Country, 2024, 2029 & 2034 (US$ Billion)
12.4 Asia-Pacific Hydrogen Infrastructure Market Size Estimation and Forecast
12.5 Asia-Pacific Hydrogen Infrastructure Market Size Estimation and Forecast by Country
12.6 Asia-Pacific Hydrogen Infrastructure Market Size Estimation and Forecast by Size
12.7 Asia-Pacific Hydrogen Infrastructure Market Size Estimation and Forecast by Purity
12.8 Asia-Pacific Hydrogen Infrastructure Market Size Estimation and Forecast by Component
12.9 Asia-Pacific Hydrogen Infrastructure Market Size Estimation and Forecast by Type
12.10 Asia-Pacific Hydrogen Infrastructure Market Size Estimation and Forecast by End-Use
12.11 China Hydrogen Infrastructure Market Analysis
12.12 India Hydrogen Infrastructure Market Analysis
12.13 Japan Hydrogen Infrastructure Market Analysis
12.14 South Korea Hydrogen Infrastructure Market Analysis
12.15 Australia Hydrogen Infrastructure Market Analysis
12.16 Rest of Asia-Pacific Hydrogen Infrastructure Market Analysis
13 Middle East and Africa Hydrogen Infrastructure Market Analysis
13.1 Key Findings
13.2 Middle East and Africa Hydrogen Infrastructure Market Attractiveness Index
13.3 Middle East and Africa Hydrogen Infrastructure Market by Country, 2024, 2029 & 2034 (US$ Billion)
13.4 Middle East and Africa Hydrogen Infrastructure Market Size Estimation and Forecast
13.5 Middle East and Africa Hydrogen Infrastructure Market Size Estimation and Forecast by Country
13.6 Middle East and Africa Hydrogen Infrastructure Market Size Estimation and Forecast by Size
13.7 Middle East and Africa Hydrogen Infrastructure Market Size Estimation and Forecast by Purity
13.8 Middle East and Africa Hydrogen Infrastructure Market Size Estimation and Forecast by Component
13.9 Middle East and Africa Hydrogen Infrastructure Market Size Estimation and Forecast by Type
13.10 Middle East and Africa Hydrogen Infrastructure Market Size Estimation and Forecast by End-Use
13.11 GCC Hydrogen Infrastructure Market Analysis
13.12 South Africa Hydrogen Infrastructure Market Analysis
13.13 Rest of Middle East & Africa Hydrogen Infrastructure Market Analysis
14 Latin America Hydrogen Infrastructure Market Analysis
14.1 Key Findings
14.2 Latin America Hydrogen Infrastructure Market Attractiveness Index
14.3 Latin America Hydrogen Infrastructure Market by Country, 2024, 2029 & 2034 (US$ Billion)
14.4 Latin America Hydrogen Infrastructure Market Size Estimation and Forecast
14.5 Latin America Hydrogen Infrastructure Market Size Estimation and Forecast by Country
14.6 Latin America Hydrogen Infrastructure Market Size Estimation and Forecast by Size
14.7 Latin America Hydrogen Infrastructure Market Size Estimation and Forecast by Purity
14.8 Latin America Hydrogen Infrastructure Market Size Estimation and Forecast by Component
14.9 Latin America Hydrogen Infrastructure Market Size Estimation and Forecast by Type
14.10 Latin America Hydrogen Infrastructure Market Size Estimation and Forecast by End-Use
14.11 Brazil Hydrogen Infrastructure Market Analysis
14.12 Mexico Hydrogen Infrastructure Market Analysis
14.13 Rest of Latin America Hydrogen Infrastructure Market Analysis
15 Company Profiles
15.1 Competitive Landscape, 2022
15.2 Strategic Outlook
15.3 Air Liquide SA
15.3.1 Company Snapshot
15.3.2 Company Overview
15.3.3 Financial Analysis
15.3.3.1 Net Revenue, 2019-2023
15.3.3.2 R&D, 2019-2023
15.3.3.3 Regional Revenue Share, 2023 (%)
15.3.3.4 Business Segment Revenue Share, 2023 (%)
15.3.4 Product Benchmarking
15.3.5 Strategic Outlook
15.4 Cummins Inc
15.4.1 Company Snapshot
15.4.2 Company Overview
15.4.3 Financial Analysis
15.4.3.1 Net Revenue, 2019-2023
15.4.3.2 R&D, 2019-2023
15.4.4 Product Benchmarking
15.4.5 Strategic Outlook
15.5 Mitsubishi Power, Ltd
15.5.1 Company Snapshot
15.5.2 Company Overview
15.5.3 Financial Analysis
15.5.3.1 Net Revenue, 2019-2023
15.5.3.2 R&D, 2019-2023
15.5.3.3 Regional Revenue Share, 2023 (%)
15.5.3.4 Business Segment Revenue Share, 2023 (%)
15.5.4 Product Benchmarking
15.5.5 Strategic Outlook
15.6 Siemens Energy AG
15.6.1 Company Snapshot
15.6.2 Company Overview
15.6.3 Financial Analysis
15.6.3.1 Net Revenue, 2019-2023
15.6.3.2 R&D, 2019-2023
15.6.3.3 Regional Revenue Share, 2023 (%)
15.6.3.4 Business Segment Revenue Share, 2023 (%)
15.6.4 Product Benchmarking
15.6.5 Strategic Outlook
15.7 Engie SA
15.7.1 Company Snapshot
15.7.2 Company Overview
15.7.3 Financial Analysis
15.7.3.1 Net Revenue, 2019-2023
15.7.3.2 Regional Revenue Share, 2023 (%)
15.7.3.3 Business Segment Revenue Share, 2023 (%)
15.7.4 Product Benchmarking
15.7.5 Strategic Outlook
15.8 Plug Power Inc
15.8.1 Company Snapshot
15.8.2 Company Overview
15.8.3 Financial Analysis
15.8.3.1 Net Revenue, 2019-2023
15.8.3.2 R&D, 2019-2023
15.8.3.3 Regional Revenue Share, 2023(%)
15.8.4 Product Benchmarking
15.8.5 Strategic Outlook
15.9 Ballard Power Systems Inc
15.9.1 Company Snapshot
15.9.2 Company Overview
15.9.3 Financial Analysis
15.9.3.1 Net Revenue, 2019-2023
15.9.3.2 R&D, 2019-2023
15.9.3.3 Regional Revenue Share, 2023 (%)
15.9.4 Product Benchmarking
15.9.5 Strategic Outlook
15.10 Nel ASA
15.10.1 Company Snapshot
15.10.2 Company Overview
15.10.3 Financial Analysis
15.10.3.1 Net Revenue, 2019-2023
15.10.3.2 R&D, 2019-2023
15.10.3.3 Regional Revenue Share, 2023 (%)
15.10.3.4 Business Segment Revenue Share, 2023 (%)
15.10.4 Product Benchmarking
15.10.5 Strategic Outlook
15.11 Fuel Cell Energy, Inc
15.11.1 Company Snapshot
15.11.2 Company Overview
15.11.3 Financial Analysis
15.11.3.1 Net Revenue, 2019-2023
15.11.3.2 R&D, 2019-2023
15.11.3.3 Regional Revenue Share, 2023 (%)
15.11.4 Product Benchmarking
15.11.5 Strategic Outlook
15.12 ITM Power plc
15.12.1 Company Snapshot
15.12.2 Company Overview
15.12.3 Financial Analysis
15.12.3.1 Net Revenue, 2019-2023
15.12.3.2 R&D, 2019-2023
15.12.3.3 Regional Revenue Share, 2023 (%)
15.12.3.4 Business Segment Revenue Share, 2023 (%)
15.12.4 Product Benchmarking
15.12.5 Strategic Outlook
15.13 Linde plc
15.13.1 Company Snapshot
15.13.2 Company Overview
15.13.3 Financial Analysis
15.13.3.1 Net Revenue, 2019-2023
15.13.3.2 R&D, 2019-2023
15.13.3.3 Regional Revenue Share, 2023 (%)
15.13.3.4 Business Segment Revenue Share, 2023 (%)
15.13.4 Product Benchmarking
15.13.5 Strategic Outlook
15.14 H2 MOBILITY Deutschland GmbH & Co. KG
15.14.1 Company Snapshot
15.14.2 Company Overview
15.14.3 Product Benchmarking
15.14.4 Strategic Outlook
15.15 Air Products and Chemicals, Inc
15.15.1 Company Snapshot
15.15.2 Company Overview
15.15.3 Financial Analysis
15.15.3.1 Net Revenue, 2019-2023
15.15.3.2 R&D, 2019-2023
15.15.3.3 Regional Revenue Share, 2023 (%)
15.15.3.4 Business Segment Revenue Share, 2023 (%)
15.15.4 Product Benchmarking
15.15.5 Strategic Outlook
15.16 Kawasaki Heavy Industries, Ltd.
15.16.1 Company Snapshot
15.16.2 Company Overview
15.16.3 Financial Analysis
15.16.3.1 Net Revenue, 2019-2023
15.16.3.2 R&D, 2019-2023
15.16.4 Product Benchmarking
15.16.5 Strategic Outlook
15.17 McPhy Energy SA
15.17.1 Company Snapshot
15.17.2 Company Overview
15.17.3 Financial Analysis
15.17.3.1 Net Revenue, 2019-2023
15.17.4 Product Benchmarking
15.17.5 Strategic Outlook
16 Conclusion and Recommendations
16.1 Concluding Remarks from Visiongain
16.2 Recommendations for Market Players
ページTOPに戻る
List of Tables/Graphs
List of Tables
Table 1 Hydrogen Infrastructure Market Snapshot, 2024 & 2034 (US$ Billion, CAGR %)
Table 2 Global Hydrogen Infrastructure Market by Region, 2024-2034 (US$ Bn, AGR (%), CAGR (%)) (V-Shaped Recovery Scenario)
Table 3 Global Hydrogen Infrastructure Market by Region, 2024-2034 (US$ Bn, AGR (%), CAGR (%)) (U-Shaped Recovery Scenario)
Table 4 Global Hydrogen Infrastructure Market by Region, 2024-2034 (US$ Bn, AGR (%), CAGR (%)) (W-Shaped Recovery Scenario)
Table 5 Global Hydrogen Infrastructure Market by Region, 2024-2034 (US$ Bn, AGR (%), CAGR (%)) (L-Shaped Recovery Scenario)
Table 6 Global Hydrogen Infrastructure Market by Size, 2024-2034 (US$ Bn, AGR (%), CAGR (%))
Table 7 Small/Mid-Scale Infrastructure Market by Region, 2024-2034 (US$ Bn, AGR (%), CAGR (%))
Table 8 Large Scale Infrastructure Market by Region, 2024-2034 (US$ Bn, AGR (%), CAGR (%))
Table 9 Global Hydrogen Infrastructure Market by Purity, 2024-2034 (US$ Bn, AGR (%), CAGR (%))
Table 10 High Purity Hydrogen (99.999%) Market by Region, 2024-2034 (US$ Bn, AGR (%), CAGR (%))
Table 11 Medium Purity Hydrogen (95-99%) Market by Region, 2024-2034 (US$ Bn, AGR (%), CAGR (%))
Table 12 Low Purity Hydrogen (Below 95%) Market by Region, 2024-2034 (US$ Bn, AGR (%), CAGR (%))
Table 13 Global Hydrogen Infrastructure Market by Component, 2024-2034 (US$ Bn, AGR (%), CAGR (%))
Table 14 Electrolysers Market by Region, 2024-2034 (US$ Bn, AGR (%), CAGR (%))
Table 15 Hydrogen Tanks Market by Region, 2024-2034 (US$ Bn, AGR (%), CAGR (%))
Table 16 Pipelines Market by Region, 2024-2034 (US$ Bn, AGR (%), CAGR (%))
Table 17 Hydrogen Dispensers Market by Region, 2024-2034 (US$ Bn, AGR (%), CAGR (%))
Table 18 Global Hydrogen Infrastructure Market by Type, 2024-2034 (US$ Bn, AGR (%), CAGR (%))
Table 19 Hydrogen Production Facilities Market by Region, 2024-2034 (US$ Bn, AGR (%), CAGR (%))
Table 20 Hydrogen Storage Facilities Market by Region, 2024-2034 (US$ Bn, AGR (%), CAGR (%))
Table 21 Hydrogen Transportation Infrastructure Market by Region, 2024-2034 (US$ Bn, AGR (%), CAGR (%))
Table 22 Hydrogen Refuelling Stations Market by Region, 2024-2034 (US$ Bn, AGR (%), CAGR (%))
Table 23 Other Infrastructures Market by Region, 2024-2034 (US$ Bn, AGR (%), CAGR (%))
Table 24 Global Hydrogen Infrastructure Market by End-Use, 2024-2034 (US$ Bn, AGR (%), CAGR (%))
Table 25 Transportation Market by Region, 2024-2034 (US$ Bn, AGR (%), CAGR (%))
Table 26 Industrial Market by Region, 2024-2034 (US$ Bn, AGR (%), CAGR (%))
Table 27 Energy Storage Market by Region, 2024-2034 (US$ Bn, AGR (%), CAGR (%))
Table 28 Residential and Commercial Heating Market by Region, 2024-2034 (US$ Bn, AGR (%), CAGR (%))
Table 29 Energy Conversion Market by Region, 2024-2034 (US$ Bn, AGR (%), CAGR (%))
Table 30 Other End-Use Market by Region, 2024-2034 (US$ Bn, AGR (%), CAGR (%))
Table 31 Global Hydrogen Infrastructure Market by Region, 2024-2034 (US$ Bn, AGR (%), CAGR (%))
Table 32 North America Hydrogen Infrastructure Market by Value, 2024-2034 (US$ Bn, AGR (%), CAGR (%))
Table 33 North America Hydrogen Infrastructure Market by Country, 2024-2034 (US$ Bn, AGR (%), CAGR (%))
Table 34 North America Hydrogen Infrastructure Market by Size, 2024-2034 (US$ Bn, AGR (%), CAGR (%))
Table 35 North America Hydrogen Infrastructure Market by Purity, 2024-2034 (US$ Bn, AGR (%), CAGR (%))
Table 36 North America Hydrogen Infrastructure Market by Component, 2024-2034 (US$ Bn, AGR (%), CAGR (%))
Table 37 North America Hydrogen Infrastructure Market by Type, 2024-2034 (US$ Bn, AGR (%), CAGR (%))
Table 38 North America Hydrogen Infrastructure Market by End-Use, 2024-2034 (US$ Bn, AGR (%), CAGR (%))
Table 39 US Hydrogen Infrastructure Market by Value, 2024-2034 (US$ Bn, AGR (%), CAGR (%))
Table 40 Canada Hydrogen Infrastructure Market by Value, 2024-2034 (US$ Bn, AGR (%), CAGR (%))
Table 41 Europe Hydrogen Infrastructure Market by Value, 2024-2034 (US$ Bn, AGR (%), CAGR (%))
Table 42 Europe Hydrogen Infrastructure Market by Country, 2024-2034 (US$ Bn, AGR (%), CAGR (%))
Table 43 Europe Hydrogen Infrastructure Market by Size, 2024-2034 (US$ Bn, AGR (%), CAGR (%))
Table 44 Europe Hydrogen Infrastructure Market by Purity, 2024-2034 (US$ Bn, AGR (%), CAGR (%))
Table 45 Europe Hydrogen Infrastructure Market by Component, 2024-2034 (US$ Bn, AGR (%), CAGR (%))
Table 46 Europe Hydrogen Infrastructure Market by Type, 2024-2034 (US$ Bn, AGR (%), CAGR (%))
Table 47 Europe Hydrogen Infrastructure Market by End-Use, 2024-2034 (US$ Bn, AGR (%), CAGR (%))
Table 48 Germany Hydrogen Infrastructure Market by Value, 2024-2034 (US$ Bn, AGR (%), CAGR (%))
Table 49 UK Hydrogen Infrastructure Market by Value, 2024-2034 (US$ Bn, AGR (%), CAGR (%))
Table 50 France Hydrogen Infrastructure Market by Value, 2024-2034 (US$ Bn, AGR (%), CAGR (%))
Table 51 Italy Hydrogen Infrastructure Market by Value, 2024-2034 (US$ Bn, AGR (%), CAGR (%))
Table 52 Spain Hydrogen Infrastructure Market by Value, 2024-2034 (US$ Bn, AGR (%), CAGR (%))
Table 53 Rest of Europe Hydrogen Infrastructure Market by Value, 2024-2034 (US$ Bn, AGR (%), CAGR (%))
Table 54 Asia-Pacific Hydrogen Infrastructure Market by Value, 2024-2034 (US$ Bn, AGR (%), CAGR (%))
Table 55 Asia-Pacific Hydrogen Infrastructure Market by Country, 2024-2034 (US$ Bn, AGR (%), CAGR (%))
Table 56 Asia-Pacific Hydrogen Infrastructure Market by Size, 2024-2034 (US$ Bn, AGR (%), CAGR (%))
Table 57 Asia-Pacific Hydrogen Infrastructure Market by Purity, 2024-2034 (US$ Bn, AGR (%), CAGR (%))
Table 58 Asia-Pacific Hydrogen Infrastructure Market by Component, 2024-2034 (US$ Bn, AGR (%), CAGR (%))
Table 59 Asia-Pacific Hydrogen Infrastructure Market by Type, 2024-2034 (US$ Bn, AGR (%), CAGR (%))
Table 60 Asia-Pacific Hydrogen Infrastructure Market by End-Use, 2024-2034 (US$ Bn, AGR (%), CAGR (%))
Table 61 China Hydrogen Infrastructure Market by Value, 2024-2034 (US$ Bn, AGR (%), CAGR (%))
Table 62 India Hydrogen Infrastructure Market by Value, 2024-2034 (US$ Bn, AGR (%), CAGR (%))
Table 63 Japan Hydrogen Infrastructure Market by Value, 2024-2034 (US$ Bn, AGR (%), CAGR (%))
Table 64 South Korea Hydrogen Infrastructure Market by Value, 2024-2034 (US$ Bn, AGR (%), CAGR (%))
Table 65 Australia Hydrogen Infrastructure Market by Value, 2024-2034 (US$ Bn, AGR (%), CAGR (%))
Table 66 Rest of Asia-Pacific Hydrogen Infrastructure Market by Value, 2024-2034 (US$ Bn, AGR (%), CAGR (%))
Table 67 Middle East & Africa Hydrogen Infrastructure Market by Value, 2024-2034 (US$ Bn, AGR (%), CAGR (%))
Table 68 Middle East & Africa Hydrogen Infrastructure Market by Country, 2024-2034 (US$ Bn, AGR (%), CAGR (%))
Table 69 Middle East & Africa Hydrogen Infrastructure Market by Size, 2024-2034 (US$ Bn, AGR (%), CAGR (%))
Table 70 Middle East & Africa Hydrogen Infrastructure Market by Purity, 2024-2034 (US$ Bn, AGR (%), CAGR (%))
Table 71 Middle East & Africa Hydrogen Infrastructure Market by Component, 2024-2034 (US$ Bn, AGR (%), CAGR (%))
Table 72 Middle East & Africa Hydrogen Infrastructure Market by Type, 2024-2034 (US$ Bn, AGR (%), CAGR (%))
Table 73 Middle East & Africa Hydrogen Infrastructure Market by End-Use, 2024-2034 (US$ Bn, AGR (%), CAGR (%))
Table 74 GCC Hydrogen Infrastructure Market by Value, 2024-2034 (US$ Bn, AGR (%), CAGR (%))
Table 75 South Africa Hydrogen Infrastructure Market by Value, 2024-2034 (US$ Bn, AGR (%), CAGR (%))
Table 76 Rest of Middle East & Africa Hydrogen Infrastructure Market by Value, 2024-2034 (US$ Bn, AGR (%), CAGR (%))
Table 77 Latin America Hydrogen Infrastructure Market by Value, 2024-2034 (US$ Bn, AGR (%), CAGR (%))
Table 78 Latin America Hydrogen Infrastructure Market by Country, 2024-2034 (US$ Bn, AGR (%), CAGR (%))
Table 79 Latin America Hydrogen Infrastructure Market by Size, 2024-2034 (US$ Bn, AGR (%), CAGR (%))
Table 80 Latin America Hydrogen Infrastructure Market by Purity, 2024-2034 (US$ Bn, AGR (%), CAGR (%))
Table 81 Latin America Hydrogen Infrastructure Market by Component, 2024-2034 (US$ Bn, AGR (%), CAGR (%))
Table 82 Latin America Hydrogen Infrastructure Market by Type, 2024-2034 (US$ Bn, AGR (%), CAGR (%))
Table 83 Latin America Hydrogen Infrastructure Market by End-Use, 2024-2034 (US$ Bn, AGR (%), CAGR (%))
Table 84 Brazil Hydrogen Infrastructure Market by Value, 2024-2034 (US$ Bn, AGR (%), CAGR (%))
Table 85 Mexico Hydrogen Infrastructure Market by Value, 2024-2034 (US$ Bn, AGR (%), CAGR (%))
Table 86 Rest of Latin America Hydrogen Infrastructure Market by Value, 2024-2034 (US$ Bn, AGR (%), CAGR (%))
Table 87 Strategic Outlook - Contract
Table 88 Air Liquide SA: Key Details, (CEO, HQ, Revenue, Founded, No. of Employees, Company Type, Website, Business Segment)
Table 89 Air Liquide SA: Product Benchmarking
Table 90 Air Liquide SA: Strategic Outlook
Table 91 Cummins Inc: Key Details, (CEO, HQ, Revenue, Founded, No. of Employees, Company Type, Website, Business Segment)
Table 92 Cummins Inc: Product Benchmarking
Table 93 Cummins Inc: Strategic Outlook
Table 94 Mitsubishi Power, Ltd.: Key Details, (CEO, HQ, Revenue, Founded, No. of Employees, Company Type, Website, Business Segment)
Table 95 Mitsubishi Power, Ltd.: Product Benchmarking
Table 96 Mitsubishi Power, Ltd.: Strategic Outlook
Table 97 Siemens Energy AG: Key Details, (CEO, HQ, Revenue, Founded, No. of Employees, Company Type, Website, Business Segment)
Table 98 Siemens Energy AG: Product Benchmarking
Table 99 Siemens Energy AG: Strategic Outlook
Table 100 Engie SA: Key Details, (CEO, HQ, Revenue, Founded, No. of Employees, Company Type, Website, Business Segment)
Table 101 Engie SA: Product Benchmarking
Table 102 Engie SA: Strategic Outlook
Table 103 Plug Power Inc: Key Details, (CEO, HQ, Revenue, Founded, No. of Employees, Company Type, Website, Business Segment)
Table 104 Plug Power Inc: Product Benchmarking
Table 105 Plug Power Inc: Strategic Outlook
Table 106 Ballard Power Systems Inc: Key Details, (CEO, HQ, Revenue, Founded, No. of Employees, Company Type, Website, Business Segment)
Table 107 Ballard Power Systems Inc: Product Benchmarking
Table 108 Ballard Power Systems Inc: Strategic Outlook
Table 109 Nel ASA: Key Details, (CEO, HQ, Revenue, Founded, No. of Employees, Company Type, Website, Business Segment)
Table 110 Nel ASA: Product Benchmarking
Table 111 Nel ASA: Strategic Outlook
Table 112 Fuel Cell Energy, Inc: Key Details, (CEO, HQ, Revenue, Founded, No. of Employees, Company Type, Website, Business Segment)
Table 113 Fuel Cell Energy, Inc: Product Benchmarking
Table 114 Fuel Cell Energy, Inc: Strategic Outlook
Table 115 ITM Power plc: Key Details, (CEO, HQ, Revenue, Founded, No. of Employees, Company Type, Website, Business Segment)
Table 116 ITM Power plc: Product Benchmarking
Table 117 ITM Power plc: Strategic Outlook
Table 118 Linde plc: Key Details, (CEO, HQ, Revenue, Founded, No. of Employees, Company Type, Website, Business Segment)
Table 119 Linde plc: Product Benchmarking
Table 120 Linde plc: Strategic Outlook
Table 121 H2 MOBILITY Deutschland GmbH & Co. KG: Key Details, (CEO, HQ, Revenue, Founded, No. of Employees, Company Type, Website, Business Segment)
Table 122 H2 MOBILITY Deutschland GmbH & Co. KG: Product Benchmarking
Table 123 H2 MOBILITY Deutschland GmbH & Co. KG: Strategic Outlook
Table 124 Air Products and Chemicals, Inc: Key Details, (CEO, HQ, Revenue, Founded, No. of Employees, Company Type, Website, Business Segment)
Table 125 Air Products and Chemicals, Inc: Product Benchmarking
Table 126 Air Products and Chemicals, Inc: Strategic Outlook
Table 127 Kawasaki Heavy Industries, Ltd.: Key Details, (CEO, HQ, Revenue, Founded, No. of Employees, Company Type, Website, Business Segment)
Table 128 Kawasaki Heavy Industries, Ltd.: Product Benchmarking
Table 129 Kawasaki Heavy Industries, Ltd.: Strategic Outlook
Table 130 McPhy Energy SA: Key Details, (CEO, HQ, Revenue, Founded, No. of Employees, Company Type, Website, Business Segment)
Table 131 McPhy Energy SA: Product Benchmarking
Table 132 McPhy Energy SA: Strategic Outlook
List of Figures
Figure 1 Hydrogen Infrastructure Market Segmentation
Figure 2 Hydrogen Infrastructure Market by Size: Market Attractiveness Index
Figure 3 Hydrogen Infrastructure Market by Purity: Market Attractiveness Index
Figure 4 Hydrogen Infrastructure Market by Component: Market Attractiveness Index
Figure 5 Hydrogen Infrastructure Market by Type: Market Attractiveness Index
Figure 6 Hydrogen Infrastructure Market by End-Use: Market Attractiveness Index
Figure 7 Hydrogen Infrastructure Market Attractiveness Index by Region
Figure 8 Hydrogen Infrastructure Market: Market Dynamics
Figure 9 Hydrogen Infrastructure Market: Porter’s Five Forces Analysis
Figure 10 Global Hydrogen Infrastructure Market by Region, 2024-2034 (US$ Bn, AGR (%)) (V-Shaped Recovery Scenario)
Figure 11 Global Hydrogen Infrastructure Market by Region, 2024-2034 (US$ Bn, AGR (%)) (U-Shaped Recovery Scenario)
Figure 12 Global Hydrogen Infrastructure Market by Region, 2024-2034 (US$ Bn, AGR (%)) (W-Shaped Recovery Scenario)
Figure 13 Global Hydrogen Infrastructure Market by Region, 2024-2034 (US$ Bn, AGR (%)) (L-Shaped Recovery Scenario)
Figure 14 Hydrogen Infrastructure Market: PEST Analysis
Figure 15 Hydrogen Infrastructure Market by Size: Market Attractiveness Index
Figure 16 Global Hydrogen Infrastructure Market by Size, 2024-2034 (US$ Bn, AGR (%))
Figure 17 Hydrogen Infrastructure Market Share Forecast by Size, 2024, 2029, 2034 (%)
Figure 18 Small/Mid-Scale Infrastructure Market by Region, 2024-2034 (US$ Bn, AGR (%))
Figure 19 Small/Mid-Scale Infrastructure Market Share Forecast by Region, 2024 & 2034 (%)
Figure 20 Large Scale Infrastructure Market by Region, 2024-2034 (US$ Bn, AGR (%))
Figure 21 Large Scale Infrastructure Market Share Forecast by Region, 2024 & 2034 (%)
Figure 22 Hydrogen Infrastructure Market by Purity: Market Attractiveness Index
Figure 23 Global Hydrogen Infrastructure Market by Purity, 2024-2034 (US$ Bn, AGR (%))
Figure 24 Hydrogen Infrastructure Market Share Forecast by Purity, 2024, 2029, 2034 (%)
Figure 25 High Purity Hydrogen (99.999%) Market by Region, 2024-2034 (US$ Bn, AGR (%))
Figure 26 High Purity Hydrogen (99.999%) Market Share Forecast by Region, 2024 & 2034 (%)
Figure 27 Medium Purity Hydrogen (95-99%) Market by Region, 2024-2034 (US$ Bn, AGR (%))
Figure 28 Medium Purity Hydrogen (95-99%) Market Share Forecast by Region, 2024 & 2034 (%)
Figure 29 Low Purity Hydrogen (Below 95%) Market by Region, 2024-2034 (US$ Bn, AGR (%))
Figure 30 Low Purity Hydrogen (Below 95%) Market Share Forecast by Region, 2024 & 2034 (%)
Figure 31 Hydrogen Infrastructure Market by Component: Market Attractiveness Index
Figure 32 Global Hydrogen Infrastructure Market by Component, 2024-2034 (US$ Bn, AGR (%))
Figure 33 Hydrogen Infrastructure Market Share Forecast by Component, 2024, 2029, 2034 (%)
Figure 34 Electrolysers Market by Region, 2024-2034 (US$ Bn, AGR (%))
Figure 35 Electrolysers Market Share Forecast by Region, 2024 & 2034 (%)
Figure 36 Hydrogen Tanks Market by Region, 2024-2034 (US$ Bn, AGR (%))
Figure 37 Hydrogen Tanks Market Share Forecast by Region, 2024 & 2034 (%)
Figure 38 Pipelines Market by Region, 2024-2034 (US$ Bn, AGR (%))
Figure 39 Pipelines Market Share Forecast by Region, 2024 & 2034 (%)
Figure 40 Hydrogen Dispensers Market by Region, 2024-2034 (US$ Bn, AGR (%))
Figure 41 Hydrogen Dispensers Market Share Forecast by Region, 2024 & 2034 (%)
Figure 42 Hydrogen Infrastructure Market by Type: Market Attractiveness Index
Figure 43 Global Hydrogen Infrastructure Market by Type, 2024-2034 (US$ Bn, AGR (%))
Figure 44 Hydrogen Infrastructure Market Share Forecast by Type, 2024, 2029, 2034 (%)
Figure 45 Hydrogen Production Facilities Market by Region, 2024-2034 (US$ Bn, AGR (%))
Figure 46 Hydrogen Production Facilities Market Share Forecast by Region, 2024 & 2034 (%)
Figure 47 Hydrogen Storage Facilities Market by Region, 2024-2034 (US$ Bn, AGR (%))
Figure 48 Hydrogen Storage Facilities Market Share Forecast by Region, 2024 & 2034 (%)
Figure 49 Hydrogen Transportation Infrastructure Market by Region, 2024-2034 (US$ Bn, AGR (%))
Figure 50 Hydrogen Transportation Infrastructure Market Share Forecast by Region, 2024 & 2034 (%)
Figure 51 Hydrogen Refuelling Stations Market by Region, 2024-2034 (US$ Bn, AGR (%))
Figure 52 Hydrogen Refuelling Stations Market Share Forecast by Region, 2024 & 2034 (%)
Figure 53 Other Infrastructures Market by Region, 2024-2034 (US$ Bn, AGR (%))
Figure 54 Other Infrastructures Market Share Forecast by Region, 2024 & 2034 (%)
Figure 55 Hydrogen Infrastructure Market by End-Use: Market Attractiveness Index
Figure 56 Global Hydrogen Infrastructure Market by End-Use, 2024-2034 (US$ Bn, AGR (%))
Figure 57 Hydrogen Infrastructure Market Share Forecast by End-Use, 2024, 2029, 2034 (%)
Figure 58 Transportation Market by Region, 2024-2034 (US$ Bn, AGR (%))
Figure 59 Transportation Market Share Forecast by Region, 2024 & 2034 (%)
Figure 60 Industrial Market by Region, 2024-2034 (US$ Bn, AGR (%))
Figure 61 Industrial Market Share Forecast by Region, 2024 & 2034 (%)
Figure 62 Energy Storage Market by Region, 2024-2034 (US$ Bn, AGR (%))
Figure 63 Energy Storage Market Share Forecast by Region, 2024 & 2034 (%)
Figure 64 Residential and Commercial Heating Market by Region, 2024-2034 (US$ Bn, AGR (%))
Figure 65 Residential and Commercial Heating Market Share Forecast by Region, 2024 & 2034 (%)
Figure 66 Energy Conversion Market by Region, 2024-2034 (US$ Bn, AGR (%))
Figure 67 Energy Conversion Market Share Forecast by Region, 2024 & 2034 (%)
Figure 68 Other End-Use Market by Region, 2024-2034 (US$ Bn, AGR (%))
Figure 69 Other End-Use Market Share Forecast by Region, 2024 & 2034 (%)
Figure 70 Hydrogen Infrastructure Market Forecast by Region 2024 and 2034 (Revenue, CAGR%)
Figure 71 Hydrogen Infrastructure Market Share Forecast by Region 2024, 2029, 2034 (%)
Figure 72 Global Hydrogen Infrastructure Market by Region, 2024-2034 (US$ Bn, AGR (%))
Figure 73 North America Hydrogen Infrastructure Market Attractiveness Index
Figure 74 North America Hydrogen Infrastructure Market by Region, 2024, 2029 & 2034 (US$ Billion)
Figure 75 North America Hydrogen Infrastructure Market by Value, 2024-2034 (US$ Bn, AGR (%))
Figure 76 North America Hydrogen Infrastructure Market by Country, 2024-2034 (US$ Bn, AGR (%))
Figure 77 North America Hydrogen Infrastructure Market Share Forecast by Country, 2024 & 2034 (%)
Figure 78 North America Hydrogen Infrastructure Market by Size, 2024-2034 (US$ Bn, AGR (%))
Figure 79 North America Hydrogen Infrastructure Market Share Forecast Size, 2024 & 2034 (%)
Figure 80 North America Hydrogen Infrastructure Market by Purity, 2024-2034 (US$ Bn, AGR (%))
Figure 81 North America Hydrogen Infrastructure Market Share Forecast by Purity, 2024 & 2034 (%)
Figure 82 North America Hydrogen Infrastructure Market by Component, 2024-2034 (US$ Bn, AGR (%))
Figure 83 North America Hydrogen Infrastructure Market Share Forecast by Component, 2024 & 2034 (%)
Figure 84 North America Hydrogen Infrastructure Market by Type, 2024-2034 (US$ Bn, AGR (%))
Figure 85 North America Hydrogen Infrastructure Market Share Forecast by Type, 2024 & 2034 (%)
Figure 86 North America Hydrogen Infrastructure Market by End-Use, 2024-2034 (US$ Bn, AGR (%))
Figure 87 North America Hydrogen Infrastructure Market Share Forecast by End-Use, 2024 & 2034 (%)
Figure 88 US Hydrogen Infrastructure Market by Value, 2024-2034 (US$ Bn, AGR (%))
Figure 89 Canada Hydrogen Infrastructure Market by Value, 2024-2034 (US$ Bn, AGR (%))
Figure 90 Europe Hydrogen Infrastructure Market Attractiveness Index
Figure 91 Europe Hydrogen Infrastructure Market by Region, 2024, 2029 & 2034 (US$ Billion)
Figure 92 Europe Hydrogen Infrastructure Market by Value, 2024-2034 (US$ Bn, AGR (%))
Figure 93 Europe Hydrogen Infrastructure Market by Country, 2024-2034 (US$ Bn, AGR (%))
Figure 94 Europe Hydrogen Infrastructure Market Share Forecast by Country, 2024 & 2034 (%)
Figure 95 Europe Hydrogen Infrastructure Market by Size, 2024-2034 (US$ Bn, AGR (%))
Figure 96 Europe Hydrogen Infrastructure Market Share Forecast Size, 2024 & 2034 (%)
Figure 97 Europe Hydrogen Infrastructure Market by Purity, 2024-2034 (US$ Bn, AGR (%))
Figure 98 Europe Hydrogen Infrastructure Market Share Forecast by Purity, 2024 & 2034 (%)
Figure 99 Europe Hydrogen Infrastructure Market by Component, 2024-2034 (US$ Bn, AGR (%))
Figure 100 Europe Hydrogen Infrastructure Market Share Forecast by Component, 2024 & 2034 (%)
Figure 101 Europe Hydrogen Infrastructure Market by Type, 2024-2034 (US$ Bn, AGR (%))
Figure 102 Europe Hydrogen Infrastructure Market Share Forecast by Type, 2024 & 2034 (%)
Figure 103 Europe Hydrogen Infrastructure Market by End-Use, 2024-2034 (US$ Bn, AGR (%))
Figure 104 Europe Hydrogen Infrastructure Market Share Forecast by End-Use, 2024 & 2034 (%)
Figure 105 Germany Hydrogen Infrastructure Market by Value, 2024-2034 (US$ Bn, AGR (%))
Figure 106 UK Hydrogen Infrastructure Market by Value, 2024-2034 (US$ Bn, AGR (%))
Figure 107 France Hydrogen Infrastructure Market by Value, 2024-2034 (US$ Bn, AGR (%))
Figure 108 Italy Hydrogen Infrastructure Market by Value, 2024-2034 (US$ Bn, AGR (%))
Figure 109 Spain Hydrogen Infrastructure Market by Value, 2024-2034 (US$ Bn, AGR (%))
Figure 110 Rest of Europe Hydrogen Infrastructure Market by Value, 2024-2034 (US$ Bn, AGR (%))
Figure 111 Asia-Pacific Hydrogen Infrastructure Market Attractiveness Index
Figure 112 Asia-Pacific Hydrogen Infrastructure Market by Region, 2024, 2029 & 2034 (US$ Billion)
Figure 113 Asia-Pacific Hydrogen Infrastructure Market by Value, 2024-2034 (US$ Bn, AGR (%))
Figure 114 Asia-Pacific Hydrogen Infrastructure Market by Country, 2024-2034 (US$ Bn, AGR (%))
Figure 115 Asia-Pacific Hydrogen Infrastructure Market Share Forecast by Country, 2024 & 2034 (%)
Figure 116 Asia-Pacific Hydrogen Infrastructure Market by Size, 2024-2034 (US$ Bn, AGR (%))
Figure 117 Asia-Pacific Hydrogen Infrastructure Market Share Forecast Size, 2024 & 2034 (%)
Figure 118 Asia-Pacific Hydrogen Infrastructure Market by Purity, 2024-2034 (US$ Bn, AGR (%))
Figure 119 Asia-Pacific Hydrogen Infrastructure Market Share Forecast by Purity, 2024 & 2034 (%)
Figure 120 Asia-Pacific Hydrogen Infrastructure Market by Component, 2024-2034 (US$ Bn, AGR (%))
Figure 121 Asia-Pacific Hydrogen Infrastructure Market Share Forecast by Component, 2024 & 2034 (%)
Figure 122 Asia-Pacific Hydrogen Infrastructure Market by Type, 2024-2034 (US$ Bn, AGR (%))
Figure 123 Asia-Pacific Hydrogen Infrastructure Market Share Forecast by Type, 2024 & 2034 (%)
Figure 124 Asia-Pacific Hydrogen Infrastructure Market by End-Use, 2024-2034 (US$ Bn, AGR (%))
Figure 125 Asia-Pacific Hydrogen Infrastructure Market Share Forecast by End-Use, 2024 & 2034 (%)
Figure 126 China Hydrogen Infrastructure Market by Value, 2024-2034 (US$ Bn, AGR (%))
Figure 127 India Hydrogen Infrastructure Market by Value, 2024-2034 (US$ Bn, AGR (%))
Figure 128 Japan Hydrogen Infrastructure Market by Value, 2024-2034 (US$ Bn, AGR (%))
Figure 129 South Korea Hydrogen Infrastructure Market by Value, 2024-2034 (US$ Bn, AGR (%))
Figure 130 Australia Hydrogen Infrastructure Market by Value, 2024-2034 (US$ Bn, AGR (%))
Figure 131 Rest of Asia-Pacific Hydrogen Infrastructure Market by Value, 2024-2034 (US$ Bn, AGR (%))
Figure 132 Middle East and Africa Hydrogen Infrastructure Market Attractiveness Index
Figure 133 Middle East and Africa Hydrogen Infrastructure Market by Region, 2024, 2029 & 2034 (US$ Billion)
Figure 134 Middle East & Africa Hydrogen Infrastructure Market by Value, 2024-2034 (US$ Bn, AGR (%))
Figure 135 Middle East & Africa Hydrogen Infrastructure Market by Country, 2024-2034 (US$ Bn,AGR (%))
Figure 136 Middle East and Africa Hydrogen Infrastructure Market Share Forecast by Country, 2024 & 2034 (%)
Figure 137 Middle East & Africa Hydrogen Infrastructure Market by Size, 2024-2034 (US$ Bn, AGR (%))
Figure 138 Middle East and Africa Hydrogen Infrastructure Market Share Forecast Size, 2024 & 2034 (%)
Figure 139 Middle East & Africa Hydrogen Infrastructure Market by Purity, 2024-2034 (US$ Bn, AGR (%))
Figure 140 Middle East and Africa Hydrogen Infrastructure Market Share Forecast by Purity, 2024 & 2034 (%)
Figure 141 Middle East & Africa Hydrogen Infrastructure Market by Component, 2024-2034 (US$ Bn, AGR (%))
Figure 142 Middle East and Africa Hydrogen Infrastructure Market Share Forecast by Component, 2024 & 2034 (%)
Figure 143 Middle East & Africa Hydrogen Infrastructure Market by Type, 2024-2034 (US$ Bn, AGR (%))
Figure 144 Middle East and Africa Hydrogen Infrastructure Market Share Forecast by Type, 2024 & 2034 (%)
Figure 145 Middle East & Africa Hydrogen Infrastructure Market by End-Use, 2024-2034 (US$ Bn, AGR (%))
Figure 146 Middle East and Africa Hydrogen Infrastructure Market Share Forecast by End-Use, 2024 & 2034 (%)
Figure 147 GCC Hydrogen Infrastructure Market by Value, 2024-2034 (US$ Bn, AGR (%))
Figure 148 South Africa Hydrogen Infrastructure Market by Value, 2024-2034 (US$ Bn, AGR (%))
Figure 149 Rest of Middle East & Africa Hydrogen Infrastructure Market by Value, 2024-2034 (US$ Bn, AGR (%))
Figure 150 Latin America Hydrogen Infrastructure Market Attractiveness Index
Figure 151 Latin America Hydrogen Infrastructure Market by Region, 2024, 2029 & 2034 (US$ Billion)
Figure 152 Latin America Hydrogen Infrastructure Market by Value, 2024-2034 (US$ Bn, AGR (%))
Figure 153 Latin America Hydrogen Infrastructure Market by Country, 2024-2034 (US$ Bn, AGR (%))
Figure 154 Latin America Hydrogen Infrastructure Market Share Forecast by Country, 2024 & 2034 (%)
Figure 155 Latin America Hydrogen Infrastructure Market by Size, 2024-2034 (US$ Bn, AGR (%))
Figure 156 Latin America Hydrogen Infrastructure Market Share Forecast Size, 2024 & 2034 (%)
Figure 157 Latin America Hydrogen Infrastructure Market by Purity, 2024-2034 (US$ Bn, AGR (%))
Figure 158 Latin America Hydrogen Infrastructure Market Share Forecast by Purity, 2024 & 2034 (%)
Figure 159 Latin America Hydrogen Infrastructure Market by Component, 2024-2034 (US$ Bn, AGR (%))
Figure 160 Latin America Hydrogen Infrastructure Market Share Forecast by Component, 2024 & 2034 (%)
Figure 161 Latin America Hydrogen Infrastructure Market by Type, 2024-2034 (US$ Bn, AGR (%))
Figure 162 Latin America Hydrogen Infrastructure Market Share Forecast by Type, 2024 & 2034 (%)
Figure 163 Latin America Hydrogen Infrastructure Market by End-Use, 2024-2034 (US$ Bn, AGR (%))
Figure 164 Latin America Hydrogen Infrastructure Market Share Forecast by End-Use, 2024 & 2034 (%)
Figure 165 Brazil Hydrogen Infrastructure Market by Value, 2024-2034 (US$ Bn, AGR (%))
Figure 166 Mexico Hydrogen Infrastructure Market by Value, 2024-2034 (US$ Bn, AGR (%))
Figure 167 Rest of Latin America Hydrogen Infrastructure Market by Value, 2024-2034 (US$ Bn, AGR (%))
Figure 168 Hydrogen Infrastructure Market: Company Share, 2022
Figure 169 Air Liquide SA.: Net Revenue, 2019-2023 (US$ Million, AGR%)
Figure 170 Air Liquide SA.: R&D, 2019-2023 (US$ Million, AGR%)
Figure 171 Air Liquide SA.: Regional Revenue Share, 2023 (%)
Figure 172 Air Liquide SA.: Business Segment Revenue Share, 2023 (%)
Figure 173 Cummins Inc.: Net Revenue, 2019-2023 (US$ Million, AGR%)
Figure 174 Cummins Inc.: R&D, 2019-2023 (US$ Million, AGR%)
Figure 175 Mitsubishi Power, Ltd..: Net Revenue, 2019-2023 (US$ Million, AGR%)
Figure 176 Mitsubishi Power, Ltd..: R&D, 2019-2023 (US$ Million, AGR%)
Figure 177 Mitsubishi Power, Ltd..: Regional Revenue Share, 2023 (%)
Figure 178 Mitsubishi Power, Ltd..: Business Segment Revenue Share, 2023 (%)
Figure 179 Siemens Energy AG.: Net Revenue, 2019-2023 (US$ Million, AGR%)
Figure 180 Siemens Energy AG.: R&D, 2019-2023 (US$ Million, AGR%)
Figure 181 Siemens Energy AG.: Regional Revenue Share, 2023 (%)
Figure 182 Siemens Energy AG.: Business Segment Revenue Share, 2023 (%)
Figure 183 Engie SA.: Net Revenue, 2019-2023 (US$ Million, AGR%)
Figure 184 Engie SA.: Regional Revenue Share, 2023 (%)
Figure 185 Engie SA.: Business Segment Revenue Share, 2023 (%)
Figure 186 Plug Power Inc.: Net Revenue, 2019-2023 (US$ Million, AGR%)
Figure 187 Plug Power Inc.: R&D, 2019-2023 (US$ Million, AGR%)
Figure 188 Plug Power Inc.: Regional Revenue Share, 2023 (%)
Figure 189 Ballard Power Systems Inc.: Net Revenue, 2019-2023 (US$ Million, AGR%)
Figure 190 Ballard Power Systems Inc.: R&D, 2019-2023 (US$ Million, AGR%)
Figure 191 Ballard Power Systems Inc.: Regional Revenue Share, 2023 (%)
Figure 192 Nel ASA.: Net Revenue, 2019-2023 (US$ Million, AGR%)
Figure 193 Nel ASA.: R&D, 2019-2023 (US$ Million, AGR%)
Figure 194 Nel ASA.: Regional Revenue Share, 2023 (%)
Figure 195 Nel ASA.: Business Segment Revenue Share, 2023 (%)
Figure 196 Fuel Cell Energy, Inc.: Net Revenue, 2019-2023 (US$ Million, AGR%)
Figure 197 Fuel Cell Energy, Inc.: R&D, 2019-2023 (US$ Million, AGR%)
Figure 198 Fuel Cell Energy, Inc.: Regional Revenue Share, 2023 (%)
Figure 199 ITM Power plc.: Net Revenue, 2019-2023 (US$ Million, AGR%)
Figure 200 ITM Power plc.: R&D, 2019-2023 (US$ Million, AGR%)
Figure 201 ITM Power plc.: Regional Revenue Share, 2023 (%)
Figure 202 ITM Power plc.: Business Segment Revenue Share, 2023 (%)
Figure 203 Linde plc.: Net Revenue, 2019-2023 (US$ Million, AGR%)
Figure 204 Linde plc.: R&D, 2019-2023 (US$ Million, AGR%)
Figure 205 Linde plc.: Regional Revenue Share, 2023 (%)
Figure 206 Linde plc.: Business Segment Revenue Share, 2023 (%)
Figure 207 Air Products and Chemicals, Inc.: Net Revenue, 2019-2023 (US$ Million, AGR%)
Figure 208 Air Products and Chemicals, Inc.: R&D, 2019-2023 (US$ Million, AGR%)
Figure 209 Air Products and Chemicals, Inc..: Regional Revenue Share, 2023 (%)
Figure 210 Air Products and Chemicals, Inc.: Business Segment Revenue Share, 2023 (%)
Figure 211 Kawasaki Heavy Industries, Ltd..: Net Revenue, 2019-2023 (US$ Million, AGR%)
Figure 212 Kawasaki Heavy Industries, Ltd..: R&D, 2019-2023 (US$ Million, AGR%)
Figure 213 McPhy Energy SA.: Net Revenue, 2019-2023 (US$ Million, AGR%)
ページTOPに戻る
- 本レポートと同じKEY WORDの最新刊レポートはありません。
よくあるご質問
Visiongain社はどのような調査会社ですか?
英国の調査会社ヴィジョンゲイン社(Visiongain)は、通信とエネルギーのほか、自動車や化学・医薬品、金属など、広範な市場を対象に調査を行っています。自動車市場については、市場全般に関する調査のほ... もっと見る
調査レポートの納品までの日数はどの程度ですか?
在庫のあるものは速納となりますが、平均的には 3-4日と見て下さい。
但し、一部の調査レポートでは、発注を受けた段階で内容更新をして納品をする場合もあります。
発注をする前のお問合せをお願いします。
注文の手続きはどのようになっていますか?
1)お客様からの御問い合わせをいただきます。
2)見積書やサンプルの提示をいたします。
3)お客様指定、もしくは弊社の発注書をメール添付にて発送してください。
4)データリソース社からレポート発行元の調査会社へ納品手配します。
5) 調査会社からお客様へ納品されます。最近は、pdfにてのメール納品が大半です。
お支払方法の方法はどのようになっていますか?
納品と同時にデータリソース社よりお客様へ請求書(必要に応じて納品書も)を発送いたします。
お客様よりデータリソース社へ(通常は円払い)の御振り込みをお願いします。
請求書は、納品日の日付で発行しますので、翌月最終営業日までの当社指定口座への振込みをお願いします。振込み手数料は御社負担にてお願いします。
お客様の御支払い条件が60日以上の場合は御相談ください。
尚、初めてのお取引先や個人の場合、前払いをお願いすることもあります。ご了承のほど、お願いします。
データリソース社はどのような会社ですか?
当社は、世界各国の主要調査会社・レポート出版社と提携し、世界各国の市場調査レポートや技術動向レポートなどを日本国内の企業・公官庁及び教育研究機関に提供しております。
世界各国の「市場・技術・法規制などの」実情を調査・収集される時には、データリソース社にご相談ください。
お客様の御要望にあったデータや情報を抽出する為のレポート紹介や調査のアドバイスも致します。
|
|

