衛星地上局市場レポート:2024-2034
Satellite Ground Station Market Report 2024-2034
レポート詳細
衛星地上局市場レポート 2024-2034年 :この調査レポートは、業界とその基礎となる原動力をより良く理解することを望むなら、新たな収益ポケットを目指す大手企業にとって貴重なものと... もっと見る
※上記価格は部署ライセンス(Departmental licence)価格です。
その他の価格についてはデータリソースまでお問合せください。
日本語のページは自動翻訳を利用し作成しています。
実際のレポートは英文のみでご納品いたします。
サマリー
レポート詳細
衛星地上局市場レポート 2024-2034年:この調査レポートは、業界とその基礎となる原動力をより良く理解することを望むなら、新たな収益ポケットを目指す大手企業にとって貴重なものとなるでしょう。異業種への進出や新規地域での既存事業の拡大を目指す企業にも有用です。
さまざまな産業で高まる衛星通信とデータ伝送サービスの需要
衛星地上局市場は、様々な産業における衛星通信とデータ伝送サービスの需要増加に牽引され、大きな成長を遂げようとしている。市場拡大を後押しする主な要因としては、通信、放送、政府・軍事活動、航空宇宙・防衛、科学研究、海上ナビゲーションなど、衛星ベースのアプリケーションの採用拡大が挙げられる。さらに、高スループット衛星の配備や小型衛星コンステレーションの出現といった衛星技術の進歩が、これらのシステムをサポートする地上局インフラへの需要を煽っている。
このような有利な市場環境の中、業界関係者が活用できる機会は数多く存在する。市場参加者間の協力とパートナーシップは、技術革新と特定のエンドユーザー要件に合わせた統合ソリューション開発の道を提供する。さらに、国内および国際レベルでの事業拡大により、特に衛星通信インフラが未発達な地域や、信頼性の高い接続に対するニーズが高まっている地域において、市場拡大の機会がもたらされる。
しかし、衛星地上局市場は、その成長軌道を妨げる可能性のあるいくつかの課題にも直面している。テレメトリー、トラッキング、コマンドシステムに関する問題は、地上局オペレータに運用上の課題をもたらし、データ取得や伝送効率に影響を与える。さらに、規制上の制約や周波数割り当ての問題は、特定の地域における衛星通信システムの展開を制限し、市場の拡大を妨げる可能性がある。
統一された規制や政府政策の不在
統一された規制や政府方針がないことが、市場環境における大きな阻害要因となっている。異なる地域や管轄区域にまたがる標準化されたガイドラインや政策がないため、同市場で事業を展開する企業は、規制の枠組みをうまく利用する上で課題に直面している。このような統一性の欠如は、特にグローバル規模で事業を展開する企業や、新規市場への進出を目指す企業にとって、混乱、非効率、コンプライアンス・コストの増加につながる可能性がある。統一された規制がないことから生じる主な懸念事項のひとつは、コンプライアンス要件に一貫性がないことである。企業は、異なる地域で事業を展開する際に、さまざまな規制基準や要件に遭遇する可能性があり、プロセスを合理化し、全体的なコンプライアンスを確保することが難しくなる。その結果、製品上市の遅れ、市場参入の障壁、企業運営の複雑化などが生じる可能性がある。
市場調査レポートを購入する前にすべき質問とは?
-
衛星地上局市場はどのように進化しているのか?
-
衛星地上局市場の推進要因と抑制要因は何か?
-
衛星地上局の各サブマーケットは、予測期間中にどのように成長し、2034年にはどれくらいの収益を占めるようになるのか?
-
2024年から2034年にかけて、衛星地上局の各サブマーケットの市場シェアはどのように推移するのか?
-
2024年から2034年にかけて、市場全体を牽引する主な要因は何か?
-
主要な衛星地上局市場はマクロ経済の動きに幅広く追随するのか、それとも個々の国の市場が他を凌駕するのか。
-
2034年までに各国市場のシェアはどのように変化し、どの地域が2034年の市場をリードするのか。
-
主要プレーヤーと予測期間中の見通しは?
-
これらの大手企業の衛星地上局プロジェクトとは?
-
2024年から2034年の間に、この業界はどのように発展していくのか?現在および今後10年間に行われる衛星地上局プロジェクトの影響とは?
-
衛星地上局市場をさらに拡大するために、製品の商業化の必要性は高まっているのか?
-
衛星地上局市場はどこに向かっているのか、また、どのようにすれば市場の最前線に立てるのか?
-
新商品や新サービスに最適な投資方法とは?
-
企業を新たな成長軌道に乗せ、C-suiteに移行させるための重要な展望とは?
このことが、現在、そして今後10年間の衛星地上局市場にどのような影響を与えるかを見極める必要がある:
-
134の表と214の図表を掲載した422ページのレポートをお届けします。
-
本レポートでは、業界における主要な有利分野を取り上げているため、今すぐターゲットを絞ることができる。
-
世界、地域、国の売上高と成長に関する詳細な分析が含まれている。
-
競合他社が成功した主なトレンド、変化、収益予測をハイライトします。
本レポートは、衛星地上局市場が今後10年間でどのように発展していくのか、またCOVID-19の景気後退と好転の変動に合わせてどのように発展していくのかをTODAYでお伝えします。この市場は、過去10年間のどの時点よりも今が重要である。
2034年までの予測やその他の分析から、商業的な展望が明らかになる
-
2034年までの収益予測に加え、最近の実績、成長率、市場シェアも提供している。
-
ビジネスの展望や展開など、独自の分析が掲載されている。
-
定性的分析(市場ダイナミクス、促進要因、機会、阻害要因、課題を含む)、コスト構造、衛星地上局価格上昇の影響、最新動向をご覧いただけます。
本レポートには、COVID-19が業界と貴社にどのような影響を与えるかについてのデータ分析と貴重な洞察が含まれている。本レポートでは、COVID-19の4つの回収パターンとその影響、すなわち「V」、「L」、「W」、「U」について論じている。
レポート対象セグメント
所在地別市場セグメント
-
地球低軌道(LEO)カバーエリア
-
静止軌道(GEO)カバーエリア
用途別市場セグメント
タイプ別市場セグメント
-
テレポート
-
遠隔地上局
-
アース・ステーション
-
追跡データ中継衛星システム(TDRSS)
周波数帯別市場セグメント
-
Xバンド
-
Kuバンド
-
Kaバンド
-
Sバンド
-
Cバンド
エンドユーザー産業別市場セグメント
-
電気通信
-
放送
-
政府と軍
-
航空宇宙・防衛
-
科学的研究
-
その他のエンドユーザー産業
世界市場全体とセグメント別の収益予測に加え、4つの地域と20の主要国市場の収益予測も掲載しています:
北米
欧州
-
ドイツ
-
ロシア
-
イギリス
-
フランス
-
イタリア
-
その他の欧州地域
アジア太平洋
-
中国
-
日本
-
インド
-
オーストラリア
-
韓国
-
その他のアジア太平洋地域
ラテンアメリカ
中東・アフリカ
このレポートには、2024年から2034年までの衛星地上局市場における主要企業のプロフィールも含まれており、これらの企業の事業のこのセグメントに重点を置いています。
報告書に掲載されている主要企業
-
Airbus Defence and Space
-
Cobham Limited
-
General Dynamics Corporation
-
Intelsat S.A.
-
Iridium Communications Inc.
-
Kratos Defence & Security Solutions, Inc.
-
L3Harris Technologies, Inc.
-
Lockheed Martin Corporation
-
Mitsubishi Electric Corporation
-
Northrop Grumman Corporation
-
Raytheon Technologies Corporation
-
SES S.A.
-
Thales Group
-
The Boeing Company
-
Viasat Inc.
2024年から2034年までの衛星地上局市場全体の世界売上高は、金額ベースで2024年に743億1,000万米ドルを突破する。2034年まで力強い収益成長を予測。当調査では、最も大きな可能性を秘めた企業を特定しています。彼らの能力、進歩、商業的展望を発見し、一歩先を行くお手伝いをします。
衛星地上局市場、2024-2034年レポートはどのように役立つのか?
要約すると、420ページを超えるこのレポートは、以下の知識を提供する:
-
衛星地上局市場、2024年から2034年までの収益予測 衛星地上局市場、2024年から2034年までの収益予測 衛星地上局市場、2024年から2034年までの収益予測 衛星地上局市場、2024年から2034年までの収益予測 (場所、用途、タイプ、周波数帯域、エンドユーザー産業の各予測を世界および地域レベルで掲載) - 業界の展望を発見し、投資と収益に最も有利な場所を見つけることができます。
-
4つの地域と20の主要国市場の2034年までの収益予測 - 衛星地上局市場の2024年から2034年までの北米、ヨーロッパ、アジア太平洋、ラテンアメリカ、中東・アフリカの市場予測をご覧ください。また、米国、カナダ、ブラジル、ドイツ、フランス、英国、ロシア、イタリア、中国、インド、日本、オーストラリアなど著名な経済圏の市場も予測しています。
-
2024年から2034年までの衛星地上局市場に関わる主要企業15社の企業プロファイルを含む。
独自の予測による定量的・定性的分析をご覧ください。私たちのレポートだけに含まれる情報を入手し、貴重なビジネスインテリジェンスで情報を得ることができます。
他にはない情報
私たちの新しいレポートがあれば、知識に遅れをとったり、チャンスを逃したりする可能性が低くなります。弊社の調査レポートが貴社の調査、分析、意思決定にどのように役立つかをご覧ください。Visiongainの調査は、衛星地上局市場、2024年から2034年、市場をリードする企業の商業分析を必要とするすべての人のためのものです。データ、トレンド、予測をご覧いただけます。
ページTOPに戻る
目次
1 レポート概要
1.1 研究の目的
1.2 衛星地上局市場の紹介
1.3 本レポートの内容
1.4 本レポートを読むべき理由
1.5 本分析レポートが回答する主な質問
1.6 本レポートは誰のためのものか?
1.7 方法論
1.7.1 市場の定義
1.7.2 市場評価・予測手法
1.7.3 データの検証
1.7.3.1 一次調査
1.7.3.2 セカンダリーリサーチ
1.8 よくある質問(FAQ)
1.9 Visiongainの関連レポート
1.10 Visiongainについて
2 エグゼクティブ・サマリー
3 市場概要
3.1 主要な調査結果
3.2 市場ダイナミクス
3.2.1 市場促進要因
3.2.1.1 軍事・防衛衛星地上局ソリューションの需要増加
3.2.1.2 テレメトリ、テレコマンド、オンラインストリーミングサービス、ラジオ、テレビ放送における衛星地上局機器の採用増加
3.2.1.3 市場成長を牽引する衛星地上局の技術進歩
3.2.2 市場抑制要因
3.2.2.1 統一された規制と政府政策の不在
3.2.2.2 テレメトリー、トラッキング、コマンドに関する問題が市場成長を妨げる
3.2.2.3 衛星地上局に対するサイバーセキュリティの脅威が市場成長を妨げる
3.2.3 市場機会
3.2.3.1 衛星地上局への投資の増加
3.2.3.2 市場プレイヤー間のコラボレーションとパートナーシップが市場成長の機会
3.2.3.3 国内・国際レベルでの事業拡大 市場成長の機会
3.3 ポーターのファイブフォース分析
3.3.1 サプライヤーの交渉力(低)
3.3.2 買い手の交渉力(中)
3.3.3 競争力(高)
3.3.4 代替品による脅威(中)
3.3.5 新規参入の脅威(低)
3.4 COVID-19の影響分析
3.4.1 "V字型回復"
3.4.2 "U字型回復"
3.4.3 "W字型回復"
3.4.4 "L字型回復"
3.5 PEST分析
4 衛星地上局市場分析:場所別
4.1 主要調査結果
4.2 ロケーションセグメント 市場魅力度指数
4.3 場所別衛星地上局市場規模推定と予測
4.4 地球低軌道(LEO)カバーエリア
4.4.1 2024〜2034年の地域別市場規模(US$ Billion)
4.4.2 地域別市場シェア、2024年・2034年(%)
4.5 静止軌道(GEO)のカバーエリア
4.5.1 2024年~2034年の地域別市場規模(US$ Billion)
4.5.2 地域別市場シェア、2024年・2034年(%)
5 衛星地上局市場分析:用途別
5.1 主要調査結果
5.2 アプリケーションセグメント 市場魅力度指数
5.3 衛星地上局の用途別市場規模推定と予測
5.4 通信衛星
5.4.1 2024〜2034年の地域別市場規模(US$ Billion)
5.4.2 地域別市場シェア、2024年・2034年(%)
5.5 気象衛星
5.5.1 2024〜2034年の地域別市場規模(US$ Billion)
5.5.2 地域別市場シェア、2024年・2034年(%)
5.6 地球観測衛星
5.6.1 2024~2034年の地域別市場規模(US$ Billion)
5.6.2 地域別市場シェア、2024年・2034年(%)
6 衛星地上局市場分析:タイプ別
6.1 主要な調査結果
6.2 タイプ別セグメント 市場魅力度指数
6.3 衛星地上局のタイプ別市場規模推定と予測
6.4 テレポート
6.4.1 2024〜2034年の地域別市場規模(US$ Billion)
6.4.2 地域別市場シェア、2024年・2034年(%)
6.5 遠隔地上局
6.5.1 2024〜2034年の地域別市場規模(US$ Billion)
6.5.2 地域別市場シェア、2024年・2034年(%)
6.6 地球局
6.6.1 2024年~2034年の地域別市場規模(US$ Billion)
6.6.2 地域別市場シェア、2024年・2034年(%)
6.7 追跡・データ中継衛星システム(TDRSS)
6.7.1 2024~2034年の地域別市場規模(US$ Billion)
6.7.2 地域別市場シェア、2024年・2034年(%)
7 衛星地上局市場分析:周波数帯別
7.1 主要調査結果
7.2 周波数帯域セグメント 市場魅力度指数
7.3 衛星地上局の周波数帯別市場規模推定と予測
7.4 Xバンド
7.4.1 2024~2034年の地域別市場規模(US$ Billion)
7.4.2 地域別市場シェア、2024年・2034年(%)
7.5 Kuバンド
7.5.1 2024~2034年の地域別市場規模(US$ Billion)
7.5.2 地域別市場シェア、2024年・2034年(%)
7.6 Kaバンド
7.6.1 2024~2034年の地域別市場規模(US$ Billion)
7.6.2 地域別市場シェア、2024年・2034年(%)
7.7 Sバンド
7.7.1 2024~2034年の地域別市場規模(US$ Billion)
7.7.2 地域別市場シェア、2024年・2034年(%)
7.8 Cバンド
7.8.1 2024~2034年の地域別市場規模(US$ Billion)
7.8.2 地域別市場シェア、2024年・2034年(%)
8 衛星地上局市場分析:エンドユーザー産業別
8.1 主要調査結果
8.2 エンドユーザー産業セグメント: 市場魅力度指数
8.3 衛星地上局のエンドユーザー産業別市場規模推定と予測
8.4 通信
8.4.1 2024年~2034年の地域別市場規模(US$ Million)
8.4.2 地域別市場シェア、2024年・2034年(%)
8.5 放送
8.5.1 2024~2034年の地域別市場規模(US$ Million)
8.5.2 地域別市場シェア、2024年・2034年(%)
8.6 政府・軍事
8.6.1 2024年~2034年の地域別市場規模(US$ Million)
8.6.2 地域別市場シェア、2024年・2034年(%)
8.7 航空宇宙と防衛
8.7.1 2024年~2034年の地域別市場規模(US$ Million)
8.7.2 地域別市場シェア、2024年・2034年(%)
8.8 科学研究
8.8.1 2024〜2034年の地域別市場規模(US$ Million)
8.8.2 地域別市場シェア、2024年・2034年(%)
8.9 その他のエンドユーザー産業
8.9.1 2024年~2034年の地域別市場規模(US$ Million)
8.9.2 地域別市場シェア、2024年・2034年(%)
9 衛星地上局市場分析:地域別
9.1 主要な調査結果
9.2 地域別市場規模の推定と予測
10 北米の衛星地上局の市場分析
10.1 主要な調査結果
10.2 北米の衛星地上局市場魅力度指数
10.3 北米の衛星地上局国別市場:2024年、2029年、2034年(US$ Billion)
10.4 北米の衛星地上局市場規模推定と予測
10.5 北米の衛星地上局市場規模推定と予測:国別
10.6 北米の衛星地上局市場規模推定と予測:場所別
10.7 北米の衛星地上局市場規模推定と予測:用途別
10.8 北米の衛星地上局市場規模推定と予測:タイプ別
10.9 北米の衛星地上局市場規模推定と予測:周波数帯別
10.10 北米の衛星地上局市場規模推定と予測:エンドユーザー産業別
10.11 アメリカの衛星地上局市場分析
10.12 カナダの衛星地上局市場分析
11 欧州の衛星地上局の市場分析
11.1 主要な調査結果
11.2 欧州衛星地上局市場魅力度指数
11.3 欧州の衛星地上局国別市場、2024年、2029年、2034年(US$ Billion)
11.4 欧州の衛星地上局市場規模推定と予測
11.5 欧州の衛星地上局市場規模推定と予測:国別
11.6 欧州の衛星地上局市場規模推定と予測:場所別
11.7 欧州の衛星地上局市場規模推定と予測:用途別
11.8 欧州の衛星地上局市場規模推定と予測:タイプ別
11.9 欧州の衛星地上局市場規模推定と予測:周波数帯別
11.10 欧州の衛星地上局市場規模推定と予測:エンドユーザー産業別
11.11 ドイツの衛星地上局市場分析
11.12 イギリスの衛星地上局市場分析
11.13 フランス衛星地上局市場分析
11.14 イタリア衛星地上局市場分析
11.15 ロシアの衛星地上局市場分析
11.16 その他の欧州地域の衛星地上局市場分析
12 アジア太平洋地域の衛星地上局の市場分析
12.1 主要な調査結果
12.2 アジア太平洋地域の衛星地上局市場魅力度指数
12.3 アジア太平洋地域の衛星地上局国別市場、2024年、2029年、2034年(US$ Billion)
12.4 アジア太平洋地域の衛星地上局市場の推定と予測
12.5 アジア太平洋地域の衛星地上局市場規模推定と予測:国別
12.6 アジア太平洋地域の衛星地上局市場規模推定と予測:場所別
12.7 アジア太平洋地域の衛星地上局市場規模推定と予測:用途別
12.8 アジア太平洋地域の衛星地上局市場規模推定と予測:タイプ別
12.9 アジア太平洋地域の衛星地上局市場規模推定と予測:周波数帯別
12.10 アジア太平洋地域の衛星地上局市場規模推定と予測:エンドユーザー産業別
12.11 中国の衛星地上局市場分析
12.12 インドの衛星地上局市場分析
12.13 日本の衛星地上局市場分析
12.14 韓国の衛星地上局市場分析
12.15 オーストラリアの衛星地上局市場分析
12.16 その他のアジア太平洋地域の衛星地上局 市場分析
13 中東・アフリカの衛星地上局の市場分析
13.1 主要な調査結果
13.2 中東・アフリカ衛星地上局市場魅力度指数
13.3 中東・アフリカの衛星地上局国別市場、2024年、2029年、2034年(US$ Billion)
13.4 中東・アフリカの衛星地上局市場規模推定と予測
13.5 中東・アフリカの衛星地上局市場規模推定と予測:国別
13.6 中東・アフリカの衛星地上局市場規模推定と予測:場所別
13.7 中東・アフリカの衛星地上局市場規模推定と予測:用途別
13.8 中東・アフリカの衛星地上局市場規模推定と予測:タイプ別
13.9 中東・アフリカの衛星地上局市場規模推定と予測:周波数帯別
13.10 中東・アフリカの衛星地上局市場規模推定と予測:エンドユーザー産業別
13.11 GCCの衛星地上局市場分析
13.12 南アフリカの衛星地上局市場分析
13.13 その他の中東・アフリカ地域の衛星地上局市場分析
14 ラテンアメリカの衛星地上局の市場分析
14.1 主要な調査結果
14.2 ラテンアメリカの衛星地上局市場魅力度指数
14.3 ラテンアメリカの衛星地上局国別市場、2024年、2029年、2034年(US$ Billion)
14.4 ラテンアメリカの衛星地上局市場規模推定と予測
14.5 ラテンアメリカの衛星地上局市場規模推定と予測:国別
14.6 ラテンアメリカの衛星地上局市場規模推定と予測:場所別
14.7 ラテンアメリカの衛星地上局市場規模推定と予測:用途別
14.8 ラテンアメリカの衛星地上局市場規模推定と予測:タイプ別
14.9 ラテンアメリカの衛星地上局市場規模推定と予測:周波数帯別
14.10 ラテンアメリカの衛星地上局市場規模推定と予測:エンドユーザー産業別
14.11 ブラジルの衛星地上局市場分析
14.12 メキシコの衛星地上局市場分析
14.13 その他のラテンアメリカの衛星地上局市場分析
15 会社概要
15.1 競争環境、2023年
15.2 戦略的展望
15.3 Intelsat S.A.
15.3.1 会社概要
15.3.2 会社概要
15.3.3 製品ベンチマーク
15.3.4 戦略的展望
15.4 SES S.A.
15.4.1 会社概要
15.4.2 会社概要
15.4.3 財務分析
15.4.3.1 純収入、2019-2023年
15.4.3.2 事業セグメント収益シェア、2023年(%)
15.4.4 製品ベンチマーク
15.4.5 戦略的展望
15.5 Viasat Inc.
15.5.1 会社概要
15.5.2 会社概要
15.5.3 財務分析
15.5.3.1 純収入、2019-2023年
15.5.3.2 R&D、2019-2023年
15.5.3.3 地域別収益シェア、2023年(%)
15.5.3.4 事業セグメント収益シェア、2023年(%)
15.5.4 製品ベンチマーク
15.5.5 戦略的展望
15.6 Lockheed Martin Corporation
15.6.1 会社概要
15.6.2 会社概要
15.6.3 財務分析
15.6.3.1 純収入、2019-2023年
15.6.3.2 R&D、2019年〜2023年
15.6.3.3 地域別収益シェア、2023年(%)
15.6.3.4 事業セグメント収益シェア、2023年(%)
15.6.4 製品ベンチマーク
15.6.5 戦略的展望
15.7 Raytheon Technologies Corporation
15.7.1 会社概要
15.7.2 会社概要
15.7.3 財務分析
15.7.3.1 純収入、2019-2023年
15.7.3.2 R&D、2019年~2023年
15.7.3.3 地域別売上高シェア(2023年)
15.7.3.4 事業セグメント収益シェア、2023年(%)
15.7.4 製品ベンチマーク
15.7.5 戦略的展望
15.8 Northrop Grumman Corporation
15.8.1 会社概要
15.8.2 会社概要
15.8.3 財務分析
15.8.3.1 純収入、2019-2023年
15.8.3.2 R&D、2019年〜2023年
15.8.3.3 地域別収益シェア、2023年(%)
15.8.3.4 事業セグメント収益シェア、2023年(%)
15.8.4 製品ベンチマーク
15.8.5 戦略的展望
15.9 L3Harris Technologies, Inc.
15.9.1 会社概要
15.9.2 会社概要
15.9.3 財務分析
15.9.3.1 純収入、2019-2023年
15.9.3.2 R&D、2019-2023年
15.9.3.3 地域別収益シェア、2023年(%)
15.9.3.4 事業セグメント収益シェア、2023年(%)
15.9.4 製品ベンチマーク
15.9.5 戦略的展望
15.10 Airbus Defence and Space
15.10.1 会社概要
15.10.2 会社概要
15.10.3 財務分析
15.10.3.1 純収入、2019-2023年
15.10.3.2 R&D、2019年〜2023年
15.10.3.3 地域別収益シェア、2023年(%)
15.10.3.4 事業セグメント収益シェア、2023年(%)
15.10.4 製品ベンチマーク
15.10.5 戦略的展望
15.11 Thales Group
15.11.1 会社概要
15.11.2 会社概要
15.11.3 財務分析
15.11.3.1 純収入、2019-2023年
15.11.4 製品ベンチマーク
15.11.5 戦略的展望
15.12 Kratos Defence & Security Solutions, Inc.
15.12.1 会社概要
15.12.2 会社概要
15.12.3 財務分析
15.12.3.1 純収入、2019-2023年
15.12.3.2 売上高、2019-2023年
15.12.3.3 事業セグメント収益シェア、2023年(%)
15.12.4 製品ベンチマーク
15.12.5 戦略的展望
15.13 General Dynamics Corporation
15.13.1 会社概要
15.13.2 会社概要
15.13.3 財務分析
15.13.3.1 純収入、2019-2023年
15.13.3.2 R&D、2019-2023年
15.13.3.3 地域別売上高シェア, 2023 (%)
15.13.3.4 事業セグメント収益シェア、2023年(%)
15.13.4 製品ベンチマーク
15.13.5 戦略的展望
15.14 The Boeing Company
15.14.1 会社概要
15.14.2 会社概要
15.14.3 財務分析
15.14.3.1 純収入、2019-2023年
15.14.3.2 R&D、2019-2023年
15.14.3.3 地域別売上高シェア(2023年)
15.14.3.4 事業セグメント収益シェア、2023年(%)
15.14.4 製品ベンチマーク
15.14.5 戦略的展望
15.15 Cobham Limited
15.15.1 会社概要
15.15.2 会社概要
15.15.3 製品ベンチマーク
15.15.4 戦略的展望
15.16 Iridium Communications Inc.
15.16.1 会社概要
15.16.2 会社概要
15.16.3 財務分析
15.16.3.1 純収入(2019-2023年
15.16.3.2 R&D(2019年~2023年
15.16.3.3 地域別売上高シェア(2023年)
15.16.4 製品ベンチマーク
15.16.5 戦略的展望
15.17 Mitsubishi Electric Corporation
15.17.1 会社概要
15.17.2 会社概要
15.17.3 財務分析
15.17.3.1 純収入(2019-2023年
15.17.3.2 売上高、2019-2023年
15.17.3.3 地域別売上高シェア、2023年(%)
15.17.3.4 事業セグメント収益シェア、2023年(%)
15.17.4 製品ベンチマーク
15.17.5 戦略的展望
16 結論と提言
16.1 Visiongainからの結びの言葉
16.2 市場プレイヤーへの提言
ページTOPに戻る
図表リスト
表の一覧
表1 衛星地上局市場のスナップショット、2024年~2034年(10億米ドル、CAGR %)
表2 衛星地上局の地域別世界市場:2024年~2034年(10億ドル、AGR (%)、CAGR (%))(V字回復シナリオ)
表3 衛星地上局の世界地域別市場:2024年~2034年(億米ドル、AGR(%)、CAGR(%))(U字回復シナリオ)
表4 衛星地上局の世界地域別市場:2024年~2034年(10億ドル、AGR(%)、CAGR(%))(W型回復シナリオ)
表5 衛星地上局の世界地域別市場:2024年~2034年(億米ドル、AGR(%)、CAGR(%))(L字型回復シナリオ)
表6 衛星地上局の場所別世界市場:2024年~2034年(億米ドル、AGR (%)、CAGR (%)
表7 低軌道(LEO)カバーエリア地域別市場:2024年~2034年(億米ドル、AGR(%)、CAGR(%)
表8 すべてのGNSS衛星のコンステレーション別リスト
表9 静止軌道(GEO)カバーエリアの地域別市場、2024年~2034年(億米ドル、AGR(%)、CAGR(%))
表10 衛星地上局の世界市場:用途別(2024年~2034年、10億ドル、AGR (%)、CAGR (%)
表11 通信衛星の地域別市場:2024年~2034年(億米ドル、AGR (%)、CAGR (%)
表12 2024~2034年の気象衛星地域別市場(億米ドル、AGR (%)、CAGR (%)
表13 地球観測衛星の地域別市場、2024年~2034年(億米ドル、AGR (%)、CAGR (%)
表14 衛星地上局の世界市場:タイプ別、2024年~2034年(億米ドル、AGR (%)、CAGR (%)
表15 テレポートの地域別市場、2024年~2034年(億米ドル、AGR (%)、CAGR (%)
表16 遠隔地上局地域別市場:2024-2034年(億米ドル、AGR (%)、CAGR (%)
表 17 地球局の地域別市場:2024-2034年(億米ドル、AGR (%)、CAGR (%)
表18 追跡・データ中継衛星システム(TDRSS)の地域別市場、2024年~2034年(億米ドル、AGR (%)、CAGR (%)
表19 衛星地上局の世界市場:周波数帯別、2024年~2034年(億米ドル、AGR (%)、CAGR (%)
表20 Xバンドの地域別市場:2024年~2034年(億米ドル、AGR (%)、CAGR (%)
表21 Kuバンド地域別市場:2024-2034年(億米ドル、AGR (%)、CAGR (%)
表22 Kaバンド地域別市場:2024-2034年(億米ドル、AGR (%)、CAGR (%)
表23 Sバンド地域別市場:2024-2034年(億米ドル、AGR (%)、CAGR (%)
表24 Cバンドの地域別市場:2024年~2034年(億米ドル、AGR (%)、CAGR (%)
表25 衛星地上局の世界市場:エンドユーザー産業別、2024年~2034年(億米ドル、AGR (%)、CAGR (%)
表26 テレコミュニケーション地域別市場:2024年~2034年(億米ドル、AGR (%)、CAGR (%)
表27 放送市場:地域別 2024-2034年 (億米ドル、AGR (%)、CAGR (%)
表 28 政府・軍需市場:地域別 2024-2034 (億米ドル、AGR (%)、CAGR (%))
表29 航空宇宙・防衛市場:地域別市場規模(2024-2034年、10億米ドル、AGR (%)、CAGR (%)
表 30 科学研究市場:地域別 2024-2034 (億米ドル、AGR (%)、CAGR (%))
表31 その他のエンドユーザー産業地域別市場:2024-2034年(億米ドル、AGR (%)、CAGR (%)
表32 衛星地上局の世界地域別市場:2024-2034年(億米ドル、AGR (%)、CAGR (%)
表33 北米の衛星地上局市場:金額ベース、2024-2034年 (億米ドル、AGR (%)、CAGR (%))
表 34 北米の衛星地上局国別市場:2024-2034 (億米ドル、AGR (%)、CAGR (%))
表35 北米の衛星地上局の場所別市場:2024-2034年(億米ドル、AGR (%)、CAGR (%)
表 36 北米の衛星地上局市場:用途別(2024-2034年:億米ドル、AGR (%)、CAGR (%)
表 37 北米の衛星地上局市場:タイプ別(2024-2034年:億米ドル、AGR (%)、CAGR (%)
表 38 北米の衛星地上局市場:周波数帯別(2024-2034年:億米ドル、AGR (%)、CAGR (%)
表39 北米の衛星地上局市場:エンドユーザー産業別:2024-2034年 (億米ドル、AGR (%)、CAGR (%))
表40 その他の国における米国の地上局
表41 米国の衛星地上局市場:金額ベース、2024~2034年(億米ドル、AGR (%)、CAGR (%)
表 42 カナダの衛星地上局市場:金額 2024-2034 (億米ドル、AGR (%)、CAGR (%))
表 43 欧州の衛星地上局市場:金額 2024-2034 (億米ドル、AGR (%)、CAGR (%))
表 44 欧州の衛星地上局国別市場:2024-2034 (億米ドル、AGR (%)、CAGR (%))
表45 欧州の衛星地上局の場所別市場:2024-2034年(億米ドル、AGR (%)、CAGR (%)
表 46 欧州の衛星地上局市場:用途別(2024-2034年:億米ドル、AGR (%)、CAGR (%)
表 47 欧州の衛星地上局のタイプ別市場:2024-2034 (億米ドル、AGR (%)、CAGR (%))
表 48 欧州の衛星地上局の周波数帯別市場:2024-2034 (億米ドル、AGR (%)、CAGR (%))
表 49 欧州の衛星地上局市場:エンドユーザー産業別:2024-2034 (億米ドル、AGR (%)、CAGR (%))
表 50 ドイツの衛星地上局市場:金額ベース(2024-2034年、10億ドル、AGR (%)、CAGR (%)
表 51 イギリスの衛星地上局の金額別市場:2024-2034 (億米ドル、AGR (%)、CAGR (%))
表 52 フランスの衛星地上局の市場規模:2024-2034 (億米ドル、AGR (%)、CAGR (%))
表 53 イタリアの衛星地上局の市場規模:2024-2034 (億米ドル、AGR (%)、CAGR (%))
表 54 ロシアの衛星地上局の市場規模:2024-2034 (億米ドル、AGR (%)、CAGR (%))
表 55 残りのヨーロッパの衛星地上局市場:金額 2024-2034 (億米ドル、AGR (%)、CAGR (%))
表 56 アジア太平洋地域の衛星地上局市場:金額 2024-2034 (億米ドル、AGR (%)、CAGR (%))
表 57 アジア太平洋地域の衛星地上局の国別市場:2024-2034年(億米ドル、AGR (%)、CAGR (%)
表58 アジア太平洋地域の衛星地上局の場所別市場:2024年~2034年(億米ドル、AGR (%)、CAGR (%)
表59 アジア太平洋地域の衛星地上局市場:用途別(2024-2034年、10億ドル、AGR (%)、CAGR (%)
表 60 アジア太平洋地域の衛星地上局のタイプ別市場:2024-2034 (億米ドル、AGR (%)、CAGR (%))
表61 アジア太平洋地域の衛星地上局の周波数帯別市場:2024年~2034年(億米ドル、AGR (%)、CAGR (%)
表62 アジア太平洋地域の衛星地上局市場:エンドユーザー産業別(2024年~2034年、10億ドル、AGR (%)、CAGR (%)
表 63 中国の衛星地上局市場:金額ベース(2024-2034年、10億ドル、AGR (%)、CAGR (%)
表 64 インドの衛星地上局の市場規模:2024-2034 (億米ドル、AGR (%)、CAGR (%))
表 65 日本の衛星地上局の市場規模:2024-2034 (億米ドル、AGR (%)、CAGR (%))
表 66 韓国の衛星地上局市場:金額 2024-2034 (億米ドル、AGR (%)、CAGR (%))
表 67 オーストラリアの衛星地上局の市場規模:2024-2034 (億米ドル、AGR (%)、CAGR (%))
表 68 アジア太平洋地域の残りの衛星地上局市場:金額(億米ドル、AGR (%)、CAGR (%)
表 69 中東・アフリカ衛星地上局市場:金額 2024-2034 (億米ドル、AGR (%)、CAGR (%))
表 70 中東・アフリカ衛星地上局国別市場:2024-2034 (億米ドル、AGR (%)、CAGR (%))
表 71 中東・アフリカ衛星地上局の場所別市場:2024~2034年(億米ドル、AGR (%)、CAGR (%)
表 72 中東・アフリカ衛星地上局市場:用途別(2024~2034年:億米ドル、AGR (%)、CAGR (%)
表 73 中東・アフリカ衛星地上局市場:タイプ別(2024~2034年:億ドル、AGR (%)、CAGR (%)
表 74 中東・アフリカ衛星地上局市場:周波数帯別(2024~2034年:億米ドル、AGR (%)、CAGR (%)
表 75 中東・アフリカ衛星地上局市場:エンドユーザー産業別 2024-2034 (億米ドル、AGR (%)、CAGR (%))
表 76 GCCの衛星地上局市場:金額ベース(2024-2034年:億米ドル、AGR (%)、CAGR (%)
表 77 南アフリカの衛星地上局市場:金額 2024-2034 (億米ドル、AGR (%)、CAGR (%))
表 78 中東・アフリカの残りの地域の衛星地上局市場:金額 2024-2034 (億米ドル、AGR (%)、CAGR (%))
表 79 ラテンアメリカの衛星地上局市場:2024-2034年(億米ドル、AGR (%)、CAGR (%)
表80 中南米の衛星地上局国別市場:2024-2034年(億米ドル、AGR (%)、CAGR (%)
表81 中南米の衛星地上局市場:場所別(2024-2034年、10億ドル、AGR (%)、CAGR (%)
表82 中南米の衛星地上局市場:用途別(2024-2034年:億米ドル、AGR (%)、CAGR (%)
表83 ラテンアメリカの衛星地上局市場:タイプ別(2024-2034年:億米ドル、AGR (%)、CAGR (%)
表84 中南米の衛星地上局市場:周波数帯別(2024-2034年:億米ドル、AGR (%)、CAGR (%)
表 85 中南米の衛星地上局市場:エンドユーザー産業別(2024-2034年:億米ドル、AGR (%)、CAGR (%)
表 86 ブラジルの衛星地上局市場:金額ベース(2024-2034年:億米ドル、AGR (%)、CAGR (%)
表 87 メキシコの衛星地上局市場:金額(2024-2034年) (億米ドル、AGR (%)、CAGR (%))
表 88 ラテンアメリカのその他の衛星地上局市場:金額(2024-2034年) (億米ドル、AGR (%)、CAGR (%))
表 89 戦略的展望 - 契約
表90 Intelsat S.A:主要詳細(CEO, 本社, 売上高, 設立, 従業員数, 企業タイプ, ウェブサイト, 事業セグメント)
表91 Intelsat S.A.: 製品ベンチマーク
表92 Intelsat S.A.:戦略的展望
表93 SES S.A.:主な詳細(CEO、本社、売上高、設立、従業員数、会社タイプ、ウェブサイト、事業セグメント)
表94 SES S.A.: 製品ベンチマーク
表95 SES S.A.:戦略的展望
表96 Viasat Inc:主な詳細(CEO, 本社, 売上高, 設立, 従業員数, 企業タイプ, ウェブサイト, 事業セグメント)
表97 Viasat:製品ベンチマーク
表98 バイアサット戦略的展望
表99 ロッキード・マーチン・コーポレーション主な詳細(CEO, 本社, 売上高, 設立, 従業員数, 企業タイプ, ウェブサイト, 事業セグメント)
表100 ロッキード・マーチン・コーポレーション製品ベンチマーク
表101 ロッキード・マーチン・コーポレーション戦略的展望
表102 レイセオン・テクノロジーズ・コーポレーション主な詳細(CEO, 本社, 売上高, 設立, 従業員数, 企業タイプ, ウェブサイト, 事業セグメント)
表 103 レイセオン・テクノロジーズ・コーポレーション製品ベンチマーク
表 104 レイセオン・テクノロジーズ・コーポレーション戦略的展望
表105 ノースロップ・グラマン・コーポレーション主な詳細(CEO, 本社, 売上高, 設立, 従業員数, 企業タイプ, ウェブサイト, 事業セグメント)
表 106 ノースロップ・グラマン・コーポレーション製品ベンチマーク
表 107 ノースロップ・グラマン・コーポレーション戦略的展望
表 108 L3Harris Technologies, Inc:主な詳細(CEO, 本社, 売上高, 設立, 従業員数, 企業タイプ, ウェブサイト, 事業セグメント)
表 109 L3Harris Technologies, Inc:製品ベンチマーク
表110 L3Harris Technologies, Inc:戦略的展望
表111 エアバス・ディフェンス・アンド・スペース主な詳細(CEO, 本社, 売上高, 設立, 従業員数, 企業タイプ, ウェブサイト, 事業セグメント)
表112 エアバス・ディフェンス・アンド・スペース製品ベンチマーク
表113 エアバス・ディフェンス・アンド・スペース戦略的展望
表114 タレスグループ主な詳細(CEO, 本社, 売上高, 設立, 従業員数, 企業タイプ, ウェブサイト, 事業セグメント)
表 115 タレスグループ製品ベンチマーク
表116 タレスグループ戦略的展望
表 117 クレイトス・ディフェンス&セキュリティ・ソリューションズ主な詳細(CEO, 本社, 売上高, 設立, 従業員数, 企業タイプ, ウェブサイト, 事業セグメント)
表 118 クレイトス ディフェンス & セキュリティ ソリューションズ:製品ベンチマーク
表 119 Kratos Defence & Security Solutions, Inc:戦略的展望
表120 ゼネラルダイナミクス社主な詳細(CEO, 本社, 売上高, 設立, 従業員数, 企業タイプ, ウェブサイト, 事業セグメント)
表 121 ゼネラルダイナミクス社製品ベンチマーク
表122 ゼネラルダイナミクス社戦略的展望
表123 ボーイング社主な詳細(CEO, 本社, 売上高, 設立, 従業員数, 企業タイプ, ウェブサイト, 事業セグメント)
表124 ザ・ボーイング・カンパニー製品ベンチマーク
表125 ザ・ボーイング・カンパニー戦略的展望
表126 コブハム社主な詳細(CEO, 本社, 売上高, 設立, 従業員数, 企業タイプ, ウェブサイト, 事業セグメント)
表 127 コブハム社製品ベンチマーク
表128 コブハム社戦略的展望
表129 イリジウム・コミュニケーションズInc:主な詳細(CEO, 本社, 売上高, 設立, 従業員数, 企業タイプ, ウェブサイト, 事業セグメント)
表 130 イリジウム・コミュニケーションズ製品ベンチマーク
表 131 イリジウム・コミュニケーションズInc:戦略的展望
表132 三菱電機株式会社主な詳細(CEO, 本社, 売上高, 設立, 従業員数, 企業タイプ, ウェブサイト, 事業セグメント)
表 133 三菱電機株式会社製品ベンチマーク
表134 三菱電機株式会社戦略的展望
図の一覧
図 1 衛星地上局市場のセグメンテーション
図2 衛星地上局の場所別市場:市場魅力度指数
図3 衛星地上局市場:用途別:衛星地上局市場:市場魅力度指数
図4 衛星地上局のタイプ別市場:市場魅力度指数衛星地上局市場:市場魅力度指数
図5 衛星地上局の周波数帯別市場:市場魅力度指数衛星地上局市場:市場魅力度指数
図6 衛星地上局のエンドユーザー産業別市場:市場魅力度指数衛星地上局市場:市場魅力度指数
図7 衛星地上局市場:地域別市場魅力度指数
図8 衛星地上局市場:市場ダイナミクス
図9 衛星地上局市場ポーターのファイブフォース分析
図 10 衛星地上局の世界市場:COVID別シェア予測(2024~2034年)
図11 衛星地上局の世界市場(地域別):2024年~2034年(10億ドル、AGR (%))(V字回復シナリオ
図12 衛星地上局の世界地域別市場:2024年~2034年(億米ドル、AGR (%))(U字回復シナリオ)
図 13 衛星地上局の世界地域別市場:2024~2034年(10億ドル、AGR (%))(W字型回復シナリオ)
図14 衛星地上局の世界地域別市場:2024~2034年(億米ドル、AGR (%))(L字型回復シナリオ)
図 15 衛星地上局市場PEST分析
図16 衛星地上局市場:地域別市場魅力度指数
図17 衛星地上局の場所別世界市場:2024年~2034年(10億ドル、AGR (%)
図18 衛星地上局の場所別市場シェア予測(2024年、2029年、2034年)
図 19 低軌道(LEO)カバーエリア地域別市場、2024年~2034年(10億米ドル、AGR (%)
図 20 低軌道(LEO)カバレッジエリアの地域別市場シェア予測、2024 年~2034 年(%)
図 21 静止軌道(GEO)カバーエリア地域別市場予測、2024~2034 年(10 億米ドル、AGR (%)
図 22 静止軌道(GEO)カバーエリア地域別市場シェア予測、2024 年~2034 年 (%)
図23 衛星地上局の用途別市場:市場魅力度指数
図24 衛星地上局の世界市場(用途別)、2024年~2034年(10億ドル、AGR (%)
図25 衛星地上局のアプリケーション別市場シェア予測(2024年、2029年、2034年)
図 26 通信衛星の地域別市場規模予測(2024~2034 年、10 億米ドル、AGR (%)
図 27 通信衛星の地域別市場シェア予測、2024 年/2034 年 (%)
図 28 2024-2034 年の気象衛星地域別市場規模(億米ドル、AGR (%)
図 29 2024-2034 年における気象衛星の地域別市場シェア予測 (%)
図 30 地球観測衛星の地域別市場規模予測(2024~2034 年)(億米ドル、AGR (%)
図 31 地球観測衛星の地域別市場シェア予測、2024 年~2034 年 (%)
図 32 衛星地上局のタイプ別市場:市場魅力度指数
図 33 衛星地上局の世界市場:タイプ別(2024~2034 年)(億米ドル、AGR (%)
図34 衛星地上局のタイプ別市場シェア予測、2024年、2029年、2034年 (%)
図 35 テレポートの地域別市場規模予測(2024~2034 年)(億米ドル、AGR (%)
図 36 テレポートの地域別市場シェア予測、2024年&2034年(%)
図 37 遠隔地上局市場:地域別(2024~2034年、10億米ドル、AGR (%)
図 38 遠隔地上局の地域別市場シェア予測、2024 年~2034 年 (%)
図 39 地球局の地域別市場規模予測(2024~2034 年)(億米ドル、AGR (%)
図 40 地球局の地域別市場シェア予測、2024 年~2034 年 (%)
図 41 追跡・データ中継衛星システム(TDRSS)地域別市場、2024~2034 年(億米ドル、AGR (%)
図 42 追跡・データ中継衛星システム(TDRSS)地域別市場シェア予測、2024 年~2034 年 (%)
図 43 衛星地上局の周波数帯別市場:市場魅力度指数
図44 衛星地上局の世界市場:周波数帯別(2024年~2034年) (億米ドル、AGR (%))
図45 衛星地上局の周波数帯別市場シェア予測:2024年、2029年、2034年(%)
図 46 X バンド地域別市場予測(2024~2034 年)(億米ドル、AGR (%)
図 47 地域別 X バンド市場シェア予測、2024 年~2034 年(%)
図 48 2024-2034 年の地域別 Ku バンド市場(億米ドル、AGR (%)
図 49 2024-2034 年の地域別 Ku バンド市場シェア予測 (%)
図 50 2024-2034 年の地域別 Ka バンド市場予測(億米ドル、AGR (%)
図 51 2024-2034 年の地域別 Ka バンド市場シェア予測 (%)
図 52 2024-2034 年における S バンド地域別市場予測(億米ドル、AGR (%)
図 53 2024-2034 年における S バンド地域別市場シェア予測 (%)
図 54 2024-2034 年地域別 C バンド市場予測(億米ドル、AGR (%)
図 55 2024-2034 年の地域別 C バンド市場シェア予測 (%)
図 56 衛星地上局のエンドユーザー産業別市場:市場魅力度指数
図 57 衛星地上局の世界市場:エンドユーザー産業別(2024~2034 年)(億米ドル、AGR (%)
図 58 衛星地上局のエンドユーザー産業別市場シェア予測(2024年、2029年、2034年) (%)
図 59 電気通信市場の地域別予測(2024~2034年、10億米ドル、AGR (%)
図60 地域別通信市場シェア予測、2024年&2034年(%)
図 61 2024-2034 年の地域別放送市場(億米ドル、AGR (%)
図 62 2024-2034 年の地域別放送市場シェア予測 (%)
図 63 地域別政府・軍需市場:2024-2034 (億米ドル、AGR (%)
図 64 2024-2034 年の地域別政府・軍需市場シェア予測 (%)
図65 航空宇宙・防衛市場の地域別予測(2024~2034年、10億米ドル、AGR (%)
図 66 地域別航空宇宙・防衛市場シェア予測、2024年&2034年(%)
図67 科学研究市場の地域別予測(2024年~2034年、10億米ドル、AGR (%)
図 68 科学研究の地域別市場シェア予測、2024年&2034年(%)
図69 その他のエンドユーザー産業地域別市場:2024-2034年(10億米ドル、AGR (%)
図 70 その他のエンドユーザー産業地域別市場シェア予測、2024 年~2034 年 (%)
図 71 2024 年と 2034 年の衛星地上局の地域別市場予測(売上高、CAGR)
図 72 2024年、2029年、2034年の衛星地上局の地域別市場シェア予測(%)
図 73 衛星地上局の世界地域別市場予測(2024年~2034年、10億ドル、AGR (%)
図 74 北米の衛星地上局市場魅力度指数
図75 北米の衛星地上局地域別市場(2024年、2029年&2034年)(億米ドル
図 76 北米の衛星地上局市場:金額ベース(2024~2034年、10億ドル、AGR (%)
図 77 北米の衛星地上局国別市場:2024~2034年(億米ドル、AGR (%)
図78 北米の衛星地上局国別市場シェア予測、2024年~2034年 (%)
図79 北米の衛星地上局市場:所在地別(2024年~2034年、10億ドル、AGR (%)
図 80 北米の衛星地上局市場シェア(場所別):2024年~2034年予測 (%)
図81 北米の衛星地上局市場:用途別(2024年~2034年、10億ドル、AGR (%)
図 82 北米の衛星地上局市場:用途別シェア予測、2024 年~2034 年 (%)
図83 北米の衛星地上局市場:タイプ別(2024~2034年、10億ドル、AGR (%)
図 84 北米の衛星地上局市場タイプ別シェア予測、2024~2034 年 (%)
図 85 北米の衛星地上局市場:周波数帯別(2024~2034年、10億ドル、AGR (%)
図 86 北米の衛星地上局市場:周波数帯別シェア予測、2024~2034 年 (%)
図87 北米の衛星地上局市場:エンドユーザー産業別(2024年~2034年、10億ドル、AGR (%)
図 88 北米の衛星地上局市場:エンドユーザー産業別シェア予測(2024 年/2034 年)
図 89 米国の衛星地上局市場:金額ベース(2024~2034 年)(億米ドル、AGR (%)
図 90 カナダの衛星地上局市場:金額ベース(2024~2034 年)(億米ドル、AGR (%))
図 91 欧州衛星地上局市場魅力度指数
図 92 欧州の衛星地上局地域別市場(2024 年、2029 年、2034 年)(億米ドル
図 93 欧州の衛星地上局市場:金額ベース(2024~2034年、10億ドル、AGR (%)
図 94 欧州衛星地上局市場:国別(2024~2034 年)(億米ドル、AGR (%)
図 95 欧州衛星地上局の国別市場シェア予測、2024~2034 年 (%)
図 96 欧州の衛星地上局市場:所在地別(2024~2034年、10億ドル、AGR (%)
図 97 欧州の衛星地上局市場シェア(場所別):2024年~2034年予測(%)
図 98 欧州の衛星地上局市場:用途別(2024~2034年、10億ドル、AGR (%)
図 99 欧州衛星地上局の用途別市場シェア予測、2024~2034 年 (%)
図 100 欧州の衛星地上局市場:タイプ別(2024~2034 年)(億米ドル、AGR (%)
図 101 欧州衛星地上局のタイプ別市場シェア予測、2024~2034 年 (%)
図 102 欧州衛星地上局の周波数帯別市場:2024~2034年(億米ドル、AGR (%)
図 103 欧州衛星地上局の周波数帯別市場シェア予測、2024~2034 年 (%)
図 104 欧州衛星地上局市場:エンドユーザー産業別 2024-2034 (億米ドル、AGR (%)
図 105 欧州衛星地上局市場:エンドユーザー産業別シェア予測、2024~2034 年 (%)
図 106 ドイツ衛星地上局市場:金額ベース(2024~2034 年)(億米ドル、AGR (%)
図 107 イギリス衛星地上局市場の金額:2024-2034 年(億米ドル、AGR (%)
図 108 フランス衛星地上局市場:2024-2034 年(億米ドル、AGR (%)
図 109 イタリア衛星地上局市場の金額:2024-2034 年(億米ドル、AGR (%)
図 110 ロシアの衛星地上局市場:2024-2034年(億米ドル、AGR (%)
図 111 その他の地域の衛星地上局市場:2024-2034 年(億米ドル、AGR (%)
図 112 アジア太平洋地域の衛星地上局市場魅力度指数
図 113 アジア太平洋地域の衛星地上局地域別市場(2024 年、2029 年、2034 年)(億米ドル
図 114 アジア太平洋地域の衛星地上局市場:金額ベース(2024~2034年、10億ドル、AGR (%)
図 115 アジア太平洋地域の衛星地上局市場:国別(2024~2034 年)(億米ドル、AGR (%)
図116 アジア太平洋地域の衛星地上局国別市場シェア予測:2024年~2034年 (%)
図 117 アジア太平洋地域の衛星地上局市場の場所別予測(2024~2034年、10億米ドル、AGR (%)
図 118 アジア太平洋地域の衛星地上局の場所別市場シェア予測、2024年~2034年 (%)
図119 アジア太平洋地域の衛星地上局市場:用途別(2024年~2034年、10億ドル、AGR (%)
図 120 アジア太平洋地域の衛星地上局市場:用途別シェア予測、2024年~2034年 (%)
図 121 アジア太平洋地域の衛星地上局のタイプ別市場:2024年~2034年(億米ドル、AGR (%)
図 122 アジア太平洋地域の衛星地上局市場タイプ別シェア予測、2024~2034 年 (%)
図 123 アジア太平洋地域の衛星地上局市場:周波数帯別(2024~2034年、10億ドル、AGR (%)
図 124 アジア太平洋地域の衛星地上局市場:周波数帯別シェア予測、2024年~2034年 (%)
図125 アジア太平洋地域の衛星地上局市場:エンドユーザー産業別(2024年~2034年、10億ドル、AGR (%)
図 126 アジア太平洋地域の衛星地上局市場:エンドユーザー産業別シェア予測(2024 年/2034 年)
図 127 中国の衛星地上局市場:金額ベース(2024~2034 年)(億米ドル、AGR (%)
図 128 インド衛星地上局市場の金額:2024-2034 年(億米ドル、AGR (%)
図 129 日本の衛星地上局市場:金額ベース(2024-2034 年)(億米ドル、AGR (%))
図 130 韓国の衛星地上局市場:金額ベース(2024-2034 年)(億米ドル、AGR (%))
図 131 オーストラリアの衛星地上局市場:2024-2034 年(億米ドル、AGR (%)
図 132 その他のアジア太平洋地域の衛星地上局市場:金額ベース(2024-2034 年) (億米ドル、AGR (%)
図 133 中東およびアフリカの衛星地上局市場魅力度指数
図 134 中東・アフリカ衛星地上局地域別市場(2024 年、2029 年、2034 年)(億米ドル
図 135 中東・アフリカ衛星地上局市場:金額ベース(2024~2034年、10億ドル、AGR (%)
図 136 中東・アフリカ衛星地上局国別市場:2024~2034 年(億米ドル、AGR (%)
図 137 中東・アフリカ衛星地上局国別市場シェア予測、2024~2034 年 (%)
図 138 中東・アフリカ衛星地上局市場の場所別予測(2024~2034 年)(億米ドル、AGR (%)
図 139 中東・アフリカ衛星地上局市場の場所別シェア予測、2024~2034 年 (%)
図 140 中東・アフリカ衛星地上局市場:用途別(2024~2034 年)(億米ドル、AGR (%)
図 141 中東・アフリカ衛星地上局市場用途別シェア予測、2024~2034 年 (%)
図 142 中東・アフリカ衛星地上局のタイプ別市場規模予測:2024~2034年 (億米ドル、AGR (%)
図 143 中東・アフリカ衛星地上局市場タイプ別シェア予測、2024~2034 年 (%)
図 144 中東・アフリカ衛星地上局市場:周波数帯別(2024~2034 年)(億米ドル、AGR (%)
図 145 中東・アフリカ衛星地上局の周波数帯別市場シェア予測、2024~2034 年 (%)
図 146 中東・アフリカ衛星地上局市場:エンドユーザー産業別 2024-2034 (億米ドル、AGR (%)
図 147 中東・アフリカ衛星地上局市場:エンドユーザー産業別 2024-2034 年シェア予測 (%)
図 148 GCC 衛星地上局の金額別市場予測(2024~2034 年)(億米ドル、AGR (%))
図 149 南アフリカの衛星地上局市場:金額(2024-2034 年)(億米ドル、AGR (%))
図 150 中東・アフリカの残りの地域の衛星地上局市場:金額(US$ Bn、AGR (%)
図 151 中南米の衛星地上局市場の魅力度指数
図 152 中南米の衛星地上局地域別市場(2024 年、2029 年、2034 年)(億米ドル
図 153 中南米の衛星地上局市場:金額ベース(2024~2034年、10億ドル、AGR (%)
図 154 中南米の衛星地上局市場:国別(2024~2034 年)(億米ドル、AGR (%)
図155 中南米の衛星地上局国別市場シェア予測、2024年~2034年 (%)
図156 中南米の衛星地上局市場:所在地別(2024年~2034年、10億ドル、AGR (%)
図 157 中南米の衛星地上局市場シェア(場所別):2024年~2034年予測 (%)
図158 中南米の衛星地上局市場:用途別(2024年~2034年、10億ドル、AGR (%)
図159 中南米の衛星地上局市場シェア(用途別):2024年~2034年予測 (%)
図 160 中南米の衛星地上局市場:タイプ別(2024~2034年、10億ドル、AGR (%)
図 161 中南米の衛星地上局市場タイプ別シェア予測、2024年~2034年 (%)
図 162 中南米の衛星地上局市場:周波数帯別(2024~2034年、10億ドル、AGR (%)
図 163 中南米衛星地上局の周波数帯別市場シェア予測、2024~2034 年 (%)
図164 中南米の衛星地上局市場:エンドユーザー産業別(2024年~2034年、10億ドル、AGR (%)
図 165 中南米の衛星地上局市場:エンドユーザー産業別シェア予測(2024 年/2034 年)
図 166 ブラジルの衛星地上局市場:金額ベース(2024~2034 年)(億米ドル、AGR (%))
図 167 メキシコ衛星地上局市場の金額:2024-2034 年(億米ドル、AGR (%)
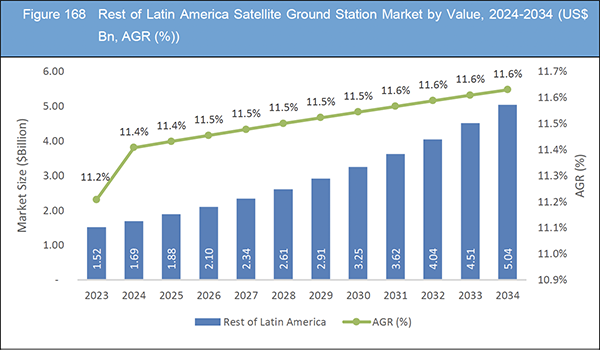
図 168 その他のラテンアメリカの衛星地上局市場:金額(US$ Bn、AGR (%)
図 169 衛星地上局市場:企業シェア(2023年
図 170 SES S.A.:純収入、2019年~2023年(百万米ドル、AGR)
図 171 SES S.A.:事業セグメント別収益シェア、2023 年 (%)
図 172 Viasat:純収入、2019年~2023年(百万米ドル、AGR)
図 173 Viasat:R&D, 2019-2023 (百万米ドル, AGR%)
図 174 Viasat:地域別収入シェア、2023年
図 175 バイアサット:事業セグメント別売上シェア、2023 年 (%)
図 176 Lockheed Martin Corporation:純収入、2019年~2023年(百万米ドル、AGR)
図 177 ロッキード・マーチン・コーポレーション:R&D, 2019-2023 (百万米ドル, AGR%)
図 178 ロッキード・マーチン社:地域別売上高シェア、2023 年
図 179 ロッキード・マーチン・コーポレーション:事業セグメント別売上高シェア、2023 年(%)
図 180 レイセオン・テクノロジーズ・コーポレーション純収入、2019年~2023年 (百万米ドル、AGR%)
図 181 Raytheon Technologies Corporation:R&D, 2019-2023 (百万米ドル, AGR%)
図 182 Raytheon Technologies Corporation:地域別売上高シェア、2023 年
図 183 Raytheon Technologies Corporation:事業セグメント別売上高シェア、2023 年 (%)
図 184 ノースロップ・グラマン・コーポレーション:純収入、2019年~2023年(百万米ドル、AGR)
図 185 ノースロップ・グラマン・コーポレーション:R&D、2019年~2023年(百万米ドル、AGR)
図 186 ノースロップ・グラマン・コーポレーション:地域別収益シェア、2023 年 (%)
図 187 ノースロップ・グラマン・コーポレーション:事業セグメントの収益シェア、2023 年(%)
図 188 L3Harris Technologies, Inc.:純収入、2019年~2023年(百万米ドル、AGR)
図 189 L3Harris Technologies, Inc:R&D、2019年~2023年(百万米ドル、AGR)
図 190 L3Harris Technologies, Inc:地域別収益シェア、2023年(%)
図 191 L3Harris Technologies, Inc.:事業別収益シェア、2023 年(%)
図 192 エアバス・ディフェンス・アンド・スペース:純収入、2019年~2023年(百万米ドル、AGR)
図 193 エアバス・ディフェンス・アンド・スペース:R&D、2019年~2023年(百万米ドル、AGR)
図 194 エアバス・ディフェンス・アンド・スペース:地域別売上高シェア(%)
図 195 エアバス・ディフェンス・アンド・スペース:事業セグメントの収益シェア、2023年(%)
図 196 タレス・グループ純収入、2019年~2023年(百万米ドル、AGR)
図 197 クレイトス・ディフェンス&セキュリティ・ソリューションズ(株): 純収入, 2019-2023 (百万米ドル, AGR%)
図 198 クレイトス・ディフェンス&セキュリティ・ソリューションズ, Inc:R&D, 2019-2023 (百万米ドル, AGR%)
図 199 クレイトス・ディフェンス&セキュリティ・ソリューションズ社: 事業セグメント別売上高シェア(%)
図 200 ゼネラル・ダイナミクス社純収入、2019年~2023年(百万米ドル、AGR)
図 201 General Dynamics Corporation:R&D, 2019-2023 (百万米ドル, AGR%)
図 202 ゼネラルダイナミクス社:地域別収益シェア(%)
図 203 ゼネラルダイナミクス社:事業セグメント別売上高シェア、2023年(%)
図 204 The Boeing Company:純収入、2019年~2023年(百万米ドル、AGR)
図 205 ザ・ボーイング・カンパニー:R&D, 2019-2023 (百万米ドル, AGR%)
図 206 ザ・ボーイング・カンパニー:地域別収益シェア、2023 年 (%)
図 207 ザ・ボーイング・カンパニー:事業別収益シェア、2023 年(%)
図 208 Iridium Communications Inc.:純収入、2019 年~2023 年(百万米ドル、AGR)
図 209 Iridium Communications Inc:R&D, 2019-2023 (百万米ドル, AGR%)
図 210 Iridium Communications Inc:地域別収益シェア、2023 年 (%)
図 211 三菱電機株式会社:純収入、2019年~2023年(百万米ドル、AGR)
図 212 三菱電機株式会社:R&D、2019年~2023年(百万米ドル、AGR)
図 213 三菱電機(株):地域別売上高シェア、2023 年
図 214 三菱電機:事業セグメント別売上高シェア、2023 年 (%)
ページTOPに戻る
Summary
Report Details
The Satellite Ground Station Market Report 2024-2034: This report will prove invaluable to leading firms striving for new revenue pockets if they wish to better understand the industry and its underlying dynamics. It will be useful for companies that would like to expand into different industries or to expand their existing operations in a new region.
The Increasing Demand for Satellite Communication and Data Transmission Services Across Various Industries
The satellite ground station market is poised for significant growth, driven by the increasing demand for satellite communication and data transmission services across various industries. Key drivers propelling market expansion include the growing adoption of satellite-based applications for telecommunications, broadcasting, government and military operations, aerospace and defence, scientific research, and maritime navigation. Additionally, advancements in satellite technology, such as the deployment of high-throughput satellites and the emergence of small satellite constellations, are fuelling the demand for ground station infrastructure to support these systems.
Amidst this favourable market landscape, numerous opportunities exist for industry players to capitalize on. Collaboration and partnerships between market participants offer avenues for innovation and the development of integrated solutions tailored to specific end-user requirements. Furthermore, the expansion of businesses on both national and international levels presents opportunities for market expansion, particularly in regions where satellite communication infrastructure is underdeveloped or where there is a growing need for reliable connectivity.
However, the satellite ground station market also faces several challenges that could potentially hinder its growth trajectory. Issues related to telemetry, tracking, and command systems pose operational challenges for ground station operators, impacting data capture and transmission efficiency. Moreover, regulatory constraints and spectrum allocation issues may limit the deployment of satellite communication systems in certain regions, hindering market expansion.
Absence of Unified Regulations and Government Policies
The absence of unified regulations and government policies presents a significant restraining factor in the market landscape. Without standardized guidelines and policies across different regions and jurisdictions, businesses operating in the market face challenges in navigating regulatory frameworks. This lack of uniformity can lead to confusion, inefficiencies, and increased compliance costs for companies, particularly those operating on a global scale or seeking to expand into new markets. One of the primary concerns arising from the absence of unified regulations is the inconsistency in compliance requirements. Companies may encounter varying regulatory standards and requirements when operating in different regions, making it difficult to streamline processes and ensure compliance across the board. This can result in delays in product launches, market entry barriers, and increased operational complexities for businesses.
What Questions Should You Ask before Buying a Market Research Report?
-
How is the satellite ground station market evolving?
-
What is driving and restraining the satellite ground station market?
-
How will each satellite ground station submarket segment grow over the forecast period and how much revenue will these submarkets account for in 2034?
-
How will the market shares for each satellite ground station submarket develop from 2024 to 2034?
-
What will be the main driver for the overall market from 2024 to 2034?
-
Will leading satellite ground station markets broadly follow the macroeconomic dynamics, or will individual national markets outperform others?
-
How will the market shares of the national markets change by 2034 and which geographical region will lead the market in 2034?
-
Who are the leading players and what are their prospects over the forecast period?
-
What are the satellite ground station projects for these leading companies?
-
How will the industry evolve during the period between 2024 and 2034? What are the implications of satellite ground station projects taking place now and over the next 10 years?
-
Is there a greater need for product commercialisation to further scale the satellite ground station market?
-
Where is the satellite ground station market heading and how can you ensure you are at the forefront of the market?
-
What are the best investment options for new product and service lines?
-
What are the key prospects for moving companies into a new growth path and C-suite?
You need to discover how this will impact the satellite ground station market today, and over the next 10 years:
-
Our 422-page report provides 134 tables and 214 charts/graphs exclusively to you.
-
The report highlights key lucrative areas in the industry so you can target them – NOW.
-
It contains in-depth analysis of global, regional and national sales and growth.
-
It highlights for you the key successful trends, changes and revenue projections made by your competitors.
This report tells you TODAY how the satellite ground station market will develop in the next 10 years, and in line with the variations in COVID-19 economic recession and bounce. This market is more critical now than at any point over the last 10 years.
Forecasts to 2034 and other analyses reveal commercial prospects
-
In addition to revenue forecasting to 2034, our new study provides you with recent results, growth rates, and market shares.
-
You will find original analyses, with business outlooks and developments.
-
Discover qualitative analyses (including market dynamics, drivers, opportunities, restraints and challenges), cost structure, impact of rising satellite ground station prices and recent developments.
This report includes data analysis and invaluable insight into how COVID-19 will affect the industry and your company. Four COVID-19 recovery patterns and their impact, namely, “V”, “L”, “W” and “U” are discussed in this report.
Segments Covered in the Report
Market Segment by Location
-
Low Earth Orbit (LEO) Coverage Areas
-
Geostationary Orbit (GEO) Coverage Areas
Market Segment by Application
-
Communication Satellite
-
Weather Satellite
-
Earth Observation Satellite
Market Segment by Type
-
Teleport
-
Remote Ground Station
-
Earth Station
-
Tracking and Data Relay Satellite System (TDRSS)
Market Segment by Frequency Band
-
X-Band
-
Ku-Band
-
Ka-Band
-
S-Band
-
C-Band
Market Segment by End-User Industry
-
Telecommunications
-
Broadcasting
-
Government and Military
-
Aerospace and Defence
-
Scientific Research
-
Other End-User Industries
In addition to the revenue predictions for the overall world market and segments, you will also find revenue forecasts for four regional and 20 leading national markets:
North America
Europe
-
Germany
-
Russia
-
United Kingdom
-
France
-
Italy
-
Rest of Europe
Asia Pacific
-
China
-
Japan
-
India
-
Australia
-
South Korea
-
Rest of Asia Pacific
Latin America
-
Brazil
-
Mexico
-
Rest of Latin America
Middle East & Africa
-
GCC
-
South Africa
-
Rest of Middle East & Africa
The report also includes profiles and for some of the leading companies in the Satellite Ground Station Market, 2024 to 2034, with a focus on this segment of these companies’ operations.
Leading companies profiled in the report
-
Airbus Defence and Space
-
Cobham Limited
-
General Dynamics Corporation
-
Intelsat S.A.
-
Iridium Communications Inc.
-
Kratos Defence & Security Solutions, Inc.
-
L3Harris Technologies, Inc.
-
Lockheed Martin Corporation
-
Mitsubishi Electric Corporation
-
Northrop Grumman Corporation
-
Raytheon Technologies Corporation
-
SES S.A.
-
Thales Group
-
The Boeing Company
-
Viasat Inc.
Overall world revenue for Satellite Ground Station Market, 2024 to 2034 in terms of value the market will surpass US$74.31 billion in 2024, our work calculates. We predict strong revenue growth through to 2034. Our work identifies which organizations hold the greatest potential. Discover their capabilities, progress, and commercial prospects, helping you stay ahead.
How will the Satellite Ground Station Market, 2024 to 2034 report help you?
In summary, our 420+ page report provides you with the following knowledge:
-
Revenue forecasts to 2034 for Satellite Ground Station Market, 2024 to 2034 Market, with forecasts for location, application, type, frequency band, and end-user industry, each forecast at a global and regional level – discover the industry’s prospects, finding the most lucrative places for investments and revenues.
-
Revenue forecasts to 2034 for four regional and 20 key national markets – See forecasts for the Satellite Ground Station Market, 2024 to 2034 market in North America, Europe, Asia-Pacific, Latin America and Middle East & Africa. Also forecasted is the market in the US, Canada, Brazil, Germany, France, UK, Russia, Italy, China, India, Japan, and Australia among other prominent economies.
-
Prospects for established firms and those seeking to enter the market – including company profiles for 15 of the major companies involved in the Satellite Ground Station Market, 2024 to 2034.
Find quantitative and qualitative analyses with independent predictions. Receive information that only our report contains, staying informed with invaluable business intelligence.
Information found nowhere else
With our new report, you are less likely to fall behind in knowledge or miss out on opportunities. See how our work could benefit your research, analyses, and decisions. Visiongain’s study is for everybody needing commercial analyses for the Satellite Ground Station Market, 2024 to 2034, market-leading companies. You will find data, trends and predictions.
ページTOPに戻る
Table of Contents
1 Report Overview
1.1 Objectives of the Study
1.2 Introduction to Satellite Ground Station Market
1.3 What This Report Delivers
1.4 Why You Should Read This Report
1.5 Key Questions Answered by This Analytical Report
1.6 Who Is This Report for?
1.7 Methodology
1.7.1 Market Definitions
1.7.2 Market Evaluation & Forecasting Methodology
1.7.3 Data Validation
1.7.3.1 Primary Research
1.7.3.2 Secondary Research
1.8 Frequently Asked Questions (FAQs)
1.9 Associated Visiongain Reports
1.10 About Visiongain
2 Executive Summary
3 Market Overview
3.1 Key Findings
3.2 Market Dynamics
3.2.1 Market Driving Factors
3.2.1.1 Rise in Demand for Military and Defence Satellite Ground Station Solutions
3.2.1.2 Increase in Adoption of Satellite Ground Station Equipment in Telemetry, Telecommand, Online Streaming Services, Radio, and TV Broadcast
3.2.1.3 Technological Advancement in Satellite Ground Stations Driving the Market Growth
3.2.2 Market Restraining Factors
3.2.2.1 Absence of Unified Regulations and Government Policies
3.2.2.2 Issues Related to Telemetry, Tracking, and Command Hinder the Market Growth
3.2.2.3 Cybersecurity Threats to Satellite Ground Station Hinder the Market Growth
3.2.3 Market Opportunities
3.2.3.1 Increase Investment in Satellite Ground Stations
3.2.3.2 Collaboration and Partnership Between Market Players Opportunities for the Market Growth
3.2.3.3 Expansion of Businesses on National and International Level Opportunities for the Market
3.3 Porter’s Five Forces Analysis
3.3.1 Bargaining Power of Suppliers (Low)
3.3.2 Bargaining Power of Buyers (Medium)
3.3.3 Competitive Rivalry (High)
3.3.4 Threat from Substitutes (Medium)
3.3.5 Threat of New Entrants (Low)
3.4 COVID-19 Impact Analysis
3.4.1 “V-Shaped Recovery”
3.4.2 “U-Shaped Recovery”
3.4.3 “W-Shaped Recovery”
3.4.4 “L-Shaped Recovery”
3.5 PEST Analysis
4 Satellite Ground Station Market Analysis by Location
4.1 Key Findings
4.2 Location Segment: Market Attractiveness Index
4.3 Satellite Ground Station Market Size Estimation and Forecast by Location
4.4 Low Earth Orbit (LEO) Coverage Areas
4.4.1 Market Size by Region, 2024-2034 (US$ Billion)
4.4.2 Market Share by Region, 2024 & 2034 (%)
4.5 Geostationary Orbit (GEO) Coverage Areas
4.5.1 Market Size by Region, 2024-2034 (US$ Billion)
4.5.2 Market Share by Region, 2024 & 2034 (%)
5 Satellite Ground Station Market Analysis by Application
5.1 Key Findings
5.2 Application Segment: Market Attractiveness Index
5.3 Satellite Ground Station Market Size Estimation and Forecast by Application
5.4 Communication Satellite
5.4.1 Market Size by Region, 2024-2034 (US$ Billion)
5.4.2 Market Share by Region, 2024 & 2034 (%)
5.5 Weather Satellite
5.5.1 Market Size by Region, 2024-2034 (US$ Billion)
5.5.2 Market Share by Region, 2024 & 2034 (%)
5.6 Earth Observation Satellite
5.6.1 Market Size by Region, 2024-2034 (US$ Billion)
5.6.2 Market Share by Region, 2024 & 2034 (%)
6 Satellite Ground Station Market Analysis by Type
6.1 Key Findings
6.2 Type Segment: Market Attractiveness Index
6.3 Satellite Ground Station Market Size Estimation and Forecast by Type
6.4 Teleport
6.4.1 Market Size by Region, 2024-2034 (US$ Billion)
6.4.2 Market Share by Region, 2024 & 2034 (%)
6.5 Remote Ground Station
6.5.1 Market Size by Region, 2024-2034 (US$ Billion)
6.5.2 Market Share by Region, 2024 & 2034 (%)
6.6 Earth Station
6.6.1 Market Size by Region, 2024-2034 (US$ Billion)
6.6.2 Market Share by Region, 2024 & 2034 (%)
6.7 Tracking and Data Relay Satellite System (TDRSS)
6.7.1 Market Size by Region, 2024-2034 (US$ Billion)
6.7.2 Market Share by Region, 2024 & 2034 (%)
7 Satellite Ground Station Market Analysis by Frequency Band
7.1 Key Findings
7.2 Frequency Band Segment: Market Attractiveness Index
7.3 Satellite Ground Station Market Size Estimation and Forecast by Frequency Band
7.4 X-Band
7.4.1 Market Size by Region, 2024-2034 (US$ Billion)
7.4.2 Market Share by Region, 2024 & 2034 (%)
7.5 Ku-Band
7.5.1 Market Size by Region, 2024-2034 (US$ Billion)
7.5.2 Market Share by Region, 2024 & 2034 (%)
7.6 Ka-Band
7.6.1 Market Size by Region, 2024-2034 (US$ Billion)
7.6.2 Market Share by Region, 2024 & 2034 (%)
7.7 S-Band
7.7.1 Market Size by Region, 2024-2034 (US$ Billion)
7.7.2 Market Share by Region, 2024 & 2034 (%)
7.8 C-Band
7.8.1 Market Size by Region, 2024-2034 (US$ Billion)
7.8.2 Market Share by Region, 2024 & 2034 (%)
8 Satellite Ground Station Market Analysis by End-User Industry
8.1 Key Findings
8.2 End-User Industry Segment: Market Attractiveness Index
8.3 Satellite Ground Station Market Size Estimation and Forecast by End-User Industry
8.4 Telecommunications
8.4.1 Market Size by Region, 2024-2034 (US$ Million)
8.4.2 Market Share by Region, 2024 & 2034 (%)
8.5 Broadcasting
8.5.1 Market Size by Region, 2024-2034 (US$ Million)
8.5.2 Market Share by Region, 2024 & 2034 (%)
8.6 Government and Military
8.6.1 Market Size by Region, 2024-2034 (US$ Million)
8.6.2 Market Share by Region, 2024 & 2034 (%)
8.7 Aerospace and Defence
8.7.1 Market Size by Region, 2024-2034 (US$ Million)
8.7.2 Market Share by Region, 2024 & 2034 (%)
8.8 Scientific Research
8.8.1 Market Size by Region, 2024-2034 (US$ Million)
8.8.2 Market Share by Region, 2024 & 2034 (%)
8.9 Other End-User Industries
8.9.1 Market Size by Region, 2024-2034 (US$ Million)
8.9.2 Market Share by Region, 2024 & 2034 (%)
9 Satellite Ground Station Market Analysis by Region
9.1 Key Findings
9.2 Regional Market Size Estimation and Forecast
10 North America Satellite Ground Station Market Analysis
10.1 Key Findings
10.2 North America Satellite Ground Station Market Attractiveness Index
10.3 North America Satellite Ground Station Market by Country, 2024, 2029 & 2034 (US$ Billion)
10.4 North America Satellite Ground Station Market Size Estimation and Forecast
10.5 North America Satellite Ground Station Market Size Estimation and Forecast by Country
10.6 North America Satellite Ground Station Market Size Estimation and Forecast by Location
10.7 North America Satellite Ground Station Market Size Estimation and Forecast by Application
10.8 North America Satellite Ground Station Market Size Estimation and Forecast by Type
10.9 North America Satellite Ground Station Market Size Estimation and Forecast by Frequency Band
10.10 North America Satellite Ground Station Market Size Estimation and Forecast by End-User Industry
10.11 U.S. Satellite Ground Station Market Analysis
10.12 Canada Satellite Ground Station Market Analysis
11 Europe Satellite Ground Station Market Analysis
11.1 Key Findings
11.2 Europe Satellite Ground Station Market Attractiveness Index
11.3 Europe Satellite Ground Station Market by Country, 2024, 2029 & 2034 (US$ Billion)
11.4 Europe Satellite Ground Station Market Size Estimation and Forecast
11.5 Europe Satellite Ground Station Market Size Estimation and Forecast by Country
11.6 Europe Satellite Ground Station Market Size Estimation and Forecast by Location
11.7 Europe Satellite Ground Station Market Size Estimation and Forecast by Application
11.8 Europe Satellite Ground Station Market Size Estimation and Forecast by Type
11.9 Europe Satellite Ground Station Market Size Estimation and Forecast by Frequency Band
11.10 Europe Satellite Ground Station Market Size Estimation and Forecast by End-User Industry
11.11 Germany Satellite Ground Station Market Analysis
11.12 UK Satellite Ground Station Market Analysis
11.13 France Satellite Ground Station Market Analysis
11.14 Italy Satellite Ground Station Market Analysis
11.15 Russia Satellite Ground Station Market Analysis
11.16 Rest of Europe Satellite Ground Station Market Analysis
12 Asia-Pacific Satellite Ground Station Market Analysis
12.1 Key Findings
12.2 Asia-Pacific Satellite Ground Station Market Attractiveness Index
12.3 Asia-Pacific Satellite Ground Station Market by Country, 2024, 2029 & 2034 (US$ Billion)
12.4 Asia-Pacific Satellite Ground Station Market Size Estimation and Forecast
12.5 Asia-Pacific Satellite Ground Station Market Size Estimation and Forecast by Country
12.6 Asia-Pacific Satellite Ground Station Market Size Estimation and Forecast by Location
12.7 Asia-Pacific Satellite Ground Station Market Size Estimation and Forecast by Application
12.8 Asia-Pacific Satellite Ground Station Market Size Estimation and Forecast by Type
12.9 Asia-Pacific Satellite Ground Station Market Size Estimation and Forecast by Frequency Band
12.10 Asia-Pacific Satellite Ground Station Market Size Estimation and Forecast by End-User Industry
12.11 China Satellite Ground Station Market Analysis
12.12 India Satellite Ground Station Market Analysis
12.13 Japan Satellite Ground Station Market Analysis
12.14 South Korea Satellite Ground Station Market Analysis
12.15 Australia Satellite Ground Station Market Analysis
12.16 Rest of Asia-Pacific Satellite Ground Station Market Analysis
13 Middle East and Africa Satellite Ground Station Market Analysis
13.1 Key Findings
13.2 Middle East and Africa Satellite Ground Station Market Attractiveness Index
13.3 Middle East and Africa Satellite Ground Station Market by Country, 2024, 2029 & 2034 (US$ Billion)
13.4 Middle East and Africa Satellite Ground Station Market Size Estimation and Forecast
13.5 Middle East and Africa Satellite Ground Station Market Size Estimation and Forecast by Country
13.6 Middle East and Africa Satellite Ground Station Market Size Estimation and Forecast by Location
13.7 Middle East and Africa Satellite Ground Station Market Size Estimation and Forecast by Application
13.8 Middle East and Africa Satellite Ground Station Market Size Estimation and Forecast by Type
13.9 Middle East and Africa Satellite Ground Station Market Size Estimation and Forecast by Frequency Band
13.10 Middle East and Africa Satellite Ground Station Market Size Estimation and Forecast by End-User Industry
13.11 GCC Satellite Ground Station Market Analysis
13.12 South Africa Satellite Ground Station Market Analysis
13.13 Rest of Middle East & Africa Satellite Ground Station Market Analysis
14 Latin America Satellite Ground Station Market Analysis
14.1 Key Findings
14.2 Latin America Satellite Ground Station Market Attractiveness Index
14.3 Latin America Satellite Ground Station Market by Country, 2024, 2029 & 2034 (US$ Billion)
14.4 Latin America Satellite Ground Station Market Size Estimation and Forecast
14.5 Latin America Satellite Ground Station Market Size Estimation and Forecast by Country
14.6 Latin America Satellite Ground Station Market Size Estimation and Forecast by Location
14.7 Latin America Satellite Ground Station Market Size Estimation and Forecast by Application
14.8 Latin America Satellite Ground Station Market Size Estimation and Forecast by Type
14.9 Latin America Satellite Ground Station Market Size Estimation and Forecast by Frequency Band
14.10 Latin America Satellite Ground Station Market Size Estimation and Forecast by End-User Industry
14.11 Brazil Satellite Ground Station Market Analysis
14.12 Mexico Satellite Ground Station Market Analysis
14.13 Rest of Latin America Satellite Ground Station Market Analysis
15 Company Profiles
15.1 Competitive Landscape, 2023
15.2 Strategic Outlook
15.3 Intelsat S.A.
15.3.1 Company Snapshot
15.3.2 Company Overview
15.3.3 Product Benchmarking
15.3.4 Strategic Outlook
15.4 SES S.A.
15.4.1 Company Snapshot
15.4.2 Company Overview
15.4.3 Financial Analysis
15.4.3.1 Net Revenue, 2019-2023
15.4.3.2 Business Segment Revenue Share, 2023 (%)
15.4.4 Product Benchmarking
15.4.5 Strategic Outlook
15.5 Viasat Inc.
15.5.1 Company Snapshot
15.5.2 Company Overview
15.5.3 Financial Analysis
15.5.3.1 Net Revenue, 2019-2023
15.5.3.2 R&D, 2019-2023
15.5.3.3 Regional Revenue Share, 2023 (%)
15.5.3.4 Business Segment Revenue Share, 2023 (%)
15.5.4 Product Benchmarking
15.5.5 Strategic Outlook
15.6 Lockheed Martin Corporation
15.6.1 Company Snapshot
15.6.2 Company Overview
15.6.3 Financial Analysis
15.6.3.1 Net Revenue, 2019-2023
15.6.3.2 R&D, 2019-2023
15.6.3.3 Regional Revenue Share, 2023 (%)
15.6.3.4 Business Segment Revenue Share, 2023 (%)
15.6.4 Product Benchmarking
15.6.5 Strategic Outlook
15.7 Raytheon Technologies Corporation
15.7.1 Company Snapshot
15.7.2 Company Overview
15.7.3 Financial Analysis
15.7.3.1 Net Revenue, 2019-2023
15.7.3.2 R&D, 2019-2023
15.7.3.3 Regional Revenue Share, 2023 (%)
15.7.3.4 Business Segment Revenue Share, 2023 (%)
15.7.4 Product Benchmarking
15.7.5 Strategic Outlook
15.8 Northrop Grumman Corporation
15.8.1 Company Snapshot
15.8.2 Company Overview
15.8.3 Financial Analysis
15.8.3.1 Net Revenue, 2019-2023
15.8.3.2 R&D, 2019-2023
15.8.3.3 Regional Revenue Share, 2023 (%)
15.8.3.4 Business Segment Revenue Share, 2023 (%)
15.8.4 Product Benchmarking
15.8.5 Strategic Outlook
15.9 L3Harris Technologies, Inc.
15.9.1 Company Snapshot
15.9.2 Company Overview
15.9.3 Financial Analysis
15.9.3.1 Net Revenue, 2019-2023
15.9.3.2 R&D, 2019-2023
15.9.3.3 Regional Revenue Share, 2023 (%)
15.9.3.4 Business Segment Revenue Share, 2023 (%)
15.9.4 Product Benchmarking
15.9.5 Strategic Outlook
15.10 Airbus Defence and Space
15.10.1 Company Snapshot
15.10.2 Company Overview
15.10.3 Financial Analysis
15.10.3.1 Net Revenue, 2019-2023
15.10.3.2 R&D, 2019-2023
15.10.3.3 Regional Revenue Share, 2023 (%)
15.10.3.4 Business Segment Revenue Share, 2023 (%)
15.10.4 Product Benchmarking
15.10.5 Strategic Outlook
15.11 Thales Group
15.11.1 Company Snapshot
15.11.2 Company Overview
15.11.3 Financial Analysis
15.11.3.1 Net Revenue, 2019-2023
15.11.4 Product Benchmarking
15.11.5 Strategic Outlook
15.12 Kratos Defence & Security Solutions, Inc.
15.12.1 Company Snapshot
15.12.2 Company Overview
15.12.3 Financial Analysis
15.12.3.1 Net Revenue, 2019-2023
15.12.3.2 R&D, 2019-2023
15.12.3.3 Business Segment Revenue Share, 2023 (%)
15.12.4 Product Benchmarking
15.12.5 Strategic Outlook
15.13 General Dynamics Corporation
15.13.1 Company Snapshot
15.13.2 Company Overview
15.13.3 Financial Analysis
15.13.3.1 Net Revenue, 2019-2023
15.13.3.2 R&D, 2019-2023
15.13.3.3 Regional Revenue Share, 2023 (%)
15.13.3.4 Business Segment Revenue Share, 2023 (%)
15.13.4 Product Benchmarking
15.13.5 Strategic Outlook
15.14 The Boeing Company
15.14.1 Company Snapshot
15.14.2 Company Overview
15.14.3 Financial Analysis
15.14.3.1 Net Revenue, 2019-2023
15.14.3.2 R&D, 2019-2023
15.14.3.3 Regional Revenue Share, 2023 (%)
15.14.3.4 Business Segment Revenue Share, 2023 (%)
15.14.4 Product Benchmarking
15.14.5 Strategic Outlook
15.15 Cobham Limited
15.15.1 Company Snapshot
15.15.2 Company Overview
15.15.3 Product Benchmarking
15.15.4 Strategic Outlook
15.16 Iridium Communications Inc.
15.16.1 Company Snapshot
15.16.2 Company Overview
15.16.3 Financial Analysis
15.16.3.1 Net Revenue, 2019-2023
15.16.3.2 R&D, 2019-2023
15.16.3.3 Regional Revenue Share, 2023 (%)
15.16.4 Product Benchmarking
15.16.5 Strategic Outlook
15.17 Mitsubishi Electric Corporation
15.17.1 Company Snapshot
15.17.2 Company Overview
15.17.3 Financial Analysis
15.17.3.1 Net Revenue, 2019-2023
15.17.3.2 R&D, 2019-2023
15.17.3.3 Regional Revenue Share, 2023 (%)
15.17.3.4 Business Segment Revenue Share, 2023 (%)
15.17.4 Product Benchmarking
15.17.5 Strategic Outlook
16 Conclusion and Recommendations
16.1 Concluding Remarks from Visiongain
16.2 Recommendations for Market Players
ページTOPに戻る
List of Tables/Graphs
List of Tables
Table 1 Satellite Ground Station Market Snapshot, 2024 & 2034 (US$ Billion, CAGR %)
Table 2 Global Satellite Ground Station Market by Region, 2024-2034 (US$ Bn, AGR (%), CAGR (%)) (V-Shaped Recovery Scenario)
Table 3 Global Satellite Ground Station Market by Region, 2024-2034 (US$ Bn, AGR (%), CAGR (%)) (U-Shaped Recovery Scenario)
Table 4 Global Satellite Ground Station Market by Region, 2024-2034 (US$ Bn, AGR (%), CAGR (%)) (W-Shaped Recovery Scenario)
Table 5 Global Satellite Ground Station Market by Region, 2024-2034 (US$ Bn, AGR (%), CAGR (%)) (L-Shaped Recovery Scenario)
Table 6 Global Satellite Ground Station Market by Location, 2024-2034 (US$ Bn, AGR (%), CAGR (%))
Table 7 Low Earth Orbit (LEO) Coverage Areas Market by Region, 2024-2034 (US$ Bn, AGR (%), CAGR (%))
Table 8 A List Of All GNSS Satellites By Constellations
Table 9 Geostationary Orbit (GEO) Coverage Areas Market by Region, 2024-2034 (US$ Bn, AGR (%), CAGR (%))
Table 10 Global Satellite Ground Station Market by Application, 2024-2034 (US$ Bn, AGR (%), CAGR (%))
Table 11 Communication Satellite Market by Region, 2024-2034 (US$ Bn, AGR (%), CAGR (%))
Table 12 Weather Satellite Market by Region, 2024-2034 (US$ Bn, AGR (%), CAGR (%))
Table 13 Earth Observation Satellite Market by Region, 2024-2034 (US$ Bn, AGR (%), CAGR (%))
Table 14 Global Satellite Ground Station Market by Type, 2024-2034 (US$ Bn, AGR (%), CAGR (%))
Table 15 Teleport Market by Region, 2024-2034 (US$ Bn, AGR (%), CAGR (%))
Table 16 Remote Ground Station Market by Region, 2024-2034 (US$ Bn, AGR (%), CAGR (%))
Table 17 Earth Station Market by Region, 2024-2034 (US$ Bn, AGR (%), CAGR (%))
Table 18 Tracking and Data Relay Satellite System (TDRSS) Market by Region, 2024-2034 (US$ Bn, AGR (%), CAGR (%))
Table 19 Global Satellite Ground Station Market by Frequency Band, 2024-2034 (US$ Bn, AGR (%), CAGR (%))
Table 20 X-Band Market by Region, 2024-2034 (US$ Bn, AGR (%), CAGR (%))
Table 21 Ku-Band Market by Region, 2024-2034 (US$ Bn, AGR (%), CAGR (%))
Table 22 Ka-Band Market by Region, 2024-2034 (US$ Bn, AGR (%), CAGR (%))
Table 23 S-Band Market by Region, 2024-2034 (US$ Bn, AGR (%), CAGR (%))
Table 24 C-Band Market by Region, 2024-2034 (US$ Bn, AGR (%), CAGR (%))
Table 25 Global Satellite Ground Station Market by End-User Industry, 2024-2034 (US$ Bn, AGR (%), CAGR (%))
Table 26 Telecommunications Market by Region, 2024-2034 (US$ Bn, AGR (%), CAGR (%))
Table 27 Broadcasting Market by Region, 2024-2034 (US$ Bn, AGR (%), CAGR (%))
Table 28 Government and Military Market by Region, 2024-2034 (US$ Bn, AGR (%), CAGR (%))
Table 29 Aerospace and Defence Market by Region, 2024-2034 (US$ Bn, AGR (%), CAGR (%))
Table 30 Scientific Research Market by Region, 2024-2034 (US$ Bn, AGR (%), CAGR (%))
Table 31 Other End-User Industries Market by Region, 2024-2034 (US$ Bn, AGR (%), CAGR (%))
Table 32 Global Satellite Ground Station Market by Region, 2024-2034 (US$ Bn, AGR (%), CAGR (%))
Table 33 North America Satellite Ground Station Market by Value, 2024-2034 (US$ Bn, AGR (%), CAGR (%))
Table 34 North America Satellite Ground Station Market by Country, 2024-2034 (US$ Bn, AGR (%), CAGR (%))
Table 35 North America Satellite Ground Station Market by Location, 2024-2034 (US$ Bn, AGR (%), CAGR (%))
Table 36 North America Satellite Ground Station Market by Application, 2024-2034 (US$ Bn, AGR (%), CAGR (%))
Table 37 North America Satellite Ground Station Market by Type, 2024-2034 (US$ Bn, AGR (%), CAGR (%))
Table 38 North America Satellite Ground Station Market by Frequency Band, 2024-2034 (US$ Bn, AGR (%), CAGR (%))
Table 39 North America Satellite Ground Station Market by End-User Industry, 2024-2034 (US$ Bn, AGR (%), CAGR (%))
Table 40 U.S. Ground Station in Other Countries
Table 41 US Satellite Ground Station Market by Value, 2024-2034 (US$ Bn, AGR (%), CAGR (%))
Table 42 Canada Satellite Ground Station Market by Value, 2024-2034 (US$ Bn, AGR (%), CAGR (%))
Table 43 Europe Satellite Ground Station Market by Value, 2024-2034 (US$ Bn, AGR (%), CAGR (%))
Table 44 Europe Satellite Ground Station Market by Country, 2024-2034 (US$ Bn, AGR (%), CAGR (%))
Table 45 Europe Satellite Ground Station Market by Location, 2024-2034 (US$ Bn, AGR (%), CAGR (%))
Table 46 Europe Satellite Ground Station Market by Application, 2024-2034 (US$ Bn, AGR (%), CAGR (%))
Table 47 Europe Satellite Ground Station Market by Type, 2024-2034 (US$ Bn, AGR (%), CAGR (%))
Table 48 Europe Satellite Ground Station Market by Frequency Band, 2024-2034 (US$ Bn, AGR (%), CAGR (%))
Table 49 Europe Satellite Ground Station Market by End-User Industry, 2024-2034 (US$ Bn, AGR (%), CAGR (%))
Table 50 Germany Satellite Ground Station Market by Value, 2024-2034 (US$ Bn, AGR (%), CAGR (%))
Table 51 UK Satellite Ground Station Market by Value, 2024-2034 (US$ Bn, AGR (%), CAGR (%))
Table 52 France Satellite Ground Station Market by Value, 2024-2034 (US$ Bn, AGR (%), CAGR (%))
Table 53 Italy Satellite Ground Station Market by Value, 2024-2034 (US$ Bn, AGR (%), CAGR (%))
Table 54 Russia Satellite Ground Station Market by Value, 2024-2034 (US$ Bn, AGR (%), CAGR (%))
Table 55 Rest of Europe Satellite Ground Station Market by Value, 2024-2034 (US$ Bn, AGR (%), CAGR (%))
Table 56 Asia-Pacific Satellite Ground Station Market by Value, 2024-2034 (US$ Bn, AGR (%), CAGR (%))
Table 57 Asia-Pacific Satellite Ground Station Market by Country, 2024-2034 (US$ Bn, AGR (%), CAGR (%))
Table 58 Asia-Pacific Satellite Ground Station Market by Location, 2024-2034 (US$ Bn, AGR (%), CAGR (%))
Table 59 Asia-Pacific Satellite Ground Station Market by Application, 2024-2034 (US$ Bn, AGR (%), CAGR (%))
Table 60 Asia-Pacific Satellite Ground Station Market by Type, 2024-2034 (US$ Bn, AGR (%), CAGR (%))
Table 61 Asia-Pacific Satellite Ground Station Market by Frequency Band, 2024-2034 (US$ Bn, AGR (%), CAGR (%))
Table 62 Asia-Pacific Satellite Ground Station Market by End-User Industry, 2024-2034 (US$ Bn, AGR (%), CAGR (%))
Table 63 China Satellite Ground Station Market by Value, 2024-2034 (US$ Bn, AGR (%), CAGR (%))
Table 64 India Satellite Ground Station Market by Value, 2024-2034 (US$ Bn, AGR (%), CAGR (%))
Table 65 Japan Satellite Ground Station Market by Value, 2024-2034 (US$ Bn, AGR (%), CAGR (%))
Table 66 South Korea Satellite Ground Station Market by Value, 2024-2034 (US$ Bn, AGR (%), CAGR (%))
Table 67 Australia Satellite Ground Station Market by Value, 2024-2034 (US$ Bn, AGR (%), CAGR (%))
Table 68 Rest of Asia-Pacific Satellite Ground Station Market by Value, 2024-2034 (US$ Bn, AGR (%), CAGR (%))
Table 69 Middle East & Africa Satellite Ground Station Market by Value, 2024-2034 (US$ Bn, AGR (%), CAGR (%))
Table 70 Middle East & Africa Satellite Ground Station Market by Country, 2024-2034 (US$ Bn, AGR (%), CAGR (%))
Table 71 Middle East & Africa Satellite Ground Station Market by Location, 2024-2034 (US$ Bn, AGR (%), CAGR (%))
Table 72 Middle East & Africa Satellite Ground Station Market by Application, 2024-2034 (US$ Bn, AGR (%), CAGR (%))
Table 73 Middle East & Africa Satellite Ground Station Market by Type, 2024-2034 (US$ Bn, AGR (%), CAGR (%))
Table 74 Middle East & Africa Satellite Ground Station Market by Frequency Band, 2024-2034 (US$ Bn, AGR (%), CAGR (%))
Table 75 Middle East & Africa Satellite Ground Station Market by End-User Industry, 2024-2034 (US$ Bn, AGR (%), CAGR (%))
Table 76 GCC Satellite Ground Station Market by Value, 2024-2034 (US$ Bn, AGR (%), CAGR (%))
Table 77 South Africa Satellite Ground Station Market by Value, 2024-2034 (US$ Bn, AGR (%), CAGR (%))
Table 78 Rest of Middle East & Africa Satellite Ground Station Market by Value, 2024-2034 (US$ Bn, AGR (%), CAGR (%))
Table 79 Latin America Satellite Ground Station Market by Value, 2024-2034 (US$ Bn, AGR (%), CAGR (%))
Table 80 Latin America Satellite Ground Station Market by Country, 2024-2034 (US$ Bn, AGR (%), CAGR (%))
Table 81 Latin America Satellite Ground Station Market by Location, 2024-2034 (US$ Bn, AGR (%), CAGR (%))
Table 82 Latin America Satellite Ground Station Market by Application, 2024-2034 (US$ Bn, AGR (%), CAGR (%))
Table 83 Latin America Satellite Ground Station Market by Type, 2024-2034 (US$ Bn, AGR (%), CAGR (%))
Table 84 Latin America Satellite Ground Station Market by Frequency Band, 2024-2034 (US$ Bn, AGR (%), CAGR (%))
Table 85 Latin America Satellite Ground Station Market by End-User Industry, 2024-2034 (US$ Bn, AGR (%), CAGR (%))
Table 86 Brazil Satellite Ground Station Market by Value, 2024-2034 (US$ Bn, AGR (%), CAGR (%))
Table 87 Mexico Satellite Ground Station Market by Value, 2024-2034 (US$ Bn, AGR (%), CAGR (%))
Table 88 Rest of Latin America Satellite Ground Station Market by Value, 2024-2034 (US$ Bn, AGR (%), CAGR (%))
Table 89 Strategic Outlook - Contract
Table 90 Intelsat S.A: Key Details, (CEO, HQ, Revenue, Founded, No. of Employees, Company Type, Website, Business Segment)
Table 91 Intelsat S.A: Product Benchmarking
Table 92 Intelsat S.A: Strategic Outlook
Table 93 SES S.A.: Key Details, (CEO, HQ, Revenue, Founded, No. of Employees, Company Type, Website, Business Segment)
Table 94 SES S.A.: Product Benchmarking
Table 95 SES S.A.: Strategic Outlook
Table 96 Viasat Inc.: Key Details, (CEO, HQ, Revenue, Founded, No. of Employees, Company Type, Website, Business Segment)
Table 97 Viasat: Product Benchmarking
Table 98 Viasat: Strategic Outlook
Table 99 Lockheed Martin Corporation: Key Details, (CEO, HQ, Revenue, Founded, No. of Employees, Company Type, Website, Business Segment)
Table 100 Lockheed Martin Corporation: Product Benchmarking
Table 101 Lockheed Martin Corporation: Strategic Outlook
Table 102 Raytheon Technologies Corporation: Key Details, (CEO, HQ, Revenue, Founded, No. of Employees, Company Type, Website, Business Segment)
Table 103 Raytheon Technologies Corporation: Product Benchmarking
Table 104 Raytheon Technologies Corporation: Strategic Outlook
Table 105 Northrop Grumman Corporation: Key Details, (CEO, HQ, Revenue, Founded, No. of Employees, Company Type, Website, Business Segment)
Table 106 Northrop Grumman Corporation: Product Benchmarking
Table 107 Northrop Grumman Corporation: Strategic Outlook
Table 108 L3Harris Technologies, Inc.: Key Details, (CEO, HQ, Revenue, Founded, No. of Employees, Company Type, Website, Business Segment)
Table 109 L3Harris Technologies, Inc.: Product Benchmarking
Table 110 L3Harris Technologies, Inc: Strategic Outlook
Table 111 Airbus Defence and Space: Key Details, (CEO, HQ, Revenue, Founded, No. of Employees, Company Type, Website, Business Segment)
Table 112 Airbus Defence and Space: Product Benchmarking
Table 113 Airbus Defence and Space: Strategic Outlook
Table 114 Thales Group: Key Details, (CEO, HQ, Revenue, Founded, No. of Employees, Company Type, Website, Business Segment)
Table 115 Thales Group: Product Benchmarking
Table 116 Thales Group: Strategic Outlook
Table 117 Kratos Defence & Security Solutions, Inc.: Key Details, (CEO, HQ, Revenue, Founded, No. of Employees, Company Type, Website, Business Segment)
Table 118 Kratos Defence & Security Solutions, Inc.: Product Benchmarking
Table 119 Kratos Defence & Security Solutions, Inc.: Strategic Outlook
Table 120 General Dynamics Corporation: Key Details, (CEO, HQ, Revenue, Founded, No. of Employees, Company Type, Website, Business Segment)
Table 121 General Dynamics Corporation: Product Benchmarking
Table 122 General Dynamics Corporation: Strategic Outlook
Table 123 The Boeing Company: Key Details, (CEO, HQ, Revenue, Founded, No. of Employees, Company Type, Website, Business Segment)
Table 124 The Boeing Company: Product Benchmarking
Table 125 The Boeing Company: Strategic Outlook
Table 126 Cobham Limited: Key Details, (CEO, HQ, Revenue, Founded, No. of Employees, Company Type, Website, Business Segment)
Table 127 Cobham Limited: Product Benchmarking
Table 128 Cobham Limited: Strategic Outlook
Table 129 Iridium Communications Inc.: Key Details, (CEO, HQ, Revenue, Founded, No. of Employees, Company Type, Website, Business Segment)
Table 130 Iridium Communications Inc.: Product Benchmarking
Table 131 Iridium Communications Inc.: Strategic Outlook
Table 132 Mitsubishi Electric Corporation: Key Details, (CEO, HQ, Revenue, Founded, No. of Employees, Company Type, Website, Business Segment)
Table 133 Mitsubishi Electric Corporation: Product Benchmarking
Table 134 Mitsubishi Electric Corporation: Strategic Outlook
List of Figures
Figure 1 Satellite Ground Station Market Segmentation
Figure 2 Satellite Ground Station Market by Location: Market Attractiveness Index
Figure 3 Satellite Ground Station Market by Application: Market Attractiveness Index
Figure 4 Satellite Ground Station Market by Type: Market Attractiveness Index
Figure 5 Satellite Ground Station Market by Frequency Band: Market Attractiveness Index
Figure 6 Satellite Ground Station Market by End-User Industry: Market Attractiveness Index
Figure 7 Satellite Ground Station Market Attractiveness Index by Region
Figure 8 Satellite Ground Station Market: Market Dynamics
Figure 9 Satellite Ground Station Market: Porter’s Five Forces Analysis
Figure 10 Global Satellite Ground Station Market Share Forecast by COVID, 2024-2034 (%)
Figure 11 Global Satellite Ground Station Market by Region, 2024-2034 (US$ Bn, AGR (%)) (V-Shaped Recovery Scenario)
Figure 12 Global Satellite Ground Station Market by Region, 2024-2034 (US$ Bn, AGR (%)) (U-Shaped Recovery Scenario)
Figure 13 Global Satellite Ground Station Market by Region, 2024-2034 (US$ Bn, AGR (%)) (W-Shaped Recovery Scenario)
Figure 14 Global Satellite Ground Station Market by Region, 2024-2034 (US$ Bn, AGR (%)) (L-Shaped Recovery Scenario)
Figure 15 Satellite Ground Station Market: PEST Analysis
Figure 16 Satellite Ground Station Market by Location: Market Attractiveness Index
Figure 17 Global Satellite Ground Station Market by Location, 2024-2034 (US$ Bn, AGR (%))
Figure 18 Satellite Ground Station Market Share Forecast by Location, 2024, 2029, 2034 (%)
Figure 19 Low Earth Orbit (LEO) Coverage Areas Market by Region, 2024-2034 (US$ Bn, AGR (%))
Figure 20 Low Earth Orbit (LEO) Coverage Areas Market Share Forecast by Region, 2024 & 2034 (%)
Figure 21 Geostationary Orbit (GEO) Coverage Areas Market by Region, 2024-2034 (US$ Bn, AGR (%))
Figure 22 Geostationary Orbit (GEO) Coverage Areas Market Share Forecast by Region, 2024 & 2034 (%)
Figure 23 Satellite Ground Station Market by Application: Market Attractiveness Index
Figure 24 Global Satellite Ground Station Market by Application, 2024-2034 (US$ Bn, AGR (%))
Figure 25 Satellite Ground Station Market Share Forecast by Application, 2024, 2029, 2034 (%)
Figure 26 Communication Satellite Market by Region, 2024-2034 (US$ Bn, AGR (%))
Figure 27 Communication Satellite Market Share Forecast by Region, 2024 & 2034 (%)
Figure 28 Weather Satellite Market by Region, 2024-2034 (US$ Bn, AGR (%))
Figure 29 Weather Satellite Market Share Forecast by Region, 2024 & 2034 (%)
Figure 30 Earth Observation Satellite Market by Region, 2024-2034 (US$ Bn, AGR (%))
Figure 31 Earth Observation Satellite Market Share Forecast by Region, 2024 & 2034 (%)
Figure 32 Satellite Ground Station Market by Type: Market Attractiveness Index
Figure 33 Global Satellite Ground Station Market by Type, 2024-2034 (US$ Bn, AGR (%))
Figure 34 Satellite Ground Station Market Share Forecast by Type, 2024, 2029, 2034 (%)
Figure 35 Teleport Market by Region, 2024-2034 (US$ Bn, AGR (%))
Figure 36 Teleport Market Share Forecast by Region, 2024 & 2034 (%)
Figure 37 Remote Ground Station Market by Region, 2024-2034 (US$ Bn, AGR (%))
Figure 38 Remote Ground Station Market Share Forecast by Region, 2024 & 2034 (%)
Figure 39 Earth Station Market by Region, 2024-2034 (US$ Bn, AGR (%))
Figure 40 Earth Station Market Share Forecast by Region, 2024 & 2034 (%)
Figure 41 Tracking and Data Relay Satellite System (TDRSS) Market by Region, 2024-2034 (US$ Bn, AGR (%))
Figure 42 Tracking and Data Relay Satellite System (TDRSS) Market Share Forecast by Region, 2024 & 2034 (%)
Figure 43 Satellite Ground Station Market by Frequency Band: Market Attractiveness Index
Figure 44 Global Satellite Ground Station Market by Frequency Band, 2024-2034 (US$ Bn, AGR (%))
Figure 45 Satellite Ground Station Market Share Forecast by Frequency Band, 2024, 2029, 2034 (%)
Figure 46 X-Band Market by Region, 2024-2034 (US$ Bn, AGR (%))
Figure 47 X-Band Market Share Forecast by Region, 2024 & 2034 (%)
Figure 48 Ku-Band Market by Region, 2024-2034 (US$ Bn, AGR (%))
Figure 49 Ku-Band Market Share Forecast by Region, 2024 & 2034 (%)
Figure 50 Ka-Band Market by Region, 2024-2034 (US$ Bn, AGR (%))
Figure 51 Ka-Band Market Share Forecast by Region, 2024 & 2034 (%)
Figure 52 S-Band Market by Region, 2024-2034 (US$ Bn, AGR (%))
Figure 53 S-Band Market Share Forecast by Region, 2024 & 2034 (%)
Figure 54 C-Band Market by Region, 2024-2034 (US$ Bn, AGR (%))
Figure 55 C-Band Market Share Forecast by Region, 2024 & 2034 (%)
Figure 56 Satellite Ground Station Market by End-User Industry: Market Attractiveness Index
Figure 57 Global Satellite Ground Station Market by End-User Industry, 2024-2034 (US$ Bn, AGR (%))
Figure 58 Satellite Ground Station Market Share Forecast by End-User Industry, 2024, 2029, 2034 (%)
Figure 59 Telecommunications Market by Region, 2024-2034 (US$ Bn, AGR (%))
Figure 60 Telecommunications Market Share Forecast by Region, 2024 & 2034 (%)
Figure 61 Broadcasting Market by Region, 2024-2034 (US$ Bn, AGR (%))
Figure 62 Broadcasting Market Share Forecast by Region, 2024 & 2034 (%)
Figure 63 Government and Military Market by Region, 2024-2034 (US$ Bn, AGR (%))
Figure 64 Government and Military Market Share Forecast by Region, 2024 & 2034 (%)
Figure 65 Aerospace and Defence Market by Region, 2024-2034 (US$ Bn, AGR (%))
Figure 66 Aerospace and Defence Market Share Forecast by Region, 2024 & 2034 (%)
Figure 67 Scientific Research Market by Region, 2024-2034 (US$ Bn, AGR (%))
Figure 68 Scientific Research Market Share Forecast by Region, 2024 & 2034 (%)
Figure 69 Other End-User Industries Market by Region, 2024-2034 (US$ Bn, AGR (%))
Figure 70 Other End-User Industries Market Share Forecast by Region, 2024 & 2034 (%)
Figure 71 Satellite Ground Station Market Forecast by Region 2024 and 2034 (Revenue, CAGR%)
Figure 72 Satellite Ground Station Market Share Forecast by Region 2024, 2029, 2034 (%)
Figure 73 Global Satellite Ground Station Market by Region, 2024-2034 (US$ Bn, AGR (%))
Figure 74 North America Satellite Ground Station Market Attractiveness Index
Figure 75 North America Satellite Ground Station Market by Region, 2024, 2029 & 2034 (US$ Billion)
Figure 76 North America Satellite Ground Station Market by Value, 2024-2034 (US$ Bn, AGR (%))
Figure 77 North America Satellite Ground Station Market by Country, 2024-2034 (US$ Bn, AGR (%))
Figure 78 North America Satellite Ground Station Market Share Forecast by Country, 2024 & 2034 (%)
Figure 79 North America Satellite Ground Station Market by Location, 2024-2034 (US$ Bn, AGR (%))
Figure 80 North America Satellite Ground Station Market Share Forecast Location, 2024 & 2034 (%)
Figure 81 North America Satellite Ground Station Market by Application, 2024-2034 (US$ Bn, AGR (%))
Figure 82 North America Satellite Ground Station Market Share Forecast by Application, 2024 & 2034 (%)
Figure 83 North America Satellite Ground Station Market by Type, 2024-2034 (US$ Bn, AGR (%))
Figure 84 North America Satellite Ground Station Market Share Forecast by Type, 2024 & 2034 (%)
Figure 85 North America Satellite Ground Station Market by Frequency Band, 2024-2034 (US$ Bn, AGR (%))
Figure 86 North America Satellite Ground Station Market Share Forecast by Frequency Band, 2024 & 2034 (%)
Figure 87 North America Satellite Ground Station Market by End-User Industry, 2024-2034 (US$ Bn, AGR (%))
Figure 88 North America Satellite Ground Station Market Share Forecast by End-User Industry, 2024 & 2034 (%)
Figure 89 US Satellite Ground Station Market by Value, 2024-2034 (US$ Bn, AGR (%))
Figure 90 Canada Satellite Ground Station Market by Value, 2024-2034 (US$ Bn, AGR (%))
Figure 91 Europe Satellite Ground Station Market Attractiveness Index
Figure 92 Europe Satellite Ground Station Market by Region, 2024, 2029 & 2034 (US$ Billion)
Figure 93 Europe Satellite Ground Station Market by Value, 2024-2034 (US$ Bn, AGR (%))
Figure 94 Europe Satellite Ground Station Market by Country, 2024-2034 (US$ Bn, AGR (%))
Figure 95 Europe Satellite Ground Station Market Share Forecast by Country, 2024 & 2034 (%)
Figure 96 Europe Satellite Ground Station Market by Location, 2024-2034 (US$ Bn, AGR (%))
Figure 97 Europe Satellite Ground Station Market Share Forecast Location, 2024 & 2034 (%)
Figure 98 Europe Satellite Ground Station Market by Application, 2024-2034 (US$ Bn, AGR (%))
Figure 99 Europe Satellite Ground Station Market Share Forecast by Application, 2024 & 2034 (%)
Figure 100 Europe Satellite Ground Station Market by Type, 2024-2034 (US$ Bn, AGR (%))
Figure 101 Europe Satellite Ground Station Market Share Forecast by Type, 2024 & 2034 (%)
Figure 102 Europe Satellite Ground Station Market by Frequency Band, 2024-2034 (US$ Bn, AGR (%))
Figure 103 Europe Satellite Ground Station Market Share Forecast by Frequency Band, 2024 & 2034 (%)
Figure 104 Europe Satellite Ground Station Market by End-User Industry, 2024-2034 (US$ Bn, AGR (%))
Figure 105 Europe Satellite Ground Station Market Share Forecast by End-User Industry, 2024 & 2034 (%)
Figure 106 Germany Satellite Ground Station Market by Value, 2024-2034 (US$ Bn, AGR (%))
Figure 107 UK Satellite Ground Station Market by Value, 2024-2034 (US$ Bn, AGR (%))
Figure 108 France Satellite Ground Station Market by Value, 2024-2034 (US$ Bn, AGR (%))
Figure 109 Italy Satellite Ground Station Market by Value, 2024-2034 (US$ Bn, AGR (%))
Figure 110 Russia Satellite Ground Station Market by Value, 2024-2034 (US$ Bn, AGR (%))
Figure 111 Rest of Europe Satellite Ground Station Market by Value, 2024-2034 (US$ Bn, AGR (%))
Figure 112 Asia-Pacific Satellite Ground Station Market Attractiveness Index
Figure 113 Asia-Pacific Satellite Ground Station Market by Region, 2024, 2029 & 2034 (US$ Billion)
Figure 114 Asia-Pacific Satellite Ground Station Market by Value, 2024-2034 (US$ Bn, AGR (%))
Figure 115 Asia-Pacific Satellite Ground Station Market by Country, 2024-2034 (US$ Bn, AGR (%))
Figure 116 Asia-Pacific Satellite Ground Station Market Share Forecast by Country, 2024 & 2034 (%)
Figure 117 Asia-Pacific Satellite Ground Station Market by Location, 2024-2034 (US$ Bn, AGR (%))
Figure 118 Asia-Pacific Satellite Ground Station Market Share Forecast Location, 2024 & 2034 (%)
Figure 119 Asia-Pacific Satellite Ground Station Market by Application, 2024-2034 (US$ Bn, AGR (%))
Figure 120 Asia-Pacific Satellite Ground Station Market Share Forecast by Application, 2024 & 2034 (%)
Figure 121 Asia-Pacific Satellite Ground Station Market by Type, 2024-2034 (US$ Bn, AGR (%))
Figure 122 Asia-Pacific Satellite Ground Station Market Share Forecast by Type, 2024 & 2034 (%)
Figure 123 Asia-Pacific Satellite Ground Station Market by Frequency Band, 2024-2034 (US$ Bn, AGR (%))
Figure 124 Asia-Pacific Satellite Ground Station Market Share Forecast by Frequency Band, 2024 & 2034 (%)
Figure 125 Asia-Pacific Satellite Ground Station Market by End-User Industry, 2024-2034 (US$ Bn, AGR (%))
Figure 126 Asia-Pacific Satellite Ground Station Market Share Forecast by End-User Industry, 2024 & 2034 (%)
Figure 127 China Satellite Ground Station Market by Value, 2024-2034 (US$ Bn, AGR (%))
Figure 128 India Satellite Ground Station Market by Value, 2024-2034 (US$ Bn, AGR (%))
Figure 129 Japan Satellite Ground Station Market by Value, 2024-2034 (US$ Bn, AGR (%))
Figure 130 South Korea Satellite Ground Station Market by Value, 2024-2034 (US$ Bn, AGR (%))
Figure 131 Australia Satellite Ground Station Market by Value, 2024-2034 (US$ Bn, AGR (%))
Figure 132 Rest of Asia-Pacific Satellite Ground Station Market by Value, 2024-2034 (US$ Bn, AGR (%))
Figure 133 Middle East and Africa Satellite Ground Station Market Attractiveness Index
Figure 134 Middle East and Africa Satellite Ground Station Market by Region, 2024, 2029 & 2034 (US$ Billion)
Figure 135 Middle East & Africa Satellite Ground Station Market by Value, 2024-2034 (US$ Bn, AGR (%))
Figure 136 Middle East & Africa Satellite Ground Station Market by Country, 2024-2034 (US$ Bn, AGR (%))
Figure 137 Middle East and Africa Satellite Ground Station Market Share Forecast by Country, 2024 & 2034 (%)
Figure 138 Middle East & Africa Satellite Ground Station Market by Location, 2024-2034 (US$ Bn, AGR (%))
Figure 139 Middle East and Africa Satellite Ground Station Market Share Forecast Location, 2024 & 2034 (%)
Figure 140 Middle East & Africa Satellite Ground Station Market by Application, 2024-2034 (US$ Bn, AGR (%))
Figure 141 Middle East and Africa Satellite Ground Station Market Share Forecast by Application, 2024 & 2034 (%)
Figure 142 Middle East & Africa Satellite Ground Station Market by Type, 2024-2034 (US$ Bn, AGR (%))
Figure 143 Middle East and Africa Satellite Ground Station Market Share Forecast by Type, 2024 & 2034 (%)
Figure 144 Middle East & Africa Satellite Ground Station Market by Frequency Band, 2024-2034 (US$ Bn, AGR (%))
Figure 145 Middle East and Africa Satellite Ground Station Market Share Forecast by Frequency Band, 2024 & 2034 (%)
Figure 146 Middle East & Africa Satellite Ground Station Market by End-User Industry, 2024-2034 (US$ Bn, AGR (%))
Figure 147 Middle East and Africa Satellite Ground Station Market Share Forecast by End-User Industry, 2024 & 2034 (%)
Figure 148 GCC Satellite Ground Station Market by Value, 2024-2034 (US$ Bn, AGR (%))
Figure 149 South Africa Satellite Ground Station Market by Value, 2024-2034 (US$ Bn, AGR (%))
Figure 150 Rest of Middle East & Africa Satellite Ground Station Market by Value, 2024-2034 (US$ Bn, AGR (%))
Figure 151 Latin America Satellite Ground Station Market Attractiveness Index
Figure 152 Latin America Satellite Ground Station Market by Region, 2024, 2029 & 2034 (US$ Billion)
Figure 153 Latin America Satellite Ground Station Market by Value, 2024-2034 (US$ Bn, AGR (%))
Figure 154 Latin America Satellite Ground Station Market by Country, 2024-2034 (US$ Bn, AGR (%))
Figure 155 Latin America Satellite Ground Station Market Share Forecast by Country, 2024 & 2034 (%)
Figure 156 Latin America Satellite Ground Station Market by Location, 2024-2034 (US$ Bn, AGR (%))
Figure 157 Latin America Satellite Ground Station Market Share Forecast Location, 2024 & 2034 (%)
Figure 158 Latin America Satellite Ground Station Market by Application, 2024-2034 (US$ Bn, AGR (%))
Figure 159 Latin America Satellite Ground Station Market Share Forecast by Application, 2024 & 2034 (%)
Figure 160 Latin America Satellite Ground Station Market by Type, 2024-2034 (US$ Bn, AGR (%))
Figure 161 Latin America Satellite Ground Station Market Share Forecast by Type, 2024 & 2034 (%)
Figure 162 Latin America Satellite Ground Station Market by Frequency Band, 2024-2034 (US$ Bn, AGR (%))
Figure 163 Latin America Satellite Ground Station Market Share Forecast by Frequency Band, 2024 & 2034 (%)
Figure 164 Latin America Satellite Ground Station Market by End-User Industry, 2024-2034 (US$ Bn, AGR (%))
Figure 165 Latin America Satellite Ground Station Market Share Forecast by End-User Industry, 2024 & 2034 (%)
Figure 166 Brazil Satellite Ground Station Market by Value, 2024-2034 (US$ Bn, AGR (%))
Figure 167 Mexico Satellite Ground Station Market by Value, 2024-2034 (US$ Bn, AGR (%))
Figure 168 Rest of Latin America Satellite Ground Station Market by Value, 2024-2034 (US$ Bn, AGR (%))
Figure 169 Satellite Ground Station Market: Company Share, 2023
Figure 170 SES S.A..: Net Revenue, 2019-2023 (US$ Million, AGR%)
Figure 171 SES S.A..: Business Segment Revenue Share, 2023 (%)
Figure 172 Viasat.: Net Revenue, 2019-2023 (US$ Million, AGR%)
Figure 173 Viasat.: R&D, 2019-2023 (US$ Million, AGR%)
Figure 174 Viasat.: Regional Revenue Share, 2023 (%)
Figure 175 Viasat.: Business Segment Revenue Share, 2023 (%)
Figure 176 Lockheed Martin Corporation.: Net Revenue, 2019-2023 (US$ Million, AGR%)
Figure 177 Lockheed Martin Corporation.: R&D, 2019-2023 (US$ Million, AGR%)
Figure 178 Lockheed Martin Corporation.: Regional Revenue Share, 2023 (%)
Figure 179 Lockheed Martin Corporation.: Business Segment Revenue Share, 2023 (%)
Figure 180 Raytheon Technologies Corporation.: Net Revenue, 2019-2023 (US$ Million, AGR%)
Figure 181 Raytheon Technologies Corporation.: R&D, 2019-2023 (US$ Million, AGR%)
Figure 182 Raytheon Technologies Corporation.: Regional Revenue Share, 2023 (%)
Figure 183 Raytheon Technologies Corporation.: Business Segment Revenue Share, 2023 (%)
Figure 184 Northrop Grumman Corporation.: Net Revenue, 2019-2023 (US$ Million, AGR%)
Figure 185 Northrop Grumman Corporation.: R&D, 2019-2023 (US$ Million, AGR%)
Figure 186 Northrop Grumman Corporation.: Regional Revenue Share, 2023 (%)
Figure 187 Northrop Grumman Corporation.: Business Segment Revenue Share, 2023 (%)
Figure 188 L3Harris Technologies, Inc..: Net Revenue, 2019-2023 (US$ Million, AGR%)
Figure 189 L3Harris Technologies, Inc..: R&D, 2019-2023 (US$ Million, AGR%)
Figure 190 L3Harris Technologies, Inc..: Regional Revenue Share, 2023 (%)
Figure 191 L3Harris Technologies, Inc..: Business Segment Revenue Share, 2023 (%)
Figure 192 Airbus Defence and Space.: Net Revenue, 2019-2023 (US$ Million, AGR%)
Figure 193 Airbus Defence and Space.: R&D, 2019-2023 (US$ Million, AGR%)
Figure 194 Airbus Defence and Space.: Regional Revenue Share, 2023 (%)
Figure 195 Airbus Defence and Space.: Business Segment Revenue Share, 2023 (%)
Figure 196 Thales Group.: Net Revenue, 2019-2023 (US$ Million, AGR%)
Figure 197 Kratos Defence & Security Solutions, Inc..: Net Revenue, 2019-2023 (US$ Million, AGR%)
Figure 198 Kratos Defence & Security Solutions, Inc..: R&D, 2019-2023 (US$ Million, AGR%)
Figure 199 Kratos Defence & Security Solutions, Inc..: Business Segment Revenue Share, 2023 (%)
Figure 200 General Dynamics Corporation.: Net Revenue, 2019-2023 (US$ Million, AGR%)
Figure 201 General Dynamics Corporation.: R&D, 2019-2023 (US$ Million, AGR%)
Figure 202 General Dynamics Corporation.: Regional Revenue Share, 2023 (%)
Figure 203 General Dynamics Corporation.: Business Segment Revenue Share, 2023 (%)
Figure 204 The Boeing Company.: Net Revenue, 2019-2023 (US$ Million, AGR%)
Figure 205 The Boeing Company.: R&D, 2019-2023 (US$ Million, AGR%)
Figure 206 The Boeing Company.: Regional Revenue Share, 2023 (%)
Figure 207 The Boeing Company.: Business Segment Revenue Share, 2023 (%)
Figure 208 Iridium Communications Inc..: Net Revenue, 2019-2023 (US$ Million, AGR%)
Figure 209 Iridium Communications Inc..: R&D, 2019-2023 (US$ Million, AGR%)
Figure 210 Iridium Communications Inc..: Regional Revenue Share, 2023 (%)
Figure 211 Mitsubishi Electric Corporation.: Net Revenue, 2019-2023 (US$ Million, AGR%)
Figure 212 Mitsubishi Electric Corporation.: R&D, 2019-2023 (US$ Million, AGR%)
Figure 213 Mitsubishi Electric Corporation.: Regional Revenue Share, 2023 (%)
Figure 214 Mitsubishi Electric Corporation.: Business Segment Revenue Share, 2023 (%)
ページTOPに戻る
Visiongain社の航空・海事分野での最新刊レポート
本レポートと同じKEY WORD(satellite)の最新刊レポート
よくあるご質問
Visiongain社はどのような調査会社ですか?
英国の調査会社ヴィジョンゲイン社(Visiongain)は、通信とエネルギーのほか、自動車や化学・医薬品、金属など、広範な市場を対象に調査を行っています。自動車市場については、市場全般に関する調査のほ... もっと見る
調査レポートの納品までの日数はどの程度ですか?
在庫のあるものは速納となりますが、平均的には 3-4日と見て下さい。
但し、一部の調査レポートでは、発注を受けた段階で内容更新をして納品をする場合もあります。
発注をする前のお問合せをお願いします。
注文の手続きはどのようになっていますか?
1)お客様からの御問い合わせをいただきます。
2)見積書やサンプルの提示をいたします。
3)お客様指定、もしくは弊社の発注書をメール添付にて発送してください。
4)データリソース社からレポート発行元の調査会社へ納品手配します。
5) 調査会社からお客様へ納品されます。最近は、pdfにてのメール納品が大半です。
お支払方法の方法はどのようになっていますか?
納品と同時にデータリソース社よりお客様へ請求書(必要に応じて納品書も)を発送いたします。
お客様よりデータリソース社へ(通常は円払い)の御振り込みをお願いします。
請求書は、納品日の日付で発行しますので、翌月最終営業日までの当社指定口座への振込みをお願いします。振込み手数料は御社負担にてお願いします。
お客様の御支払い条件が60日以上の場合は御相談ください。
尚、初めてのお取引先や個人の場合、前払いをお願いすることもあります。ご了承のほど、お願いします。
データリソース社はどのような会社ですか?
当社は、世界各国の主要調査会社・レポート出版社と提携し、世界各国の市場調査レポートや技術動向レポートなどを日本国内の企業・公官庁及び教育研究機関に提供しております。
世界各国の「市場・技術・法規制などの」実情を調査・収集される時には、データリソース社にご相談ください。
お客様の御要望にあったデータや情報を抽出する為のレポート紹介や調査のアドバイスも致します。
|
|

