Summary
Report Details
The Connected Aircraft Market Report 2024-2034: This report will prove invaluable to leading firms striving for new revenue pockets if they wish to better understand the industry and its underlying dynamics. It will be useful for companies that would like to expand into different industries or to expand their existing operations in a new region.
Improved Airline and Passenger Safety
The connected aircraft industry is experiencing significant growth, driven by advancements in technology aimed at enhancing airline and passenger safety. This industry integrates various digital and communication technologies to create a networked environment, providing real-time data and connectivity for aircraft.
Connected aircraft can continuously monitor their own systems and components, identifying potential issues before they become critical. This predictive maintenance reduces the risk of in-flight failures, enhancing overall safety. Real-time data transmission allows for continuous analysis of flight conditions, weather patterns, and other variables, helping pilots make more informed decisions.
Limited Availability of Bandwidth to Restrain Connected Aircraft Industry
The connected aircraft industry, which includes systems enabling in-flight connectivity and data sharing between aircraft and ground systems, is poised for significant growth. However, one major challenge that could restrain this industry is the limited availability of bandwidth. Passengers increasingly expect reliable and high-speed internet access during flights, similar to what they experience on the ground. The available bandwidth must be shared among all passengers and crew, leading to potential slowdowns during peak usage times.
Airlines and aircraft operators rely on real-time data transmission for operations, maintenance, and safety. This includes communication with air traffic control, live weather updates, and aircraft health monitoring systems. Limited bandwidth can slow down the transmission of critical data, potentially affecting operational efficiency and timely decision-making.
What Questions Should You Ask before Buying a Market Research Report?
-
How is the connected aircraft market evolving?
-
What is driving and restraining the connected aircraft market?
-
How will each connected aircraft submarket segment grow over the forecast period and how much revenue will these submarkets account for in 2034?
-
How will the market shares for each connected aircraft submarket develops from 2023 to 2034?
-
What will be the main driver for the overall market from 2024 to 2034?
-
Will leading connected aircraft markets broadly follow the macroeconomic dynamics, or will individual national markets outperform others?
-
How will the market shares of the national markets change by 2034 and which geographical region will lead the market in 2034?
-
Who are the leading players and what are their prospects over the forecast period?
-
What are the connected aircraft projects for these leading companies?
-
How will the industry evolve during the period between 2024 and 2034? What are the implications of connected aircraft projects taking place now and over the next 10 years?
-
Is there a greater need for product commercialisation to further scale the connected aircraft market?
-
Where is the connected aircraft market heading and how can you ensure you are at the forefront of the market?
You need to discover how this will impact the connected aircraft market today, and over the next 10 years:
-
Our 269-page report provides 89 tables and 148 charts/graphs exclusively to you.
-
The report highlights key lucrative areas in the industry so you can target them – NOW.
-
It contains in-depth analysis of global, regional and national sales and growth.
-
It highlights for you the key successful trends, changes and revenue projections made by your competitors.
This report tells you TODAY how the connected aircraft market will develop in the next 10 years, and in line with the variations in COVID-19 economic recession and bounce. This market is more critical now than at any point over the last 10 years.
Forecasts to 2034 and other analyses reveal commercial prospects
-
In addition to revenue forecasting to 2034, our new study provides you with recent results, growth rates, and market shares.
-
You will find original analyses, with business outlooks and developments.
-
Discover qualitative analyses (including market dynamics, drivers, opportunities, restraints, and challenges), porters five forces analysis, PEST analysis, and recent developments.
Segments Covered in the Report
Type Outlook
Connectivity Outlook
-
In-flight
-
Air-to-Air
-
Air-to-Ground
Platform Outlook
-
Commercial Aviation
-
Military Aviation
-
Business and General Aviation
-
UAV
-
Advanced Air Mobility
In addition to the revenue predictions for the overall world market and segments, you will also find revenue forecasts for five regional and 15 leading national markets:
North America
Europe
-
UK
-
Germany
-
Ireland
-
Spain
-
France
Asia Pacific
-
China
-
India
-
Japan
-
South Korea
-
Australia
Latin America
Middle East & Africa
The report also includes profiles and for some of the leading companies in the Connected Aircraft Market, 2024 to 2034, with a focus on this segment of these companies’ operations.
Leading companies profiled in the report
-
Anuvu
-
Astronics Corporation
-
Gogo Inc.
-
Honeywell International
-
Iridium Communications
-
Panasonic Holdings Corporation
-
Raytheon Technologies Corporation
-
TE Connectivity
-
Thales Group
-
Viasat
Overall revenue for Connected Aircraft Market, 2024 to 2034 in terms of value the market surpassed US$5,500 million in 2023, our work calculates. We predict strong revenue growth through to 2033. Our work identifies which organisations hold the greatest potential. Discover their capabilities, progress, and commercial prospects, helping you stay ahead.
How will the Connected Aircraft Market, 2024 to 2034 Market report help you?
In summary, our 260+ page report provides you with the following knowledge:
-
Revenue forecasts to 2034 for Connected Aircraft Market, 2024 to 2034 Market, with forecasts for connectivity, type, platform, and each forecast at a global, and regional level – discover the industry’s prospects, finding the most lucrative places for investments and revenues.
-
Revenue forecasts to 2034 for five regional and 15 key national markets – See forecasts for the Connected Aircraft Market, 2024 to 2034 market in North America, Europe, Asia-Pacific, Latin America, and Middle East & Africa.
-
Prospects for established firms and those seeking to enter the market – including company profiles for 10 of the major companies involved in the Connected Aircraft Market.
Find quantitative and qualitative analyses with independent predictions. Receive information that only our report contains, staying informed with invaluable business intelligence.
Information found nowhere else
With our new report, you are less likely to fall behind in knowledge or miss out on opportunities. See how our work could benefit your research, analyses, and decisions. Visiongain’s study is for everybody needing commercial analyses for the Connected Aircraft Market, 2024 to 2034, market-leading companies. You will find data, trends and predictions.
ページTOPに戻る
Table of Contents
1 Report Overview
1.1 Objectives of the Study
1.2 Introduction to Connected Aircraft Market
1.3 What This Report Delivers
1.4 Why You Should Read This Report
1.5 Key Questions Answered by This Analytical Report
1.6 Who is This Report for?
1.7 Methodology
1.7.1 Market Definitions
1.7.2 Market Evaluation & Forecasting Methodology
1.7.3 Data Validation
1.7.3.1 Primary Research
1.7.3.2 Secondary Research
1.8 Frequently Asked Questions (FAQs)
1.9 Associated Visiongain Reports
1.10 About Visiongain
2 Executive Summary
3 Market Overview
3.1 Key Findings
3.2 Market Dynamics
3.2.1 Market Driving Factors
3.2.1.1 Need for Optimum Airline Operations to Drive the Market
3.2.1.2 Growing Demand for In-flight Connectivity to Propel Market Growth
3.2.1.3 Improved Airline and Passenger Safety
3.2.2 Market Restraining Factors
3.2.2.1 Cybersecurity Risks to Offer Challenges for Connected Aircraft Industry
3.2.2.2 Limited Availability of Bandwidth to Restrain Connected Aircraft Industry
3.2.3 Market Opportunities
3.2.3.1 Growing Passenger and Cargo Traffic to Provide an Opportunity
3.2.3.2 Collaborations and Partnerships between Companies to Open New Avenues
3.3 COVID-19 Impact Analysis
3.4 Porter’s Five Forces Analysis
3.4.1 Bargaining Power of Suppliers (Moderate – High)
3.4.2 Bargaining Power of Buyers (Moderate)
3.4.3 Competitive Rivalry (High)
3.4.4 Threat from Substitutes (Low)
3.4.5 Threat of New Entrants (Low)
4 Connected Aircraft Market Analysis by Type
4.1 Key Findings
4.2 Type Segment: Market Attractiveness Index
4.3 Connected Aircraft Market Size Estimation and Forecast by Type
4.4 Hardware
4.4.1 Honeywell Launched Device That Limits Effects Of Cellular Interference On Aircraft
4.4.2 Market Size by Region, 2024-2034 (US$ Million)
4.4.3 Market Share by Region, 2024 & 2034 (%)
4.5 Software
4.5.1 Panasonic Avionics Announced New Software Engineering Capabilities
4.5.2 Market Size by Region, 2024-2034 (US$ Million)
4.5.3 Market Share by Region, 2024 & 2034 (%)
5 Connected Aircraft Market Analysis by Connectivity
5.1 Key Findings
5.2 Connectivity Segment: Market Attractiveness Index
5.3 Connected Aircraft Market Size Estimation and Forecast by Connectivity
5.4 In-flight
5.4.1 Market Size by Region, 2024-2034 (US$ Million)
5.4.2 Market Share by Region, 2024 & 2034 (%)
5.5 Air-to-Air
5.5.1 Market Size by Region, 2024-2034 (US$ Million)
5.5.2 Market Share by Region, 2024 & 2034 (%)
5.6 Air-to-Ground
5.6.1 Market Size by Region, 2024-2034 (US$ Million)
5.6.2 Market Share by Region, 2024 & 2034 (%)
6 Connected Aircraft Market Analysis by Platform
6.1 Key Findings
6.2 Platform Segment: Market Attractiveness Index
6.3 Connected Aircraft Market Size Estimation and Forecast by Platform
6.4 Commercial Aviation
6.4.1 Market Size by Region, 2024-2034 (US$ Million)
6.4.2 Market Share by Region, 2024 & 2034 (%)
6.5 Military Aviation
6.5.1 Market Size by Region, 2024-2034 (US$ Million)
6.5.2 Market Share by Region, 2024 & 2034 (%)
6.6 Business and General Aviation
6.6.1 Market Size by Region, 2024-2034 (US$ Million)
6.6.2 Market Share by Region, 2024 & 2034 (%)
6.7 UAV
6.7.1 Viasat’s New UAV Terminal Takes Flight In Powerline Inspection Demonstration
6.7.2 Market Size by Region, 2024-2034 (US$ Million)
6.7.3 Market Share by Region, 2024 & 2034 (%)
6.8 Advanced Air Mobility
6.8.1 Airbus and LCI to Partner on Development of Advanced Air Mobility Ecosystems
6.8.2 Market Size by Region, 2024-2034 (US$ Million)
6.8.3 Market Share by Region, 2024 & 2034 (%)
7 Connected Aircraft Market Analysis by Region
7.1 Key Findings
7.2 Regional Market Size Estimation and Forecast
8 North America Connected Aircraft Market Analysis
8.1 Key Findings
8.2 North America Connected Aircraft Market Attractiveness Index
8.3 North America Connected Aircraft Market by Country, 2024, 2029, and 2034 (US$ Million)
8.4 North America Connected Aircraft Market Size Estimation and Forecast by Country
8.5 North America Connected Aircraft Market Size Estimation and Forecast by Type
8.6 North America Connected Aircraft Market Size Estimation and Forecast by Connectivity
8.7 North America Connected Aircraft Market Size Estimation and Forecast by Platform
8.8 U.S. Connected Aircraft Market Analysis
8.8.1 American Plans Expansion of High-Speed Wi-Fi to Regional Aircraft
8.8.2 Raytheon Technologies Gives Airlines New Insights
8.9 Canada Connected Aircraft Market Analysis
8.9.1 Intelsat Selected by Air Canada for Expanded Fleet Connectivity
8.9.2 Viasat Expands IFC Deal With Canada’s Porter Airlines
9 Europe Connected Aircraft Market Analysis
9.1 Key Findings
9.2 Europe Connected Aircraft Market Attractiveness Index
9.3 Europe Connected Aircraft Market by Country, 2024, 2029, and 2034 (US$ Million)
9.4 Europe Connected Aircraft Market Size Estimation and Forecast by Country
9.5 Europe Connected Aircraft Market Size Estimation and Forecast by Type
9.6 Europe Connected Aircraft Market Size Estimation and Forecast by Connectivity
9.7 Europe Connected Aircraft Market Size Estimation and Forecast by Platform
9.8 Germany Connected Aircraft Market Analysis
9.8.1 Viasat and Deutsche Telekom’s In-flight Broadband Coverage
9.8.2 Hughes Launches OneWeb LEO In-flight Solutions to Airlines Worldwide
9.9 UK Connected Aircraft Market Analysis
9.9.1 Wizz Air To Add FFLYA In-Flight Connectivity To UK Fleet
9.10 France Connected Aircraft Market Analysis
9.10.1 Thales to Upgrade Air India’s Inflight Entertainment System
9.10.2 Air France Operated Intelsat 2Ku In-Flight Connectivity
9.11 Ireland Connected Aircraft Market Analysis
9.11.1 InflightFlix Signs Content Deal with Aer Lingus
9.12 Spain Connected Aircraft Market Analysis
9.12.1 Key Aspects of Spain's Connected Aircraft Industry
9.13 Rest of the Europe Connected Aircraft Market Analysis
10 Asia Pacific Connected Aircraft Market Analysis
10.1 Key Findings
10.2 Asia Pacific Connected Aircraft Market Attractiveness Index
10.3 Asia Pacific Connected Aircraft Market by Country, 2024, 2029, and 2034 (US$ Million)
10.4 Asia Pacific Connected Aircraft Market Size Estimation and Forecast by Country
10.5 Asia Pacific Connected Aircraft Market Size Estimation and Forecast by Type
10.6 Asia Pacific Connected Aircraft Market Size Estimation and Forecast by Connectivity
10.7 Asia Pacific Connected Aircraft Market Size Estimation and Forecast by Platform
10.8 China Connected Aircraft Market Analysis
10.8.1 China Satcom Partners With ViaSat To Provide Inflight Connectivity For Airlines
10.8.2 Sichuan Airlines Becomes China’s First Domestic Carrier to Partner with Viasat’s In-Flight Connectivity Solution
10.9 India Connected Aircraft Market Analysis
10.9.1 Airtel Announces In-Flight Connectivity for Users on International Routes
10.9.2 Thales, Indian Airlines Working on In-flight Wi-Fi
10.10 Japan Connected Aircraft Market Analysis
10.10.1 Japan Airlines to Upgrade 50 Boeing 737s and 767s to Intelsat’s 2Ku Inflight Connectivity Solution
10.11 South Korea Connected Aircraft Market Analysis
10.11.1 Viasat (VSAT) to Install In-Flight Connectivity for Korean Air
10.12 Australia Connected Aircraft Market Analysis
10.12.1 Vodafone Australia Connects With Aeromobile For In-Flight Mobile Use
10.13 Rest of Asia Pacific Connected Aircraft Market Analysis
11 Latin America Connected Aircraft Market Analysis
11.1 Key Findings
11.2 Latin America Connected Aircraft Market Attractiveness Index
11.3 Latin America Connected Aircraft Market by Country, 2024, 2029, and 2034 (US$ Million)
11.4 Latin America Connected Aircraft Market Size Estimation and Forecast by Country
11.5 Latin America Connected Aircraft Market Size Estimation and Forecast by Type
11.6 Latin America Connected Aircraft Market Size Estimation and Forecast by Connectivity
11.7 Latin America Connected Aircraft Market Size Estimation and Forecast by Platform
11.8 Brazil Connected Aircraft Market Analysis
11.9 Mexico Connected Aircraft Market Analysis
11.10 Rest of Latin America Connected Aircraft Market Analysis
12 Middle East & Africa Connected Aircraft Market Analysis
12.1 Key Findings
12.2 Middle East & Africa Connected Aircraft Market Attractiveness Index
12.3 Middle East & Africa Connected Aircraft Market by Country, 2024, 2029, and 2034 (US$ Million)
12.4 Middle East & Africa Connected Aircraft Market Size Estimation and Forecast by Country
12.5 Middle East & Africa Connected Aircraft Market Size Estimation and Forecast by Type
12.6 Middle East & Africa Connected Aircraft Market Size Estimation and Forecast by Connectivity
12.7 Middle East & Africa Connected Aircraft Market Size Estimation and Forecast by Platform
12.8 GCC Connected Aircraft Market Analysis
12.8.1 Emirates Passengers Can Avail of Free Wi-Fi Connectivity Onboard
12.8.2 Wizz Air to Expand Connections, Attract Tourists into Saudi Arabia
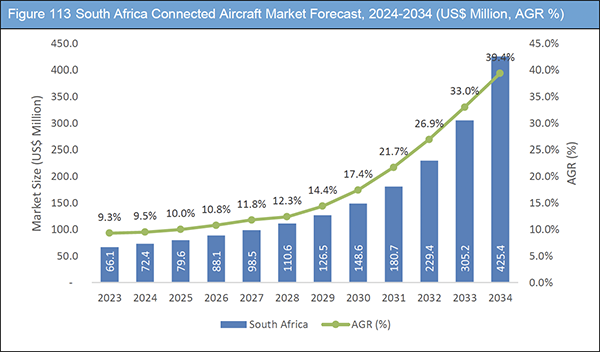
12.9 South Africa Connected Aircraft Market Analysis
12.9.1 Big South African Airline Considering New In-Flight Wi-Fi Services
12.10 Rest of Middle East & Africa Connected Aircraft Market Analysis
13 Company Profiles
13.1 Gogo Inc.
13.1.1 Company Snapshot
13.1.2 Company Overview
13.1.3 Financial Analysis
13.1.3.1 Net Revenue, 2019-2023
13.1.3.2 Type Market Shares, 2023
13.1.3.3 Segment Market Shares, 2023
13.1.3.4 Customer Market Shares, 2023
13.1.4 Product Benchmarking
13.1.5 Strategic Outlook
13.2 Honeywell
13.2.1 Company Snapshot
13.2.2 Company Overview
13.2.3 Financial Analysis
13.2.3.1 Net Revenue, 2018-2023
13.2.3.2 Segment Market Shares, 2023
13.2.3.3 Performance Materials and Technologies Segment Market Shares, 2023
13.2.3.4 Aerospace Segment Market Shares, 2023
13.2.3.5 Honeywell Building Technologies Segment Market Shares, 2023
13.2.3.6 Safety and Productivity Solutions Segment Market Shares, 2023
13.2.4 Product Benchmarking
13.2.5 Strategic Outlook
13.3 Raytheon
13.3.1 Company Snapshot
13.3.2 Company Overview
13.3.3 Financial Analysis
13.3.3.1 Net Revenue, 2018-2023
13.3.3.2 Regional Market Shares, 2023
13.3.3.3 Segment Market Shares, 2023
13.3.3.4 Segment Market Shares, 2023
13.3.4 Product Benchmarking
13.3.5 Strategic Outlook
13.4 Thales
13.4.1 Company Snapshot
13.4.2 Company Overview
13.4.3 Financial Analysis
13.4.3.1 Net Revenue, 2018-2023
13.4.3.2 Regional Market Shares, 2023
13.4.3.3 Segment Market Shares, 2023
13.4.4 Product Benchmarking
13.4.5 Strategic Outlook
13.5 Viasat
13.5.1 Company Snapshot
13.5.2 Company Overview
13.5.3 Financial Analysis
13.5.3.1 Net Revenue, 2019-2023
13.5.3.2 Customer Market Shares, 2023
13.5.3.3 Segment Market Shares, 2023
13.5.3.4 Segment Market Shares, 2023
13.5.4 Product Benchmarking
13.5.5 Strategic Outlook
13.6 TE Connectivity
13.6.1 Company Snapshot
13.6.2 Company Overview
13.6.3 Financial Analysis
13.6.3.1 Net Revenue, 2019-2023
13.6.3.2 Regional Market Shares, 2023
13.6.3.3 Segment Market Shares, 2023
13.6.4 Product Benchmarking
13.6.5 Strategic Outlook
13.7 Iridium Communications
13.7.1 Company Snapshot
13.7.2 Company Overview
13.7.3 Financial Analysis
13.7.3.1 Net Revenue, 2019-2023
13.7.3.2 Regional Market Shares, 2023
13.7.3.3 Segment Market Shares, 2023
13.7.4 Product Benchmarking
13.7.5 Strategic Outlook
13.8 Astronics Corporation
13.8.1 Company Snapshot
13.8.2 Company Overview
13.8.3 Financial Analysis
13.8.3.1 Net Revenue, 2019-2023
13.8.3.2 Regional Market Shares, 2023
13.8.3.3 Segment Market Shares, 2023
13.8.3.4 Segment Market Shares, 2023
13.8.4 Product Benchmarking
13.8.5 Strategic Outlook
13.9 Panasonic Holdings Corporation
13.9.1 Company Snapshot
13.9.2 Company Overview
13.9.3 Financial Analysis
13.9.3.1 Net Revenue, 2018-2023
13.9.3.2 Regional Market Shares, 2023
13.9.3.3 Segment Market Shares, 2023
13.9.4 Product Benchmarking
13.9.5 Strategic Outlook
13.10 Anuvu
13.10.1 Company Snapshot
13.10.2 Company Overview
13.10.3 Product Benchmarking
13.10.4 Strategic Outlook
14 Conclusion and Recommendations
14.1 Concluding Remarks from Visiongain
14.2 Recommendations
ページTOPに戻る
List of Tables/Graphs
List of Tables
Table 1 Connected Aircraft Market Snapshot, 2024 & 2034 (US$ Million, CAGR %)
Table 2 Connected Aircraft Market Forecast by Region, 2024-2034 (US$ Million, AGR%, CAGR%): “V” Shaped Recovery
Table 3 Connected Aircraft Market Forecast by Region, 2024-2034 (US$ Million, AGR%, CAGR%): “U” Shaped Recovery
Table 4 Connected Aircraft Market Forecast by Region, 2024-2034 (US$ Million, AGR%, CAGR%): “W” Shaped Recovery
Table 5 Connected Aircraft Market Forecast by Region, 2024-2034 (US$ Million, AGR%, CAGR%): “L” Shaped Recovery
Table 6 Connected Aircraft Market Forecast by Type, 2024-2034 (US$ Million, AGR%, CAGR%)
Table 7 Hardware Segment Market Forecast by Region, 2024-2034 (US$ Million, AGR%, CAGR%)
Table 8 Software Segment Market Forecast by Region, 2024-2034 (US$ Million, AGR%, CAGR%)
Table 9 Connected Aircraft Market Forecast by Connectivity, 2024-2034 (US$ Million, AGR%, CAGR%)
Table 10 In-flight Segment Market Forecast by Region, 2024-2034 (US$ Million, AGR%, CAGR%)
Table 11 Air-to-Air Segment Market Forecast by Region, 2024-2034 (US$ Million, AGR%, CAGR%)
Table 12 Air-to-Ground Segment Market Forecast by Region, 2024-2034 (US$ Million, AGR%, CAGR%)
Table 13 Connected Aircraft Market Forecast by Platform, 2024-2034 (US$ Million, AGR%, CAGR%)
Table 14 Commercial Aviation Segment Market Forecast by Region, 2024-2034 (US$ Million, AGR%, CAGR%)
Table 15 Military Aviation Segment Market Forecast by Region, 2024-2034 (US$ Million, AGR%, CAGR%)
Table 16 Business and General Aviation Segment Market Forecast by Region, 2024-2034 (US$ Million, AGR%, CAGR%)
Table 17 UAV Segment Market Forecast by Region, 2024-2034 (US$ Million, AGR%, CAGR%)
Table 18 Advanced Air Mobility Segment Market Forecast by Region, 2024-2034 (US$ Million, AGR%, CAGR%)
Table 19 Connected Aircraft Market Forecast by Region, 2024-2034 (US$ Million, AGR%, CAGR%)
Table 20 North America Connected Aircraft Market Forecast by Country, 2024-2034 (US$ Million, AGR%, CAGR%)
Table 21 North America Connected Aircraft Market Forecast by Type, 2024-2034 (US$ Million, AGR%, CAGR%)
Table 22 North America Connected Aircraft Market Forecast by Connectivity, 2024-2034 (US$ Million, AGR%, CAGR%)
Table 23 North America Connected Aircraft Market Forecast by Platform, 2024-2034 (US$ Million, AGR%, CAGR%)
Table 24 U.S. Connected Aircraft Market Forecast, 2024-2034 (US$ Million, AGR%, CAGR%)
Table 25 Canada Connected Aircraft Market Forecast, 2024-2034 (US$ Million, AGR%, CAGR%)
Table 26 Europe Connected Aircraft Market Forecast by Country, 2024-2034 (US$ Million, AGR%, CAGR%)
Table 27 Europe Connected Aircraft Market Forecast by Type, 2024-2034 (US$ Million, AGR%, CAGR%)
Table 28 Europe Connected Aircraft Market Forecast by Connectivity, 2024-2034 (US$ Million, AGR%, CAGR%)
Table 29 Europe Connected Aircraft Market Forecast by Platform, 2024-2034 (US$ Million, AGR%, CAGR%)
Table 30 Germany Connected Aircraft Market Forecast, 2024-2034 (US$ Million, AGR%, CAGR%)
Table 31 UK Connected Aircraft Market Forecast, 2024-2034 (US$ Million, AGR%, CAGR%)
Table 32 France Connected Aircraft Market Forecast, 2024-2034 (US$ Million, AGR%, CAGR%)
Table 33 Ireland Connected Aircraft Market Forecast, 2024-2034 (US$ Million, AGR%, CAGR%)
Table 34 Spain Connected Aircraft Market Forecast, 2024-2034 (US$ Million, AGR%, CAGR%)
Table 35 Rest of the Europe Connected Aircraft Market Forecast, 2024-2034 (US$ Million, AGR%, CAGR%)
Table 36 Asia Pacific Connected Aircraft Market Forecast by Country, 2024-2034 (US$ Million, AGR%, CAGR%)
Table 37 Asia Pacific Connected Aircraft Market Forecast by Type, 2024-2034 (US$ Million, AGR%, CAGR%)
Table 38 Asia Pacific Connected Aircraft Market Forecast by Connectivity, 2024-2034 (US$ Million, AGR%, CAGR%)
Table 39 Asia Pacific Connected Aircraft Market Forecast by Platform, 2024-2034 (US$ Million, AGR%, CAGR%)
Table 40 China Connected Aircraft Market Forecast, 2024-2034 (US$ Million, AGR%, CAGR%)
Table 41 India Connected Aircraft Market Forecast, 2024-2034 (US$ Million, AGR%, CAGR%)
Table 42 Japan Connected Aircraft Market Forecast, 2024-2034 (US$ Million, AGR%, CAGR%)
Table 43 South Korea Connected Aircraft Market Forecast, 2024-2034 (US$ Million, AGR%, CAGR%)
Table 44 Australia Connected Aircraft Market Forecast, 2024-2034 (US$ Million, AGR%, CAGR%)
Table 45 Rest of Asia Pacific Connected Aircraft Market Forecast, 2024-2034 (US$ Million, AGR%, CAGR%)
Table 46 Latin America Connected Aircraft Market Forecast by Country, 2024-2034 (US$ Million, AGR%, CAGR%)
Table 47 Latin America Connected Aircraft Market Forecast by Type, 2024-2034 (US$ Million, AGR%, CAGR%)
Table 48 Latin America Connected Aircraft Market Forecast by Connectivity, 2024-2034 (US$ Million, AGR%, CAGR%)
Table 49 Latin America Connected Aircraft Market Forecast by Platform, 2024-2034 (US$ Million, AGR%, CAGR%)
Table 50 Brazil Connected Aircraft Market Forecast, 2024-2034 (US$ Million, AGR%, CAGR%)
Table 51 Mexico Connected Aircraft Market Forecast, 2024-2034 (US$ Million, AGR%, CAGR%)
Table 52 Rest of Latin America Connected Aircraft Market Forecast, 2024-2034 (US$ Million, AGR%, CAGR%)
Table 53 Middle East & Africa Connected Aircraft Market Forecast by Country, 2024-2034 (US$ Million, AGR%, CAGR%)
Table 54 Middle East & Africa Connected Aircraft Market Forecast by Type, 2024-2034 (US$ Million, AGR%, CAGR%)
Table 55 Middle East & Africa Connected Aircraft Market Forecast by Connectivity, 2024-2034 (US$ Million, AGR%, CAGR%)
Table 56 Middle East & Africa Connected Aircraft Market Forecast by Platform, 2024-2034 (US$ Million, AGR%, CAGR%)
Table 57 GCC Connected Aircraft Market Forecast, 2024-2034 (US$ Million, AGR%, CAGR%)
Table 58 South Africa Connected Aircraft Market Forecast, 2024-2034 (US$ Million, AGR%, CAGR%)
Table 59 Rest of Middle East & Africa Connected Aircraft Market Forecast, 2024-2034 (US$ Million, AGR%, CAGR%)
Table 60 Gogo Inc.: Key Details, (CEO, HQ, Revenue, Founded, No. of Employees, Company Type, Website, Business Segment)
Table 61 Gogo Inc.: Product Benchmarking
Table 62 Gogo Inc.: Strategic Outlook
Table 63 Honeywell: Key Details, (CEO, HQ, Revenue, Founded, No. of Employees, Company Type, Website, Business Segment)
Table 64 Honeywell: Product Benchmarking
Table 65 Honeywell: Strategic Outlook
Table 66 Raytheon: Key Details, (CEO, HQ, Revenue, Founded, No. of Employees, Company Type, Website, Business Segment)
Table 67 Raytheon: Product Benchmarking
Table 68 Raytheon: Strategic Outlook
Table 69 Thales: Key Details, (CEO, HQ, Revenue, Founded, No. of Employees, Company Type, Website, Business Segment)
Table 70 Thales: Product Benchmarking
Table 71 Thales: Strategic Outlook
Table 72 Viasat: Key Details, (CEO, HQ, Revenue, Founded, No. of Employees, Company Type, Website, Business Segment)
Table 73 Viasat: Product Benchmarking
Table 74 Viasat: Strategic Outlook
Table 75 TE Connectivity: Key Details, (CEO, HQ, Revenue, Founded, No. of Employees, Company Type, Website, Business Segment)
Table 76 TE Connectivity: Product Benchmarking
Table 77 TE Connectivity: Strategic Outlook
Table 78 Iridium Communications: Key Details, (CEO, HQ, Revenue, Founded, No. of Employees, Company Type, Website, Business Segment)
Table 79 Iridium Communications: Product Benchmarking
Table 80 Iridium Communications: Strategic Outlook
Table 81 Astronics Corporation: Key Details, (CEO, HQ, Revenue, Founded, No. of Employees, Company Type, Website, Business Segment)
Table 82 Astronics Corporation: Product Benchmarking
Table 83 Astronics Corporation: Strategic Outlook
Table 84 Panasonic Holdings Corporation: Key Details, (CEO, HQ, Revenue, Founded, No. of Employees, Company Type, Website, Business Segment)
Table 85 Panasonic Holdings Corporation: Product Benchmarking
Table 86 Panasonic Holdings Corporation: Strategic Outlook
Table 87 Anuvu: Key Details, (CEO, HQ, Revenue, Founded, No. of Employees, Company Type, Website, Business Segment)
Table 88 Anuvu: Product Benchmarking
Table 89 Anuvu: Strategic Outlook
List of Figures
Figure 1 Connected Aircraft Market Segmentation
Figure 2 Connected Aircraft Market by Type: Market Attractiveness Index
Figure 3 Connected Aircraft Market by Connectivity: Market Attractiveness Index
Figure 4 Connected Aircraft Market by Platform: Market Attractiveness Index
Figure 5 Connected Aircraft Market Attractiveness Index by Region
Figure 6 Connected Aircraft Market: Market Dynamics
Figure 7 Annual Growth In Global Air Traffic Passenger Demand, 2010 – 2023 (%)
Figure 8 Connected Aircraft Market by Region, 2024-2034 (US$ Million, AGR %): “V” Shaped Recovery
Figure 9 Connected Aircraft Market by Region, 2024-2034 (US$ Million, AGR %): “U” Shaped Recovery
Figure 10 Connected Aircraft Market by Region, 2024-2034 (US$ Million, AGR %): “W” Shaped Recovery
Figure 11 Connected Aircraft Market by Region, 2024-2034 (US$ Million, AGR %): “L” Shaped Recovery
Figure 12 Connected Aircraft Market: Porter’s Five Forces Analysis
Figure 13 Connected Aircraft Market by Type: Market Attractiveness Index
Figure 14 Connected Aircraft Market Forecast by Type, 2024-2034 (US$ Million, AGR %)
Figure 15 Connected Aircraft Market Share Forecast by Type, 2024, 2029, 2034 (%)
Figure 16 Hardware Segment Market Forecast by Region, 2024-2034 (US$ Million, AGR %)
Figure 17 Hardware Segment Market Share Forecast by Region, 2024 & 2034 (%)
Figure 18 Software Segment Market Forecast by Region, 2024-2034 (US$ Million, AGR %)
Figure 19 Software Segment Market Share Forecast by Region, 2024 & 2034 (%)
Figure 20 Connected Aircraft Market by Connectivity: Market Attractiveness Index
Figure 21 Connected Aircraft Market Forecast by Connectivity, 2024-2034 (US$ Million, AGR %)
Figure 22 Connected Aircraft Market Share Forecast by Connectivity, 2024, 2029, 2034 (%)
Figure 23 In-flight Segment Market Forecast by Region, 2024-2034 (US$ Million, AGR %)
Figure 24 In-flight Segment Market Share Forecast by Region, 2024 & 2034 (%)
Figure 25 Air-to-Air Segment Market Forecast by Region, 2024-2034 (US$ Million, AGR %)
Figure 26 Air-to-Air Segment Market Share Forecast by Region, 2024 & 2034 (%)
Figure 27 Air-to-Ground Segment Market Forecast by Region, 2024-2034 (US$ Million, AGR %)
Figure 28 Air-to-Ground Segment Market Share Forecast by Region, 2024 & 2034 (%)
Figure 29 Connected Aircraft Market by Platform: Market Attractiveness Index
Figure 30 Connected Aircraft Market Forecast by Platform, 2024-2034 (US$ Million, AGR %)
Figure 31 Connected Aircraft Market Share Forecast by Platform, 2024, 2029, 2034 (%)
Figure 32 Commercial Aviation Segment Market Forecast by Region, 2024-2034 (US$ Million, AGR %)
Figure 33 Commercial Aviation Segment Market Share Forecast by Region, 2024 & 2034 (%)
Figure 34 Military Aviation Segment Market Forecast by Region, 2024-2034 (US$ Million, AGR %)
Figure 35 Military Aviation Segment Market Share Forecast by Region, 2024 & 2034 (%)
Figure 36 Business and General Aviation Segment Market Forecast by Region, 2024-2034 (US$ Million, AGR %)
Figure 37 Business and General Aviation Segment Market Share Forecast by Region, 2024 & 2034 (%)
Figure 38 UAV Segment Market Forecast by Region, 2024-2034 (US$ Million, AGR %)
Figure 39 UAV Segment Market Share Forecast by Region, 2024 & 2034 (%)
Figure 40 Advanced Air Mobility Segment Market Forecast by Region, 2024-2034 (US$ Million, AGR %)
Figure 41 Advanced Air Mobility Segment Market Share Forecast by Region, 2024 & 2034 (%)
Figure 42 Connected Aircraft Market Forecast by Region 2024 and 2034 (US$ Million, CAGR%)
Figure 43 Connected Aircraft Market Share Forecast by Region 2024, 2029, 2034 (%)
Figure 44 Connected Aircraft Market by Region, 2024-2034 (US$ Million, AGR %)
Figure 45 North America Connected Aircraft Market Attractiveness Index
Figure 46 North America Connected Aircraft Market by Region, 2024, 2029 & 2034 (US$ Million)
Figure 47 North America Connected Aircraft Market Forecast by Country, 2024-2034 (US$ Million, AGR %)
Figure 48 North America Connected Aircraft Market Share Forecast by Country, 2024 & 2034 (%)
Figure 49 North America Connected Aircraft Market Forecast by Type, 2024-2034 (US$ Million, AGR %)
Figure 50 North America Connected Aircraft Market Share Forecast by Type, 2024 & 2034 (%)
Figure 51 North America Connected Aircraft Market Forecast by Connectivity, 2024-2034 (US$ Million, AGR %)
Figure 52 North America Connected Aircraft Market Share Forecast by Connectivity, 2024 & 2034 (%)
Figure 53 North America Connected Aircraft Market Forecast by Platform, 2024-2034 (US$ Million, AGR %)
Figure 54 North America Connected Aircraft Market Share Forecast by Platform, 2024 & 2034 (%)
Figure 55 U.S. Connected Aircraft Market Forecast, 2024-2034 (US$ Million, AGR %)
Figure 56 Canada Connected Aircraft Market Forecast, 2024-2034 (US$ Million, AGR %)
Figure 57 Europe Connected Aircraft Market Attractiveness Index
Figure 58 Europe Connected Aircraft Market by Region, 2024, 2029 & 2034 (US$ Million)
Figure 59 Europe Connected Aircraft Market Forecast by Country, 2024-2034 (US$ Million, AGR %)
Figure 60 Europe Connected Aircraft Market Share Forecast by Country, 2024 & 2034 (%)
Figure 61 Europe Connected Aircraft Market Forecast by Type, 2024-2034 (US$ Million, AGR %)
Figure 62 Europe Connected Aircraft Market Share Forecast by Type, 2024 & 2034 (%)
Figure 63 Europe Connected Aircraft Market Forecast by Connectivity, 2024-2034 (US$ Million, AGR %)
Figure 64 Europe Connected Aircraft Market Share Forecast by Connectivity, 2024 & 2034 (%)
Figure 65 Europe Connected Aircraft Market Forecast by Platform, 2024-2034 (US$ Million, AGR %)
Figure 66 Europe Connected Aircraft Market Share Forecast by Platform, 2024 & 2034 (%)
Figure 67 Germany Connected Aircraft Market Forecast, 2024-2034 (US$ Million, AGR %)
Figure 68 UK Connected Aircraft Market Forecast, 2024-2034 (US$ Million, AGR %)
Figure 69 France Connected Aircraft Market Forecast, 2024-2034 (US$ Million, AGR %)
Figure 70 Ireland Connected Aircraft Market Forecast, 2024-2034 (US$ Million, AGR %)
Figure 71 Spain Connected Aircraft Market Forecast, 2024-2034 (US$ Million, AGR %)
Figure 72 Rest of the Europe Connected Aircraft Market Forecast, 2024-2034 (US$ Million, AGR %)
Figure 73 Asia Pacific Connected Aircraft Market Attractiveness Index
Figure 74 Asia Pacific Connected Aircraft Market by Region, 2024, 2029 & 2034 (US$ Million)
Figure 75 Asia Pacific Connected Aircraft Market Forecast by Country, 2024-2034 (US$ Million, AGR %)
Figure 76 Asia Pacific Connected Aircraft Market Share Forecast by Country, 2024 & 2034 (%)
Figure 77 Asia Pacific Connected Aircraft Market Forecast by Type, 2024-2034 (US$ Million, AGR %)
Figure 78 Asia Pacific Connected Aircraft Market Share Forecast by Type, 2024 & 2034 (%)
Figure 79 Asia Pacific Connected Aircraft Market Forecast by Connectivity, 2024-2034 (US$ Million, AGR %)
Figure 80 Asia Pacific Connected Aircraft Market Share Forecast by Connectivity, 2024 & 2034 (%)
Figure 81 Asia Pacific Connected Aircraft Market Forecast by Platform, 2024-2034 (US$ Million, AGR %)
Figure 82 Asia Pacific Connected Aircraft Market Share Forecast by Platform, 2024 & 2034 (%)
Figure 83 China Connected Aircraft Market Forecast, 2024-2034 (US$ Million, AGR %)
Figure 84 India Connected Aircraft Market Forecast, 2024-2034 (US$ Million, AGR %)
Figure 85 Japan Connected Aircraft Market Forecast, 2024-2034 (US$ Million, AGR %)
Figure 86 South Korea Connected Aircraft Market Forecast, 2024-2034 (US$ Million, AGR %)
Figure 87 Australia Connected Aircraft Market Forecast, 2024-2034 (US$ Million, AGR %)
Figure 88 Rest of Asia Pacific Connected Aircraft Market Forecast, 2024-2034 (US$ Million, AGR %)
Figure 89 Latin America Connected Aircraft Market Attractiveness Index
Figure 90 Latin America Connected Aircraft Market by Region, 2024, 2029 & 2034 (US$ Million)
Figure 91 Latin America Connected Aircraft Market Forecast by Country, 2024-2034 (US$ Million, AGR %)
Figure 92 Latin America Connected Aircraft Market Share Forecast by Country, 2024 & 2034 (%)
Figure 93 Latin America Connected Aircraft Market Forecast by Type, 2024-2034 (US$ Million, AGR %)
Figure 94 Latin America Connected Aircraft Market Share Forecast by Type, 2024 & 2034 (%)
Figure 95 Latin America Connected Aircraft Market Forecast by Connectivity, 2024-2034 (US$ Million, AGR %)
Figure 96 Latin America Connected Aircraft Market Share Forecast by Connectivity, 2024 & 2034 (%)
Figure 97 Latin America Connected Aircraft Market Forecast by Platform, 2024-2034 (US$ Million, AGR %)
Figure 98 Latin America Connected Aircraft Market Share Forecast by Platform, 2024 & 2034 (%)
Figure 99 Brazil Connected Aircraft Market Forecast, 2024-2034 (US$ Million, AGR %)
Figure 100 Mexico Connected Aircraft Market Forecast, 2024-2034 (US$ Million, AGR %)
Figure 101 Rest of Latin America Connected Aircraft Market Forecast, 2024-2034 (US$ Million, AGR %)
Figure 102 Middle East & Africa Connected Aircraft Market Attractiveness Index
Figure 103 Middle East & Africa Connected Aircraft Market by Region, 2024, 2029 & 2034 (US$ Million)
Figure 104 Middle East & Africa Connected Aircraft Market Forecast by Country, 2024-2034 (US$ Million, AGR %)
Figure 105 Middle East & Africa Connected Aircraft Market Share Forecast by Country, 2024 & 2034 (%)
Figure 106 Middle East & Africa Connected Aircraft Market Forecast by Type, 2024-2034 (US$ Million, AGR %)
Figure 107 Middle East & Africa Connected Aircraft Market Share Forecast by Type, 2024 & 2034 (%)
Figure 108 Middle East & Africa Connected Aircraft Market Forecast by Connectivity, 2024-2034 (US$ Million, AGR %)
Figure 109 Middle East & Africa Connected Aircraft Market Share Forecast by Connectivity, 2024 & 2034 (%)
Figure 110 Middle East & Africa Connected Aircraft Market Forecast by Platform, 2024-2034 (US$ Million, AGR %)
Figure 111 Middle East & Africa Connected Aircraft Market Share Forecast by Platform, 2024 & 2034 (%)
Figure 112 GCC Connected Aircraft Market Forecast, 2024-2034 (US$ Million, AGR %)
Figure 113 South Africa Connected Aircraft Market Forecast, 2024-2034 (US$ Million, AGR %)
Figure 114 Rest of Middle East & Africa Connected Aircraft Market Forecast, 2024-2034 (US$ Million, AGR %)
Figure 115 Gogo Inc.: Net Revenue, 2019-2023 (US$ Million, AGR%)
Figure 116 Gogo Inc.: Type Market Shares, 2023
Figure 117 Gogo Inc.: Segment Market Shares, 2023
Figure 118 Gogo Inc.: Customer Market Shares, 2023
Figure 119 Honeywell: Net Revenue, 2018-2023 (US$ Million, AGR%)
Figure 120 Honeywell: Segment Market Shares, 2023
Figure 121 Honeywell: Performance Materials and Technologies Segment Market Shares, 2023
Figure 122 Honeywell: Aerospace Segment Market Shares, 2023
Figure 123 Honeywell Building Technologies: Segment Market Shares, 2023
Figure 124 Honeywell: Safety and Productivity Solutions Segment Market Shares, 2023
Figure 125 Raytheon: Net Revenue, 2018-2023 (US$ Million, AGR%)
Figure 126 Raytheon: Regional Market Shares, 2023
Figure 127 Raytheon: Segment Market Shares, 2023
Figure 128 Raytheon: Segment Market Shares, 2023
Figure 129 Thales: Net Revenue, 2018-2023 (US$ Million, AGR%)
Figure 130 Thales: Regional Market Shares, 2023
Figure 131 Thales: Segment Market Shares, 2023
Figure 132 Viasat: Net Revenue, 2019-2023 (US$ Million, AGR%)
Figure 133 Viasat: Customer Market Shares, 2023
Figure 134 Viasat: Segment Market Shares, 2023
Figure 135 Viasat: Segment Market Shares, 2023
Figure 136 TE Connectivity: Net Revenue, 2019-2023 (US$ Million, AGR%)
Figure 137 TE Connectivity: Regional Market Shares, 2023
Figure 138 TE Connectivity: Segment Market Shares, 2023
Figure 139 Iridium Communications: Net Revenue, 2019-2023 (US$ Million, AGR%)
Figure 140 Iridium Communications: Regional Market Shares, 2023
Figure 141 Iridium Communications: Segment Market Shares, 2023
Figure 142 Astronics Corporation: Net Revenue, 2019-2023 (US$ Million, AGR%)
Figure 143 Astronics Corporation: Regional Market Shares, 2023
Figure 144 Astronics Corporation: Segment Market Shares, 2023
Figure 145 Astronics Corporation: Segment Market Shares, 2023
Figure 146 Panasonic Holdings Corporation: Net Revenue, 2018-2023 (US$ Million, AGR%)
Figure 147 Panasonic Holdings Corporation: Regional Market Shares, 2023
Figure 148 Panasonic Holdings Corporation: Segment Market Shares, 2023


