持続可能な航空燃料市場レポート:2024-2024
Sustainable Aviation Fuel Market Report 2024-2024
レポート詳細
持続可能な航空燃料市場レポート 2024-2034 :本レポートは、業界とその根底にあるダイナミクスをより良く理解したいと望むならば、新たな収益ポケットを目指す大手企業にとって非常に... もっと見る
※上記価格は部署ライセンス(Departmental licence)価格です。
その他の価格についてはデータリソースまでお問合せください。
日本語のページは自動翻訳を利用し作成しています。
実際のレポートは英文のみでご納品いたします。
サマリー
レポート詳細
持続可能な航空燃料市場レポート 2024-2034:本レポートは、業界とその根底にあるダイナミクスをより良く理解したいと望むならば、新たな収益ポケットを目指す大手企業にとって非常に貴重なものとなるでしょう。異業種への進出や新たな地域での既存事業の拡大を目指す企業にも有用です。
政府の取り組みが持続可能な航空燃料(SAF)の導入を後押ししている
世界的に厳しい環境規制や政策が、持続可能な航空燃料(SAF)市場の成長を後押ししている。各国政府はSAFの採用を促進するため、混合燃料の義務付けやインセンティブなどの施策を実施しており、水素ソリューションを重視している国もある。米国のインフレ抑制法や英国のジェット・ゼロ戦略のような取り組みが水素経済を牽引しており、航空業界は2023年までに水素を動力源とする電力に注力する。また、カーボンプライシングメカニズムや排出権取引制度は、SAFの生産と使用への投資を奨励する。各国政府が環境規制を強化し、野心的な排出削減目標を設定し続ける中、SAFの需要は拡大し、業界関係者にとって有利な市場環境が生まれると予想される。
持続可能な航空燃料(SAF)産業に関連する課題
持続可能な航空燃料(SAF)市場の成長を阻害する主な課題は、持続可能な原料の入手可能性が限られ、コストが高いことである。例えば、国際クリーン輸送評議会(ICCT)によると、持続可能な航空燃料の製造コストは大きく異なり、1リットル当たり0.88ユーロまたは1.0米ドル(ハイドロプロセスドエステルと脂肪酸(HEFA)プロセスを使用した脂質ベースの原料の場合)から、1リットル当たり3.44ユーロまたは3.9米ドル(発酵糖のハイドロプロセッシングを使用した場合)である。このコスト範囲は、従来のジェット燃料の価格の約2倍から8倍である。
また、英国を拠点とする業界団体Energy Industries Council(EIC)が2024年3月に発表した報告書では、持続可能な航空燃料(SAF)の世界的な生産拡大を阻む主な障害として、高コストと限られた原料の利用可能性が強調されている。SAFは、従来のジェット燃料に比べてライフサイクル炭素排出量を最大80%削減できるなど、環境面で大きなメリットがあるにもかかわらず、現在の市場シェアは1%未満にとどまっている。2050年までに二酸化炭素排出量を正味ゼロにするという航空業界の目標を達成するためには、原料へのアクセス、投資の誘致、SAFの生産と採用を支援する政府政策の実施といった課題に取り組むことが不可欠である。
市場調査レポートを購入する前にすべき質問とは?
-
持続可能な航空燃料市場はどのように進化しているのか?
-
持続可能な航空燃料市場の推進要因と阻害要因は何か?
-
持続可能な航空燃料の各サブマーケットは予測期間中にどのように成長し、2034年にはどれくらいの売上を占めるようになるのか?
-
2024年から2034年にかけて、持続可能な航空燃料の各サブマーケットの市場シェアはどのように推移するか?
-
2024年から2034年にかけて、市場全体を牽引する主な要因は何か?
-
主要な持続可能な航空燃料市場は、マクロ経済の動きに幅広く追随するのか、それとも個々の国の市場が他を凌駕するのか。
-
2034年までに各国市場のシェアはどのように変化し、どの地域が2034年の市場をリードするのか。
-
主要プレーヤーと予測期間中の見通しは?
-
これらの大手企業にとっての持続可能な航空燃料プロジェクトとは?
-
2024年から2034年の間に、業界はどのように発展していくのか?現在、そして今後10年間に行われる持続可能な航空燃料プロジェクトにはどのような意味があるのか?
-
持続可能な航空燃料市場をさらに拡大するためには、製品の商業化がより必要なのでしょうか?
-
持続可能な航空燃料市場はどこへ向かっているのか。
-
新商品や新サービスに最適な投資方法とは?
-
企業を新たな成長軌道に乗せ、C-suiteに移行させるための重要な展望とは?
このことが、現在、そして今後10年間の持続可能な航空燃料市場にどのような影響を与えるかを見極める必要がある:
-
286ページに及ぶレポートには、112の表と161の図表が掲載されている。
-
本レポートでは、業界の主要な有利分野を取り上げている。
-
世界、地域、国の売上高と成長に関する詳細な分析が含まれている。
-
競合他社が成功した主なトレンド、変化、収益予測をハイライトします。
本レポートは、持続可能な航空燃料市場が今後10年間にどのように発展していくのか、またCOVID-19の景気後退と好転の変動に合わせてどのように発展していくのかを今でお伝えするものである。この市場は、過去10年間のどの時点よりも今が重要である。
2034年までの予測やその他の分析から、商業的な展望が明らかになる
-
2034年までの収益予測に加え、最近の実績、成長率、市場シェアも提供している。
-
ビジネスの展望や展開など、独自の分析が掲載されている。
-
定性的分析(市場ダイナミクス、促進要因、機会、阻害要因、課題を含む)、コスト構造、持続可能な航空燃料価格上昇の影響、最近の動向をご覧ください。
本レポートには、COVID-19が業界と貴社にどのような影響を与えるかについてのデータ分析と貴重な洞察が含まれている。本レポートでは、COVID-19の4つの回復パターンとその影響、すなわち「V」、「L」、「W」、「U」について論じている。
レポート対象セグメント
燃料タイプ
-
水素燃料電池
-
バイオ燃料
-
液体への電力
-
ガスから液体へ
混合容量
バイオ燃料製造技術
-
HFS-SIP
-
ATJ-SPK
-
FT-SPK
-
HEFA-SPK
プラットフォーム
-
民間航空
-
軍用航空
-
ビジネス&ゼネラル・アビエーション
-
無人航空機
世界市場全体と各分野の売上予測に加え、5つの地域と16の主要国市場の売上予測も掲載しています:
北米
欧州
-
ドイツ
-
フランス
-
英国
-
イタリア
-
ロシア
-
その他の欧州地域
アジア太平洋
-
日本
-
中国
-
インド
-
オーストラリア
-
韓国
-
その他のアジア太平洋地域
ラテンアメリカ
MEA
についてまた、2024年から2034年までの持続可能な航空燃料市場における主要企業のプロファイルも掲載している。
報告書に掲載されている主要企業
-
Aemetis, Inc.
-
Avfuel Corporation
-
Ballard Power Systems
-
Eni SPA
-
Fulcrum BioEnergy, Inc.
-
Gevo Inc.
-
LanzaTech
-
Neste Oyj
-
Northwest Advanced Biofuels, LLC.
-
OMV Aktiengesellschaft
-
Red Rock Biofuels
-
SKYNRG
-
TotalEnergies SE
-
Velocys
2024年から2034年までの持続可能な航空燃料市場の世界全体の売上高は、金額ベースで2024年に14億6,560万米ドルを突破する。2034年まで収益は力強く成長すると予測している。当研究所では、最も大きな可能性を秘めた組織を特定している。彼らの能力、進歩、商業的展望を発見し、あなたが一歩先を行くのを支援します。
持続可能な航空燃料市場、2024〜2034年」レポートはどのようにお役に立ちますか?
要約すると、280ページを超えるこのレポートは、以下の知識を提供する:
-
持続可能な航空燃料市場、2024年から2034年までの収益予測 燃料タイプ、混合能力、バイオ燃料製造技術、プラットフォームの各予測を世界および地域レベルで掲載 - 業界の将来性を発見し、投資と収益に最も有利な場所を見つけることができます。
-
5つの地域と16の主要国市場の2034年までの収益予測 - 北米、欧州、アジア太平洋、中南米、MEAの持続可能な航空燃料市場、2024年から2034年までの市場予測をご覧ください。また、米国、カナダ、メキシコ、ブラジル、ドイツ、フランス、ロシア、イタリア、中国、インド、日本、オーストラリアなどの主要国の市場も予測しています。
-
2024年から2034年までの持続可能な航空燃料市場に関わる主要企業14社の企業プロファイルを含む。
独自の予測による定量的・定性的分析をご覧ください。私たちのレポートだけに含まれる情報を入手し、貴重なビジネスインテリジェンスで情報を得ることができます。
他にはない情報
私たちの新しいレポートがあれば、知識に遅れをとったり、チャンスを逃したりする可能性が低くなります。Visiongainのレポートが貴社の調査、分析、意思決定にどのように役立つかをご覧ください。Visiongainの調査は、持続可能な航空燃料市場、2024年から2034年、市場をリードする企業の商業分析を必要とするすべての人のためのものです。データ、トレンド、予測をご覧いただけます。
ページTOPに戻る
目次
1 レポート概要
1.1 調査の目的
1.2 持続可能な航空燃料市場の紹介
1.3 本レポートの内容
1.4 本レポートを読むべき理由
1.5 本分析レポートが回答する主な質問
1.6 本レポートは誰のためのものか?
1.7 方法論
1.7.1 市場の定義
1.7.2 市場評価・予測手法
1.7.3 データの検証
1.7.3.1 一次調査
1.7.3.2 セカンダリーリサーチ
1.8 よくある質問(FAQ)
1.9 Visiongainの関連レポート
1.10 Visiongainについて
2 エグゼクティブ・サマリー
3 市場概要
3.1 主要な調査結果
3.2 市場ダイナミクス
3.2.1 市場促進要因
3.2.1.1 持続可能な航空燃料の採用を促進する政府の取り組み
3.2.1.2 SAFプロセスにおける技術の進歩と革新
3.2.1.3 環境の持続可能性と脱炭素化への取り組みのための持続可能な航空燃料(SAF)へのシフトの推進力
3.2.2 市場阻害要因
3.2.2.1 持続可能な原料の入手制限とコスト高が持続可能な航空燃料(SAF)市場の拡大を妨げる
3.2.2.2 SAF生産のためのインフラと流通の課題
3.2.3 市場機会
3.2.3.1 持続可能な航空燃料(SAF)への投資機会の増加
3.2.3.2 持続可能な航空燃料(SAF)供給に関する市場拡大と協力関係
3.3 COVID-19影響分析
3.4 ポーターのファイブフォース分析
3.4.1 サプライヤーの交渉力中程度~中程度
3.4.2 買い手の交渉力:高程度~高程度
3.4.3 競争上のライバル: 高程度~高程度
3.4.4 代替品からの脅威:低程度~中程度
3.4.5 新規参入の脅威:低程度~低程度
3.5 PEST分析
3.6 SWOT分析
4 持続可能な航空燃料市場分析:燃料タイプ別
4.1 主要な調査結果
4.2 燃料タイプ別セグメント 市場魅力度指数
4.3 燃料タイプ別持続可能な航空燃料市場規模の推定と予測
4.4 水素燃料電池
4.4.1 2024〜2034年の地域別市場規模(US$ Million)
4.4.2 地域別市場シェア、2024年・2034年(%)
4.5 バイオ燃料
4.5.1 2024〜2034年の地域別市場規模(US$ Million)
4.5.2 地域別市場シェア、2024年・2034年(%)
4.6 パワー・ツー・リキッド
4.6.1 2024~2034年の地域別市場規模(US$ Million)
4.6.2 地域別市場シェア、2024年・2034年(%)
4.7 ガスから液体へ
4.7.1 2024~2034年の地域別市場規模(US$ Million)
4.7.2 地域別市場シェア、2024年・2034年(%)
5 持続可能な航空燃料市場分析:混入容量別
5.1 主要調査結果
5.2 混合容量セグメント 市場魅力度指数
5.3 混入容量別のサステイナブル航空燃料市場規模の推定と予測
5.4 30%未満
5.4.1 2024〜2034年の地域別市場規模(US$ Million)
5.4.2 地域別市場シェア、2024年・2034年(%)
5.5 30%~50%未満
5.5.1 2024〜2034年の地域別市場規模(US$ Million)
5.5.2 地域別市場シェア、2024年・2034年(%)
5.6 50%以上
5.6.1 2024~2034年の地域別市場規模(US$ Million)
5.6.2 地域別市場シェア、2024年・2034年(%)
6 持続可能な航空燃料市場分析:バイオ燃料製造技術別
6.1 主要な調査結果
6.2 バイオ燃料製造技術セグメント 市場魅力度指数
6.3 バイオ燃料製造技術別の持続可能な航空燃料市場規模の推定と予測
6.4 HFS-SIP
6.4.1 2024〜2034年の地域別市場規模(US$ Million)
6.4.2 地域別市場シェア、2024年・2034年(%)
6.5 ATJ-SPK
6.5.1 2024-2034年地域別市場規模(US$ Million)
6.5.2 地域別市場シェア、2024年・2034年(%)
6.6 FT-SPK
6.6.1 2024~2034年の地域別市場規模(US$ Million)
6.6.2 地域別市場シェア、2024年・2034年(%)
6.7 HEFA-SPK
6.7.1 2024~2034年の地域別市場規模(US$ Million)
6.7.2 地域別市場シェア、2024年・2034年(%)
7 持続可能な航空燃料市場分析:プラットフォーム別
7.1 主要調査結果
7.2 プラットフォームセグメント 市場魅力度指数
7.3 プラットフォーム別持続可能な航空燃料市場規模の推定と予測
7.4 民間航空
7.4.1 地域別市場シェア、2024年・2034年(%)
7.5 軍用航空
7.5.1 2024〜2034年の地域別市場規模(US$ Million)
7.5.2 地域別市場シェア、2024年・2034年(%)
7.6 ビジネス・一般航空
7.6.1 2024〜2034年の地域別市場規模(US$ Million)
7.6.2 地域別市場シェア、2024年・2034年(%)
7.7 無人航空機
7.7.1 2024~2034年の地域別市場規模(US$ Million)
7.7.2 地域別市場シェア、2024年・2034年(%)
8 持続可能な航空燃料市場分析:地域別
8.1 主要な調査結果
8.2 地域別市場規模の推定と予測
9 北米の持続可能な航空燃料市場分析
9.1 主要な調査結果
9.2 北米の持続可能な航空燃料市場魅力度指数
9.3 北米の持続可能な航空燃料の国別市場、2024年、2029年、2034年(US$ Million)
9.4 北米の持続可能な航空燃料市場規模推定と予測:国別
9.5 北米の持続可能な航空燃料市場規模推定と予測:燃料タイプ別
9.6 北米の持続可能な航空燃料市場規模推定と予測:混合容量別
9.7 北米の持続可能な航空燃料市場規模推定と予測:バイオ燃料製造技術別
9.8 北米の持続可能な航空燃料市場規模推定と予測:プラットフォーム別
9.9 米国の持続可能な航空燃料市場分析
9.10 カナダの持続可能な航空燃料市場分析
10 欧州の持続可能な航空燃料市場分析
10.1 主要な調査結果
10.2 欧州の持続可能な航空燃料市場魅力度指数
10.3 欧州の持続可能な航空燃料の国別市場、2024年、2029年、2034年(US$ Million)
10.4 欧州の持続可能な航空燃料市場規模推定と予測:国別
10.5 欧州の持続可能な航空燃料市場規模推定と予測:燃料タイプ別
10.6 欧州の持続可能な航空燃料市場規模推定と予測:混合容量別
10.7 欧州の持続可能な航空燃料市場規模推定と予測:バイオ燃料製造技術別
10.8 欧州の持続可能な航空燃料市場規模推定と予測:プラットフォーム別
10.9 ドイツの持続可能な航空燃料市場分析
10.10 フランスの持続可能な航空燃料市場分析
10.11 イギリスの持続可能な航空燃料市場分析
10.12 イタリアの持続可能な航空燃料市場分析
10.13 ロシアの持続可能な航空燃料市場分析
10.14 その他のヨーロッパの持続可能な航空燃料市場分析
11 アジア太平洋地域の持続可能な航空燃料市場分析
11.1 主要な調査結果
11.2 アジア太平洋地域の持続可能な航空燃料市場魅力度指数
11.3 アジア太平洋地域の持続可能な航空燃料の国別市場、2024年、2029年、2034年(US$ Million)
11.4 アジア太平洋地域の持続可能な航空燃料市場規模推定と予測:国別
11.5 アジア太平洋地域の持続可能な航空燃料市場規模推定と予測:燃料タイプ別
11.6 アジア太平洋地域の持続可能な航空燃料市場規模推定と予測:混合容量別
11.7 アジア太平洋地域の持続可能な航空燃料市場規模推定と予測:バイオ燃料製造技術別
11.8 アジア太平洋地域の持続可能な航空燃料市場規模推定と予測:プラットフォーム別
11.9 日本の持続可能な航空燃料市場分析
11.10 中国の持続可能な航空燃料市場分析
11.11 インドの持続可能な航空燃料市場分析
11.12 オーストラリアの持続可能な航空燃料市場分析
11.13 韓国の持続可能な航空燃料市場分析
11.14 その他のアジア太平洋地域の持続可能な航空燃料市場分析
12 ラテンアメリカの持続可能な航空燃料市場分析
12.1 主要な調査結果
12.2 ラテンアメリカの持続可能な航空燃料市場魅力度指数
12.3 ラテンアメリカの持続可能な航空燃料の国別市場、2024年、2029年、2034年(US$ Million)
12.4 ラテンアメリカの持続可能な航空燃料市場規模推定と予測:国別
12.5 ラテンアメリカの持続可能な航空燃料市場規模推定と予測:燃料タイプ別
12.6 ラテンアメリカの持続可能な航空燃料市場規模推定と予測:混合容量別
12.7 ラテンアメリカの持続可能な航空燃料市場規模推定と予測:バイオ燃料製造技術別
12.8 ラテンアメリカの持続可能な航空燃料市場規模推定と予測:プラットフォーム別
12.9 ブラジルの持続可能な航空燃料市場分析
12.10 メキシコの持続可能な航空燃料市場分析
12.11 その他のラテンアメリカの持続可能な航空燃料市場分析
13 MEAの持続可能な航空燃料市場分析
13.1 主要な調査結果
13.2 MEA持続可能な航空燃料市場魅力度指数
13.3 MEAの持続可能な航空燃料の国別市場、2024年、2029年、2034年(US$ Million)
13.4 MEAの持続可能な航空燃料市場規模推定と予測:国別
13.5 MEAの持続可能な航空燃料市場規模推定と予測:燃料タイプ別
13.6 MEAの持続可能な航空燃料市場規模推定と予測:混合容量別
13.7 MEAの持続可能な航空燃料市場規模推定と予測:バイオ燃料製造技術別
13.8 MEAの持続可能な航空燃料市場規模推定と予測:プラットフォーム別
13.9 GCCの持続可能な航空燃料市場分析
13.10 南アフリカの持続可能な航空燃料市場の分析
13.11 その他のMEA持続可能な航空燃料市場の分析
14 主要企業のプロファイル
14.1 競争環境、2023年
14.2 戦略的展望
14.3 Aemetis, Inc.
14.3.1 会社概要
14.3.2 会社概要
14.3.3 財務分析
14.3.3.1 純収入、2019-2023年
14.3.3.2 R&D、2019-2023年
14.3.3.3 セグメント市場シェア、2023年
14.3.4 製品ベンチマーク
14.3.5 戦略的展望
14.4 Avfuel Corporation
14.4.1 会社概要
14.4.2 会社概要
14.4.3 製品ベンチマーク
14.4.4 戦略的展望
14.5 Ballard Power Systems
14.5.1 会社概要
14.5.2 会社概要
14.5.3 財務分析
14.5.3.1 純収入、2019-2023年
14.5.3.2 地域市場シェア、2023年
14.5.3.3 セグメント市場シェア、2023年
14.5.4 製品ベンチマーク
14.5.5 戦略的展望
14.6 Eni SPA
14.6.1 会社概要
14.6.2 会社概要
14.6.3 財務分析
14.6.3.1 純収入、2019-2023年
14.6.3.2 R&D、2019年〜2023年
14.6.3.3 地域市場シェア、2023年
14.6.3.4 セグメント市場シェア、2023年
14.6.4 製品ベンチマーク
14.6.5 戦略的展望
14.7 Fulcrum BioEnergy, Inc.
14.7.1 会社概要
14.7.2 会社概要
14.7.3 製品ベンチマーク
14.7.4 戦略的展望
14.8 Gevo Inc.
14.8.1 会社概要
14.8.2 会社概要
14.8.3 財務分析
14.8.3.1 純収入、2019-2023年
14.8.3.2 セグメント市場シェア、2023年
14.8.4 製品ベンチマーク
14.8.5 戦略的展望
14.9 LanzaTech
14.9.1 会社概要
14.9.2 会社概要
14.9.3 製品ベンチマーク
14.9.4 戦略的展望
14.10 Neste Oyj
14.10.1 会社概要
14.10.2 会社概要
14.10.3 財務分析
14.10.3.1 純収入、2019年~2023年
14.10.3.2 地域別市場シェア(2023年
14.10.3.3 セグメント市場シェア(2023年
14.10.4 製品ベンチマーク
14.10.5 戦略的展望
14.11 Northwest Advanced Biofuels, LLC.
14.11.1 会社概要
14.11.2 会社概要
14.11.3 製品ベンチマーク
14.11.4 戦略的展望
14.12 OMV Aktiengesellschaft
14.12.1 会社概要
14.12.2 会社概要
14.12.3 財務分析
14.12.3.1 純収入、2019年~2023年
14.12.3.2 地域別市場シェア(2023年
14.12.3.3 セグメント別市場シェア(2023年
14.12.4 製品ベンチマーク
14.12.5 戦略的展望
14.13 Red Rock Biofuels
14.13.1 会社概要
14.13.2 会社概要
14.13.3 製品ベンチマーク
14.13.4 戦略的展望
14.14 SKYNRG
14.14.1 会社概要
14.14.2 会社概要
14.14.3 製品ベンチマーク
14.14.4 戦略的展望
14.15 TotalEnergies SE
14.15.1 会社概要
14.15.2 会社概要
14.15.3 財務分析
14.15.3.1 純収入、2019年~2023年
14.15.3.2 地域別市場シェア(2023年
14.15.3.3 セグメント市場シェア(2023年
14.15.4 製品ベンチマーク
14.15.5 戦略的展望
14.16 Velocys
14.16.1 会社概要
14.16.2 会社概要
14.16.3 製品ベンチマーク
14.16.4 戦略的展望
15 結論と提言
15.1 Visiongainからの結びの言葉
15.2 市場プレイヤーへの提言
ページTOPに戻る
図表リスト
表の一覧
表1 持続可能な航空燃料市場のスナップショット、2024年〜2034年(百万米ドル、CAGR %)
表1 持続可能な航空燃料市場持続可能な航空燃料の地域別市場予測、2024〜2034年(百万米ドル、AGR%、CAGR)「V字型回復
表2.持続可能な航空燃料の地域別市場予測、2024~2034年(百万米ドル、AGR%、CAGR%):「U字型回復
表3.持続可能な航空燃料の地域別市場予測、2024~2034年(百万米ドル、AGR%、CAGR%):「W字型回復
表4.持続可能な航空燃料の地域別市場予測、2024~2034年(百万米ドル、AGR%、CAGR%):「L字型回復
表5.持続可能な航空燃料の燃料タイプ別市場予測、2024〜2034年(百万米ドル、AGR%、CAGR)
表6.水素燃料電池の地域別市場予測、2024~2034年(百万米ドル、AGR%、CAGR)
表7.バイオ燃料セグメントの地域別市場予測、2024~2034年(百万米ドル、AGR%、CAGR)
表8.パワー・ツー・リキッドセグメントの地域別市場予測、2024~2034年(百万米ドル、AGR%、CAGR)
表9.ガス~液体セグメントの地域別市場予測、2024~2034年(百万米ドル、AGR%、CAGR)
表10.持続可能な航空燃料の混合容量別市場予測、2024~2034年(百万米ドル、AGR%、CAGR)
表11.30%未満セグメントの地域別市場予測、2024~2034年(百万米ドル、AGR%、CAGR)
表12.30%~50%セグメント地域別市場予測、2024~2034年(百万米ドル、AGR%、CAGR)
表13.50%以上セグメントの地域別市場予測、2024~2034年(百万米ドル、AGR%、CAGR)
表14.バイオ燃料製造技術別の持続可能な航空燃料市場予測、2024~2034年(百万米ドル、AGR%、CAGR)
表15.HFS-SIPセグメントの地域別市場予測、2024~2034年(百万米ドル、AGR%、CAGR)
表16.ATJ-SPKセグメントの地域別市場予測、2024~2034年(百万米ドル、AGR%、CAGR)
表17.FT-SPKセグメントの地域別市場予測、2024~2034年 (百万米ドル, AGR%, CAGR%)
表18.HEFA-SPKセグメントの地域別市場予測、2024~2034年(百万米ドル、AGR%、CAGR)
表19.持続可能な航空燃料のプラットフォーム別市場予測、2024~2034年(百万米ドル、AGR%、CAGR)
表20.民間航空機セグメントの地域別市場予測、2024~2034年(百万米ドル、AGR%、CAGR)
表21.軍用機セグメントの地域別市場予測、2024~2034年(百万米ドル、AGR%、CAGR)
表22.ビジネス・一般航空セグメントの地域別市場予測、2024~2034年(百万米ドル、AGR%、CAGR)
表23.無人航空機セグメントの地域別市場予測、2024~2034年(百万米ドル、AGR%、CAGR)
表24.持続可能な航空燃料の地域別市場予測、2024~2034年(百万米ドル、AGR%、CAGR)
表25.北米の持続可能な航空燃料の国別市場予測、2024〜2034年(百万米ドル、AGR%、CAGR)
表26.北米の持続可能な航空燃料市場の燃料タイプ別予測、2024〜2034年(百万米ドル、AGR%、CAGR)
表27.北米の持続可能な航空燃料市場の予測:混合容量別、2024〜2034年(百万米ドル、AGR%、CAGR)
表28.北米の持続可能な航空燃料市場の予測:バイオ燃料製造技術別、2024〜2034年(百万米ドル、AGR%、CAGR)
表29.北米の持続可能な航空燃料市場の予測:プラットフォーム別、2024〜2034年(百万米ドル、AGR%、CAGR)
表30.米国の持続可能な航空燃料市場の予測、2024~2034年(百万米ドル、AGR%、CAGR)
表31.カナダの持続可能な航空燃料市場の予測、2024~2034年(百万米ドル、AGR%、CAGR)
表32.欧州の持続可能な航空燃料の国別市場予測、2024~2034年(百万米ドル、AGR%、CAGR)
表33.欧州の持続可能な航空燃料市場の燃料タイプ別予測、2024〜2034年(百万米ドル、AGR%、CAGR)
表34.欧州の持続可能な航空燃料市場の予測:混合容量別、2024〜2034年(百万米ドル、AGR%、CAGR)
表35.欧州の持続可能な航空燃料市場の予測:バイオ燃料製造技術別、2024〜2034年(百万米ドル、AGR%、CAGR)
表36.欧州の持続可能な航空燃料市場の予測:プラットフォーム別、2024〜2034年(百万米ドル、AGR%、CAGR)
表37.ドイツの持続可能な航空燃料市場の予測、2024~2034年(百万米ドル、AGR%、CAGR)
表38.フランスの持続可能な航空燃料市場の予測、2024~2034年(百万米ドル、AGR%、CAGR)
表39.イギリスの持続可能な航空燃料市場の予測、2024~2034年(百万米ドル、AGR%、CAGR)
表40.イタリアの持続可能な航空燃料市場の予測、2024~2034年(百万米ドル、AGR%、CAGR)
表41.ロシアの持続可能な航空燃料市場の予測、2024~2034年(百万米ドル、AGR%、CAGR)
表42.その他のヨーロッパの持続可能な航空燃料市場の予測、2024~2034年(百万米ドル、AGR%、CAGR)
表43.アジア太平洋地域の持続可能な航空燃料の国別市場予測、2024~2034年(百万米ドル、AGR%、CAGR)
表44.アジア太平洋地域の持続可能な航空燃料市場の燃料タイプ別予測、2024〜2034年(百万米ドル、AGR%、CAGR)
表45.アジア太平洋地域の持続可能な航空燃料市場の予測:混合容量別、2024〜2034年(百万米ドル、AGR%、CAGR)
表46.アジア太平洋地域の持続可能な航空燃料市場の予測:バイオ燃料製造技術別、2024〜2034年(百万米ドル、AGR%、CAGR)
表47.アジア太平洋地域の持続可能な航空燃料市場の予測:プラットフォーム別、2024〜2034年(百万米ドル、AGR%、CAGR)
表48.日本の持続可能な航空燃料市場の予測、2024~2034年(百万米ドル、AGR%、CAGR)
表49.中国の持続可能な航空燃料市場の予測、2024~2034年(百万米ドル、AGR%、CAGR)
表50.インドの持続可能な航空燃料市場の予測、2024~2034年(百万米ドル、AGR%、CAGR)
表51.オーストラリアの持続可能な航空燃料市場の予測、2024〜2034年(百万米ドル、AGR%、CAGR)
表 52.韓国の持続可能な航空燃料市場の予測、2024~2034年(百万米ドル、AGR%、CAGR)
表53.その他のアジア太平洋地域の持続可能な航空燃料市場の予測、2024~2034年(百万米ドル、AGR%、CAGR)
表54.中南米の持続可能な航空燃料の国別市場予測、2024~2034年(百万米ドル、AGR%、CAGR)
表55.中南米の持続可能な航空燃料市場の燃料タイプ別予測、2024〜2034年(百万米ドル、AGR%、CAGR)
表56.ラテンアメリカの持続可能な航空燃料市場の予測:混合容量別、2024〜2034年(百万米ドル、AGR%、CAGR)
表57.ラテンアメリカの持続可能な航空燃料市場の予測:バイオ燃料製造技術別、2024〜2034年(百万米ドル、AGR%、CAGR)
表58.中南米太平洋地域の持続可能な航空燃料市場の予測:プラットフォーム別、2024~2034年(百万米ドル、AGR%、CAGR)
表59.ブラジルの持続可能な航空燃料市場の予測、2024~2034年(百万米ドル、AGR%、CAGR)
表60.メキシコの持続可能な航空燃料市場の予測、2024~2034年(百万米ドル、AGR%、CAGR)
表61.ラテンアメリカのその他の持続可能な航空燃料市場の予測、2024~2034年(百万米ドル、AGR%、CAGR)
表62.MEAの持続可能な航空燃料の国別市場予測、2024~2034年(百万米ドル、AGR%、CAGR)
表63.MEAの持続可能な航空燃料市場の燃料タイプ別予測、2024〜2034年(百万米ドル、AGR%、CAGR)
表64.MEAの持続可能な航空燃料市場の予測:混合容量別、2024〜2034年(百万米ドル、AGR%、CAGR)
表65.MEAの持続可能な航空燃料市場の予測:バイオ燃料製造技術別、2024〜2034年(百万米ドル、AGR%、CAGR)
表 66.MEA太平洋地域の持続可能な航空燃料市場の予測:プラットフォーム別、2024〜2034年(百万米ドル、AGR%、CAGR)
表67.GCCの持続可能な航空燃料市場の予測、2024~2034年(百万米ドル、AGR%、CAGR)
表68.南アフリカの持続可能な航空燃料市場の予測、2024〜2034年(百万米ドル、AGR%、CAGR)
表69.その他のMEAの持続可能な航空燃料市場の予測、2024~2034年(百万米ドル、AGR%、CAGR)
表70.戦略的展望
表71.エメティス社主な詳細(CEO, 本社, 売上高, 設立, 従業員数, 企業タイプ, ウェブサイト, 事業セグメント)
表72.Aemetis, Inc:製品ベンチマーク
表73.エーメティス戦略的展望
表74.アヴフューエル・コーポレーション主な詳細(CEO, 本社, 売上高, 設立, 従業員数, 企業タイプ, ウェブサイト, 事業セグメント)
表 75.Avfuel Corporation:製品ベンチマーク
表 76.Avfuel Corporation:戦略的展望
表77.バラード・パワー・システムズ主な詳細(CEO, 本社, 売上高, 設立, 従業員数, 企業タイプ, ウェブサイト, 事業セグメント)
表 78.バラード・パワー・システムズ製品ベンチマーク
表 79.バラード・パワー・システムズ戦略的展望
表 80.Eni SPA: 主要詳細(CEO, 本社, 売上高, 設立, 従業員数, 企業タイプ, ウェブサイト, 事業セグメント)
表 81.Eni SPA: 製品ベンチマーク
表82.エニ・スパ:戦略的展望
表83.フルクラム・バイオエナジー社主な詳細(CEO, 本社, 売上高, 設立, 従業員数, 企業タイプ, ウェブサイト, 事業セグメント)
表84.フルクラムバイオエナジー社:製品ベンチマーク
表85.フルクラムバイオエナジー社:戦略的展望
表 86.Gevo Inc:主な詳細(CEO, 本社, 売上高, 設立, 従業員数, 企業タイプ, ウェブサイト, 事業セグメント)
表 87.Gevo Inc:製品ベンチマーク
表 88.Gevo Inc:戦略的展望
表89.ランザテック主な詳細(CEO, 本社, 売上高, 設立, 従業員数, 企業タイプ, ウェブサイト, 事業セグメント)
表 90.ランザテック製品ベンチマーク
表 91.ランザテック戦略的展望
表92.Neste Oyj: 主要詳細(CEO, 本社, 売上高, 設立, 従業員数, 企業タイプ, ウェブサイト, 事業セグメント)
表93.Neste Oyj: 製品ベンチマーク
表94.ネステ・オイジ:戦略的展望
表95.ノースウエスト・アドバンスト・バイオ燃料 LLC:主要詳細(CEO、本社、売上高、設立、従業員数、企業タイプ、ウェブサイト、事業セグメント)
表 96.ノースウエスト・アドバンスト・バイオ燃料 LLC.
表 97.ノースウエスト・アドバンスト・バイオ燃料:戦略的展望
表98.OMV アクティエンゲゼルシャフト主な詳細(CEO, 本社, 売上高, 設立, 従業員数, 企業タイプ, ウェブサイト, 事業セグメント)
表99.OMVアクティエンゲゼルシャフト製品ベンチマーク
表100.OMVアクティエンゲゼルシャフト戦略的展望
表101.レッドロックバイオ燃料主な詳細(CEO, 本社, 売上高, 設立, 従業員数, 企業タイプ, ウェブサイト, 事業セグメント)
表 102.レッドロックバイオ燃料製品ベンチマーク
表103.レッドロックバイオ燃料戦略的展望
表104.SKYNRG:主な詳細(CEO、本社、売上高、設立、従業員数、会社タイプ、ウェブサイト、事業セグメント)
表105.SKYNRG: 製品ベンチマーク
表106.SKYNRG: 戦略的展望
表107.TotalEnergies SE: 主要詳細(CEO, 本社, 売上高, 設立, 従業員数, 企業タイプ, ウェブサイト, 事業セグメント)
表108.トータルエナジーSE:製品ベンチマーク
表109.トータルエナジーSE:戦略的展望
表110.ベロシス主な詳細(CEO, 本社, 売上高, 設立, 従業員数, 企業タイプ, ウェブサイト, 事業セグメント)
表111.ベロシス製品ベンチマーク
表112.ベロシス戦略的展望
ヴェロシス
図の一覧
図1 持続可能な航空燃料市場のセグメント化
図2 燃料タイプ別の持続可能な航空燃料市場:市場魅力度指数
図3 持続可能な航空燃料市場:混合容量別:市場魅力度指数
図4 バイオ燃料製造技術別の持続可能な航空燃料市場:市場魅力度指数市場魅力度指数
図5 持続可能な航空燃料市場:プラットフォーム別市場魅力度指数
図6 持続可能な航空燃料市場:地域別魅力度指数
図7 持続可能な航空燃料市場市場ダイナミクス
図8 持続可能な航空燃料の地域別市場、2024年~2034年(百万米ドル、AGR %):「V字型回復
図9 2024〜2034年の地域別持続可能な航空燃料市場(百万米ドル、AGR %):「V」字型回復「U字型回復
図10 2024~2034年の地域別持続可能な航空燃料市場(百万米ドル、AGR %):「W字型回復
図11 2024~2034年の地域別持続可能な航空燃料市場(百万米ドル、AGR %):「L字型回復
図 12 持続可能な航空燃料市場ポーターのファイブフォース分析
図 13 持続可能な航空燃料市場PEST分析
図 14 持続可能な航空燃料市場SWOT分析
図15 持続可能な航空燃料市場:燃料タイプ別:市場魅力度指数
図16 持続可能な航空燃料の燃料タイプ別市場予測(2024年~2034年)(百万米ドル、AGR
図17 持続可能な航空燃料市場:燃料タイプ別シェア予測(2024年、2029年、2034年)
図18 水素燃料電池セグメントの地域別市場予測、2024~2034年(百万米ドル、AGR)
図 19 水素燃料電池セグメントの地域別市場予測、2024 年~2034 年(%)
図20 バイオ燃料セグメントの地域別市場予測、2024~2034年 (百万米ドル, AGR %)
図 21 2024-2034 地域別バイオ燃料セグメント市場シェア予測 (%)
図22 2024~2034年のPower to Liquidセグメントの地域別市場予測(百万米ドル, AGR)
図 23 2024~2034 年における液化電力セグメントの地域別市場シェア予測 (%)
図 24 2024-2034 年の地域別ガス~液体セグメント市場予測(百万米ドル、AGR)
図 25 2024-2034 地域別ガス~液体燃料セグメント市場シェア予測 (%)
図 26 混合容量別の持続可能な航空燃料市場:市場魅力度指数
図 27 2024-2034 混合容量別持続可能な航空燃料市場予測(百万米ドル、AGR)
図28 混入容量別サステイナブル航空燃料市場予測:2024年、2029年、2034年(%)
図 29 30%未満セグメントの地域別市場予測、2024~2034 年 (百万米ドル, AGR %)
図 30 OEM セグメントの地域別市場予測、2024 年~2034 年(%)
図 31 30~50% セグメントの地域別市場予測、2024~2034 年 (百万米ドル、AGR)
図 32 2024-2034 年における 30%~50% セグメントの地域別市場シェア予測 (%)
図 33 50%以上セグメントの地域別市場予測、2024~2034 年(百万米ドル、AGR)
図 34 2024-2034 年における 50%超セグメントの地域別市場シェア予測(%)
図 35 バイオ燃料製造技術別の持続可能な航空燃料市場:市場魅力度指数
図 36 バイオ燃料製造技術別の持続可能な航空燃料市場予測(2024~2034 年)(百万米ドル、AGR
図37 バイオ燃料製造技術別の持続可能な航空燃料市場予測:2024年、2029年、2034年(%)
図 38 HFS-SIPセグメントの地域別市場予測、2024~2034年(百万米ドル、AGR)
図 39 HFS-SIP セグメントの地域別市場シェア予測、2024 年~2034 年(%)
図40 ATJ-SPKセグメントの地域別市場展望、2024~2034年 (百万米ドル、AGR %)
図 41 2024-2034 年における ATJ-SPK セグメントの地域別市場シェア予測 (%)
図42 2024~2034年FT-SPKセグメント地域別市場展望 (百万米ドル, AGR %)
図 43 2024-2034 年における FT-SPK セグメントの地域別市場シェア予測 (%)
図 44 HEFA-SPK セグメントの地域別市場展望、2024~2034 年 (100 万米ドル、AGR %)
図 45 HEFA-SPK セグメントの地域別市場シェア予測、2024 年~2034 年(%)
図 46 プラットフォーム別持続可能な航空燃料市場:市場魅力度指数
図 47 プラットフォーム別持続可能な航空燃料市場予測、2024~2034 年 (百万米ドル、AGR)
図 48 プラットフォーム別持続可能な航空燃料市場予測:2024, 2029, 2034 (%)
図 49 民間航空機セグメントの地域別市場予測、2024~2034 年 (百万米ドル、AGR)
図 50 HFS-SIP セグメントの地域別市場シェア予測、2024 年~2034 年(%)
図 51 軍用機セグメントの地域別市場予測、2024~2034 年(百万米ドル、AGR)
図 52 軍用機セグメントの地域別市場シェア予測、2024 年~2034 年(%)
図 53 2024-2034 年におけるビジネス・一般航空セグメントの地域別市場予測(百万米ドル、AGR)
図 54 2024-2034 年におけるビジネス・一般航空機セグメントの地域別市場シェア予測 (%)
図 55 無人航空機セグメントの地域別市場予測、2024~2034 年 (百万米ドル、AGR)
図 56 無人航空機セグメントの地域別市場予測、2024~2034 年 (%)
図57 持続可能な航空燃料の地域別市場予測(2024年、2034年)(売上高、CAGR
図58 2024年、2029年、2034年のサステイナブル航空燃料の地域別市場シェア予測(%)
図59 2024年〜2034年の地域別持続可能な航空燃料市場予測(百万米ドル、AGR)
図60 北米の持続可能な航空燃料市場魅力度指数
図 61 北米の持続可能な航空燃料市場:地域別(2024 年、2029 年、2034 年)(百万米ドル
図62 北米の持続可能な航空燃料の国別市場予測、2024~2034年(百万米ドル、AGR %)
図63 北米の持続可能な航空燃料の国別市場予測、2024年&2034年(%)
図64 北米の持続可能な航空燃料市場の燃料タイプ別予測、2024〜2034年 (百万米ドル、AGR %)
図 65 北米の持続可能な航空燃料の燃料タイプ別市場予測、2024 & 2034 (%)
図 66 北米の持続可能な航空燃料市場の予測:混合能力別(2024~2034 年)(百万米ドル、AGR
図67 北米の持続可能な航空燃料市場:混合容量別予測、2024年〜2034年(%)
図 68 北米の持続可能な航空燃料市場の予測:バイオ燃料製造技術別、2024~2034年(百万米ドル、AGR)
図 69 北米の持続可能な航空燃料市場:バイオ燃料製造技術別シェア予測、2024 & 2034 (%)
図 70 北米の持続可能な航空燃料市場:プラットフォーム別予測(2024~2034 年)(百万米ドル、AGR
図 71 北米の持続可能な航空燃料市場:バイオ燃料製造技術別シェア予測、2024 & 2034 (%)
図 72 米国の持続可能な航空燃料市場の予測、2024~2034 年(百万米ドル、AGR %)
図 73 カナダの持続可能な航空燃料市場の予測、2024~2034 年(百万米ドル、AGR)
図 74 欧州の持続可能な航空燃料市場の魅力指数
図 75 欧州の持続可能な航空燃料市場の地域別予測(2024 年、2029 年、2034 年)(百万米ドル
図 76 欧州の持続可能な航空燃料の国別市場予測(2024~2034 年)(百万米ドル、AGR %)
図 77 欧州の持続可能な航空燃料の国別市場シェア予測、2024 年~2034 年 (%)
図78 燃料タイプ別欧州持続可能な航空燃料市場予測、2024~2034年 (百万米ドル、AGR %)
図 79 2024-2034 燃料タイプ別持続可能な航空燃料の欧州市場予測シェア(%)
図 80 2024-2034 混合能力別持続可能な航空燃料の欧州市場予測(百万米ドル、AGR)
図 81 2024-2034 混合容量別持続可能な航空燃料の欧州市場予測 (%)
図 82 2024-2034 バイオ燃料製造技術別持続可能な航空燃料市場予測(百万米ドル、AGR)
図 83 2024-2034 年バイオ燃料製造技術別持続可能な航空燃料市場シェア予測(%) (単位:百万米ドル、AGR
図84 欧州の持続可能な航空燃料のプラットフォーム別市場予測、2024~2034年 (百万米ドル、AGR)
図 85 2024-2034 バイオ燃料製造技術別持続可能な航空燃料市場予測(百万米ドル、AGR)
図 86 ドイツの持続可能な航空燃料市場の予測、2024~2034 年(百万米ドル、AGR %)
図 87 フランスの持続可能な航空燃料市場の予測、2024~2034 年 (100 万米ドル, AGR %)
図 88 イギリスの持続可能な航空燃料の市場予測、2024-2034 (百万米ドル, AGR %)
図 89 イタリアの持続可能な航空燃料の市場予測、2024~2034 年 (100 万米ドル, AGR %)
図 90 ロシアの持続可能な航空燃料市場の予測、2024-2034 (百万米ドル、AGR %)
図 91 その他のヨーロッパの持続可能な航空燃料市場の予測、2024-2034 (百万米ドル、AGR %)
図92 アジア太平洋地域の持続可能な航空燃料市場の魅力指数
図 93 アジア太平洋地域の持続可能な航空燃料市場の地域別予測(2024 年、2029 年、2034 年)(百万米ドル
図94 アジア太平洋地域の持続可能な航空燃料の国別市場予測、2024~2034年(百万米ドル、AGR)
図95 アジア太平洋地域の持続可能な航空燃料の国別市場予測、2024年&2034年(%)
図96 アジア太平洋地域の持続可能な航空燃料の燃料タイプ別市場予測、2024〜2034年 (百万米ドル、AGR)
図 97 アジア太平洋地域の持続可能な航空燃料の燃料タイプ別市場予測、2024 & 2034 (%)
図98 アジア太平洋地域の持続可能な航空燃料の混合容量別市場予測、2024~2034年(百万米ドル、AGR)
図99 アジア太平洋地域の持続可能な航空燃料の混合容量別市場予測、2024年〜2034年(%)
図100 アジア太平洋地域の持続可能な航空燃料市場の予測:バイオ燃料製造技術別、2024〜2034年(百万米ドル、AGR)
図101 アジア太平洋地域の持続可能な航空燃料市場:バイオ燃料製造技術別シェア予測、2024年〜2034年(%)
図102 アジア太平洋地域の持続可能な航空燃料のプラットフォーム別市場予測、2024~2034年(百万米ドル、AGR)
図103 アジア太平洋地域の持続可能な航空燃料市場のバイオ燃料製造技術別シェア予測、2024年 & 2034年 (%)
図 104 日本の持続可能な航空燃料市場の予測、2024~2034年(百万米ドル、AGR %)
図105 中国の持続可能な航空燃料市場の予測、2024~2034年 (百万米ドル, AGR %)
図 106 インドの持続可能な航空燃料市場の予測、2024-2034 年 (百万米ドル、AGR %)
図 107 オーストラリアの持続可能な航空燃料の市場予測、2024-2034 (百万米ドル, AGR %)
図 108 韓国の持続可能な航空燃料市場の予測、2024-2034 (百万米ドル, AGR %)
図 109 その他のアジア太平洋地域の持続可能な航空燃料市場の予測、2024-2034年 (百万米ドル, AGR %)
図110 中南米の持続可能な航空燃料市場の魅力指数
図111 中南米の持続可能な航空燃料市場の地域別予測(2024年、2029年&2034年:百万米ドル)
図112 中南米の持続可能な航空燃料の国別市場予測、2024~2034年(百万米ドル、AGR)
図 113 中南米の持続可能な航空燃料の国別市場予測、2024 年~2034 年 (%)
図114 中南米の持続可能な航空燃料の燃料タイプ別市場予測、2024~2034年 (百万米ドル, AGR %)
図 115 中南米の持続可能な航空燃料の燃料タイプ別市場予測、2024 & 2034 (%)
図116 中南米の持続可能な航空燃料市場予測(混合容量別)、2024~2034年(百万米ドル、AGR
図 117 中南米の持続可能な航空燃料市場:混合容量別予測(2024 年/2034 年)
図118 中南米の持続可能な航空燃料市場:バイオ燃料製造技術別予測(2024~2034年、百万米ドル、AGR)
図 119 中南米の持続可能な航空燃料市場:バイオ燃料製造技術別シェア予測(2024 年~2034 年)
図120 中南米の持続可能な航空燃料のプラットフォーム別市場予測、2024~2034年(百万米ドル、AGR)
図 121 ラテンアメリカの持続可能な航空燃料市場:バイオ燃料製造技術別 2024-2034 年予測 (%)
図 122 ブラジルの持続可能な航空燃料市場の予測、2024~2034 年(百万米ドル、AGR %)
図 123 メキシコの持続可能な航空燃料市場の予測、2024~2034年 (百万米ドル, AGR %)
図 124 その他のラテンアメリカの持続可能な航空燃料市場の予測、2024-2034 (百万米ドル, AGR %)
図 125 MEA持続可能な航空燃料市場の魅力指数
図126 MEA持続可能な航空燃料の地域別市場(2024年、2029年&2034年)(百万米ドル
図127 MEA持続可能な航空燃料の国別市場予測、2024~2034年(百万米ドル、AGR)
図128 MEA持続可能な航空燃料の国別市場予測、2024年&2034年(%)
図129 MEA持続可能な航空燃料の燃料タイプ別市場予測、2024~2034年 (百万米ドル, AGR %)
図 130 MEA 持続可能な航空燃料の燃料タイプ別市場予測、2024 & 2034 (%)
図131 MEA持続可能な航空燃料の混合容量別市場予測、2024~2034年(百万米ドル、AGR)
図 132 中南米の持続可能な航空燃料市場:混合容量別予測、2024 年~2034 年(%)
図 133 MEA持続可能な航空燃料のバイオ燃料製造技術別市場予測:2024~2034年(百万米ドル、AGR)
図 134 MEA 持続可能な航空燃料のバイオ燃料製造技術別市場予測、2024 年 & 2034 年 (%)
図135 MEA持続可能な航空燃料のプラットフォーム別市場予測、2024~2034年 (百万米ドル, AGR %)
図 136 MEA 持続可能な航空燃料のバイオ燃料製造技術別市場予測、2024 年 & 2034 年 (%)
図 137 GCC持続可能な航空燃料の市場予測、2024~2034年(百万米ドル、AGR %)
図 138 南アフリカの持続可能な航空燃料市場の予測、2024~2034年 (百万米ドル, AGR %)
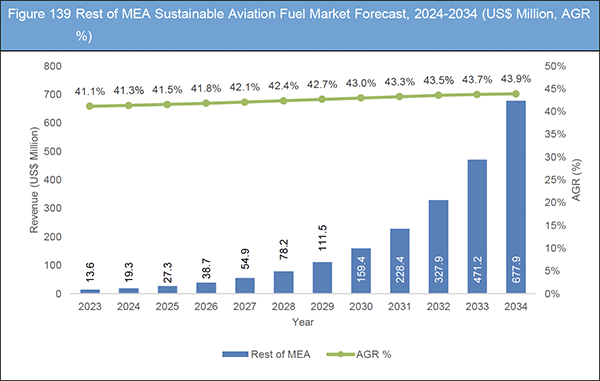
図139 MEAの残りの持続可能な航空燃料市場の予測、2024-2034年 (百万米ドル, AGR %)
図 140 持続可能な航空燃料市場企業シェア/ランキング(2023年
図 141 Aemetis, Inc:純収入、2019年~2023年(百万米ドル、AGR)
図 142 Aemetis, Inc:R&D、2019年~2023年(百万米ドル、AGR)
図 143 Aemetis, Inc:セグメント別市場シェア、2023 年
図 144 バラード・パワー・システムズ純収入、2019 年~2023 年(百万米ドル、AGR)
図 145 バラード・パワー・システムズ地域別市場シェア、2023 年
図 146 Ballard Power Systems:セグメント別市場シェア(2023 年
図 147 Eni SPA:純収入、2019~2023 年(百万米ドル、AGR%)
図 148 Eni SPA:R&D, 2019-2023 (百万米ドル, AGR%)
図 149 Eni SPA:地域別市場シェア(2023
図 150 エニ・スパ:セグメント別市場シェア、2023 年
図 151 Gevo Inc:純収入、2019年~2023年(百万米ドル、AGR)
図 152 Gevo Inc:セグメント別市場シェア、2023 年
図 153 Neste Oyj: 純収入, 2019-2023 (百万米ドル, AGR%)
図 154 Neste Oyj:地域別市場シェア(2023年
図 155 Neste Oyj:セグメント別市場シェア(2023 年
図 156 OMV Aktiengesellschaft:純収入、2019年~2023年(百万米ドル、AGR)
図157 OMVアクティエンゲゼルシャフト:地域別市場シェア(2023年
図158 OMVアクティエンゲゼルシャフト:セグメント別市場シェア(2023年
図 159 TotalEnergies SE:純収入、2019年~2023年(百万米ドル、AGR)
図 160 トータルエナジーズ SE:地域別市場シェア(2023 年
図 161 トータルエナジー SE:セグメント別市場シェア(2023 年
ページTOPに戻る
Summary
Report Details
The Sustainable Aviation Fuel Market Report 2024-2034: This report will prove invaluable to leading firms striving for new revenue pockets if they wish to better understand the industry and its underlying dynamics. It will be useful for companies that would like to expand into different industries or to expand their existing operations in a new region.
Government Initiatives Are Pushing the Adoption of Sustainable Aviation Fuel (SAF)
Stringent environmental regulations and policies worldwide are driving the sustainable aviation fuel (SAF) market’s growth. Governments are enacting measures like blending mandates and incentives to boost SAF adoption, with some countries emphasizing hydrogen solutions. Initiatives like the US Inflation Reduction Act and the UK’s Jet Zero strategy are driving the hydrogen economy, with the aviation industry focusing on hydrogen-powered electricity by 2023. Also, carbon pricing mechanisms and emissions trading schemes incentivize investment in SAF production and use. As governments continue to tighten environmental regulations and set ambitious emissions reduction targets, the demand for SAF is expected to expand, creating favourable market conditions for industry players.
Challenges Associated with Sustainable Aviation Fuel (SAF) Industry
A key challenge impeding the Sustainable Aviation Fuel (SAF) market growth is the limited availability and high cost of sustainable feedstocks. For example, according to the International Council on Clean Transportation (ICCT), the production cost of Sustainable Aviation Fuel varies significantly, ranging from €0.88 per litter or US$1.0 per litter (for lipid-based feedstock using the hydro processed esters and fatty acids (HEFA) process) to €3.44 per litter or US$3.9 per litter (via hydro processing of fermented sugars). This cost range is about 2 to 8 times higher than the price of conventional jet fuel.
Also, the UK-based trade group Energy Industries Council (EIC) report from March 2024, underscores the primary obstacles hindering the global expansion of sustainable aviation fuel (SAF) production: high costs and limited feedstock availability. Despite SAF’s significant environmental advantages, such as an up to 80% reduction in lifecycle carbon emissions compared to traditional jet fuel, its current market share remains below 1%. To achieve the aviation industry’s goal of net-zero carbon dioxide emissions by 2050, addressing challenges like access to feedstocks, attracting investment, and implementing supportive government policies for SAF production and adoption is imperative.
What Questions Should You Ask before Buying a Market Research Report?
-
How is the sustainable aviation fuel market evolving?
-
What is driving and restraining the sustainable aviation fuel market?
-
How will each sustainable aviation fuel submarket segment grow over the forecast period and how much revenue will these submarkets account for in 2034?
-
How will the market shares for each sustainable aviation fuel submarket develop from 2024 to 2034?
-
What will be the main driver for the overall market from 2024 to 2034?
-
Will leading sustainable aviation fuel markets broadly follow the macroeconomic dynamics, or will individual national markets outperform others?
-
How will the market shares of the national markets change by 2034 and which geographical region will lead the market in 2034?
-
Who are the leading players and what are their prospects over the forecast period?
-
What are the sustainable aviation fuel projects for these leading companies?
-
How will the industry evolve during the period between 2024 and 2034? What are the implications of sustainable aviation fuel projects taking place now and over the next 10 years?
-
Is there a greater need for product commercialisation to further scale the sustainable aviation fuel market?
-
Where is the sustainable aviation fuel market heading and how can you ensure you are at the forefront of the market?
-
What are the best investment options for new product and service lines?
-
What are the key prospects for moving companies into a new growth path and C-suite?
You need to discover how this will impact the sustainable aviation fuel market today, and over the next 10 years:
-
Our 286-page report provides 112 tables and 161 charts/graphs exclusively to you.
-
The report highlights key lucrative areas in the industry so you can target them – NOW.
-
It contains in-depth analysis of global, regional and national sales and growth.
-
It highlights for you the key successful trends, changes and revenue projections made by your competitors.
This report tells you TODAY how the sustainable aviation fuel market will develop in the next 10 years, and in line with the variations in COVID-19 economic recession and bounce. This market is more critical now than at any point over the last 10 years.
Forecasts to 2034 and other analyses reveal commercial prospects
-
In addition to revenue forecasting to 2034, our new study provides you with recent results, growth rates, and market shares.
-
You will find original analyses, with business outlooks and developments.
-
Discover qualitative analyses (including market dynamics, drivers, opportunities, restraints and challenges), cost structure, impact of rising sustainable aviation fuel prices and recent developments.
This report includes data analysis and invaluable insight into how COVID-19 will affect the industry and your company. Four COVID-19 recovery patterns and their impact, namely, “V”, “L”, “W” and “U” are discussed in this report.
Segments Covered in the Report
Fuel Type
-
Hydrogen Fuel Cell
-
Biofuel
-
Power to Liquid
-
Gas to Liquid
Blending Capacity
-
Below 30%
-
30% to 50%
-
Above 50%
Biofuel Manufacturing Technology
-
HFS-SIP
-
ATJ-SPK
-
FT-SPK
-
HEFA-SPK
Platform
-
Commercial Aviation
-
Military Aviation
-
Business & General Aviation
-
Unmanned Aerial Vehicle
In addition to the revenue predictions for the overall world market and segments, you will also find revenue forecasts for five regional and 16 leading national markets:
North America
Europe
-
Germany
-
France
-
UK
-
Italy
-
Russia
-
Rest of Europe
Asia Pacific
-
Japan
-
China
-
India
-
Australia
-
South Korea
-
Rest of Asia Pacific
Latin America
-
Brazil
-
Mexico
-
Rest of Latin America
MEA
-
GCC
-
South Africa
-
Rest of MEA
The report also includes profiles and for some of the leading companies in the Sustainable Aviation Fuel Market, 2024 to 2034, with a focus on this segment of these companies’ operations.
Leading companies profiled in the report
-
Aemetis, Inc.
-
Avfuel Corporation
-
Ballard Power Systems
-
Eni SPA
-
Fulcrum BioEnergy, Inc.
-
Gevo Inc.
-
LanzaTech
-
Neste Oyj
-
Northwest Advanced Biofuels, LLC.
-
OMV Aktiengesellschaft
-
Red Rock Biofuels
-
SKYNRG
-
TotalEnergies SE
-
Velocys
Overall world revenue for Sustainable Aviation Fuel Market, 2024 to 2034 in terms of value the market will surpass US$1,465.6 million in 2024, our work calculates. We predict strong revenue growth through to 2034. Our work identifies which organizations hold the greatest potential. Discover their capabilities, progress, and commercial prospects, helping you stay ahead.
How will the Sustainable Aviation Fuel Market, 2024 to 2034 report help you?
In summary, our 280+ page report provides you with the following knowledge:
-
Revenue forecasts to 2034 for Sustainable Aviation Fuel Market, 2024 to 2034 Market, with forecasts for fuel type, blending capacity, biofuel manufacturing technology, and platform, each forecast at a global and regional level – discover the industry’s prospects, finding the most lucrative places for investments and revenues.
-
Revenue forecasts to 2034 for five regional and 16 key national markets – See forecasts for the Sustainable Aviation Fuel Market, 2024 to 2034 market in North America, Europe, Asia-Pacific, Latin America, and MEA. Also forecasted is the market in the US, Canada, Mexico, Brazil, Germany, France, Russia, Italy, China, India, Japan, and Australia among other prominent economies.
-
Prospects for established firms and those seeking to enter the market – including company profiles for 14 of the major companies involved in the Sustainable Aviation Fuel Market, 2024 to 2034.
Find quantitative and qualitative analyses with independent predictions. Receive information that only our report contains, staying informed with invaluable business intelligence.
Information found nowhere else
With our new report, you are less likely to fall behind in knowledge or miss out on opportunities. See how our work could benefit your research, analyses, and decisions. Visiongain’s study is for everybody needing commercial analyses for the Sustainable Aviation Fuel Market, 2024 to 2034, market-leading companies. You will find data, trends and predictions.
ページTOPに戻る
Table of Contents
1 Report Overview
1.1 Objectives of the Study
1.2 Introduction to Sustainable Aviation Fuel Market
1.3 What This Report Delivers
1.4 Why You Should Read This Report
1.5 Key Questions Answered by This Analytical Report
1.6 Who is This Report for?
1.7 Methodology
1.7.1 Market Definitions
1.7.2 Market Evaluation & Forecasting Methodology
1.7.3 Data Validation
1.7.3.1 Primary Research
1.7.3.2 Secondary Research
1.8 Frequently Asked Questions (FAQs)
1.9 Associated Visiongain Reports
1.10 About Visiongain
2 Executive Summary
3 Market Overview
3.1 Key Findings
3.2 Market Dynamics
3.2.1 Market Driving Factors
3.2.1.1 Government Initiatives Driving Sustainable Aviation Fuel Adoption
3.2.1.2 Technological Advancements and Innovation in SAF Processes
3.2.1.3 Driving Forces Behind Aviation's Shift to Sustainable Aviation Fuel (SAF) for Environmental Sustainability and Decarbonization Initiatives
3.2.2 Market Restraining Factors
3.2.2.1 Limited Sustainable Feedstock Availability and High Costs Hinder Sustainable Aviation Fuel (SAF) Market Expansion
3.2.2.2 Infrastructure and Distribution Challenges for SAF Production
3.2.3 Market Opportunities
3.2.3.1 Increasing Investment Opportunities for Sustainable Aviation Fuel (SAF)
3.2.3.2 Market Expansion and Collaboration on Sustainable Aviation Fuel (SAF) Supply
3.3 COVID-19 Impact Analysis
3.4 Porter’s Five Forces Analysis
3.4.1 Bargaining Power of Suppliers: Moderate to Moderate
3.4.2 Bargaining Power of Buyers: High to High
3.4.3 Competitive Rivalry: High to High
3.4.4 Threat from Substitutes: Low to Moderate
3.4.5 Threat of New Entrants: Low to Low
3.5 PEST Analysis
3.6 SWOT Analysis
4 Sustainable Aviation Fuel Market Analysis by Fuel Type
4.1 Key Findings
4.2 Fuel Type Segment: Market Attractiveness Index
4.3 Sustainable Aviation Fuel Market Size Estimation and Forecast by Fuel Type
4.4 Hydrogen Fuel Cell
4.4.1 Market Size by Region, 2024-2034 (US$ Million)
4.4.2 Market Share by Region, 2024 & 2034 (%)
4.5 Biofuel
4.5.1 Market Size by Region, 2024-2034 (US$ Million)
4.5.2 Market Share by Region, 2024 & 2034 (%)
4.6 Power to Liquid
4.6.1 Market Size by Region, 2024-2034 (US$ Million)
4.6.2 Market Share by Region, 2024 & 2034 (%)
4.7 Gas to Liquid
4.7.1 Market Size by Region, 2024-2034 (US$ Million)
4.7.2 Market Share by Region, 2024 & 2034 (%)
5 Sustainable Aviation Fuel Market Analysis by Blending Capacity
5.1 Key Findings
5.2 Blending Capacity Segment: Market Attractiveness Index
5.3 Sustainable Aviation Fuel Market Size Estimation and Forecast by Blending Capacity
5.4 Below 30%
5.4.1 Market Size by Region, 2024-2034 (US$ Million)
5.4.2 Market Share by Region, 2024 & 2034 (%)
5.5 30% to 50%
5.5.1 Market Size by Region, 2024-2034 (US$ Million)
5.5.2 Market Share by Region, 2024 & 2034 (%)
5.6 Above 50%
5.6.1 Market Size by Region, 2024-2034 (US$ Million)
5.6.2 Market Share by Region, 2024 & 2034 (%)
6 Sustainable Aviation Fuel Market Analysis by Biofuel Manufacturing Technology
6.1 Key Findings
6.2 Biofuel Manufacturing Technology Segment: Market Attractiveness Index
6.3 Sustainable Aviation Fuel Market Size Estimation and Forecast by Biofuel Manufacturing Technology
6.4 HFS-SIP
6.4.1 Market Size by Region, 2024-2034 (US$ Million)
6.4.2 Market Share by Region, 2024 & 2034 (%)
6.5 ATJ-SPK
6.5.1 Market Size by Region, 2024-2034 (US$ Million)
6.5.2 Market Share by Region, 2024 & 2034 (%)
6.6 FT-SPK
6.6.1 Market Size by Region, 2024-2034 (US$ Million)
6.6.2 Market Share by Region, 2024 & 2034 (%)
6.7 HEFA-SPK
6.7.1 Market Size by Region, 2024-2034 (US$ Million)
6.7.2 Market Share by Region, 2024 & 2034 (%)
7 Sustainable Aviation Fuel Market Analysis by Platform
7.1 Key Findings
7.2 Platform Segment: Market Attractiveness Index
7.3 Sustainable Aviation Fuel Market Size Estimation and Forecast by Platform
7.4 Commercial Aviation
7.4.1 Market Share by Region, 2024 & 2034 (%)
7.5 Military Aviation
7.5.1 Market Size by Region, 2024-2034 (US$ Million)
7.5.2 Market Share by Region, 2024 & 2034 (%)
7.6 Business & General Aviation
7.6.1 Market Size by Region, 2024-2034 (US$ Million)
7.6.2 Market Share by Region, 2024 & 2034 (%)
7.7 Unmanned Aerial Vehicle
7.7.1 Market Size by Region, 2024-2034 (US$ Million)
7.7.2 Market Share by Region, 2024 & 2034 (%)
8 Sustainable Aviation Fuel Market Analysis by Region
8.1 Key Findings
8.2 Regional Market Size Estimation and Forecast
9 North America Sustainable Aviation Fuel Market Analysis
9.1 Key Findings
9.2 North America Sustainable Aviation Fuel Market Attractiveness Index
9.3 North America Sustainable Aviation Fuel Market by Country, 2024, 2029 & 2034 (US$ Million)
9.4 North America Sustainable Aviation Fuel Market Size Estimation and Forecast by Country
9.5 North America Sustainable Aviation Fuel Market Size Estimation and Forecast by Fuel Type
9.6 North America Sustainable Aviation Fuel Market Size Estimation and Forecast by Blending Capacity
9.7 North America Sustainable Aviation Fuel Market Size Estimation and Forecast by Biofuel Manufacturing Technology
9.8 North America Sustainable Aviation Fuel Market Size Estimation and Forecast by Platform
9.9 U.S. Sustainable Aviation Fuel Market Analysis
9.10 Canada Sustainable Aviation Fuel Market Analysis
10 Europe Sustainable Aviation Fuel Market Analysis
10.1 Key Findings
10.2 Europe Sustainable Aviation Fuel Market Attractiveness Index
10.3 Europe Sustainable Aviation Fuel Market by Country, 2024, 2029 & 2034 (US$ Million)
10.4 Europe Sustainable Aviation Fuel Market Size Estimation and Forecast by Country
10.5 Europe Sustainable Aviation Fuel Market Size Estimation and Forecast by Fuel Type
10.6 Europe Sustainable Aviation Fuel Market Size Estimation and Forecast by Blending Capacity
10.7 Europe Sustainable Aviation Fuel Market Size Estimation and Forecast by Biofuel Manufacturing Technology
10.8 Europe Sustainable Aviation Fuel Market Size Estimation and Forecast by Platform
10.9 Germany Sustainable Aviation Fuel Market Analysis
10.10 France Sustainable Aviation Fuel Market Analysis
10.11 UK Sustainable Aviation Fuel Market Analysis
10.12 Italy Sustainable Aviation Fuel Market Analysis
10.13 Russia Sustainable Aviation Fuel Market Analysis
10.14 Rest of Europe Sustainable Aviation Fuel Market Analysis
11 Asia Pacific Sustainable Aviation Fuel Market Analysis
11.1 Key Findings
11.2 Asia Pacific Sustainable Aviation Fuel Market Attractiveness Index
11.3 Asia Pacific Sustainable Aviation Fuel Market by Country, 2024, 2029 & 2034 (US$ Million)
11.4 Asia Pacific Sustainable Aviation Fuel Market Size Estimation and Forecast by Country
11.5 Asia Pacific Sustainable Aviation Fuel Market Size Estimation and Forecast by Fuel Type
11.6 Asia Pacific Sustainable Aviation Fuel Market Size Estimation and Forecast by Blending Capacity
11.7 Asia Pacific Sustainable Aviation Fuel Market Size Estimation and Forecast by Biofuel Manufacturing Technology
11.8 Asia Pacific Sustainable Aviation Fuel Market Size Estimation and Forecast by Platform
11.9 Japan Sustainable Aviation Fuel Market Analysis
11.10 China Sustainable Aviation Fuel Market Analysis
11.11 India Sustainable Aviation Fuel Market Analysis
11.12 Australia Sustainable Aviation Fuel Market Analysis
11.13 South Korea Sustainable Aviation Fuel Market Analysis
11.14 Rest of Asia Pacific Sustainable Aviation Fuel Market Analysis
12 Latin America Sustainable Aviation Fuel Market Analysis
12.1 Key Findings
12.2 Latin America Sustainable Aviation Fuel Market Attractiveness Index
12.3 Latin America Sustainable Aviation Fuel Market by Country, 2024, 2029 & 2034 (US$ Million)
12.4 Latin America Sustainable Aviation Fuel Market Size Estimation and Forecast by Country
12.5 Latin America Sustainable Aviation Fuel Market Size Estimation and Forecast by Fuel Type
12.6 Latin America Sustainable Aviation Fuel Market Size Estimation and Forecast by Blending Capacity
12.7 Latin America Sustainable Aviation Fuel Market Size Estimation and Forecast by Biofuel Manufacturing Technology
12.8 Latin America Sustainable Aviation Fuel Market Size Estimation and Forecast by Platform
12.9 Brazil Sustainable Aviation Fuel Market Analysis
12.10 Mexico Sustainable Aviation Fuel Market Analysis
12.11 Rest of Latin America Sustainable Aviation Fuel Market Analysis
13 MEA Sustainable Aviation Fuel Market Analysis
13.1 Key Findings
13.2 MEA Sustainable Aviation Fuel Market Attractiveness Index
13.3 MEA Sustainable Aviation Fuel Market by Country, 2024, 2029 & 2034 (US$ Million)
13.4 MEA Sustainable Aviation Fuel Market Size Estimation and Forecast by Country
13.5 MEA Sustainable Aviation Fuel Market Size Estimation and Forecast by Fuel Type
13.6 MEA Sustainable Aviation Fuel Market Size Estimation and Forecast by Blending Capacity
13.7 MEA Sustainable Aviation Fuel Market Size Estimation and Forecast by Biofuel Manufacturing Technology
13.8 MEA Sustainable Aviation Fuel Market Size Estimation and Forecast by Platform
13.9 GCC Sustainable Aviation Fuel Market Analysis
13.10 South Africa Sustainable Aviation Fuel Market Analysis
13.11 Rest of MEA Sustainable Aviation Fuel Market Analysis
14 Company Profiles
14.1 Competitive Landscape, 2023
14.2 Strategic Outlook
14.3 Aemetis, Inc.
14.3.1 Company Snapshot
14.3.2 Company Overview
14.3.3 Financial Analysis
14.3.3.1 Net Revenue, 2019-2023
14.3.3.2 R&D, 2019-2023
14.3.3.3 Segment Market Shares, 2023
14.3.4 Product Benchmarking
14.3.5 Strategic Outlook
14.4 Avfuel Corporation
14.4.1 Company Snapshot
14.4.2 Company Overview
14.4.3 Product Benchmarking
14.4.4 Strategic Outlook
14.5 Ballard Power Systems
14.5.1 Company Snapshot
14.5.2 Company Overview
14.5.3 Financial Analysis
14.5.3.1 Net Revenue, 2019-2023
14.5.3.2 Regional Market Shares, 2023
14.5.3.3 Segment Market Shares, 2023
14.5.4 Product Benchmarking
14.5.5 Strategic Outlook
14.6 Eni SPA
14.6.1 Company Snapshot
14.6.2 Company Overview
14.6.3 Financial Analysis
14.6.3.1 Net Revenue, 2019-2023
14.6.3.2 R&D, 2019-2023
14.6.3.3 Regional Market Shares, 2023
14.6.3.4 Segment Market Shares, 2023
14.6.4 Product Benchmarking
14.6.5 Strategic Outlook
14.7 Fulcrum BioEnergy, Inc.
14.7.1 Company Snapshot
14.7.2 Company Overview
14.7.3 Product Benchmarking
14.7.4 Strategic Outlook
14.8 Gevo Inc.
14.8.1 Company Snapshot
14.8.2 Company Overview
14.8.3 Financial Analysis
14.8.3.1 Net Revenue, 2019-2023
14.8.3.2 Segment Market Shares, 2023
14.8.4 Product Benchmarking
14.8.5 Strategic Outlook
14.9 LanzaTech
14.9.1 Company Snapshot
14.9.2 Company Overview
14.9.3 Product Benchmarking
14.9.4 Strategic Outlook
14.10 Neste Oyj
14.10.1 Company Snapshot
14.10.2 Company Overview
14.10.3 Financial Analysis
14.10.3.1 Net Revenue, 2019-2023
14.10.3.2 Regional Market Shares, 2023
14.10.3.3 Segment Market Shares, 2023
14.10.4 Product Benchmarking
14.10.5 Strategic Outlook
14.11 Northwest Advanced Biofuels, LLC.
14.11.1 Company Snapshot
14.11.2 Company Overview
14.11.3 Product Benchmarking
14.11.4 Strategic Outlook
14.12 OMV Aktiengesellschaft
14.12.1 Company Snapshot
14.12.2 Company Overview
14.12.3 Financial Analysis
14.12.3.1 Net Revenue, 2019-2023
14.12.3.2 Regional Market Shares, 2023
14.12.3.3 Segment Market Shares, 2023
14.12.4 Product Benchmarking
14.12.5 Strategic Outlook
14.13 Red Rock Biofuels
14.13.1 Company Snapshot
14.13.2 Company Overview
14.13.3 Product Benchmarking
14.13.4 Strategic Outlook
14.14 SKYNRG
14.14.1 Company Snapshot
14.14.2 Company Overview
14.14.3 Product Benchmarking
14.14.4 Strategic Outlook
14.15 TotalEnergies SE
14.15.1 Company Snapshot
14.15.2 Company Overview
14.15.3 Financial Analysis
14.15.3.1 Net Revenue, 2019-2023
14.15.3.2 Regional Market Shares, 2023
14.15.3.3 Segment Market Shares, 2023
14.15.4 Product Benchmarking
14.15.5 Strategic Outlook
14.16 Velocys
14.16.1 Company Snapshot
14.16.2 Company Overview
14.16.3 Product Benchmarking
14.16.4 Strategic Outlook
15 Conclusion and Recommendations
15.1 Concluding Remarks from Visiongain
15.2 Recommendations for Market Players
ページTOPに戻る
List of Tables/Graphs
List of Tables
Table 1 Sustainable Aviation Fuel Market Snapshot, 2024 & 2034 (US$ Million, CAGR %)
Table 1. Sustainable Aviation Fuel Market Forecast by Region, 2024-2034 (US$ Million, AGR%, CAGR%): “V” Shaped Recovery
Table 2. Sustainable Aviation Fuel Market Forecast by Region, 2024-2034 (US$ Million, AGR%, CAGR%): “U” Shaped Recovery
Table 3. Sustainable Aviation Fuel Market Forecast by Region, 2024-2034 (US$ Million, AGR%, CAGR%): “W” Shaped Recovery
Table 4. Sustainable Aviation Fuel Market Forecast by Region, 2024-2034 (US$ Million, AGR%, CAGR%): “L” Shaped Recovery
Table 5. Sustainable Aviation Fuel Market Forecast by Fuel Type, 2024-2034 (US$ Million, AGR%, CAGR%)
Table 6. Hydrogen Fuel Cell Market Forecast by Region, 2024-2034 (US$ Million, AGR%, CAGR%)
Table 7. Biofuel Segment Market Forecast by Region, 2024-2034 (US$ Million, AGR%, CAGR%)
Table 8. Power to Liquid Segment Market Forecast by Region, 2024-2034 (US$ Million, AGR%, CAGR%)
Table 9. Gas to Liquid Segment Market Forecast by Region, 2024-2034 (US$ Million, AGR%, CAGR%)
Table 10. Sustainable Aviation Fuel Market Forecast by Blending Capacity, 2024-2034 (US$ Million, AGR%, CAGR%)
Table 11. Below 30% Segment Market Forecast by Region, 2024-2034 (US$ Million, AGR%, CAGR%)
Table 12. 30% to 50% Segment Market Forecast by Region, 2024-2034 (US$ Million, AGR%, CAGR%)
Table 13. Above 50% Segment Market Forecast by Region, 2024-2034 (US$ Million, AGR%, CAGR%)
Table 14. Sustainable Aviation Fuel Market Forecast by Biofuel Manufacturing Technology, 2024-2034 (US$ Million, AGR%, CAGR%)
Table 15. HFS-SIP Segment Market Forecast by Region, 2024-2034 (US$ Million, AGR%, CAGR%)
Table 16. ATJ-SPK Segment Market Forecast by Region, 2024-2034 (US$ Million, AGR%, CAGR%)
Table 17. FT-SPK Segment Market Forecast by Region, 2024-2034 (US$ Million, AGR%, CAGR%)
Table 18. HEFA-SPK Segment Market Forecast by Region, 2024-2034 (US$ Million, AGR%, CAGR%)
Table 19. Sustainable Aviation Fuel Market Forecast by Platform, 2024-2034 (US$ Million, AGR%, CAGR%)
Table 20. Commercial Aviation Segment Market Forecast by Region, 2024-2034 (US$ Million, AGR%, CAGR%)
Table 21. Military Aviation Segment Market Forecast by Region, 2024-2034 (US$ Million, AGR%, CAGR%)
Table 22. Business & General Aviation Segment Market Forecast by Region, 2024-2034 (US$ Million, AGR%, CAGR%)
Table 23. Unmanned Aerial Vehicle Segment Market Forecast by Region, 2024-2034 (US$ Million, AGR%, CAGR%)
Table 24. Sustainable Aviation Fuel Market Forecast by Region, 2024-2034 (US$ Million, AGR%, CAGR%)
Table 25. North America Sustainable Aviation Fuel Market Forecast by Country, 2024-2034 (US$ Million, AGR%, CAGR%)
Table 26. North America Sustainable Aviation Fuel Market Forecast by Fuel Type, 2024-2034 (US$ Million, AGR%, CAGR%)
Table 27. North America Sustainable Aviation Fuel Market Forecast by Blending Capacity, 2024-2034 (US$ Million, AGR%, CAGR%)
Table 28. North America Sustainable Aviation Fuel Market Forecast by Biofuel Manufacturing Technology, 2024-2034 (US$ Million, AGR%, CAGR%)
Table 29. North America Sustainable Aviation Fuel Market Forecast by Platform, 2024-2034 (US$ Million, AGR%, CAGR%)
Table 30. U.S. Sustainable Aviation Fuel Market Forecast, 2024-2034 (US$ Million, AGR%, CAGR%)
Table 31. Canada Sustainable Aviation Fuel Market Forecast, 2024-2034 (US$ Million, AGR%, CAGR%)
Table 32. Europe Sustainable Aviation Fuel Market Forecast by Country, 2024-2034 (US$ Million, AGR%, CAGR%)
Table 33. Europe Sustainable Aviation Fuel Market Forecast by Fuel Type, 2024-2034 (US$ Million, AGR%, CAGR%)
Table 34. Europe Sustainable Aviation Fuel Market Forecast by Blending Capacity, 2024-2034 (US$ Million, AGR%, CAGR%)
Table 35. Europe Sustainable Aviation Fuel Market Forecast by Biofuel Manufacturing Technology, 2024-2034 (US$ Million, AGR%, CAGR%)
Table 36. Europe Sustainable Aviation Fuel Market Forecast by Platform, 2024-2034 (US$ Million, AGR%, CAGR%)
Table 37. Germany Sustainable Aviation Fuel Market Forecast, 2024-2034 (US$ Million, AGR%, CAGR%)
Table 38. France Sustainable Aviation Fuel Market Forecast, 2024-2034 (US$ Million, AGR%, CAGR%)
Table 39. UK Sustainable Aviation Fuel Market Forecast, 2024-2034 (US$ Million, AGR%, CAGR%)
Table 40. Italy Sustainable Aviation Fuel Market Forecast, 2024-2034 (US$ Million, AGR%, CAGR%)
Table 41. Russia Sustainable Aviation Fuel Market Forecast, 2024-2034 (US$ Million, AGR%, CAGR%)
Table 42. Rest of Europe Sustainable Aviation Fuel Market Forecast, 2024-2034 (US$ Million, AGR%, CAGR%)
Table 43. Asia Pacific Sustainable Aviation Fuel Market Forecast by Country, 2024-2034 (US$ Million, AGR%, CAGR%)
Table 44. Asia Pacific Sustainable Aviation Fuel Market Forecast by Fuel Type, 2024-2034 (US$ Million, AGR%, CAGR%)
Table 45. Asia Pacific Sustainable Aviation Fuel Market Forecast by Blending Capacity, 2024-2034 (US$ Million, AGR%, CAGR%)
Table 46. Asia Pacific Sustainable Aviation Fuel Market Forecast by Biofuel Manufacturing Technology, 2024-2034 (US$ Million, AGR%, CAGR%)
Table 47. Asia Pacific Sustainable Aviation Fuel Market Forecast by Platform, 2024-2034 (US$ Million, AGR%, CAGR%)
Table 48. Japan Sustainable Aviation Fuel Market Forecast, 2024-2034 (US$ Million, AGR%, CAGR%)
Table 49. China Sustainable Aviation Fuel Market Forecast, 2024-2034 (US$ Million, AGR%, CAGR%)
Table 50. India Sustainable Aviation Fuel Market Forecast, 2024-2034 (US$ Million, AGR%, CAGR%)
Table 51. Australia Sustainable Aviation Fuel Market Forecast, 2024-2034 (US$ Million, AGR%, CAGR%)
Table 52. South Korea Sustainable Aviation Fuel Market Forecast, 2024-2034 (US$ Million, AGR%, CAGR%)
Table 53. Rest of Asia Pacific Sustainable Aviation Fuel Market Forecast, 2024-2034 (US$ Million, AGR%, CAGR%)
Table 54. Latin America Sustainable Aviation Fuel Market Forecast by Country, 2024-2034 (US$ Million, AGR%, CAGR%)
Table 55. Latin America Sustainable Aviation Fuel Market Forecast by Fuel Type, 2024-2034 (US$ Million, AGR%, CAGR%)
Table 56. Latin America Sustainable Aviation Fuel Market Forecast by Blending Capacity, 2024-2034 (US$ Million, AGR%, CAGR%)
Table 57. Latin America Sustainable Aviation Fuel Market Forecast by Biofuel Manufacturing Technology, 2024-2034 (US$ Million, AGR%, CAGR%)
Table 58. Latin America Pacific Sustainable Aviation Fuel Market Forecast by Platform, 2024-2034 (US$ Million, AGR%, CAGR%)
Table 59. Brazil Sustainable Aviation Fuel Market Forecast, 2024-2034 (US$ Million, AGR%, CAGR%)
Table 60. Mexico Sustainable Aviation Fuel Market Forecast, 2024-2034 (US$ Million, AGR%, CAGR%)
Table 61. Rest of Latin America Sustainable Aviation Fuel Market Forecast, 2024-2034 (US$ Million, AGR%, CAGR%)
Table 62. MEA Sustainable Aviation Fuel Market Forecast by Country, 2024-2034 (US$ Million, AGR%, CAGR%)
Table 63. MEA Sustainable Aviation Fuel Market Forecast by Fuel Type, 2024-2034 (US$ Million, AGR%, CAGR%)
Table 64. MEA Sustainable Aviation Fuel Market Forecast by Blending Capacity, 2024-2034 (US$ Million, AGR%, CAGR%)
Table 65. MEA Sustainable Aviation Fuel Market Forecast by Biofuel Manufacturing Technology, 2024-2034 (US$ Million, AGR%, CAGR%)
Table 66. MEA Pacific Sustainable Aviation Fuel Market Forecast by Platform, 2024-2034 (US$ Million, AGR%, CAGR%)
Table 67. GCC Sustainable Aviation Fuel Market Forecast, 2024-2034 (US$ Million, AGR%, CAGR%)
Table 68. South Africa Sustainable Aviation Fuel Market Forecast, 2024-2034 (US$ Million, AGR%, CAGR%)
Table 69. Rest of MEA Sustainable Aviation Fuel Market Forecast, 2024-2034 (US$ Million, AGR%, CAGR%)
Table 70. Strategic Outlook
Table 71. Aemetis, Inc.: Key Details, (CEO, HQ, Revenue, Founded, Number of Employees, Company Type, Website, Business Segment)
Table 72. Aemetis, Inc.: Product Benchmarking
Table 73. Aemetis, Inc.: Strategic Outlook
Table 74. Avfuel Corporation: Key Details, (CEO, HQ, Revenue, Founded, No. of Employees, Company Type, Website, Business Segment)
Table 75. Avfuel Corporation: Product Benchmarking
Table 76. Avfuel Corporation: Strategic Outlook
Table 77. Ballard Power Systems: Key Details, (CEO, HQ, Revenue, Founded, Number of Employees, Company Type, Website, Business Segment)
Table 78. Ballard Power Systems: Product Benchmarking
Table 79. Ballard Power Systems: Strategic Outlook
Table 80. Eni SPA: Key Details, (CEO, HQ, Revenue, Founded, Number of Employees, Company Type, Website, Business Segment)
Table 81. Eni SPA: Product Benchmarking
Table 82. Eni SPA: Strategic Outlook
Table 83. Fulcrum BioEnergy, Inc.: Key Details, (CEO, HQ, Revenue, Founded, No. of Employees, Company Type, Website, Business Segment)
Table 84. Fulcrum BioEnergy, Inc.: Product Benchmarking
Table 85. Fulcrum BioEnergy, Inc.: Strategic Outlook
Table 86. Gevo Inc.: Key Details, (CEO, HQ, Revenue, Founded, Number of Employees, Company Type, Website, Business Segment)
Table 87. Gevo Inc.: Product Benchmarking
Table 88. Gevo Inc.: Strategic Outlook
Table 89. LanzaTech: Key Details, (CEO, HQ, Revenue, Founded, Number of Employees, Company Type, Website, Business Segment)
Table 90. LanzaTech: Product Benchmarking
Table 91. LanzaTech: Strategic Outlook
Table 92. Neste Oyj: Key Details, (CEO, HQ, Revenue, Founded, Number of Employees, Company Type, Website, Business Segment)
Table 93. Neste Oyj: Product Benchmarking
Table 94. Neste Oyj: Strategic Outlook
Table 95. Northwest Advanced Biofuels, LLC.: Key Details, (CEO, HQ, Revenue, Founded, No. of Employees, Company Type, Website, Business Segment)
Table 96. Northwest Advanced Biofuels, LLC.: Product Benchmarking
Table 97. Northwest Advanced Biofuels, LLC.: Strategic Outlook
Table 98. OMV Aktiengesellschaft: Key Details, (CEO, HQ, Revenue, Founded, No. of Employees, Company Type, Website, Business Segment)
Table 99. OMV Aktiengesellschaft: Product Benchmarking
Table 100. OMV Aktiengesellschaft: Strategic Outlook
Table 101. Red Rock Biofuels: Key Details, (CEO, HQ, Revenue, Founded, Number of Employees, Company Type, Website, Business Segment)
Table 102. Red Rock Biofuels: Product Benchmarking
Table 103. Red Rock Biofuels: Strategic Outlook
Table 104. SKYNRG: Key Details, (CEO, HQ, Revenue, Founded, Number of Employees, Company Type, Website, Business Segment)
Table 105. SKYNRG: Product Benchmarking
Table 106. SKYNRG: Strategic Outlook
Table 107. TotalEnergies SE: Key Details, (CEO, HQ, Revenue, Founded, Number of Employees, Company Type, Website, Business Segment)
Table 108. TotalEnergies SE: Product Benchmarking
Table 109. TotalEnergies SE: Strategic Outlook
Table 110. Velocys: Key Details, (CEO, HQ, Revenue, Founded, Number of Employees, Company Type, Website, Business Segment)
Table 111. Velocys: Product Benchmarking
Table 112. Velocys: Strategic Outlook
List of Figures
Figure 1 Sustainable Aviation Fuel Market Segmentation
Figure 2 Sustainable Aviation Fuel Market by Fuel Type: Market Attractiveness Index
Figure 3 Sustainable Aviation Fuel Market by Blending Capacity: Market Attractiveness Index
Figure 4 Sustainable Aviation Fuel Market by Biofuel Manufacturing Technology: Market Attractiveness Index
Figure 5 Sustainable Aviation Fuel Market by Platform: Market Attractiveness Index
Figure 6 Sustainable Aviation Fuel Market Attractiveness Index by Region
Figure 7 Sustainable Aviation Fuel Market: Market Dynamics
Figure 8 Sustainable Aviation Fuel Market by Region, 2024-2034 (US$ Million, AGR %): “V” Shaped Recovery
Figure 9 Sustainable Aviation Fuel Market by Region, 2024-2034 (US$ Million, AGR %): “U” Shaped Recovery
Figure 10 Sustainable Aviation Fuel Market by Region, 2024-2034 (US$ Million, AGR %): “W” Shaped Recovery
Figure 11 Sustainable Aviation Fuel Market by Region, 2024-2034 (US$ Million, AGR %): “L” Shaped Recovery
Figure 12 Sustainable Aviation Fuel Market: Porter’s Five Forces Analysis
Figure 13 Sustainable Aviation Fuel Market: PEST Analysis
Figure 14 Sustainable Aviation Fuel Market: SWOT Analysis
Figure 15 Sustainable Aviation Fuel Market by Fuel Type: Market Attractiveness Index
Figure 16 Sustainable Aviation Fuel Market Forecast by Fuel Type, 2024-2034 (US$ Million, AGR %)
Figure 17 Sustainable Aviation Fuel Market Share Forecast by Fuel Type, 2024, 2029, 2034 (%)
Figure 18 Hydrogen Fuel Cell Segment Market Forecast by Region, 2024-2034 (US$ Million, AGR %)
Figure 19 Hydrogen Fuel Cell Segment Market Share Forecast by Region, 2024 & 2034 (%)
Figure 20 Biofuel Segment Market Forecast by Region, 2024-2034 (US$ Million, AGR %)
Figure 21 Biofuel Segment Market Share Forecast by Region, 2024 & 2034 (%)
Figure 22 Power to Liquid Segment Market Forecast by Region, 2024-2034 (US$ Million, AGR %)
Figure 23 Power to Liquid Segment Market Share Forecast by Region, 2024 & 2034 (%)
Figure 24 Gas to Liquid Segment Market Forecast by Region, 2024-2034 (US$ Million, AGR %)
Figure 25 Gas to Liquid Segment Market Share Forecast by Region, 2024 & 2034 (%)
Figure 26 Sustainable Aviation Fuel Market by Blending Capacity: Market Attractiveness Index
Figure 27 Sustainable Aviation Fuel Market Forecast by Blending Capacity, 2024-2034 (US$ Million, AGR %)
Figure 28 Sustainable Aviation Fuel Market Share Forecast by Blending Capacity, 2024, 2029, 2034 (%)
Figure 29 Below 30% Segment Market Forecast by Region, 2024-2034 (US$ Million, AGR %)
Figure 30 OEM Segment Market Share Forecast by Region, 2024 & 2034 (%)
Figure 31 30% to 50% Segment Market Forecast by Region, 2024-2034 (US$ Million, AGR %)
Figure 32 30% to 50% Segment Market Share Forecast by Region, 2024 & 2034 (%)
Figure 33 Above 50% Segment Market Forecast by Region, 2024-2034 (US$ Million, AGR %)
Figure 34 Above 50% Segment Market Share Forecast by Region, 2024 & 2034 (%)
Figure 35 Sustainable Aviation Fuel Market by Biofuel Manufacturing Technology: Market Attractiveness Index
Figure 36 Sustainable Aviation Fuel Market Forecast by Biofuel Manufacturing Technology, 2024-2034 (US$ Million, AGR %)
Figure 37 Sustainable Aviation Fuel Market Share Forecast by Biofuel Manufacturing Technology, 2024, 2029, 2034 (%)
Figure 38 HFS-SIP Segment Market Forecast by Region, 2024-2034 (US$ Million, AGR %)
Figure 39 HFS-SIP Segment Market Share Forecast by Region, 2024 & 2034 (%)
Figure 40 ATJ-SPK Segment Market Forecast by Region, 2024-2034 (US$ Million, AGR %)
Figure 41 ATJ-SPK Segment Market Share Forecast by Region, 2024 & 2034 (%)
Figure 42 FT-SPK Segment Market Forecast by Region, 2024-2034 (US$ Million, AGR %)
Figure 43 FT-SPK Segment Market Share Forecast by Region, 2024 & 2034 (%)
Figure 44 HEFA-SPK Segment Market Forecast by Region, 2024-2034 (US$ Million, AGR %)
Figure 45 HEFA-SPK Segment Market Share Forecast by Region, 2024 & 2034 (%)
Figure 46 Sustainable Aviation Fuel Market by Platform: Market Attractiveness Index
Figure 47 Sustainable Aviation Fuel Market Forecast by Platform, 2024-2034 (US$ Million, AGR %)
Figure 48 Sustainable Aviation Fuel Market Share Forecast by Platform, 2024, 2029, 2034 (%)
Figure 49 Commercial Aviation Segment Market Forecast by Region, 2024-2034 (US$ Million, AGR %)
Figure 50 HFS-SIP Segment Market Share Forecast by Region, 2024 & 2034 (%)
Figure 51 Military Aviation Segment Market Forecast by Region, 2024-2034 (US$ Million, AGR %)
Figure 52 Military Aviation Segment Market Share Forecast by Region, 2024 & 2034 (%)
Figure 53 Business & General Aviation Segment Market Forecast by Region, 2024-2034 (US$ Million, AGR %)
Figure 54 Business & General Aviation Segment Market Share Forecast by Region, 2024 & 2034 (%)
Figure 55 Unmanned Aerial Vehicle Segment Market Forecast by Region, 2024-2034 (US$ Million, AGR %)
Figure 56 Unmanned Aerial Vehicle Segment Market Share Forecast by Region, 2024 & 2034 (%)
Figure 57 Sustainable Aviation Fuel Market Forecast by Region 2024 and 2034 (Revenue, CAGR%)
Figure 58 Sustainable Aviation Fuel Market Share Forecast by Region 2024, 2029, 2034 (%)
Figure 59 Sustainable Aviation Fuel Market by Region, 2024-2034 (US$ Million, AGR %)
Figure 60 North America Sustainable Aviation Fuel Market Attractiveness Index
Figure 61 North America Sustainable Aviation Fuel Market by Region, 2024, 2029 & 2034 (US$ Million)
Figure 62 North America Sustainable Aviation Fuel Market Forecast by Country, 2024-2034 (US$ Million, AGR %)
Figure 63 North America Sustainable Aviation Fuel Market Share Forecast by Country, 2024 & 2034 (%)
Figure 64 North America Sustainable Aviation Fuel Market Forecast by Fuel Type, 2024-2034 (US$ Million, AGR %)
Figure 65 North America Sustainable Aviation Fuel Market Share Forecast by Fuel Type, 2024 & 2034 (%)
Figure 66 North America Sustainable Aviation Fuel Market Forecast by Blending Capacity, 2024-2034 (US$ Million, AGR %)
Figure 67 North America Sustainable Aviation Fuel Market Share Forecast by Blending Capacity, 2024 & 2034 (%)
Figure 68 North America Sustainable Aviation Fuel Market Forecast by Biofuel Manufacturing Technology, 2024-2034 (US$ Million, AGR %)
Figure 69 North America Sustainable Aviation Fuel Market Share Forecast by Biofuel Manufacturing Technology, 2024 & 2034 (%)
Figure 70 North America Sustainable Aviation Fuel Market Forecast by Platform, 2024-2034 (US$ Million, AGR %)
Figure 71 North America Sustainable Aviation Fuel Market Share Forecast by Biofuel Manufacturing Technology, 2024 & 2034 (%)
Figure 72 U.S. Sustainable Aviation Fuel Market Forecast, 2024-2034 (US$ Million, AGR %)
Figure 73 Canada Sustainable Aviation Fuel Market Forecast, 2024-2034 (US$ Million, AGR %)
Figure 74 Europe Sustainable Aviation Fuel Market Attractiveness Index
Figure 75 Europe Sustainable Aviation Fuel Market by Region, 2024, 2029 & 2034 (US$ Million)
Figure 76 Europe Sustainable Aviation Fuel Market Forecast by Country, 2024-2034 (US$ Million, AGR %)
Figure 77 Europe Sustainable Aviation Fuel Market Share Forecast by Country, 2024 & 2034 (%)
Figure 78 Europe Sustainable Aviation Fuel Market Forecast by Fuel Type, 2024-2034 (US$ Million, AGR %)
Figure 79 Europe Sustainable Aviation Fuel Market Share Forecast by Fuel Type, 2024 & 2034 (%)
Figure 80 Europe Sustainable Aviation Fuel Market Forecast by Blending Capacity, 2024-2034 (US$ Million, AGR %)
Figure 81 Europe Sustainable Aviation Fuel Market Share Forecast by Blending Capacity, 2024 & 2034 (%)
Figure 82 Europe Sustainable Aviation Fuel Market Forecast by Biofuel Manufacturing Technology, 2024-2034 (US$ Million, AGR %)
Figure 83 Europe Sustainable Aviation Fuel Market Share Forecast by Biofuel Manufacturing Technology, 2024 & 2034 (%)
Figure 84 Europe Sustainable Aviation Fuel Market Forecast by Platform, 2024-2034 (US$ Million, AGR %)
Figure 85 Europe Sustainable Aviation Fuel Market Share Forecast by Biofuel Manufacturing Technology, 2024 & 2034 (%)
Figure 86 Germany Sustainable Aviation Fuel Market Forecast, 2024-2034 (US$ Million, AGR %)
Figure 87 France Sustainable Aviation Fuel Market Forecast, 2024-2034 (US$ Million, AGR %)
Figure 88 UK Sustainable Aviation Fuel Market Forecast, 2024-2034 (US$ Million, AGR %)
Figure 89 Italy Sustainable Aviation Fuel Market Forecast, 2024-2034 (US$ Million, AGR %)
Figure 90 Russia Sustainable Aviation Fuel Market Forecast, 2024-2034 (US$ Million, AGR %)
Figure 91 Rest of Europe Sustainable Aviation Fuel Market Forecast, 2024-2034 (US$ Million, AGR %)
Figure 92 Asia Pacific Sustainable Aviation Fuel Market Attractiveness Index
Figure 93 Asia Pacific Sustainable Aviation Fuel Market by Region, 2024, 2029 & 2034 (US$ Million)
Figure 94 Asia Pacific Sustainable Aviation Fuel Market Forecast by Country, 2024-2034 (US$ Million, AGR %)
Figure 95 Asia Pacific Sustainable Aviation Fuel Market Share Forecast by Country, 2024 & 2034 (%)
Figure 96 Asia Pacific Sustainable Aviation Fuel Market Forecast by Fuel Type, 2024-2034 (US$ Million, AGR %)
Figure 97 Asia Pacific Sustainable Aviation Fuel Market Share Forecast by Fuel Type, 2024 & 2034 (%)
Figure 98 Asia Pacific Sustainable Aviation Fuel Market Forecast by Blending Capacity, 2024-2034 (US$ Million, AGR %)
Figure 99 Asia Pacific Sustainable Aviation Fuel Market Share Forecast by Blending Capacity, 2024 & 2034 (%)
Figure 100 Asia Pacific Sustainable Aviation Fuel Market Forecast by Biofuel Manufacturing Technology, 2024-2034 (US$ Million, AGR %)
Figure 101 Asia Pacific Sustainable Aviation Fuel Market Share Forecast by Biofuel Manufacturing Technology, 2024 & 2034 (%)
Figure 102 Asia Pacific Sustainable Aviation Fuel Market Forecast by Platform, 2024-2034 (US$ Million, AGR %)
Figure 103 Asia Pacific Sustainable Aviation Fuel Market Share Forecast by Biofuel Manufacturing Technology, 2024 & 2034 (%)
Figure 104 Japan Sustainable Aviation Fuel Market Forecast, 2024-2034 (US$ Million, AGR %)
Figure 105 China Sustainable Aviation Fuel Market Forecast, 2024-2034 (US$ Million, AGR %)
Figure 106 India Sustainable Aviation Fuel Market Forecast, 2024-2034 (US$ Million, AGR %)
Figure 107 Australia Sustainable Aviation Fuel Market Forecast, 2024-2034 (US$ Million, AGR %)
Figure 108 South Korea Sustainable Aviation Fuel Market Forecast, 2024-2034 (US$ Million, AGR %)
Figure 109 Rest of Asia Pacific Sustainable Aviation Fuel Market Forecast, 2024-2034 (US$ Million, AGR %)
Figure 110 Latin America Sustainable Aviation Fuel Market Attractiveness Index
Figure 111 Latin America Sustainable Aviation Fuel Market by Region, 2024, 2029 & 2034 (US$ Million)
Figure 112 Latin America Sustainable Aviation Fuel Market Forecast by Country, 2024-2034 (US$ Million, AGR %)
Figure 113 Latin America Sustainable Aviation Fuel Market Share Forecast by Country, 2024 & 2034 (%)
Figure 114 Latin America Sustainable Aviation Fuel Market Forecast by Fuel Type, 2024-2034 (US$ Million, AGR %)
Figure 115 Latin America Sustainable Aviation Fuel Market Share Forecast by Fuel Type, 2024 & 2034 (%)
Figure 116 Latin America Sustainable Aviation Fuel Market Forecast by Blending Capacity, 2024-2034 (US$ Million, AGR %)
Figure 117 Latin America Sustainable Aviation Fuel Market Share Forecast by Blending Capacity, 2024 & 2034 (%)
Figure 118 Latin America Sustainable Aviation Fuel Market Forecast by Biofuel Manufacturing Technology, 2024-2034 (US$ Million, AGR %)
Figure 119 Latin America Sustainable Aviation Fuel Market Share Forecast by Biofuel Manufacturing Technology, 2024 & 2034 (%)
Figure 120 Latin America Sustainable Aviation Fuel Market Forecast by Platform, 2024-2034 (US$ Million, AGR %)
Figure 121 Latin America Sustainable Aviation Fuel Market Share Forecast by Biofuel Manufacturing Technology, 2024 & 2034 (%)
Figure 122 Brazil Sustainable Aviation Fuel Market Forecast, 2024-2034 (US$ Million, AGR %)
Figure 123 Mexico Sustainable Aviation Fuel Market Forecast, 2024-2034 (US$ Million, AGR %)
Figure 124 Rest of Latin America Sustainable Aviation Fuel Market Forecast, 2024-2034 (US$ Million, AGR %)
Figure 125 MEA Sustainable Aviation Fuel Market Attractiveness Index
Figure 126 MEA Sustainable Aviation Fuel Market by Region, 2024, 2029 & 2034 (US$ Million)
Figure 127 MEA Sustainable Aviation Fuel Market Forecast by Country, 2024-2034 (US$ Million, AGR %)
Figure 128 MEA Sustainable Aviation Fuel Market Share Forecast by Country, 2024 & 2034 (%)
Figure 129 MEA Sustainable Aviation Fuel Market Forecast by Fuel Type, 2024-2034 (US$ Million, AGR %)
Figure 130 MEA Sustainable Aviation Fuel Market Share Forecast by Fuel Type, 2024 & 2034 (%)
Figure 131 MEA Sustainable Aviation Fuel Market Forecast by Blending Capacity, 2024-2034 (US$ Million, AGR %)
Figure 132 Latin America Sustainable Aviation Fuel Market Share Forecast by Blending Capacity, 2024 & 2034 (%)
Figure 133 MEA Sustainable Aviation Fuel Market Forecast by Biofuel Manufacturing Technology, 2024-2034 (US$ Million, AGR %)
Figure 134 MEA Sustainable Aviation Fuel Market Share Forecast by Biofuel Manufacturing Technology, 2024 & 2034 (%)
Figure 135 MEA Sustainable Aviation Fuel Market Forecast by Platform, 2024-2034 (US$ Million, AGR %)
Figure 136 MEA Sustainable Aviation Fuel Market Share Forecast by Biofuel Manufacturing Technology, 2024 & 2034 (%)
Figure 137 GCC Sustainable Aviation Fuel Market Forecast, 2024-2034 (US$ Million, AGR %)
Figure 138 South Africa Sustainable Aviation Fuel Market Forecast, 2024-2034 (US$ Million, AGR %)
Figure 139 Rest of MEA Sustainable Aviation Fuel Market Forecast, 2024-2034 (US$ Million, AGR %)
Figure 140 Sustainable Aviation Fuel Market: Company Share/Ranking, 2023
Figure 141 Aemetis, Inc.: Net Revenue, 2019-2023 (US$ Million, AGR%)
Figure 142 Aemetis, Inc.: R&D, 2019-2023 (US$ Million, AGR%)
Figure 143 Aemetis, Inc.: Segment Market Shares, 2023
Figure 144 Ballard Power Systems: Net Revenue, 2019-2023 (US$ Million, AGR%)
Figure 145 Ballard Power Systems: Regional Market Shares, 2023
Figure 146 Ballard Power Systems: Segment Market Shares, 2023
Figure 147 Eni SPA: Net Revenue, 2019-2023 (US$ Million, AGR%)
Figure 148 Eni SPA: R&D, 2019-2023 (US$ Million, AGR%)
Figure 149 Eni SPA: Regional Market Shares, 2023
Figure 150 Eni SPA: Segment Market Shares, 2023
Figure 151 Gevo Inc.: Net Revenue, 2019-2023 (US$ Million, AGR%)
Figure 152 Gevo Inc.: Segment Market Shares, 2023
Figure 153 Neste Oyj: Net Revenue, 2019-2023 (US$ Million, AGR%)
Figure 154 Neste Oyj: Regional Market Shares, 2023
Figure 155 Neste Oyj: Segment Market Shares, 2023
Figure 156 OMV Aktiengesellschaft: Net Revenue, 2019-2023 (US$ Million, AGR%)
Figure 157 OMV Aktiengesellschaft: Regional Market Shares, 2023
Figure 158 OMV Aktiengesellschaft: Segment Market Shares, 2023
Figure 159 TotalEnergies SE: Net Revenue, 2019-2023 (US$ Million, AGR%)
Figure 160 TotalEnergies SE: Regional Market Shares, 2023
Figure 161 TotalEnergies SE: Segment Market Shares, 2023
ページTOPに戻る
Visiongain社の航空・海事分野での最新刊レポート
本レポートと同じKEY WORD()の最新刊レポート
- 本レポートと同じKEY WORDの最新刊レポートはありません。
よくあるご質問
Visiongain社はどのような調査会社ですか?
英国の調査会社ヴィジョンゲイン社(Visiongain)は、通信とエネルギーのほか、自動車や化学・医薬品、金属など、広範な市場を対象に調査を行っています。自動車市場については、市場全般に関する調査のほ... もっと見る
調査レポートの納品までの日数はどの程度ですか?
在庫のあるものは速納となりますが、平均的には 3-4日と見て下さい。
但し、一部の調査レポートでは、発注を受けた段階で内容更新をして納品をする場合もあります。
発注をする前のお問合せをお願いします。
注文の手続きはどのようになっていますか?
1)お客様からの御問い合わせをいただきます。
2)見積書やサンプルの提示をいたします。
3)お客様指定、もしくは弊社の発注書をメール添付にて発送してください。
4)データリソース社からレポート発行元の調査会社へ納品手配します。
5) 調査会社からお客様へ納品されます。最近は、pdfにてのメール納品が大半です。
お支払方法の方法はどのようになっていますか?
納品と同時にデータリソース社よりお客様へ請求書(必要に応じて納品書も)を発送いたします。
お客様よりデータリソース社へ(通常は円払い)の御振り込みをお願いします。
請求書は、納品日の日付で発行しますので、翌月最終営業日までの当社指定口座への振込みをお願いします。振込み手数料は御社負担にてお願いします。
お客様の御支払い条件が60日以上の場合は御相談ください。
尚、初めてのお取引先や個人の場合、前払いをお願いすることもあります。ご了承のほど、お願いします。
データリソース社はどのような会社ですか?
当社は、世界各国の主要調査会社・レポート出版社と提携し、世界各国の市場調査レポートや技術動向レポートなどを日本国内の企業・公官庁及び教育研究機関に提供しております。
世界各国の「市場・技術・法規制などの」実情を調査・収集される時には、データリソース社にご相談ください。
お客様の御要望にあったデータや情報を抽出する為のレポート紹介や調査のアドバイスも致します。
|
|

