空港セキュリティ市場レポート:2023-2033
Airport Security Market Report 2023-2033
レポート詳細
空港セキュリティ市場レポート 2023-2033 : 本レポートは、業界とその基礎となる力学をよりよく理解したい場合、新たな収益ポケットを目指す大手企業にとって貴重なものとなります。ま... もっと見る
※上記価格は部署ライセンス(Departmental licence)価格です。
その他の価格についてはデータリソースまでお問合せください。
日本語のページは自動翻訳を利用し作成しています。
実際のレポートは英文のみでご納品いたします。

|

|
サマリー
レポート詳細
空港セキュリティ市場レポート 2023-2033: 本レポートは、業界とその基礎となる力学をよりよく理解したい場合、新たな収益ポケットを目指す大手企業にとって貴重なものとなります。また、異業種への進出や新地域での既存事業の拡大を目指す企業にとっても有益なレポートです。
航空旅客数の急増、テロの脅威の増大、クラウドベースの空港セキュリティソリューションの需要増が市場成長を牽引
過去数十年間、航空業界では、飛行場でのサイバーセキュリティ攻撃の増加など、いくつかの理由から、クラウドベースの空港セキュリティソリューションの需要が増加しています。クラウド技術の出現は、空港セキュリティシステムの運用方法を変え、従来のオンプレミス型ソリューションと比較していくつかの利点を提供しました。クラウドベースの空港セキュリティソリューションの採用が増加している背景には、拡張性、柔軟性、費用対効果、効率の向上といったさまざまな要因があり、これが空港当局での採用を後押ししている。クラウド技術により、空港はニーズに応じてセキュリティシステムを迅速に拡大・縮小することができます。この拡張性により、空港は旅客数の変動や脅威の状況の変化に対応するためにセキュリティ対策を調整することができます。
高度なセキュリティ対策の実施に伴う高コストとサイバー脅威の蔓延が業界成長の妨げとなる
空港セキュリティ市場は、サイバー脅威の蔓延が原因で大きな課題に直面しています。サイバー攻撃はより巧妙かつ頻繁になっており、空港セキュリティシステムと航空旅行の安全性に大きなリスクをもたらしています。航空業界は、空港セキュリティシステムの脆弱性を悪用してさまざまな悪意のある活動を行おうとするサイバー犯罪者の格好の標的になっています。
空港セキュリティに対する最も重大なサイバー脅威は、ランサムウェア攻撃、データ漏洩、個人情報盗難などです。ランサムウェア攻撃は近年一般的になっており、サイバー犯罪者は重要な空港システムやデータへのアクセスを回復させる代わりに支払いを要求します。データ漏洩は、旅客データや従業員記録などの機密情報を漏洩させ、金銭的・風評的な損害を与える可能性があります。個人情報の盗難は、 空港セキュリティプロトコルを危険にさらし、制限されたエリアや機器への不正アクセスを可能にする可能性があります。
マーケットリサーチレポートを購入する前に、どのような質問をするべきか?
- 空港セキュリティ市場はどのように進化しているのか?
- 空港セキュリティ市場を牽引し、抑制しているものは何か?
- 空港セキュリティの各サブマーケットセグメントは予測期間中にどのように成長し、2033年にこれらのサブマーケットが占める売上はどの程度になるのか?
- 2023年から2033年にかけて、空港セキュリティの各サブマーケットの市場シェアはどのように推移するのか?
- 2023年から2033年にかけて、市場全体の主な牽引役となるのは何か?
- 空港セキュリティの主要市場はマクロ経済ダイナミクスに概ね追随するのか、それとも個々の国別市場が他を凌駕するのか?
- 2033年までに各国市場のシェアはどのように変化し、2033年に市場をリードするのはどの地域か?
- 主要プレイヤーは誰で、予測期間中の見通しは?
- これらの大手企業の空港セキュリティプロジェクトはどのようなものか?
- 2023年から2033年の間に、業界はどのように進化していくのでしょうか?現在および今後10年間に実施される空港セキュリティプロジェクトには、どのような意味があるのでしょうか?
- 空港セキュリティ市場をさらに拡大するために、製品の商業化の必要性は高まっているのでしょうか?
- 空港セキュリティ市場の方向性と、市場の最前線に立つための方法とは?
- 新製品やサービスラインへの最適な投資方法とは?
- 企業を新たな成長軌道に乗せ、C-suiteに移行させるための重要な展望は何か?
このことが、現在、そして今後10年間の空港セキュリティ市場にどのような影響を与えるかを見極める必要があります:
- 248ページにわたる本レポートでは、109の表と148のチャート/グラフを独占的に提供します。
- 本レポートでは、業界における主要な収益性の高い分野を取り上げているため、今すぐその分野をターゲットにすることができます。
- 世界、地域、国の売上高と成長率を詳細に分析しています。
- 競合他社が成功した主要なトレンド、変化、収益予測をハイライトしています。
本レポートは、空港セキュリティ市場が今後10年間にどのように発展するか、またCOVID-19の景気後退やバウンスの変化に合わせて、今日あなたにお伝えします。この市場は、過去10年間のどの時点よりも今が重要です。
2033年までの予測やその他の分析により、商業的な展望を明らかにする。
- 今回の調査では、2033年までの収益予測に加え、直近の実績、成長率、市場シェアも掲載しています。
- ビジネスの展望や展開など、独自の分析がご覧いただけます。
- 定性的分析(市場力学、促進要因、機会、阻害要因、課題など)、コスト構造、空港セキュリティ価格上昇の影響、最近の動向などをご覧いただけます。
本レポートでは、COVID-19が業界や貴社にどのような影響を与えるかについて、データ分析および貴重な知見を提供しています。COVID-19の4つの回収パターン、すなわち「V」、「L」、「W」、「U」の回収パターンとその影響について考察しています。
報告書の対象セグメント
用途
- 監視カメラ
- アクセスコントロール
- ペリメーターセキュリティ
- スクリーニング
- サイバーセキュリティ
- その他
システム
- 生体認証システム
- アラート・サイバーセキュリティシステム
- Eフェンス・地上監視レーダーシステム
- 電子タグシステム
- その他
エンドユーザー
- 端末側
- 航空機側
- 海軍側
世界市場全体およびセグメントの収益予測に加え、5つの地域および16の主要国市場の収益予測も掲載しています:
北米
- アメリカ
- カナダ
欧州
- ドイツ
- 英国
- フランス
- スペイン
- イタリア
- その他の欧州地域
アジア太平洋地域
- 中国
- 日本
- インド
- オーストラリア
- 韓国
- その他のアジア太平洋地域
ラテンアメリカ
- ブラジル
- メキシコ
- その他のラテンアメリカ地域
MEA
- GCC
- 南アフリカ
- その他のMEA地域
空港セキュリティ市場の2023年から2033年にかけての主要企業のプロファイルと、これらの企業のこのセグメントに焦点を当てたいくつかの企業についても報告しています。
主要企業と市場成長の可能性
・ Analogic Corporation
・ Bruker Corporation
・ G4S Plc
・ Hitachi, Ltd.
・ Honeywell International
・ L3Harris Technologies
・ Leidos Holdings, Inc.
・ Nuctech Company Ltd
・ OSI システムs
・ OT-Morpho (IDEMIA)
・ Securitas AB
・ Siemens AG
・ SITA
・ Smiths Detection
・ Thales SA
空港セキュリティ市場の世界全体の収益、2023年から2033年までの金額ベースで、市場は2023年に131億2410万米ドルを突破すると、私たちの仕事は計算されます。2033年まで収益が大きく伸びることが予測されます。当社の調査では、最も大きな可能性を秘めた企業を特定しています。彼らの能力、進歩、商業的展望を知ることで、常に先を行くことができます。
空港セキュリティ市場、2023年から2033年までのレポートはどのように役立つのでしょうか?
まとめると、248ページのレポートでは、以下のような知識を得ることができます:
- 空港セキュリティ市場、2023年から2033年までの収益予測 用途、システム、エンドユーザー別に、世界と地域レベルでそれぞれ予測 - 業界の展望を発見し、投資と収益に最も有利な場所を見つけることができます。
- 5つの地域と16の主要国市場の2033年までの収益予測 - 空港セキュリティ市場の2023年から2033年の市場予測は、北米、欧州、アジア太平洋、ラテンアメリカ、MEAでご覧いただけます。また、米国、カナダ、メキシコ、ブラジル、ドイツ、フランス、英国、イタリア、中国、インド、日本、オーストラリアなど、著名な経済圏の市場も予測しています。
- 空港セキュリティ市場に関わる主要企業15社の企業プロファイルを含む、2023年から2033年までの市場参入を目指す企業や既存企業の展望。
独自の予測による定量・定性分析をご覧いただけます。私たちのレポートだけが持つ情報を入手し、貴重なビジネスインテリジェンスとして情報を得ることができます。
他にはない情報
私たちの新しいレポートがあれば、知識に遅れをとったり、チャンスを逃したりする可能性は低くなります。私たちの仕事が、あなたの調査、分析、意思決定にどのように役立つかをご覧ください。Visiongainの研究は、空港セキュリティ市場、2023年から2033年、市場をリードする企業のための商業分析を必要とするすべての人のためのものです。データ、トレンド、予測を見つけることができます。
ページTOPに戻る
目次
目次
1 レポートの概要
1.1 調査の目的
1.2 空港セキュリティ市場の紹介
1.3 本レポートが提供するもの
1.4 本レポートを読むべき理由
1.5 本分析レポートが回答する主な質問事項
1.6 本レポートは誰のためのものか?
1.7 方法論
1.7.1 市場の定義
1.7.2 市場評価・予測手法
1.7.3 データの検証
1.7.3.1 プライマリーリサーチ
1.7.3.2 セカンダリーリサーチ
1.8 よくある質問(FAQ)
1.9 関連するVisiongainのレポート
1.10 Visiongainについて
2 エグゼクティブサマリー
3 市場の概要
3.1 主要な調査結果
3.2 マーケットダイナミクス
3.2.1 市場促進要因
3.2.1.1 航空旅客数の増加
3.2.1.2 テロの脅威の増大
3.2.1.3 クラウドベースの空港セキュリティソリューションに対する需要の高まり
3.2.2 市場抑制要因
3.2.2.1 高度なセキュリティ対策の実施に伴う高コスト
3.2.2.2 サイバー脅威の普及率上昇
3.2.3 市場機会
3.2.3.1 AIと機械学習の採用の増加
3.2.3.2 クラウドベースの空港セキュリティソリューションの採用
3.2.3.3 バイオメトリクス認証の需要増
3.3 COVID-19影響度分析
3.4 ポーターのファイブフォース分析
3.4.1 サプライヤーのバーゲニングパワーは中程度
3.4.2 高いバイヤーのバーゲニングパワー
3.4.3 高い競争力のあるライバル関係
3.4.4 低い代替品による脅威
3.4.5 低い新規参入の脅威
3.5 PEST分析
4 空港セキュリティ市場分析:用途別
4.1 主要な調査結果
4.2 用途セグメント市場魅力度指数
4.3 空港セキュリティの用途別市場規模の推定と予測
4.4 サーベイランス
4.4.1 地域別市場規模、2023年〜2033年(US$ Million)
4.4.2 地域別市場シェア、2023年&2033年(%)
4.5 アクセスコントロール
4.5.1 2023年~2033年の地域別市場規模(US$ Million)
4.5.2 地域別市場シェア、2023年&2033年(%)
4.6 ペリメーターセキュリティ
4.6.1 2023年~2033年の地域別市場規模(US$ Million)
4.6.2 地域別市場シェア、2023年&2033年(%)
4.7 スクリーン
4.7.1 2023年~2033年の地域別市場規模(US$ Million)
4.7.2 地域別市場シェア、2023年&2033年(%)
4.8 サイバーセキュリティ
4.8.1 2023年~2033年の地域別市場規模(US$ Million)
4.8.2 地域別市場シェア、2023年&2033年(%)
4.9 その他
4.9.1 2023年~2033年の地域別市場規模(US$ Million)
4.9.2 地域別市場シェア、2023年&2033年 (%)
5 空港セキュリティ市場分析:システム別
5.1 主要な調査結果
5.2 システムセグメント市場魅力度指数
5.3 空港セキュリティのシステム別市場規模の推定と予測
5.4 生体認証システム
5.4.1 地域別市場規模、2023年〜2033年(US$ Million)
5.4.2 地域別市場シェア、2023年&2033年(%)
5.5 アラート・サイバーセキュリティシステム
5.5.1 2023年~2033年の地域別市場規模(US$ Million)
5.5.2 地域別市場シェア、2023年&2033年(%)
5.6 Eフェンス・地上監視レーダーシステム
5.6.1 2023年~2033年の地域別市場規模(US$ Million)
5.6.2 地域別市場シェア、2023年&2033年(%)
5.7 Eタグシステム
5.7.1 2023年~2033年の地域別市場規模(US$ Million)
5.7.2 地域別市場シェア、2023年&2033年(%)
5.8 その他
5.8.1 2023年~2033年の地域別市場規模(US$ Million)
5.8.2 地域別市場シェア、2023年&2033年 (%)
6 空港セキュリティ市場分析:エンドユーザー別
6.1 主要な調査結果
6.2 エンドユーザー・セグメント市場魅力度指数
6.3 空港セキュリティのエンドユーザー別市場規模の推定と予測
6.4 ターミナル側
6.4.1 2023年~2033年の地域別市場規模(US$ Million)
6.4.2 地域別市場シェア、2023年&2033年(%)
6.5 航空機側
6.5.1 2023年~2033年の地域別市場規模(US$ Million)
6.5.2 地域別市場シェア、2023年&2033年(%)
6.6 海軍側
6.6.1 2023年~2033年の地域別市場規模(US$ Million)
6.6.2 地域別市場シェア、2023年&2033年(%)
7 空港セキュリティ市場分析:地域別
7.1 主要な調査結果
7.2 地域別市場規模の推定と予測
8 北米空港セキュリティ市場の分析
8.1 主要な調査結果
8.2 北米空港セキュリティ市場魅力度指数
8.3 北米空港セキュリティの国別市場規模推移、2023年、2028年&2033年(US$ Million)
8.4 北米空港セキュリティの国別市場規模推移の推定と予測
8.5 北米空港セキュリティの用途別市場規模推定と予測
8.6 北米空港セキュリティのシステム別市場規模推定と予測
8.7 北米空港セキュリティのエンドユーザー別市場規模推定と予測
8.8 アメリカの空港セキュリティ市場の分析
8.9 カナダの空港セキュリティ市場の分析
9 欧州の空港セキュリティ市場分析
9.1 主要な調査結果
9.2 欧州空港セキュリティ市場魅力度指数
9.3 欧州空港セキュリティの国別市場規模、2023年、2028年&2033年(US$ Million)
9.4 欧州空港セキュリティの国別市場規模推移推定と予測
9.5 欧州空港セキュリティの用途別市場規模推定と予測
9.6 欧州空港セキュリティのシステム別市場規模推定と予測
9.7 欧州空港セキュリティのエンドユーザー別市場規模推定と予測
9.8 ドイツの空港セキュリティの市場分析
9.9 イギリスの空港セキュリティ市場の分析
9.10 フランスの空港セキュリティ市場の分析
9.11 イタリアの空港セキュリティ市場の分析
9.12 スペイン空港セキュリティの市場分析
9.13 その他の欧州地域の空港セキュリティ市場の分析
10 アジア太平洋地域の空港セキュリティ市場の分析
10.1 主要な調査結果
10.2 アジア太平洋地域の空港セキュリティ市場魅力度指数
10.3 アジア太平洋地域の空港セキュリティの国別市場規模、2023年、2028年、2033年(US$ Million)
10.4 アジア太平洋地域の空港セキュリティの国別市場規模推定と予測
10.5 アジア太平洋地域の空港セキュリティの用途別市場規模推定と予測
10.6 アジア太平洋地域の空港セキュリティのシステム別市場規模推定と予測
10.7 アジア太平洋地域の空港セキュリティのエンドユーザー別市場規模推定と予測
10.8 中国空港セキュリティの市場分析
10.9 日本空港セキュリティ市場分析
10.10 インドの空港セキュリティ市場の分析
10.11 オーストラリアの空港セキュリティ市場の分析
10.12 韓国空港セキュリティの市場分析
10.13 その他のアジア太平洋地域の空港セキュリティ市場の分析
11 ラテンアメリカの空港セキュリティ市場分析
11.1 主要な調査結果
11.2 ラテンアメリカの空港セキュリティ市場魅力度指数
11.3 ラテンアメリカの空港セキュリティ市場の国別推移、2023年、2028年&2033年(US$ Million)
11.4 ラテンアメリカの空港セキュリティの国別市場規模推移推定と予測
11.5 ラテンアメリカの空港セキュリティの用途別市場規模推定と予測
11.6 ラテンアメリカの空港セキュリティのシステム別市場規模推定と予測
11.7 ラテンアメリカの空港セキュリティのエンドユーザー別市場規模推定と予測
11.8 ブラジル空港セキュリティの市場分析
11.9 メキシコの空港セキュリティ市場分析
11.10 その他のラテンアメリカの空港セキュリティ市場分析
12 MEAの空港セキュリティの市場分析
12.1 主要な調査結果
12.2 MEA空港セキュリティ市場魅力度指数
12.3 MEA空港セキュリティの国別市場:2023年、2028年&2033年(US$ Million)
12.4 MEA空港セキュリティの国別市場規模推移推定と予測
12.5 MEA空港セキュリティの用途別市場規模推定と予測
12.6 MEA空港セキュリティのシステム別市場規模推定と予測
12.7 MEA空港セキュリティのエンドユーザー別市場規模推定と予測
12.8 GCC空港セキュリティの市場分析
12.9 南アフリカの空港セキュリティ市場の分析
12.10 その他のMEAの空港セキュリティ市場の分析
13 会社概要
13.1 競争環境、2022年
13.2 戦略的な展望
13.3 Analogic Corporation
13.3.1 企業スナップショット
13.3.2 会社概要
13.3.3 製品ベンチマーキング
13.3.4 戦略的な展望
13.4 ブBruker Corporation
13.4.1 企業スナップショット
13.4.2 会社概要
13.4.3 財務分析
13.4.3.1 純収入、2017-2022年
13.4.3.2 R&D、2017年〜2022年
13.4.3.3 地域別市場シェア、2022年
13.4.4 製品のベンチマーキング
13.4.5 戦略的な展望
13.5 G4S Plc
13.5.1 企業スナップショット
13.5.2 会社概要
13.5.3 財務分析
13.5.3.1 純収益、2017年〜2021年
13.5.3.2 地域別市場占有率、2021年
13.5.4 製品ベンチマーキング
13.5.5 戦略的な展望
13.6 株式会社日立製作所
13.6.1 企業スナップショット
13.6.2 会社概要
13.6.3 財務分析
13.6.3.1 純収益、2017年〜2021年
13.6.3.2 地域別市場占有率、2021年
13.6.4 製品ベンチマーキング
13.6.5 戦略的な展望
13.7 ハネウェルインターナショナル
13.7.1 企業スナップショット
13.7.2 会社概要
13.7.3 財務分析
13.7.3.1 純収益、2017年〜2022年
13.7.3.2 地域別市場占有率、2022年
13.7.4 製品ベンチマーキング
13.7.5 戦略的な展望
13.8 L3Harris Technologies
13.8.1 企業スナップショット
13.8.2 会社概要
13.8.3 財務分析
13.8.3.1 純収益、2017年〜2022年
13.8.3.2 地域別市場占有率、2022年
13.8.4 製品ベンチマーキング
13.8.5 戦略的な展望
13.9 Leidos Holdings, Inc.
13.9.1 企業スナップショット
13.9.2 会社概要
13.9.3 財務分析
13.9.3.1 純収益、2017年〜2022年
13.9.3.2 R&D、2017年〜2022年
13.9.3.3 地域別市場シェア、2022年
13.9.4 製品のベンチマーキング
13.9.5 戦略的な展望
13.10 Nuctech Company Ltd
13.10.1 企業スナップショット
13.10.2 会社概要
13.10.3 ベンチマーキング製品
13.10.4 戦略的な展望
13.11 OSI Systems
13.11.1 企業スナップショット
13.11.2 会社概要
13.11.3 財務分析
13.11.3.1 純収益、2017年〜2022年
13.11.3.2 R&D、2017年〜2022年
13.11.3.3 地域別市場シェア、2022年
13.11.4 製品のベンチマーキング
13.11.5 戦略的な展望
13.12 OT-Morpho (IDEMIA)
13.12.1 企業スナップショット
13.12.2 会社概要
13.12.3 製品ベンチマーク
13.12.4 戦略的な展望
13.13 Securitas AB
13.13.1 企業スナップショット
13.13.2 会社概要
13.13.3 財務分析
13.13.3.1 純収益、2017年〜2022年
13.13.3.2 地域別市場占有率、2022年
13.13.4 製品のベンチマーキング
13.13.5 戦略的な展望
13.14 Siemens AG
13.14.1 企業スナップショット
13.14.2 会社概要
13.14.3 財務分析
13.14.3.1 純収益、2017年〜2022年
13.14.3.2 地域別市場占有率、2022年
13.14.4 製品のベンチマーキング
13.14.5 戦略的な展望
13.15 SITA
13.15.1 企業スナップショット
13.15.2 会社概要
13.15.3 製品ベンチマーク
13.15.4 戦略的展望
13.16 Smiths Detection
13.16.1 企業スナップショット
13.16.2 会社概要
13.16.3 財務分析
13.16.3.1 純収入、2017年〜2022年
13.16.4 製品ベンチマーキング
13.16.5 戦略的な展望
13.17 Thales SA
13.17.1 企業スナップショット
13.17.2 会社概要
13.17.3 財務分析
13.17.3.1 純収益、2017年〜2022年
13.17.3.2 R&D、2017年〜2022年
13.17.3.3 地域別市場占有率、2022年
13.17.4 製品のベンチマーキング
13.17.5 戦略的な展望
14 結論と提言
14.1 Visiongainからの結びの言葉
14.2 市場関係者への提言
ページTOPに戻る
図表リスト
表の一覧
Table 1 Airport Security Market Snapshot, 2023 & 2033 (US$ Million, CAGR %)
Table 2 Airport Security Market Forecast by Region, 2023-2033 (US$ Million, AGR%, CAGR%): “V” Shaped Recovery
Table 3 Airport Security Market Forecast by Region, 2023-2033 (US$ Million, AGR%, CAGR%): “U” Shaped Recovery
Table 4 Airport Security Market Forecast by Region, 2023-2033 (US$ Million, AGR%, CAGR%): “W” Shaped Recovery
Table 5 Airport Security Market Forecast by Region, 2023-2033 (US$ Million, AGR%, CAGR%): “L” Shaped Recovery
Table 6 Airport Security Market Forecast by Application, 2023-2033 (US$ Million, AGR%, CAGR%)
Table 7 Surveillance Segment Market Forecast by Region, 2023-2033 (US$ Million, AGR%, CAGR%)
Table 8 Access Control Segment Market Forecast by Region, 2023-2033 (US$ Million, AGR%, CAGR%)
Table 9 Perimeter Security Segment Market Forecast by Region, 2023-2033 (US$ Million, AGR%, CAGR%)
Table 10 Screening Segment Market Forecast by Region, 2023-2033 (US$ Million, AGR%, CAGR%)
Table 11 Cyber Security Segment Market Forecast by Region, 2023-2033 (US$ Million, AGR%, CAGR%)
Table 12 Others Segment Market Forecast by Region, 2023-2033 (US$ Million, AGR%, CAGR%)
Table 13 Airport Security Market Forecast by System, 2023-2033 (US$ Million, AGR%, CAGR%)
Table 14 Biometric System Segment Market Forecast by Region, 2023-2033 (US$ Million, AGR%, CAGR%)
Table 15 Alert and Cyber Security System Segment Market Forecast by Region, 2023-2033 (US$ Million, AGR%, CAGR%)
Table 16 E-fence and Ground Surveillance Radar System Segment Market Forecast by Region, 2023-2033 (US$ Million, AGR%, CAGR%)
Table 17 E-tag System Segment Market Forecast by Region, 2023-2033 (US$ Million, AGR%, CAGR%)
Table 18 Others Segment Market Forecast by Region, 2023-2033 (US$ Million, AGR%, CAGR%)
Table 19 Airport Security Market Forecast by End User, 2023-2033 (US$ Million, AGR%, CAGR%)
Table 20 Terminal Side Segment Market Forecast by Region, 2023-2033 (US$ Million, AGR%, CAGR%)
Table 21 Air Side Segment Market Forecast by Region, 2023-2033 (US$ Million, AGR%, CAGR%)
Table 22 Naval Side Segment Market Forecast by Region, 2023-2033 (US$ Million, AGR%, CAGR%)
Table 23 Airport Security Market Forecast by Region, 2023-2033 (US$ Million, AGR%, CAGR%)
Table 24 North America Airport Security Market Forecast by Country, 2023-2033 (US$ Million, AGR%, CAGR%)
Table 25 North America Airport Security Market Forecast by Application, 2023-2033 (US$ Million, AGR%, CAGR%)
Table 26 North America Airport Security Market Forecast by System, 2023-2033 (US$ Million, AGR%, CAGR%)
Table 27 North America Airport Security Market Forecast by End User, 2023-2033 (US$ Million, AGR%, CAGR%)
Table 28 U.S. Airport Security Market Forecast, 2023-2033 (US$ Million, AGR%, CAGR%)
Table 29 Canada Airport Security Market Forecast, 2023-2033 (US$ Million, AGR%, CAGR%)
Table 30 Europe Airport Security Market Forecast by Country, 2023-2033 (US$ Million, AGR%, CAGR%)
Table 31 Europe Airport Security Market Forecast by Application, 2023-2033 (US$ Million, AGR%, CAGR%)
Table 32 Europe Airport Security Market Forecast by System, 2023-2033 (US$ Million, AGR%, CAGR%)
Table 33 Europe Airport Security Market Forecast by End User, 2023-2033 (US$ Million, AGR%, CAGR%)
Table 34 Germany Airport Security Market Forecast, 2023-2033 (US$ Million, AGR%, CAGR%)
Table 35 UK Airport Security Market Forecast, 2023-2033 (US$ Million, AGR%, CAGR%)
Table 36 France Airport Security Market Forecast, 2023-2033 (US$ Million, AGR%, CAGR%)
Table 37 Italy Airport Security Market Forecast, 2023-2033 (US$ Million, AGR%, CAGR%)
Table 38 Spain Airport Security Market Forecast, 2023-2033 (US$ Million, AGR%, CAGR%)
Table 39 Rest of Europe Airport Security Market Forecast, 2023-2033 (US$ Million, AGR%, CAGR%)
Table 40 Asia Pacific Airport Security Market Forecast by Country, 2023-2033 (US$ Million, AGR%, CAGR%)
Table 41 Asia Pacific Airport Security Market Forecast by Application, 2023-2033 (US$ Million, AGR%, CAGR%)
Table 42 Asia Pacific Airport Security Market Forecast by System, 2023-2033 (US$ Million, AGR%, CAGR%)
Table 43 Asia Pacific Airport Security Market Forecast by End User, 2023-2033 (US$ Million, AGR%, CAGR%)
Table 44 China Airport Security Market Forecast, 2023-2033 (US$ Million, AGR%, CAGR%)
Table 45 Japan Airport Security Market Forecast, 2023-2033 (US$ Million, AGR%, CAGR%)
Table 46 India Airport Security Market Forecast, 2023-2033 (US$ Million, AGR%, CAGR%)
Table 47 Australia Airport Security Market Forecast, 2023-2033 (US$ Million, AGR%, CAGR%)
Table 48 South Korea Airport Security Market Forecast, 2023-2033 (US$ Million, AGR%, CAGR%)
Table 49 Rest of Asia Pacific Airport Security Market Forecast, 2023-2033 (US$ Million, AGR%, CAGR%)
Table 50 Latin America Airport Security Market Forecast by Country, 2023-2033 (US$ Million, AGR%, CAGR%)
Table 51 Latin America Airport Security Market Forecast by Application, 2023-2033 (US$ Million, AGR%, CAGR%)
Table 52 Latin America Airport Security Market Forecast by System, 2023-2033 (US$ Million, AGR%, CAGR%)
Table 53 Latin America Airport Security Market Forecast by End User, 2023-2033 (US$ Million, AGR%, CAGR%)
Table 54 Brazil Airport Security Market Forecast, 2023-2033 (US$ Million, AGR%, CAGR%)
Table 55 Mexico Airport Security Market Forecast, 2023-2033 (US$ Million, AGR%, CAGR%)
Table 56 Rest of Latin America Airport Security Market Forecast, 2023-2033 (US$ Million, AGR%, CAGR%)
Table 57 MEA Airport Security Market Forecast by Country, 2023-2033 (US$ Million, AGR%, CAGR%)
Table 58 MEA Airport Security Market Forecast by Application, 2023-2033 (US$ Million, AGR%, CAGR%)
Table 59 MEA Airport Security Market Forecast by System, 2023-2033 (US$ Million, AGR%, CAGR%)
Table 60 MEA Airport Security Market Forecast by End User, 2023-2033 (US$ Million, AGR%, CAGR%)
Table 61 GCC Airport Security Market Forecast, 2023-2033 (US$ Million, AGR%, CAGR%)
Table 62 South Africa Airport Security Market Forecast, 2023-2033 (US$ Million, AGR%, CAGR%)
Table 63 Rest of MEA Airport Security Market Forecast, 2023-2033 (US$ Million, AGR%, CAGR%)
Table 64 Strategic Outlook
Table 65 Analogic Corporation: Key Details, (CEO, HQ, Revenue, Founded, No. of Employees, Company Type, Website, Business Segment)
Table 66 Analogic Corporation: Product Benchmarking
Table 67 Analogic Corporation: Strategic Outlook
Table 68 Bruker Corporation: Key Details, (CEO, HQ, Revenue, Founded, No. of Employees, Company Type, Website, Business Segment)
Table 69 Bruker Corporation: Product Benchmarking
Table 70 Bruker Corporation: Strategic Outlook
Table 71 G4S Plc: Key Details, (CEO, HQ, Revenue, Founded, No. of Employees, Company Type, Website, Business Segment)
Table 72 G4S Plc: Product Benchmarking
Table 73 G4S Plc: Strategic Outlook
Table 74 Hitachi, Ltd.: Key Details, (CEO, HQ, Revenue, Founded, No. of Employees, Company Type, Website, Business Segment)
Table 75 Hitachi, Ltd.: Product Benchmarking
Table 76 Hitachi, Ltd.: Strategic Outlook
Table 77 Honeywell International: Key Details, (CEO, HQ, Revenue, Founded, No. of Employees, Company Type, Website, Business Segment)
Table 78 Honeywell International: Product Benchmarking
Table 79 Honeywell International: Strategic Outlook
Table 80 L3Harris Technologies: Key Details, (CEO, HQ, Revenue, Founded, No. of Employees, Company Type, Website, Business Segment)
Table 81 L3Harris Technologies: Product Benchmarking
Table 82 L3Harris Technologies: Strategic Outlook
Table 83 Leidos Holdings Inc.: Key Details, (CEO, HQ, Revenue, Founded, No. of Employees, Company Type, Website, Business Segment)
Table 84 Leidos Holdings Inc.: Product Benchmarking
Table 85 Leidos Holdings Inc.: Strategic Outlook
Table 86 Nuctech Company Ltd: Key Details, (CEO, HQ, Founded, No. of Employees, Company Type, Website, Business Segment)
Table 87 Nuctech Company Ltd: Product Benchmarking
Table 88 Nuctech Company Ltd: Strategic Outlook
Table 89 OSI Systems: Key Details, (CEO, HQ, Revenue, Founded, No. of Employees, Company Type, Website, Business Segment)
Table 90 OSI Systems: Product Benchmarking
Table 91 OSI Systems: Strategic Outlook
Table 92 OT-Morpho (IDEMIA): Key Details, (CEO, HQ, Revenue, Founded, No. of Employees, Company Type, Website, Business Segment)
Table 93 OT-Morpho (IDEMIA): Product Benchmarking
Table 94 OT-Morpho (IDEMIA): Strategic Outlook
Table 95 Securitas AB: Key Details, (CEO, HQ, Revenue, Founded, No. of Employees, Company Type, Website, Business Segment)
Table 96 Securitas AB: Product Benchmarking
Table 97 Securitas AB: Strategic Outlook
Table 98 Siemens AG: Key Details, (CEO, HQ, Revenue, Founded, No. of Employees, Company Type, Website, Business Segment)
Table 99 Siemens AG: Product Benchmarking
Table 100 Siemens AG: Strategic Outlook
Table 101 SITA: Key Details, (CEO, HQ, Founded, No. of Employees, Company Type, Website, Business Segment)
Table 102 SITA: Product Benchmarking
Table 103 SITA: Strategic Outlook
Table 104 Smiths Detection: Key Details, (CEO, HQ, Revenue, Founded, Company Type, Website, Business Segment)
Table 105 Smiths Detection: Product Benchmarking
Table 106 Smiths Detection: Strategic Outlook
Table 107 Thales SA: Key Details, (CEO, HQ, Revenue, Founded, No. of Employees, Company Type, Website, Business Segment)
Table 108 Thales SA: Product Benchmarking
Table 109 Thales SA: Strategic Outlook
図の一覧
Figure 1 Airport Security Market Segmentation
Figure 2 Airport Security Market by Application: Market Attractiveness Index
Figure 3 Airport Security Market by System: Market Attractiveness Index
Figure 4 Airport Security Market by End User: Market Attractiveness Index
Figure 5 Airport Security Market Attractiveness Index by Region
Figure 6 Airport Security Market: Market Dynamics
Figure 7 Airport Security Market by Region, 2023-2033 (US$ Million, AGR %): “V” Shaped Recovery
Figure 8 Airport Security Market by Region, 2023-2033 (US$ Million, AGR %): “U” Shaped Recovery
Figure 9 Airport Security Market by Region, 2023-2033 (US$ Million, AGR %): “W” Shaped Recovery
Figure 10 Airport Security Market by Region, 2023-2033 (US$ Million, AGR %): “L” Shaped Recovery
Figure 11 Airport Security Market: Porter’s Five Forces Analysis
Figure 12 Airport Security Market: PEST Analysis
Figure 13 Airport Security Market by Application: Market Attractiveness Index
Figure 14 Airport Security Market Forecast by Application, 2023-2033 (US$ Million, AGR %)
Figure 15 Airport Security Market Share Forecast by Application, 2023, 2028, 2033 (%)
Figure 16 Surveillance Segment Market Forecast by Region, 2023-2033 (US$ Million, AGR %)
Figure 17 Surveillance Segment Market Share Forecast by Region, 2023 & 2033 (%)
Figure 18 Access Control Segment Market Forecast by Region, 2023-2033 (US$ Million, AGR %)
Figure 19 Access Control Segment Market Share Forecast by Region, 2023 & 2033 (%)
Figure 20 Perimeter Security Segment Market Forecast by Region, 2023-2033 (US$ Million, AGR %)
Figure 21 Perimeter Security Segment Market Share Forecast by Region, 2023 & 2033 (%)
Figure 22 Screening Segment Market Forecast by Region, 2023-2033 (US$ Million, AGR %)
Figure 23 Screening Segment Market Share Forecast by Region, 2023 & 2033 (%)
Figure 24 Cyber Security Segment Market Forecast by Region, 2023-2033 (US$ Million, AGR %)
Figure 25 Cyber Security Segment Market Share Forecast by Region, 2023 & 2033 (%)
Figure 26 Others Segment Market Forecast by Region, 2023-2033 (US$ Million, AGR %)
Figure 27 Others Segment Market Share Forecast by Region, 2023 & 2033 (%)
Figure 28 Airport Security Market by System: Market Attractiveness Index
Figure 29 Airport Security Market Forecast by System, 2023-2033 (US$ Million, AGR %)
Figure 30 Airport Security Market Share Forecast by System, 2023, 2028, 2033 (%)
Figure 31 Biometric System Segment Market Forecast by Region, 2023-2033 (US$ Million, AGR %)
Figure 32 Biometric System Segment Market Share Forecast by Region, 2023 & 2033 (%)
Figure 33 Alert and Cyber Security System Segment Market Forecast by Region, 2023-2033 (US$ Million, AGR %)
Figure 34 Alert and Cyber Security System Segment Market Share Forecast by Region, 2023 & 2033 (%)
Figure 35 E-fence and Ground Surveillance Radar System Segment Market Forecast by Region, 2023-2033 (US$ Million, AGR %)
Figure 36 E-fence and Ground Surveillance Radar System Segment Market Share Forecast by Region, 2023 & 2033 (%)
Figure 37 E-tag System Segment Market Forecast by Region, 2023-2033 (US$ Million, AGR %)
Figure 38 E-tag System Segment Market Share Forecast by Region, 2023 & 2033 (%)
Figure 39 Others Segment Market Forecast by Region, 2023-2033 (US$ Million, AGR %)
Figure 40 Others Segment Market Share Forecast by Region, 2023 & 2033 (%)
Figure 41 Airport Security Market by End User: Market Attractiveness Index
Figure 42 Airport Security Market Forecast by End User, 2023-2033 (US$ Million, AGR %)
Figure 43 Airport Security Market Share Forecast by End User, 2023, 2028, 2033 (%)
Figure 44 Terminal Side Segment Market Forecast by Region, 2023-2033 (US$ Million, AGR %)
Figure 45 Terminal Side Segment Market Share Forecast by Region, 2023 & 2033 (%)
Figure 46 Air Side Segment Market Forecast by Region, 2023-2033 (US$ Million, AGR %)
Figure 47 Air Side Segment Market Share Forecast by Region, 2023 & 2033 (%)
Figure 48 Naval Side Segment Market Forecast by Region, 2023-2033 (US$ Million, AGR %)
Figure 49 Naval Side Segment Market Share Forecast by Region, 2023 & 2033 (%)
Figure 50 Airport Security Market Forecast by Region 2023 and 2033 (Revenue, CAGR%)
Figure 51 Airport Security Market Share Forecast by Region 2023, 2028, 2033 (%)
Figure 52 Airport Security Market by Region, 2023-2033 (US$ Million, AGR %)
Figure 53 North America Airport Security Market Attractiveness Index
Figure 54 North America Airport Security Market by Region, 2023, 2028 & 2033 (US$ Million)
Figure 55 North America Airport Security Market Forecast by Country, 2023-2033 (US$ Million, AGR %)
Figure 56 North America Airport Security Market Share Forecast by Country, 2023 & 2033 (%)
Figure 57 North America Airport Security Market Forecast by Application, 2023-2033 (US$ Million, AGR %)
Figure 58 North America Airport Security Market Share Forecast by Application, 2023 & 2033 (%)
Figure 59 North America Airport Security Market Forecast by System, 2023-2033 (US$ Million, AGR %)
Figure 60 North America Airport Security Market Share Forecast by System, 2023 & 2033 (%)
Figure 61 North America Airport Security Market Forecast by End User, 2023-2033 (US$ Million, AGR %)
Figure 62 North America Airport Security Market Share Forecast by End User, 2023 & 2033 (%)
Figure 63 U.S. Airport Security Market Forecast, 2023-2033 (US$ Million, AGR %)
Figure 64 Canada Airport Security Market Forecast, 2023-2033 (US$ Million, AGR %)
Figure 65 Europe Airport Security Market Attractiveness Index
Figure 66 Europe Airport Security Market by Region, 2023, 2028 & 2033 (US$ Million)
Figure 67 Europe Airport Security Market Forecast by Country, 2023-2033 (US$ Million, AGR %)
Figure 68 Europe Airport Security Market Share Forecast by Country, 2023 & 2033 (%)
Figure 69 Europe Airport Security Market Forecast by Application, 2023-2033 (US$ Million, AGR %)
Figure 70 Europe Airport Security Market Share Forecast by Application, 2023 & 2033 (%)
Figure 71 Europe Airport Security Market Forecast by System, 2023-2033 (US$ Million, AGR %)
Figure 72 Europe Airport Security Market Share Forecast by System, 2023 & 2033 (%)
Figure 73 Europe Airport Security Market Forecast by End User, 2023-2033 (US$ Million, AGR %)
Figure 74 Europe Airport Security Market Share Forecast by End User, 2023 & 2033 (%)
Figure 75 Germany Airport Security Market Forecast, 2023-2033 (US$ Million, AGR %)
Figure 76 UK Airport Security Market Forecast, 2023-2033 (US$ Million, AGR %)
Figure 77 France Airport Security Market Forecast, 2023-2033 (US$ Million, AGR %)
Figure 78 Italy Airport Security Market Forecast, 2023-2033 (US$ Million, AGR %)
Figure 79 Spain Airport Security Market Forecast, 2023-2033 (US$ Million, AGR %)
Figure 80 Rest of Europe Airport Security Market Forecast, 2023-2033 (US$ Million, AGR %)
Figure 81 Asia Pacific Airport Security Market Attractiveness Index
Figure 82 Asia Pacific Airport Security Market by Region, 2023, 2028 & 2033 (US$ Million)
Figure 83 Asia Pacific Airport Security Market Forecast by Country, 2023-2033 (US$ Million, AGR %)
Figure 84 Asia Pacific Airport Security Market Share Forecast by Country, 2023 & 2033 (%)
Figure 85 Asia Pacific Airport Security Market Forecast by Application, 2023-2033 (US$ Million, AGR %)
Figure 86 Asia Pacific Airport Security Market Share Forecast by Application, 2023 & 2033 (%)
Figure 87 Asia Pacific Airport Security Market Forecast by System, 2023-2033 (US$ Million, AGR %)
Figure 88 Asia Pacific Airport Security Market Share Forecast by System, 2023 & 2033 (%)
Figure 89 Asia Pacific Airport Security Market Forecast by End User, 2023-2033 (US$ Million, AGR %)
Figure 90 Asia Pacific Airport Security Market Share Forecast by End User, 2023 & 2033 (%)
Figure 91 China Airport Security Market Forecast, 2023-2033 (US$ Million, AGR %)
Figure 92 Japan Airport Security Market Forecast, 2023-2033 (US$ Million, AGR %)
Figure 93 India Airport Security Market Forecast, 2023-2033 (US$ Million, AGR %)
Figure 94 Australia Airport Security Market Forecast, 2023-2033 (US$ Million, AGR %)
Figure 95 South Korea Airport Security Market Forecast, 2023-2033 (US$ Million, AGR %)
Figure 96 Rest of Asia Pacific Airport Security Market Forecast, 2023-2033 (US$ Million, AGR %)
Figure 97 Latin America Airport Security Market Attractiveness Index
Figure 98 Latin America Airport Security Market by Region, 2023, 2028 & 2033 (US$ Million)
Figure 99 Latin America Airport Security Market Forecast by Country, 2023-2033 (US$ Million, AGR %)
Figure 100 Latin America Airport Security Market Share Forecast by Country, 2023 & 2033 (%)
Figure 101 Latin America Airport Security Market Forecast by Application, 2023-2033 (US$ Million, AGR %)
Figure 102 Latin America Pacific Airport Security Market Share Forecast by Application, 2023 & 2033 (%)
Figure 103 Latin America Airport Security Market Forecast by System, 2023-2033 (US$ Million, AGR %)
Figure 104 Latin America Airport Security Market Share Forecast by System, 2023 & 2033 (%)
Figure 105 Latin America Airport Security Market Forecast by End User, 2023-2033 (US$ Million, AGR %)
Figure 106 Latin America Airport Security Market Share Forecast by End User, 2023 & 2033 (%)
Figure 107 Brazil Airport Security Market Forecast, 2023-2033 (US$ Million, AGR %)
Figure 108 Mexico Airport Security Market Forecast, 2023-2033 (US$ Million, AGR %)
Figure 109 Rest of Latin America Airport Security Market Forecast, 2023-2033 (US$ Million, AGR %)
Figure 110 MEA Airport Security Market Attractiveness Index
Figure 111 MEA Airport Security Market by Region, 2023, 2028 & 2033 (US$ Million)
Figure 112 MEA Airport Security Market Forecast by Country, 2023-2033 (US$ Million, AGR %)
Figure 113 MEA Airport Security Market Share Forecast by Country, 2023 & 2033 (%)
Figure 114 MEA Airport Security Market Forecast by Application, 2023-2033 (US$ Million, AGR %)
Figure 115 MEA Pacific Airport Security Market Share Forecast by Application, 2023 & 2033 (%)
Figure 116 MEA Airport Security Market Forecast by System, 2023-2033 (US$ Million, AGR %)
Figure 117 MEA Airport Security Market Share Forecast by System, 2023 & 2033 (%)
Figure 118 MEA Airport Security Market Forecast by End User, 2023-2033 (US$ Million, AGR %)
Figure 119 MEA Airport Security Market Share Forecast by End User, 2023 & 2033 (%)
Figure 120 GCC Airport Security Market Forecast, 2023-2033 (US$ Million, AGR %)
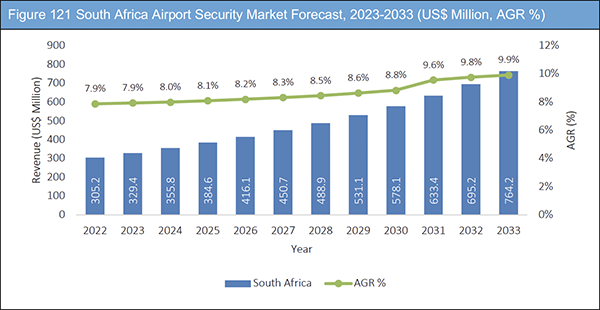
Figure 121 South Africa Airport Security Market Forecast, 2023-2033 (US$ Million, AGR %)
Figure 122 Rest of MEA Airport Security Market Forecast, 2023-2033 (US$ Million, AGR %)
Figure 123 Airport Security Market: Company Share/Ranking, 2022
Figure 124 Bruker Corporation: Net Revenue, 2017-2022 (US$ Million, AGR%)
Figure 125 Bruker Corporation: R&D, 2017-2022 (US$ Million, AGR%)
Figure 126 Bruker Corporation: Regional Market Shares, 2022
Figure 127 G4S Plc: Net Revenue, 2017-2021 (US$ Million, AGR%)
Figure 128 G4S Plc: Regional Market Shares, 2021
Figure 129 Hitachi, Ltd.: Net Revenue, 2017-2021 (US$ Million, AGR%)
Figure 130 Hitachi, Ltd.: Regional Market Shares, 2021
Figure 131 Honeywell International: Net Revenue, 2017-2022 (US$ Million, AGR%)
Figure 132 Honeywell International: Regional Market Shares, 2022
Figure 133 L3Harris Technologies: Net Revenue, 2017-2022 (US$ Million, AGR%)
Figure 134 L3Harris Technologies: Regional Market Shares, 2022
Figure 135 Leidos Holdings Inc.: Net Revenue, 2017-2022 (US$ Million, AGR%)
Figure 136 Leidos Holdings, Inc.: R&D, 2017-2022 (US$ Million, AGR%)
Figure 137 Leidos Holdings Inc.: Regional Market Shares, 2022
Figure 138 OSI Systems: Net Revenue, 2017-2022 (US$ Million, AGR%)
Figure 139 OSI Systems: R&D, 2017-2022 (US$ Million, AGR%)
Figure 140 OSI Systems: Regional Market Shares, 2022
Figure 141 Securitas AB: Net Revenue, 2017-2022 (US$ Million, AGR%)
Figure 142 Securitas AB: Regional Market Shares, 2022
Figure 143 Siemens AG: Net Revenue, 2017-2022 (US$ Million, AGR%)
Figure 144 Siemens AG: Regional Market Shares, 2022
Figure 145 Smiths Detection: Net Revenue, 2017-2022 (US$ Million, AGR%)
Figure 146 Thales SA: Net Revenue, 2017-2022 (US$ Million, AGR%)
Figure 147 Thales SA: R&D, 2017-2022 (US$ Million, AGR%)
Figure 148 Thales SA: Regional Market Shares, 2022
ページTOPに戻る
Summary
Report Details
The Airport Security Market Report 2023-2033: This report will prove invaluable to leading firms striving for new revenue pockets if they wish to better understand the industry and its underlying dynamics. It will be useful for companies that would like to expand into different industries or to expand their existing operations in a new region.
Rapid Increase in Number of Air Passengers, Growing Threat of Terrorism, and Rising Demand for Cloud-Based Airport Security Solutions Driving Market Growth
Past few decades, the demand for cloud-based airport security solutions in the aviation industry has been on the rise, due to several reasons such as rising cyber security attacks at airfields. The emergence of cloud technology has transformed the way airport security systems operate, offering several benefits over traditional on-premise solutions. Increasing adoption of cloud-based airport security solutions is driven by a range of factors such as scalability, flexibility, cost-effectiveness, and improved efficiency, which is driving their adoption among airport authorities. Cloud technology enables airports to quickly scale their security systems up or down based on their needs. This scalability allows airports to adjust their security measures to cope with fluctuations in passenger traffic or changes in the threat landscape.
High Cost Associated with Implementing Advanced Security Measures and Increasing Prevalence of Cyber Threats to Hamper Industry Growth
The airport security market is facing significant challenges due to the increasing prevalence of cyber threats. Cyberattacks are becoming more sophisticated and frequent, posing a major risk to airport security systems and the safety of air travel. The aviation industry has become a prime target for cybercriminals seeking to exploit vulnerabilities in airport security systems to carry out various malicious activities.
The most significant cyber threats to airport security include ransomware attacks, data breaches, and identity theft. Ransomware attacks have become more common in recent years, with cybercriminals demanding payment in exchange for restoring access to critical airport systems and data. Data breaches can expose sensitive information, including passenger data and employee records, leading to financial and reputational damage. Identity theft can compromise airport security protocols, allowing unauthorized access to restricted areas and equipment.
What Questions Should You Ask before Buying a Market Research Report?
• How is the airport security market evolving?
• What is driving and restraining the airport security market?
• How will each airport security submarket segment grow over the forecast period and how much revenue will these submarkets account for in 2033?
• How will the market shares for each airport security submarket develop from 2023 to 2033?
• What will be the main driver for the overall market from 2023 to 2033?
• Will leading airport security markets broadly follow the macroeconomic dynamics, or will individual national markets outperform others?
• How will the market shares of the national markets change by 2033 and which geographical region will lead the market in 2033?
• Who are the leading players and what are their prospects over the forecast period?
• What are the airport security projects for these leading companies?
• How will the industry evolve during the period between 2023 and 2033? What are the implications of airport security projects taking place now and over the next 10 years?
• Is there a greater need for product commercialisation to further scale the airport security market?
• Where is the airport security market heading and how can you ensure you are at the forefront of the market?
• What are the best investment options for new product and service lines?
• What are the key prospects for moving companies into a new growth path and C-suite?
You need to discover how this will impact the airport security market today, and over the next 10 years:
• Our 248-page report provides 109 tables and 148 charts/graphs exclusively to you.
• The report highlights key lucrative areas in the industry so you can target them – NOW.
• It contains in-depth analysis of global, regional and national sales and growth.
• It highlights for you the key successful trends, changes and revenue projections made by your competitors.
This report tells you TODAY how the airport security market will develop in the next 10 years, and in line with the variations in COVID-19 economic recession and bounce. This market is more critical now than at any point over the last 10 years.
Forecasts to 2033 and other analyses reveal commercial prospects
• In addition to revenue forecasting to 2033, our new study provides you with recent results, growth rates, and market shares.
• You will find original analyses, with business outlooks and developments.
• Discover qualitative analyses (including market dynamics, drivers, opportunities, restraints and challenges), cost structure, impact of rising airport security prices and recent developments.
This report includes data analysis and invaluable insight into how COVID-19 will affect the industry and your company. Four COVID-19 recovery patterns and their impact, namely, “V”, “L”, “W” and “U” are discussed in this report.
Segments Covered in the Report
Application
• Surveillance
• Access Control
• Perimeter Security
• Screening
• Cyber Security
• Others
System
• Biometric System
• Alert and Cyber Security System
• E-fence and Ground Surveillance Radar System
• E-tag System
• Others
End User
• Terminal Side
• Air Side
• Naval Side
In addition to the revenue predictions for the overall world market and segments, you will also find revenue forecasts for five regional and 16 leading national markets:
North America
• U.S.
• Canada
Europe
• Germany
• UK
• France
• Spain
• Italy
• Rest of Europe
Asia Pacific
• China
• Japan
• India
• Australia
• South Korea
• Rest of Asia Pacific
Latin America
• Brazil
• Mexico
• Rest of Latin America
MEA
• GCC
• South Africa
• Rest of MEA
The report also includes profiles and for some of the leading companies in the Airport Security Market, 2023 to 2033, with a focus on this segment of these companies’ operations.
Leading companies and the potential for market growth
• Analogic Corporation
• Bruker Corporation
• G4S Plc
• Hitachi, Ltd.
• Honeywell International
• L3Harris Technologies
• Leidos Holdings, Inc.
• Nuctech Company Ltd
• OSI Systems
• OT-Morpho (IDEMIA)
• Securitas AB
• Siemens AG
• SITA
• Smiths Detection
• Thales SA
Overall world revenue for Airport Security Market, 2023 to 2033 in terms of value the market will surpass US$13,124.1 million in 2023, our work calculates. We predict strong revenue growth through to 2033. Our work identifies which organizations hold the greatest potential. Discover their capabilities, progress, and commercial prospects, helping you stay ahead.
How will the Airport Security Market, 2023 to 2033 report help you?
In summary, our 248 page report provides you with the following knowledge:
• Revenue forecasts to 2033 for Airport Security Market, 2023 to 2033 Market, with forecasts for application, system, and end user, each forecast at a global and regional level – discover the industry’s prospects, finding the most lucrative places for investments and revenues.
• Revenue forecasts to 2033 for five regional and 16 key national markets – See forecasts for the Airport Security Market, 2023 to 2033 market in North America, Europe, Asia-Pacific, Latin America, and MEA. Also forecasted is the market in the US, Canada, Mexico, Brazil, Germany, France, UK, Italy, China, India, Japan, and Australia among other prominent economies.
• Prospects for established firms and those seeking to enter the market – including company profiles for 15 of the major companies involved in the Airport Security Market, 2023 to 2033.
Find quantitative and qualitative analyses with independent predictions. Receive information that only our report contains, staying informed with invaluable business intelligence.
Information found nowhere else
With our new report, you are less likely to fall behind in knowledge or miss out on opportunities. See how our work could benefit your research, analyses, and decisions. Visiongain’s study is for everybody needing commercial analyses for the Airport Security Market, 2023 to 2033, market-leading companies. You will find data, trends and predictions.
ページTOPに戻る
Table of Contents
Table of Contents
1 Report Overview
1.1 Objectives of the Study
1.2 Introduction to Airport Security Market
1.3 What This Report Delivers
1.4 Why You Should Read This Report
1.5 Key Questions Answered by This Analytical Report
1.6 Who is This Report for?
1.7 Methodology
1.7.1 Market Definitions
1.7.2 Market Evaluation & Forecasting Methodology
1.7.3 Data Validation
1.7.3.1 Primary Research
1.7.3.2 Secondary Research
1.8 Frequently Asked Questions (FAQs)
1.9 Associated Visiongain Reports
1.10 About Visiongain
2 Executive Summary
3 Market Overview
3.1 Key Findings
3.2 Market Dynamics
3.2.1 Market Driving Factors
3.2.1.1 Increasing Number of Air Passengers
3.2.1.2 Growing Threat of Terrorism
3.2.1.3 Rising Demand for Cloud-Based Airport Security Solutions
3.2.2 Market Restraining Factors
3.2.2.1 High Cost Associated with Implementing Advanced Security Measures
3.2.2.2 Increasing Prevalence of Cyber Threats
3.2.3 Market Opportunities
3.2.3.1 Increasing Adoption of AI and Machine Learning
3.2.3.2 Adoption of Cloud-based Airport Security Solutions
3.2.3.3 Rising Demand for Biometric Authentication
3.3 COVID-19 Impact Analysis
3.4 Porter’s Five Forces Analysis
3.4.1 Moderate Bargaining Power of Suppliers
3.4.2 High Bargaining Power of Buyers
3.4.3 Highly Competitive Rivalry
3.4.4 Low Threat from Substitutes
3.4.5 Low Threat of New Entrants
3.5 PEST Analysis
4 Airport Security Market Analysis by Application
4.1 Key Findings
4.2 Application Segment: Market Attractiveness Index
4.3 Airport Security Market Size Estimation and Forecast by Application
4.4 Surveillance
4.4.1 Market Size by Region, 2023-2033 (US$ Million)
4.4.2 Market Share by Region, 2023 & 2033 (%)
4.5 Access Control
4.5.1 Market Size by Region, 2023-2033 (US$ Million)
4.5.2 Market Share by Region, 2023 & 2033 (%)
4.6 Perimeter Security
4.6.1 Market Size by Region, 2023-2033 (US$ Million)
4.6.2 Market Share by Region, 2023 & 2033 (%)
4.7 Screening
4.7.1 Market Size by Region, 2023-2033 (US$ Million)
4.7.2 Market Share by Region, 2023 & 2033 (%)
4.8 Cyber Security
4.8.1 Market Size by Region, 2023-2033 (US$ Million)
4.8.2 Market Share by Region, 2023 & 2033 (%)
4.9 Others
4.9.1 Market Size by Region, 2023-2033 (US$ Million)
4.9.2 Market Share by Region, 2023 & 2033 (%)
5 Airport Security Market Analysis by System
5.1 Key Findings
5.2 System Segment: Market Attractiveness Index
5.3 Airport Security Market Size Estimation and Forecast by System
5.4 Biometric System
5.4.1 Market Size by Region, 2023-2033 (US$ Million)
5.4.2 Market Share by Region, 2023 & 2033 (%)
5.5 Alert and Cyber Security System
5.5.1 Market Size by Region, 2023-2033 (US$ Million)
5.5.2 Market Share by Region, 2023 & 2033 (%)
5.6 E-fence and Ground Surveillance Radar System
5.6.1 Market Size by Region, 2023-2033 (US$ Million)
5.6.2 Market Share by Region, 2023 & 2033 (%)
5.7 E-tag System
5.7.1 Market Size by Region, 2023-2033 (US$ Million)
5.7.2 Market Share by Region, 2023 & 2033 (%)
5.8 Others
5.8.1 Market Size by Region, 2023-2033 (US$ Million)
5.8.2 Market Share by Region, 2023 & 2033 (%)
6 Airport Security Market Analysis by End User
6.1 Key Findings
6.2 End User Segment: Market Attractiveness Index
6.3 Airport Security Market Size Estimation and Forecast by End User
6.4 Terminal Side
6.4.1 Market Size by Region, 2023-2033 (US$ Million)
6.4.2 Market Share by Region, 2023 & 2033 (%)
6.5 Air Side
6.5.1 Market Size by Region, 2023-2033 (US$ Million)
6.5.2 Market Share by Region, 2023 & 2033 (%)
6.6 Naval Side
6.6.1 Market Size by Region, 2023-2033 (US$ Million)
6.6.2 Market Share by Region, 2023 & 2033 (%)
7 Airport Security Market Analysis by Region
7.1 Key Findings
7.2 Regional Market Size Estimation and Forecast
8 North America Airport Security Market Analysis
8.1 Key Findings
8.2 North America Airport Security Market Attractiveness Index
8.3 North America Airport Security Market by Country, 2023, 2028 & 2033 (US$ Million)
8.4 North America Airport Security Market Size Estimation and Forecast by Country
8.5 North America Airport Security Market Size Estimation and Forecast by Application
8.6 North America Airport Security Market Size Estimation and Forecast by System
8.7 North America Airport Security Market Size Estimation and Forecast by End User
8.8 U.S. Airport Security Market Analysis
8.9 Canada Airport Security Market Analysis
9 Europe Airport Security Market Analysis
9.1 Key Findings
9.2 Europe Airport Security Market Attractiveness Index
9.3 Europe Airport Security Market by Country, 2023, 2028 & 2033 (US$ Million)
9.4 Europe Airport Security Market Size Estimation and Forecast by Country
9.5 Europe Airport Security Market Size Estimation and Forecast by Application
9.6 Europe Airport Security Market Size Estimation and Forecast by System
9.7 Europe Airport Security Market Size Estimation and Forecast by End User
9.8 Germany Airport Security Market Analysis
9.9 UK Airport Security Market Analysis
9.10 France Airport Security Market Analysis
9.11 Italy Airport Security Market Analysis
9.12 Spain Airport Security Market Analysis
9.13 Rest of Europe Airport Security Market Analysis
10 Asia Pacific Airport Security Market Analysis
10.1 Key Findings
10.2 Asia Pacific Airport Security Market Attractiveness Index
10.3 Asia Pacific Airport Security Market by Country, 2023, 2028 & 2033 (US$ Million)
10.4 Asia Pacific Airport Security Market Size Estimation and Forecast by Country
10.5 Asia Pacific Airport Security Market Size Estimation and Forecast by Application
10.6 Asia Pacific Airport Security Market Size Estimation and Forecast by System
10.7 Asia Pacific Airport Security Market Size Estimation and Forecast by End User
10.8 China Airport Security Market Analysis
10.9 Japan Airport Security Market Analysis
10.10 India Airport Security Market Analysis
10.11 Australia Airport Security Market Analysis
10.12 South Korea Airport Security Market Analysis
10.13 Rest of Asia Pacific Airport Security Market Analysis
11 Latin America Airport Security Market Analysis
11.1 Key Findings
11.2 Latin America Airport Security Market Attractiveness Index
11.3 Latin America Airport Security Market by Country, 2023, 2028 & 2033 (US$ Million)
11.4 Latin America Airport Security Market Size Estimation and Forecast by Country
11.5 Latin America Airport Security Market Size Estimation and Forecast by Application
11.6 Latin America Airport Security Market Size Estimation and Forecast by System
11.7 Latin America Airport Security Market Size Estimation and Forecast by End User
11.8 Brazil Airport Security Market Analysis
11.9 Mexico Airport Security Market Analysis
11.10 Rest of Latin America Airport Security Market Analysis
12 MEA Airport Security Market Analysis
12.1 Key Findings
12.2 MEA Airport Security Market Attractiveness Index
12.3 MEA Airport Security Market by Country, 2023, 2028 & 2033 (US$ Million)
12.4 MEA Airport Security Market Size Estimation and Forecast by Country
12.5 MEA Airport Security Market Size Estimation and Forecast by Application
12.6 MEA Airport Security Market Size Estimation and Forecast by System
12.7 MEA Airport Security Market Size Estimation and Forecast by End User
12.8 GCC Airport Security Market Analysis
12.9 South Africa Airport Security Market Analysis
12.10 Rest of MEA Airport Security Market Analysis
13 Company Profiles
13.1 Competitive Landscape, 2022
13.2 Strategic Outlook
13.3 Analogic Corporation
13.3.1 Company Snapshot
13.3.2 Company Overview
13.3.3 Product Benchmarking
13.3.4 Strategic Outlook
13.4 Bruker Corporation
13.4.1 Company Snapshot
13.4.2 Company Overview
13.4.3 Financial Analysis
13.4.3.1 Net Revenue, 2017-2022
13.4.3.2 R&D, 2017-2022
13.4.3.3 Regional Market Shares, 2022
13.4.4 Product Benchmarking
13.4.5 Strategic Outlook
13.5 G4S Plc
13.5.1 Company Snapshot
13.5.2 Company Overview
13.5.3 Financial Analysis
13.5.3.1 Net Revenue, 2017-2021
13.5.3.2 Regional Market Shares, 2021
13.5.4 Product Benchmarking
13.5.5 Strategic Outlook
13.6 Hitachi, Ltd.
13.6.1 Company Snapshot
13.6.2 Company Overview
13.6.3 Financial Analysis
13.6.3.1 Net Revenue, 2017-2021
13.6.3.2 Regional Market Shares, 2021
13.6.4 Product Benchmarking
13.6.5 Strategic Outlook
13.7 Honeywell International
13.7.1 Company Snapshot
13.7.2 Company Overview
13.7.3 Financial Analysis
13.7.3.1 Net Revenue, 2017-2022
13.7.3.2 Regional Market Shares, 2022
13.7.4 Product Benchmarking
13.7.5 Strategic Outlook
13.8 L3Harris Technologies
13.8.1 Company Snapshot
13.8.2 Company Overview
13.8.3 Financial Analysis
13.8.3.1 Net Revenue, 2017-2022
13.8.3.2 Regional Market Shares, 2022
13.8.4 Product Benchmarking
13.8.5 Strategic Outlook
13.9 Leidos Holdings, Inc.
13.9.1 Company Snapshot
13.9.2 Company Overview
13.9.3 Financial Analysis
13.9.3.1 Net Revenue, 2017-2022
13.9.3.2 R&D, 2017-2022
13.9.3.3 Regional Market Shares, 2022
13.9.4 Product Benchmarking
13.9.5 Strategic Outlook
13.10 Nuctech Company Ltd
13.10.1 Company Snapshot
13.10.2 Company Overview
13.10.3 Product Benchmarking
13.10.4 Strategic Outlook
13.11 OSI Systems
13.11.1 Company Snapshot
13.11.2 Company Overview
13.11.3 Financial Analysis
13.11.3.1 Net Revenue, 2017-2022
13.11.3.2 R&D, 2017-2022
13.11.3.3 Regional Market Shares, 2022
13.11.4 Product Benchmarking
13.11.5 Strategic Outlook
13.12 OT-Morpho (IDEMIA)
13.12.1 Company Snapshot
13.12.2 Company Overview
13.12.3 Product Benchmarking
13.12.4 Strategic Outlook
13.13 Securitas AB
13.13.1 Company Snapshot
13.13.2 Company Overview
13.13.3 Financial Analysis
13.13.3.1 Net Revenue, 2017-2022
13.13.3.2 Regional Market Shares, 2022
13.13.4 Product Benchmarking
13.13.5 Strategic Outlook
13.14 Siemens AG
13.14.1 Company Snapshot
13.14.2 Company Overview
13.14.3 Financial Analysis
13.14.3.1 Net Revenue, 2017-2022
13.14.3.2 Regional Market Shares, 2022
13.14.4 Product Benchmarking
13.14.5 Strategic Outlook
13.15 SITA
13.15.1 Company Snapshot
13.15.2 Company Overview
13.15.3 Product Benchmarking
13.15.4 Strategic Outlook
13.16 Smiths Detection
13.16.1 Company Snapshot
13.16.2 Company Overview
13.16.3 Financial Analysis
13.16.3.1 Net Revenue, 2017-2022
13.16.4 Product Benchmarking
13.16.5 Strategic Outlook
13.17 Thales SA
13.17.1 Company Snapshot
13.17.2 Company Overview
13.17.3 Financial Analysis
13.17.3.1 Net Revenue, 2017-2022
13.17.3.2 R&D, 2017-2022
13.17.3.3 Regional Market Shares, 2022
13.17.4 Product Benchmarking
13.17.5 Strategic Outlook
14 Conclusion and Recommendations
14.1 Concluding Remarks from Visiongain
14.2 Recommendations for Market Players
ページTOPに戻る
List of Tables/Graphs
List of Tables
Table 1 Airport Security Market Snapshot, 2023 & 2033 (US$ Million, CAGR %)
Table 2 Airport Security Market Forecast by Region, 2023-2033 (US$ Million, AGR%, CAGR%): “V” Shaped Recovery
Table 3 Airport Security Market Forecast by Region, 2023-2033 (US$ Million, AGR%, CAGR%): “U” Shaped Recovery
Table 4 Airport Security Market Forecast by Region, 2023-2033 (US$ Million, AGR%, CAGR%): “W” Shaped Recovery
Table 5 Airport Security Market Forecast by Region, 2023-2033 (US$ Million, AGR%, CAGR%): “L” Shaped Recovery
Table 6 Airport Security Market Forecast by Application, 2023-2033 (US$ Million, AGR%, CAGR%)
Table 7 Surveillance Segment Market Forecast by Region, 2023-2033 (US$ Million, AGR%, CAGR%)
Table 8 Access Control Segment Market Forecast by Region, 2023-2033 (US$ Million, AGR%, CAGR%)
Table 9 Perimeter Security Segment Market Forecast by Region, 2023-2033 (US$ Million, AGR%, CAGR%)
Table 10 Screening Segment Market Forecast by Region, 2023-2033 (US$ Million, AGR%, CAGR%)
Table 11 Cyber Security Segment Market Forecast by Region, 2023-2033 (US$ Million, AGR%, CAGR%)
Table 12 Others Segment Market Forecast by Region, 2023-2033 (US$ Million, AGR%, CAGR%)
Table 13 Airport Security Market Forecast by System, 2023-2033 (US$ Million, AGR%, CAGR%)
Table 14 Biometric System Segment Market Forecast by Region, 2023-2033 (US$ Million, AGR%, CAGR%)
Table 15 Alert and Cyber Security System Segment Market Forecast by Region, 2023-2033 (US$ Million, AGR%, CAGR%)
Table 16 E-fence and Ground Surveillance Radar System Segment Market Forecast by Region, 2023-2033 (US$ Million, AGR%, CAGR%)
Table 17 E-tag System Segment Market Forecast by Region, 2023-2033 (US$ Million, AGR%, CAGR%)
Table 18 Others Segment Market Forecast by Region, 2023-2033 (US$ Million, AGR%, CAGR%)
Table 19 Airport Security Market Forecast by End User, 2023-2033 (US$ Million, AGR%, CAGR%)
Table 20 Terminal Side Segment Market Forecast by Region, 2023-2033 (US$ Million, AGR%, CAGR%)
Table 21 Air Side Segment Market Forecast by Region, 2023-2033 (US$ Million, AGR%, CAGR%)
Table 22 Naval Side Segment Market Forecast by Region, 2023-2033 (US$ Million, AGR%, CAGR%)
Table 23 Airport Security Market Forecast by Region, 2023-2033 (US$ Million, AGR%, CAGR%)
Table 24 North America Airport Security Market Forecast by Country, 2023-2033 (US$ Million, AGR%, CAGR%)
Table 25 North America Airport Security Market Forecast by Application, 2023-2033 (US$ Million, AGR%, CAGR%)
Table 26 North America Airport Security Market Forecast by System, 2023-2033 (US$ Million, AGR%, CAGR%)
Table 27 North America Airport Security Market Forecast by End User, 2023-2033 (US$ Million, AGR%, CAGR%)
Table 28 U.S. Airport Security Market Forecast, 2023-2033 (US$ Million, AGR%, CAGR%)
Table 29 Canada Airport Security Market Forecast, 2023-2033 (US$ Million, AGR%, CAGR%)
Table 30 Europe Airport Security Market Forecast by Country, 2023-2033 (US$ Million, AGR%, CAGR%)
Table 31 Europe Airport Security Market Forecast by Application, 2023-2033 (US$ Million, AGR%, CAGR%)
Table 32 Europe Airport Security Market Forecast by System, 2023-2033 (US$ Million, AGR%, CAGR%)
Table 33 Europe Airport Security Market Forecast by End User, 2023-2033 (US$ Million, AGR%, CAGR%)
Table 34 Germany Airport Security Market Forecast, 2023-2033 (US$ Million, AGR%, CAGR%)
Table 35 UK Airport Security Market Forecast, 2023-2033 (US$ Million, AGR%, CAGR%)
Table 36 France Airport Security Market Forecast, 2023-2033 (US$ Million, AGR%, CAGR%)
Table 37 Italy Airport Security Market Forecast, 2023-2033 (US$ Million, AGR%, CAGR%)
Table 38 Spain Airport Security Market Forecast, 2023-2033 (US$ Million, AGR%, CAGR%)
Table 39 Rest of Europe Airport Security Market Forecast, 2023-2033 (US$ Million, AGR%, CAGR%)
Table 40 Asia Pacific Airport Security Market Forecast by Country, 2023-2033 (US$ Million, AGR%, CAGR%)
Table 41 Asia Pacific Airport Security Market Forecast by Application, 2023-2033 (US$ Million, AGR%, CAGR%)
Table 42 Asia Pacific Airport Security Market Forecast by System, 2023-2033 (US$ Million, AGR%, CAGR%)
Table 43 Asia Pacific Airport Security Market Forecast by End User, 2023-2033 (US$ Million, AGR%, CAGR%)
Table 44 China Airport Security Market Forecast, 2023-2033 (US$ Million, AGR%, CAGR%)
Table 45 Japan Airport Security Market Forecast, 2023-2033 (US$ Million, AGR%, CAGR%)
Table 46 India Airport Security Market Forecast, 2023-2033 (US$ Million, AGR%, CAGR%)
Table 47 Australia Airport Security Market Forecast, 2023-2033 (US$ Million, AGR%, CAGR%)
Table 48 South Korea Airport Security Market Forecast, 2023-2033 (US$ Million, AGR%, CAGR%)
Table 49 Rest of Asia Pacific Airport Security Market Forecast, 2023-2033 (US$ Million, AGR%, CAGR%)
Table 50 Latin America Airport Security Market Forecast by Country, 2023-2033 (US$ Million, AGR%, CAGR%)
Table 51 Latin America Airport Security Market Forecast by Application, 2023-2033 (US$ Million, AGR%, CAGR%)
Table 52 Latin America Airport Security Market Forecast by System, 2023-2033 (US$ Million, AGR%, CAGR%)
Table 53 Latin America Airport Security Market Forecast by End User, 2023-2033 (US$ Million, AGR%, CAGR%)
Table 54 Brazil Airport Security Market Forecast, 2023-2033 (US$ Million, AGR%, CAGR%)
Table 55 Mexico Airport Security Market Forecast, 2023-2033 (US$ Million, AGR%, CAGR%)
Table 56 Rest of Latin America Airport Security Market Forecast, 2023-2033 (US$ Million, AGR%, CAGR%)
Table 57 MEA Airport Security Market Forecast by Country, 2023-2033 (US$ Million, AGR%, CAGR%)
Table 58 MEA Airport Security Market Forecast by Application, 2023-2033 (US$ Million, AGR%, CAGR%)
Table 59 MEA Airport Security Market Forecast by System, 2023-2033 (US$ Million, AGR%, CAGR%)
Table 60 MEA Airport Security Market Forecast by End User, 2023-2033 (US$ Million, AGR%, CAGR%)
Table 61 GCC Airport Security Market Forecast, 2023-2033 (US$ Million, AGR%, CAGR%)
Table 62 South Africa Airport Security Market Forecast, 2023-2033 (US$ Million, AGR%, CAGR%)
Table 63 Rest of MEA Airport Security Market Forecast, 2023-2033 (US$ Million, AGR%, CAGR%)
Table 64 Strategic Outlook
Table 65 Analogic Corporation: Key Details, (CEO, HQ, Revenue, Founded, No. of Employees, Company Type, Website, Business Segment)
Table 66 Analogic Corporation: Product Benchmarking
Table 67 Analogic Corporation: Strategic Outlook
Table 68 Bruker Corporation: Key Details, (CEO, HQ, Revenue, Founded, No. of Employees, Company Type, Website, Business Segment)
Table 69 Bruker Corporation: Product Benchmarking
Table 70 Bruker Corporation: Strategic Outlook
Table 71 G4S Plc: Key Details, (CEO, HQ, Revenue, Founded, No. of Employees, Company Type, Website, Business Segment)
Table 72 G4S Plc: Product Benchmarking
Table 73 G4S Plc: Strategic Outlook
Table 74 Hitachi, Ltd.: Key Details, (CEO, HQ, Revenue, Founded, No. of Employees, Company Type, Website, Business Segment)
Table 75 Hitachi, Ltd.: Product Benchmarking
Table 76 Hitachi, Ltd.: Strategic Outlook
Table 77 Honeywell International: Key Details, (CEO, HQ, Revenue, Founded, No. of Employees, Company Type, Website, Business Segment)
Table 78 Honeywell International: Product Benchmarking
Table 79 Honeywell International: Strategic Outlook
Table 80 L3Harris Technologies: Key Details, (CEO, HQ, Revenue, Founded, No. of Employees, Company Type, Website, Business Segment)
Table 81 L3Harris Technologies: Product Benchmarking
Table 82 L3Harris Technologies: Strategic Outlook
Table 83 Leidos Holdings Inc.: Key Details, (CEO, HQ, Revenue, Founded, No. of Employees, Company Type, Website, Business Segment)
Table 84 Leidos Holdings Inc.: Product Benchmarking
Table 85 Leidos Holdings Inc.: Strategic Outlook
Table 86 Nuctech Company Ltd: Key Details, (CEO, HQ, Founded, No. of Employees, Company Type, Website, Business Segment)
Table 87 Nuctech Company Ltd: Product Benchmarking
Table 88 Nuctech Company Ltd: Strategic Outlook
Table 89 OSI Systems: Key Details, (CEO, HQ, Revenue, Founded, No. of Employees, Company Type, Website, Business Segment)
Table 90 OSI Systems: Product Benchmarking
Table 91 OSI Systems: Strategic Outlook
Table 92 OT-Morpho (IDEMIA): Key Details, (CEO, HQ, Revenue, Founded, No. of Employees, Company Type, Website, Business Segment)
Table 93 OT-Morpho (IDEMIA): Product Benchmarking
Table 94 OT-Morpho (IDEMIA): Strategic Outlook
Table 95 Securitas AB: Key Details, (CEO, HQ, Revenue, Founded, No. of Employees, Company Type, Website, Business Segment)
Table 96 Securitas AB: Product Benchmarking
Table 97 Securitas AB: Strategic Outlook
Table 98 Siemens AG: Key Details, (CEO, HQ, Revenue, Founded, No. of Employees, Company Type, Website, Business Segment)
Table 99 Siemens AG: Product Benchmarking
Table 100 Siemens AG: Strategic Outlook
Table 101 SITA: Key Details, (CEO, HQ, Founded, No. of Employees, Company Type, Website, Business Segment)
Table 102 SITA: Product Benchmarking
Table 103 SITA: Strategic Outlook
Table 104 Smiths Detection: Key Details, (CEO, HQ, Revenue, Founded, Company Type, Website, Business Segment)
Table 105 Smiths Detection: Product Benchmarking
Table 106 Smiths Detection: Strategic Outlook
Table 107 Thales SA: Key Details, (CEO, HQ, Revenue, Founded, No. of Employees, Company Type, Website, Business Segment)
Table 108 Thales SA: Product Benchmarking
Table 109 Thales SA: Strategic Outlook
List of Figures
Figure 1 Airport Security Market Segmentation
Figure 2 Airport Security Market by Application: Market Attractiveness Index
Figure 3 Airport Security Market by System: Market Attractiveness Index
Figure 4 Airport Security Market by End User: Market Attractiveness Index
Figure 5 Airport Security Market Attractiveness Index by Region
Figure 6 Airport Security Market: Market Dynamics
Figure 7 Airport Security Market by Region, 2023-2033 (US$ Million, AGR %): “V” Shaped Recovery
Figure 8 Airport Security Market by Region, 2023-2033 (US$ Million, AGR %): “U” Shaped Recovery
Figure 9 Airport Security Market by Region, 2023-2033 (US$ Million, AGR %): “W” Shaped Recovery
Figure 10 Airport Security Market by Region, 2023-2033 (US$ Million, AGR %): “L” Shaped Recovery
Figure 11 Airport Security Market: Porter’s Five Forces Analysis
Figure 12 Airport Security Market: PEST Analysis
Figure 13 Airport Security Market by Application: Market Attractiveness Index
Figure 14 Airport Security Market Forecast by Application, 2023-2033 (US$ Million, AGR %)
Figure 15 Airport Security Market Share Forecast by Application, 2023, 2028, 2033 (%)
Figure 16 Surveillance Segment Market Forecast by Region, 2023-2033 (US$ Million, AGR %)
Figure 17 Surveillance Segment Market Share Forecast by Region, 2023 & 2033 (%)
Figure 18 Access Control Segment Market Forecast by Region, 2023-2033 (US$ Million, AGR %)
Figure 19 Access Control Segment Market Share Forecast by Region, 2023 & 2033 (%)
Figure 20 Perimeter Security Segment Market Forecast by Region, 2023-2033 (US$ Million, AGR %)
Figure 21 Perimeter Security Segment Market Share Forecast by Region, 2023 & 2033 (%)
Figure 22 Screening Segment Market Forecast by Region, 2023-2033 (US$ Million, AGR %)
Figure 23 Screening Segment Market Share Forecast by Region, 2023 & 2033 (%)
Figure 24 Cyber Security Segment Market Forecast by Region, 2023-2033 (US$ Million, AGR %)
Figure 25 Cyber Security Segment Market Share Forecast by Region, 2023 & 2033 (%)
Figure 26 Others Segment Market Forecast by Region, 2023-2033 (US$ Million, AGR %)
Figure 27 Others Segment Market Share Forecast by Region, 2023 & 2033 (%)
Figure 28 Airport Security Market by System: Market Attractiveness Index
Figure 29 Airport Security Market Forecast by System, 2023-2033 (US$ Million, AGR %)
Figure 30 Airport Security Market Share Forecast by System, 2023, 2028, 2033 (%)
Figure 31 Biometric System Segment Market Forecast by Region, 2023-2033 (US$ Million, AGR %)
Figure 32 Biometric System Segment Market Share Forecast by Region, 2023 & 2033 (%)
Figure 33 Alert and Cyber Security System Segment Market Forecast by Region, 2023-2033 (US$ Million, AGR %)
Figure 34 Alert and Cyber Security System Segment Market Share Forecast by Region, 2023 & 2033 (%)
Figure 35 E-fence and Ground Surveillance Radar System Segment Market Forecast by Region, 2023-2033 (US$ Million, AGR %)
Figure 36 E-fence and Ground Surveillance Radar System Segment Market Share Forecast by Region, 2023 & 2033 (%)
Figure 37 E-tag System Segment Market Forecast by Region, 2023-2033 (US$ Million, AGR %)
Figure 38 E-tag System Segment Market Share Forecast by Region, 2023 & 2033 (%)
Figure 39 Others Segment Market Forecast by Region, 2023-2033 (US$ Million, AGR %)
Figure 40 Others Segment Market Share Forecast by Region, 2023 & 2033 (%)
Figure 41 Airport Security Market by End User: Market Attractiveness Index
Figure 42 Airport Security Market Forecast by End User, 2023-2033 (US$ Million, AGR %)
Figure 43 Airport Security Market Share Forecast by End User, 2023, 2028, 2033 (%)
Figure 44 Terminal Side Segment Market Forecast by Region, 2023-2033 (US$ Million, AGR %)
Figure 45 Terminal Side Segment Market Share Forecast by Region, 2023 & 2033 (%)
Figure 46 Air Side Segment Market Forecast by Region, 2023-2033 (US$ Million, AGR %)
Figure 47 Air Side Segment Market Share Forecast by Region, 2023 & 2033 (%)
Figure 48 Naval Side Segment Market Forecast by Region, 2023-2033 (US$ Million, AGR %)
Figure 49 Naval Side Segment Market Share Forecast by Region, 2023 & 2033 (%)
Figure 50 Airport Security Market Forecast by Region 2023 and 2033 (Revenue, CAGR%)
Figure 51 Airport Security Market Share Forecast by Region 2023, 2028, 2033 (%)
Figure 52 Airport Security Market by Region, 2023-2033 (US$ Million, AGR %)
Figure 53 North America Airport Security Market Attractiveness Index
Figure 54 North America Airport Security Market by Region, 2023, 2028 & 2033 (US$ Million)
Figure 55 North America Airport Security Market Forecast by Country, 2023-2033 (US$ Million, AGR %)
Figure 56 North America Airport Security Market Share Forecast by Country, 2023 & 2033 (%)
Figure 57 North America Airport Security Market Forecast by Application, 2023-2033 (US$ Million, AGR %)
Figure 58 North America Airport Security Market Share Forecast by Application, 2023 & 2033 (%)
Figure 59 North America Airport Security Market Forecast by System, 2023-2033 (US$ Million, AGR %)
Figure 60 North America Airport Security Market Share Forecast by System, 2023 & 2033 (%)
Figure 61 North America Airport Security Market Forecast by End User, 2023-2033 (US$ Million, AGR %)
Figure 62 North America Airport Security Market Share Forecast by End User, 2023 & 2033 (%)
Figure 63 U.S. Airport Security Market Forecast, 2023-2033 (US$ Million, AGR %)
Figure 64 Canada Airport Security Market Forecast, 2023-2033 (US$ Million, AGR %)
Figure 65 Europe Airport Security Market Attractiveness Index
Figure 66 Europe Airport Security Market by Region, 2023, 2028 & 2033 (US$ Million)
Figure 67 Europe Airport Security Market Forecast by Country, 2023-2033 (US$ Million, AGR %)
Figure 68 Europe Airport Security Market Share Forecast by Country, 2023 & 2033 (%)
Figure 69 Europe Airport Security Market Forecast by Application, 2023-2033 (US$ Million, AGR %)
Figure 70 Europe Airport Security Market Share Forecast by Application, 2023 & 2033 (%)
Figure 71 Europe Airport Security Market Forecast by System, 2023-2033 (US$ Million, AGR %)
Figure 72 Europe Airport Security Market Share Forecast by System, 2023 & 2033 (%)
Figure 73 Europe Airport Security Market Forecast by End User, 2023-2033 (US$ Million, AGR %)
Figure 74 Europe Airport Security Market Share Forecast by End User, 2023 & 2033 (%)
Figure 75 Germany Airport Security Market Forecast, 2023-2033 (US$ Million, AGR %)
Figure 76 UK Airport Security Market Forecast, 2023-2033 (US$ Million, AGR %)
Figure 77 France Airport Security Market Forecast, 2023-2033 (US$ Million, AGR %)
Figure 78 Italy Airport Security Market Forecast, 2023-2033 (US$ Million, AGR %)
Figure 79 Spain Airport Security Market Forecast, 2023-2033 (US$ Million, AGR %)
Figure 80 Rest of Europe Airport Security Market Forecast, 2023-2033 (US$ Million, AGR %)
Figure 81 Asia Pacific Airport Security Market Attractiveness Index
Figure 82 Asia Pacific Airport Security Market by Region, 2023, 2028 & 2033 (US$ Million)
Figure 83 Asia Pacific Airport Security Market Forecast by Country, 2023-2033 (US$ Million, AGR %)
Figure 84 Asia Pacific Airport Security Market Share Forecast by Country, 2023 & 2033 (%)
Figure 85 Asia Pacific Airport Security Market Forecast by Application, 2023-2033 (US$ Million, AGR %)
Figure 86 Asia Pacific Airport Security Market Share Forecast by Application, 2023 & 2033 (%)
Figure 87 Asia Pacific Airport Security Market Forecast by System, 2023-2033 (US$ Million, AGR %)
Figure 88 Asia Pacific Airport Security Market Share Forecast by System, 2023 & 2033 (%)
Figure 89 Asia Pacific Airport Security Market Forecast by End User, 2023-2033 (US$ Million, AGR %)
Figure 90 Asia Pacific Airport Security Market Share Forecast by End User, 2023 & 2033 (%)
Figure 91 China Airport Security Market Forecast, 2023-2033 (US$ Million, AGR %)
Figure 92 Japan Airport Security Market Forecast, 2023-2033 (US$ Million, AGR %)
Figure 93 India Airport Security Market Forecast, 2023-2033 (US$ Million, AGR %)
Figure 94 Australia Airport Security Market Forecast, 2023-2033 (US$ Million, AGR %)
Figure 95 South Korea Airport Security Market Forecast, 2023-2033 (US$ Million, AGR %)
Figure 96 Rest of Asia Pacific Airport Security Market Forecast, 2023-2033 (US$ Million, AGR %)
Figure 97 Latin America Airport Security Market Attractiveness Index
Figure 98 Latin America Airport Security Market by Region, 2023, 2028 & 2033 (US$ Million)
Figure 99 Latin America Airport Security Market Forecast by Country, 2023-2033 (US$ Million, AGR %)
Figure 100 Latin America Airport Security Market Share Forecast by Country, 2023 & 2033 (%)
Figure 101 Latin America Airport Security Market Forecast by Application, 2023-2033 (US$ Million, AGR %)
Figure 102 Latin America Pacific Airport Security Market Share Forecast by Application, 2023 & 2033 (%)
Figure 103 Latin America Airport Security Market Forecast by System, 2023-2033 (US$ Million, AGR %)
Figure 104 Latin America Airport Security Market Share Forecast by System, 2023 & 2033 (%)
Figure 105 Latin America Airport Security Market Forecast by End User, 2023-2033 (US$ Million, AGR %)
Figure 106 Latin America Airport Security Market Share Forecast by End User, 2023 & 2033 (%)
Figure 107 Brazil Airport Security Market Forecast, 2023-2033 (US$ Million, AGR %)
Figure 108 Mexico Airport Security Market Forecast, 2023-2033 (US$ Million, AGR %)
Figure 109 Rest of Latin America Airport Security Market Forecast, 2023-2033 (US$ Million, AGR %)
Figure 110 MEA Airport Security Market Attractiveness Index
Figure 111 MEA Airport Security Market by Region, 2023, 2028 & 2033 (US$ Million)
Figure 112 MEA Airport Security Market Forecast by Country, 2023-2033 (US$ Million, AGR %)
Figure 113 MEA Airport Security Market Share Forecast by Country, 2023 & 2033 (%)
Figure 114 MEA Airport Security Market Forecast by Application, 2023-2033 (US$ Million, AGR %)
Figure 115 MEA Pacific Airport Security Market Share Forecast by Application, 2023 & 2033 (%)
Figure 116 MEA Airport Security Market Forecast by System, 2023-2033 (US$ Million, AGR %)
Figure 117 MEA Airport Security Market Share Forecast by System, 2023 & 2033 (%)
Figure 118 MEA Airport Security Market Forecast by End User, 2023-2033 (US$ Million, AGR %)
Figure 119 MEA Airport Security Market Share Forecast by End User, 2023 & 2033 (%)
Figure 120 GCC Airport Security Market Forecast, 2023-2033 (US$ Million, AGR %)
Figure 121 South Africa Airport Security Market Forecast, 2023-2033 (US$ Million, AGR %)
Figure 122 Rest of MEA Airport Security Market Forecast, 2023-2033 (US$ Million, AGR %)
Figure 123 Airport Security Market: Company Share/Ranking, 2022
Figure 124 Bruker Corporation: Net Revenue, 2017-2022 (US$ Million, AGR%)
Figure 125 Bruker Corporation: R&D, 2017-2022 (US$ Million, AGR%)
Figure 126 Bruker Corporation: Regional Market Shares, 2022
Figure 127 G4S Plc: Net Revenue, 2017-2021 (US$ Million, AGR%)
Figure 128 G4S Plc: Regional Market Shares, 2021
Figure 129 Hitachi, Ltd.: Net Revenue, 2017-2021 (US$ Million, AGR%)
Figure 130 Hitachi, Ltd.: Regional Market Shares, 2021
Figure 131 Honeywell International: Net Revenue, 2017-2022 (US$ Million, AGR%)
Figure 132 Honeywell International: Regional Market Shares, 2022
Figure 133 L3Harris Technologies: Net Revenue, 2017-2022 (US$ Million, AGR%)
Figure 134 L3Harris Technologies: Regional Market Shares, 2022
Figure 135 Leidos Holdings Inc.: Net Revenue, 2017-2022 (US$ Million, AGR%)
Figure 136 Leidos Holdings, Inc.: R&D, 2017-2022 (US$ Million, AGR%)
Figure 137 Leidos Holdings Inc.: Regional Market Shares, 2022
Figure 138 OSI Systems: Net Revenue, 2017-2022 (US$ Million, AGR%)
Figure 139 OSI Systems: R&D, 2017-2022 (US$ Million, AGR%)
Figure 140 OSI Systems: Regional Market Shares, 2022
Figure 141 Securitas AB: Net Revenue, 2017-2022 (US$ Million, AGR%)
Figure 142 Securitas AB: Regional Market Shares, 2022
Figure 143 Siemens AG: Net Revenue, 2017-2022 (US$ Million, AGR%)
Figure 144 Siemens AG: Regional Market Shares, 2022
Figure 145 Smiths Detection: Net Revenue, 2017-2022 (US$ Million, AGR%)
Figure 146 Thales SA: Net Revenue, 2017-2022 (US$ Million, AGR%)
Figure 147 Thales SA: R&D, 2017-2022 (US$ Million, AGR%)
Figure 148 Thales SA: Regional Market Shares, 2022
ページTOPに戻る
よくあるご質問
Visiongain社はどのような調査会社ですか?
英国の調査会社ヴィジョンゲイン社(Visiongain)は、通信とエネルギーのほか、自動車や化学・医薬品、金属など、広範な市場を対象に調査を行っています。自動車市場については、市場全般に関する調査のほ... もっと見る
調査レポートの納品までの日数はどの程度ですか?
在庫のあるものは速納となりますが、平均的には 3-4日と見て下さい。
但し、一部の調査レポートでは、発注を受けた段階で内容更新をして納品をする場合もあります。
発注をする前のお問合せをお願いします。
注文の手続きはどのようになっていますか?
1)お客様からの御問い合わせをいただきます。
2)見積書やサンプルの提示をいたします。
3)お客様指定、もしくは弊社の発注書をメール添付にて発送してください。
4)データリソース社からレポート発行元の調査会社へ納品手配します。
5) 調査会社からお客様へ納品されます。最近は、pdfにてのメール納品が大半です。
お支払方法の方法はどのようになっていますか?
納品と同時にデータリソース社よりお客様へ請求書(必要に応じて納品書も)を発送いたします。
お客様よりデータリソース社へ(通常は円払い)の御振り込みをお願いします。
請求書は、納品日の日付で発行しますので、翌月最終営業日までの当社指定口座への振込みをお願いします。振込み手数料は御社負担にてお願いします。
お客様の御支払い条件が60日以上の場合は御相談ください。
尚、初めてのお取引先や個人の場合、前払いをお願いすることもあります。ご了承のほど、お願いします。
データリソース社はどのような会社ですか?
当社は、世界各国の主要調査会社・レポート出版社と提携し、世界各国の市場調査レポートや技術動向レポートなどを日本国内の企業・公官庁及び教育研究機関に提供しております。
世界各国の「市場・技術・法規制などの」実情を調査・収集される時には、データリソース社にご相談ください。
お客様の御要望にあったデータや情報を抽出する為のレポート紹介や調査のアドバイスも致します。
|
|


