世界各国のリアルタイムなデータ・インテリジェンスで皆様をお手伝い
モバイルPOSハードウェアベンダーの市場シェアMobile POS Hardware Vendor Market Share 製品概要 発行日 2021年9月1日 地理 世界または地域別 フォーマット マイクロソフト・エクセル ライセンス エンタープライズ-ワイド内部-フェアユースライセン... もっと見る
※その他の価格の詳細は、データリソースまでお問合せください。 
サマリー製品概要
発行日 2021年9月1日 アソシエイトのモバイル化は、店舗のインターネット化が進んだ後、最も急速に進んでいるトレンドと言えます。今回の調査では、特にPOS機能に使用されているモバイル機器を対象としています。この市場の規模はどのくらいの速さで成長しているのか?どのベンダーが勝っているのか?どのような画面形式でソフトウェアを書くべきか?この調査でわかります。本製品は、アップルをはじめとするベンダーの出荷台数やインストールベースを、四半期および年間ベースで提供します。 Zebra、Samsung、HP、Lenovo、Dell、HTC、Motion Computing、NECなど、小売業で爆発的に普及しているモバイル機器をPOSに利用するための資料です。また、画面サイズのフォーマットやオペレーティング・プラットフォームに関するデータも含まれています。当社では、小売店向けに強化されたデバイスと消費者向けのデバイスを区別しています。これは非常に多くのデータを必要とする製品であり、セグメント別、地域別、OS別、画面サイズ別の出荷数まで詳細に調べることができます。また、世界/地域別にベンダーごとに集計しただけのデータを購入することもできます。本製品には、ベンダー別の過去のデータと今後6四半期の予測が含まれています。 以下の「製品ハイライト」では、利用可能なデータの詳細について説明しています。プレビュー」タブでは、利用可能なデータの種類を図解しています。 これは非常にデータの多い研究です。 また、セグメント別、地域別、OS別、プロセッサタイプ別の出荷台数など、より詳細な情報を得ることができます。また、全世界のベンダーごとに集計したデータや、地域ごとに集計したデータを購入することもできます。また、ベンダー別に2年前までの過去のデータと今後6四半期までの予測も含まれています。 これらのデータは、トレンドの質的な背景を示す「モバイルPOS調査」と合わせてご利用いただくことを想定しています。この調査では、トレンド、参入障壁、成長の仮定などを議論しています。ここでのデータは、純粋に定量的なものです。データの正確性を高めるために、データポイントの共有にご協力いただいたベンダーの皆様に感謝いたします。 ハイトライト 4つの地域のデータがあります。
北米(アメリカ、カナダ 以下の小売セグメントごとに、上位10~20社のベンダーのデータを提供しています。
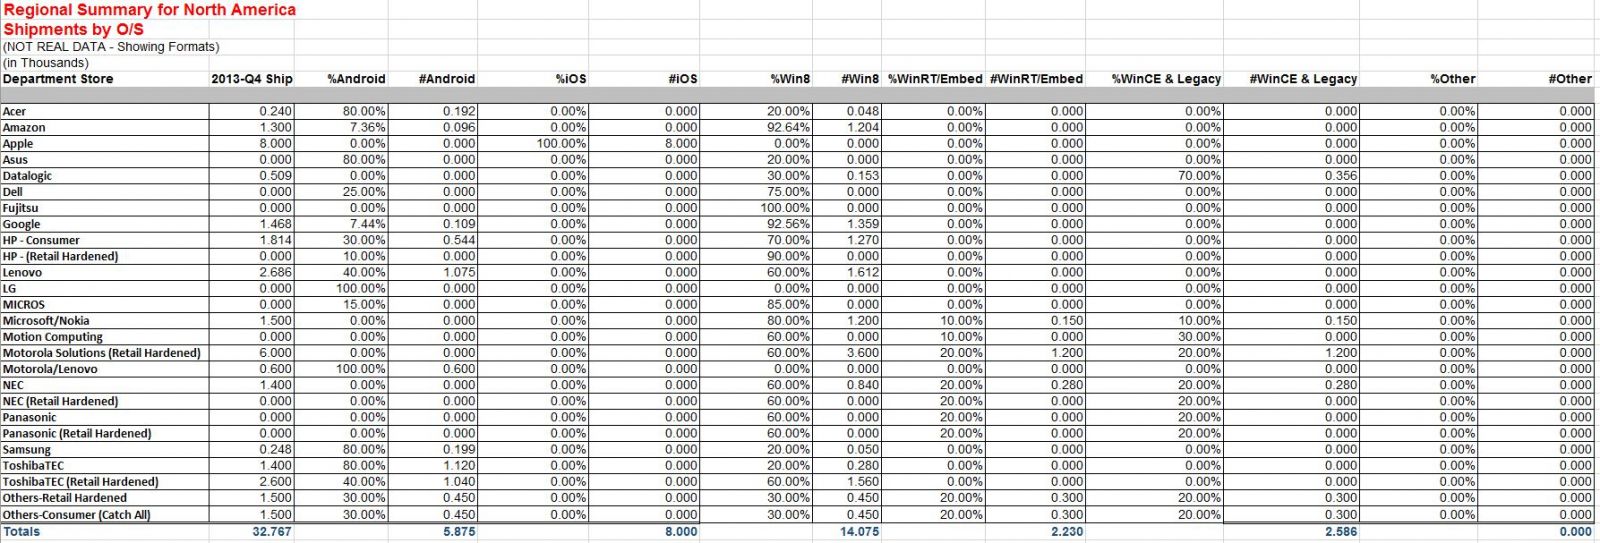
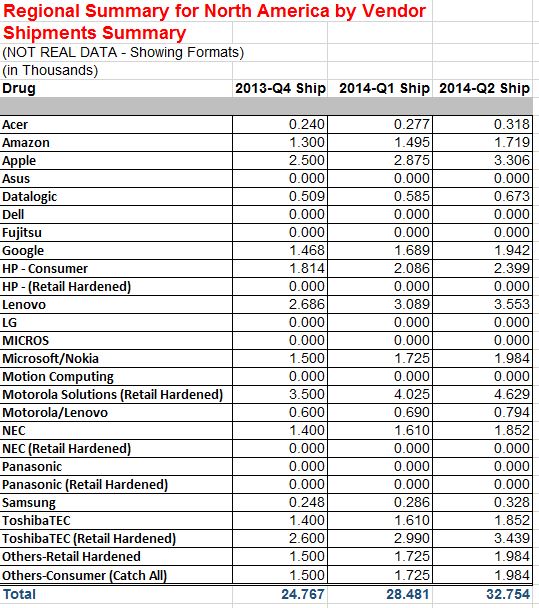
食品/食料品(Kroger, Safeway, Trader Joe's, Wakerfern, Tesco,) 各地域について、以下の詳細を毎年または四半期ごとに提供していきます。 デバイス・フォーマット別の総出荷台数とインストール・ベース - は、セグメント別、ベンダー別のロールアップで、前年を含み、その後6四半期分の予測を行います。出荷台数とインストールベースを含みます。これは非常に詳細なシートで、以下のデバイスサイズが含まれます。 8.9″ ベンダー別の地域別OS出荷数/インストールベース - これはDevice Format/Sizeと同じ形式ですが、プロセッサの代わりにベンダー別のOSをセグメント別に見ていきます。以下のOSが取り上げられています。
アンドロイド 本調査で名前を追跡することになるベンダーは以下の通りです:
エイサー 対象となるデバイスの種類は、iPhone、iPad、iPod、Kindle、およびタブレットを含みます。それぞれの名称は挙げませんが、ベンダーとフォームファクターを組み合わせることで、画面サイズに基づいてそれらのデバイスを網羅します。 プレビュー
よくあるご質問 モバイルPOSとはどのようなものでしょうか? 携帯電話、ファブレット、タブレットなど、さまざまな大きさのモバイルデバイスがあると思います。このサービスは、アソシエイトが取引を処理するために使用するデバイスを対象としています。これは、クレジット/デビットリーダーの有無にかかわらず、また、コンシューマーグレードのデバイスであるか、小売店向けに強化されたものであるかを問いません。トランザクションを処理することを目的としているものであれば、カウントされます。明確にしておきますが、これは定義された伝統的な小売分野に限定されます。慈善団体、修理業者、配達人、ガレージセールなど、個人がドングルを追加してクレジットカードをスワイプするようなものはカウントしていません。従来の小売業以外の取引や、POS以外のモバイル機器の情報については、こちらまでお問い合わせください。 どのような小売市場セグメント(バーティカル)に対応していますか? 当社の調査フォーマットは、以下の8つの小売市場セグメントの詳細な分析に基づいています。
Food/Supermarkets 北米ではさらに、専門店を「専門カテゴリーキラー」と「専門その他」に、ホスピタリティを「ファストフード」、「バー・レストラン」、「宿泊施設」、「カジノ・クルーズ」、「エンタテインメント」に分けています。娯楽:テーマパーク、スタジアム、博物館、その他。 含まれるサイズ/フォーマットはどのように定義されていますか? これが流動的なカテゴリーであることは間違いありません。私たちは、主要なお客様に、データの表示サイズを定義していただきました。また、新しいフォーマットが導入された場合は、そのフォーマットが普及し、シェアが拡大した時点で追加することを検討しています。まずは、これらに焦点を当てていきます。 10″ OSをどのように分類していますか? OSに関しては、以下のような点に注目しています。
アンドロイド 繰り返しになりますが、これは流動的なカテゴリーであり、市場の変化や他の製品の人気に応じて調整していきます。 1つのリージョンやいくつかのセグメントだけを購入することはできますか? はい、一つの地域の一つのセグメントだけを購入することもできますし、OSやフォーマット/サイズの情報を含む全世界のすべてのセグメントを含むモデル全体を購入することもできます。 どのようなベンダーが含まれていますか?
エイサー 本報告書では、ラボにあるユニットはカウントせず、パイロットまたはロールアウト中のユニットのみをカウントしています。 価格
購入者は様々なフォーマットでデータを購入することができます。 単一のリージョンは、1回4,000ドル、または6,000ドル(四半期ごとのアップデート付き)で購入できます。 使用可能なライセンス エンタープライズライセンス - 組織内および完全子会社内の誰もが研究にアクセスし、内部で共有することを可能にするライセンス。 IHLグループライセンスおよびフェアユース契約 IHLグループの一般に公開されている研究は、すべて電子ライセンスであり、購買組織および完全子会社内で自由に共有することができます。ただし、IHLグループの許可なく、パートナーや購買企業以外の人と共有しないようお願いします。このライセンスは、ジョイントベンチャーなどの提携関係には適用されません。完全子会社以外の関係であれば、双方がライセンスを必要とします。 現実的には、次のようなことを意味します。 1.購買会社は、国際機関が購買会社の完全子会社である限り、世界中のデータや研究を社内で使用することができます。 2.このデータや研究内容の全部または一部を、IHLグループの書面による明確な承認なしに、パートナーや顧客に配布することはできません。 3.購買会社は、顧客へのプレゼンテーションにおいて、特定のチャートなど、データの構成要素を引用することができます(限定使用)。ただし、これは構成要素のパーセンテージに限られ、個々のユニット情報は含まれません。ユニットデータは、IHLグループの書面による明示的な承認なしに、外部で共有することはできません。プレゼンテーションの中で本データを使用する場合には、本データに関するIHLグループのクレジットを明記してください。 4.購買企業は、IHLグループの書面による承認を得た上で、定性引用符を印刷物に記載することができます。 5.書面による承認を必要とするすべてのリクエストは、ihl(at)ihlservices.comに提出され、1営業日以内に審査されます。

SummaryこのレポートはモバイルPOSハードウェアベンダー市場を調査し、市場規模、成長要因、世界の技術に関する分析・予測結果を提供しています。また、世界/地域別にベンダーごとに集計したデータも提供しています。 Product Overview
Date of publication September 1, 2021 The move to mobile for associates is the single fastest adopting trend we have seen since the rush to get stores Internet-enabled. This research looks specifically at those mobile devices being used for POS functions. How big is this market? How fast is it growing? Which vendors are winning? What screen format should you write the software for? This research will tell you. This product provides shipments and installed base on a quarterly and annual basis for vendors such as Apple, Zebra, Samsung, HP, Lenovo, Dell, HTC, Motion Computing, NEC and many others for use of mobile devices for POS, an area that is exploding in retail. It includes data on screen size formats and operating platforms. We distinguish between retail hardened devices and consumer grade devices. This is a very data intensive product and can go as deep as shipments by segment by region by operating system or screen size. Or the data can be purchased simply in aggregate by vendor worldwide/region. It includes historical data and projections forward for the next 6 quarters by vendor. Below in the Product Highlights section we get into the details of the data available. The Preview tab gives you some pictorial examples of the types of data available. This is very data intensive research and can go as deep as shipments by segment by region by operating system or processor-type. The data can also be purchased simply in aggregate by vendor worldwide or by individual region. Included are historical data back 2 years and projections forward for the next 6 quarters by vendor. These data are meant to be used in conjunction with the Mobile POS Study which provides the qualitative background of the trends. It is in this study where we discuss trends, barriers to entry, and growth assumptions. The data here is purely quantitative in nature. We are thankful to the vendors who participate in sharing data points to make this as accurate as possible. Hightlights Data is available for 4 regions:
North America (US and Canada) For each segment we provide data for the top 10-20 vendors per the following retail segments:
Food/Grocery (Kroger, Safeway, Trader Joe’s, Wakerfern, Tesco,) For each region, we will provide the following detail either annually or quarterly: Total Shipments and Installed Base by Device Format – this is a rollup by segment and by vendor and will include the previous year, then forecast for next 6 quarters. Includes shipments and installed base. This will be a very detailed sheet and will include the following Device Sizes: 8.9″ Regional OS Shipments/Installed Base by Vendor – This is the same format as Device Format/Size, but instead of the processors we will look at the operating systems by vendor by segment. The following operating systems are addressed.
Android Vendors that will be tracked in this research by name are the following:
Acer Types of devices included will be inclusive of iPhones, iPads, iPods, Kindles, and tablets. We will not name the names of each, but by combining vendor and form factor it will be inclusive of those devices based on screen size. Preview
FAQS What do you define as Mobile POS? There are no doubt many mobile devices ranging from phones to phablets to tablets of all sizes. This specific service is for those devices being used by associates to process a transaction. This can be with or without credit/debit readers, or it could be a consumer grade device or retail hardened. If it is purposed as a way to take transactions, we count it. To be clear, this is limited to the traditional retail segments as defined. We are not counting charities, repairmen, delivery men or garage sales where individuals add a dongle and swipe a credit card. For non-traditional retail for transactions, or mobile device information beyond POS, contact us for more information. What retail market segments (verticals) do you address? Our format for the study is based on detailed analysis of the following 8 retail market segments:
Food/Supermarkets For North America we further segment Specialty Stores into Specialty Category Killers and Specialty Other, and Hospitality into Fast Food, Bar/Restaurant, Lodging, Casinos/Cruises, and Entertainment: Theme Parks, Stadiums, Museums, others. How do you define the sizes/formats involved included? No doubt this is a fluid category. We looked to our core customers to help define the sizes they would like to see the data. If there is a new format that is introduced, we will consider adding that in as it gains traction and share. To start we will focus on these. 10″ How do you categorize operating systems? With regard to operating systems, our focus is on the following.
Android Once again this is a fluid category and as the market changes and others gain traction we will adjust. Can I buy just one region or a few segments? Yes, you can purchase as little as one segment in one region or the entire model with all segments worldwide including the OS and format/size information. What Vendors are Included?
Acer For the purposes of this report we do not count units that are in labs; we only count those in pilot or in rollout. Pricing
Buyers can buy the data in a variety of formats. Single regions can be purchased for $4,000 one time or $6,000 with quarterly updates. Licenses Available Enterprise License – a license that allows for the research to be accessed and shared internally with anyone else within the organization and wholly owned subsidiaries. IHL Group License and Fair Use Agreement All of IHL Group’s generally available research are electronic licenses and can be shared freely within the purchasing organization and wholly owned subsidiaries. We only ask that this information not be shared with partners or others outside the purchasing company without authorization from IHL Group. The license does not extend to joint ventures or other partnerships. If the relationship is not a wholly-owned subsidiary, then both parties would need a license. Practically, this implies the following: 1. The purchasing company can use the data and research worldwide internally as long as the international organizations are wholly owned subsidiaries of the purchasing company. 2. The data or any research cannot be distributed in whole or in part to partners or customers without express written approval from IHL Group. 3. The purchasing company may quote components of the data (limited use) in presentations to customers such as specific charts. This is limited to percentage components, not individual unit information. Unit data cannot be shared externally without express written approval from IHL Group. All references to the data in presentations should include credit to IHL Group for the data. 4. The purchasing company can reference qualitative quotes in printed material with written approval from IHL Group. 5. All requests requiring written approval should be submitted to ihl(at)ihlservices.com and will be reviewed within one business day.
ご注文は、お電話またはWEBから承ります。お見積もりの作成もお気軽にご相談ください。本レポートと同分野(移動通信)の最新刊レポート
IHL Group社の移動通信分野での最新刊レポート本レポートと同じKEY WORD(mobile)の最新刊レポート
よくあるご質問IHL Group社はどのような調査会社ですか?IHLグループ (IHL Group) は、米国テネシー州に本社をおき、世界の小売業とサービス業向けのIT技術を専門に調査しています。 もっと見る 調査レポートの納品までの日数はどの程度ですか?在庫のあるものは速納となりますが、平均的には 3-4日と見て下さい。
注文の手続きはどのようになっていますか?1)お客様からの御問い合わせをいただきます。
お支払方法の方法はどのようになっていますか?納品と同時にデータリソース社よりお客様へ請求書(必要に応じて納品書も)を発送いたします。
データリソース社はどのような会社ですか?当社は、世界各国の主要調査会社・レポート出版社と提携し、世界各国の市場調査レポートや技術動向レポートなどを日本国内の企業・公官庁及び教育研究機関に提供しております。
|
詳細検索
2025/04/25 10:26 144.11 円 164.02 円 194.52 円 |
.jpg)