世界各国のリアルタイムなデータ・インテリジェンスで皆様をお手伝い


Flexible, Printed OLED Displays 2020-2030: Forecasts, Markets, Technologiesフレキシブル、プリンテッドOLEDディスプレイ 2020-2030:予測、市場、技術:エリアごとの10年予測と過去のデータと、8市場でのガラス、フレキシブルとフォルダブル基板向けのOLEDディスプレイ このレポートはフレキシブル、プリンテッドOLEDディスプレイ市場を調査し、用途やディスプレイタイプ別に市場を分析、予測しています。 主な掲載内容 用途別市... もっと見る
出版社
IDTechEx
アイディーテックエックス 出版年月
2019年10月1日
価格
お問い合わせください
ライセンス・価格情報/注文方法はこちら 納期
お問合わせください
ページ数
315
言語
英語
※価格はデータリソースまでお問い合わせください。
Summary
このレポートはフレキシブル、プリンテッドOLEDディスプレイ市場を調査し、用途やディスプレイタイプ別に市場を分析、予測しています。
主な掲載内容
用途別市場予測
フォーム別市場予測
Report Details
This report provides a comprehensive assessment of OLED display technologies and markets with detailed segmentation across 8 displays uses with data broken down by area, substrate type (glass, plastic, foldable substrate) and value. Current and emerging technology options are evaluated and other flexible display technologies, including quantum dot displays and electrophoretic displays are covered.
Analysis and Forecasts of OLED Markets to 2030
Detailed trends, supplier information, historic data and ten year market forecasts are provided on a global basis for the following applications of OLED displays:
• Cellphones
• Tablet and Computers
• TV
• Automotive
• Wearable
• Industrial and Professional Equipment
• MICRO OLED
• Other: Gaming Consoles, Cameras, Appliances, Other Consumer Electronics
OLED Display Forecasts 2017-2030 by Value $ Billions
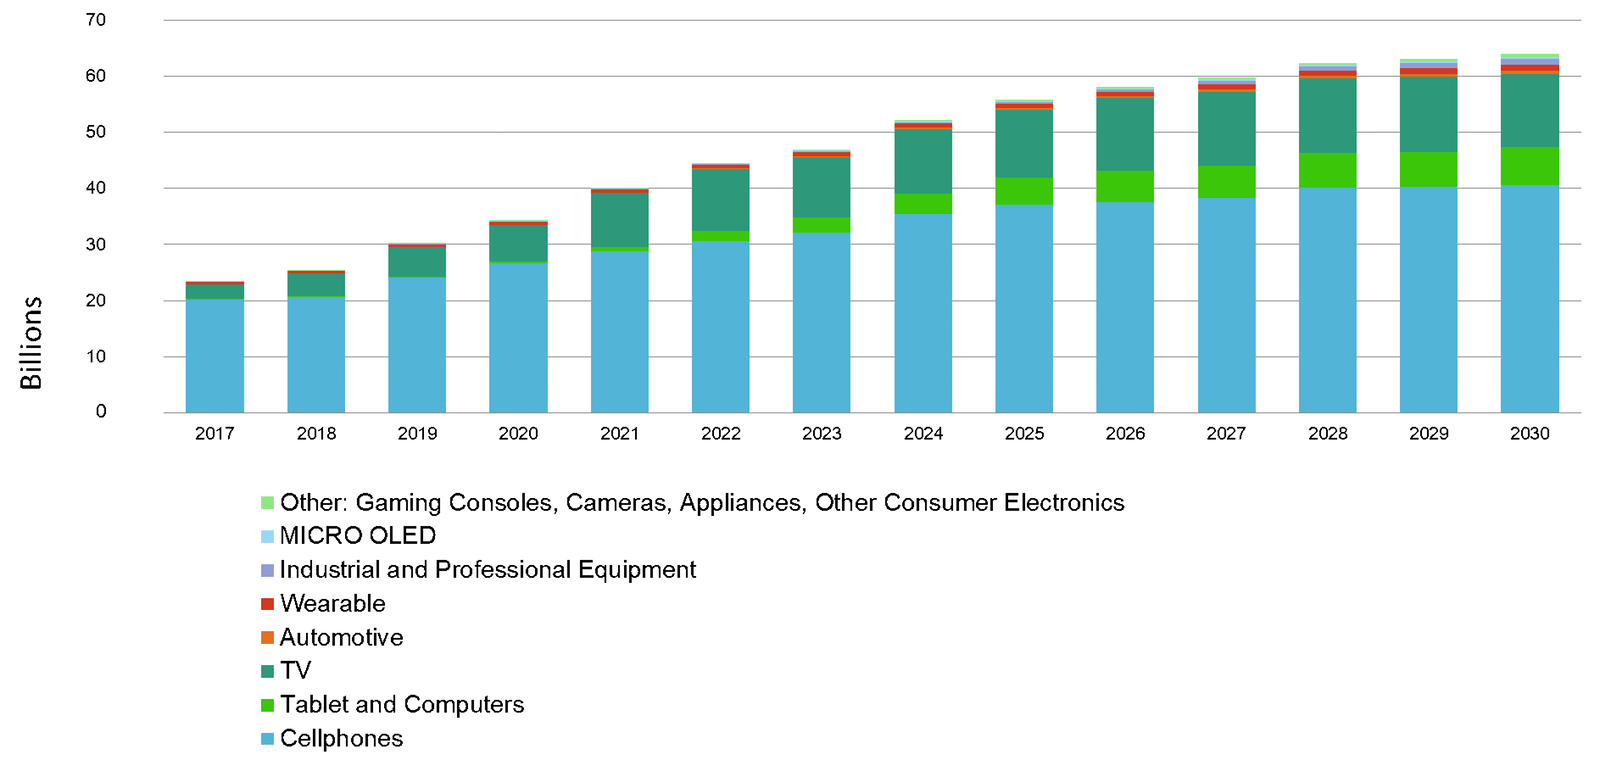
For each of the above, the market size is provided for the years 2017-2030 in addition to total display area in sq meters and value. Additionally, data is broken out by form factor for the following categories:
• Glass based OLED displays
• Flexible / Rigid plastic based OLED displays
• Flexible / Foldable OLED displays
Change in form factor of OLED Displays 2020-2030
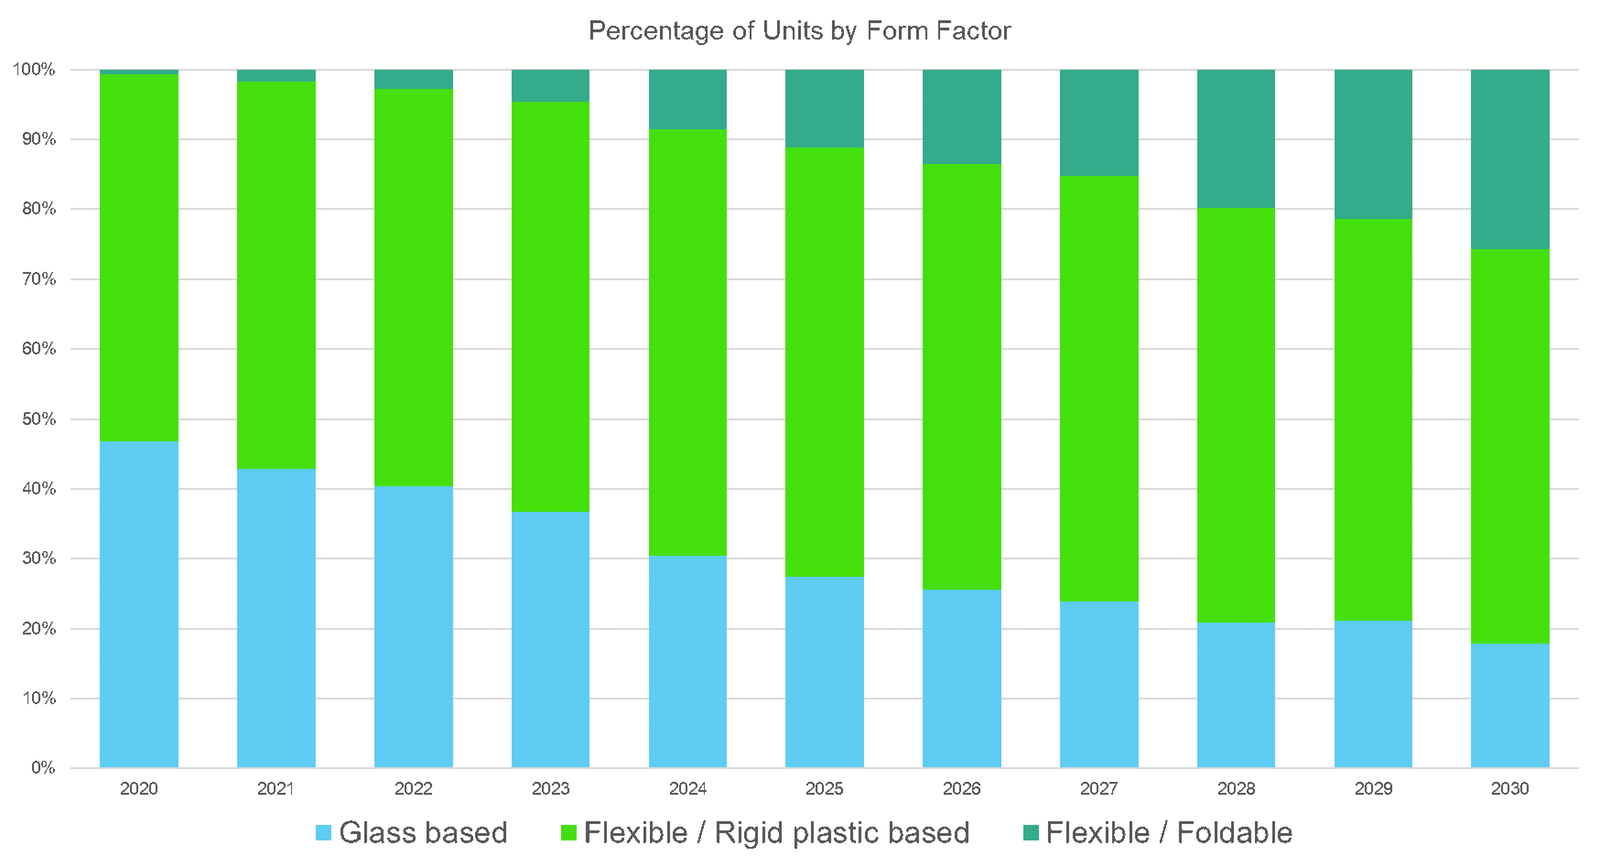
Data is provided for each of the eight application sectors.
OLED displays in the automotive sector, by substrate type

The data and forecasts provided in the report are the result of extensive research including interviews with key providers of OLED materials, manufacturing equipment, panel makers and OEMs. For each of the applications above IDTechEx provides detailed assessments of the markets including the technology requirements, technology roadmap and the impact of competitive technologies, which all feed in to our forecasting model.
Growing Industry but Underlying Technology is Changing
In 2020, IDTechEx expect that the OLED display business will be $34.3 Billion, up from $30.3 Billion in 2019. There has been significant investment in OLED display manufacture from panel makers mainly based in China, Korea, Japan and Taiwan. The investment is coming from the need to differentiate products with better screens and new form factors, with plastic based OLEDs being the norm (in rigid format) leading to foldable displays, which were a false start in 2019 but will be rapidly improved.
2018-2019 OLED displays by area and value
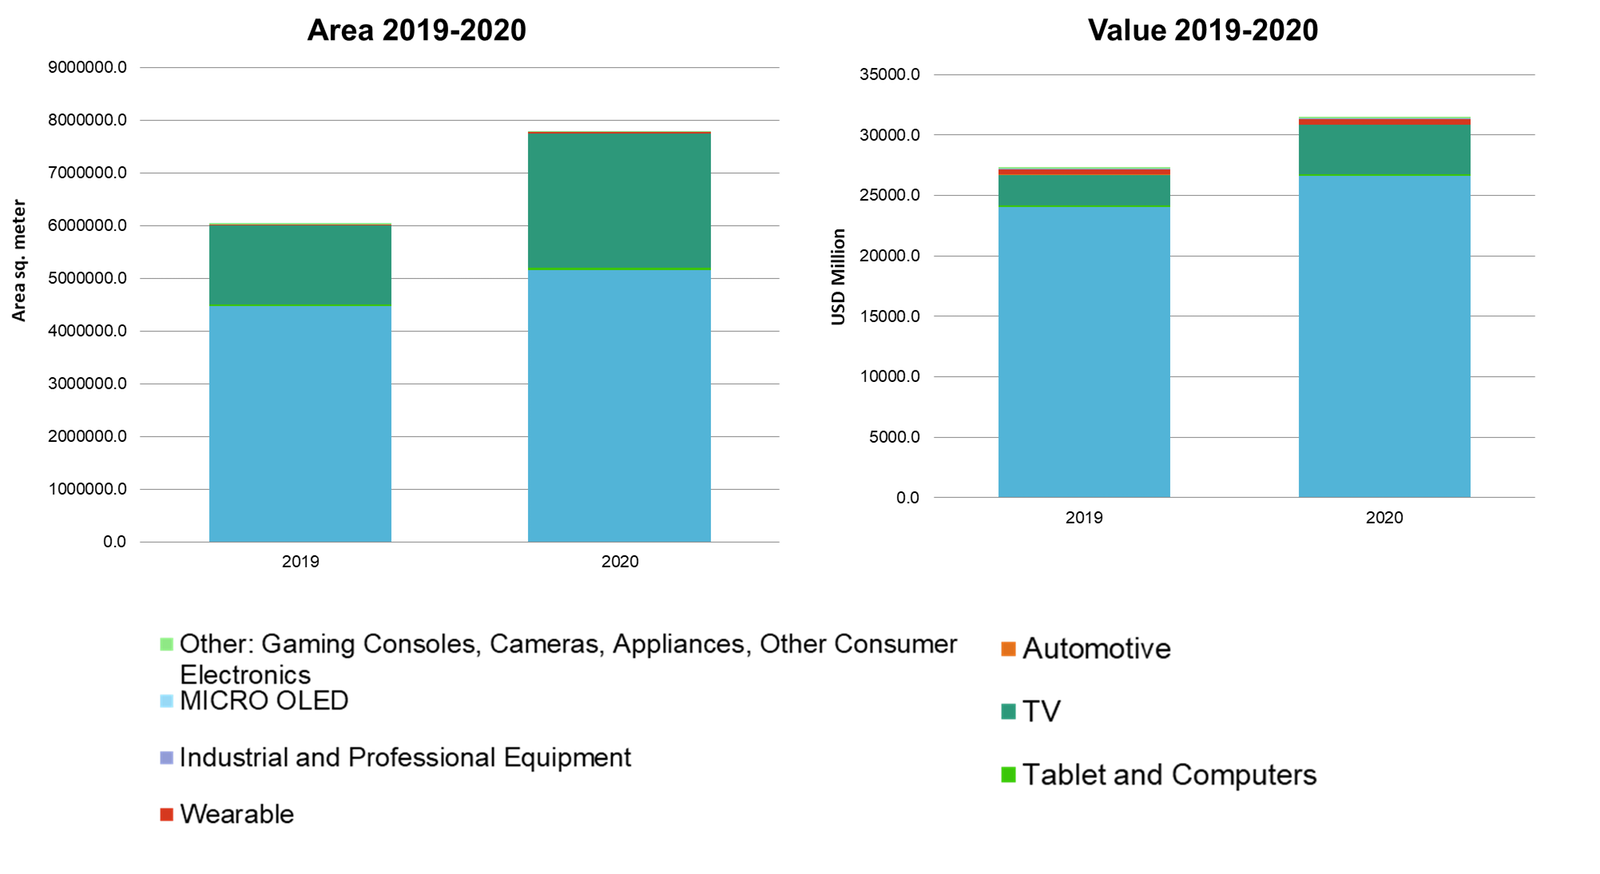
OLEDs for cellphones dominate the OLED sector, comprising of 78% of the OLED market revenue in 2020. The second largest sector are OLED TVs which are 17% of the total market by revenue in 2020. Despite being 17% of the revenue, OLED TVs are 43% of the OLED market by area of display. The third largest OLED application is wearables, which is 2% of the total OLED display market value and 0.3% by area in 2020. The thinness, flexibility and appearance of the display are desirable in may wearable applications versus LCDs.
Historic data from 2017 is provided as a reference in addition to forecasts to 2030.
OLED Technologies Appraised - Processes, Unmet Needs, Roadmaps
In separate chapters, the report assesses each of the main layers of OLED displays including substrates, thin film transistors (TFTs), materials, barrier layers, transparent conductive film and manufacturing processes.
Options for each are assessed and compared, identifying which are being used by which application. Key players and their progress are identified.
The technology assessment also includes matching the technology against the market need. For example, the impact of the Rec.2020 digital standard for next generation ultra HD displays, to the roadmap from glass based displays to foldable displays, to the progress with printed displays and how the materials and manufacturing processes used are changing to enable that.
Latest Activities of OLED Companies
The latest activities of OLED companies are covered, including their state-of-the-art capability, technology and, where applicable, OLED manufacturing capacity. OLED panel makers/display providers covered include Samsung, LG Display, AUO, Sony, JOLED, BOE, CSOT, EverDisplay (EDO), Tianma, Visionox, Skyworth and many more, in addition to material companies and equipment providers.
Printed OLED Displays
In addition to assessing trends and progress across each key material layers, including barrier films, thin film transistors, touch layer technologies, optical medium, the report also looks at manufacturing advances including the progress and outlook for printed OLED displays, which are are separately forecast in the report.

Quantum Dot Displays
In assessing the display industry the report also covers the advancement of Quantum Dot Displays in different guises of
• Edge Optic
• Film Type
• Color Filter
• On Chip
• Emissive
Each of these options are assessed with the outlook for versus OLED displays for different market types. Ten year forecasts are ultimate provided showing the share of the market of these different technology types.
Other Flexible Displays & lighting
The report also assesses other flexible display and lighting types, including for each the players, technologies, commercial success and applications. Technologies covered include
• Electrophoretic displays
• Flexible LCD displays
• Electrowetting displays
• AC electroluminescent displays
• Thermochromic displays
• Electrochromic displays
• OLED lighting
• Flexible LED lighting
Complete assessment of current and emerging flexible display technologies and markets
IDTechEx has been tracking the display industry since 2001. This report gives a detailed, impartial and realistic appraisal of the markets and technologies, leveraging the full expertise of our analysts and the direct interviews with companies in the value chain. Key features of this report include:
• Detailed 10-year forecasts by market segment, by value and display area 2020-2030
• Detailed 10-year forecasts by display type (AMOLED rigid glass, AMOLED flexible / rigid plastic, AMOLED flexible / foldable, PMOLED, segmented, and microdisplays) 2020-2030
• 2017-2019 OLED data
• 10 year forecast of Quantum Dot Displays by type
• The current status on printed OLED displays
• Technologies and players in the OLED value chain (substrate, backplane, transparent conductor, barrier film)
• Company profiles based on direct interviews
• Quantum Dot Displays
• Electrophoretic displays
• Other flexible displays
• OLED lighting and flexible LED lighting
Table of ContentsTable of Contents
株式会社 データリソース Data Resource, Inc.
電話:03-3582-2531
COPYRIGHT(C) 2011-2025 DATA RESOURCE, Inc. ALL RIGHTS RESERVED. |