歯科用骨移植片と代替品市場レポート:2023-2033
Dental Bone Graft & Substitute Market Report 2023-2033
レポート詳細
歯科用骨移植片と代替品市場レポート 2023-2033 : 本レポートは、業界とその基礎となるダイナミクスをより良く理解したい場合、新たな収益ポケットを目指している大手企業にとって非常... もっと見る
※上記価格は部署ライセンス(Departmental licence)価格です。
その他の価格についてはデータリソースまでお問合せください。
日本語のページは自動翻訳を利用し作成しています。
実際のレポートは英文のみでご納品いたします。
サマリー
レポート詳細
歯科用骨移植片と代替品市場レポート 2023-2033: 本レポートは、業界とその基礎となるダイナミクスをより良く理解したい場合、新たな収益ポケットを目指している大手企業にとって非常に貴重なものとなります。異業種への進出や新地域での既存事業の拡大を目指す企業にも有用です。
歯科疾患の頻度増加が市場成長を牽引
歯科疾患の頻度増加、歯科手術の増加、審美意識、規制基準の進化が歯科用骨移植片と代替品業界を後押しする主な要因である。根管感染、虫歯、歯周病などの歯科問題が世界的に増加した結果、歯科管理ソリューションに対する需要が大幅に増加している。特に社会的弱者に適切な歯科治療を提供するための政府プログラムは、この需要を強化している。文化的に肉体的な美しさが重視され、審美的な歯科治療が行われる傾向にあるため、より厳格な滅菌処置が必要になりつつあり、これが市場の拡大に寄与している。
適切な償還構造の欠如が市場成長を阻害する可能性が高い
米国、欧州、オーストラリア、日本などの先進地域では、歯科治療は十分に償還されていない。同様に、インド、中国、タイなどの新興国では、歯科インプラントなどの高額な歯科治療を含む包括的な医療保険制度がない。米国では、払い戻しの対象となる歯科処置の範囲が制限されているため、患者は経済的な実現可能性に基づいて治療を決定する傾向にある。不十分な償還は、予測される期間を通じて骨移植代替物産業の拡大を阻害する可能性がある。
市場調査レポートを購入する前にすべき質問とは?
- 歯科用骨移植片と代替品市場はどのように進化しているのか?
- 歯科用骨移植片と代替品市場の促進要因と抑制要因は何か?
- 歯科用骨移植片と代替品の各サブマーケット区分は予測期間中にどのように成長し、2033年にどれくらいの売上を占めるのか?
- 2023年から2033年にかけて、歯科用骨移植片と代替品の各サブマーケットの市場シェアはどのように推移するのか?
- 2023年から2033年にかけて、市場全体の主な牽引役となるのは何か?
- 歯科用骨移植片と代替品の主要市場はマクロ経済の動きに大枠で追随するのか、それとも個々の国内市場が他を凌駕するのか?
- 2033年までに各国市場のシェアはどのように変化し、どの地域が2033年に市場をリードするのか?
- 主要プレーヤーは誰で、予測期間中の見通しは?
- これらの主要企業の歯科用骨移植片と代替品プロジェクトは?
- 2023年から2033年の間に、業界はどのように発展するのか?また
歯科用骨移植片と代替品のプロジェクトは現在、そして今後10年間にどのような意味を持つのか?
- 歯科用骨移植片と代替品市場をさらに拡大するために、製品化の必要性は高まっていますか?
- 歯科用骨移植片と代替品市場はどこに向かっているのか、そしてどのようにすれば市場の最前線に立てるのか?
- 新製品やサービスラインに対する最適な投資オプションは何か?
- 企業を新たな成長軌道に乗せ、C-suiteに移行させるための重要な展望とは?
歯科用骨移植片と代替品市場が現在、そして今後10年間でどのような影響を受けるかを知る必要があります:
- 本レポートは235ページにわたり、90の表と131の図表で構成されています。
- 本レポートでは、業界の主要な有利分野をハイライトしているため、今すぐターゲットを絞ることができます。
- 世界、地域、国の売上と成長に関する詳細な分析が含まれています。
- 競合他社が成功した主なトレンド、変化、収益予測をハイライトしています。
本レポートは、歯科用骨移植片と代替品市場が今後10年間でどのように発展していくのか、またCOVID-19の景気後退と好転の変動に合わせてどのように発展していくのかをお伝えします。この市場は過去10年間のどの時点よりも今が重要です。
2033年までの予測やその他の分析から、商業的な展望が明らかになる
- 2033年までの収益予測に加え、直近の業績、成長率、市場シェアもご覧いただけます。
- ビジネスの展望と展開に関する独自の分析をご覧いただけます。
- 定性的分析(市場ダイナミクス、促進要因、機会、阻害要因など)、ポーターのファイブフォース分析、PEST分析、最近の動向をご覧いただけます。
本レポートには、COVID-19が業界と貴社にどのような影響を与えるかについてのデータ分析と貴重な洞察が含まれている。本レポートでは、COVID-19の4つの回収パターンとその影響、すなわち「V」、「L」、「W」、「U」について論じている。
レポート対象セグメント
材料のタイプ
- 同種移植片
- 自家移植
- 合成
- 異種移植片
用途
- インプラント骨再生
- 歯周欠損の再生
- リッジ補強
- サイナスリフト
- ソケットプリザベーション
エンドユーザー
- 歯科医院
- 病院
- その他
世界市場全体と各分野の収益予測に加え、5つの地域と22の主要国市場の収益予測も掲載している:
北米
- アメリカ
- カナダ
欧州
- ドイツ
- 英国
- フランス
- イタリア
- スペイン
- ロシア
- その他の欧州
アジア太平洋
- 日本
- 中国
- インド
- オーストラリア
- 韓国
- 東南アジア
- その他のアジア太平洋地域
ラテンアメリカ
- ブラジル
- メキシコ
- その他のラテンアメリカ
MEA
- GCC
- 南アフリカ
- その他のMEA
このレポートには、歯科用骨移植片と代替品市場の2023年から2033年までの主要企業のプロファイルと、これらの企業の事業のこのセグメントに焦点を当てています。
主要企業と市場成長の可能性
・ BioHorizons
・ Botiss biomaterials GmbH
・ Dentsply Sirona
・ Geistlich Pharma Ag
・ Johnson & Johnson
・ Lifenet Health
・ Medtronic
・ Nobel Biocare Services AG
・ NovaBone Products, LLC. (A Halma Company)
・ Regenity
・ Rti Surgical, Inc.
・ Straumann Group
歯科用骨移植片と代替品市場の2023年から2033年までの世界全体の売上高(金額ベース)は、2023年に8億米ドルを突破すると弊社では予測しています。2033年まで力強い収益成長を予測。当研究所では、最大の可能性を秘めた組織を特定しています。彼らの能力、進歩、商業的展望を発見し、一歩先を行くお手伝いをします。
歯科用骨移植片と代替品市場、2023-2033年レポートはどのようにお役に立つでしょうか?
要約すると、230ページを超えるこのレポートは、以下のような知識を提供する:
- 歯科用骨移植片と代替品市場の2023年から2033年までの収益予測 世界および地域レベルで、材料タイプ、用途、エンドユーザー別に予測 - 業界の展望を発見し、投資と収益に最も有利な場所を見つけることができます。
- 5つの地域と22の主要国市場の2033年までの収益予測 - 歯科用骨移植片と代替品市場、北米、欧州、アジア太平洋、ラテンアメリカ、MEAの2023年から2033年までの市場予測をご覧ください。また、米国、カナダ、メキシコ、ブラジル、ドイツ、フランス、英国、イタリア、中国、インド、日本、オーストラリアなどの主要国の市場も予測しています。
- 既存企業および市場参入を目指す企業の展望 - 歯科用骨移植片と代替品市場に関わる主要企業12社の企業プロファイルを含む、2023年から2033年までの市場展望。
独自の予測による定量的・定性的分析をご覧ください。私たちのレポートだけに含まれる情報を入手し、貴重なビジネスインテリジェンスで情報を得ることができます。
他にはない情報
私たちの新しいレポートがあれば、知識に遅れをとったり、チャンスを逃したりする可能性が低くなります。弊社の調査レポートが貴社の調査、分析、意思決定にどのように役立つかをご覧ください。Visiongainのこの調査レポートは、歯科用骨移植片と代替品市場(2023年〜2033年)、市場リーダー企業の商業分析を必要とするすべての人のためのものです。データ、動向、予測をご覧いただけます。
ページTOPに戻る
目次
目次
1 レポート概要
1.1 研究の目的
1.2 歯科用骨移植片と代替品市場の紹介
1.3 本レポートの内容
1.4 本レポートを読むべき理由
1.5 本分析レポートが回答する主な質問は以下の通り
1.6 本レポートの対象者
1.7 方法論
1.7.1 市場の定義
1.7.2 市場評価・予測手法
1.7.3 データの検証
1.7.3.1 一次調査
1.7.3.2 セカンダリーリサーチ
1.8 よくある質問(FAQ)
1.9 Visiongainの関連レポート
1.10 Visiongainについて
2 エグゼクティブ・サマリー
3 市場の概要
3.1 主要な調査結果
3.2 市場ダイナミクス
3.2.1 市場牽引要因
3.2.1.1 医療・歯科ツーリズムの拡大が産業の成長を促進する
3.2.1.2 生体適合性合成骨移植片の開発が産業の成長を促進する
3.2.2 市場抑制要因
3.2.2.1 歯科治療費の高騰
3.2.2.2 適切な償還構造の欠如が市場成長を阻害する可能性が高い
3.2.2.3 認識不足が産業成長を妨げる可能性が高い
3.2.3 市場機会
3.2.3.1 顧客からの需要の増加と審美歯科志向の高まり
3.2.3.2 研究開発活動の活発化により、市場プレーヤーに有利な成長機会がもたらされる
3.2.3.3 アジア太平洋地域の新興経済圏は市場プレーヤーに有利な収益ポケットを提供する
3.3 ポーターのファイブフォース分析
3.3.1 サプライヤーの交渉力
3.3.2 買い手の交渉力
3.3.3 競争上のライバル関係
3.3.4 代替品による脅威
3.3.5 新規参入企業の脅威
3.4 PEST分析
3.5 COVID-19影響分析
4 歯科用骨移植片と代替品市場分析:材料タイプ別
4.1 主要な調査結果
4.2 材料タイプセグメント 市場魅力度指数
4.3 歯科用骨移植片と代替品の材料タイプ別市場規模推定と代替品予測
4.4 アログラフト
4.4.1 2023〜2033年の地域別市場予測 (US$ Mn, AGR %)
4.4.2 地域別市場シェア、2023年・2033年 (%)
4.5 自家移植
4.5.1 2023〜2033年の地域別市場予測 (US$ Mn, AGR %)
4.5.2 地域別市場シェア、2023年・2033年 (%)
4.6 合成
4.6.1 2023~2033年の地域別市場予測 (US$ Mn, AGR %)
4.6.2 地域別市場シェア、2023年・2033年 (%)
4.7 異種移植
4.7.1 2023〜2033年の地域別市場予測 (US$ Mn, AGR %)
4.7.2 地域別市場シェア、2023年・2033年 (%)
5 歯科用骨移植片と代替品市場分析:用途別
5.1 主な調査結果
5.2 用途セグメント 市場魅力度指数
5.3 歯科用骨移植片と代替品の用途別市場規模の推定と代替品予測
5.4 インプラント骨再生
5.4.1 2023〜2033年の地域別市場予測(US$ Mn, AGR %)
5.4.2 地域別市場シェア、2023年・2033年 (%)
5.5 歯周欠損の再生
5.5.1 地域別市場予測、2023〜2033年 (US $ Mn, AGR %)
5.5.2 地域別市場シェア、2023年・2033年 (%)
5.6 隆起補強
5.6.1 2023〜2033年の地域別市場予測 (US$ Mn, AGR %)
5.6.2 地域別市場シェア、2023年・2033年 (%)
5.7 サイナスリフト
5.7.1 2023~2033年の地域別市場予測 (US$ Mn, AGR %)
5.7.2 地域別市場シェア、2023年・2033年 (%)
5.8 ソケットプリザベーション
5.8.1 2023~2033年の地域別市場予測 (US$ Mn, AGR %)
5.8.2 地域別市場シェア、2023年・2033年 (%)
6 歯科用骨移植片と代替品市場分析:エンドユーザー別
6.1 主要調査結果
6.2 エンドユーザーセグメント: 市場魅力度指数
6.3 歯科用骨移植片と代替品のエンドユーザー別市場規模推定と代替品予測
6.4 歯科診療所
6.4.1 2023〜2033年の地域別市場予測(US$ Mn, AGR %)
6.4.2 地域別市場シェア、2023年・2033年(%)
6.5 病院
6.5.1 2023~2033年の地域別市場予測(単位:百万米ドル、AGR)
6.5.2 地域別市場シェア、2023年・2033年(%)
6.6 その他
6.6.1 2023〜2033年の地域別市場予測 (US$ Mn, AGR %)
6.6.2 地域別市場シェア、2023年・2033年(%)
7 歯科用骨移植片と代替品市場分析:地域別
7.1 主要な調査結果
7.2 地域別市場規模の推定と予測
8 北米歯科用骨移植片と代替品市場分析
8.1 主要な調査結果
8.2 歯科用骨移植片と代替品の北米市場魅力度指数
8.3 国別市場規模、2023年、2028年、2033年(US$ Mn)
8.4 国別市場規模推定と予測、2023年〜2033年 (US$ Mn)
8.5 材料タイプ別市場規模推定と予測、2023〜2033年(US$ Mn)
8.6 用途別市場規模推定と予測、2023~2033年 (US$ Mn)
8.7 エンドユーザー別市場規模推定と予測、2023~2033年 (US$ Mn)
8.8 米国の歯科用骨移植片と代替品市場分析
8.9 カナダの歯科用骨移植片と代替品市場分析
9 欧州の歯科用骨移植片と代替品市場分析
9.1 主要な調査結果
9.2 歯科用骨移植片と代替品の欧州市場魅力度指数
9.3 国別市場規模、2023年、2028年、2033年(US$ Mn)
9.4 国別市場規模推定と予測、2023〜2033年(US$ Mn)
9.5 材料タイプ別市場規模推定と予測、2023〜2033年(US$ Mn)
9.6 用途別市場規模推定と予測、2023~2033年(US$ Mn)
9.7 エンドユーザー別市場規模推定と予測、2023~2033年 (US$ Mn)
9.8 ドイツの歯科用骨移植片と代替品市場分析
9.9 イギリスの歯科用骨移植片と代替品市場分析
9.10 フランスの歯科用骨移植片と代替品市場分析
9.11 イタリアの歯科用骨移植片と代替品市場分析
9.12 スペインの歯科用骨移植片と代替品市場分析
9.13 ロシアの歯科用骨移植片と代替品市場分析
9.14 その他の欧州の歯科用骨移植片と代替品市場分析
10 アジア太平洋の歯科用骨移植片と代替品市場分析
10.1 主要な調査結果
10.2 アジア太平洋地域の歯科用骨移植片と代替品市場魅力度指数
10.3 国別市場規模、2023年、2028年、2033年(US$ Mn)
10.4 国別市場規模推定と予測、2023〜2033年(US$ Mn)
10.5 材料タイプ別市場規模推定と予測、2023〜2033年(US$ Mn)
10.6 用途別市場規模推定と予測、2023~2033年(US$ Mn)
10.7 エンドユーザー別市場規模推定と予測、2023~2033年 (US$ Mn)
10.8 日本の歯科用骨移植片と代替品市場分析
10.9 中国の歯科用骨移植片と代替品市場分析
10.10 インドの歯科用骨移植片と代替品市場分析
10.11 オーストラリアの歯科用骨移植片と代替品市場分析
10.12 韓国の歯科用骨移植片と代替品市場分析
10.13 東南アジアの歯科用骨移植片と代替品市場分析
10.14 その他のアジア太平洋地域の歯科用骨移植片と代替品市場分析
11 ラテンアメリカの歯科用骨移植片と代替品市場分析
11.1 主要な調査結果
11.2 ラテンアメリカの歯科用骨移植片と代替品市場魅力度指数
11.3 国別市場規模、2023年、2028年、2033年(US$ Mn)
11.4 国別市場規模推定と予測、2023〜2033年(US$ Mn)
11.5 材料タイプ別市場規模推定と予測、2023〜2033年(US$ Mn)
11.6 用途別市場規模推定と予測:2023~2033年(US$ Mn)
11.7 エンドユーザー別市場規模推定と予測、2023~2033年 (US$ Mn)
11.8 ブラジルの歯科用骨移植片と代替品市場分析
11.9 メキシコ歯科用骨移植片と代替品市場分析
11.10 その他のラテンアメリカの歯科用骨移植片と代替品市場分析
12 MEAの歯科用骨移植片と代替品の市場分析
12.1 主要な調査結果
12.2 MEA歯科用骨移植片と代替品市場魅力度指数
12.3 国別市場規模、2023年、2028年、2033年(US$ Mn)
12.4 国別市場規模推定と予測、2023〜2033年(US$ Mn)
12.5 材料タイプ別市場規模推定と予測、2023〜2033年(US$ Mn)
12.6 用途別市場規模推定と予測:2023~2033年(US$ Mn)
12.7 エンドユーザー別市場規模推定と予測、2023~2033年 (US$ Mn)
12.8 GCCの歯科用骨移植片と代替品市場分析
12.9 南アフリカの歯科用骨移植片と代替品市場分析
12.10 その他のMEAの歯科用骨移植片と代替品市場分析
13 企業のプロフィール
13.1 バイオホライゾン
13.1.1 会社概要
13.1.2 会社概要
13.1.3 製品ベンチマーク
13.2 Botiss biomaterials GmbH
13.2.1 会社概要
13.2.2 会社概要
13.2.3 製品ベンチマーク
13.3 リジェニティ
13.3.1 会社概要
13.3.2 会社概要
13.3.3 製品ベンチマーク
13.4 Nobel Biocare Services AG
13.4.1 会社概要
13.4.2 会社概要
13.4.3 製品ベンチマーク
13.5 Dentsply Sirona
13.5.1 会社概要
13.5.2 会社概要
13.5.3 財務分析
13.5.3.1 純収入、2015-2022年
13.5.3.2 地域市場シェア、2022年
13.5.3.3 R&D、2019-2022年
13.5.4 製品ベンチマーク
13.5.5 戦略的展望
13.6 Geistlich Pharma Ag
13.6.1 会社概要
13.6.2 会社概要
13.6.3 製品ベンチマーク
13.6.4 戦略的展望
13.7 NovaBone Products, LLC. (A Halma Company)
13.7.1 会社概要
13.7.2 会社概要
13.7.3 製品ベンチマーク
13.8 Johnson & Johnson
13.8.1 会社概要
13.8.2 会社概要
13.8.3 財務分析
13.8.3.1 純収入、2015-2022年
13.8.3.2 地域市場シェア、2022年
13.8.3.3 R&D、2015-2022年
13.8.4 製品ベンチマーク
13.9 LifeNet Health
13.9.1 会社概要
13.9.2 会社概要
13.9.3 製品ベンチマーク
13.10 Medtronic
13.10.1 会社概要
13.10.2 会社概要
13.10.3 財務分析
13.10.3.1 純収入、2015-2022年
13.10.3.2 地域市場シェア、2022年
13.10.3.3 R&D、2015-2022年
13.10.4 製品ベンチマーク
13.11 Rti Surgical, Inc.
13.11.1 会社概要
13.11.2 会社概要
13.11.3 製品ベンチマーク
13.11.4 戦略的展望
13.12 Straumann Group
13.12.1 会社概要
13.12.2 会社概要
13.12.3 財務分析
13.12.3.1 純収入、2015-2022年
13.12.3.2 地域市場シェア、2022年
13.12.4 製品ベンチマーク
14 結論と提言
14.1.1 Visiongainの結論
14.1.2 市場プレイヤーへの提言
ページTOPに戻る
図表リスト
表の一覧
Table 1 Dental Bone Graft & Substitute Market Snapshot, 2023 & 2033 (US$ million, CAGR %)
Table 2 Dental Bone Graft & Substitute Market Forecast by Region, 2023-2033 (US$ Million, AGR%, CAGR%): "V" Shaped Recovery
Table 3 Dental Bone Graft & Substitute Market Forecast by Region, 2023-2033 (US$ Million, AGR%, CAGR%): "U" Shaped Recovery
Table 4 Dental Bone Graft & Substitute Market Forecast by Region, 2023-2033 (US$ Million, AGR%, CAGR%): "W" Shaped Recovery
Table 5 Dental Bone Graft & Substitute Market Forecast by Region, 2023-2033 (US$ Million, AGR%, CAGR%): "L" Shaped Recovery
Table 6 Dental Bone Graft & Substitute Market Forecast by Material Type, 2023-2033 (US$ Million, AGR%, CAGR%)
Table 7 Allograft Segment Market Forecast by Region, 2023-2033 (US$ Million, AGR%, CAGR%)
Table 8 Autograft Segment Market Forecast by Region, 2023-2033 (US$ Million, AGR%, CAGR%)
Table 9 Synthetic Segment Market Forecast by Region, 2023-2033 (US$ Million, AGR%, CAGR%)
Table 10 Xenograft Segment Market Forecast by Region, 2023-2033 (US$ Million, AGR%, CAGR%)
Table 11 Dental Bone Graft & Substitute Market Forecast by Application, 2023-2033 (US$ Million, AGR%, CAGR%)
Table 12 Implant Bone Regeneration Segment Market Forecast by Region, 2023-2033 (US$ Million, AGR%, CAGR%)
Table 13 Periodontal Defect Regeneration Segment Market Forecast by Region, 2023-2033 (US$ Million, AGR%, CAGR%)
Table 14 Ridge Augmentation Segment Market Forecast by Region, 2023-2033 (US$ Million, AGR%, CAGR%)
Table 15 Sinus Lift Segment Market Forecast by Region, 2023-2033 (US$ Million, AGR%, CAGR%)
Table 16 Socket Preservation Segment Market Forecast by Region, 2023-2033 (US$ Million, AGR%, CAGR%)
Table 17 Dental Bone Graft & Substitute Market Forecast by End-users, 2023-2033 (US$ Million, AGR%, CAGR%)
Table 18 Dental Clinics Segment Market Forecast by Region, 2023-2033 (US$ Million, AGR%, CAGR%)
Table 19 Hospitals Segment Market Forecast by Region, 2023-2033 (US$ Million, AGR%, CAGR%)
Table 20 Others Segment Market Forecast by Region, 2023-2033 (US$ Million, AGR%, CAGR%)
Table 21 Dental Bone Graft & Substitute Market Forecast by Region, 2023-2033 (US$ Million, AGR%, CAGR%)
Table 22 North America Dental Bone Graft & Substitute Market Forecast by Country, 2023-2033 (US$ Million, AGR%, CAGR%)
Table 23 North America Dental Bone Graft & Substitute Market Forecast by Material Type, 2023-2033 (US$ Million, AGR%, CAGR%)
Table 24 North America Dental Bone Graft & Substitute Market Forecast by Application, 2023-2033 (US$ Million, AGR%, CAGR%)
Table 25 North America Dental Bone Graft & Substitute Market Forecast by End-users, 2023-2033 (US$ Million, AGR%, CAGR%)
Table 26 U.S. Dental Bone Graft & Substitute Market Forecast, 2023-2033 (US$ Million, AGR%, CAGR%)
Table 27 Canada Dental Bone Graft & Substitute Market Forecast, 2023-2033 (US$ Million, AGR%, CAGR%)
Table 28 Europe Dental Bone Graft & Substitute Market Forecast by Country, 2023-2033 (US$ Million, AGR%, CAGR%)
Table 29 Europe Dental Bone Graft & Substitute Market Forecast by Material Type, 2023-2033 (US$ Million, AGR%, CAGR%)
Table 30 Europe Dental Bone Graft & Substitute Market Forecast by Application, 2023-2033 (US$ Million, AGR%, CAGR%)
Table 31 Europe Dental Bone Graft & Substitute Market Forecast by End-users, 2023-2033 (US$ Million, AGR%, CAGR%)
Table 32 Germany Dental Bone Graft & Substitute Market Forecast, 2023-2033 (US$ Million, AGR%, CAGR%)
Table 33 UK Dental Bone Graft & Substitute Market Forecast, 2023-2033 (US$ Million, AGR%, CAGR%)
Table 34 France Dental Bone Graft & Substitute Market Forecast, 2023-2033 (US$ Million, AGR%, CAGR%)
Table 35 Italy Dental Bone Graft & Substitute Market Forecast, 2023-2033 (US$ Million, AGR%, CAGR%)
Table 36 Spain Dental Bone Graft & Substitute Market Forecast, 2023-2033 (US$ Million, AGR%, CAGR%)
Table 37 Russia Dental Bone Graft & Substitute Market Forecast, 2023-2033 (US$ Million, AGR%, CAGR%)
Table 38 Rest of Europe Dental Bone Graft & Substitute Market Forecast, 2023-2033 (US$ Million, AGR%, CAGR%)
Table 39 Asia Pacific Dental Bone Graft & Substitute Market Forecast by Country, 2023-2033 (US$ Million, AGR%, CAGR%)
Table 40 Asia Pacific Dental Bone Graft & Substitute Market Forecast by Material Type, 2023-2033 (US$ Million, AGR%, CAGR%)
Table 41 Asia Pacific Dental Bone Graft & Substitute Market Forecast by Application, 2023-2033 (US$ Million, AGR%, CAGR%)
Table 42 Asia Pacific Dental Bone Graft & Substitute Market Forecast by End-users, 2023-2033 (US$ Million, AGR%, CAGR%)
Table 43 Japan Dental Bone Graft & Substitute Market Forecast, 2023-2033 (US$ Million, AGR%, CAGR%)
Table 44 China Dental Bone Graft & Substitute Market Forecast, 2023-2033 (US$ Million, AGR%, CAGR%)
Table 45 India Dental Bone Graft & Substitute Market Forecast, 2023-2033 (US$ Million, AGR%, CAGR%)
Table 46 Australia Dental Bone Graft & Substitute Market Forecast, 2023-2033 (US$ Million, AGR%, CAGR%)
Table 47 South Korea Dental Bone Graft & Substitute Market Forecast, 2023-2033 (US$ Million, AGR%, CAGR%)
Table 48 South-East Asia Dental Bone Graft & Substitute Market Forecast, 2023-2033 (US$ Million, AGR%, CAGR%)
Table 49 Rest of Asia Pacific Dental Bone Graft & Substitute Market Forecast, 2023-2033 (US$ Million, AGR%, CAGR%)
Table 50 Latin America Dental Bone Graft & Substitute Market Forecast by Country, 2023-2033 (US$ Million, AGR%, CAGR%)
Table 51 Latin America Dental Bone Graft & Substitute Market Forecast by Material Type, 2023-2033 (US$ Million, AGR%, CAGR%)
Table 52 Latin America Dental Bone Graft & Substitute Market Forecast by Application, 2023-2033 (US$ Million, AGR%, CAGR%)
Table 53 Latin America Dental Bone Graft & Substitute Market Forecast by End-users, 2023-2033 (US$ Million, AGR%, CAGR%)
Table 54 Brazil Dental Bone Graft & Substitute Market Forecast, 2023-2033 (US$ Million, AGR%, CAGR%)
Table 55 Mexico Dental Bone Graft & Substitute Market Forecast, 2023-2033 (US$ Million, AGR%, CAGR%)
Table 56 Rest of Latin America Dental Bone Graft & Substitute Market Forecast, 2023-2033 (US$ Million, AGR%, CAGR%)
Table 57 MEA Dental Bone Graft & Substitute Market Forecast by Country, 2023-2033 (US$ Million, AGR%, CAGR%)
Table 58 MEA Dental Bone Graft & Substitute Market Forecast by Material Type, 2023-2033 (US$ Million, AGR%, CAGR%)
Table 59 MEA Dental Bone Graft & Substitute Market Forecast by Application, 2023-2033 (US$ Million, AGR%, CAGR%)
Table 60 MEA Dental Bone Graft & Substitute Market Forecast by End-users, 2023-2033 (US$ Million, AGR%, CAGR%)
Table 61 GCC Dental Bone Graft & Substitute Market Forecast, 2023-2033 (US$ Million, AGR%, CAGR%)
Table 62 South Africa Dental Bone Graft & Substitute Market Forecast, 2023-2033 (US$ Million, AGR%, CAGR%)
Table 63 Rest of MEA Dental Bone Graft & Substitute Market Forecast, 2023-2033 (US$ Million, AGR%, CAGR%)
Table 64 BioHorizons: Key Details, (CEO, HQ, Revenue, Founded, No. of Employees, Company Type, Website, Business Segment)
Table 65 BioHorizons: Product Benchmarking
Table 66 Botiss biomaterials GmbH: Key Details, (CEO, HQ, Revenue, Founded, No. of Employees, Company Type, Website, Business Segment)
Table 67 Botiss biomaterials GmbH: Product Benchmarking
Table 68 Regenity: Key Details, (CEO, HQ, Revenue, Founded, No. of Employees, Company Type, Website, Business Segment)
Table 69 Regenity: Product Benchmarking
Table 70 Nobel Biocare Services AG: Key Details, (CEO, HQ, Revenue, Founded, No. of Employees, Company Type, Website, Business Segment)
Table 71 Nobel Biocare Services AG: Product Benchmarking
Table 72 Dentsply Sirona: Key Details, (CEO, HQ, Revenue, Founded, No. of Employees, Company Type, Website, Business Segment)
Table 73 Dentsply Sirona: Product Benchmarking
Table 74 Dentsply Sirona: Strategic Outlook
Table 75 Geistlich Pharma Ag: Key Details, (CEO, HQ, Revenue, Founded, No. of Employees, Company Type, Website, Business Segment)
Table 76 Geistlich Pharma Ag: Product Benchmarking
Table 77 Geistlich Pharma Ag: Strategic Outlook
Table 78 NovaBone Products, LLC. (A Halma Company): Key Details, (CEO, HQ, Revenue, Founded, No. of Employees, Company Type, Website, Business Segment)
Table 79 NovaBone Products, LLC. (A Halma Company: Product Benchmarking
Table 80 Johnson & Johnson: Key Details, (CEO, HQ, Revenue, Founded, No. of Employees, Company Type, Website, Business Segment)
Table 81 Johnson & Johnson: Product Benchmarking
Table 82 LifeNet Health: Key Details, (CEO, HQ, Revenue, Founded, No. of Employees, Company Type, Website, Business Segment)
Table 83 LifeNet Health: Product Benchmarking
Table 84 Medtronic: Key Details, (CEO, HQ, Revenue, Founded, No. of Employees, Company Type, Website, Business Segment)
Table 85 Medtronic: Product Benchmarking
Table 86 Rti Surgical, Inc.: Key Details, (CEO, HQ, Revenue, Founded, No. of Employees, Company Type, Website, Business Segment)
Table 87 Rti Surgical, Inc.: Product Benchmarking
Table 88 Rti Surgical, Inc.: Strategic Outlook
Table 89 Straumann Group: Key Details, (CEO, HQ, Revenue, Founded, No. of Employees, Company Type, Website, Business Segment)
Table 90 Straumann Group: Product Benchmarking
図の一覧
Figure 1 Dental Bone Graft & Substitute Market Segmentation
Figure 2 Dental Bone Graft & Substitute Market by Material Type: Market Attractiveness Index
Figure 3 Dental Bone Graft & Substitute Market by Application: Market Attractiveness Index
Figure 4 Dental Bone Graft & Substitute Market by End-users: Market Attractiveness Index
Figure 5 Dental Bone Graft & Substitute Market Attractiveness Index by Region
Figure 6 Dental Bone Graft & Substitute Market: Market Dynamics
Figure 7 Dental Bone Graft & Substitute Market: Porter’s Five Forces Analysis
Figure 8 Dental Bone Graft & Substitute Market: Porter’s Five Forces Analysis
Figure 9 Dental Bone Graft & Substitute Market by Region, 2023-2033 (US$ Mn, AGR %): “V” Shaped Recovery
Figure 10 Dental Bone Graft & Substitute Market by Region, 2023-2033 (US$ Mn, AGR %): “U” Shaped Recovery
Figure 11 Dental Bone Graft & Substitute Market by Region, 2023-2033 (US$ Mn, AGR %): “W” Shaped Recovery
Figure 12 Dental Bone Graft & Substitute Market by Region, 2023-2033 (US$ Mn, AGR %): “L” Shaped Recovery
Figure 13 Dental Bone Graft & Substitute Market Attractiveness Index by Material Type
Figure 14 Dental Bone Graft & Substitute Market Forecast by Material Type, 2023-2033 (US$ Million, AGR %)
Figure 15 Dental Bone Graft & Substitute Market Share Forecast by Material Type, 2023, 2028, 2033 (%)
Figure 16 Allograft Segment Market Forecast by Region, 2023-2033 (US$ Million, AGR %)
Figure 17 Allograft Segment Market Share Forecast by Region, 2023 & 2033 (%)
Figure 18 Autograft Segment Market Forecast by Region, 2023-2033 (US$ Million, AGR %)
Figure 19 Autograft Segment Market Share Forecast by Region, 2023 & 2033 (%)
Figure 20 Synthetic Segment Market Forecast by Region, 2023-2033 (US$ Million, AGR %)
Figure 21 Synthetic Segment Market Share Forecast by Region, 2023 & 2033 (%)
Figure 22 Xenograft Segment Market Forecast by Region, 2023-2033 (US$ Million, AGR %)
Figure 23 Xenograft Segment Market Share Forecast by Region, 2023 & 2033 (%)
Figure 24 Dental Bone Graft & Substitute Market Attractiveness Index by Material Type
Figure 25 Dental Bone Graft & Substitute Market Forecast by Application, 2023-2033 (US$ Million, AGR %)
Figure 26 Dental Bone Graft & Substitute Market Share Forecast by Application, 2023, 2028, 2033 (%)
Figure 27 Implant Bone Regeneration Segment Market Forecast by Region, 2023-2033 (US$ Million, AGR %)
Figure 28 Implant Bone Regeneration Segment Market Share Forecast by Region, 2023 & 2033 (%)
Figure 29 Periodontal Defect Regeneration Segment Market Forecast by Region, 2023-2033 (US$ Million, AGR %)
Figure 30 Periodontal Defect Regeneration Segment Market Share Forecast by Region, 2023 & 2033 (%)
Figure 31 Ridge Augmentation Segment Market Forecast by Region, 2023-2033 (US$ Million, AGR %)
Figure 32 Ridge Augmentation Segment Market Share Forecast by Region, 2023 & 2033 (%)
Figure 33 Sinus Lift Segment Market Forecast by Region, 2023-2033 (US$ Million, AGR %)
Figure 34 Sinus Lift Segment Market Share Forecast by Region, 2023 & 2033 (%)
Figure 35 Socket Preservation Segment Market Forecast by Region, 2023-2033 (US$ Million, AGR %)
Figure 36 Socket Preservation Segment Market Share Forecast by Region, 2023 & 2033 (%)
Figure 37 Dental Bone Graft & Substitute Market Attractiveness Index by End-users
Figure 38 Dental Bone Graft & Substitute Market Forecast by End-users, 2023-2033 (US$ Million, AGR %)
Figure 39 Dental Bone Graft & Substitute Market Share Forecast by End-users, 2023, 2028, 2033 (%)
Figure 40 Dental Clinics Segment Market Forecast by Region, 2023-2033 (US$ Million, AGR %)
Figure 41 Dental Clinics Segment Market Share Forecast by Region, 2023 & 2033 (%)
Figure 42 Hospitals Segment Market Forecast by Region, 2023-2033 (US$ Million, AGR %)
Figure 43 Hospitals Segment Market Share Forecast by Region, 2023 & 2033 (%)
Figure 44 Others Segment Market Forecast by Region, 2023-2033 (US$ Million, AGR %)
Figure 45 Others Segment Market Share Forecast by Region, 2023 & 2033 (%)
Figure 46 Dental Bone Graft & Substitute Market Forecast by Region 2023 and 2033 (Revenue, CAGR%)
Figure 47 Dental Bone Graft & Substitute Market Share Forecast by Region 2023, 2028, 2033 (%)
Figure 48 Dental Bone Graft & Substitute Market by Region, 2023-2033 (US$ Mn, AGR %)
Figure 49 North America Dental Bone Graft & Substitute Market Attractiveness Index
Figure 50 North America Dental Bone Graft & Substitute Market by Region, 2023, 2028 & 2033 (US$ million)
Figure 51 North America Dental Bone Graft & Substitute Market Forecast by Country, 2023-2033 (US$ million)
Figure 52 North America Dental Bone Graft & Substitute Market Share Forecast by Country, 2023 & 2033 (%)
Figure 53 North America Dental Bone Graft & Substitute Market Forecast by Material Type, 2023-2033 (US$ Million, AGR %)
Figure 54 North America Dental Bone Graft & Substitute Market Share Forecast by Material Type, 2023 & 2033 (%)
Figure 55 North America Dental Bone Graft & Substitute Market Forecast by Application, 2023-2033 (US$ Million, AGR %)
Figure 56 North America Dental Bone Graft & Substitute Market Share Forecast by Application, 2023 & 2033 (%)
Figure 57 North America Dental Bone Graft & Substitute Market Forecast by End-users, 2023-2033 (US$ Million, AGR %)
Figure 58 North America Dental Bone Graft & Substitute Market Share Forecast by End-users, 2023 & 2033 (%)
Figure 59 U.S. Dental Bone Graft & Substitute Market Forecast, 2023-2033 (US$ Million, AGR %)
Figure 60 Canada Dental Bone Graft & Substitute Market Forecast, 2023-2033 (US$ Million, AGR %)
Figure 61 Europe Dental Bone Graft & Substitute Market Attractiveness Index
Figure 62 Europe Dental Bone Graft & Substitute Market by Region, 2023, 2028 & 2033 (US$ million)
Figure 63 Europe Dental Bone Graft & Substitute Market Forecast by Country, 2023-2033 (US$ million)
Figure 64 Europe Dental Bone Graft & Substitute Market Share Forecast by Country, 2023 & 2033 (%)
Figure 65 Europe Dental Bone Graft & Substitute Market Forecast by Material Type, 2023-2033 (US$ Million, AGR %)
Figure 66 Europe Dental Bone Graft & Substitute Market Share Forecast by Material Type, 2023 & 2033 (%)
Figure 67 Europe Dental Bone Graft & Substitute Market Forecast by Application, 2023-2033 (US$ Million, AGR %)
Figure 68 Europe Dental Bone Graft & Substitute Market Share Forecast by Application, 2023 & 2033 (%)
Figure 69 Europe Dental Bone Graft & Substitute Market Forecast by End-users, 2023-2033 (US$ Million, AGR %)
Figure 70 Europe Dental Bone Graft & Substitute Market Share Forecast by End-users, 2023 & 2033 (%)
Figure 71 Germany Dental Bone Graft & Substitute Market Forecast, 2023-2033 (US$ Million, AGR %)
Figure 72 UK Dental Bone Graft & Substitute Market Forecast, 2023-2033 (US$ Million, AGR %)
Figure 73 France Dental Bone Graft & Substitute Market Forecast, 2023-2033 (US$ Million, AGR %)
Figure 74 Italy Dental Bone Graft & Substitute Market Forecast, 2023-2033 (US$ Million, AGR %)
Figure 75 Spain Dental Bone Graft & Substitute Market Forecast, 2023-2033 (US$ Million, AGR %)
Figure 76 Russia Dental Bone Graft & Substitute Market Forecast, 2023-2033 (US$ Million, AGR %)
Figure 77 Rest of Europe Dental Bone Graft & Substitute Market Forecast, 2023-2033 (US$ Million, AGR %)
Figure 78 Asia Pacific Dental Bone Graft & Substitute Market Attractiveness Index
Figure 79 Asia Pacific Dental Bone Graft & Substitute Market by Region, 2023, 2028 & 2033 (US$ million)
Figure 80 Asia Pacific Dental Bone Graft & Substitute Market Forecast by Country, 2023-2033 (US$ million)
Figure 81 Asia Pacific Dental Bone Graft & Substitute Market Share Forecast by Country, 2023 & 2033 (%)
Figure 82 Asia Pacific Dental Bone Graft & Substitute Market Forecast by Material Type, 2023-2033 (US$ Million, AGR %)
Figure 83 Asia Pacific Dental Bone Graft & Substitute Market Share Forecast by Material Type, 2023 & 2033 (%)
Figure 84 Asia Pacific Dental Bone Graft & Substitute Market Forecast by Application, 2023-2033 (US$ Million, AGR %)
Figure 85 Asia Pacific Dental Bone Graft & Substitute Market Share Forecast by Application, 2023 & 2033 (%)
Figure 86 Asia Pacific Dental Bone Graft & Substitute Market Forecast by End-users, 2023-2033 (US$ Million, AGR %)
Figure 87 Asia Pacific Dental Bone Graft & Substitute Market Share Forecast by End-users, 2023 & 2033 (%)
Figure 88 Japan Dental Bone Graft & Substitute Market Forecast, 2023-2033 (US$ Million, AGR %)
Figure 89 China Dental Bone Graft & Substitute Market Forecast, 2023-2033 (US$ Million, AGR %)
Figure 90 India Dental Bone Graft & Substitute Market Forecast, 2023-2033 (US$ Million, AGR %)
Figure 91 Australia Dental Bone Graft & Substitute Market Forecast, 2023-2033 (US$ Million, AGR %)
Figure 92 South Korea Dental Bone Graft & Substitute Market Forecast, 2023-2033 (US$ Million, AGR %)
Figure 93 South-East Asia Dental Bone Graft & Substitute Market Forecast, 2023-2033 (US$ Million, AGR %)
Figure 94 Rest of Asia Pacific Dental Bone Graft & Substitute Market Forecast, 2023-2033 (US$ Million, AGR %)
Figure 95 Latin America Dental Bone Graft & Substitute Market Attractiveness Index
Figure 96 Latin America Dental Bone Graft & Substitute Market by Region, 2023, 2028 & 2033 (US$ million)
Figure 97 Latin America Dental Bone Graft & Substitute Market Forecast by Country, 2023-2033 (US$ million)
Figure 98 Latin America Dental Bone Graft & Substitute Market Share Forecast by Country, 2023 & 2033 (%)
Figure 99 Latin America Dental Bone Graft & Substitute Market Forecast by Material Type, 2023-2033 (US$ Million, AGR %)
Figure 100 Latin America Dental Bone Graft & Substitute Market Share Forecast by Material Type, 2023 & 2033 (%)
Figure 101 Latin America Dental Bone Graft & Substitute Market Forecast by Application, 2023-2033 (US$ Million, AGR %)
Figure 102 Latin America Dental Bone Graft & Substitute Market Share Forecast by Application, 2023 & 2033 (%)
Figure 103 Latin America Dental Bone Graft & Substitute Market Forecast by End-users, 2023-2033 (US$ Million, AGR %)
Figure 104 Latin America Dental Bone Graft & Substitute Market Share Forecast by End-users, 2023 & 2033 (%)
Figure 105 Brazil Dental Bone Graft & Substitute Market Forecast, 2023-2033 (US$ Million, AGR %)
Figure 106 Mexico Dental Bone Graft & Substitute Market Forecast, 2023-2033 (US$ Million, AGR %)
Figure 107 Rest of Latin America Dental Bone Graft & Substitute Market Forecast, 2023-2033 (US$ Million, AGR %)
Figure 108 MEA Dental Bone Graft & Substitute Market Attractiveness Index
Figure 109 MEA Dental Bone Graft & Substitute Market by Region, 2023, 2028 & 2033 (US$ million)
Figure 110 MEA Dental Bone Graft & Substitute Market Forecast by Country, 2023-2033 (US$ million)
Figure 111 MEA Dental Bone Graft & Substitute Market Share Forecast by Country, 2023 & 2033 (%)
Figure 112 MEA Dental Bone Graft & Substitute Market Forecast by Material Type, 2023-2033 (US$ Million, AGR %)
Figure 113 MEA Dental Bone Graft & Substitute Market Share Forecast by Material Type, 2023 & 2033 (%)
Figure 114 MEA Dental Bone Graft & Substitute Market Forecast by Application, 2023-2033 (US$ Million, AGR %)
Figure 115 MEA Dental Bone Graft & Substitute Market Share Forecast by Application, 2023 & 2033 (%)
Figure 116 MEA Dental Bone Graft & Substitute Market Forecast by End-users, 2023-2033 (US$ Million, AGR %)
Figure 117 MEA Dental Bone Graft & Substitute Market Share Forecast by End-users, 2023 & 2033 (%)
Figure 118 GCC Dental Bone Graft & Substitute Market Forecast, 2023-2033 (US$ Million, AGR %)
Figure 119 South Africa Dental Bone Graft & Substitute Market Forecast, 2023-2033 (US$ Million, AGR %)
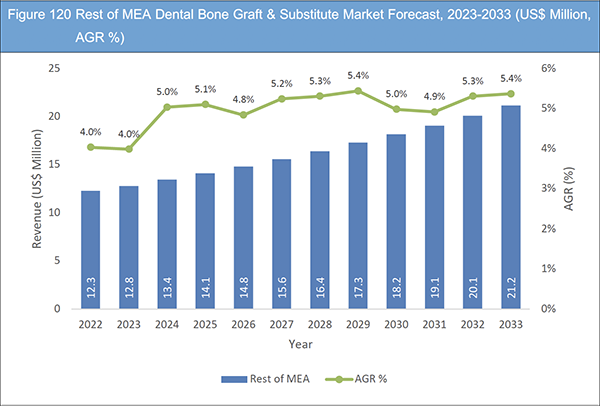
Figure 120 Rest of MEA Dental Bone Graft & Substitute Market Forecast, 2023-2033 (US$ Million, AGR %)
Figure 121 Dentsply Sirona: Net Revenue, 2015-2022 (US$ Million, AGR%)
Figure 122 Dentsply Sirona: Regional Market Shares (%), 2022
Figure 123 Dentsply Sirona: R&D, 2019-2022 (US$ Million, AGR%)
Figure 124 Johnson & Johnson: Net Revenue, 2015-2022 (US$ Million, AGR%)
Figure 125 Johnson & Johnson: Regional Market Shares (%), 2022
Figure 126 Johnson & Johnson: R&D, 2015-2022 (US$ Million, AGR%)
Figure 127 Medtronic: Net Revenue, 2015-2022 (US$ Million, AGR%)
Figure 128 Medtronic: Regional Market Shares (%), 2022
Figure 129 Medtronic: R&D, 2015-2022 (US$ Million, AGR%)
Figure 130 Straumann Group: Net Revenue, 2015-2022 (US$ Million, AGR%)
Figure 131 Straumann Group: Regional Market Shares (%), 2022
ページTOPに戻る
Summary
Report Details
The Dental Bone Graft & Substitute Market Report 2023-2033: This report will prove invaluable to leading firms striving for new revenue pockets if they wish to better understand the industry and its underlying dynamics. It will be useful for companies that would like to expand into different industries or to expand their existing operations in a new region.
Rising Prevalence of Dental Issues Driving Market Growth
The increased frequency of dental problems, a growth in dental operations, aesthetic consciousness, and the evolution of regulatory standards are the main factors boosting the dental bone graft & substitute industry. There has been a huge increase in demand for dental management solutions as a result of a global rise in dental issues like root canal infections, cavities, and periodontal diseases. Government programmes to provide proper dental care, especially for vulnerable communities, reinforce this demand. Due to the cultural emphasis on physical beauty and the tendency towards aesthetic dentistry, stricter sterilisation procedures are becoming more necessary, which is helping to expand the market.
Lack of Adequate Reimbursement Structures Likely to Impede Market Growth
In developed regions such as the United States, Europe, Australia, and Japan, dental procedures are not adequately reimbursed. Likewise, emerging economies such as India, China, and Thailand lack comprehensive medical insurance schemes that encompass costly dental interventions such as dental implants. In the United States, the range of dental procedures eligible for reimbursement is restricted, resulting in patients being inclined to make treatment decisions based on financial feasibility. Insufficient reimbursements have the potential to impede the expansion of the bone graft substitutes industry throughout the projected timeframe.
What Questions Should You Ask before Buying a Market Research Report?
• How is the dental bone graft & substitute market evolving?
• What is driving and restraining the dental bone graft & substitute market?
• How will each dental bone graft & substitute submarket segment grow over the forecast period and how much revenue will these submarkets account for in 2033?
• How will the market shares for each dental bone graft & substitute submarket develop from 2023 to 2033?
• What will be the main driver for the overall market from 2023 to 2033?
• Will leading dental bone graft & substitute markets broadly follow the macroeconomic dynamics, or will individual national markets outperform others?
• How will the market shares of the national markets change by 2033 and which geographical region will lead the market in 2033?
• Who are the leading players and what are their prospects over the forecast period?
• What are the dental bone graft & substitute projects for these leading companies?
• How will the industry evolve during the period between 2023 and 2033? What are the implications of
dental bone graft & substitute projects taking place now and over the next 10 years?
• Is there a greater need for product commercialisation to further scale the dental bone graft & substitute market?
• Where is the dental bone graft & substitute market heading and how can you ensure you are at the forefront of the market?
• What are the best investment options for new product and service lines?
• What are the key prospects for moving companies into a new growth path and C-suite?
You need to discover how this will impact the dental bone graft & substitute market today, and over the next 10 years:
• Our 235-page report provides 90 tables and 131 charts/graphs exclusively to you.
• The report highlights key lucrative areas in the industry so you can target them – NOW.
• It contains in-depth analysis of global, regional and national sales and growth.
• It highlights for you the key successful trends, changes and revenue projections made by your competitors.
This report tells you TODAY how the dental bone graft & substitute market will develop in the next 10 years, and in line with the variations in COVID-19 economic recession and bounce. This market is more critical now than at any point over the last 10 years.
Forecasts to 2033 and other analyses reveal commercial prospects
• In addition to revenue forecasting to 2033, our new study provides you with recent results, growth rates, and market shares.
• You will find original analyses, with business outlooks and developments.
• Discover qualitative analyses (including market dynamics, drivers, opportunities, and restraints), Porter’s Five Forces Analysis, PEST Analysis and recent developments.
This report includes data analysis and invaluable insight into how COVID-19 will affect the industry and your company. Four COVID-19 recovery patterns and their impact, namely, “V”, “L”, “W” and “U” are discussed in this report.
Segments Covered in the Report
Material Type
• Allograft
• Autograft
• Synthetic
• Xenograft
Application
• Implant Bone Regeneration
• Periodontal Defect Regeneration
• Ridge Augmentation
• Sinus Lift
• Socket Preservation
End-users
• Dental Clinics
• Hospitals
• Others
In addition to the revenue predictions for the overall world market and segments, you will also find revenue forecasts for five regional and 22 leading national markets:
North America
• U.S.
• Canada
Europe
• Germany
• UK
• France
• Italy
• Spain
• Russia
• Rest of Europe
Asia Pacific
• Japan
• China
• India
• Australia
• South Korea
• South-East Asia
• Rest of Asia Pacific
Latin America
• Brazil
• Mexico
• Rest of Latin America
MEA
• GCC
• South Africa
• Rest of MEA
The report also includes profiles and for some of the leading companies in the Dental Bone Graft & Substitute Market, 2023 to 2033, with a focus on this segment of these companies’ operations.
Leading companies and the potential for market growth
• BioHorizons
• Botiss biomaterials GmbH
• Dentsply Sirona
• Geistlich Pharma Ag
• Johnson & Johnson
• Lifenet Health
• Medtronic
• Nobel Biocare Services AG
• NovaBone Products, LLC. (A Halma Company)
• Regenity
• Rti Surgical, Inc.
• Straumann Group
Overall world revenue for Dental Bone Graft & Substitute Market, 2023 to 2033 in terms of value the market will surpass US$800 million in 2023, our work calculates. We predict strong revenue growth through to 2033. Our work identifies which organizations hold the greatest potential. Discover their capabilities, progress, and commercial prospects, helping you stay ahead.
How will the Dental Bone Graft & Substitute Market, 2023 to 2033 report help you?
In summary, our 230+ page report provides you with the following knowledge:
• Revenue forecasts to 2033 for Dental Bone Graft & Substitute Market, 2023 to 2033 Market, with forecasts for material type, application, and end-users, each forecast at a global and regional level – discover the industry’s prospects, finding the most lucrative places for investments and revenues.
• Revenue forecasts to 2033 for five regional and 22 key national markets – See forecasts for the Dental Bone Graft & Substitute Market, 2023 to 2033 market in North America, Europe, Asia-Pacific, Latin America, and MEA. Also forecasted is the market in the US, Canada, Mexico, Brazil, Germany, France, UK, Italy, China, India, Japan, and Australia among other prominent economies.
• Prospects for established firms and those seeking to enter the market – including company profiles for 12 of the major companies involved in the Dental Bone Graft & Substitute Market, 2023 to 2033.
Find quantitative and qualitative analyses with independent predictions. Receive information that only our report contains, staying informed with invaluable business intelligence.
Information found nowhere else
With our new report, you are less likely to fall behind in knowledge or miss out on opportunities. See how our work could benefit your research, analyses, and decisions. Visiongain’s study is for everybody needing commercial analyses for the Dental Bone Graft & Substitute Market, 2023 to 2033, market-leading companies. You will find data, trends and predictions.
ページTOPに戻る
Table of Contents
Table of Contents
1 Report Overview
1.1 Objectives of the Study
1.2 Introduction to Dental Bone Graft & Substitute Market
1.3 What This Report Delivers
1.4 Why You Should Read This Report
1.5 Key Questions Answered by This Analytical Report Include:
1.6 Who is This Report For?
1.7 Methodology
1.7.1 Market Definitions
1.7.2 Market Evaluation & Forecasting Methodology
1.7.3 Data Validation
1.7.3.1 Primary Research
1.7.3.2 Secondary Research
1.8 Frequently Asked Questions (FAQs)
1.9 Associated Visiongain Reports
1.10 About Visiongain
2 Executive Summary
3 Market Overview
3.1 Key Findings
3.2 Market Dynamics
3.2.1 Market Driving Factors
3.2.1.1 Growing Medical and Dental Tourism to Drive Industry Growth
3.2.1.2 Development of Biocompatible Synthetic Bone Grafts Projected to Fuel Industry Growth
3.2.2 Market Restraining Factors
3.2.2.1 High Cost of Dental Treatment
3.2.2.2 Lack of Adequate Reimbursement Structures Likely to Impede Market Growth
3.2.2.3 Lack of Awareness Likely to Hamper Industry Growth
3.2.3 Market Opportunities
3.2.3.1 Increasing Demand from Customers and Rising Inclination Towards Aesthetic Dentistry
3.2.3.2 Increasing Research & Development Activities to Offer Lucrative Growth Opportunities for Market Players
3.2.3.3 Emerging Economies Across Asia Pacific to Offer Lucrative Revenue Pockets for Market Players
3.3 Porter’s Five Forces Analysis
3.3.1 Bargaining Power of Suppliers
3.3.2 Bargaining Power of Buyers
3.3.3 Competitive Rivalry
3.3.4 Threat from Substitutes
3.3.5 Threat of New Entrants
3.4 PEST Analysis
3.5 COVID-19 Impact Analysis
4 Dental Bone Graft & Substitute Market Analysis by Material Type
4.1 Key Findings
4.2 Material Type Segment: Market Attractiveness Index
4.3 Dental Bone Graft & Substitute Market Size Estimation and Forecast by Material Type
4.4 Allograft
4.4.1 Market Forecast by Region, 2023-2033 (US$ Mn, AGR %)
4.4.2 Market Share by Region, 2023 & 2033 (%)
4.5 Autograft
4.5.1 Market Forecast by Region, 2023-2033 (US$ Mn, AGR %)
4.5.2 Market Share by Region, 2023 & 2033 (%)
4.6 Synthetic
4.6.1 Market Forecast by Region, 2023-2033 (US$ Mn, AGR %)
4.6.2 Market Share by Region, 2023 & 2033 (%)
4.7 Xenograft
4.7.1 Market Forecast by Region, 2023-2033 (US$ Mn, AGR %)
4.7.2 Market Share by Region, 2023 & 2033 (%)
5 Dental Bone Graft & Substitute Market Analysis by Application
5.1 Key Findings
5.2 Application Segment: Market Attractiveness Index
5.3 Dental Bone Graft & Substitute Market Size Estimation and Forecast by Application
5.4 Implant Bone Regeneration
5.4.1 Market Forecast by Region, 2023-2033 (US$ Mn, AGR %)
5.4.2 Market Share by Region, 2023 & 2033 (%)
5.5 Periodontal Defect Regeneration
5.5.1 Market Forecast by Region, 2023-2033 (US$ Mn, AGR %)
5.5.2 Market Share by Region, 2023 & 2033 (%)
5.6 Ridge Augmentation
5.6.1 Market Forecast by Region, 2023-2033 (US$ Mn, AGR %)
5.6.2 Market Share by Region, 2023 & 2033 (%)
5.7 Sinus Lift
5.7.1 Market Forecast by Region, 2023-2033 (US$ Mn, AGR %)
5.7.2 Market Share by Region, 2023 & 2033 (%)
5.8 Socket Preservation
5.8.1 Market Forecast by Region, 2023-2033 (US$ Mn, AGR %)
5.8.2 Market Share by Region, 2023 & 2033 (%)
6 Dental Bone Graft & Substitute Market Analysis by End-users
6.1 Key Findings
6.2 End-users Segment: Market Attractiveness Index
6.3 Dental Bone Graft & Substitute Market Size Estimation and Forecast by End-users
6.4 Dental Clinics
6.4.1 Market Forecast by Region, 2023-2033 (US$ Mn, AGR %)
6.4.2 Market Share by Region, 2023 & 2033 (%)
6.5 Hospitals
6.5.1 Market Forecast by Region, 2023-2033 (US$ Mn, AGR %)
6.5.2 Market Share by Region, 2023 & 2033 (%)
6.6 Others
6.6.1 Market Forecast by Region, 2023-2033 (US$ Mn, AGR %)
6.6.2 Market Share by Region, 2023 & 2033 (%)
7 Dental Bone Graft & Substitute Market Analysis by Region
7.1 Key Findings
7.2 Regional Market Size Estimation and Forecast
8 North America Dental Bone Graft & Substitute Market Analysis
8.1 Key Findings
8.2 North America Dental Bone Graft & Substitute Market Attractiveness Index
8.3 Market Size by Country, 2023, 2028 & 2033 (US$ Mn)
8.4 Market Size Estimation and Forecast by Country, 2023-2033 (US$ Mn)
8.5 Market Size Estimation and Forecast by Material Type, 2023-2033 (US$ Mn)
8.6 Market Size Estimation and Forecast by Application, 2023-2033 (US$ Mn)
8.7 Market Size Estimation and Forecast by End-users, 2023-2033 (US$ Mn)
8.8 U.S. Dental Bone Graft & Substitute Market Analysis
8.9 Canada Dental Bone Graft & Substitute Market Analysis
9 Europe Dental Bone Graft & Substitute Market Analysis
9.1 Key Findings
9.2 Europe Dental Bone Graft & Substitute Market Attractiveness Index
9.3 Market Size by Country, 2023, 2028 & 2033 (US$ Mn)
9.4 Market Size Estimation and Forecast by Country, 2023-2033 (US$ Mn)
9.5 Market Size Estimation and Forecast by Material Type, 2023-2033 (US$ Mn)
9.6 Market Size Estimation and Forecast by Application, 2023-2033 (US$ Mn)
9.7 Market Size Estimation and Forecast by End-users, 2023-2033 (US$ Mn)
9.8 Germany Dental Bone Graft & Substitute Market Analysis
9.9 UK Dental Bone Graft & Substitute Market Analysis
9.10 France Dental Bone Graft & Substitute Market Analysis
9.11 Italy Dental Bone Graft & Substitute Market Analysis
9.12 Spain Dental Bone Graft & Substitute Market Analysis
9.13 Russia Dental Bone Graft & Substitute Market Analysis
9.14 Rest of Europe Dental Bone Graft & Substitute Market Analysis
10 Asia Pacific Dental Bone Graft & Substitute Market Analysis
10.1 Key Findings
10.2 Asia Pacific Dental Bone Graft & Substitute Market Attractiveness Index
10.3 Market Size by Country, 2023, 2028 & 2033 (US$ Mn)
10.4 Market Size Estimation and Forecast by Country, 2023-2033 (US$ Mn)
10.5 Market Size Estimation and Forecast by Material Type, 2023-2033 (US$ Mn)
10.6 Market Size Estimation and Forecast by Application, 2023-2033 (US$ Mn)
10.7 Market Size Estimation and Forecast by End-users, 2023-2033 (US$ Mn)
10.8 Japan Dental Bone Graft & Substitute Market Analysis
10.9 China Dental Bone Graft & Substitute Market Analysis
10.10 India Dental Bone Graft & Substitute Market Analysis
10.11 Australia Dental Bone Graft & Substitute Market Analysis
10.12 South Korea Dental Bone Graft & Substitute Market Analysis
10.13 South-East Asia Dental Bone Graft & Substitute Market Analysis
10.14 Rest of Asia Pacific Dental Bone Graft & Substitute Market Analysis
11 Latin America Dental Bone Graft & Substitute Market Analysis
11.1 Key Findings
11.2 Latin America Dental Bone Graft & Substitute Market Attractiveness Index
11.3 Market Size by Country, 2023, 2028 & 2033 (US$ Mn)
11.4 Market Size Estimation and Forecast by Country, 2023-2033 (US$ Mn)
11.5 Market Size Estimation and Forecast by Material Type, 2023-2033 (US$ Mn)
11.6 Market Size Estimation and Forecast by Application, 2023-2033 (US$ Mn)
11.7 Market Size Estimation and Forecast by End-users, 2023-2033 (US$ Mn)
11.8 Brazil Dental Bone Graft & Substitute Market Analysis
11.9 Mexico Dental Bone Graft & Substitute Market Analysis
11.10 Rest of Latin America Dental Bone Graft & Substitute Market Analysis
12 MEA Dental Bone Graft & Substitute Market Analysis
12.1 Key Findings
12.2 MEA Dental Bone Graft & Substitute Market Attractiveness Index
12.3 Market Size by Country, 2023, 2028 & 2033 (US$ Mn)
12.4 Market Size Estimation and Forecast by Country, 2023-2033 (US$ Mn)
12.5 Market Size Estimation and Forecast by Material Type, 2023-2033 (US$ Mn)
12.6 Market Size Estimation and Forecast by Application, 2023-2033 (US$ Mn)
12.7 Market Size Estimation and Forecast by End-users, 2023-2033 (US$ Mn)
12.8 GCC Dental Bone Graft & Substitute Market Analysis
12.9 South Africa Dental Bone Graft & Substitute Market Analysis
12.10 Rest of MEA Dental Bone Graft & Substitute Market Analysis
13 Company Profiles
13.1 BioHorizons
13.1.1 Company Snapshot
13.1.2 Company Overview
13.1.3 Product Benchmarking
13.2 Botiss biomaterials GmbH
13.2.1 Company Snapshot
13.2.2 Company Overview
13.2.3 Product Benchmarking
13.3 Regenity
13.3.1 Company Snapshot
13.3.2 Company Overview
13.3.3 Product Benchmarking
13.4 Nobel Biocare Services AG
13.4.1 Company Snapshot
13.4.2 Company Overview
13.4.3 Product Benchmarking
13.5 Dentsply Sirona
13.5.1 Company Snapshot
13.5.2 Company Overview
13.5.3 Financial Analysis
13.5.3.1 Net Revenue, 2015-2022
13.5.3.2 Regional Market Shares, 2022
13.5.3.3 R&D, 2019-2022
13.5.4 Product Benchmarking
13.5.5 Strategic Outlook
13.6 Geistlich Pharma Ag
13.6.1 Company Snapshot
13.6.2 Company Overview
13.6.3 Product Benchmarking
13.6.4 Strategic Outlook
13.7 NovaBone Products, LLC. (A Halma Company)
13.7.1 Company Snapshot
13.7.2 Company Overview
13.7.3 Product Benchmarking
13.8 Johnson & Johnson
13.8.1 Company Snapshot
13.8.2 Company Overview
13.8.3 Financial Analysis
13.8.3.1 Net Revenue, 2015-2022
13.8.3.2 Regional Market Shares, 2022
13.8.3.3 R&D, 2015-2022
13.8.4 Product Benchmarking
13.9 LifeNet Health
13.9.1 Company Snapshot
13.9.2 Company Overview
13.9.3 Product Benchmarking
13.10 Medtronic
13.10.1 Company Snapshot
13.10.2 Company Overview
13.10.3 Financial Analysis
13.10.3.1 Net Revenue, 2015-2022
13.10.3.2 Regional Market Shares, 2022
13.10.3.3 R&D, 2015-2022
13.10.4 Product Benchmarking
13.11 Rti Surgical, Inc.
13.11.1 Company Snapshot
13.11.2 Company Overview
13.11.3 Product Benchmarking
13.11.4 Strategic Outlook
13.12 Straumann Group
13.12.1 Company Snapshot
13.12.2 Company Overview
13.12.3 Financial Analysis
13.12.3.1 Net Revenue, 2015-2022
13.12.3.2 Regional Market Shares, 2022
13.12.4 Product Benchmarking
14 Conclusion and Recommendations
14.1.1 Concluding Remarks from Visiongain
14.1.2 Recommendations for Market Players
ページTOPに戻る
List of Tables/Graphs
List of Tables
Table 1 Dental Bone Graft & Substitute Market Snapshot, 2023 & 2033 (US$ million, CAGR %)
Table 2 Dental Bone Graft & Substitute Market Forecast by Region, 2023-2033 (US$ Million, AGR%, CAGR%): "V" Shaped Recovery
Table 3 Dental Bone Graft & Substitute Market Forecast by Region, 2023-2033 (US$ Million, AGR%, CAGR%): "U" Shaped Recovery
Table 4 Dental Bone Graft & Substitute Market Forecast by Region, 2023-2033 (US$ Million, AGR%, CAGR%): "W" Shaped Recovery
Table 5 Dental Bone Graft & Substitute Market Forecast by Region, 2023-2033 (US$ Million, AGR%, CAGR%): "L" Shaped Recovery
Table 6 Dental Bone Graft & Substitute Market Forecast by Material Type, 2023-2033 (US$ Million, AGR%, CAGR%)
Table 7 Allograft Segment Market Forecast by Region, 2023-2033 (US$ Million, AGR%, CAGR%)
Table 8 Autograft Segment Market Forecast by Region, 2023-2033 (US$ Million, AGR%, CAGR%)
Table 9 Synthetic Segment Market Forecast by Region, 2023-2033 (US$ Million, AGR%, CAGR%)
Table 10 Xenograft Segment Market Forecast by Region, 2023-2033 (US$ Million, AGR%, CAGR%)
Table 11 Dental Bone Graft & Substitute Market Forecast by Application, 2023-2033 (US$ Million, AGR%, CAGR%)
Table 12 Implant Bone Regeneration Segment Market Forecast by Region, 2023-2033 (US$ Million, AGR%, CAGR%)
Table 13 Periodontal Defect Regeneration Segment Market Forecast by Region, 2023-2033 (US$ Million, AGR%, CAGR%)
Table 14 Ridge Augmentation Segment Market Forecast by Region, 2023-2033 (US$ Million, AGR%, CAGR%)
Table 15 Sinus Lift Segment Market Forecast by Region, 2023-2033 (US$ Million, AGR%, CAGR%)
Table 16 Socket Preservation Segment Market Forecast by Region, 2023-2033 (US$ Million, AGR%, CAGR%)
Table 17 Dental Bone Graft & Substitute Market Forecast by End-users, 2023-2033 (US$ Million, AGR%, CAGR%)
Table 18 Dental Clinics Segment Market Forecast by Region, 2023-2033 (US$ Million, AGR%, CAGR%)
Table 19 Hospitals Segment Market Forecast by Region, 2023-2033 (US$ Million, AGR%, CAGR%)
Table 20 Others Segment Market Forecast by Region, 2023-2033 (US$ Million, AGR%, CAGR%)
Table 21 Dental Bone Graft & Substitute Market Forecast by Region, 2023-2033 (US$ Million, AGR%, CAGR%)
Table 22 North America Dental Bone Graft & Substitute Market Forecast by Country, 2023-2033 (US$ Million, AGR%, CAGR%)
Table 23 North America Dental Bone Graft & Substitute Market Forecast by Material Type, 2023-2033 (US$ Million, AGR%, CAGR%)
Table 24 North America Dental Bone Graft & Substitute Market Forecast by Application, 2023-2033 (US$ Million, AGR%, CAGR%)
Table 25 North America Dental Bone Graft & Substitute Market Forecast by End-users, 2023-2033 (US$ Million, AGR%, CAGR%)
Table 26 U.S. Dental Bone Graft & Substitute Market Forecast, 2023-2033 (US$ Million, AGR%, CAGR%)
Table 27 Canada Dental Bone Graft & Substitute Market Forecast, 2023-2033 (US$ Million, AGR%, CAGR%)
Table 28 Europe Dental Bone Graft & Substitute Market Forecast by Country, 2023-2033 (US$ Million, AGR%, CAGR%)
Table 29 Europe Dental Bone Graft & Substitute Market Forecast by Material Type, 2023-2033 (US$ Million, AGR%, CAGR%)
Table 30 Europe Dental Bone Graft & Substitute Market Forecast by Application, 2023-2033 (US$ Million, AGR%, CAGR%)
Table 31 Europe Dental Bone Graft & Substitute Market Forecast by End-users, 2023-2033 (US$ Million, AGR%, CAGR%)
Table 32 Germany Dental Bone Graft & Substitute Market Forecast, 2023-2033 (US$ Million, AGR%, CAGR%)
Table 33 UK Dental Bone Graft & Substitute Market Forecast, 2023-2033 (US$ Million, AGR%, CAGR%)
Table 34 France Dental Bone Graft & Substitute Market Forecast, 2023-2033 (US$ Million, AGR%, CAGR%)
Table 35 Italy Dental Bone Graft & Substitute Market Forecast, 2023-2033 (US$ Million, AGR%, CAGR%)
Table 36 Spain Dental Bone Graft & Substitute Market Forecast, 2023-2033 (US$ Million, AGR%, CAGR%)
Table 37 Russia Dental Bone Graft & Substitute Market Forecast, 2023-2033 (US$ Million, AGR%, CAGR%)
Table 38 Rest of Europe Dental Bone Graft & Substitute Market Forecast, 2023-2033 (US$ Million, AGR%, CAGR%)
Table 39 Asia Pacific Dental Bone Graft & Substitute Market Forecast by Country, 2023-2033 (US$ Million, AGR%, CAGR%)
Table 40 Asia Pacific Dental Bone Graft & Substitute Market Forecast by Material Type, 2023-2033 (US$ Million, AGR%, CAGR%)
Table 41 Asia Pacific Dental Bone Graft & Substitute Market Forecast by Application, 2023-2033 (US$ Million, AGR%, CAGR%)
Table 42 Asia Pacific Dental Bone Graft & Substitute Market Forecast by End-users, 2023-2033 (US$ Million, AGR%, CAGR%)
Table 43 Japan Dental Bone Graft & Substitute Market Forecast, 2023-2033 (US$ Million, AGR%, CAGR%)
Table 44 China Dental Bone Graft & Substitute Market Forecast, 2023-2033 (US$ Million, AGR%, CAGR%)
Table 45 India Dental Bone Graft & Substitute Market Forecast, 2023-2033 (US$ Million, AGR%, CAGR%)
Table 46 Australia Dental Bone Graft & Substitute Market Forecast, 2023-2033 (US$ Million, AGR%, CAGR%)
Table 47 South Korea Dental Bone Graft & Substitute Market Forecast, 2023-2033 (US$ Million, AGR%, CAGR%)
Table 48 South-East Asia Dental Bone Graft & Substitute Market Forecast, 2023-2033 (US$ Million, AGR%, CAGR%)
Table 49 Rest of Asia Pacific Dental Bone Graft & Substitute Market Forecast, 2023-2033 (US$ Million, AGR%, CAGR%)
Table 50 Latin America Dental Bone Graft & Substitute Market Forecast by Country, 2023-2033 (US$ Million, AGR%, CAGR%)
Table 51 Latin America Dental Bone Graft & Substitute Market Forecast by Material Type, 2023-2033 (US$ Million, AGR%, CAGR%)
Table 52 Latin America Dental Bone Graft & Substitute Market Forecast by Application, 2023-2033 (US$ Million, AGR%, CAGR%)
Table 53 Latin America Dental Bone Graft & Substitute Market Forecast by End-users, 2023-2033 (US$ Million, AGR%, CAGR%)
Table 54 Brazil Dental Bone Graft & Substitute Market Forecast, 2023-2033 (US$ Million, AGR%, CAGR%)
Table 55 Mexico Dental Bone Graft & Substitute Market Forecast, 2023-2033 (US$ Million, AGR%, CAGR%)
Table 56 Rest of Latin America Dental Bone Graft & Substitute Market Forecast, 2023-2033 (US$ Million, AGR%, CAGR%)
Table 57 MEA Dental Bone Graft & Substitute Market Forecast by Country, 2023-2033 (US$ Million, AGR%, CAGR%)
Table 58 MEA Dental Bone Graft & Substitute Market Forecast by Material Type, 2023-2033 (US$ Million, AGR%, CAGR%)
Table 59 MEA Dental Bone Graft & Substitute Market Forecast by Application, 2023-2033 (US$ Million, AGR%, CAGR%)
Table 60 MEA Dental Bone Graft & Substitute Market Forecast by End-users, 2023-2033 (US$ Million, AGR%, CAGR%)
Table 61 GCC Dental Bone Graft & Substitute Market Forecast, 2023-2033 (US$ Million, AGR%, CAGR%)
Table 62 South Africa Dental Bone Graft & Substitute Market Forecast, 2023-2033 (US$ Million, AGR%, CAGR%)
Table 63 Rest of MEA Dental Bone Graft & Substitute Market Forecast, 2023-2033 (US$ Million, AGR%, CAGR%)
Table 64 BioHorizons: Key Details, (CEO, HQ, Revenue, Founded, No. of Employees, Company Type, Website, Business Segment)
Table 65 BioHorizons: Product Benchmarking
Table 66 Botiss biomaterials GmbH: Key Details, (CEO, HQ, Revenue, Founded, No. of Employees, Company Type, Website, Business Segment)
Table 67 Botiss biomaterials GmbH: Product Benchmarking
Table 68 Regenity: Key Details, (CEO, HQ, Revenue, Founded, No. of Employees, Company Type, Website, Business Segment)
Table 69 Regenity: Product Benchmarking
Table 70 Nobel Biocare Services AG: Key Details, (CEO, HQ, Revenue, Founded, No. of Employees, Company Type, Website, Business Segment)
Table 71 Nobel Biocare Services AG: Product Benchmarking
Table 72 Dentsply Sirona: Key Details, (CEO, HQ, Revenue, Founded, No. of Employees, Company Type, Website, Business Segment)
Table 73 Dentsply Sirona: Product Benchmarking
Table 74 Dentsply Sirona: Strategic Outlook
Table 75 Geistlich Pharma Ag: Key Details, (CEO, HQ, Revenue, Founded, No. of Employees, Company Type, Website, Business Segment)
Table 76 Geistlich Pharma Ag: Product Benchmarking
Table 77 Geistlich Pharma Ag: Strategic Outlook
Table 78 NovaBone Products, LLC. (A Halma Company): Key Details, (CEO, HQ, Revenue, Founded, No. of Employees, Company Type, Website, Business Segment)
Table 79 NovaBone Products, LLC. (A Halma Company: Product Benchmarking
Table 80 Johnson & Johnson: Key Details, (CEO, HQ, Revenue, Founded, No. of Employees, Company Type, Website, Business Segment)
Table 81 Johnson & Johnson: Product Benchmarking
Table 82 LifeNet Health: Key Details, (CEO, HQ, Revenue, Founded, No. of Employees, Company Type, Website, Business Segment)
Table 83 LifeNet Health: Product Benchmarking
Table 84 Medtronic: Key Details, (CEO, HQ, Revenue, Founded, No. of Employees, Company Type, Website, Business Segment)
Table 85 Medtronic: Product Benchmarking
Table 86 Rti Surgical, Inc.: Key Details, (CEO, HQ, Revenue, Founded, No. of Employees, Company Type, Website, Business Segment)
Table 87 Rti Surgical, Inc.: Product Benchmarking
Table 88 Rti Surgical, Inc.: Strategic Outlook
Table 89 Straumann Group: Key Details, (CEO, HQ, Revenue, Founded, No. of Employees, Company Type, Website, Business Segment)
Table 90 Straumann Group: Product Benchmarking
List of Figures
Figure 1 Dental Bone Graft & Substitute Market Segmentation
Figure 2 Dental Bone Graft & Substitute Market by Material Type: Market Attractiveness Index
Figure 3 Dental Bone Graft & Substitute Market by Application: Market Attractiveness Index
Figure 4 Dental Bone Graft & Substitute Market by End-users: Market Attractiveness Index
Figure 5 Dental Bone Graft & Substitute Market Attractiveness Index by Region
Figure 6 Dental Bone Graft & Substitute Market: Market Dynamics
Figure 7 Dental Bone Graft & Substitute Market: Porter’s Five Forces Analysis
Figure 8 Dental Bone Graft & Substitute Market: Porter’s Five Forces Analysis
Figure 9 Dental Bone Graft & Substitute Market by Region, 2023-2033 (US$ Mn, AGR %): “V” Shaped Recovery
Figure 10 Dental Bone Graft & Substitute Market by Region, 2023-2033 (US$ Mn, AGR %): “U” Shaped Recovery
Figure 11 Dental Bone Graft & Substitute Market by Region, 2023-2033 (US$ Mn, AGR %): “W” Shaped Recovery
Figure 12 Dental Bone Graft & Substitute Market by Region, 2023-2033 (US$ Mn, AGR %): “L” Shaped Recovery
Figure 13 Dental Bone Graft & Substitute Market Attractiveness Index by Material Type
Figure 14 Dental Bone Graft & Substitute Market Forecast by Material Type, 2023-2033 (US$ Million, AGR %)
Figure 15 Dental Bone Graft & Substitute Market Share Forecast by Material Type, 2023, 2028, 2033 (%)
Figure 16 Allograft Segment Market Forecast by Region, 2023-2033 (US$ Million, AGR %)
Figure 17 Allograft Segment Market Share Forecast by Region, 2023 & 2033 (%)
Figure 18 Autograft Segment Market Forecast by Region, 2023-2033 (US$ Million, AGR %)
Figure 19 Autograft Segment Market Share Forecast by Region, 2023 & 2033 (%)
Figure 20 Synthetic Segment Market Forecast by Region, 2023-2033 (US$ Million, AGR %)
Figure 21 Synthetic Segment Market Share Forecast by Region, 2023 & 2033 (%)
Figure 22 Xenograft Segment Market Forecast by Region, 2023-2033 (US$ Million, AGR %)
Figure 23 Xenograft Segment Market Share Forecast by Region, 2023 & 2033 (%)
Figure 24 Dental Bone Graft & Substitute Market Attractiveness Index by Material Type
Figure 25 Dental Bone Graft & Substitute Market Forecast by Application, 2023-2033 (US$ Million, AGR %)
Figure 26 Dental Bone Graft & Substitute Market Share Forecast by Application, 2023, 2028, 2033 (%)
Figure 27 Implant Bone Regeneration Segment Market Forecast by Region, 2023-2033 (US$ Million, AGR %)
Figure 28 Implant Bone Regeneration Segment Market Share Forecast by Region, 2023 & 2033 (%)
Figure 29 Periodontal Defect Regeneration Segment Market Forecast by Region, 2023-2033 (US$ Million, AGR %)
Figure 30 Periodontal Defect Regeneration Segment Market Share Forecast by Region, 2023 & 2033 (%)
Figure 31 Ridge Augmentation Segment Market Forecast by Region, 2023-2033 (US$ Million, AGR %)
Figure 32 Ridge Augmentation Segment Market Share Forecast by Region, 2023 & 2033 (%)
Figure 33 Sinus Lift Segment Market Forecast by Region, 2023-2033 (US$ Million, AGR %)
Figure 34 Sinus Lift Segment Market Share Forecast by Region, 2023 & 2033 (%)
Figure 35 Socket Preservation Segment Market Forecast by Region, 2023-2033 (US$ Million, AGR %)
Figure 36 Socket Preservation Segment Market Share Forecast by Region, 2023 & 2033 (%)
Figure 37 Dental Bone Graft & Substitute Market Attractiveness Index by End-users
Figure 38 Dental Bone Graft & Substitute Market Forecast by End-users, 2023-2033 (US$ Million, AGR %)
Figure 39 Dental Bone Graft & Substitute Market Share Forecast by End-users, 2023, 2028, 2033 (%)
Figure 40 Dental Clinics Segment Market Forecast by Region, 2023-2033 (US$ Million, AGR %)
Figure 41 Dental Clinics Segment Market Share Forecast by Region, 2023 & 2033 (%)
Figure 42 Hospitals Segment Market Forecast by Region, 2023-2033 (US$ Million, AGR %)
Figure 43 Hospitals Segment Market Share Forecast by Region, 2023 & 2033 (%)
Figure 44 Others Segment Market Forecast by Region, 2023-2033 (US$ Million, AGR %)
Figure 45 Others Segment Market Share Forecast by Region, 2023 & 2033 (%)
Figure 46 Dental Bone Graft & Substitute Market Forecast by Region 2023 and 2033 (Revenue, CAGR%)
Figure 47 Dental Bone Graft & Substitute Market Share Forecast by Region 2023, 2028, 2033 (%)
Figure 48 Dental Bone Graft & Substitute Market by Region, 2023-2033 (US$ Mn, AGR %)
Figure 49 North America Dental Bone Graft & Substitute Market Attractiveness Index
Figure 50 North America Dental Bone Graft & Substitute Market by Region, 2023, 2028 & 2033 (US$ million)
Figure 51 North America Dental Bone Graft & Substitute Market Forecast by Country, 2023-2033 (US$ million)
Figure 52 North America Dental Bone Graft & Substitute Market Share Forecast by Country, 2023 & 2033 (%)
Figure 53 North America Dental Bone Graft & Substitute Market Forecast by Material Type, 2023-2033 (US$ Million, AGR %)
Figure 54 North America Dental Bone Graft & Substitute Market Share Forecast by Material Type, 2023 & 2033 (%)
Figure 55 North America Dental Bone Graft & Substitute Market Forecast by Application, 2023-2033 (US$ Million, AGR %)
Figure 56 North America Dental Bone Graft & Substitute Market Share Forecast by Application, 2023 & 2033 (%)
Figure 57 North America Dental Bone Graft & Substitute Market Forecast by End-users, 2023-2033 (US$ Million, AGR %)
Figure 58 North America Dental Bone Graft & Substitute Market Share Forecast by End-users, 2023 & 2033 (%)
Figure 59 U.S. Dental Bone Graft & Substitute Market Forecast, 2023-2033 (US$ Million, AGR %)
Figure 60 Canada Dental Bone Graft & Substitute Market Forecast, 2023-2033 (US$ Million, AGR %)
Figure 61 Europe Dental Bone Graft & Substitute Market Attractiveness Index
Figure 62 Europe Dental Bone Graft & Substitute Market by Region, 2023, 2028 & 2033 (US$ million)
Figure 63 Europe Dental Bone Graft & Substitute Market Forecast by Country, 2023-2033 (US$ million)
Figure 64 Europe Dental Bone Graft & Substitute Market Share Forecast by Country, 2023 & 2033 (%)
Figure 65 Europe Dental Bone Graft & Substitute Market Forecast by Material Type, 2023-2033 (US$ Million, AGR %)
Figure 66 Europe Dental Bone Graft & Substitute Market Share Forecast by Material Type, 2023 & 2033 (%)
Figure 67 Europe Dental Bone Graft & Substitute Market Forecast by Application, 2023-2033 (US$ Million, AGR %)
Figure 68 Europe Dental Bone Graft & Substitute Market Share Forecast by Application, 2023 & 2033 (%)
Figure 69 Europe Dental Bone Graft & Substitute Market Forecast by End-users, 2023-2033 (US$ Million, AGR %)
Figure 70 Europe Dental Bone Graft & Substitute Market Share Forecast by End-users, 2023 & 2033 (%)
Figure 71 Germany Dental Bone Graft & Substitute Market Forecast, 2023-2033 (US$ Million, AGR %)
Figure 72 UK Dental Bone Graft & Substitute Market Forecast, 2023-2033 (US$ Million, AGR %)
Figure 73 France Dental Bone Graft & Substitute Market Forecast, 2023-2033 (US$ Million, AGR %)
Figure 74 Italy Dental Bone Graft & Substitute Market Forecast, 2023-2033 (US$ Million, AGR %)
Figure 75 Spain Dental Bone Graft & Substitute Market Forecast, 2023-2033 (US$ Million, AGR %)
Figure 76 Russia Dental Bone Graft & Substitute Market Forecast, 2023-2033 (US$ Million, AGR %)
Figure 77 Rest of Europe Dental Bone Graft & Substitute Market Forecast, 2023-2033 (US$ Million, AGR %)
Figure 78 Asia Pacific Dental Bone Graft & Substitute Market Attractiveness Index
Figure 79 Asia Pacific Dental Bone Graft & Substitute Market by Region, 2023, 2028 & 2033 (US$ million)
Figure 80 Asia Pacific Dental Bone Graft & Substitute Market Forecast by Country, 2023-2033 (US$ million)
Figure 81 Asia Pacific Dental Bone Graft & Substitute Market Share Forecast by Country, 2023 & 2033 (%)
Figure 82 Asia Pacific Dental Bone Graft & Substitute Market Forecast by Material Type, 2023-2033 (US$ Million, AGR %)
Figure 83 Asia Pacific Dental Bone Graft & Substitute Market Share Forecast by Material Type, 2023 & 2033 (%)
Figure 84 Asia Pacific Dental Bone Graft & Substitute Market Forecast by Application, 2023-2033 (US$ Million, AGR %)
Figure 85 Asia Pacific Dental Bone Graft & Substitute Market Share Forecast by Application, 2023 & 2033 (%)
Figure 86 Asia Pacific Dental Bone Graft & Substitute Market Forecast by End-users, 2023-2033 (US$ Million, AGR %)
Figure 87 Asia Pacific Dental Bone Graft & Substitute Market Share Forecast by End-users, 2023 & 2033 (%)
Figure 88 Japan Dental Bone Graft & Substitute Market Forecast, 2023-2033 (US$ Million, AGR %)
Figure 89 China Dental Bone Graft & Substitute Market Forecast, 2023-2033 (US$ Million, AGR %)
Figure 90 India Dental Bone Graft & Substitute Market Forecast, 2023-2033 (US$ Million, AGR %)
Figure 91 Australia Dental Bone Graft & Substitute Market Forecast, 2023-2033 (US$ Million, AGR %)
Figure 92 South Korea Dental Bone Graft & Substitute Market Forecast, 2023-2033 (US$ Million, AGR %)
Figure 93 South-East Asia Dental Bone Graft & Substitute Market Forecast, 2023-2033 (US$ Million, AGR %)
Figure 94 Rest of Asia Pacific Dental Bone Graft & Substitute Market Forecast, 2023-2033 (US$ Million, AGR %)
Figure 95 Latin America Dental Bone Graft & Substitute Market Attractiveness Index
Figure 96 Latin America Dental Bone Graft & Substitute Market by Region, 2023, 2028 & 2033 (US$ million)
Figure 97 Latin America Dental Bone Graft & Substitute Market Forecast by Country, 2023-2033 (US$ million)
Figure 98 Latin America Dental Bone Graft & Substitute Market Share Forecast by Country, 2023 & 2033 (%)
Figure 99 Latin America Dental Bone Graft & Substitute Market Forecast by Material Type, 2023-2033 (US$ Million, AGR %)
Figure 100 Latin America Dental Bone Graft & Substitute Market Share Forecast by Material Type, 2023 & 2033 (%)
Figure 101 Latin America Dental Bone Graft & Substitute Market Forecast by Application, 2023-2033 (US$ Million, AGR %)
Figure 102 Latin America Dental Bone Graft & Substitute Market Share Forecast by Application, 2023 & 2033 (%)
Figure 103 Latin America Dental Bone Graft & Substitute Market Forecast by End-users, 2023-2033 (US$ Million, AGR %)
Figure 104 Latin America Dental Bone Graft & Substitute Market Share Forecast by End-users, 2023 & 2033 (%)
Figure 105 Brazil Dental Bone Graft & Substitute Market Forecast, 2023-2033 (US$ Million, AGR %)
Figure 106 Mexico Dental Bone Graft & Substitute Market Forecast, 2023-2033 (US$ Million, AGR %)
Figure 107 Rest of Latin America Dental Bone Graft & Substitute Market Forecast, 2023-2033 (US$ Million, AGR %)
Figure 108 MEA Dental Bone Graft & Substitute Market Attractiveness Index
Figure 109 MEA Dental Bone Graft & Substitute Market by Region, 2023, 2028 & 2033 (US$ million)
Figure 110 MEA Dental Bone Graft & Substitute Market Forecast by Country, 2023-2033 (US$ million)
Figure 111 MEA Dental Bone Graft & Substitute Market Share Forecast by Country, 2023 & 2033 (%)
Figure 112 MEA Dental Bone Graft & Substitute Market Forecast by Material Type, 2023-2033 (US$ Million, AGR %)
Figure 113 MEA Dental Bone Graft & Substitute Market Share Forecast by Material Type, 2023 & 2033 (%)
Figure 114 MEA Dental Bone Graft & Substitute Market Forecast by Application, 2023-2033 (US$ Million, AGR %)
Figure 115 MEA Dental Bone Graft & Substitute Market Share Forecast by Application, 2023 & 2033 (%)
Figure 116 MEA Dental Bone Graft & Substitute Market Forecast by End-users, 2023-2033 (US$ Million, AGR %)
Figure 117 MEA Dental Bone Graft & Substitute Market Share Forecast by End-users, 2023 & 2033 (%)
Figure 118 GCC Dental Bone Graft & Substitute Market Forecast, 2023-2033 (US$ Million, AGR %)
Figure 119 South Africa Dental Bone Graft & Substitute Market Forecast, 2023-2033 (US$ Million, AGR %)
Figure 120 Rest of MEA Dental Bone Graft & Substitute Market Forecast, 2023-2033 (US$ Million, AGR %)
Figure 121 Dentsply Sirona: Net Revenue, 2015-2022 (US$ Million, AGR%)
Figure 122 Dentsply Sirona: Regional Market Shares (%), 2022
Figure 123 Dentsply Sirona: R&D, 2019-2022 (US$ Million, AGR%)
Figure 124 Johnson & Johnson: Net Revenue, 2015-2022 (US$ Million, AGR%)
Figure 125 Johnson & Johnson: Regional Market Shares (%), 2022
Figure 126 Johnson & Johnson: R&D, 2015-2022 (US$ Million, AGR%)
Figure 127 Medtronic: Net Revenue, 2015-2022 (US$ Million, AGR%)
Figure 128 Medtronic: Regional Market Shares (%), 2022
Figure 129 Medtronic: R&D, 2015-2022 (US$ Million, AGR%)
Figure 130 Straumann Group: Net Revenue, 2015-2022 (US$ Million, AGR%)
Figure 131 Straumann Group: Regional Market Shares (%), 2022
ページTOPに戻る
Visiongain社の医薬・化学品分野での最新刊レポート
本レポートと同じKEY WORD(bone graft)の最新刊レポート
よくあるご質問
Visiongain社はどのような調査会社ですか?
英国の調査会社ヴィジョンゲイン社(Visiongain)は、通信とエネルギーのほか、自動車や化学・医薬品、金属など、広範な市場を対象に調査を行っています。自動車市場については、市場全般に関する調査のほ... もっと見る
調査レポートの納品までの日数はどの程度ですか?
在庫のあるものは速納となりますが、平均的には 3-4日と見て下さい。
但し、一部の調査レポートでは、発注を受けた段階で内容更新をして納品をする場合もあります。
発注をする前のお問合せをお願いします。
注文の手続きはどのようになっていますか?
1)お客様からの御問い合わせをいただきます。
2)見積書やサンプルの提示をいたします。
3)お客様指定、もしくは弊社の発注書をメール添付にて発送してください。
4)データリソース社からレポート発行元の調査会社へ納品手配します。
5) 調査会社からお客様へ納品されます。最近は、pdfにてのメール納品が大半です。
お支払方法の方法はどのようになっていますか?
納品と同時にデータリソース社よりお客様へ請求書(必要に応じて納品書も)を発送いたします。
お客様よりデータリソース社へ(通常は円払い)の御振り込みをお願いします。
請求書は、納品日の日付で発行しますので、翌月最終営業日までの当社指定口座への振込みをお願いします。振込み手数料は御社負担にてお願いします。
お客様の御支払い条件が60日以上の場合は御相談ください。
尚、初めてのお取引先や個人の場合、前払いをお願いすることもあります。ご了承のほど、お願いします。
データリソース社はどのような会社ですか?
当社は、世界各国の主要調査会社・レポート出版社と提携し、世界各国の市場調査レポートや技術動向レポートなどを日本国内の企業・公官庁及び教育研究機関に提供しております。
世界各国の「市場・技術・法規制などの」実情を調査・収集される時には、データリソース社にご相談ください。
お客様の御要望にあったデータや情報を抽出する為のレポート紹介や調査のアドバイスも致します。
|
|

