医薬品受託製造市場レポート:2024-2034
Pharmaceutical Contract Manufacturing Market Report 2024-2034
レポート詳細
医薬品受託製造市場レポート 2024-2034年 :この調査レポートは、業界とその基礎となるダイナミクスをより良く理解することを望むなら、新たな収益ポケットを目指す大手企業にとって貴... もっと見る
※上記価格は部署ライセンス(Departmental licence)価格です。
その他の価格についてはデータリソースまでお問合せください。
日本語のページは自動翻訳を利用し作成しています。
実際のレポートは英文のみでご納品いたします。
サマリー
レポート詳細
医薬品受託製造市場レポート 2024-2034年:この調査レポートは、業界とその基礎となるダイナミクスをより良く理解することを望むなら、新たな収益ポケットを目指す大手企業にとって貴重なものとなるでしょう。異業種への進出や新規地域での既存事業の拡大を目指す企業にも有用です。
高い自社医薬品開発コスト
自社での医薬品開発・製造に伴うコストの上昇が、医薬品受託製造市場の大きな成長を促している。新薬の発見から上市までの開発プロセスは20億ドルを超え、10年以上に及ぶこともある。このような多額の資金が必要となるため、製薬会社は製造の必要性をCDMO(医薬品開発・製造受託機関)に委託せざるを得なくなっている。CDMOは、スケールメリットと専門的な知識によってコスト効率を高めることができる。
サーモフィッシャーサイエンティフィックやサムスンバイオロジクスなどの企業は、業務コストの削減を求める製薬企業の高まる需要に応えるため、受託製造能力を拡大している。これらのCDMOは、初期段階の開発から商業規模の製造に至るまで、包括的なエンド・ツー・エンドのサービスを提供し、それによって製薬会社は社内経費を削減することができる。
加えて、R&Dコストの高騰、規制当局の監視の強化、市場競争の激化に起因する財務的圧力により、製薬企業はより費用対効果の高いソリューションを求めるようになっています。CDMOにアウトソーシングすることで、これらの企業は、効率的でスケーラブルな生産を受託製造業者に依存しながら、技術革新と市場拡大に焦点を当て、より戦略的に資源を配分することができます。
地域によって異なる規制要件
規制ガイドラインの遵守と品質基準の維持は、製薬業界にとって非常に重要な課題です。開発・製造受託機関(CDMO)の領域では、契約に基づいて製造された医薬品は契約企業のブランド名で販売されるため、規制要件を細心の注意を払って遵守する必要があります。
医薬品開発プロセスには、開発や臨床試験を含む様々な段階を通じて、規制当局への広範なデータ収集と提出が含まれる。CDMOにとって、複数の製剤や管轄区域にまたがるこのデータの管理と提出は、大きな課題となっている。多様な規制当局への提出書類の取り扱いの複雑さと、規制当局への提出書類に誤りが生じる可能性は、CDMOの効率性と有効性を阻害する可能性がある。
このような規制や品質管理上の課題は、今後数年間の医薬品CDMO市場の成長軌道に影響を与える可能性が高い。業界が進化を続ける中、CDMOは規制遵守の複雑さを乗り切る一方で、リスクを軽減し市場成長を維持するために高品質の製造基準の維持に努めなければならない。
市場調査レポートを購入する前にすべき質問とは?
-
医薬品受託製造市場はどのように進化しているのか?
-
医薬品受託製造市場を牽引しているもの、抑制しているものは何か?
-
各医薬品受託製造サブ市場セグメントは予測期間中にどのように成長し、2034年にはどれくらいの売上を占めるようになるのか?
-
2024年から2034年にかけて、各医薬品受託製造サブマーケットの市場シェアはどのように推移するのか?
-
2024年から2034年にかけて、市場全体を牽引する主な要因は何か?
-
主要な医薬品製造請負市場はマクロ経済の動きに大枠で追随するのか、それとも個々の国内市場が他を凌駕するのか?
-
2034年までに各国市場のシェアはどのように変化し、2034年に市場をリードするのはどの地域か?
-
主要プレイヤーは誰で、予測期間中の見通しは?
-
これらの大手企業の医薬品受託製造プロジェクトとは?
-
2024年から2034年の間に、業界はどのように進化するのか?現在行われている
-
現在および今後10年間に実施される医薬品製造受託プロジェクトはどのような意味を持つのか?
-
医薬品受託製造市場をさらに拡大するために、製品の商業化の必要性は高まっているのでしょうか?
医薬品受託製造市場はどこへ向かい、どのようにすれば市場の最前線に立てるのか?
-
新製品や新サービスへの最適な投資方法とは?
-
企業を新たな成長軌道に乗せ、C-suiteに移行させるための重要な展望とは?
このことが、現在、そして今後10年間の医薬品受託製造市場にどのような影響を与えるかを見極める必要がある:
-
349ページにわたるレポートには、143の表と198の図表が掲載されている。
-
このレポートでは、業界の主要な収益分野に焦点を当てているため、今すぐそこにターゲットを絞ることができます。
-
世界、地域、国の売上高と成長に関する詳細な分析が含まれている。
-
競合他社が成功した主なトレンド、変化、収益予測をハイライトします。
2034年までの予測やその他の分析から、商業的な展望が明らかになる
-
2034年までの収益予測に加え、最近の実績、成長率、市場シェアも提供している。
-
ビジネスの展望や展開など、独自の分析が掲載されている。
-
定性的分析(市場ダイナミクス、促進要因、機会、阻害要因など)、ポーターのファイブフォース分析、PEST分析、最近の動向をご覧いただけます。
レポート対象セグメント
サービス
-
医薬品製造サービス
-
医薬品開発サービス
-
生物製剤製造サービス
薬剤タイプ
エンドユーザー
-
大手製薬会社
-
中小製薬企業
-
ジェネリック医薬品会社
-
その他エンドユーザー
事業規模
世界市場全体と各分野の収益予測に加え、5つの地域と28の主要国市場の収益予測も掲載している:
北米
欧州
-
ドイツ
-
英国
-
フランス
-
イタリア
-
スペイン
-
ロシア
-
スイス
-
オランダ
-
その他の欧州地域
アジア太平洋
-
日本
-
中国
-
インド
-
オーストラリア
-
韓国
-
マレーシア
-
シンガポール
-
インドネシア
-
その他のアジア太平洋地域
ラテンアメリカ
-
ブラジル
-
メキシコ
-
アルゼンチン
-
コロンビア
-
その他のラテンアメリカ地域
MEA
2024年から2034年までの医薬品受託製造市場における主要企業のプロファイルも掲載しており、これらの企業の事業分野の中でもこの分野に焦点を当てている。
報告書に掲載されている主要企業
-
AbbVie Inc.
-
Abnova Corporation
-
Aenova Group
-
Almac Group
-
Baxter
-
Boehringer Ingelheim International GmbH
-
Catalent, Inc.
-
Charles River Laboratories
-
Curia Global, Inc.
-
Evonik Industries AG
-
FUJIFILM Diosynth Biotechnologies
-
Grifols, S.A.
-
ICON plc
-
IQVIA Inc.
-
Jubilant Pharmova Limited
-
Lannett
-
Lonza
-
Nipro Pharma Corporation
-
Piramal Pharma Solutions
-
Pfizer Inc.
-
Recipharm AB
-
Samsung Biologics
-
Siegfried Holding AG
-
Thermo Fisher Scientific Inc.
-
Vetter Pharma
-
WuXi AppTec
2024年から2034年までの医薬品受託製造市場全体の世界売上高(金額ベース)は、2024年に1,550億米ドルを突破する。2034年まで収益の力強い伸びを予測。当社の調査では、どの企業が最も大きな可能性を秘めているかを特定します。彼らの能力、進歩、商業的展望を発見し、あなたが一歩先を行くのを支援します。
医薬品受託製造市場、2024-2034年レポートはどのようにお役に立ちますか?
要約すると、340ページを超えるこのレポートは、以下のような知識を提供する:
-
医薬品受託製造市場の2024年から2034年までの収益予測、サービス、医薬品タイプ、エンドユーザー、事業規模の各予測を世界および地域レベルで掲載 - 業界の将来性を発見し、投資と収益に最も有利な場所を見つけることができます。
-
5つの地域と28の主要国市場の2034年までの収益予測 - 北米、欧州、アジア太平洋、中南米、MEAの医薬品受託製造市場の2024年から2034年までの予測をご覧ください。また、米国、カナダ、メキシコ、ブラジル、ドイツ、フランス、英国、イタリア、中国、インド、日本、オーストラリアなどの主要国の市場も予測しています。
-
2024年から2034年までの医薬品受託製造市場に関わる主要企業26社の企業プロファイルを含む。
独自の予測による定量的・定性的分析をご覧ください。私たちのレポートだけに含まれる情報を入手し、貴重なビジネスインテリジェンスで情報を得ることができます。
他にはない情報
私たちの新しいレポートがあれば、知識に遅れをとったり、チャンスを逃したりする可能性が低くなります。弊社の調査レポートが貴社の調査、分析、意思決定にどのように役立つかをご覧ください。Visiongainの調査は、医薬品受託製造市場2024年から2034年、市場をリードする企業のための商業分析を必要とするすべての人のためのものです。データ、トレンド、予測をご覧いただけます。
ページTOPに戻る
目次
1 レポート概要
1.1 研究の目的
1.2 医薬品受託製造市場の紹介
1.3 本レポートの内容
1.4 本レポートを読むべき理由
1.5 本分析レポートが回答する主な質問は以下の通り:
1.6 本レポートの対象者
1.7 方法論
1.7.1 市場の定義
1.7.2 市場評価・予測手法
1.7.3 データの検証
1.7.3.1 一次調査
1.7.3.2 セカンダリーリサーチ
1.8 よくある質問(FAQ)
1.9 Visiongainの関連レポート
1.10 Visiongainについて
2 エグゼクティブ・サマリー
3 市場概要
3.1 主要な調査結果
3.2 市場ダイナミクス
3.3 影響分析
3.3.1 市場促進要因
3.3.1.1 特許切れとジェネリック医薬品需要の増加
3.3.1.2 医薬品R&Dへの投資の増加
3.3.1.3 CDMOによる先端製造技術への投資
3.3.2 市場抑制要因
3.3.2.1 シリアル化の導入
3.3.2.2 様々な規制シナリオ
3.3.3 市場機会
3.3.3.1 生物学的治療に対する需要の増加
3.3.3.2 核医学分野の成長
3.3.3.3 細胞・遺伝子治療に対する需要の増大
3.4 規制の枠組み
3.5 新興市場とメガトレンド
3.6 ポーターのファイブフォース分析
3.6.1 サプライヤーの交渉力
3.6.2 買い手の交渉力
3.6.3 新規参入者の脅威
3.6.4 代替品の脅威
3.6.5 競争上のライバル
3.7 PEST分析
3.8 SWOT分析
4 医薬品受託製造市場のサービス別分析
4.1 主要調査結果
4.2 サービスセグメント 市場魅力度指数
4.3 医薬品受託製造のサービス別市場規模推定と予測
4.4 医薬品製造サービス
4.4.1 タイプ別市場予測、2024年〜2034年(US$ Billion, AGR %)
4.4.2 2024〜2034年の地域別市場予測(US$ Billion, AGR %)
4.4.3 地域別市場シェア、2024年・2034年 (%)
4.5 医薬品開発サービス
4.5.1 タイプ別市場予測、2024〜2034年 (US$ Billion, AGR %)
4.5.2 2024〜2034年地域別市場予測(US$ Billion, AGR %)
4.5.3 地域別市場シェア、2024年・2034年 (%)
4.6 生物製剤製造サービス
4.6.1 タイプ別市場予測、2024〜2034年(US$ Billion, AGR %)
4.6.2 2024〜2034年の地域別市場展望(US$ Billion, AGR %)
4.6.3 地域別市場シェア、2024年・2034年 (%)
5 医薬品受託製造市場分析:薬剤タイプ別
5.1 主要な調査結果
5.2 医薬品タイプ別セグメント 市場魅力度指数
5.3 医薬品受託製造の薬剤タイプ別市場規模推定と予測
5.4 ブランド
5.4.1 2024〜2034年の地域別市場予測(US$ Billion, AGR %)
5.4.2 地域別市場シェア、2024年・2034年 (%)
5.5 ジェネリック医薬品
5.5.1 2024〜2034年の地域別市場予測(US$ Billion, AGR %)
5.5.2 地域別市場シェア、2024年・2034年 (%)
6 医薬品受託製造市場分析:エンドユーザー別
6.1 主要な調査結果
6.2 エンドユーザーセグメント: 市場魅力度指数
6.3 エンドユーザー別医薬品受託製造市場規模の推定と予測
6.4 大手製薬企業
6.4.1 2024〜2034年の地域別市場予測(US$ Billion, AGR %)
6.4.2 地域別市場シェア、2024年・2034年(%)
6.5 中小製薬企業
6.5.1 2024-2034年地域別市場予測(US$ Billion, AGR)
6.5.2 地域別市場シェア、2024年・2034年(%)
6.6 ジェネリック医薬品企業
6.6.1 2024〜2034年の地域別市場予測(US$ Billion, AGR %)
6.6.2 地域別市場シェア、2024年・2034年(%)
6.7 その他のエンドユーザー
6.7.1 2024年~2034年の地域別市場予測(US$ Billion, AGR %)
6.7.2 地域別市場シェア、2024年・2034年(%)
7 医薬品受託製造市場分析:事業規模別
7.1 主要な調査結果
7.2 事業規模別セグメント 市場魅力度指数
7.3 医薬品受託製造の事業規模別市場規模の推定と予測
7.4 臨床
7.4.1 2024〜2034年の地域別市場予測(US$ Billion, AGR %)
7.4.2 地域別市場シェア、2024年・2034年(%)
7.5 商業
7.5.1 2024〜2034年の地域別市場予測(US$ Billion, AGR %)
7.5.2 地域別市場シェア、2024年・2034年(%)
8 医薬品受託製造市場分析:地域別
8.1 主要な調査結果
8.2 地域別市場規模の推定と予測
9 北米の医薬品受託製造市場の分析
9.1 主要な調査結果
9.2 北米の医薬品受託製造市場魅力度指数
9.3 北米の医薬品受託製造市場の国別推移、2024年、2029年、2034年(US$ Billion)
9.4 北米の医薬品受託製造市場規模推定と予測:国別
9.5 北米の医薬品受託製造市場規模推定と予測:サービス別
9.6 北米の医薬品受託製造市場規模推定と予測:医薬品タイプ別
9.7 北米の医薬品受託製造市場規模推定と予測:エンドユーザー別
9.8 北米の医薬品受託製造市場規模推定と予測:事業規模別
9.9 アメリカの医薬品受託製造市場分析
9.10 カナダ医薬品受託製造市場の分析
10 欧州の医薬品受託製造市場分析
10.1 主要な調査結果
10.2 欧州の医薬品受託製造市場魅力度指数
10.3 欧州の医薬品受託製造市場の国別市場規模、2024年、2029年、2034年(US$ Billion)
10.4 欧州の医薬品受託製造市場模推定と予測の:別規
10.5 欧州の医薬品受託製造市場規模推定と予測:サービス別
10.6 欧州の医薬品受託製造市場規模推定と予測:医薬品タイプ別
10.7 欧州の医薬品受託製造市場規模推定と予測:エンドユーザー別
10.8 欧州の医薬品受託製造市場規模推定と予測:事業規模別
10.9 ドイツの医薬品受託製造市場分析
10.10 イギリスの医薬品受託製造市場分析
10.11 フランスの医薬品受託製造市場分析
10.12 イタリアの医薬品受託製造市場分析
10.13 スペインの医薬品受託製造市場分析
10.14 ロシアの医薬品受託製造市場分析
10.15 スイスの医薬品受託製造市場分析
10.16 オランダの医薬品受託製造市場分析
10.17 その他の欧州の医薬品受託製造市場分析
11 アジア太平洋医薬品受託製造市場分析
11.1 主要な調査結果
11.2 アジア太平洋地域の医薬品受託製造市場魅力度指数
11.3 アジア太平洋地域の医薬品受託製造市場の国別推移、2024年、2029年、2034年(US$ Billion)
11.4 アジア太平洋地域の医薬品受託製造市場規模推定と予測:国別
11.5 アジア太平洋地域の医薬品受託製造市場規模推定と予測:サービス別
11.6 アジア太平洋地域の医薬品受託製造市場規模推定と予測:医薬品タイプ別
11.7 アジア太平洋地域の医薬品受託製造市場規模推定と予測:エンドユーザー別
11.8 アジア太平洋地域の医薬品受託製造市場規模推定と予測:事業規模別
11.9 日本の医薬品受託製造市場分析
11.10 中国の医薬品受託製造市場分析
11.11 インドの医薬品受託製造市場分析
11.12 オーストラリアの医薬品受託製造市場分析
11.13 韓国の医薬品受託製造市場分析
11.14 マレーシアの医薬品受託製造市場分析
11.15 シンガポールの医薬品受託製造市場分析
11.16 インドネシアの医薬品受託製造市場分析
11.17 その他のアジア太平洋地域の医薬品受託製造市場分析
12 ラテンアメリカ医薬品受託製造市場分析
12.1 主要な調査結果
12.2 ラテンアメリカの医薬品受託製造市場魅力度指数
12.3 ラテンアメリカの医薬品受託製造市場の国別推移、2024年、2029年、2034年(US$ Billion)
12.4 ラテンアメリカの医薬品受託製造市場規模推定と予測:国別
12.5 ラテンアメリカの医薬品受託製造市場規模推定と予測:サービス別
12.6 ラテンアメリカの医薬品受託製造市場規模推定と予測:医薬品タイプ別
12.7 ラテンアメリカの医薬品受託製造市場規模推定と予測:エンドユーザー別
12.8 ラテンアメリカの医薬品受託製造市場規模推定と予測:事業規模別
12.9 ブラジルの医薬品受託製造市場分析
12.10 メキシコの医薬品受託製造市場分析
12.11 アルゼンチンの医薬品受託製造市場分析
12.12 コロンビアの医薬品受託製造市場分析
12.13 その他のラテンアメリカの医薬品受託製造市場分析
13 MEAの医薬品受託製造市場分析
13.1 主要な調査結果
13.2 MEAの医薬品受託製造市場魅力度指数
13.3 MEAの医薬品受託製造市場の国別推移、2024年、2029年、2034年(US$ Billion)
13.4 MEAの医薬品受託製造市場規模推定と予測:国別
13.5 MEAの医薬品受託製造市場規模推定と予測:サービス別
13.6 MEAの医薬品受託製造市場規模推定と予測:医薬品タイプ別
13.7 MEAの医薬品受託製造市場規模推定と予測:エンドユーザー別
13.8 MEAの医薬品受託製造市場規模推定と予測:事業規模別
13.9 GCCの医薬品受託製造市場分析
13.10 南アフリカの医薬品受託製造市場分析
13.11 その他のMEA医薬品受託製造市場分析
14 主要企業のプロファイル
14.1 競争環境
14.2 Lonza
14.2.1 会社概要
14.2.2 会社概要
14.2.3 財務分析
14.2.3.1 純収入、2018-2023年
14.2.3.2 R&D、2018年~2023年
14.2.3.3 地域別市場シェア、2023年
14.2.3.4 事業セグメントの市場シェア(2023年
14.2.4 サービスベンチマーク
14.2.5 戦略的展望
14.2.6 SWOT分析
14.3 Catalent, Inc.
14.3.1 会社概要
14.3.2 会社概要
14.3.3 財務分析
14.3.3.1 純収入、2018-2023年
14.3.3.2 地域別市場シェア(2023年
14.3.3.3 事業セグメント市場シェア(2023年
14.3.4 サービスベンチマーク
14.3.5 戦略的展望
14.3.6 SWOT分析
14.4 Recipharm AB
14.4.1 会社概要
14.4.2 会社概要
14.4.3 サービス・ベンチマーク
14.4.4 戦略的展望
14.4.5 SWOT分析
14.5 AbbVie Inc.
14.5.1 会社概要
14.5.2 会社概要
14.5.3 財務分析
14.5.3.1 純収入、2018-2023年
14.5.3.2 R&D、2018年〜2023年
14.5.3.3 地域別市場シェア、2023年
14.5.3.4 事業セグメントの市場シェア(2023年
14.5.4 サービスベンチマーク
14.5.5 SWOT分析
14.6 Thermo Fisher Scientific Inc.
14.6.1 会社概要
14.6.2 会社概要
14.6.3 財務分析
14.6.3.1 純収入、2018-2023年
14.6.3.2 R&D、2018年〜2023年
14.6.3.3 地域別市場シェア、2023年
14.6.3.4 事業セグメントの市場シェア(2023年
14.6.4 サービスベンチマーク
14.6.5 戦略的展望
14.6.6 SWOT分析
14.7 Siegfried Holding AG
14.7.1 会社概要
14.7.2 会社概要
14.7.3 財務分析
14.7.3.1 純収入、2018年~2023年
14.7.3.2 事業セグメント市場シェア、2023年
14.7.4 サービスベンチマーク
14.7.5 戦略的展望
14.8 Evonik Industries AG
14.8.1 会社概要
14.8.2 会社概要
14.8.3 財務分析
14.8.3.1 純収入、2018年~2023年
14.8.3.2 地域別市場シェア、2023年
14.8.3.3 事業セグメントの市場シェア(2023年
14.8.4 サービスベンチマーク
14.8.5 戦略的展望
14.9 Boehringer Ingelheim International GmbH
14.9.1 会社概要
14.9.2 会社概要
14.9.3 財務分析
14.9.3.1 純収入、2018年〜2023年
14.9.3.2 地域別市場シェア(2023年
14.9.3.3 事業セグメント市場シェア(2023年
14.9.4 サービスベンチマーク
14.10 Piramal Pharma Solutions
14.10.1 会社概要
14.10.2 会社概要
14.10.3 サービス・ベンチマーク
14.10.4 戦略的展望
14.11 Samsung Biologics
14.11.1 会社概要
14.11.2 会社概要
14.11.3 財務分析
14.11.3.1 純収入、2018-2023年
14.11.4 サービスベンチマーク
14.11.5 戦略的展望
14.12 WuXi AppTec
14.12.1 会社概要
14.12.2 会社概要
14.12.3 財務分析
14.12.3.1 純収入、2018年~2023年
14.12.3.2 地域別市場シェア、2023年
14.12.3.3 事業セグメントの市場シェア(2023年
14.12.4 サービスベンチマーク
14.12.5 戦略的展望
14.13 FUJIFILM Diosynth Biotechnologies
14.13.1 会社概要
14.13.2 会社概要
14.13.3 財務分析
14.13.3.1 純収入(2018年~2023年
14.13.3.2 売上高、2018-2023年
14.13.4 サービスベンチマーク
14.13.5 戦略的展望
14.14 ICON plc
14.14.1 会社概要
14.14.2 会社概要
14.14.3 財務分析
14.14.3.1 純収入、2018年~2023年
14.14.3.2 地域市場シェア、2023年
14.14.4 サービスベンチマーク
14.14.5 戦略的展望
14.15 Abnova Corporation
14.15.1 会社概要
14.15.2 会社概要
14.15.3 サービス・ベンチマーク
14.15.4 戦略的展望
14.16 Vetter Pharma
14.16.1 会社概要
14.16.2 会社概要
14.16.3 サービス・ベンチマーク
14.16.4 戦略的展望
14.17 Aenova Group
14.17.1 会社概要
14.17.2 会社概要
14.17.3 財務分析
14.17.3.1 純収入、2018-2022年
14.17.3.2 地域別市場シェア、2022年
14.17.3.3 事業セグメントの市場シェア、2022年
14.17.4 サービスベンチマーク
14.17.5 戦略的展望
14.18 Almac Group
14.18.1 会社概要
14.18.2 会社概要
14.18.3 サービス・ベンチマーク
14.18.4 戦略的展望
14.19 Nipro Pharma Corporation
14.19.1 会社概要
14.19.2 会社概要
14.19.3 財務分析
14.19.3.1 純収入(2018年~2023年
14.19.3.2 R&D、2018年〜2023年
14.19.3.3 地域市場シェア、2023年
14.19.3.4 事業セグメントの市場シェア(2023年
14.19.4 サービスベンチマーク
14.19.5 戦略的展望
14.20 Jubilant Pharmova Limited
14.20.1 会社概要
14.20.2 会社概要
14.20.3 サービス・ベンチマーク
14.20.4 戦略的展望
14.21 Pfizer Inc.
14.21.1 会社概要
14.21.2 会社概要
14.21.3 財務分析
14.21.3.1 純収入、2018年~2023年
14.21.3.2 R&D、2018年〜2023年
14.21.3.3 地域市場シェア、2023年
14.21.3.4 事業セグメントの市場シェア(2023年
14.21.4 サービスベンチマーク
14.21.5 戦略的展望
14.22 Grifols, S.A.
14.22.1 会社概要
14.22.2 会社概要
14.22.3 財務分析
14.22.3.1 純収入、2018年~2023年
14.22.3.2 R&D、2018年~2023年
14.22.4 戦略的展望
14.23 Charles River Laboratories
14.23.1 会社概要
14.23.2 会社概要
14.23.3 財務分析
14.23.3.1 純収入、2018年〜2023年
14.23.3.2 地域別市場シェア、2023年
14.23.3.3 事業セグメントの市場シェア(2023年
14.23.4 サービスベンチマーク
14.23.5 戦略的展望
14.24 IQVIA Inc.
14.24.1 会社概要
14.24.2 会社概要
14.24.3 財務分析
14.24.3.1 純収入、2018年〜2023年
14.24.3.2 地域別市場シェア、2023年
14.24.3.3 事業セグメントの市場シェア(2023年
14.24.4 サービスベンチマーク
14.24.5 戦略的展望
14.25 Baxter
14.25.1 会社概要
14.25.2 会社概要
14.25.3 財務分析
14.25.3.1 純収入(2018年~2023年
14.25.3.2 R&D、2018年~2023年
14.25.3.3 地域市場シェア、2023年
14.25.3.4 事業セグメントの市場シェア(2023年
14.25.4 サービスベンチマーク
14.26 Curia Global, Inc.
14.26.1 会社概要
14.26.2 会社概要
14.26.3 サービス・ベンチマーク
14.26.4 戦略的展望
14.27 Lannett
14.27.1 会社概要
14.27.2 会社概要
14.27.3 サービス・ベンチマーク
15 結論と提言
15.1 Visiongainからの結びの言葉
15.2 市場プレイヤーへの提言
ページTOPに戻る
図表リスト
表の一覧
表1 医薬品受託製造市場のスナップショット、2024年&2034年(百万米ドル、CAGR %)
表2 医薬品受託製造市場のサービス別予測、2024年~2034年(10億米ドル、AGR %、CAGR %)
表3 医薬品製造サービスセグメントのタイプ別市場予測、2024〜2034年(10億米ドル、AGR %、CAGR %)
表4 医薬品製造サービスセグメントの地域別市場予測、2024-2034年(10億米ドル、AGR %、CAGR %)
表5 医薬品開発サービスセグメントのタイプ別市場予測、2024-2034年(10億米ドル、AGR %、CAGR %)
表6 医薬品開発サービスセグメントの地域別市場予測、2024-2034年(10億米ドル、AGR %、CAGR %)
表7 生物製剤製造サービス事業のタイプ別市場予測、2024-2034年(10億米ドル、AGR %、CAGR %)
表8 生物製剤製造サービスセグメントの地域別市場予測、2024-2034年(10億米ドル、AGR %、CAGR %)
表9 医薬品受託製造のエンドユーザー別市場予測、2024〜2034年(10億米ドル、AGR %、CAGR %)
表10 ブランド品セグメントの地域別市場予測、2024-2034年(10億米ドル、AGR %、CAGR %)
表11 ジェネリック医薬品セグメントの地域別市場予測、2024-2034年(10億米ドル、AGR %、CAGR %)
表12 医薬品受託製造のエンドユーザー別市場予測、2024-2034年(10億米ドル、AGR %、CAGR %)
表13 大手製薬企業セグメントの地域別市場予測、2024-2034年(10億米ドル、AGR %、CAGR %)
表14 中小製薬企業セグメント地域別市場予測、2024-2034年(10億米ドル、AGR %、CAGR %)
表15 ジェネリック医薬品企業セグメント地域別市場予測、2024-2034年(10億米ドル、AGR %、CAGR %)
表16 その他のエンドユーザーセグメントの地域別市場予測、2024-2034年(10億米ドル、AGR %、CAGR %)
表17 医薬品受託製造サービス別市場予測:2024-2034年(10億米ドル、AGR %、CAGR %)
表18 臨床セグメントの地域別市場予測、2024-2034年(10億米ドル、AGR %、CAGR %)
表19 商業セグメントの地域別市場予測、2024-2034年(10億米ドル、AGR %、CAGR %)
表20 医薬品受託製造市場の地域別予測、2024-2034年(10億米ドル、AGR %、CAGR %)
表21 北米の医薬品受託製造市場の国別予測、2024-2034年(10億米ドル、AGR %、CAGR %)
表22 北米の医薬品受託製造市場のサービス別予測、2024-2034年 (10億米ドル、AGR %、CAGR %)
表23 北米の医薬品受託製造市場:エンドユーザー別予測 2024-2034 (10億米ドル, AGR %, CAGR %)
表24 北米の医薬品受託製造市場のエンドユーザー別予測:2024-2034年(10億米ドル、AGR %、CAGR %)
表25 北米の医薬品受託製造市場規模別予測:2024-2034年(10億米ドル、AGR %、CAGR %)
表26 米国の医薬品受託製造市場予測、2024〜2034年(10億米ドル、AGR %、CAGR %)
表27 カナダ医薬品受託製造市場の予測、2024〜2034年 (億米ドル、AGR %、CAGR %)
表28 欧州医薬品受託製造市場の国別予測、2024〜2034年(億米ドル、AGR %、CAGR %)
表29 欧州医薬品受託製造市場のサービス別予測、2024-2034年 (億米ドル、AGR %、CAGR %)
表30 欧州医薬品受託製造市場の予測:エンドユーザー別、2024年〜2034年(10億米ドル、AGR %、CAGR %)
表31 欧州の医薬品受託製造市場のエンドユーザー別予測、2024-2034年 (10億米ドル、AGR %、CAGR %)
表32 欧州医薬品受託製造市場の規模別予測:2024-2034年(10億米ドル、AGR %、CAGR %)
表33 ドイツ医薬品受託製造市場の予測、2024年〜2034年(億米ドル、AGR %、CAGR %)
表34 イギリス医薬品受託製造市場の予測、2024〜2034年 (億米ドル、AGR %、CAGR %)
表35 フランス医薬品受託製造市場の予測、2024-2034年(億米ドル、AGR %、CAGR %)
表36 イタリア医薬品受託製造市場の予測:2024-2034年(億米ドル、AGR %、CAGR %)
表37 スペインの医薬品受託製造市場の予測、2024-2034年 (億米ドル、AGR %、CAGR %)
表38 ロシア医薬品受託製造市場の予測、2024-2034年 (億米ドル、AGR %、CAGR %)
表39 スイス医薬品受託製造市場の予測、2024-2034年 (億米ドル、AGR %、CAGR %)
表40 オランダの医薬品受託製造市場の予測、2024〜2034年(億米ドル、AGR %、CAGR %)
表41 その他のヨーロッパの医薬品受託製造市場の予測、2024-2034年(億米ドル、AGR %、CAGR %)
表42 アジア太平洋地域の医薬品受託製造市場の国別予測、2024〜2034年(億米ドル、AGR %、CAGR %)
表43 アジア太平洋地域の医薬品受託製造市場のサービス別予測、2024年〜2034年 (億米ドル、AGR %、CAGR %)
表44 アジア太平洋地域の医薬品受託製造市場:エンドユーザー別予測 2024-2034 (億米ドル、AGR %、CAGR %)
表45 アジア太平洋地域の医薬品受託製造市場のエンドユーザー別予測:2024〜2034年(10億米ドル、AGR %、CAGR %)
表46 アジア太平洋地域の医薬品受託製造市場規模別予測:2024〜2034年(10億米ドル、AGR %、CAGR %)
表47 日本の医薬品受託製造市場の予測、2024年〜2034年 (億米ドル、AGR %、CAGR %)
表48 中国医薬品受託製造市場の予測、2024〜2034年 (億米ドル、AGR %、CAGR %)
表49 インド医薬品受託製造市場の予測、2024〜2034年 (億米ドル、AGR %、CAGR %)
表50 オーストラリア医薬品受託製造市場の予測、2024-2034年 (億米ドル、AGR %、CAGR %)
表51 オーストラリア医薬品受託製造市場の予測、2024〜2034年 (億米ドル、AGR %、CAGR %)
表52 マレーシア医薬品受託製造市場の予測、2024〜2034年(億米ドル、AGR %、CAGR %)
表53 シンガポール医薬品受託製造市場の予測、2024-2034年 (億米ドル、AGR %、CAGR %)
表54 インドネシア医薬品受託製造市場の予測、2024〜2034年(億米ドル、AGR %、CAGR %)
表55 その他のアジア太平洋地域の医薬品受託製造市場の予測、2024〜2034年(億米ドル、AGR %、CAGR %)
表56 中南米の医薬品受託製造市場の国別予測、2024〜2034年 (億米ドル、AGR %、CAGR %)
表57 ラテンアメリカ医薬品受託製造市場のサービス別予測、2024-2034年 (億米ドル、AGR %、CAGR %)
表58 ラテンアメリカの医薬品受託製造市場:エンドユーザー別予測 2024-2034 (億米ドル, AGR %, CAGR %)
表59 ラテンアメリカ医薬品受託製造市場のエンドユーザー別予測:2024-2034年(10億米ドル、AGR %、CAGR %)
表60 中南米の医薬品受託製造市場規模別予測:2024-2034年(10億米ドル、AGR %、CAGR %)
表61 ブラジル医薬品受託製造市場の予測、2024〜2034年 (億米ドル、AGR %、CAGR %)
表62 メキシコ医薬品受託製造市場の予測、2024〜2034年 (億米ドル、AGR %、CAGR %)
表63 アルゼンチン医薬品受託製造市場の予測、2024-2034年 (億米ドル、AGR %、CAGR %)
表64 コロンビアの医薬品受託製造市場の予測、2024〜2034年 (億米ドル、AGR %、CAGR %)
表65 ラテンアメリカのその他の医薬品受託製造市場の予測、2024-2034年 (億米ドル、AGR %、CAGR %)
表66 MEA医薬品受託製造の国別市場予測、2024-2034年 (億米ドル、AGR %、CAGR %)
表67 MEA医薬品受託製造市場のサービス別予測、2024-2034年 (億米ドル、AGR %、CAGR %)
表68 MEA医薬品受託製造市場の予測:エンドユーザー別、2024-2034年 (10億米ドル、AGR %、CAGR %)
表69 MEA医薬品受託製造市場のエンドユーザー別予測:2024-2034年(10億米ドル、AGR %、CAGR %)
表70 MEA医薬品受託製造市場の規模別予測:2024-2034年(10億米ドル、AGR %、CAGR %)
表71 GCCの医薬品受託製造市場予測、2024-2034年 (億米ドル、AGR %、CAGR %)
表72 南アフリカの医薬品受託製造市場の予測、2024年〜2034年 (億米ドル、AGR %、CAGR %)
表73 その他のMEA医薬品受託製造市場の予測、2024-2034年(億米ドル、AGR %、CAGR %)
表 74 ロンザ主な詳細(CEO, 本社, 売上高, 設立, 従業員数, 企業タイプ, ウェブサイト, 事業セグメント)
表 75 Lonza:サービスベンチマーク
表 76 Lonza:戦略的展望
表 77 キャタレント主な詳細(CEO, 本社, 売上高, 設立, 従業員数, 企業タイプ, ウェブサイト, 事業セグメント)
表 78 キャタレント社サービス・ベンチマーク
表 79 キャタレント社戦略的展望
表80 レシファームAB:主要詳細(CEO、本社、売上高、設立、従業員数、企業タイプ、ウェブサイト、事業セグメント)
表81 レシファームAB:サービスベンチマーク
表82 レシファームAB:戦略的展望
表83 アッヴィ社主な詳細(CEO, 本社, 売上高, 設立, 従業員数, 企業タイプ, ウェブサイト, 事業セグメント)
表 84 AbbVie Inc:サービスベンチマーク
表 85 サーモフィッシャーサイエンティフィック(Thermo Fisher Scientific Inc:主な詳細(CEO, 本社, 売上高, 設立, 従業員数, 企業タイプ, ウェブサイト, 事業セグメント)
表86 サーモフィッシャーサイエンティフィック:サービスベンチマークサービスベンチマーク
表 87 サーモフィッシャーサイエンティフィック:戦略的展望戦略的展望
表88 ジークフリード ホールディングAG: 主要詳細(CEO、本社、売上高、設立、従業員数、企業タイプ、ウェブサイト、事業セグメント)
表 89 ジークフリード ホールディング AG: サービスベンチマーク
表90 ジークフリードホールディングAG:戦略的展望
表 91 エボニック・インダストリーズAG: 主要詳細(CEO、本社、売上高、設立、従業員数、企業タイプ、ウェブサイト、事業セグメント)
表 92 エボニック インダストリーズAG:サービスベンチマーク
表93 エボニック:戦略的展望
表94 ベーリンガーインゲルハイム・インターナショナルGmbH:主要詳細(CEO、本社、売上高、設立、従業員数、企業タイプ、ウェブサイト、事業セグメント)
表95 ベーリンガーインゲルハイム・インターナショナルGmbH:サービスベンチマーク
表96 ピラマル・ファーマ・ソリューションズ主な詳細(CEO, 本社, 売上高, 設立, 従業員数, 企業タイプ, ウェブサイト, 事業セグメント)
表 97 ピラマル・ファーマ・ソリューションズサービスベンチマーク
表 98 ピラマル・ファーマ・ソリューションズ戦略的展望
表99 サムスンバイオロジクス:主要な詳細(CEO、本社、売上高、設立、従業員数、企業タイプ、ウェブサイト、事業セグメント)
表 100 サムスンバイオロジクス:サービスベンチマーク
表101 三星生物製剤:戦略的展望
表102 呉西AppTec:主な詳細(CEO, 本社, 売上高, 設立, 従業員数, 企業タイプ, ウェブサイト, 事業セグメント)
表 103 呉西 AppTec:サービスベンチマーク
表 104 呉西AppTec:戦略的展望
表105 富士フイルムジオシンスバイオテクノロジーズ:主な詳細(CEO、本社、売上高、設立、従業員数、会社タイプ、ウェブサイト、事業セグメント)
表 106 富士フイルムダイオシンスバイオテクノロジーズ:サービスベンチマーク
表 107 富士フイルムダイオシンスバイオテクノロジーズ:サービス・ベンチマーク戦略的展望
表 108 ICON plc:主な詳細(CEO, 本社, 売上高, 設立, 従業員数, 企業タイプ, ウェブサイト, 事業セグメント)
表 109 ICON plc:サービスベンチマーク
表 110 ICON plc:戦略的展望
表111 アブノバ・コーポレーション主な詳細(CEO, 本社, 売上高, 設立, 従業員数, 企業タイプ, ウェブサイト, 事業セグメント)
表 112 アブノバ・コーポレーションサービスベンチマーク
表 113 アブノバ・コーポレーション戦略的展望
表114 ベッター・ファーマ:主要な詳細(CEO、本社、売上高、設立、従業員数、企業タイプ、ウェブサイト、事業セグメント)
表115 ベッターファーマ:サービスベンチマーク
表116 ベッターファーマ:戦略的展望
表117 アエノバ・グループ主な詳細(CEO、本社、売上高、設立、従業員数、企業タイプ、ウェブサイト、事業セグメント)
表 118 アエノバグループサービスベンチマーク
表119 アエノバグループ戦略的展望
表120 アルマックグループ主な詳細(CEO, 本社, 売上高, 設立, 従業員数, 企業タイプ, ウェブサイト, 事業セグメント)
表121 アルマックグループサービス・ベンチマーク
表122 アルマックグループ戦略的展望
表123 ニプロファーマ:戦略的展望主な詳細(CEO, 本社, 売上高, 設立, 従業員数, 企業タイプ, ウェブサイト, 事業セグメント)
表 124 ニプロファーマ株式会社サービスベンチマーク
表 125 ニプロファーマ:戦略的展望戦略的展望
表126 ジュビラント・ファーマバ・リミテッド:戦略的展望主な詳細(CEO, 本社, 売上高, 設立, 従業員数, 企業タイプ, ウェブサイト, 事業セグメント)
表 127 ジュビラント・ファーマバ・リミテッドサービスベンチマーク
表 128 ジュビラント・ファーマバ・リミテッド:戦略的展望戦略的展望
表129 ファイザー主な詳細(CEO、本社、売上高、設立、従業員数、企業タイプ、ウェブサイト、事業セグメント)
表 130 ファイザーサービスベンチマーク
表131 ファイザー:戦略的展望戦略的展望
表132 Grifols, S.A.:主な詳細(CEO、本社、売上高、設立、従業員数、企業タイプ、ウェブサイト、事業セグメント)
表133 Grifols, S.A.:戦略的展望
表134 チャールズ・リバー・ラボラトリーズ主な詳細(CEO, 本社, 売上高, 設立, 従業員数, 企業タイプ, ウェブサイト, 事業セグメント)
表 135 チャールズ・リバー・ラボラトリーズサービスベンチマーク
表136 チャールズ・リバー・ラボラトリーズ戦略的展望
表137 IQVIA Inc:主な詳細(CEO, 本社, 売上高, 設立, 従業員数, 企業タイプ, ウェブサイト, 事業セグメント)
表 138 IQVIA Inc:サービスベンチマーク
表139 IQVIA Inc:戦略的展望
表140 バクスター主な詳細(CEO, 本社, 売上高, 設立, 従業員数, 企業タイプ, ウェブサイト, 事業セグメント)
表141 バクスター:サービスベンチマーク
表142 キュリア・グローバル・インク主な詳細(CEO、本社、売上高、設立、従業員数、企業タイプ、ウェブサイト、事業セグメント)
表143 キュリア グローバル社サービスベンチマーク
表144 キュリア グローバル社:戦略的展望戦略的展望
表145 ランネット:主要詳細(CEO、本社、売上高、設立、従業員数、企業タイプ、ウェブサイト、事業セグメント)
表 146 ランネット:サービスベンチマーク
図の一覧
図1 医薬品受託製造市場のセグメンテーション
図2 サービス別医薬品受託製造市場市場魅力度指数
図3 医薬品受託製造市場:医薬品タイプ別:市場魅力度指数
図4 エンドユーザー別医薬品受託製造市場:市場魅力度指数市場魅力度指数
図5 医薬品受託製造市場:事業規模別:市場魅力度指数市場魅力度指数
図6 医薬品受託製造市場:地域別市場魅力度指数
図7 医薬品受託製造市場市場ダイナミクス
図8 医薬品受託製造市場:インパクト分析
図9 医薬品受託製造市場ポーターのファイブフォース分析
図10 医薬品受託製造市場:PEST分析PEST分析
図11 医薬品受託製造市場:SWOT分析SWOT分析
図12 医薬品受託製造市場のサービス別魅力度指数
図13 医薬品受託製造市場のサービス別予測(2024年~2034年、10億米ドル、AGR)
図14 医薬品受託製造市場サービス別シェア予測(2024年、2029年、2034年)
図15 医薬品製造サービス市場タイプ別予測、2024年~2034年 (10億米ドル, AGR %)
図16 医薬品製造サービス市場地域別予測、2024年~2034年 (10億米ドル, AGR %)
図17 医薬品製造サービス地域別市場シェア予測、2024年〜2034年(%)
図18 医薬品開発サービスセグメントのタイプ別市場予測、2024~2034年 (10億米ドル, AGR %)
図19 医薬品開発サービスセグメント地域別市場予測、2024~2034年 (10億米ドル, AGR %)
図20 医薬品開発サービス地域別市場シェア予測、2024年〜2034年(%)
図21 生物製剤製造サービスセグメントのタイプ別市場予測、2024~2034年 (10億米ドル、AGR %)
図22 生物製剤製造サービス地域別市場予測、2024~2034年(10億米ドル、AGR %)
図23 生物製剤製造サービス地域別市場シェア予測、2024年〜2034年(%)
図24 医薬品受託製造市場のサービス別魅力度指数
図25 医薬品受託製造の医薬品タイプ別市場予測、2024年〜2034年(10億米ドル、AGR)
図26 医薬品受託製造の薬剤タイプ別市場予測(2024年、2029年、2034年)(%)
図27 地域別ブランドセグメント市場予測、2024年〜2034年 (10億米ドル、AGR %)
図28 地域別ブランド品セグメント市場予測、2024年&2034年(%)
図29 ジェネリック医薬品セグメントの地域別市場予測、2024~2034年 (10億米ドル, AGR %)
図30 ジェネリック医薬品セグメントの地域別市場シェア予測、2024年&2034年(%)
図31 エンドユーザー別医薬品受託製造市場魅力度指数
図32 エンドユーザー別医薬品受託製造市場予測(2024年〜2034年、10億米ドル、AGR)
図33 エンドユーザー別医薬品受託製造市場シェア予測(2024年、2029年、2034年)
図34 大手製薬企業セグメント地域別市場予測、2024年~2034年 (10億米ドル, AGR %)
図 35 地域別大手製薬企業セグメント市場予測、2024 年・2034 年(%)
図36 中小製薬企業セグメント地域別市場予測、2024~2034年 (10億米ドル、AGR %)
図 37 中小製薬企業セグメントの地域別市場シェア予測、2024 年~2034 年(%)
図38 2024~2034年後発医薬品企業セグメント地域別市場予測(10億米ドル、AGR)
図39 2024〜2034年後発医薬品企業地域別市場シェア予測(%)
図40 その他のエンドユーザーセグメント地域別市場予測、2024~2034年 (10億米ドル、AGR %)
図 41 その他のエンドユーザーセグメント地域別市場シェア予測、2024 年~2034 年(%)
図42 医薬品受託製造市場の事業規模別魅力度指数
図43 医薬品受託製造市場規模別予測(2024年~2034年)(億米ドル、AGR
図44 医薬品受託製造の事業規模別市場予測(2024年、2029年、2034年)(%)
図45 臨床セグメントの地域別市場予測、2024年~2034年 (10億米ドル、AGR %)
図46 地域別臨床セグメント市場予測、2024年&2034年(%)
図47 2024~2034年の地域別商用セグメント市場予測(10億米ドル、AGR)
図48 2024〜2034年地域別商業セグメント市場シェア予測(%)
図49 医薬品受託製造の地域別市場展望 2024年、2029年、2034年 (売上高, CAGR%)
図50 医薬品受託製造の地域別市場シェア予測:2024年、2029年、2034年(%)
図51 医薬品受託製造市場の地域別予測(2024年〜2034年、10億米ドル、AGR)
図52 北米の医薬品受託製造市場魅力度指数
図53 北米の医薬品受託製造市場(地域別):2024年、2029年&2034年(10億米ドル
図54 北米の医薬品受託製造市場の国別予測、2024年〜2034年(10億米ドル、AGR %)
図55 北米医薬品受託製造市場の国別シェア予測、2024年&2034年(%)
図56 北米医薬品受託製造市場のサービス別予測(2024〜2034年) (10億米ドル, AGR %)
図57 北米の医薬品受託製造市場サービス別シェア予測、2024年&2034年(%)
図58 北米の医薬品受託製造市場の薬剤タイプ別予測(2024〜2034年) (10億米ドル, AGR %)
図59 北米の医薬品受託製造市場:医薬品タイプ別シェア予測、2024年〜2034年(%)
図60 北米の医薬品受託製造市場のエンドユーザー別予測(2024〜2034年) (10億米ドル, AGR %)
図61 北米医薬品受託製造市場のエンドユーザー別予測、2024年〜2034年(%)
図62 北米の医薬品受託製造市場規模別予測、2024年~2034年 (10億米ドル、AGR %)
図63 北米の医薬品受託製造市場規模別シェア予測、2024年〜2034年(%)
図64 米国医薬品受託製造市場予測、2024~2034年 (10億米ドル、AGR %)
図65 カナダ医薬品受託製造市場の予測、2024年〜2034年 (10億米ドル, AGR %)
図66 欧州医薬品受託製造市場の魅力度指数
図67 欧州医薬品受託製造市場の地域別予測(2024年、2029年&2034年)(10億米ドル
図68 欧州医薬品受託製造市場の国別予測(2024〜2034年、10億米ドル、AGR)
図69 欧州医薬品受託製造市場の国別シェア予測、2024年&2034年(%)
図70 欧州医薬品受託製造市場のサービス別予測(2024〜2034年) (10億米ドル, AGR %)
図71 欧州医薬品受託製造市場サービス別シェア予測、2024年〜2034年 (%)
図72 欧州医薬品受託製造市場:医薬品タイプ別予測(2024年〜2034年) (10億米ドル, AGR %)
図73 欧州医薬品受託製造市場:医薬品タイプ別シェア予測、2024年〜2034年(%)
図74 欧州医薬品受託製造市場のエンドユーザー別予測(2024-2034年) (10億米ドル, AGR %)
図75 欧州医薬品受託製造市場のエンドユーザー別シェア予測、2024年〜2034年 (%)
図76 欧州医薬品受託製造市場規模別予測、2024~2034年 (10億米ドル、AGR %)
図77 欧州医薬品受託製造市場規模別シェア予測、2024年〜2034年(%)
図78 ドイツ医薬品受託製造市場予測、2024年~2034年 (10億米ドル, AGR %)
図79 イギリス医薬品受託製造市場の予測、2024年~2034年 (10億米ドル, AGR %)
図80 フランス医薬品受託製造市場の予測、2024年~2034年 (10億米ドル, AGR %)
図81 イタリア医薬品受託製造市場の予測、2024年~2034年 (10億米ドル, AGR %)
図82 スペインの医薬品受託製造市場の予測、2024年~2034年 (10億米ドル, AGR %)
図83 ロシアの医薬品受託製造市場の予測、2024年~2034年 (10億米ドル, AGR %)
図84 スイス医薬品受託製造市場の予測、2024年~2034年 (10億米ドル, AGR %)
図85 オランダ医薬品受託製造市場の予測、2024年~2034年 (10億米ドル, AGR %)
図86 その他のヨーロッパの医薬品受託製造市場予測、2024-2034年 (10億米ドル, AGR %)
図87 アジア太平洋地域の医薬品受託製造市場魅力度指数
図88 アジア太平洋地域の医薬品受託製造市場の地域別予測(2024年、2029年&2034年)(10億米ドル
図89 アジア太平洋地域の医薬品受託製造市場の国別予測(2024〜2034年、10億米ドル、AGR)
図90 アジア太平洋地域の医薬品受託製造市場国別シェア予測、2024年&2034年(%)
図91 アジア太平洋地域の医薬品受託製造市場のサービス別予測(2024〜2034年) (10億米ドル, AGR %)
図92 アジア太平洋地域の医薬品受託製造市場サービス別シェア予測、2024年&2034年(%)
図93 アジア太平洋地域の医薬品受託製造市場:医薬品タイプ別予測(2024年〜2034年) (10億米ドル, AGR %)
図94 アジア太平洋地域の医薬品受託製造市場:医薬品タイプ別シェア予測、2024年〜2034年(%)
図95 アジア太平洋地域の医薬品受託製造市場のエンドユーザー別予測(2024〜2034年) (10億米ドル, AGR %)
図96 アジア太平洋地域の医薬品受託製造市場のエンドユーザー別シェア予測、2024年〜2034年(%)
図97 アジア太平洋地域の医薬品受託製造市場規模別予測、2024年~2034年 (10億米ドル、AGR %)
図98 アジア太平洋地域の医薬品受託製造市場規模別シェア予測、2024年〜2034年(%)
図99 日本の医薬品受託製造市場予測、2024年〜2034年 (10億米ドル、AGR %)
図100 中国医薬品受託製造市場の予測、2024年〜2034年 (10億米ドル, AGR %)
図101 インド医薬品受託製造市場の予測、2024-2034年 (10億米ドル, AGR %)
図 102 オーストラリア医薬品受託製造市場の予測、2024年~2034年 (10億米ドル, AGR %)
図103 韓国医薬品受託製造市場の予測、2024-2034年 (10億米ドル, AGR %)
図104 マレーシア医薬品受託製造市場の予測、2024年~2034年 (10億米ドル, AGR %)
図105 シンガポール医薬品受託製造市場の予測、2024年~2034年 (10億米ドル, AGR %)
図106 インドネシア医薬品受託製造市場の予測、2024年~2034年 (10億米ドル, AGR %)
図107 その他のアジア太平洋地域の医薬品受託製造市場の予測、2024年~2034年 (10億米ドル, AGR %)
図108 ラテンアメリカ医薬品受託製造市場魅力度指数
図109 ラテンアメリカ医薬品受託製造市場の地域別市場規模(2024年、2029年&2034年)(10億米ドル
図110 ラテンアメリカ医薬品受託製造市場の国別予測(2024〜2034年、10億米ドル、AGR)
図111 ラテンアメリカ医薬品受託製造市場の国別シェア予測、2024年&2034年(%)
図112 ラテンアメリカ医薬品受託製造市場のサービス別予測(2024~2034年) (10億米ドル, AGR %)
図113 中南米の医薬品受託製造市場サービス別シェア予測、2024年&2034年(%)
図114 ラテンアメリカ医薬品受託製造市場の医薬品タイプ別予測(2024〜2034年) (10億米ドル, AGR %)
図115 ラテンアメリカ医薬品受託製造市場薬剤タイプ別シェア予測、2024年〜2034年(%)
図116 ラテンアメリカ医薬品受託製造市場のエンドユーザー別予測(2024〜2034年) (10億米ドル, AGR %)
図117 ラテンアメリカ医薬品受託製造市場のエンドユーザー別予測、2024年〜2034年 (%)
図118 中南米の医薬品受託製造市場規模別予測、2024~2034年 (10億米ドル, AGR %)
図119 中南米の医薬品受託製造市場規模別シェア予測、2024年〜2034年(%)
図120 ブラジルの医薬品受託製造市場予測、2024~2034年 (10億米ドル, AGR %)
図121 メキシコ医薬品受託製造市場予測、2024~2034年 (10億米ドル, AGR %)
図122 アルゼンチン医薬品受託製造市場の予測、2024~2034年 (10億米ドル, AGR %)
図123 コロンビアの医薬品受託製造市場の予測、2024年~2034年 (10億米ドル, AGR %)
図124 その他のラテンアメリカ医薬品受託製造市場の予測、2024年~2034年 (10億米ドル, AGR %)
図125 MEA医薬品受託製造市場の魅力度指数
図126 MEA医薬品受託製造市場の地域別予測(2024年、2029年&2034年)(10億米ドル
図127 MEA医薬品受託製造市場の国別予測、2024年~2034年(10億米ドル、AGR %)
図128 MEA医薬品受託製造の国別市場シェア予測、2024年&2034年(%)
図129 MEA医薬品受託製造市場のサービス別予測(2024~2034年) (10億米ドル, AGR %)
図130 MEA医薬品受託製造市場サービス別シェア予測、2024年〜2034年(%)
図131 MEA医薬品受託製造市場の医薬品タイプ別予測(2024~2034年) (10億米ドル, AGR %)
図132 MEA医薬品受託製造市場の薬剤タイプ別予測、2024年 & 2034年 (%)
図133 MEA医薬品受託製造市場のエンドユーザー別予測(2024-2034年) (10億米ドル, AGR %)
図134 MEA医薬品受託製造市場のエンドユーザー別予測、2024年~2034年(%)
図135 MEA医薬品受託製造の事業規模別市場予測、2024~2034年 (10億米ドル, AGR %)
図136 MEA医薬品受託製造市場規模別シェア予測、2024年~2034年(%)
図 137 GCCの医薬品受託製造市場予測、2024~2034年 (10億米ドル, AGR %)
図138 南アフリカ医薬品受託製造市場の予測、2024年~2034年 (10億米ドル, AGR %)
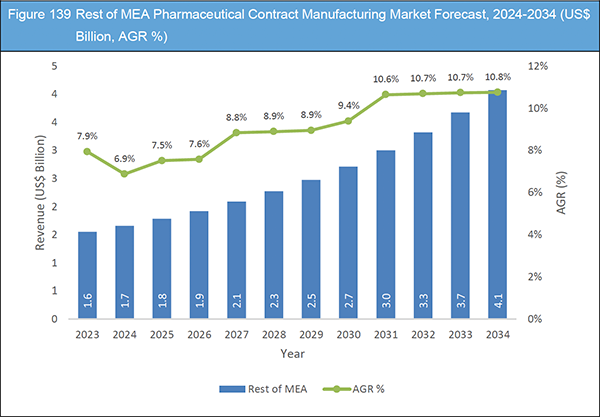
図139 その他のMEA医薬品受託製造市場の予測、2024-2034年 (10億米ドル, AGR %)
図140 ロンザ純収入, 2018-2023 (百万米ドル, AGR %)
図 141 ロンザ:R&D、2018年~2023年(百万米ドル、AGR)
図 142 ロンザ:地域別市場シェア(%), 2023
図 143 ロンザ:事業セグメント別市場シェア(%), 2023
図 144 ロンザSWOT 分析
図 145 キャタレント社純収入, 2018-2023 (百万米ドル, AGR %)
図 146 Catalent, Inc:地域別市場シェア(%), 2023
図 147 Catalent, Inc:事業セグメント別市場シェア(%), 2023
図 148 Catalent, Inc:SWOT 分析
図 149 レシファーム AB: SWOT 分析
図 150 AbbVie Inc:純収入, 2018-2023 (百万米ドル, AGR %)
図 151 AbbVie Inc:R&D, 2018-2023 (百万米ドル, AGR %)
図 152 AbbVie Inc:地域別市場シェア(%), 2023
図 153 AbbVie Inc:事業セグメント別市場シェア(%), 2023
図 154 AbbVie Inc:SWOT分析
図 155 サーモフィッシャーサイエンティフィック(Thermo Fisher Scientific Inc:純収入, 2018-2023 (百万米ドル, AGR %)
図 156 サーモフィッシャーサイエンティフィック社:R&D, 2018-2023 (百万米ドル, AGR %)
図 157 Thermo Fisher Scientific Inc:地域別市場シェア(%), 2023
図 158 Thermo Fisher Scientific Inc:事業セグメント別市場シェア(%), 2023
図 159 サーモフィッシャーサイエンティフィック:SWOT分析
図 160 ジークフリード・ホールディング AG:純収入、2018 年~2023 年(百万米ドル、AGR %)
図 161 ジークフリード・ホールディング AG:事業セグメント別市場シェア(%)、2023 年
図 162 エボニック・インダストリーズAG:純収入、2018 年~2023 年(百万米ドル、AGR %)
図 163 エボニック・インダストリーズAG:地域別市場シェア(%)、2023 年
図 164 エボニック・インダストリーズAG: 事業セグメント別市場シェア(%), 2023年
図 165 ベーリンガーインゲルハイム・インターナショナルGmbH:純収入、2018 年~2023 年(百万米ドル、AGR %)
図 166 ベーリンガーインゲルハイム・インターナショナルGmbH:地域別市場シェア(%)、2023 年
図 167 ベーリンガーインゲルハイム・インターナショナルGmbH:事業セグメント別市場シェア(%)、2023 年
図168 三星生物製剤:純収入、2018年~2023年(百万米ドル、AGR)
図 169 WuXi AppTec:純収入, 2018-2023 (百万米ドル, AGR %)
図 170 呉西 AppTec:地域別市場シェア(%), 2023
図 171 呉西 AppTec:事業セグメント別市場シェア(%), 2023
図 172 富士フイルムジオシンスバイオテクノロジーズ:純収入, 2018-2023 (US$ Million, AGR %)
図 173 富士フイルムジオシンスバイオテクノロジーズ:R&D, 2018-2023 (百万米ドル, AGR %)
図 174 ICON plc:純収入, 2018-2023 (百万米ドル, AGR %)
図 175 ICON plc:地域別市場シェア(%), 2023
図 176 アエノバ・グループ純収入, 2018-2022 (百万米ドル, AGR %)
図 177 Aenova Group:地域別市場シェア(%), 2022
図 178 アエノバ・グループ:事業セグメント別市場シェア(%), 2022
図 179 ニプロファーマ・コーポレーション:純収入, 2018-2023 (百万米ドル, AGR %)
図 180 ニプロファーマ株式会社:R&D, 2018-2023 (百万米ドル, AGR %)
図 181 ニプロファーマ株式会社:地域別市場シェア(%)地域別市場シェア(%), 2023
図 182 ニプロファーマ株式会社:事業セグメント別市場シェア(%)事業セグメント別市場シェア(%), 2023
図 183 ファイザー純収入、2018年~2023年(百万米ドル、AGR %)
図 184 ファイザーR&D、2018年-2023年(百万米ドル、AGR)
図 185 ファイザー株式会社:地域別市場シェア(%), 2023
図 186 ファイザー事業セグメント別市場シェア(%), 2023
図 187 Grifols, S.A.:純収入、2018年~2023年(百万米ドル、AGR %)
図188 Grifols, S.A.:研究開発費、2018年~2023年(百万米ドル、AGR)
図 189 チャールズ・リバー・ラボラトリーズ純収入、2018年~2023年(百万米ドル、AGR)
図 190 チャールズ・リバー・ラボラトリーズ地域別市場シェア(%), 2023
図 191 チャールズ・リバー・ラボラトリーズ事業セグメント別市場シェア(%), 2023年
図 192 IQVIA Inc:純収入、2018年〜2023年(百万米ドル、AGR)
図 193 IQVIA Inc:地域別市場シェア(%), 2023
図 194 IQVIA Inc:事業セグメント別市場シェア(%), 2023
図195 バクスター純収入、2018年〜2023年(百万米ドル、AGR)
図 196 バクスターR&D、2018年-2023年(百万米ドル、AGR)
図197 バクスター地域別市場シェア(%), 2023
図 198 バクスター:事業セグメント別市場シェア(%)、2023 年
ページTOPに戻る
Summary
Report Details
The Pharmaceutical Contract Manufacturing Market Report 2024-2034: This report will prove invaluable to leading firms striving for new revenue pockets if they wish to better understand the industry and its underlying dynamics. It will be useful for companies that would like to expand into different industries or to expand their existing operations in a new region.
High Cost of In-house Drug Development
The rising costs associated with in-house drug development and manufacturing are driving significant growth in the pharmaceutical contract manufacturing market. The process of developing a new drug, from discovery to market launch, can exceed $2 billion and span over a decade. These substantial financial requirements are compelling pharmaceutical companies to outsource their manufacturing needs to Contract Development and Manufacturing Organizations (CDMOs), which provide cost efficiencies through economies of scale and specialized expertise.
Companies such as Thermo Fisher Scientific and Samsung Biologics are expanding their contract manufacturing capabilities to meet the growing demand from pharmaceutical firms seeking to reduce operational costs. These CDMOs offer comprehensive end-to-end services, ranging from early-stage development to commercial-scale manufacturing, thereby enabling pharmaceutical companies to lower their in-house expenditures.
In addition, the financial pressures resulting from escalating R&D costs, increased regulatory scrutiny, and heightened market competition are driving pharmaceutical companies to seek more cost-effective solutions. Outsourcing to CDMOs allows these companies to allocate their resources more strategically, focusing on innovation and market expansion while relying on contract manufacturers for efficient and scalable production.
Varying Regulatory Requirements Across Regions
Ensuring compliance with regulatory guidelines and maintaining high-quality standards are critical imperatives for the pharmaceutical industry, as noncompliance and substandard drug quality can have severe repercussions for both business operations and brand reputation. In the realm of Contract Development and Manufacturing Organizations (CDMOs), the drugs produced under contract are marketed under the brand name of the contractor, necessitating meticulous adherence to regulatory requirements.
The drug development process involves extensive data collection and submission to regulatory authorities throughout various stages, including development and clinical trials. For CDMOs, managing and submitting this data across multiple formulations and jurisdictions poses significant challenges. The complexity of handling diverse regulatory submissions and the potential for errors in regulatory filings can impede the efficiency and effectiveness of CDMOs.
These regulatory and quality control challenges are likely to impact the growth trajectory of the pharmaceutical CDMO market in the forthcoming years. As the industry continues to evolve, CDMOs must navigate the complexities of regulatory compliance while striving to maintain high-quality manufacturing standards to mitigate risks and sustain market growth.
What Questions Should You Ask before Buying a Market Research Report?
-
How is the pharmaceutical contract manufacturing market evolving?
-
What is driving and restraining the pharmaceutical contract manufacturing market?
-
How will each pharmaceutical contract manufacturing submarket segment grow over the forecast period and how much revenue will these submarkets account for in 2034?
-
How will the market shares for each pharmaceutical contract manufacturing submarket develop from 2024 to 2034?
-
What will be the main driver for the overall market from 2024 to 2034?
-
Will leading pharmaceutical contract manufacturing markets broadly follow the macroeconomic dynamics, or will individual national markets outperform others?
-
How will the market shares of the national markets change by 2034 and which geographical region will lead the market in 2034?
-
Who are the leading players and what are their prospects over the forecast period?
-
What are the pharmaceutical contract manufacturing projects for these leading companies?
-
How will the industry evolve during the period between 2024 and 2034? What are the implications of
pharmaceutical contract manufacturing projects taking place now and over the next 10 years?
-
Is there a greater need for product commercialisation to further scale the pharmaceutical contract manufacturing market?
-
Where is the pharmaceutical contract manufacturing market heading and how can you ensure you are at the forefront of the market?
-
What are the best investment options for new product and service lines?
-
What are the key prospects for moving companies into a new growth path and C-suite?
You need to discover how this will impact the pharmaceutical contract manufacturing market today, and over the next 10 years:
-
Our 349-page report provides 143 tables and 198 charts/graphs exclusively to you.
-
The report highlights key lucrative areas in the industry so you can target them – NOW.
-
It contains in-depth analysis of global, regional and national sales and growth.
-
It highlights for you the key successful trends, changes and revenue projections made by your competitors.
Forecasts to 2034 and other analyses reveal commercial prospects
-
In addition to revenue forecasting to 2034, our new study provides you with recent results, growth rates, and market shares.
-
You will find original analyses, with business outlooks and developments.
-
Discover qualitative analyses (including market dynamics, drivers, opportunities, and restraints), Porter’s Five Forces Analysis, PEST Analysis and recent developments.
Segments Covered in the Report
Services
-
Pharmaceutical Manufacturing Services
-
Drug Development Services
-
Biologics Manufacturing Services
Drug Type
End-users
-
Big Pharmaceutical Companies
-
Small & Medium-sized Pharmaceutical Companies
-
Generic Pharmaceutical Companies
-
Other End-users
Scale of Operation
In addition to the revenue predictions for the overall world market and segments, you will also find revenue forecasts for five regional and 28 leading national markets:
North America
Europe
-
Germany
-
UK
-
France
-
Italy
-
Spain
-
Russia
-
Switzerland
-
Netherlands
-
Rest of Europe
Asia Pacific
-
Japan
-
China
-
India
-
Australia
-
South Korea
-
Malaysia
-
Singapore
-
Indonesia
-
Rest of Asia Pacific
Latin America
-
Brazil
-
Mexico
-
Argentina
-
Colombia
-
Rest of Latin America
MEA
-
GCC
-
South Africa
-
Rest of MEA
The report also includes profiles for some of the leading companies in the Pharmaceutical Contract Manufacturing Market, 2024 to 2034, with a focus on this segment of these companies’ operations.
Leading companies profiled in the report
-
AbbVie Inc.
-
Abnova Corporation
-
Aenova Group
-
Almac Group
-
Baxter
-
Boehringer Ingelheim International GmbH
-
Catalent, Inc.
-
Charles River Laboratories
-
Curia Global, Inc.
-
Evonik Industries AG
-
FUJIFILM Diosynth Biotechnologies
-
Grifols, S.A.
-
ICON plc
-
IQVIA Inc.
-
Jubilant Pharmova Limited
-
Lannett
-
Lonza
-
Nipro Pharma Corporation
-
Piramal Pharma Solutions
-
Pfizer Inc.
-
Recipharm AB
-
Samsung Biologics
-
Siegfried Holding AG
-
Thermo Fisher Scientific Inc.
-
Vetter Pharma
-
WuXi AppTec
Overall world revenue for Pharmaceutical Contract Manufacturing Market, 2024 to 2034 in terms of value the market will surpass US$155 billion in 2024, our work calculates. We predict strong revenue growth through to 2034. Our work identifies which organizations hold the greatest potential. Discover their capabilities, progress, and commercial prospects, helping you stay ahead.
How will the Pharmaceutical Contract Manufacturing Market, 2024 to 2034 report help you?
In summary, our 340+ page report provides you with the following knowledge:
-
Revenue forecasts to 2034 for Pharmaceutical Contract Manufacturing Market 2024 to 2034, with forecasts for services, drug type, end-users, and scale of operation, each forecast at a global and regional level – discover the industry’s prospects, finding the most lucrative places for investments and revenues.
-
Revenue forecasts to 2034 for five regional and 28 key national markets – See forecasts for the Pharmaceutical Contract Manufacturing Market, 2024 to 2034 market in North America, Europe, Asia-Pacific, Latin America, and MEA. Also forecasted is the market in the US, Canada, Mexico, Brazil, Germany, France, UK, Italy, China, India, Japan, and Australia among other prominent economies.
-
Prospects for established firms and those seeking to enter the market – including company profiles for 26 of the major companies involved in the Pharmaceutical Contract Manufacturing Market, 2024 to 2034.
Find quantitative and qualitative analyses with independent predictions. Receive information that only our report contains, staying informed with invaluable business intelligence.
Information found nowhere else
With our new report, you are less likely to fall behind in knowledge or miss out on opportunities. See how our work could benefit your research, analyses, and decisions. Visiongain’s study is for everybody needing commercial analyses for the Pharmaceutical Contract Manufacturing Market 2024 to 2034, market-leading companies. You will find data, trends and predictions.
ページTOPに戻る
Table of Contents
1 Report Overview
1.1 Objectives of the Study
1.2 Introduction to Pharmaceutical Contract Manufacturing Market
1.3 What This Report Delivers
1.4 Why You Should Read This Report
1.5 Key Questions Answered by This Analytical Report Include:
1.6 Who is This Report For?
1.7 Methodology
1.7.1 Market Definitions
1.7.2 Market Evaluation & Forecasting Methodology
1.7.3 Data Validation
1.7.3.1 Primary Research
1.7.3.2 Secondary Research
1.8 Frequently Asked Questions (FAQs)
1.9 Associated Visiongain Reports
1.10 About Visiongain
2 Executive Summary
3 Market Overview
3.1 Key Findings
3.2 Market Dynamics
3.3 Impact Analysis
3.3.1 Market Driving Factors
3.3.1.1 Patent Expiry and Increasing Demand for Generic Drugs
3.3.1.2 Increasing Investments in Pharmaceutical R&D
3.3.1.3 Investments in Advanced Manufacturing Technologies by CDMOs
3.3.2 Market Restraining Factors
3.3.2.1 Introduction of Serialization
3.3.2.2 Varying Regulatory Scenarios
3.3.3 Market Opportunities
3.3.3.1 Increasing Demand for Biological Therapies
3.3.3.2 Growth in the Nuclear Medicine Sector
3.3.3.3 Growing Demand for Cell and Gene Therapies
3.4 Regulatory Framework
3.5 Emerging Markets and Megatrends
3.6 Porter’s Five Forces Analysis
3.6.1 Bargaining Power of Supplier
3.6.2 Bargaining Power of Buyer
3.6.3 Threat of New Entrants
3.6.4 Threat of Substitutes
3.6.5 Competitive Rivalry
3.7 PEST Analysis
3.8 SWOT Analysis
4 Pharmaceutical Contract Manufacturing Market Analysis by Services
4.1 Key Findings
4.2 Services Segment: Market Attractiveness Index
4.3 Pharmaceutical Contract Manufacturing Market Size Estimation and Forecast by Services
4.4 Pharmaceutical Manufacturing Services
4.4.1 Market Forecast by Type, 2024-2034 (US$ Billion, AGR %)
4.4.2 Market Forecast by Region, 2024-2034 (US$ Billion, AGR %)
4.4.3 Market Share by Region, 2024 & 2034 (%)
4.5 Drug Development Services
4.5.1 Market Forecast by Type, 2024-2034 (US$ Billion, AGR %)
4.5.2 Market Forecast by Region, 2024-2034 (US$ Billion, AGR %)
4.5.3 Market Share by Region, 2024 & 2034 (%)
4.6 Biologics Manufacturing Services
4.6.1 Market Forecast by Type, 2024-2034 (US$ Billion, AGR %)
4.6.2 Market Forecast by Region, 2024-2034 (US$ Billion, AGR %)
4.6.3 Market Share by Region, 2024 & 2034 (%)
5 Pharmaceutical Contract Manufacturing Market Analysis by Drug Type
5.1 Key Findings
5.2 Drug Type Segment: Market Attractiveness Index
5.3 Pharmaceutical Contract Manufacturing Market Size Estimation and Forecast by Drug Type
5.4 Branded
5.4.1 Market Forecast by Region, 2024-2034 (US$ Billion, AGR %)
5.4.2 Market Share by Region, 2024 & 2034 (%)
5.5 Generics
5.5.1 Market Forecast by Region, 2024-2034 (US$ Billion, AGR %)
5.5.2 Market Share by Region, 2024 & 2034 (%)
6 Pharmaceutical Contract Manufacturing Market Analysis by End-users
6.1 Key Findings
6.2 End-users Segment: Market Attractiveness Index
6.3 Pharmaceutical Contract Manufacturing Market Size Estimation and Forecast by End-users
6.4 Big Pharmaceutical Companies
6.4.1 Market Forecast by Region, 2024-2034 (US$ Billion, AGR %)
6.4.2 Market Share by Region, 2024 & 2034 (%)
6.5 Small & Medium-sized Pharmaceutical Companies
6.5.1 Market Forecast by Region, 2024-2034 (US$ Billion, AGR %)
6.5.2 Market Share by Region, 2024 & 2034 (%)
6.6 Generic Pharmaceutical Companies
6.6.1 Market Forecast by Region, 2024-2034 (US$ Billion, AGR %)
6.6.2 Market Share by Region, 2024 & 2034 (%)
6.7 Other End-users
6.7.1 Market Forecast by Region, 2024-2034 (US$ Billion, AGR %)
6.7.2 Market Share by Region, 2024 & 2034 (%)
7 Pharmaceutical Contract Manufacturing Market Analysis by Scale of Operation
7.1 Key Findings
7.2 Scale of Operation Segment: Market Attractiveness Index
7.3 Pharmaceutical Contract Manufacturing Market Size Estimation and Forecast by Scale of Operation
7.4 Clinical
7.4.1 Market Forecast by Region, 2024-2034 (US$ Billion, AGR %)
7.4.2 Market Share by Region, 2024 & 2034 (%)
7.5 Commercial
7.5.1 Market Forecast by Region, 2024-2034 (US$ Billion, AGR %)
7.5.2 Market Share by Region, 2024 & 2034 (%)
8 Pharmaceutical Contract Manufacturing Market Analysis by Region
8.1 Key Findings
8.2 Regional Market Size Estimation and Forecast
9 North America Pharmaceutical Contract Manufacturing Market Analysis
9.1 Key Findings
9.2 North America Pharmaceutical Contract Manufacturing Market Attractiveness Index
9.3 North America Pharmaceutical Contract Manufacturing Market by Country, 2024, 2029 & 2034 (US$ Billion)
9.4 North America Pharmaceutical Contract Manufacturing Market Size Estimation and Forecast by Country
9.5 North America Pharmaceutical Contract Manufacturing Market Size Estimation and Forecast by Services
9.6 North America Pharmaceutical Contract Manufacturing Market Size Estimation and Forecast by Drug Type
9.7 North America Pharmaceutical Contract Manufacturing Market Size Estimation and Forecast by End-users
9.8 North America Pharmaceutical Contract Manufacturing Market Size Estimation and Forecast by Scale of Operation
9.9 U.S. Pharmaceutical Contract Manufacturing Market Analysis
9.10 Canada Pharmaceutical Contract Manufacturing Market Analysis
10 Europe Pharmaceutical Contract Manufacturing Market Analysis
10.1 Key Findings
10.2 Europe Pharmaceutical Contract Manufacturing Market Attractiveness Index
10.3 Europe Pharmaceutical Contract Manufacturing Market by Country, 2024, 2029 & 2034 (US$ Billion)
10.4 Europe Pharmaceutical Contract Manufacturing Market Size Estimation and Forecast by Country
10.5 Europe Pharmaceutical Contract Manufacturing Market Size Estimation and Forecast by Services
10.6 Europe Pharmaceutical Contract Manufacturing Market Size Estimation and Forecast by Drug Type
10.7 Europe Pharmaceutical Contract Manufacturing Market Size Estimation and Forecast by End-users
10.8 Europe Pharmaceutical Contract Manufacturing Market Size Estimation and Forecast by Scale of Operation
10.9 Germany Pharmaceutical Contract Manufacturing Market Analysis
10.10 UK Pharmaceutical Contract Manufacturing Market Analysis
10.11 France Pharmaceutical Contract Manufacturing Market Analysis
10.12 Italy Pharmaceutical Contract Manufacturing Market Analysis
10.13 Spain Pharmaceutical Contract Manufacturing Market Analysis
10.14 Russia Pharmaceutical Contract Manufacturing Market Analysis
10.15 Switzerland Pharmaceutical Contract Manufacturing Market Analysis
10.16 Netherlands Pharmaceutical Contract Manufacturing Market Analysis
10.17 Rest of Europe Pharmaceutical Contract Manufacturing Market Analysis
11 Asia Pacific Pharmaceutical Contract Manufacturing Market Analysis
11.1 Key Findings
11.2 Asia Pacific Pharmaceutical Contract Manufacturing Market Attractiveness Index
11.3 Asia Pacific Pharmaceutical Contract Manufacturing Market by Country, 2024, 2029 & 2034 (US$ Billion)
11.4 Asia Pacific Pharmaceutical Contract Manufacturing Market Size Estimation and Forecast by Country
11.5 Asia Pacific Pharmaceutical Contract Manufacturing Market Size Estimation and Forecast by Services
11.6 Asia Pacific Pharmaceutical Contract Manufacturing Market Size Estimation and Forecast by Drug Type
11.7 Asia Pacific Pharmaceutical Contract Manufacturing Market Size Estimation and Forecast by End-users
11.8 Asia Pacific Pharmaceutical Contract Manufacturing Market Size Estimation and Forecast by Scale of Operation
11.9 Japan Pharmaceutical Contract Manufacturing Market Analysis
11.10 China Pharmaceutical Contract Manufacturing Market Analysis
11.11 India Pharmaceutical Contract Manufacturing Market Analysis
11.12 Australia Pharmaceutical Contract Manufacturing Market Analysis
11.13 South Korea Pharmaceutical Contract Manufacturing Market Analysis
11.14 Malaysia Contract Manufacturing Market Analysis
11.15 Singapore Pharmaceutical Contract Manufacturing Market Analysis
11.16 Indonesia Pharmaceutical Contract Manufacturing Market Analysis
11.17 Rest of Asia Pacific Pharmaceutical Contract Manufacturing Market Analysis
12 Latin America Pharmaceutical Contract Manufacturing Market Analysis
12.1 Key Findings
12.2 Latin America Pharmaceutical Contract Manufacturing Market Attractiveness Index
12.3 Latin America Pharmaceutical Contract Manufacturing Market by Country, 2024, 2029 & 2034 (US$ Billion)
12.4 Latin America Pharmaceutical Contract Manufacturing Market Size Estimation and Forecast by Country
12.5 Latin America Pharmaceutical Contract Manufacturing Market Size Estimation and Forecast by Services
12.6 Latin America Pharmaceutical Contract Manufacturing Market Size Estimation and Forecast by Drug Type
12.7 Latin America Pharmaceutical Contract Manufacturing Market Size Estimation and Forecast by End-users
12.8 Latin America Pharmaceutical Contract Manufacturing Market Size Estimation and Forecast by Scale of Operation
12.9 Brazil Pharmaceutical Contract Manufacturing Market Analysis
12.10 Mexico Pharmaceutical Contract Manufacturing Market Analysis
12.11 Argentina Pharmaceutical Contract Manufacturing Market Analysis
12.12 Colombia Pharmaceutical Contract Manufacturing Market Analysis
12.13 Rest of Latin America Pharmaceutical Contract Manufacturing Market Analysis
13 MEA Pharmaceutical Contract Manufacturing Market Analysis
13.1 Key Findings
13.2 MEA Pharmaceutical Contract Manufacturing Market Attractiveness Index
13.3 MEA Pharmaceutical Contract Manufacturing Market by Country, 2024, 2029 & 2034 (US$ Billion)
13.4 MEA Pharmaceutical Contract Manufacturing Market Size Estimation and Forecast by Country
13.5 MEA Pharmaceutical Contract Manufacturing Market Size Estimation and Forecast by Services
13.6 MEA Pharmaceutical Contract Manufacturing Market Size Estimation and Forecast by Drug Type
13.7 MEA Pharmaceutical Contract Manufacturing Market Size Estimation and Forecast by End-users
13.8 MEA Pharmaceutical Contract Manufacturing Market Size Estimation and Forecast by Scale of Operation
13.9 GCC Pharmaceutical Contract Manufacturing Market Analysis
13.10 South Africa Pharmaceutical Contract Manufacturing Market Analysis
13.11 Rest of MEA Pharmaceutical Contract Manufacturing Market Analysis
14 Company Profiles
14.1 Competitive Landscape
14.2 Lonza
14.2.1 Company Snapshot
14.2.2 Company Overview
14.2.3 Financial Analysis
14.2.3.1 Net Revenue, 2018-2023
14.2.3.2 R&D, 2018-2023
14.2.3.3 Regional Market Shares, 2023
14.2.3.4 Business Segment Market Shares, 2023
14.2.4 Service Benchmarking
14.2.5 Strategic Outlook
14.2.6 SWOT Analysis
14.3 Catalent, Inc.
14.3.1 Company Snapshot
14.3.2 Company Overview
14.3.3 Financial Analysis
14.3.3.1 Net Revenue, 2018-2023
14.3.3.2 Regional Market Shares, 2023
14.3.3.3 Business Segment Market Shares, 2023
14.3.4 Service Benchmarking
14.3.5 Strategic Outlook
14.3.6 SWOT Analysis
14.4 Recipharm AB
14.4.1 Company Snapshot
14.4.2 Company Overview
14.4.3 Service Benchmarking
14.4.4 Strategic Outlook
14.4.5 SWOT Analysis
14.5 AbbVie Inc.
14.5.1 Company Snapshot
14.5.2 Company Overview
14.5.3 Financial Analysis
14.5.3.1 Net Revenue, 2018-2023
14.5.3.2 R&D, 2018-2023
14.5.3.3 Regional Market Shares, 2023
14.5.3.4 Business Segment Market Shares, 2023
14.5.4 Service Benchmarking
14.5.5 SWOT Analysis
14.6 Thermo Fisher Scientific Inc.
14.6.1 Company Snapshot
14.6.2 Company Overview
14.6.3 Financial Analysis
14.6.3.1 Net Revenue, 2018-2023
14.6.3.2 R&D, 2018-2023
14.6.3.3 Regional Market Shares, 2023
14.6.3.4 Business Segment Market Shares, 2023
14.6.4 Service Benchmarking
14.6.5 Strategic Outlook
14.6.6 SWOT Analysis
14.7 Siegfried Holding AG
14.7.1 Company Snapshot
14.7.2 Company Overview
14.7.3 Financial Analysis
14.7.3.1 Net Revenue, 2018-2023
14.7.3.2 Business Segment Market Shares, 2023
14.7.4 Service Benchmarking
14.7.5 Strategic Outlook
14.8 Evonik Industries AG
14.8.1 Company Snapshot
14.8.2 Company Overview
14.8.3 Financial Analysis
14.8.3.1 Net Revenue, 2018-2023
14.8.3.2 Regional Market Shares, 2023
14.8.3.3 Business Segment Market Shares, 2023
14.8.4 Service Benchmarking
14.8.5 Strategic Outlook
14.9 Boehringer Ingelheim International GmbH
14.9.1 Company Snapshot
14.9.2 Company Overview
14.9.3 Financial Analysis
14.9.3.1 Net Revenue, 2018-2023
14.9.3.2 Regional Market Shares, 2023
14.9.3.3 Business Segment Market Shares, 2023
14.9.4 Service Benchmarking
14.10 Piramal Pharma Solutions
14.10.1 Company Snapshot
14.10.2 Company Overview
14.10.3 Service Benchmarking
14.10.4 Strategic Outlook
14.11 Samsung Biologics
14.11.1 Company Snapshot
14.11.2 Company Overview
14.11.3 Financial Analysis
14.11.3.1 Net Revenue, 2018-2023
14.11.4 Service Benchmarking
14.11.5 Strategic Outlook
14.12 WuXi AppTec
14.12.1 Company Snapshot
14.12.2 Company Overview
14.12.3 Financial Analysis
14.12.3.1 Net Revenue, 2018-2023
14.12.3.2 Regional Market Shares, 2023
14.12.3.3 Business Segment Market Shares, 2023
14.12.4 Service Benchmarking
14.12.5 Strategic Outlook
14.13 FUJIFILM Diosynth Biotechnologies
14.13.1 Company Snapshot
14.13.2 Company Overview
14.13.3 Financial Analysis
14.13.3.1 Net Revenue, 2018-2023
14.13.3.2 R&D, 2018-2023
14.13.4 Service Benchmarking
14.13.5 Strategic Outlook
14.14 ICON plc
14.14.1 Company Snapshot
14.14.2 Company Overview
14.14.3 Financial Analysis
14.14.3.1 Net Revenue, 2018-2023
14.14.3.2 Regional Market Shares, 2023
14.14.4 Service Benchmarking
14.14.5 Strategic Outlook
14.15 Abnova Corporation
14.15.1 Company Snapshot
14.15.2 Company Overview
14.15.3 Service Benchmarking
14.15.4 Strategic Outlook
14.16 Vetter Pharma
14.16.1 Company Snapshot
14.16.2 Company Overview
14.16.3 Service Benchmarking
14.16.4 Strategic Outlook
14.17 Aenova Group
14.17.1 Company Snapshot
14.17.2 Company Overview
14.17.3 Financial Analysis
14.17.3.1 Net Revenue, 2018-2022
14.17.3.2 Regional Market Shares, 2022
14.17.3.3 Business Segment Market Shares, 2022
14.17.4 Service Benchmarking
14.17.5 Strategic Outlook
14.18 Almac Group
14.18.1 Company Snapshot
14.18.2 Company Overview
14.18.3 Service Benchmarking
14.18.4 Strategic Outlook
14.19 Nipro Pharma Corporation
14.19.1 Company Snapshot
14.19.2 Company Overview
14.19.3 Financial Analysis
14.19.3.1 Net Revenue, 2018-2023
14.19.3.2 R&D, 2018-2023
14.19.3.3 Regional Market Shares, 2023
14.19.3.4 Business Segment Market Shares, 2023
14.19.4 Service Benchmarking
14.19.5 Strategic Outlook
14.20 Jubilant Pharmova Limited
14.20.1 Company Snapshot
14.20.2 Company Overview
14.20.3 Service Benchmarking
14.20.4 Strategic Outlook
14.21 Pfizer Inc.
14.21.1 Company Snapshot
14.21.2 Company Overview
14.21.3 Financial Analysis
14.21.3.1 Net Revenue, 2018-2023
14.21.3.2 R&D, 2018-2023
14.21.3.3 Regional Market Shares, 2023
14.21.3.4 Business Segment Market Shares, 2023
14.21.4 Service Benchmarking
14.21.5 Strategic Outlook
14.22 Grifols, S.A.
14.22.1 Company Snapshot
14.22.2 Company Overview
14.22.3 Financial Analysis
14.22.3.1 Net Revenue, 2018-2023
14.22.3.2 R&D, 2018-2023
14.22.4 Strategic Outlook
14.23 Charles River Laboratories
14.23.1 Company Snapshot
14.23.2 Company Overview
14.23.3 Financial Analysis
14.23.3.1 Net Revenue, 2018-2023
14.23.3.2 Regional Market Shares, 2023
14.23.3.3 Business Segment Market Shares, 2023
14.23.4 Service Benchmarking
14.23.5 Strategic Outlook
14.24 IQVIA Inc.
14.24.1 Company Snapshot
14.24.2 Company Overview
14.24.3 Financial Analysis
14.24.3.1 Net Revenue, 2018-2023
14.24.3.2 Regional Market Shares, 2023
14.24.3.3 Business Segment Market Shares, 2023
14.24.4 Service Benchmarking
14.24.5 Strategic Outlook
14.25 Baxter
14.25.1 Company Snapshot
14.25.2 Company Overview
14.25.3 Financial Analysis
14.25.3.1 Net Revenue, 2018-2023
14.25.3.2 R&D, 2018-2023
14.25.3.3 Regional Market Shares, 2023
14.25.3.4 Business Segment Market Shares, 2023
14.25.4 Service Benchmarking
14.26 Curia Global, Inc.
14.26.1 Company Snapshot
14.26.2 Company Overview
14.26.3 Service Benchmarking
14.26.4 Strategic Outlook
14.27 Lannett
14.27.1 Company Snapshot
14.27.2 Company Overview
14.27.3 Service Benchmarking
15 Conclusion and Recommendations
15.1 Concluding Remarks from Visiongain
15.2 Recommendations for Market Players
ページTOPに戻る
List of Tables/Graphs
List of Tables
Table 1 Pharmaceutical Contract Manufacturing Market Snapshot, 2024 & 2034 (US$ million, CAGR %)
Table 2 Pharmaceutical Contract Manufacturing Market Forecast by Services, 2024-2034 (US$ Billion, AGR %, CAGR %)
Table 3 Pharmaceutical Manufacturing Services Segment Market Forecast by Type, 2024-2034 (US$ Billion, AGR %, CAGR %)
Table 4 Pharmaceutical Manufacturing Services Segment Market Forecast by Region, 2024-2034 (US$ Billion, AGR %, CAGR %)
Table 5 Drug Development Services Segment Market Forecast by Type, 2024-2034 (US$ Billion, AGR %, CAGR %)
Table 6 Drug Development Services Segment Market Forecast by Region, 2024-2034 (US$ Billion, AGR %, CAGR %)
Table 7 Biologics Manufacturing Services Segment Market Forecast by Type, 2024-2034 (US$ Billion, AGR %, CAGR %)
Table 8 Biologics Manufacturing Services Segment Market Forecast by Region, 2024-2034 (US$ Billion, AGR %, CAGR %)
Table 9 Pharmaceutical Contract Manufacturing Market Forecast by End-users, 2024-2034 (US$ Billion, AGR %, CAGR %)
Table 10 Branded Segment Market Forecast by Region, 2024-2034 (US$ Billion, AGR %, CAGR %)
Table 11 Generics Segment Market Forecast by Region, 2024-2034 (US$ Billion, AGR %, CAGR %)
Table 12 Pharmaceutical Contract Manufacturing Market Forecast by End-users, 2024-2034 (US$ Billion, AGR %, CAGR %)
Table 13 Big Pharmaceutical Companies Segment Market Forecast by Region, 2024-2034 (US$ Billion, AGR %, CAGR %)
Table 14 Small & Medium-sized Pharmaceutical Companies Segment Market Forecast by Region, 2024-2034 (US$ Billion, AGR %, CAGR %)
Table 15 Generic Pharmaceutical Companies Segment Market Forecast by Region, 2024-2034 (US$ Billion, AGR %, CAGR %)
Table 16 Other End-users Segment Market Forecast by Region, 2024-2034 (US$ Billion, AGR %, CAGR %)
Table 17 Pharmaceutical Contract Manufacturing Market Forecast by Pharmaceutical Manufacturing Services, 2024-2034 (US$ Billion, AGR %, CAGR %)
Table 18 Clinical Segment Market Forecast by Region, 2024-2034 (US$ Billion, AGR %, CAGR %)
Table 19 Commercial Segment Market Forecast by Region, 2024-2034 (US$ Billion, AGR %, CAGR %)
Table 20 Pharmaceutical Contract Manufacturing Market Forecast by Region, 2024-2034 (US$ Billion, AGR %, CAGR %)
Table 21 North America Pharmaceutical Contract Manufacturing Market Forecast by Country, 2024-2034 (US$ Billion, AGR %, CAGR %)
Table 22 North America Pharmaceutical Contract Manufacturing Market Forecast by Services, 2024-2034 (US$ Billion, AGR %, CAGR %)
Table 23 North America Pharmaceutical Contract Manufacturing Market Forecast by End-users, 2024-2034 (US$ Billion, AGR %, CAGR %)
Table 24 North America Pharmaceutical Contract Manufacturing Market Forecast by End-users, 2024-2034 (US$ Billion, AGR %, CAGR %)
Table 25 North America Pharmaceutical Contract Manufacturing Market Forecast by Scale of Operation, 2024-2034 (US$ Billion, AGR %, CAGR %)
Table 26 U.S. Pharmaceutical Contract Manufacturing Market Forecast, 2024-2034 (US$ Bn, AGR %, CAGR %)
Table 27 Canada Pharmaceutical Contract Manufacturing Market Forecast, 2024-2034 (US$ Bn, AGR %, CAGR %)
Table 28 Europe Pharmaceutical Contract Manufacturing Market Forecast by Country, 2024-2034 (US$ Billion, AGR %, CAGR %)
Table 29 Europe Pharmaceutical Contract Manufacturing Market Forecast by Services, 2024-2034 (US$ Billion, AGR %, CAGR %)
Table 30 Europe Pharmaceutical Contract Manufacturing Market Forecast by End-users, 2024-2034 (US$ Billion, AGR %, CAGR %)
Table 31 Europe Pharmaceutical Contract Manufacturing Market Forecast by End-users, 2024-2034 (US$ Billion, AGR %, CAGR %)
Table 32 Europe Pharmaceutical Contract Manufacturing Market Forecast by Scale of Operation, 2024-2034 (US$ Billion, AGR %, CAGR %)
Table 33 Germany Pharmaceutical Contract Manufacturing Market Forecast, 2024-2034 (US$ Bn, AGR %, CAGR %)
Table 34 UK Pharmaceutical Contract Manufacturing Market Forecast, 2024-2034 (US$ Bn, AGR %, CAGR %)
Table 35 France Pharmaceutical Contract Manufacturing Market Forecast, 2024-2034 (US$ Bn, AGR %, CAGR %)
Table 36 Italy Pharmaceutical Contract Manufacturing Market Forecast, 2024-2034 (US$ Bn, AGR %, CAGR %)
Table 37 Spain Pharmaceutical Contract Manufacturing Market Forecast, 2024-2034 (US$ Bn, AGR %, CAGR %)
Table 38 Russia Pharmaceutical Contract Manufacturing Market Forecast, 2024-2034 (US$ Bn, AGR %, CAGR %)
Table 39 Switzerland Pharmaceutical Contract Manufacturing Market Forecast, 2024-2034 (US$ Bn, AGR %, CAGR %)
Table 40 Netherlands Pharmaceutical Contract Manufacturing Market Forecast, 2024-2034 (US$ Bn, AGR %, CAGR %)
Table 41 Rest of Europe Pharmaceutical Contract Manufacturing Market Forecast, 2024-2034 (US$ Bn, AGR %, CAGR %)
Table 42 Asia Pacific Pharmaceutical Contract Manufacturing Market Forecast by Country, 2024-2034 (US$ Billion, AGR %, CAGR %)
Table 43 Asia Pacific Pharmaceutical Contract Manufacturing Market Forecast by Services, 2024-2034 (US$ Billion, AGR %, CAGR %)
Table 44 Asia Pacific Pharmaceutical Contract Manufacturing Market Forecast by End-users, 2024-2034 (US$ Billion, AGR %, CAGR %)
Table 45 Asia Pacific Pharmaceutical Contract Manufacturing Market Forecast by End-users, 2024-2034 (US$ Billion, AGR %, CAGR %)
Table 46 Asia Pacific Pharmaceutical Contract Manufacturing Market Forecast by Scale of Operation, 2024-2034 (US$ Billion, AGR %, CAGR %)
Table 47 Japan Pharmaceutical Contract Manufacturing Market Forecast, 2024-2034 (US$ Bn, AGR %, CAGR %)
Table 48 China Pharmaceutical Contract Manufacturing Market Forecast, 2024-2034 (US$ Bn, AGR %, CAGR %)
Table 49 India Pharmaceutical Contract Manufacturing Market Forecast, 2024-2034 (US$ Bn, AGR %, CAGR %)
Table 50 Australia Pharmaceutical Contract Manufacturing Market Forecast, 2024-2034 (US$ Bn, AGR %, CAGR %)
Table 51 Australia Pharmaceutical Contract Manufacturing Market Forecast, 2024-2034 (US$ Bn, AGR %, CAGR %)
Table 52 Malaysia Pharmaceutical Contract Manufacturing Market Forecast, 2024-2034 (US$ Bn, AGR %, CAGR %)
Table 53 Singapore Pharmaceutical Contract Manufacturing Market Forecast, 2024-2034 (US$ Bn, AGR %, CAGR %)
Table 54 Indonesia Pharmaceutical Contract Manufacturing Market Forecast, 2024-2034 (US$ Bn, AGR %, CAGR %)
Table 55 Rest of Asia Pacific Pharmaceutical Contract Manufacturing Market Forecast, 2024-2034 (US$ Bn, AGR %, CAGR %)
Table 56 Latin America Pharmaceutical Contract Manufacturing Market Forecast by Country, 2024-2034 (US$ Billion, AGR %, CAGR %)
Table 57 Latin America Pharmaceutical Contract Manufacturing Market Forecast by Services, 2024-2034 (US$ Billion, AGR %, CAGR %)
Table 58 Latin America Pharmaceutical Contract Manufacturing Market Forecast by End-users, 2024-2034 (US$ Billion, AGR %, CAGR %)
Table 59 Latin America Pharmaceutical Contract Manufacturing Market Forecast by End-users, 2024-2034 (US$ Billion, AGR %, CAGR %)
Table 60 Latin America Pharmaceutical Contract Manufacturing Market Forecast by Scale of Operation, 2024-2034 (US$ Billion, AGR %, CAGR %)
Table 61 Brazil Pharmaceutical Contract Manufacturing Market Forecast, 2024-2034 (US$ Bn, AGR %, CAGR %)
Table 62 Mexico Pharmaceutical Contract Manufacturing Market Forecast, 2024-2034 (US$ Bn, AGR %, CAGR %)
Table 63 Argentina Pharmaceutical Contract Manufacturing Market Forecast, 2024-2034 (US$ Bn, AGR %, CAGR %)
Table 64 Colombia Pharmaceutical Contract Manufacturing Market Forecast, 2024-2034 (US$ Bn, AGR %, CAGR %)
Table 65 Rest of Latin America Pharmaceutical Contract Manufacturing Market Forecast, 2024-2034 (US$ Bn, AGR %, CAGR %)
Table 66 MEA Pharmaceutical Contract Manufacturing Market Forecast by Country, 2024-2034 (US$ Billion, AGR %, CAGR %)
Table 67 MEA Pharmaceutical Contract Manufacturing Market Forecast by Services, 2024-2034 (US$ Billion, AGR %, CAGR %)
Table 68 MEA Pharmaceutical Contract Manufacturing Market Forecast by End-users, 2024-2034 (US$ Billion, AGR %, CAGR %)
Table 69 MEA Pharmaceutical Contract Manufacturing Market Forecast by End-users, 2024-2034 (US$ Billion, AGR %, CAGR %)
Table 70 MEA Pharmaceutical Contract Manufacturing Market Forecast by Scale of Operation, 2024-2034 (US$ Billion, AGR %, CAGR %)
Table 71 GCC Pharmaceutical Contract Manufacturing Market Forecast, 2024-2034 (US$ Bn, AGR %, CAGR %)
Table 72 South Africa Pharmaceutical Contract Manufacturing Market Forecast, 2024-2034 (US$ Bn, AGR %, CAGR %)
Table 73 Rest of MEA Pharmaceutical Contract Manufacturing Market Forecast, 2024-2034 (US$ Bn, AGR %, CAGR %)
Table 74 Lonza: Key Details, (CEO, HQ, Revenue, Founded, No. of Employees, Company Type, Website, Business Segment)
Table 75 Lonza: Service Benchmarking
Table 76 Lonza: Strategic Outlook
Table 77 Catalent, Inc.: Key Details, (CEO, HQ, Revenue, Founded, No. of Employees, Company Type, Website, Business Segment)
Table 78 Catalent, Inc.: Service Benchmarking
Table 79 Catalent, Inc.: Strategic Outlook
Table 80 Recipharm AB: Key Details, (CEO, HQ, Revenue, Founded, No. of Employees, Company Type, Website, Business Segment)
Table 81 Recipharm AB: Service Benchmarking
Table 82 Recipharm AB: Strategic Outlook
Table 83 AbbVie Inc.: Key Details, (CEO, HQ, Revenue, Founded, No. of Employees, Company Type, Website, Business Segment)
Table 84 AbbVie Inc.: Service Benchmarking
Table 85 Thermo Fisher Scientific Inc.: Key Details, (CEO, HQ, Revenue, Founded, No. of Employees, Company Type, Website, Business Segment)
Table 86 Thermo Fisher Scientific Inc.: Service Benchmarking
Table 87 Thermo Fisher Scientific Inc.: Strategic Outlook
Table 88 Siegfried Holding AG: Key Details, (CEO, HQ, Revenue, Founded, No. of Employees, Company Type, Website, Business Segment)
Table 89 Siegfried Holding AG: Service Benchmarking
Table 90 Siegfried Holding AG: Strategic Outlook
Table 91 Evonik Industries AG: Key Details, (CEO, HQ, Revenue, Founded, No. of Employees, Company Type, Website, Business Segment)
Table 92 Evonik Industries AG: Service Benchmarking
Table 93 Evonik Industries AG: Strategic Outlook
Table 94 Boehringer Ingelheim International GmbH: Key Details, (CEO, HQ, Revenue, Founded, No. of Employees, Company Type, Website, Business Segment)
Table 95 Boehringer Ingelheim International GmbH: Service Benchmarking
Table 96 Piramal Pharma Solutions: Key Details, (CEO, HQ, Revenue, Founded, No. of Employees, Company Type, Website, Business Segment)
Table 97 Piramal Pharma Solutions: Service Benchmarking
Table 98 Piramal Pharma Solutions: Strategic Outlook
Table 99 Samsung Biologics: Key Details, (CEO, HQ, Revenue, Founded, No. of Employees, Company Type, Website, Business Segment)
Table 100 Samsung Biologics: Service Benchmarking
Table 101 Samsung Biologics: Strategic Outlook
Table 102 WuXi AppTec: Key Details, (CEO, HQ, Revenue, Founded, No. of Employees, Company Type, Website, Business Segment)
Table 103 WuXi AppTec: Service Benchmarking
Table 104 WuXi AppTec: Strategic Outlook
Table 105 FUJIFILM Diosynth Biotechnologies: Key Details, (CEO, HQ, Revenue, Founded, No. of Employees, Company Type, Website, Business Segment)
Table 106 FUJIFILM Diosynth Biotechnologies: Service Benchmarking
Table 107 FUJIFILM Diosynth Biotechnologies: Strategic Outlook
Table 108 ICON plc: Key Details, (CEO, HQ, Revenue, Founded, No. of Employees, Company Type, Website, Business Segment)
Table 109 ICON plc: Service Benchmarking
Table 110 ICON plc: Strategic Outlook
Table 111 Abnova Corporation: Key Details, (CEO, HQ, Revenue, Founded, No. of Employees, Company Type, Website, Business Segment)
Table 112 Abnova Corporation: Service Benchmarking
Table 113 Abnova Corporation: Strategic Outlook
Table 114 Vetter Pharma: Key Details, (CEO, HQ, Revenue, Founded, No. of Employees, Company Type, Website, Business Segment)
Table 115 Vetter Pharma: Service Benchmarking
Table 116 Vetter Pharma: Strategic Outlook
Table 117 Aenova Group: Key Details, (CEO, HQ, Revenue, Founded, No. of Employees, Company Type, Website, Business Segment)
Table 118 Aenova Group: Service Benchmarking
Table 119 Aenova Group: Strategic Outlook
Table 120 Almac Group: Key Details, (CEO, HQ, Revenue, Founded, No. of Employees, Company Type, Website, Business Segment)
Table 121 Almac Group: Service Benchmarking
Table 122 Almac Group: Strategic Outlook
Table 123 Nipro Pharma Corporation: Key Details, (CEO, HQ, Revenue, Founded, No. of Employees, Company Type, Website, Business Segment)
Table 124 Nipro Pharma Corporation: Service Benchmarking
Table 125 Nipro Pharma Corporation: Strategic Outlook
Table 126 Jubilant Pharmova Limited: Key Details, (CEO, HQ, Revenue, Founded, No. of Employees, Company Type, Website, Business Segment)
Table 127 Jubilant Pharmova Limited: Service Benchmarking
Table 128 Jubilant Pharmova Limited: Strategic Outlook
Table 129 Pfizer Inc.: Key Details, (CEO, HQ, Revenue, Founded, No. of Employees, Company Type, Website, Business Segment)
Table 130 Pfizer Inc.: Service Benchmarking
Table 131 Pfizer Inc.: Strategic Outlook
Table 132 Grifols, S.A.: Key Details, (CEO, HQ, Revenue, Founded, No. of Employees, Company Type, Website, Business Segment)
Table 133 Grifols, S.A.: Strategic Outlook
Table 134 Charles River Laboratories: Key Details, (CEO, HQ, Revenue, Founded, No. of Employees, Company Type, Website, Business Segment)
Table 135 Charles River Laboratories: Service Benchmarking
Table 136 Charles River Laboratories: Strategic Outlook
Table 137 IQVIA Inc.: Key Details, (CEO, HQ, Revenue, Founded, No. of Employees, Company Type, Website, Business Segment)
Table 138 IQVIA Inc.: Service Benchmarking
Table 139 IQVIA Inc.: Strategic Outlook
Table 140 Baxter: Key Details, (CEO, HQ, Revenue, Founded, No. of Employees, Company Type, Website, Business Segment)
Table 141 Baxter: Service Benchmarking
Table 142 Curia Global, Inc.: Key Details, (CEO, HQ, Revenue, Founded, No. of Employees, Company Type, Website, Business Segment)
Table 143 Curia Global, Inc.: Service Benchmarking
Table 144 Curia Global, Inc.: Strategic Outlook
Table 145 Lannett: Key Details, (CEO, HQ, Revenue, Founded, No. of Employees, Company Type, Website, Business Segment)
Table 146 Lannett: Service Benchmarking
List of Figures
Figure 1 Pharmaceutical Contract Manufacturing Market Segmentation
Figure 2 Pharmaceutical Contract Manufacturing Market by Services: Market Attractiveness Index
Figure 3 Pharmaceutical Contract Manufacturing Market by Drug Type: Market Attractiveness Index
Figure 4 Pharmaceutical Contract Manufacturing Market by End-users: Market Attractiveness Index
Figure 5 Pharmaceutical Contract Manufacturing Market by Scale of Operation: Market Attractiveness Index
Figure 6 Pharmaceutical Contract Manufacturing Market Attractiveness Index by Region
Figure 7 Pharmaceutical Contract Manufacturing Market: Market Dynamics
Figure 8 Pharmaceutical Contract Manufacturing Market: Impact Analysis
Figure 9 Pharmaceutical Contract Manufacturing Market: Porter’s Five Forces Analysis
Figure 10 Pharmaceutical Contract Manufacturing Market: PEST Analysis
Figure 11 Pharmaceutical Contract Manufacturing Market: SWOT Analysis
Figure 12 Pharmaceutical Contract Manufacturing Market Attractiveness Index by Services
Figure 13 Pharmaceutical Contract Manufacturing Market Forecast by Services, 2024-2034 (US$ Billion, AGR %)
Figure 14 Pharmaceutical Contract Manufacturing Market Share Forecast by Services, 2024, 2029, 2034 (%)
Figure 15 Pharmaceutical Manufacturing Services Segment Market Forecast by Type, 2024-2034 (US$ Billion, AGR %)
Figure 16 Pharmaceutical Manufacturing Services Segment Market Forecast by Region, 2024-2034 (US$ Billion, AGR %)
Figure 17 Pharmaceutical Manufacturing Services Segment Market Share Forecast by Region, 2024 & 2034 (%)
Figure 18 Drug Development Services Segment Market Forecast by Type, 2024-2034 (US$ Billion, AGR %)
Figure 19 Drug Development Services Segment Market Forecast by Region, 2024-2034 (US$ Billion, AGR %)
Figure 20 Drug Development Services Segment Market Share Forecast by Region, 2024 & 2034 (%)
Figure 21 Biologics Manufacturing Services Segment Market Forecast by Type, 2024-2034 (US$ Billion, AGR %)
Figure 22 Biologics Manufacturing Services Segment Market Forecast by Region, 2024-2034 (US$ Billion, AGR %)
Figure 23 Biologics Manufacturing Services Segment Market Share Forecast by Region, 2024 & 2034 (%)
Figure 24 Pharmaceutical Contract Manufacturing Market Attractiveness Index by Services
Figure 25 Pharmaceutical Contract Manufacturing Market Forecast by Drug Type, 2024-2034 (US$ Billion, AGR %)
Figure 26 Pharmaceutical Contract Manufacturing Market Share Forecast by Drug Type, 2024, 2029, 2034 (%)
Figure 27 Branded Segment Market Forecast by Region, 2024-2034 (US$ Billion, AGR %)
Figure 28 Branded Segment Market Share Forecast by Region, 2024 & 2034 (%)
Figure 29 Generics Segment Market Forecast by Region, 2024-2034 (US$ Billion, AGR %)
Figure 30 Generics Segment Market Share Forecast by Region, 2024 & 2034 (%)
Figure 31 Pharmaceutical Contract Manufacturing Market Attractiveness Index by End-users
Figure 32 Pharmaceutical Contract Manufacturing Market Forecast by End-users, 2024-2034 (US$ Billion, AGR %)
Figure 33 Pharmaceutical Contract Manufacturing Market Share Forecast by End-users, 2024, 2029, 2034 (%)
Figure 34 Big Pharmaceutical Companies Segment Market Forecast by Region, 2024-2034 (US$ Billion, AGR %)
Figure 35 Big Pharmaceutical Companies Segment Market Share Forecast by Region, 2024 & 2034 (%)
Figure 36 Small & Medium-sized Pharmaceutical Companies Segment Market Forecast by Region, 2024-2034 (US$ Billion, AGR %)
Figure 37 Small & Medium-sized Pharmaceutical Companies Segment Market Share Forecast by Region, 2024 & 2034 (%)
Figure 38 Generic Pharmaceutical Companies Segment Market Forecast by Region, 2024-2034 (US$ Billion, AGR %)
Figure 39 Generic Pharmaceutical Companies Segment Market Share Forecast by Region, 2024 & 2034 (%)
Figure 40 Other End-users Segment Market Forecast by Region, 2024-2034 (US$ Billion, AGR %)
Figure 41 Other End-users Segment Market Share Forecast by Region, 2024 & 2034 (%)
Figure 42 Pharmaceutical Contract Manufacturing Market Attractiveness Index by Scale of Operation
Figure 43 Pharmaceutical Contract Manufacturing Market Forecast by Scale of Operation, 2024-2034 (US$ Billion, AGR %)
Figure 44 Pharmaceutical Contract Manufacturing Market Share Forecast by Scale of Operation, 2024, 2029, 2034 (%)
Figure 45 Clinical Segment Market Forecast by Region, 2024-2034 (US$ Billion, AGR %)
Figure 46 Clinical Segment Market Share Forecast by Region, 2024 & 2034 (%)
Figure 47 Commercial Segment Market Forecast by Region, 2024-2034 (US$ Billion, AGR %)
Figure 48 Commercial Segment Market Share Forecast by Region, 2024 & 2034 (%)
Figure 49 Pharmaceutical Contract Manufacturing Market Forecast by Region 2024, 2029, 2034 (Revenue, CAGR%)
Figure 50 Pharmaceutical Contract Manufacturing Market Share Forecast by Region 2024, 2029, 2034 (%)
Figure 51 Pharmaceutical Contract Manufacturing Market by Region, 2024-2034 (US$ Bn, AGR %)
Figure 52 North America Pharmaceutical Contract Manufacturing Market Attractiveness Index
Figure 53 North America Pharmaceutical Contract Manufacturing Market by Region, 2024, 2029 & 2034 (US$ Billion)
Figure 54 North America Pharmaceutical Contract Manufacturing Market Forecast by Country, 2024-2034 (US$ Billion, AGR %)
Figure 55 North America Pharmaceutical Contract Manufacturing Market Share Forecast by Country, 2024 & 2034 (%)
Figure 56 North America Pharmaceutical Contract Manufacturing Market Forecast by Services, 2024-2034 (US$ Billion, AGR %)
Figure 57 North America Pharmaceutical Contract Manufacturing Market Share Forecast by Services, 2024 & 2034 (%)
Figure 58 North America Pharmaceutical Contract Manufacturing Market Forecast by Drug Type, 2024-2034 (US$ Billion, AGR %)
Figure 59 North America Pharmaceutical Contract Manufacturing Market Share Forecast by Drug Type, 2024 & 2034 (%)
Figure 60 North America Pharmaceutical Contract Manufacturing Market Forecast by End-users, 2024-2034 (US$ Billion, AGR %)
Figure 61 North America Pharmaceutical Contract Manufacturing Market Share Forecast by End-users, 2024 & 2034 (%)
Figure 62 North America Pharmaceutical Contract Manufacturing Market Forecast by Scale of Operation, 2024-2034 (US$ Billion, AGR %)
Figure 63 North America Pharmaceutical Contract Manufacturing Market Share Forecast by Scale of Operation, 2024 & 2034 (%)
Figure 64 U.S. Pharmaceutical Contract Manufacturing Market Forecast, 2024-2034 (US$ Billion, AGR %)
Figure 65 Canada Pharmaceutical Contract Manufacturing Market Forecast, 2024-2034 (US$ Billion, AGR %)
Figure 66 Europe Pharmaceutical Contract Manufacturing Market Attractiveness Index
Figure 67 Europe Pharmaceutical Contract Manufacturing Market by Region, 2024, 2029 & 2034 (US$ Billion)
Figure 68 Europe Pharmaceutical Contract Manufacturing Market Forecast by Country, 2024-2034 (US$ Billion, AGR %)
Figure 69 Europe Pharmaceutical Contract Manufacturing Market Share Forecast by Country, 2024 & 2034 (%)
Figure 70 Europe Pharmaceutical Contract Manufacturing Market Forecast by Services, 2024-2034 (US$ Billion, AGR %)
Figure 71 Europe Pharmaceutical Contract Manufacturing Market Share Forecast by Services, 2024 & 2034 (%)
Figure 72 Europe Pharmaceutical Contract Manufacturing Market Forecast by Drug Type, 2024-2034 (US$ Billion, AGR %)
Figure 73 Europe Pharmaceutical Contract Manufacturing Market Share Forecast by Drug Type, 2024 & 2034 (%)
Figure 74 Europe Pharmaceutical Contract Manufacturing Market Forecast by End-users, 2024-2034 (US$ Billion, AGR %)
Figure 75 Europe Pharmaceutical Contract Manufacturing Market Share Forecast by End-users, 2024 & 2034 (%)
Figure 76 Europe Pharmaceutical Contract Manufacturing Market Forecast by Scale of Operation, 2024-2034 (US$ Billion, AGR %)
Figure 77 Europe Pharmaceutical Contract Manufacturing Market Share Forecast by Scale of Operation, 2024 & 2034 (%)
Figure 78 Germany Pharmaceutical Contract Manufacturing Market Forecast, 2024-2034 (US$ Billion, AGR %)
Figure 79 UK Pharmaceutical Contract Manufacturing Market Forecast, 2024-2034 (US$ Billion, AGR %)
Figure 80 France Pharmaceutical Contract Manufacturing Market Forecast, 2024-2034 (US$ Billion, AGR %)
Figure 81 Italy Pharmaceutical Contract Manufacturing Market Forecast, 2024-2034 (US$ Billion, AGR %)
Figure 82 Spain Pharmaceutical Contract Manufacturing Market Forecast, 2024-2034 (US$ Billion, AGR %)
Figure 83 Russia Pharmaceutical Contract Manufacturing Market Forecast, 2024-2034 (US$ Billion, AGR %)
Figure 84 Switzerland Pharmaceutical Contract Manufacturing Market Forecast, 2024-2034 (US$ Billion, AGR %)
Figure 85 Netherlands Pharmaceutical Contract Manufacturing Market Forecast, 2024-2034 (US$ Billion, AGR %)
Figure 86 Rest of Europe Pharmaceutical Contract Manufacturing Market Forecast, 2024-2034 (US$ Billion, AGR %)
Figure 87 Asia Pacific Pharmaceutical Contract Manufacturing Market Attractiveness Index
Figure 88 Asia Pacific Pharmaceutical Contract Manufacturing Market by Region, 2024, 2029 & 2034 (US$ Billion)
Figure 89 Asia Pacific Pharmaceutical Contract Manufacturing Market Forecast by Country, 2024-2034 (US$ Billion, AGR %)
Figure 90 Asia Pacific Pharmaceutical Contract Manufacturing Market Share Forecast by Country, 2024 & 2034 (%)
Figure 91 Asia Pacific Pharmaceutical Contract Manufacturing Market Forecast by Services, 2024-2034 (US$ Billion, AGR %)
Figure 92 Asia Pacific Pharmaceutical Contract Manufacturing Market Share Forecast by Services, 2024 & 2034 (%)
Figure 93 Asia Pacific Pharmaceutical Contract Manufacturing Market Forecast by Drug Type, 2024-2034 (US$ Billion, AGR %)
Figure 94 Asia Pacific Pharmaceutical Contract Manufacturing Market Share Forecast by Drug Type, 2024 & 2034 (%)
Figure 95 Asia Pacific Pharmaceutical Contract Manufacturing Market Forecast by End-users, 2024-2034 (US$ Billion, AGR %)
Figure 96 Asia Pacific Pharmaceutical Contract Manufacturing Market Share Forecast by End-users, 2024 & 2034 (%)
Figure 97 Asia Pacific Pharmaceutical Contract Manufacturing Market Forecast by Scale of Operation, 2024-2034 (US$ Billion, AGR %)
Figure 98 Asia Pacific Pharmaceutical Contract Manufacturing Market Share Forecast by Scale of Operation, 2024 & 2034 (%)
Figure 99 Japan Pharmaceutical Contract Manufacturing Market Forecast, 2024-2034 (US$ Billion, AGR %)
Figure 100 China Pharmaceutical Contract Manufacturing Market Forecast, 2024-2034 (US$ Billion, AGR %)
Figure 101 India Pharmaceutical Contract Manufacturing Market Forecast, 2024-2034 (US$ Billion, AGR %)
Figure 102 Australia Pharmaceutical Contract Manufacturing Market Forecast, 2024-2034 (US$ Billion, AGR %)
Figure 103 South Korea Pharmaceutical Contract Manufacturing Market Forecast, 2024-2034 (US$ Billion, AGR %)
Figure 104 Malaysia Pharmaceutical Contract Manufacturing Market Forecast, 2024-2034 (US$ Billion, AGR %)
Figure 105 Singapore Pharmaceutical Contract Manufacturing Market Forecast, 2024-2034 (US$ Billion, AGR %)
Figure 106 Indonesia Pharmaceutical Contract Manufacturing Market Forecast, 2024-2034 (US$ Billion, AGR %)
Figure 107 Rest of Asia Pacific Pharmaceutical Contract Manufacturing Market Forecast, 2024-2034 (US$ Billion, AGR %)
Figure 108 Latin America Pharmaceutical Contract Manufacturing Market Attractiveness Index
Figure 109 Latin America Pharmaceutical Contract Manufacturing Market by Region, 2024, 2029 & 2034 (US$ Billion)
Figure 110 Latin America Pharmaceutical Contract Manufacturing Market Forecast by Country, 2024-2034 (US$ Billion, AGR %)
Figure 111 Latin America Pharmaceutical Contract Manufacturing Market Share Forecast by Country, 2024 & 2034 (%)
Figure 112 Latin America Pharmaceutical Contract Manufacturing Market Forecast by Services, 2024-2034 (US$ Billion, AGR %)
Figure 113 Latin America Pharmaceutical Contract Manufacturing Market Share Forecast by Services, 2024 & 2034 (%)
Figure 114 Latin America Pharmaceutical Contract Manufacturing Market Forecast by Drug Type, 2024-2034 (US$ Billion, AGR %)
Figure 115 Latin America Pharmaceutical Contract Manufacturing Market Share Forecast by Drug Type, 2024 & 2034 (%)
Figure 116 Latin America Pharmaceutical Contract Manufacturing Market Forecast by End-users, 2024-2034 (US$ Billion, AGR %)
Figure 117 Latin America Pharmaceutical Contract Manufacturing Market Share Forecast by End-users, 2024 & 2034 (%)
Figure 118 Latin America Pharmaceutical Contract Manufacturing Market Forecast by Scale of Operation, 2024-2034 (US$ Billion, AGR %)
Figure 119 Latin America Pharmaceutical Contract Manufacturing Market Share Forecast by Scale of Operation, 2024 & 2034 (%)
Figure 120 Brazil Pharmaceutical Contract Manufacturing Market Forecast, 2024-2034 (US$ Billion, AGR %)
Figure 121 Mexico Pharmaceutical Contract Manufacturing Market Forecast, 2024-2034 (US$ Billion, AGR %)
Figure 122 Argentina Pharmaceutical Contract Manufacturing Market Forecast, 2024-2034 (US$ Billion, AGR %)
Figure 123 Colombia Pharmaceutical Contract Manufacturing Market Forecast, 2024-2034 (US$ Billion, AGR %)
Figure 124 Rest of Latin America Pharmaceutical Contract Manufacturing Market Forecast, 2024-2034 (US$ Billion, AGR %)
Figure 125 MEA Pharmaceutical Contract Manufacturing Market Attractiveness Index
Figure 126 MEA Pharmaceutical Contract Manufacturing Market by Region, 2024, 2029 & 2034 (US$ Billion)
Figure 127 MEA Pharmaceutical Contract Manufacturing Market Forecast by Country, 2024-2034 (US$ Billion, AGR %)
Figure 128 MEA Pharmaceutical Contract Manufacturing Market Share Forecast by Country, 2024 & 2034 (%)
Figure 129 MEA Pharmaceutical Contract Manufacturing Market Forecast by Services, 2024-2034 (US$ Billion, AGR %)
Figure 130 MEA Pharmaceutical Contract Manufacturing Market Share Forecast by Services, 2024 & 2034 (%)
Figure 131 MEA Pharmaceutical Contract Manufacturing Market Forecast by Drug Type, 2024-2034 (US$ Billion, AGR %)
Figure 132 MEA Pharmaceutical Contract Manufacturing Market Share Forecast by Drug Type, 2024 & 2034 (%)
Figure 133 MEA Pharmaceutical Contract Manufacturing Market Forecast by End-users, 2024-2034 (US$ Billion, AGR %)
Figure 134 MEA Pharmaceutical Contract Manufacturing Market Share Forecast by End-users, 2024 & 2034 (%)
Figure 135 MEA Pharmaceutical Contract Manufacturing Market Forecast by Scale of Operation, 2024-2034 (US$ Billion, AGR %)
Figure 136 MEA Pharmaceutical Contract Manufacturing Market Share Forecast by Scale of Operation, 2024 & 2034 (%)
Figure 137 GCC Pharmaceutical Contract Manufacturing Market Forecast, 2024-2034 (US$ Billion, AGR %)
Figure 138 South Africa Pharmaceutical Contract Manufacturing Market Forecast, 2024-2034 (US$ Billion, AGR %)
Figure 139 Rest of MEA Pharmaceutical Contract Manufacturing Market Forecast, 2024-2034 (US$ Billion, AGR %)
Figure 140 Lonza: Net Revenue, 2018-2023 (US$ Million, AGR %)
Figure 141 Lonza: R&D, 2018-2023 (US$ Million, AGR %)
Figure 142 Lonza: Regional Market Shares (%), 2023
Figure 143 Lonza: Business Segment Market Shares (%), 2023
Figure 144 Lonza: SWOT Analysis
Figure 145 Catalent, Inc.: Net Revenue, 2018-2023 (US$ Million, AGR %)
Figure 146 Catalent, Inc.: Regional Market Shares (%), 2023
Figure 147 Catalent, Inc.: Business Segment Market Shares (%), 2023
Figure 148 Catalent, Inc.: SWOT Analysis
Figure 149 Recipharm AB: SWOT Analysis
Figure 150 AbbVie Inc.: Net Revenue, 2018-2023 (US$ Million, AGR %)
Figure 151 AbbVie Inc.: R&D, 2018-2023 (US$ Million, AGR %)
Figure 152 AbbVie Inc.: Regional Market Shares (%), 2023
Figure 153 AbbVie Inc.: Business Segment Market Shares (%), 2023
Figure 154 AbbVie Inc.: SWOT Analysis
Figure 155 Thermo Fisher Scientific Inc.: Net Revenue, 2018-2023 (US$ Million, AGR %)
Figure 156 Thermo Fisher Scientific Inc.: R&D, 2018-2023 (US$ Million, AGR %)
Figure 157 Thermo Fisher Scientific Inc.: Regional Market Shares (%), 2023
Figure 158 Thermo Fisher Scientific Inc.: Business Segment Market Shares (%), 2023
Figure 159 Thermo Fisher Scientific Inc.: SWOT Analysis
Figure 160 Siegfried Holding AG: Net Revenue, 2018-2023 (US$ Million, AGR %)
Figure 161 Siegfried Holding AG: Business Segment Market Shares (%), 2023
Figure 162 Evonik Industries AG: Net Revenue, 2018-2023 (US$ Million, AGR %)
Figure 163 Evonik Industries AG: Regional Market Shares (%), 2023
Figure 164 Evonik Industries AG: Business Segment Market Shares (%), 2023
Figure 165 Boehringer Ingelheim International GmbH: Net Revenue, 2018-2023 (US$ Million, AGR %)
Figure 166 Boehringer Ingelheim International GmbH: Regional Market Shares (%), 2023
Figure 167 Boehringer Ingelheim International GmbH: Business Segment Market Shares (%), 2023
Figure 168 Samsung Biologics: Net Revenue, 2018-2023 (US$ Million, AGR %)
Figure 169 WuXi AppTec: Net Revenue, 2018-2023 (US$ Million, AGR %)
Figure 170 WuXi AppTec: Regional Market Shares (%), 2023
Figure 171 WuXi AppTec: Business Segment Market Shares (%), 2023
Figure 172 FUJIFILM Diosynth Biotechnologies: Net Revenue, 2018-2023 (US$ Million, AGR %)
Figure 173 FUJIFILM Diosynth Biotechnologies: R&D, 2018-2023 (US$ Million, AGR %)
Figure 174 ICON plc: Net Revenue, 2018-2023 (US$ Million, AGR %)
Figure 175 ICON plc: Regional Market Shares (%), 2023
Figure 176 Aenova Group: Net Revenue, 2018-2022 (US$ Million, AGR %)
Figure 177 Aenova Group: Regional Market Shares (%), 2022
Figure 178 Aenova Group: Business Segment Market Shares (%), 2022
Figure 179 Nipro Pharma Corporation: Net Revenue, 2018-2023 (US$ Million, AGR %)
Figure 180 Nipro Pharma Corporation: R&D, 2018-2023 (US$ Million, AGR %)
Figure 181 Nipro Pharma Corporation: Regional Market Shares (%), 2023
Figure 182 Nipro Pharma Corporation: Business Segment Market Shares (%), 2023
Figure 183 Pfizer Inc.: Net Revenue, 2018-2023 (US$ Million, AGR %)
Figure 184 Pfizer Inc.: R&D, 2018-2023 (US$ Million, AGR %)
Figure 185 Pfizer Inc.: Regional Market Shares (%), 2023
Figure 186 Pfizer Inc.: Business Segment Market Shares (%), 2023
Figure 187 Grifols, S.A.: Net Revenue, 2018-2023 (US$ Million, AGR %)
Figure 188 Grifols, S.A.: R&D, 2018-2023 (US$ Million, AGR %)
Figure 189 Charles River Laboratories: Net Revenue, 2018-2023 (US$ Million, AGR %)
Figure 190 Charles River Laboratories: Regional Market Shares (%), 2023
Figure 191 Charles River Laboratories: Business Segment Market Shares (%), 2023
Figure 192 IQVIA Inc.: Net Revenue, 2018-2023 (US$ Million, AGR %)
Figure 193 IQVIA Inc.: Regional Market Shares (%), 2023
Figure 194 IQVIA Inc.: Business Segment Market Shares (%), 2023
Figure 195 Baxter: Net Revenue, 2018-2023 (US$ Million, AGR %)
Figure 196 Baxter: R&D, 2018-2023 (US$ Million, AGR %)
Figure 197 Baxter: Regional Market Shares (%), 2023
Figure 198 Baxter: Business Segment Market Shares (%), 2023
ページTOPに戻る
Visiongain社のヘルスケアと医薬・化学品分野での最新刊レポート
本レポートと同じKEY WORD(pharmaceutical)の最新刊レポート
-
ビタミンB3の世界市場規模調査:供給源別(天然、合成)、形態別(乾燥、液体)、用途別(飼料、医薬品)、地域別予測:2022-2032年
-
医薬品迅速微生物検査の世界市場規模調査、製品別(試薬・キット)、手法別(生育系検査、核酸系検査)、用途別(原材料検査)、地域別予測:2022-2032年
-
医薬品不純物合成・分離サービスの世界市場規模調査、サービス別(合成サービス、分離サービス、分析サービス)、不純物タイプ別、技術別、用途別、最終用途別、地域別予測:2022-2032年
-
Pharmaceutical Excipients Market Size, Growth and Trends Analysis by Function (Pharmaceutical Fillers, Binders, Coatings, Disintegrants, Preservatives, Others), Application (Oral, Parenteral, Topical, Others), Product (Organic Chemicals, Inorganic Chemicals) - Forecast 2032
-
医薬品有効成分世界市場
-
中南米のヒト用ワクチンアジュバント市場の2030年までの予測 - 地域別分析 - タイプ別(粒子状アジュバント、エマルジョンアジュバント、配合アジュバント、その他)、用途別(インフルエンザ、肝炎、ヒト乳頭腫ウイルス(HPV)、その他)、エンドユーザー別(製薬・バイオテクノロジー企業、CMO・CRO、その他)
-
北米のヒト用ワクチンアジュバント市場の2030年までの予測 - 地域別分析 - タイプ別(粒子状アジュバント、エマルジョンアジュバント、配合アジュバント、その他)、用途別(インフルエンザ、肝炎、ヒト乳頭腫ウイルス(HPV)、その他)、エンドユーザー別(製薬・バイオテクノロジー企業、CMO・CRO、その他)
-
中東・アフリカのヒト用ワクチンアジュバントの2030年までの市場予測 - 地域別分析 - タイプ別(粒子状アジュバント、エマルジョンアジュバント、配合アジュバント、その他)、用途別(インフルエンザ、肝炎、ヒトパピローマウイルス(HPV)、その他)、エンドユーザー別(製薬・バイオテクノロジー企業、CMO・CRO、その他)
-
欧州のヒト用ワクチンアジュバントの2030年までの市場予測 - 地域別分析 - タイプ別(粒子状アジュバント、エマルジョンアジュバント、配合アジュバント、その他)、用途別(インフルエンザ、肝炎、ヒト乳頭腫ウイルス(HPV)、その他)、エンドユーザー別(製薬・バイオテクノロジー企業、CMO・CRO、その他)
-
2024-2029 医薬品CDMOの世界市場展望 プレーヤー、タイプ、用途、地域別の市場規模、シェア、動向分析レポート
よくあるご質問
Visiongain社はどのような調査会社ですか?
英国の調査会社ヴィジョンゲイン社(Visiongain)は、通信とエネルギーのほか、自動車や化学・医薬品、金属など、広範な市場を対象に調査を行っています。自動車市場については、市場全般に関する調査のほ... もっと見る
調査レポートの納品までの日数はどの程度ですか?
在庫のあるものは速納となりますが、平均的には 3-4日と見て下さい。
但し、一部の調査レポートでは、発注を受けた段階で内容更新をして納品をする場合もあります。
発注をする前のお問合せをお願いします。
注文の手続きはどのようになっていますか?
1)お客様からの御問い合わせをいただきます。
2)見積書やサンプルの提示をいたします。
3)お客様指定、もしくは弊社の発注書をメール添付にて発送してください。
4)データリソース社からレポート発行元の調査会社へ納品手配します。
5) 調査会社からお客様へ納品されます。最近は、pdfにてのメール納品が大半です。
お支払方法の方法はどのようになっていますか?
納品と同時にデータリソース社よりお客様へ請求書(必要に応じて納品書も)を発送いたします。
お客様よりデータリソース社へ(通常は円払い)の御振り込みをお願いします。
請求書は、納品日の日付で発行しますので、翌月最終営業日までの当社指定口座への振込みをお願いします。振込み手数料は御社負担にてお願いします。
お客様の御支払い条件が60日以上の場合は御相談ください。
尚、初めてのお取引先や個人の場合、前払いをお願いすることもあります。ご了承のほど、お願いします。
データリソース社はどのような会社ですか?
当社は、世界各国の主要調査会社・レポート出版社と提携し、世界各国の市場調査レポートや技術動向レポートなどを日本国内の企業・公官庁及び教育研究機関に提供しております。
世界各国の「市場・技術・法規制などの」実情を調査・収集される時には、データリソース社にご相談ください。
お客様の御要望にあったデータや情報を抽出する為のレポート紹介や調査のアドバイスも致します。
|
|

