アジア太平洋地域のビジネスプロセスアウトソーシング(BPO)市場レポート:2023-2033
Asia-Pacific Business Process Outsourcing (BPO) Market Report 2023-2033
レポート詳細
アジア太平洋地域のビジネスプロセスアウトソーシング(BPO)市場レポート 2023-2033 :本レポートは、新たな収益の柱を目指すリーディングカンパニーが、業界とその背景にあるダイナミ... もっと見る
※上記価格は部署ライセンス(Departmental licence)価格です。
その他の価格についてはデータリソースまでお問合せください。
日本語のページは自動翻訳を利用し作成しています。
実際のレポートは英文のみでご納品いたします。

|

|
サマリー
レポート詳細
アジア太平洋地域のビジネスプロセスアウトソーシング(BPO)市場レポート 2023-2033:本レポートは、新たな収益の柱を目指すリーディングカンパニーが、業界とその背景にあるダイナミクスをより深く理解する上で、非常に有益なものとなるでしょう。また、異業種への進出や新地域での既存事業の拡大を目指す企業にとっても有用なレポートです。
アジア太平洋地域のビジネスプロセスアウトソーシング(BPO)市場は急成長中
アジア太平洋地域のビジネスプロセスアウトソーシング(BPO)市場は、急速に成長している市場であり、今後数年間も成長軌道を維持すると予想されています。この市場を牽引しているのは、コスト削減や効率化、コアコンピタンスへの注力を目的に、企業がアウトソーシングを導入するケースが増加していることです。この地域には世界最大かつ最先端の経済が存在するため、BPOサービスにとって魅力的な投資先となっています。
また、自動化や人工知能(AI)などのデジタル技術の採用が進んでいることも、同地域のBPO市場の成長を後押しすると予想されます。これらの技術により、企業は反復的で価値の低い業務を自動化し、人的資源をより戦略的で価値の高い業務に振り向けることができるようになります。さらに、AIと機械学習(ML)の利用は、組織が顧客サービスを改善し、顧客に対してよりパーソナライズされた効率的なサービスを提供するのに役立っています。
アジア太平洋地域のBPO市場は競争が激しく、今後数年間はベンダー間の激しい競争が続くと予想されます。同市場の主要企業には、Accenture、Capgemini、Cognizant、Genpact、HCL Technologies、Infosys、Tata Consultancy Services、Wipro、WNS Global Servicesなどが名を連ねています。これらの企業は、BPOサービスの需要拡大に対応するため、同地域での事業拡大に注力しています。
マーケットリサーチレポートを購入する前に、どのような質問をすべきでしょうか?
- アジア太平洋地域のビジネスプロセスアウトソーシング(BPO)市場はどのように進化しているのか?
- アジア太平洋地域のビジネスプロセスアウトソーシング(BPO)市場の推進要因と阻害要因は何か?
- アジア太平洋地域のビジネスプロセスアウトソーシング(BPO)サブマーケットの各セグメントは予測期間中にどのように成長し、2033年にはどの程度の収益を占めるようになるのか?
- 2023年から2033年にかけて、アジア太平洋地域のビジネスプロセスアウトソーシング(BPO)サブマーケットごとの市場シェアはどのように推移するのか?
- 2023年から2033年にかけて、市場全体の主な牽引役となるのは何か?
- アジア太平洋地域のビジネスプロセスアウトソーシング(BPO)の主要市場はマクロ経済のダイナミクスに概ね追随するのか、それとも個々の国市場が他を凌駕するのか?
- 2033年までに各国市場のシェアはどのように変化し、どの地域が2033年の市場をリードするのでしょうか?
- 主要プレイヤーは誰か、また予測期間中の展望は?
- これらのリーディングカンパニーによるアジア太平洋地域のビジネスプロセスアウトソーシング(BPO)プロジェクトとは何か?
- 2023年から2033年の間に、業界はどのように進化していくのか?現在および今後10年間に実施されるアジア太平洋地域のビジネスプロセス・アウトソーシング(BPO)プロジェクトにはどのような意味があるのか?
- アジア太平洋地域のビジネスプロセスアウトソーシング(BPO)市場をさらに拡大するために、製品の商業化の必要性は高まっているのか?
- アジア太平洋地域のビジネスプロセスアウトソーシング(BPO)市場はどこへ向かい、どのようにすれば市場の最前線に立つことができるのか?
- 新製品・新サービスへの最適な投資方法とは?
- 企業を新たな成長軌道に乗せ、C-suiteに移行させるための重要な展望とは?
このことがアジア太平洋地域のビジネスプロセスアウトソーシング(BPO)市場に現在、そして今後10年間、どのような影響を及ぼすかを知る必要があります。
- 303ページにわたる本レポートでは、157の表と154のグラフを独占的に提供します。
- このレポートでは、業界における主要な収益性の高い分野をハイライトしているため、今すぐターゲットを絞ることができます。
- 地域別、国別の売上高と成長率の詳細な分析が含まれています。
- 競合他社が成功した主なトレンド、変化、収益予測をハイライトしています。
このレポートは、アジア太平洋地域のビジネスプロセスアウトソーシング(BPO)市場が今後10年間にどのように発展するか、またCOVID-19の景気後退と回復の変動に即して、今日のあなたに伝えています。この市場は、過去10年間のどの時点よりも、今がより重要です。
2033年までの予測やその他の分析により、商業的な展望が見えてきた
- 2033年までの収益予測に加え、直近の実績、成長率、市場シェアもご覧いただけます。
- ビジネスの展望や展開など、独自の分析もご覧いただけます。
- 定性的分析(市場力学、促進要因、機会、阻害要因、課題など)、コスト構造、アジア太平洋地域のビジネスプロセスアウトソーシング(BPO)価格上昇の影響、最近の動向などをご覧いただけます。
本レポートでは、COVID-19が業界と貴社にどのような影響を与えるかについて、データ分析と貴重な洞察を掲載しています。本レポートでは、COVID-19の4つの回収パターンとその影響、すなわち「V」、「L」、「W」、「U」について論じています。
報告書の対象セグメント
タイプ別市場セグメント
- ニアショア
- オフソース
- オンショア
サービス別市場セグメント
- 音声処理
- テレマーケティングサービス
- 可視化サービス
- その他サービス
用途別市場セグメント
- カスタマーケア&デモンストレーション
- セールス&マーケティング
- 財務・会計
- 人材育成
- その他アプリケーション
エンドユーザー別市場セグメント
- IT・通信
- BFSI
- ヘルスケア分野
- 製造業
- 小売・Eコマース
- その他エンドユーザー
地域別市場セグメント
- 南アジア
- 東南アジア
- 東アジア
- 西アジア
- 中央アジア
アジア太平洋地域全体の市場およびセグメントの収益予測に加え、4つの地域と20の主要な国内市場の収益予測も掲載しています。
南アジア
- インド
- その他の南アジア地域
東南アジア
- インドネシア
- シンガポール
- マレーシア
- フィリピン
- タイ
- その他の東南アジア地域
東アジア
- 中国
- 香港
- 日本
- 韓国
- 台湾
- その他の東アジア地域
西アジア
- トルコ
- アラブ首長国連邦
- その他の西アジア地域
中央アジア
- ウズベキスタン
- カザフスタン
- その他の中央アジア地域
アジア太平洋地域のビジネスプロセスアウトソーシング(BPO)市場の2023年から2033年にかけての主要企業のプロファイルと、これらの企業のこのセグメントを中心とした情報も掲載しています。
主要企業と市場成長の可能性
・ Accenture Plc
・ ADP Inc.
・ Amdocs
・ Capgemini SE
・ CBRE Group, Inc.
・ Cognizant
・ Concentrix Corporation
・ HCL Technologies Limited
・ IBM Corporation
・ Infosys Limited
アジア太平洋地域のビジネスプロセスアウトソーシング(BPO)市場の全体収益、金額ベースで2023年から2033年まで、市場は2023年に723億8000万米ドルを突破すると当研究所は算出している。また、2033年までの間に収益が大きく伸びると予測しています。本調査では、最も大きな可能性を秘めた組織を特定しています。彼らの能力、進歩、商業的展望を発見することで、一歩先を行くことができます。
アジア太平洋地域のビジネスプロセスアウトソーシング(BPO)市場、2023年から2033年までのレポートはどのように役立つのでしょうか?
300ページを超えるレポートでは、要約すると以下のような知識を得ることができます。
- アジア太平洋地域のビジネスプロセスアウトソーシング(BPO)市場の2033年までの収益予測、タイプ、サービス、アプリケーション、エンドユーザー、企業規模の各予測を地域レベルで掲載 - 投資と収益に最も有利な場所を見つけ、業界の展望を発見してください。
- 4つの地域と20の主要国市場の2033年までの収益予測 - アジア太平洋地域のビジネスプロセスアウトソーシング(BPO)市場、2023年から2033年の南アジア、東南アジア、東アジア、西アジア、中央アジアの市場予測をご覧ください。また、インド、インドネシア、シンガポール、マレーシア、フィリピン、タイ、中国、香港、日本、韓国、台湾などの主要経済圏の市場も予測されています。
- アジア太平洋地域のビジネスプロセスアウトソーシング(BPO)市場(2023年~2033年)に関わる主要企業10社の企業プロファイルを含む、既存企業および市場参入を目指す企業の展望。
定量的・定性的な分析と独自の予測をご覧いただけます。私たちのレポートだけが持つ情報を入手し、貴重なビジネスインテリジェンスを得ることができます。
他にはない情報
私たちの新しいレポートがあれば、知識の遅れを取り戻し、チャンスを逃す可能性が低くなります。私たちの研究が貴社の調査、分析、意思決定にどのように役立つかをご覧ください。Visiongainの調査は、アジア太平洋地域のビジネスプロセスアウトソーシング(BPO)市場、2023年から2033年、市場の主要企業に関する商業分析を必要とするすべての人のためのものです。データ、トレンド、予測を見つけることができます。
ページTOPに戻る
目次
目次
1.レポートの概要
1.1 調査の目的
1.2 アジア太平洋地域のビジネスプロセスアウトソーシング(BPO)市場の紹介
1.3 本レポートが提供するもの
1.4 本レポートを読むべき理由
1.5 本分析レポートが回答する主要な質問
1.6 本レポートは誰のためのものなのか?
1.7 調査方法
1.7.1 市場の定義
1.7.2 市場評価・予測手法
1.7.3 データの検証
1.8 よくある質問と回答(FAQ)
1.9 関連するVisiongainのレポート
1.10 Visiongainについて
2 エグゼクティブサマリー
2.1 プレミアムインサイト
2.1.1 地域別分析
2.1.2 タイプ別セグメント分析
2.1.3 サービスセグメント分析
2.1.4 用途別セグメント分析
2.1.5 エンドユーザーセグメント分析
3 市場の概要
3.1 主要な調査結果
3.2 マーケットダイナミクス
3.2.1 市場の推進要因
3.2.2 市場の抑制要因
3.2.3 市場機会
3.3 サプライチェーンの概要
3.4 バリューチェーンの概要
3.5 COVID-19影響度分析
3.6 ポーターのファイブフォース分析
3.6.1 新規参入の脅威(高)
3.6.2 代替品の脅威(中)
3.6.3 買い手のバーゲニングパワー(中)
3.6.4 供給者のバーゲニングパワー(低)
3.6.5 競合他社との競争 (高)
3.7 環境要因分析
3.7.1 政治的要因
3.7.2 経済的要因
3.7.3 社会的要因
3.7.4 技術的要素
3.7.5 環境的要素
3.7.6 法的側面
4 アジア太平洋地域のビジネスプロセスアウトソーシング(BPO)市場分析:タイプ別
4.1 主な調査結果
4.1.1 タイプ別セグメント。市場魅力度指数
4.1.2 アジア太平洋地域のビジネスプロセスアウトソーシング(BPO)市場シェア:タイプ別、2023年&2033年
4.1.3 アジア太平洋地域のビジネスプロセスアウトソーシング(BPO)市場タイプ別
4.2 ニアショアセグメント
4.2.1 ニアショア市場予測
4.2.2 地域別ニアショア市場
4.3 オフショアセグメント
4.3.1 オフショア市場予測
4.3.2 オフショア地域別市場
4.4 オンショアセグメント
4.4.1 オンショア市場予測
4.4.2 オンショア地域別市場
5 アジア太平洋地域のビジネスプロセスアウトソーシング(BPO)市場分析:サービス別
5.1 主な調査結果
5.1.1 サービス・セグメント市場魅力度指数
5.1.2 アジア太平洋地域のビジネスプロセスアウトソーシング(BPO)市場シェア:サービス別、2023年&2033年
5.1.3 アジア太平洋地域ビジネスプロセスアウトソーシング(BPO)サービス別市場規模推移
5.2 音声処理セグメント
5.2.2 音声処理の市場予測
5.2.3 音声処理の地域別市場予測
5.3 テレマーケティングサービス部門
5.3.1 テレマーケティングサービス市場予測
5.3.2 テレマーケティングサービス地域別市場予測
5.4 可視化サービスセグメント
5.4.1 可視化サービスの市場展望
5.4.2 可視化サービスの地域別市場展望
5.5 その他サービスセグメント
5.5.1 その他サービスの市場展望
5.5.2 その他サービスの地域別市場展望
6 アジア太平洋地域のビジネスプロセスアウトソーシング(BPO)市場分析:用途別
6.1 主な調査結果
6.1.1 用途別セグメント市場魅力度指数
6.1.2 アジア太平洋地域のビジネスプロセスアウトソーシング(BPO)市場シェア:用途別、2023年&2033年
6.1.3 アジア太平洋地域のビジネスプロセスアウトソーシング(BPO)市場:用途別
6.2 カスタマーケア&デモンストレーション部門
6.2.1 カスタマーケア&デモンストレーションの市場予測
6.2.2 地域別カスタマーケア&デモンストレーション市場予測
6.3 セールスマーケティングセグメント
6.3.1 セールスマーケティング市場予測
6.3.2 地域別セールスマーケティング市場予測
6.4 ファイナンス&アカウンティングセグメント
6.4.1 ファイナンス&アカウンティング市場予測
6.4.2 地域別財務・会計市場予測
6.5 人材育成セグメント
6.5.1 人材育成の市場展望
6.5.2 人材育成の地域別市場展望
6.6 その他用途セグメント
6.6.1 その他用途の市場展望
6.6.2 その他用途の地域別市場展望
7 アジア太平洋地域のビジネスプロセスアウトソーシング(BPO)市場分析:エンドユーザー別
7.1 主な調査結果
7.1.1 エンドユーザセグメント。市場魅力度指数
7.1.2 アジア太平洋地域のビジネスプロセスアウトソーシング(BPO)市場シェア:エンドユーザー別、2023年&2033年
7.1.3 アジア太平洋地域のビジネスプロセスアウトソーシング(BPO)市場:エンドユーザー別
7.2 IT&テレコムセグメント
7.2.1 IT&テレコム市場予測
7.2.2 IT&テレコム地域別市場予測
7.3 BFSIセグメント
7.3.1 BFSIの市場展望
7.3.2 BFSIの地域別市場予測
7.4 ヘルスケア分野セグメント
7.4.1 ヘルスケア分野の市場展望
7.4.2 ヘルスケア分野の地域別市場展望
7.5 製造業セグメント
7.5.1 製造業の市場展望
7.5.2 製造業の地域別市場展望
7.6 小売・Eコマース
7.6.1 小売・Eコマースの市場展望
7.6.2 小売・Eコマースの地域別市場展望
7.7 その他エンドユーザーセグメント
7.7.1 その他エンドユーザーの市場展望
7.7.2 その他エンドユーザーの地域別市場展望
8 アジア太平洋地域のビジネスプロセスアウトソーシング(BPO)市場分析:地域別
8.1 主要な調査結果
8.1.1 アジア太平洋地域のビジネスプロセスアウトソーシング(BPO)地域別市場魅力度指数
8.1.2 アジア太平洋地域のビジネスプロセスアウトソーシング(BPO)地域別市場シェア、2023年&2033年
8.2 アジア太平洋地域のビジネスプロセスアウトソーシング(BPO)市場予測
8.3 アジア太平洋地域のビジネスプロセスアウトソーシング(BPO)地域別市場予測
8.4 アジア太平洋地域のビジネスプロセスアウトソーシング(BPO)タイプ別市場展望
8.5 アジア太平洋地域のビジネスプロセスアウトソーシング(BPO)サービス別市場展望
8.6 アジア太平洋地域のビジネスプロセスアウトソーシング(BPO)用途別市場展望
8.7 アジア太平洋地域のビジネスプロセスアウトソーシング(BPO)エンドユーザー別市場展望
9 南アジア太平洋地域のビジネスプロセスアウトソーシング(BPO)市場分析
9.1 主要な調査結果
9.1.1 南アジア太平洋地域のビジネスプロセスアウトソーシング(BPO)市場魅力度指数
9.1.2 南アジア太平洋地域のビジネスプロセスアウトソーシング(BPO)市場価値規模推計・予測
9.2 南アジア太平洋地域のビジネスプロセスアウトソーシング(BPO)国別市場規模推計・予測
9.3 南アジア太平洋地域のビジネスプロセスアウトソーシング(BPO)市場:タイプ別規模予測・展望
9.4 南アジア太平洋地域のビジネスプロセスアウトソーシング(BPO)市場:サービス別市場規模予測・予測
9.5 南アジア太平洋地域のビジネスプロセスアウトソーシング(BPO)市場:用途別市場規模予測・予測
9.6 南アジア太平洋地域のビジネスプロセスアウトソーシング(BPO)市場:エンドユーザー別市場規模予測・予測
9.7 インドの市場展望
9.7.1 同国における主要プレイヤー
9.8 南アジア地域のその他の地域の市場展望
10 東南アジア太平洋地域のビジネスプロセスアウトソーシング(BPO)市場分析
10.1 主要な調査結果
10.1.1 東南アジア・太平洋地域のビジネスプロセスアウトソーシング(BPO)市場魅力度指数
10.1.2 東南アジア・太平洋地域のビジネスプロセスアウトソーシング(BPO)市場金額別
10.1.3 東南アジア・南太平洋のビジネスプロセスアウトソーシング(BPO)国別市場
10.2 東南アジア・南太平洋のビジネスプロセスアウトソーシング(BPO)タイプ別市場規模予測・予想
10.3 東南アジア・南太平洋のビジネスプロセスアウトソーシング(BPO)市場:サービス別市場規模予測及び予測
10.4 東南アジア・南太平洋のビジネスプロセスアウトソーシング(BPO)市場:用途別市場規模予測・予測
10.5 東南アジア・南太平洋のビジネスプロセスアウトソーシング(BPO)市場:エンドユーザー別市場規模予測・予測
10.6 インドネシアの市場展望
10.6.1 同国における主要プレイヤー
10.7 フィリピンの市場展望
10.7.1 フィリピンの主要企業
10.8 タイの市場展望
10.8.1 この国の主要なプレーヤー
10.9 マレーシアの市場展望
10.9.1 マレーシアの主要企業
10.10 シンガポールの市場展望
10.10.1 シンガポールの主要企業
10.11 その他の東南アジア地域の市場展望
11 東アジア太平洋地域のビジネスプロセスアウトソーシング(BPO)市場の分析
11.1 主要な調査結果
11.1.1 東アジア・太平洋地域のビジネスプロセスアウトソーシング(BPO)市場の魅力度指数
11.1.2 東アジア・太平洋地域のビジネスプロセスアウトソーシング(BPO)市場金額別
11.1.3 東アジア太平洋地域のビジネスプロセスアウトソーシング(BPO)市場国別
11.2 東アジア太平洋地域のビジネスプロセスアウトソーシング(BPO)市場:タイプ別
11.3 東アジア・太平洋地域のビジネスプロセスアウトソーシング(BPO)市場:サービス別
11.4 東アジア太平洋地域のビジネスプロセスアウトソーシング(BPO)市場:用途別規模予測・予想
11.5 東アジア太平洋地域のビジネスプロセスアウトソーシング(BPO)市場:エンドユーザー別市場規模予測・予測
11.6 中国市場の展望
11.6.1 中国における主要プレイヤーの数
11.7 日本市場の展望
11.7.1 日本における主要プレイヤー
11.8 韓国市場の展望
11.8.1 韓国におけるキープレイヤー
11.9 オーストラリアの市場展望
11.9.1 この国のキープレイヤー
11.10 香港の市場展望
11.10.1 国内の主要なプレーヤー
11.11 東アジア・太平洋の残りの地域の市場展望
12 西アジア太平洋地域のビジネスプロセスアウトソーシング(BPO)市場の分析
12.1 主要な調査結果
12.1.1 西アジア太平洋地域のビジネスプロセスアウトソーシング(BPO)市場魅力度指数
12.1.2 西アジア太平洋地域のビジネスプロセスアウトソーシング(BPO)市場金額別
12.1.3 西アジア太平洋地域のビジネスプロセスアウトソーシング(BPO)国別市場
12.2 西アジア太平洋地域のビジネスプロセスアウトソーシング(BPO)市場:タイプ別
12.3 西アジア太平洋地域のビジネスプロセスアウトソーシング(BPO)市場:サービス別規模予測・予想
12.4 西アジア太平洋地域のビジネスプロセスアウトソーシング(BPO)市場:用途別
12.5 西アジア太平洋地域のビジネスプロセスアウトソーシング(BPO)市場:エンドユーザー別市場規模予測・予測
12.6 トルコの市場展望
12.7 アラブ首長国連邦の市場展望
12.8 その他の西アジア地域の市場展望
13 中央アジア・太平洋地域のビジネスプロセスアウトソーシング(BPO)市場分析
13.1 主要な調査結果
13.1.1 中央アジア・太平洋地域のビジネスプロセスアウトソーシング(BPO)市場魅力度指数
13.1.2 中央アジア・パシフィックのビジネスプロセスアウトソーシング(BPO)市場(金額別
13.2 中央アジア・太平洋地域のビジネスプロセスアウトソーシング(BPO)市場(国別
13.3 中央アジア・太平洋地域のビジネスプロセスアウトソーシング(BPO)市場:タイプ別
13.4 中央アジア・太平洋地域のビジネスプロセスアウトソーシング(BPO)市場:サービス別
13.5 中央アジア・太平洋地域のビジネスプロセスアウトソーシング(BPO)市場:アプリケーション別
13.6 中央アジア・太平洋地域のビジネスプロセスアウトソーシング(BPO)市場:エンドユーザー別規模予測・予想
13.7 ウズベキスタン市場の展望
13.8 カザフスタンの市場展望
13.9 中央アジアのその他の地域の市場展望
14 競合他社の状況
14.1 主要事業戦略分析-買収
14.2 主要事業戦略分析-契約
14.3 主要事業戦略分析-投資
14.4 主要事業戦略分析-新製品上市
14.5 主要事業戦略分析-パートナーシップ
15 主要企業のプロフィール
15.1 Accenture Plc
15.1.1 会社概要
15.1.2 会社概要
15.1.3 財務分析
15.1.4 製品ベンチマーク
15.1.5 戦略的展望
15.2 IBM Corporation
15.2.1 企業スナップショット
15.2.2 会社概要
15.2.3 財務分析
15.2.4 製品ベンチマーク
15.2.5 戦略的展望
15.3 Cognizant
15.3.1 企業スナップショット
15.3.2 会社概要
15.3.3 財務分析
15.3.4 製品ベンチマーク
15.3.5 戦略的展望
15.4 Capgemini SE
15.4.1 企業スナップショット
15.4.2 会社概要
15.4.3 財務分析
15.4.4 製品ベンチマーク
15.4.5 戦略的展望
15.5 インフォシスリミテッド
15.5.1 企業スナップショット
15.5.2 会社概要
15.5.3 財務分析
15.5.4 製品ベンチマーク
15.5.5 戦略的な展望
15.6 ADP Inc.
15.6.1 企業スナップショット
15.6.2 会社概要
15.6.3 財務分析
15.6.4 製品ベンチマーク
15.7 Amdocs
15.7.1 企業スナップショット
15.7.2 会社概要
15.7.3 財務分析
15.7.4 ベンチマーキング
15.7.5 戦略的展望
15.8 CBRE Group, Inc
15.8.1 企業スナップショット
15.8.2 会社概要
15.8.3 財務分析
15.8.4 製品ベンチマーク
15.8.5 戦略的展望
15.9 Concentrix Corporation
15.9.1 企業スナップショット
15.9.2 会社概要
15.9.3 財務分析
15.9.4 製品ベンチマーク
15.9.5 戦略的展望
15.10 HCL Technologies Limited
15.10.1 企業スナップショット
15.10.2 会社概要
15.10.3 財務分析
15.10.4 製品ベンチマーク
15.10.5 戦略的な展望
16 結論と提言
16.1 ビジョンゲインからの結論
16.2 市場関係者への提言
16.2.1 プロセスへの経営陣の参加
16.2.2 事前に成長目標を明確にする
16.2.3 IT能力を過小評価しない
16.2.4 BPO戦略の実行には時間をかけるべき
表の一覧
Table 1 Asia-Pacific Business Process Outsourcing (BPO) Market Snapshot, 2023 & 2033 (US$ billion, CAGR %)
Table 2 Asia-Pacific Business Process Outsourcing (BPO) Market Forecast, 2023-2033 (US$ Bn, AGR (%), CAGR (%)) (V-Shaped Recovery Scenario)
Table 3 Asia-Pacific Business Process Outsourcing (BPO) Market by Region, 2023-2033 (US$ Bn, AGR (%), CAGR (%)) (V-Shaped Recovery Scenario)
Table 4 Asia-Pacific Business Process Outsourcing (BPO) Market Forecast, 2023-2033 (US$ Bn, AGR (%), CAGR (%)) (W-Shaped Recovery Scenario)
Table 5 Asia-Pacific Business Process Outsourcing (BPO) Market by Region, 2023-2033 (US$ Bn, AGR (%), CAGR (%)) (W-Shaped Recovery Scenario)
Table 6 Asia-Pacific Business Process Outsourcing (BPO) Market Forecast, 2023-2033 (US$ Bn, AGR (%), CAGR (%)) (U-Shaped Recovery Scenario)
Table 7 Asia-Pacific Business Process Outsourcing (BPO) Market by Region, 2023-2033 (US$ Bn, AGR (%), CAGR (%)) (U-Shaped Recovery Scenario)
Table 8 Asia-Pacific Business Process Outsourcing (BPO) Market Forecast, 2023-2033 (US$ Bn, AGR (%), CAGR (%)) (L-Shaped Recovery Scenario)
Table 9 Asia-Pacific Business Process Outsourcing (BPO) Market by Region, 2023-2033 (US$ Bn, AGR (%), CAGR (%)) (L-Shaped Recovery Scenario)
Table 10 Asia-Pacific Business Process Outsourcing (BPO) Market by Type, 2023-2033 (US$ Bn, AGR (%), CAGR (%))
Table 11 Asia-Pacific Nearshore Market Forecast, 2023-2033 (US$ Bn, AGR (%), CAGR (%))
Table 12 Asia-Pacific Nearshore Market by Region, 2023-2033 (US$ Bn, AGR (%), CAGR (%))
Table 13 Asia-Pacific Off-source Market Forecast, 2023-2033 (US$ Bn, AGR (%), CAGR (%))
Table 14 Asia-Pacific Off-source Market by Region, 2023-2033 (US$ Bn, AGR (%), CAGR (%))
Table 15 Asia-Pacific Onshore Market Forecast, 2023-2033 (US$ Bn, AGR (%), CAGR (%))
Table 16 Asia-Pacific Onshore Market by Region, 2023-2033 (US$ Bn, AGR (%), CAGR (%))
Table 17 Asia-Pacific Business Process Outsourcing (BPO) Market by Service, 2023-2033 (US$ Bn, AGR (%), CAGR (%))
Table 18 Asia-Pacific Voice Processing Market Forecast, 2023-2033 (US$ Bn, AGR (%), CAGR (%))
Table 19 Asia-Pacific Voice Processing Market by Region, 2023-2033 (US$ Bn, AGR (%), CAGR (%))
Table 20 Asia-Pacific Telemarketing Services Market Forecast, 2023-2033 (US$ Bn, AGR (%), CAGR (%))
Table 21 Asia-Pacific Telemarketing Services Market by Region, 2023-2033 (US$ Bn, AGR (%), CAGR (%))
Table 22 Asia-Pacific Visualization Services Market Forecast, 2023-2033 (US$ Bn, AGR (%), CAGR (%))
Table 23 Asia-Pacific Visualization Services Market by Region, 2023-2033 (US$ Bn, AGR (%), CAGR (%))
Table 24 Asia-Pacific Other Services Market Forecast, 2023-2033 (US$ Bn, AGR (%), CAGR (%))
Table 25 Asia-Pacific Other Services Market by Region, 2023-2033 (US$ Bn, AGR (%), CAGR (%))
Table 26 Asia-Pacific Business Process Outsourcing (BPO) Market by Application, 2023-2033 (US$ Bn, AGR (%), CAGR (%))
Table 27 Asia-Pacific Customer Care & Demonstrations Market Forecast, 2023-2033 (US$ Bn, AGR (%), CAGR (%))
Table 28 Asia-Pacific Customer Care & Demonstrations Market by Region, 2023-2033 (US$ Bn, AGR (%), CAGR (%))
Table 29 Asia-Pacific Sales & Marketing Market Forecast, 2023-2033 (US$ Bn, AGR (%), CAGR (%))
Table 30 Asia-Pacific Sales & Marketing Market by Region, 2023-2033 (US$ Bn, AGR (%), CAGR (%))
Table 31 Asia-Pacific Finance & Accounting Market Forecast, 2023-2033 (US$ Bn, AGR (%), CAGR (%))
Table 32 Asia-Pacific Finance & Accounting Market by Region, 2023-2033 (US$ Bn, AGR (%), CAGR (%))
Table 33 Asia-Pacific Human Resource & Development Market Forecast, 2023-2033 (US$ Bn, AGR (%), CAGR (%))
Table 34 Asia-Pacific Human Resource & Development Market by Region, 2023-2033 (US$ Bn, AGR (%), CAGR (%))
Table 35 Asia-Pacific Other Application Market Forecast, 2023-2033 (US$ Bn, AGR (%), CAGR (%))
Table 36 Asia-Pacific Other Application Market by Region, 2023-2033 (US$ Bn, AGR (%), CAGR (%))
Table 37 Asia-Pacific Business Process Outsourcing (BPO) Market by End-User, 2023-2033 (US$ Bn, AGR (%), CAGR (%))
Table 38 Asia-Pacific IT & Telecom Market Forecast, 2023-2033 (US$ Bn, AGR (%), CAGR (%))
Table 39 Asia-Pacific IT & Telecom Market by Region, 2023-2033 (US$ Bn, AGR (%), CAGR (%))
Table 40 Asia-Pacific BFSI Market Forecast, 2023-2033 (US$ Bn, AGR (%), CAGR (%))
Table 41 Asia-Pacific BFSI Market by Region, 2023-2033 (US$ Bn, AGR (%), CAGR (%))
Table 42 Asia-Pacific Healthcare Sector Market Forecast, 2023-2033 (US$ Bn, AGR (%), CAGR (%))
Table 43 Asia-Pacific Healthcare Sector Market by Region, 2023-2033 (US$ Bn, AGR (%), CAGR (%))
Table 44 Asia-Pacific Manufacturing Sector Market Forecast, 2023-2033 (US$ Bn, AGR (%), CAGR (%))
Table 45 Asia-Pacific Manufacturing Sector Market by Region, 2023-2033 (US$ Bn, AGR (%), CAGR (%))
Table 46 Asia-Pacific Retail & E-Commerce Market Forecast, 2023-2033 (US$ Bn, AGR (%), CAGR (%))
Table 47 Asia-Pacific Retail & E-Commerce Market by Region, 2023-2033 (US$ Bn, AGR (%), CAGR (%))
Table 48 Asia-Pacific Other End-User Market Forecast, 2023-2033 (US$ Bn, AGR (%), CAGR (%))
Table 49 Asia-Pacific Other End-User Market by Region, 2023-2033 (US$ Bn, AGR (%), CAGR (%))
Table 50 Asia-Pacific Business Process Outsourcing (BPO) Market Forecast, 2023-2033 (US$ Bn, AGR (%), CAGR (%))
Table 51 Asia-Pacific Business Process Outsourcing (BPO) Market by Region, 2023-2033 (US$ Bn, AGR (%), CAGR (%))
Table 52 Asia-Pacific Business Process Outsourcing (BPO) Market by Type, 2023-2033 (US$ Bn, AGR (%), CAGR (%))
Table 53 Asia-Pacific Business Process Outsourcing (BPO) Market by Service, 2023-2033 (US$ Bn, AGR (%), CAGR (%))
Table 54 Asia-Pacific Business Process Outsourcing (BPO) Market by Application, 2023-2033 (US$ Bn, AGR (%), CAGR (%))
Table 55 Asia-Pacific Business Process Outsourcing (BPO) Market by End-User, 2023-2033 (US$ Bn, AGR (%), CAGR (%))
Table 56 Southern Asia Business Process Outsourcing (BPO) Market by Value, 2023-2033 (US$ Bn, AGR (%), CAGR (%))
Table 57 Southern Asia Business Process Outsourcing (BPO) Market by Country, 2023-2033 (US$ Bn, AGR (%), CAGR (%))
Table 58 Southern Asia Business Process Outsourcing (BPO) Market by Type, 2023-2033 (US$ Bn, AGR (%), CAGR (%))
Table 59 Southern Asia Business Process Outsourcing (BPO) Market by Service, 2023-2033 (US$ Bn, AGR (%), CAGR (%))
Table 60 Southern Asia Business Process Outsourcing (BPO) Market by Application, 2023-2033 (US$ Bn, AGR (%), CAGR (%))
Table 61 Southern Asia Business Process Outsourcing (BPO) Market by End-User, 2023-2033 (US$ Bn, AGR (%), CAGR (%))
Table 62 India Business Process Outsourcing (BPO) Market by Value, 2023-2033 (US$ Bn, AGR (%), CAGR (%))
Table 63 Rest of Southern Asia Business Process Outsourcing (BPO) Market by Value, 2023-2033 (US$ Bn, AGR (%), CAGR (%))
Table 64 South-Eastern Asia Business Process Outsourcing (BPO) Market by Value, 2023-2033 (US$ Bn, AGR (%), CAGR (%))
Table 65 South-Eastern Asia Business Process Outsourcing (BPO) Market by Country, 2023-2033 (US$ Bn, AGR (%), CAGR (%))
Table 66 South-Eastern Asia Business Process Outsourcing (BPO) Market by Type, 2023-2033 (US$ Bn, AGR (%), CAGR (%))
Table 67 South-Eastern Asia Business Process Outsourcing (BPO) Market by Service, 2023-2033 (US$ Bn, AGR (%), CAGR (%))
Table 68 South-Eastern Asia Business Process Outsourcing (BPO) Market by Application, 2023-2033 (US$ Bn, AGR (%), CAGR (%))
Table 69 South-Eastern Asia Business Process Outsourcing (BPO) Market by End-User, 2023-2033 (US$ Bn, AGR (%), CAGR (%))
Table 70 Indonesia Business Process Outsourcing (BPO) Market by Value, 2023-2033 (US$ Bn, AGR (%), CAGR (%))
Table 71 Philippines Business Process Outsourcing (BPO) Market by Value, 2023-2033 (US$ Bn, AGR (%), CAGR (%))
Table 72 Thailand Business Process Outsourcing (BPO) Market by Value, 2023-2033 (US$ Bn, AGR (%), CAGR (%))
Table 73 Malaysia Business Process Outsourcing (BPO) Market by Value, 2023-2033 (US$ Bn, AGR (%), CAGR (%))
Table 74 Singapore Business Process Outsourcing (BPO) Market by Value, 2023-2033 (US$ Bn, AGR (%), CAGR (%))
Table 75 Rest of South-Eastern Asia Business Process Outsourcing (BPO) Market by Value, 2023-2033 (US$ Bn, AGR (%), CAGR (%))
Table 76 Eastern Asia Business Process Outsourcing (BPO) Market by Country, 2023-2033 (US$ Bn, AGR (%), CAGR (%))
Table 77 Eastern Asia Business Process Outsourcing (BPO) Market by Type, 2023-2033 (US$ Bn, AGR (%), CAGR (%))
Table 78 Eastern Asia Business Process Outsourcing (BPO) Market by Service, 2023-2033 (US$ Bn, AGR (%), CAGR (%))
Table 79 Eastern Asia Business Process Outsourcing (BPO) Market by Application, 2023-2033 (US$ Bn, AGR (%), CAGR (%))
Table 80 Eastern Asia Business Process Outsourcing (BPO) Market by End-User, 2023-2033 (US$ Bn, AGR (%), CAGR (%))
Table 81 China Business Process Outsourcing (BPO) Market by Value, 2023-2033 (US$ Bn, AGR (%), CAGR (%))
Table 82 Japan Business Process Outsourcing (BPO) Market by Value, 2023-2033 (US$ Bn, AGR (%), CAGR (%))
Table 83 South Korea Business Process Outsourcing (BPO) Market by Value, 2023-2033 (US$ Bn, AGR (%), CAGR (%))
Table 84 Australia Business Process Outsourcing (BPO) Market by Value, 2023-2033 (US$ Bn, AGR (%), CAGR (%))
Table 85 Hong Kong Business Process Outsourcing (BPO) Market by Value, 2023-2033 (US$ Bn, AGR (%), CAGR (%))
Table 86 Rest of Eastern Asia Business Process Outsourcing (BPO) Market by Value, 2023-2033 (US$ Bn, AGR (%), CAGR (%))
Table 87 Western Asia Business Process Outsourcing (BPO) Market by Value, 2023-2033 (US$ Bn, AGR (%), CAGR (%))
Table 88 Western Asia Business Process Outsourcing (BPO) Market by Country, 2023-2033 (US$ Bn, AGR (%), CAGR (%))
Table 89 Western Asia Business Process Outsourcing (BPO) Market by Type, 2023-2033 (US$ Bn, AGR (%), CAGR (%))
Table 90 Western Asia Business Process Outsourcing (BPO) Market by Service, 2023-2033 (US$ Bn, AGR (%), CAGR (%))
Table 91 Western Asia Business Process Outsourcing (BPO) Market by Application, 2023-2033 (US$ Bn, AGR (%), CAGR (%))
Table 92 Western Asia Business Process Outsourcing (BPO) Market by End-User, 2023-2033 (US$ Bn, AGR (%), CAGR (%))
Table 93 Turkey Business Process Outsourcing (BPO) Market by Value, 2023-2033 (US$ Bn, AGR (%), CAGR (%))
Table 94 United Arab Emirates Business Process Outsourcing (BPO) Market by Value, 2023-2033 (US$ Bn, AGR (%), CAGR (%))
Table 95 Rest of Western Asia Business Process Outsourcing (BPO) Market by Value, 2023-2033 (US$ Bn, AGR (%), CAGR (%))
Table 96 Central Asia Business Process Outsourcing (BPO) Market by Value, 2023-2033 (US$ Bn, AGR (%), CAGR (%))
Table 97 Central Asia Business Process Outsourcing (BPO) Market by Country, 2023-2033 (US$ Bn, AGR (%), CAGR (%))
Table 98 Central Asia Business Process Outsourcing (BPO) Market by Type, 2023-2033 (US$ Bn, AGR (%), CAGR (%))
Table 99 Central Asia Business Process Outsourcing (BPO) Market by Service, 2023-2033 (US$ Bn, AGR (%), CAGR (%))
Table 100 Central Asia Business Process Outsourcing (BPO) Market by Application, 2023-2033 (US$ Bn, AGR (%), CAGR (%))
Table 101 Central Asia Business Process Outsourcing (BPO) Market by End-User, 2023-2033 (US$ Bn, AGR (%), CAGR (%))
Table 102 Uzbekistan Business Process Outsourcing (BPO) Market by Value, 2023-2033 (US$ Bn, AGR (%), CAGR (%))
Table 103 Kazakhstan Business Process Outsourcing (BPO) Market by Value, 2023-2033 (US$ Bn, AGR (%), CAGR (%))
Table 104 Rest of Central Asia Business Process Outsourcing (BPO) Market by Value, 2023-2033 (US$ Bn, AGR (%), CAGR (%))
Table 105 Key Business Strategies Adopted by Key Players in Asia-Pacific Business Process Outsourcing (BPO) Market
Table 106 Key Business Strategies Adopted by Key Players in Asia-Pacific Business Process Outsourcing (BPO) Market
Table 107 Key Business Strategies Adopted by Key Players in Asia-Pacific Business Process Outsourcing (BPO) Market
Table 108 Key Business Strategies Adopted by Key Players in Asia-Pacific Business Process Outsourcing (BPO) Market
Table 109 Key Business Strategies Adopted by Key Players in Asia-Pacific Business Process Outsourcing (BPO) Market
Table 110 Accenture Plc: Key Details, (CEO, HQ, Revenue, Founded, No. of Employees, Company Type, Website, Business Segment)
Table 111 Accenture Plc: Product Benchmarking
Table 112 Accenture Plc: Strategic Outlook
Table 113 IBM Corporation: Key Details, (CEO, HQ, Revenue, Founded, No. of Employees, Company Type, Website, Business Segment)
Table 114 IBM Corporation: Product Benchmarking
Table 115 IBM Corporation: Strategic Outlook
Table 116 Cognizant: Key Details, (CEO, HQ, Revenue, Founded, No. of Employees, Company Type, Website, Business Segment)
Table 117 Cognizant: Product Benchmarking
Table 118 Cognizant: Strategic Outlook
Table 119 Capgemini SE: Key Details, (CEO, HQ, Revenue, Founded, No. of Employees, Company Type, Website, Business Segment)
Table 120 Capgemini SE: Product Benchmarking
Table 121 Capgemini SE: Strategic Outlook
Table 122 Infosys Limited: Key Details, (CEO, HQ, Revenue, Founded, No. of Employees, Company Type, Website, Business Segment)
Table 123 Infosys Limited: Product Benchmarking
Table 124 Infosys Limited: Strategic Outlook
Table 125 ADP, Inc: Key Details, (CEO, HQ, Revenue, Founded, No. of Employees, Company Type, Website, Business Segment)
Table 126 ADP, Inc: Product Benchmarking
Table 127 Amdocs: Key Details, (CEO, HQ, Revenue, Founded, No. of Employees, Company Type, Website, Business Segment)
Table 128 Amdocs: Product Benchmarking
Table 129 Amdocs: Strategic Outlook
Table 130 CBRE Group, Inc: Key Details, (CEO, HQ, Revenue, Founded, No. of Employees, Company Type, Website, Business Segment)
Table 131 CBRE Group, Inc: Product Benchmarking
Table 132 CBRE Group, Inc: Strategic Outlook
Table 133 Concentrix Corporation: Key Details, (CEO, HQ, Revenue, Founded, No. of Employees, Company Type, Website, Business Segment)
Table 134 Concentrix Corporation: Product Benchmarking
Table 135 Concentrix Corporation: Strategic Outlook
Table 136 HCL Technologies Limited: Key Details, (CEO, HQ, Revenue, Founded, No. of Employees, Company Type, Website, Business Segment)
Table 137 HCL Technologies Limited: Product Benchmarking
Table 138 HCL Technologies Limited: Strategic Outlook
図の一覧
Figure 1 Asia-Pacific Business Process Outsourcing (BPO) Market Segmentation
Figure 2 Asia-Pacific Business Process Outsourcing (BPO) Market by Region: Market Attractiveness Index
Figure 3 Asia-Pacific Business Process Outsourcing (BPO) Market by Type: Market Attractiveness Index
Figure 4 Asia-Pacific Business Process Outsourcing (BPO) Market by Services: Market Attractiveness Index
Figure 5 Asia-Pacific Business Process Outsourcing (BPO) Market by Application: Market Attractiveness Index
Figure 6 Asia-Pacific Business Process Outsourcing (BPO) Market by End-User: Market Attractiveness Index
Figure 7 Asia-Pacific Business Process Outsourcing (BPO) Market: Market Dynamics
Figure 8 COVID Impact Analysis: Asia-Pacific Business Process Outsourcing (BPO) Market Recovery Scenarios 2023-2033 (US$ Bn, CAGR (%))
Figure 9 Asia-Pacific Business Process Outsourcing (BPO) Market Forecast, 2023-2033 (US$ Bn, AGR (%)) (V-Shaped Recovery Scenario)
Figure 10 Asia-Pacific Business Process Outsourcing (BPO) Market by Region, 2023-2033 (US$ Bn, AGR (%)) (V-Shaped Recovery Scenario)
Figure 11 Asia-Pacific Business Process Outsourcing (BPO) Market Forecast, 2023-2033 (US$ Bn, AGR (%)) (W-Shaped Recovery Scenario)
Figure 12 Asia-Pacific Business Process Outsourcing (BPO) Market by Region, 2023-2033 (US$ Bn, AGR (%)) (W-Shaped Recovery Scenario)
Figure 13 Asia-Pacific Business Process Outsourcing (BPO) Market Forecast, 2023-2033 (US$ Bn, AGR (%)) (U-Shaped Recovery Scenario)
Figure 14 Asia-Pacific Business Process Outsourcing (BPO) Market by Region, 2023-2033 (US$ Bn, AGR (%)) (U-Shaped Recovery Scenario)
Figure 15 Asia-Pacific Business Process Outsourcing (BPO) Market Forecast, 2023-2033 (US$ Bn, AGR (%)) (L-Shaped Recovery Scenario)
Figure 16 Asia-Pacific Business Process Outsourcing (BPO) Market by Region, 2023-2033 (US$ Bn, AGR (%)) (L-Shaped Recovery Scenario)
Figure 17 Asia-Pacific Business Process Outsourcing (BPO) Market: Porter’s Five Forces Analysis
Figure 18 Asia-Pacific Business Process Outsourcing (BPO) Market: PESTLE Analysis
Figure 19 Asia-Pacific Business Process Outsourcing (BPO) Market Forecast by Type 2023-2033 (Revenue, CAGR%)
Figure 20 Asia-Pacific Business Process Outsourcing (BPO) Market Share Forecast by Type, 2023& 2033 (%)
Figure 21 Asia-Pacific Business Process Outsourcing (BPO) Market by Type, 2023-2033 (US$ Bn, AGR (%))
Figure 22 Asia-Pacific Nearshore Market Forecast, 2023-2033 (US$ Bn, AGR (%))
Figure 23 Asia-Pacific Nearshore Market by Region, 2023-2033 (US$ Bn, AGR (%))
Figure 24 Asia-Pacific Off-source Market Forecast, 2023-2033 (US$ Bn, AGR (%))
Figure 25 Asia-Pacific Off-source Market by Region, 2023-2033 (US$ Bn, AGR (%))
Figure 26 Asia-Pacific Onshore Market Forecast, 2023-2033 (US$ Bn, AGR (%))
Figure 27 Asia-Pacific Onshore Market by Region, 2023-2033 (US$ Bn, AGR (%))
Figure 28 Asia-Pacific Business Process Outsourcing (BPO) Market Forecast by Service Segment: Market Attractiveness Index
Figure 29 Asia-Pacific Business Process Outsourcing (BPO) Market Share Forecast by Service, 2023, 20323(%)
Figure 30 Asia-Pacific Business Process Outsourcing (BPO) Market by Service, 2023-2033 (US$ Bn, AGR (%))
Figure 31 Asia-Pacific Voice Processing Market Forecast, 2023-2033 (US$ Bn, AGR (%))
Figure 32 Asia-Pacific Voice Processing Market by Region, 2023-2033 (US$ Bn, AGR (%))
Figure 33 Asia-Pacific Telemarketing Services Market Forecast, 2023-2033 (US$ Bn, AGR (%))
Figure 34 Asia-Pacific Telemarketing Services Market by Region, 2023-2033 (US$ Bn, AGR (%))
Figure 35 Asia-Pacific Visualization Services Market Forecast, 2023-2033 (US$ Bn, AGR (%))
Figure 36 Asia-Pacific Visualization Services Market by Region, 2023-2033 (US$ Bn, AGR (%))
Figure 37 Asia-Pacific Other Services Market Forecast, 2023-2033 (US$ Bn, AGR (%))
Figure 38 Asia-Pacific Other Services Market by Region, 2023-2033 (US$ Bn, AGR (%))
Figure 39 Asia-Pacific Business Process Outsourcing (BPO) Market Forecast by Application Segment: Market Attractiveness Index
Figure 40 Asia-Pacific Business Process Outsourcing (BPO) Market Share Forecast by Application, 2023, 2033 (%)
Figure 41 Asia-Pacific Business Process Outsourcing (BPO) Market by Application, 2023-2033 (US$ Bn, AGR (%))
Figure 42 Asia-Pacific Customer Care & Demonstrations Market Forecast, 2023-2033 (US$ Bn, AGR (%))
Figure 43 Asia-Pacific Customer Care & Demonstrations Market by Region, 2023-2033 (US$ Bn, AGR (%))
Figure 44 Asia-Pacific Sales & Marketing Market Forecast, 2023-2033 (US$ Bn, AGR (%))
Figure 45 Asia-Pacific Sales & Marketing Market by Region, 2023-2033 (US$ Bn, AGR (%))
Figure 46 Asia-Pacific Finance & Accounting Market Forecast, 2023-2033 (US$ Bn, AGR (%))
Figure 47 Asia-Pacific Finance & Accounting Market by Region, 2023-2033 (US$ Bn, AGR (%))
Figure 48 Asia-Pacific Human Resource & Development Market Forecast, 2023-2033 (US$ Bn, AGR (%))
Figure 49 Asia-Pacific Human Resource & Development Market by Region, 2023-2033 (US$ Bn, AGR (%))
Figure 50 Asia-Pacific Other Application Market Forecast, 2023-2033 (US$ Bn, AGR (%))
Figure 51 Asia-Pacific Other Application Market by Region, 2023-2033 (US$ Bn, AGR (%))
Figure 52 Asia-Pacific Business Process Outsourcing (BPO) Market Forecast by End-User Segment: Market Attractiveness Index
Figure 53 Asia-Pacific Business Process Outsourcing (BPO) Market Share Forecast by End-User, 2023, 2033 (%)
Figure 54 Asia-Pacific Business Process Outsourcing (BPO) Market by End-User, 2023-2033 (US$ Bn, AGR (%))
Figure 55 Asia-Pacific IT & Telecom Market Forecast, 2023-2033 (US$ Bn, AGR (%))
Figure 56 Asia-Pacific IT & Telecom Market by Region, 2023-2033 (US$ Bn, AGR (%))
Figure 57 Asia-Pacific BFSI Market Forecast, 2023-2033 (US$ Bn, AGR (%))
Figure 58 Asia-Pacific BFSI Market by Region, 2023-2033 (US$ Bn, AGR (%))
Figure 60 Asia-Pacific Healthcare Sector Market by Region, 2023-2033 (US$ Bn, AGR (%))
Figure 61 Asia-Pacific Manufacturing Sector Market Forecast, 2023-2033 (US$ Bn, AGR (%))
Figure 62 Asia-Pacific Manufacturing Sector Market by Region, 2023-2033 (US$ Bn, AGR (%))
Figure 64 Asia-Pacific Retail & E-Commerce Market by Region, 2023-2033 (US$ Bn, AGR (%))
Figure 65 Asia-Pacific Other End-User Market Forecast, 2023-2033 (US$ Bn, AGR (%))
Figure 66 Asia-Pacific Other End-User Market by Region, 2023-2033 (US$ Bn, AGR (%))
Figure 67 Asia-Pacific Business Process Outsourcing (BPO) Market Forecast by Region 2023-2033: Market Attractiveness Index
Figure 68 Asia-Pacific Business Process Outsourcing (BPO) Market Share Forecast by Application, 2023, 2033 (%)
Figure 69 Asia-Pacific Business Process Outsourcing (BPO) Market Forecast, 2023-2033 (US$ Bn, AGR (%))
Figure 70 Asia-Pacific Business Process Outsourcing (BPO) Market by Region, 2023-2033 (US$ Bn, AGR (%))
Figure 71 Asia-Pacific Business Process Outsourcing (BPO) Market by Type, 2023-2033 (US$ Bn, AGR (%))
Figure 72 Asia-Pacific Business Process Outsourcing (BPO) Market by Service, 2023-2033 (US$ Bn, AGR (%))
Figure 73 Asia-Pacific Business Process Outsourcing (BPO) Market by Application, 2023-2033 (US$ Bn, AGR (%))
Figure 74 Asia-Pacific Business Process Outsourcing (BPO) Market by End-User, 2023-2033 (US$ Bn, AGR (%))
Figure 75 Southern Asia-Pacific Business Process Outsourcing (BPO) Market by Region: Market Attractiveness Index
Figure 76 Southern Asia Business Process Outsourcing (BPO) Market by Value, 2023-2033 (US$ Bn, AGR (%))
Figure 77 Southern Asia Business Process Outsourcing (BPO) Market by Country, 2023-2033 (US$ Bn, AGR (%))
Figure 78 Southern Asia Business Process Outsourcing (BPO) Market by Type, 2023-2033 (US$ Bn, AGR (%))
Figure 79 Southern Asia Business Process Outsourcing (BPO) Market by Service, 2023-2033 (US$ Bn, AGR (%))
Figure 80 Southern Asia Business Process Outsourcing (BPO) Market by Application, 2023-2033 (US$ Bn, AGR (%))
Figure 81 Southern Asia Business Process Outsourcing (BPO) Market by End-User, 2023-2033 (US$ Bn, AGR (%))
Figure 82 India Business Process Outsourcing (BPO) Market by Value, 2023-2033 (US$ Bn, AGR (%))
Figure 83 Rest of Southern Asia Business Process Outsourcing (BPO) Market by Value, 2023-2033 (US$ Bn, AGR (%))
Figure 84 Southern-Eastern Asia-Pacific Business Process Outsourcing (BPO) Market by Region: Market Attractiveness Index
Figure 85 South-Eastern Asia Business Process Outsourcing (BPO) Market by Value, 2023-2033 (US$ Bn, AGR (%))
Figure 86 South-Eastern Asia Business Process Outsourcing (BPO) Market by Country, 2023-2033 (US$ Bn, AGR (%))
Figure 87 South-Eastern Asia Business Process Outsourcing (BPO) Market by Type, 2023-2033 (US$ Bn, AGR (%))
Figure 88 South-Eastern Asia Business Process Outsourcing (BPO) Market by Service, 2023-2033 (US$ Bn, AGR (%))
Figure 89 South-Eastern Asia Business Process Outsourcing (BPO) Market by Application, 2023-2033 (US$ Bn, AGR (%))
Figure 90 South-Eastern Asia Business Process Outsourcing (BPO) Market by End-User, 2023-2033 (US$ Bn, AGR (%))
Figure 91 Indonesia Business Process Outsourcing (BPO) Market by Value, 2023-2033 (US$ Bn, AGR (%))
Figure 92 Philippines Business Process Outsourcing (BPO) Market by Value, 2023-2033 (US$ Bn, AGR (%))
Figure 93 Thailand Business Process Outsourcing (BPO) Market by Value, 2023-2033 (US$ Bn, AGR (%))
Figure 94 Malaysia Business Process Outsourcing (BPO) Market by Value, 2023-2033 (US$ Bn, AGR (%))
Figure 95 Singapore Business Process Outsourcing (BPO) Market by Value, 2023-2033 (US$ Bn, AGR (%))
Figure 96 Rest of South-Eastern Asia Business Process Outsourcing (BPO) Market by Value, 2023-2033 (US$ Bn, AGR (%))
Figure 97 Eastern Asia-Pacific Business Process Outsourcing (BPO) Market by Region: Market Attractiveness Index
Figure 98 Eastern Asia Business Process Outsourcing (BPO) Market by Value, 2023-2033 (US$ Bn, AGR (%))
Figure 99 Eastern Asia Business Process Outsourcing (BPO) Market by Country, 2023-2033 (US$ Bn, AGR (%))
Figure 100 Eastern Asia Business Process Outsourcing (BPO) Market by Type, 2023-2033 (US$ Bn, AGR (%))
Figure 101 Eastern Asia Business Process Outsourcing (BPO) Market by Service, 2023-2033 (US$ Bn, AGR (%))
Figure 102 Eastern Asia Business Process Outsourcing (BPO) Market by Application, 2023-2033 (US$ Bn, AGR (%))
Figure 103 Eastern Asia Business Process Outsourcing (BPO) Market by End-User, 2023-2033 (US$ Bn, AGR (%))
Figure 104 China Business Process Outsourcing (BPO) Market by Value, 2023-2033 (US$ Bn, AGR (%))
Figure 105 Japan Business Process Outsourcing (BPO) Market by Value, 2023-2033 (US$ Bn, AGR (%))
Figure 106 South Korea Business Process Outsourcing (BPO) Market by Value, 2023-2033 (US$ Bn, AGR (%))
Figure 107 Australia Business Process Outsourcing (BPO) Market by Value, 2023-2033 (US$ Bn, AGR (%))
Figure 108 Hong Kong Business Process Outsourcing (BPO) Market by Value, 2023-2033 (US$ Bn, AGR (%))
Figure 109 Rest of Eastern Asia Business Process Outsourcing (BPO) Market by Value, 2023-2033 (US$ Bn, AGR (%))
Figure 110 Western Asia-Pacific Business Process Outsourcing (BPO) Market by Region: Market Attractiveness Index
Figure 111 Western Asia Business Process Outsourcing (BPO) Market by Value, 2023-2033 (US$ Bn, AGR (%))
Figure 112 Western Asia Business Process Outsourcing (BPO) Market by Country, 2023-2033 (US$ Bn, AGR (%))
Figure 113 Western Asia Business Process Outsourcing (BPO) Market by Type, 2023-2033 (US$ Bn, AGR (%))
Figure 114 Western Asia Business Process Outsourcing (BPO) Market by Service, 2023-2033 (US$ Bn, AGR (%))
Figure 115 Western Asia Business Process Outsourcing (BPO) Market by Application, 2023-2033 (US$ Bn, AGR (%))
Figure 116 Western Asia Business Process Outsourcing (BPO) Market by End-User, 2023-2033 (US$ Bn, AGR (%))
Figure 117 Turkey Business Process Outsourcing (BPO) Market by Value, 2023-2033 (US$ Bn, AGR (%))
Figure 118 United Arab Emirates Business Process Outsourcing (BPO) Market by Value, 2023-2033 (US$ Bn, AGR (%))
Figure 119 Rest of Western Asia Business Process Outsourcing (BPO) Market by Value, 2023-2033 (US$ Bn, AGR (%))
Figure 120 Central Asia-Pacific Business Process Outsourcing (BPO) Market by Region: Market Attractiveness Index
Figure 121 Central Asia Business Process Outsourcing (BPO) Market by Value, 2023-2033 (US$ Bn, AGR (%))
Figure 122 Central Asia Business Process Outsourcing (BPO) Market by Country, 2023-2033 (US$ Bn, AGR (%))
Figure 123 Central Asia Business Process Outsourcing (BPO) Market by Type, 2023-2033 (US$ Bn, AGR (%))
Figure 124 Central Asia Business Process Outsourcing (BPO) Market by Service, 2023-2033 (US$ Bn, AGR (%))
Figure 125 Central Asia Business Process Outsourcing (BPO) Market by Application, 2023-2033 (US$ Bn, AGR (%))
Figure 126 Central Asia Business Process Outsourcing (BPO) Market by End-User, 2023-2033 (US$ Bn, AGR (%))
Figure 127 Uzbekistan Business Process Outsourcing (BPO) Market by Value, 2023-2033 (US$ Bn, AGR (%))
Figure 128 Kazakhstan Business Process Outsourcing (BPO) Market by Value, 2023-2033 (US$ Bn, AGR (%))
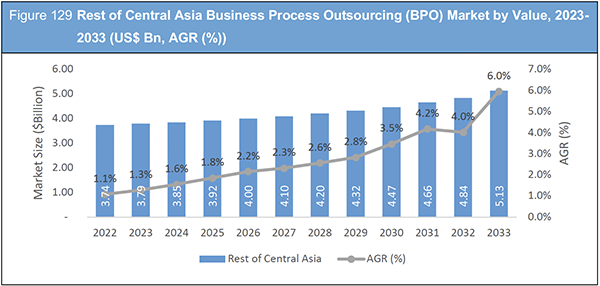
Figure 129 Rest of Central Asia Business Process Outsourcing (BPO) Market by Value, 2023-2033 (US$ Bn, AGR (%))
Figure 130 Accenture Plc: Net Revenue, 2017-2021 (US$ million, AGR%)
Figure 131 Accenture Plc: Gross Profit, 2017-2021 (US$ million, AGR%)
Figure 132 Accenture Plc: R&D, 2017-2021 (US$ million, AGR%)
Figure 133 IBM Corporation: Net Revenue, 2017-2021 (US$ million, AGR%)
Figure 134 IBM Corporation: Gross Profit, 2017-2021 (US$ million, AGR%)
Figure 135 IBM Corporation: R&D, 2017-2021 (US$ million, AGR%)
Figure 136 Cognizant: Net Revenue, 2017-2021 (US$ million, AGR%)
Figure 137 Cognizant: Gross Profit, 2017-2021 (US$ million, AGR%)
Figure 138 Capgemini SE: Net Revenue, 2017-2021 (US$ million, AGR%)
Figure 139 Capgemini SE: Gross Profit, 2017-2021 (US$ million, AGR%)
Figure 140 Infosys Limited: Net Revenue, 2017-2021 (US$ million, AGR%)
Figure 141 Infosys Limited: Gross Profit, 2017-2021 (US$ million, AGR%)
Figure 142 Infosys Limited: R&D, 2017-2021 (US$ million, AGR%)
Figure 143 ADP, Inc: Net Revenue, 2017-2021 (US$ million, AGR%)
Figure 144 ADP, Inc.: Gross Profit, 2017-2021 (US$ million, AGR%)
Figure 145 Amdocs: Net Revenue, 2017-2021 (US$ million, AGR%)
Figure 146 Amdocs: Gross Profit, 2017-2021 (US$ million, AGR%)
Figure 147 Amdocs: R&D, 2017-2021 (US$ million, AGR%)
Figure 148 CBRE Group, Inc: Net Revenue, 2017-2021 (US$ million, AGR%)
Figure 149 CBRE Group, Inc: Gross Profit, 2017-2021 (US$ million, AGR%)
Figure 150 Concentrix Corporation: Net Revenue, 2017-2021 (US$ million, AGR%)
Figure 151 Concentrix Corporation: Gross Profit, 2017-2021 (US$ million, AGR%)
Figure 152 HCL Technologies Limited: Net Revenue, 2017-2021 (US$ million, AGR%)
Figure 153 HCL Technologies Limited: Gross Profit, 2017-2021 (US$ million, AGR%)
Figure 154 HCL Technologies Limited: R&D, 2017-2021 (US$ million, AGR%)
ページTOPに戻る
Summary
Report Details
The Asia-Pacific Business Process Outsourcing (BPO) Market Report 2023-2033: This report will prove invaluable to leading firms striving for new revenue pockets if they wish to better understand the industry and its underlying dynamics. It will be useful for companies that would like to expand into different industries or to expand their existing operations in a new region.
The Asia-Pacific Business Process Outsourcing (BPO) Market Is a Rapidly Growing Market
The Asia-Pacific Business Process Outsourcing (BPO) market is a rapidly growing market that is expected to continue its growth trajectory in the coming years. The market is driven by the increasing adoption of outsourcing by organizations to reduce costs, improve efficiency and focus on their core competencies. The region is home to some of the world’s largest and most advanced economies, making it an attractive destination for BPO services.
The increasing adoption of digital technologies such as automation and artificial intelligence (AI) is also expected to boost the growth of the BPO market in the region. These technologies are enabling organizations to automate repetitive and low-value tasks, freeing up human resources for more strategic and higher-value tasks. Additionally, the use of AI and machine learning (ML) is helping organizations to improve their customer service and provide more personalized and efficient services to their customers.
The Asia-Pacific BPO market is competitive and is expected to see intense competition among vendors in the coming years. Some of the key players in the market include Accenture, Capgemini, Cognizant, Genpact, HCL Technologies, Infosys, Tata Consultancy Services, Wipro, and WNS Global Services. These companies are focusing on expanding their operations in the region to tap into the growing demand for BPO services.
What Questions Should You Ask before Buying a Market Research Report?
• How is the Asia-Pacific business process outsourcing (BPO) market evolving?
• What is driving and restraining the Asia-Pacific business process outsourcing (BPO) market?
• How will each Asia-Pacific business process outsourcing (BPO) submarket segment grow over the forecast period and how much revenue will these submarkets account for in 2033?
• How will the market shares for each Asia-Pacific business process outsourcing (BPO) submarket develop from 2023 to 2033?
• What will be the main driver for the overall market from 2023 to 2033?
• Will leading Asia-Pacific business process outsourcing (BPO) markets broadly follow the macroeconomic dynamics, or will individual national markets outperform others?
• How will the market shares of the national markets change by 2033 and which geographical region will lead the market in 2033?
• Who are the leading players and what are their prospects over the forecast period?
• What are the Asia-Pacific business process outsourcing (BPO) projects for these leading companies?
• How will the industry evolve during the period between 2023 and 2033? What are the implications of Asia-Pacific business process outsourcing (BPO) projects taking place now and over the next 10 years?
• Is there a greater need for product commercialisation to further scale the Asia-Pacific business process outsourcing (BPO) market?
• Where is the Asia-Pacific business process outsourcing (BPO) market heading and how can you ensure you are at the forefront of the market?
• What are the best investment options for new product and service lines?
• What are the key prospects for moving companies into a new growth path and C-suite?
You need to discover how this will impact the Asia-Pacific business process outsourcing (BPO) market today, and over the next 10 years:
• Our 303-page report provides 157 tables and 154 charts/graphs exclusively to you.
• The report highlights key lucrative areas in the industry so you can target them – NOW.
• It contains in-depth analysis of regional and national sales and growth.
• It highlights for you the key successful trends, changes and revenue projections made by your competitors.
This report tells you TODAY how the Asia-Pacific business process outsourcing (BPO) market will develop in the next 10 years, and in line with the variations in COVID-19 economic recession and bounce. This market is more critical now than at any point over the last 10 years.
Forecasts to 2033 and other analyses reveal commercial prospects
• In addition to revenue forecasting to 2033, our new study provides you with recent results, growth rates, and market shares.
• You will find original analyses, with business outlooks and developments.
• Discover qualitative analyses (including market dynamics, drivers, opportunities, restraints and challenges), cost structure, impact of rising Asia-Pacific business process outsourcing (BPO) prices and recent developments.
This report includes data analysis and invaluable insight into how COVID-19 will affect the industry and your company. Four COVID-19 recovery patterns and their impact, namely, “V”, “L”, “W” and “U” are discussed in this report.
Segments Covered in the Report
Market Segment by Type
• Nearshore
• Offsource
• Onshore
Market Segment by Service
• Voice Processing
• Telemarketing Services
• Visualization Services
• Other Services
Market Segment by Application
• Customer Care & Demonstrations
• Sales & Marketing
• Finance & Accounting
• Human Resource & Development
• Other Application
Market Segment by End-User
• IT & Telecom
• BFSI
• Healthcare Sector
• Manufacturing Sector
• Retail & E-Commerce
• Other End-User
Market Segment by Region
• Southern Asia
• South-Eastern Asia
• Eastern Asia
• Western Asia
• Central Asia
In addition to the revenue predictions for the overall Asia-Pacific market and segments, you will also find revenue forecasts for four regional and 20 leading national markets:
Southern Asia
• India
• Rest of Southern Asia
South-Eastern Asia
• Indonesia
• Singapore
• Malaysia
• Philippines
• Thailand
• Rest of South-Eastern Asia
Eastern Asia
• China
• Hong Kong
• Japan
• South Korea
• Taiwan
• Rest of Eastern Asia
Western Asia
• Turkey
• United Arab Emirates
• Rest of Western Asia
Central Asia
• Uzbekistan
• Kazakhstan
• Rest of Central Asia
The report also includes profiles and for some of the leading companies in the Asia-Pacific Business Process Outsourcing (BPO) Market, 2023 to 2033, with a focus on this segment of these companies’ operations.
Leading companies and the potential for market growth
• Accenture Plc
• ADP Inc.
• Amdocs
• Capgemini SE
• CBRE Group, Inc.
• Cognizant
• Concentrix Corporation
• HCL Technologies Limited
• IBM Corporation
• Infosys Limited
Overall revenue for Asia-Pacific Business Process Outsourcing (BPO) Market, 2023 to 2033 in terms of value the market will surpass US$72.38 billion in 2023, our work calculates. We predict strong revenue growth through to 2033. Our work identifies which organizations hold the greatest potential. Discover their capabilities, progress, and commercial prospects, helping you stay ahead.
How will the Asia-Pacific Business Process Outsourcing (BPO) Market, 2023 to 2033 report help you?
In summary, our 300+ page report provides you with the following knowledge:
• Revenue forecasts to 2033 for Asia-Pacific Business Process Outsourcing (BPO) Market, 2023 to 2033 Market, with forecasts for type, service, application, End-user, and company size, each forecast at a regional level – discover the industry’s prospects, finding the most lucrative places for investments and revenues.
• Revenue forecasts to 2033 for four regional and 20 key national markets – See forecasts for the Asia-Pacific Business Process Outsourcing (BPO) Market, 2023 to 2033 market in Southern Asia, South-Eastern Asia, Eastern Asia, Western Asia, Central Asia. Also forecasted is the market in India, Indonesia, Singapore, Malaysia, Philippines, Thailand, China, Hong Kong, Japan, South Korea, and Taiwan among other prominent economies.
• Prospects for established firms and those seeking to enter the market – including company profiles for 10 of the major companies involved in the Asia-Pacific Business Process Outsourcing (BPO) Market, 2023 to 2033.
Find quantitative and qualitative analyses with independent predictions. Receive information that only our report contains, staying informed with invaluable business intelligence.
Information found nowhere else
With our new report, you are less likely to fall behind in knowledge or miss out on opportunities. See how our work could benefit your research, analyses, and decisions. Visiongain’s study is for everybody needing commercial analyses for the Asia-Pacific Business Process Outsourcing (BPO) Market, 2023 to 2033, market-leading companies. You will find data, trends and predictions.
ページTOPに戻る
Table of Contents
Table of Contents
1. Report Overview
1.1 Objectives of the Study
1.2 Introduction to Asia-Pacific Business Process Outsourcing (BPO) Market
1.3 What This Report Delivers
1.4 Why You Should Read This Report
1.5 Key Questions Answered by This Analytical Report
1.6 Who is This Report for?
1.7 Research Methodology
1.7.1 Market Definitions
1.7.2 Market Evaluation & Forecasting Methodology
1.7.3 Data Validation
1.8 Frequently Asked Questions (FAQs)
1.9 Associated Visiongain Reports
1.10 About Visiongain
2 Executive Summary
2.1 Premium Insights
2.1.1 Regional Analysis
2.1.2 Type Segment Analysis
2.1.3 Services Segment Analysis
2.1.4 Application Segment Analysis
2.1.5 End-User Segment Analysis
3 Market Overview
3.1 Key Findings
3.2 Market Dynamics
3.2.1 Market Driving Factors
3.2.2 Market Restraining Factors
3.2.3 Market Opportunities
3.3 Supply Chain Overview
3.4 Value Chain Overview
3.5 COVID-19 Impact Analysis
3.6 Porter’s Five Forces Analysis
3.6.1 Threat of New Entrants (High)
3.6.2 Threat of Substitutes (Moderate)
3.6.3 Bargaining Power of Buyers (Moderate)
3.6.4 Bargaining Power of Suppliers (Low)
3.6.5 Competitive Rivalry (High)
3.7 PESTLE Analysis
3.7.1 Political Factors
3.7.2 Economic Factors
3.7.3 Social Factors
3.7.4 Technological Factors
3.7.5 Environmental Elements
3.7.6 Legal Aspects
4 Asia-Pacific Business Process Outsourcing (BPO) Market Analysis by Type
4.1 Key Findings
4.1.1 Type Segment: Market Attractiveness Index
4.1.2 Asia-Pacific Business Process Outsourcing (BPO) Market Share by Type, 2023 & 2033
4.1.3 Asia-Pacific Business Process Outsourcing (BPO) Market by Type
4.2 Nearshore Segment
4.2.1 Nearshore Market Forecast
4.2.2 Nearshore Market by Region
4.3 Offshore Segment
4.3.1 Offshore Market Forecast
4.3.2 Offshore Market by Region
4.4 Onshore Segment
4.4.1 Onshore Market Forecast
4.4.2 Onshore Market by Region
5 Asia-Pacific Business Process Outsourcing (BPO) Market Analysis by Service
5.1 Key Findings
5.1.1 Service Segment: Market Attractiveness Index
5.1.2 Asia-Pacific Business Process Outsourcing (BPO) Market Share by Service, 2023 & 2033
5.1.3 Asia-Pacific Business Process Outsourcing (BPO) Market by Service
5.2 Voice Processing Segment
5.2.2 Voice Processing Market Forecast
5.2.3 Voice Processing Market Forecast by Region
5.3 Telemarketing Services Segment
5.3.1 Telemarketing Services Market Forecast
5.3.2 Telemarketing Services Market Forecast by Region
5.4 Visualization Services Segment
5.4.1 Visualization Services Market Forecast
5.4.2 Visualization Services Market Forecast by Region
5.5 Other Services Segment
5.5.1 Other Services Market Forecast
5.5.2 Other Services Market Forecast by Region
6 Asia-Pacific Business Process Outsourcing (BPO) Market Analysis by Application
6.1 Key Findings
6.1.1 Application Segment: Market Attractiveness Index
6.1.2 Asia-Pacific Business Process Outsourcing (BPO) Market Share by Application, 2023 & 2033
6.1.3 Asia-Pacific Business Process Outsourcing (BPO) Market by Application
6.2 Customer Care & Demonstrations Segment
6.2.1 Customer Care & Demonstrations Market Forecast
6.2.2 Customer Care & Demonstrations Market Forecast by Region
6.3 Sales Marketing Segment
6.3.1 Sales Marketing Market Forecast
6.3.2 Sales Marketing Market Forecast by Region
6.4 Finance & Accounting Segment
6.4.1 Finance & Accounting Market Forecast
6.4.2 Finance & Accounting Market Forecast by Region
6.5 Human Resource Development Segment
6.5.1 Human Resource Development Market Forecast
6.5.2 Human Resource Development Market Forecast by Region
6.6 Other Applications Segment
6.6.1 Other Application Market Forecast
6.6.2 Other Application Market Forecast by Region
7 Asia-Pacific Business Process Outsourcing (BPO) Market Analysis by End-User
7.1 Key Findings
7.1.1 End-User Segment: Market Attractiveness Index
7.1.2 Asia-Pacific Business Process Outsourcing (BPO) Market Share by End-User, 2023 & 2033
7.1.3 Asia-Pacific Business Process Outsourcing (BPO) Market by End-User
7.2 IT & Telecom Segment
7.2.1 IT & Telecom Market Forecast
7.2.2 IT & Telecom Market Forecast by Region
7.3 BFSI Segment
7.3.1 BFSI Market Forecast
7.3.2 BFSI Market Forecast by Region
7.4 Healthcare Sector Segment
7.4.1 Healthcare Sector Market Forecast
7.4.2 Healthcare Sector Market Forecast by Region
7.5 Manufacturing Sector Segment
7.5.1 Manufacturing Sector Market Forecast
7.5.2 Manufacturing Sector Market Forecast by Region
7.6 Retail and E-Commerce
7.6.1 Retail and E- Commerce Market Forecast
7.6.2 Retail and E- Commerce Market Forecast by Region
7.7 Other End-User Segment
7.7.1 Other End-User Market Forecast
7.7.2 Other End-User Market Forecast by Region
8 Asia-Pacific Business Process Outsourcing (BPO) Market Analysis by Region
8.1 Key Findings
8.1.1 Asia-Pacific Business Process Outsourcing (BPO) Market by Region Market Attractiveness Index
8.1.2 Asia-Pacific Business Process Outsourcing (BPO) Market Share by Region, 2023 & 2033
8.2 Asia-Pacific Business Process Outsourcing (BPO) Market Forecast
8.3 Asia-Pacific Business Process Outsourcing (BPO) Market Forecast by Region
8.4 Asia-Pacific Business Process Outsourcing (BPO) Market Forecast by Type
8.5 Asia-Pacific Business Process Outsourcing (BPO) Market Forecast by Services
8.6 Asia-Pacific Business Process Outsourcing (BPO) Market Forecast by Application
8.7 Asia-Pacific Business Process Outsourcing (BPO) Market Forecast by End-User
9 Southern Asia-Pacific Business Process Outsourcing (BPO) Market Analysis
9.1 Key Findings
9.1.1 Southern Asia-Pacific Business Process Outsourcing (BPO) Market Attractiveness Index
9.1.2 Southern Asia-Pacific Business Process Outsourcing (BPO) Market by Value Size Estimation and Forecast
9.2 Southern Asia-Pacific Business Process Outsourcing (BPO) Market by Country Size Estimation and Forecast
9.3 Southern Asia-Pacific Business Process Outsourcing (BPO) Market by Type Size Estimation and Forecast
9.4 Southern Asia-Pacific Business Process Outsourcing (BPO) Market by Service Size Estimation and Forecast
9.5 Southern Asia-Pacific Business Process Outsourcing (BPO) Market by Application Size Estimation and Forecast
9.6 Southern Asia-Pacific Business Process Outsourcing (BPO) Market by End-User Size Estimation and Forecast
9.7 India Market Forecast
9.7.1 Key Players in the Country
9.8 Rest of Southern Asia Market Forecast
10 Southern-Eastern Asia-Pacific Business Process Outsourcing (BPO) Market Analysis
10.1 Key Findings
10.1.1 Southern-Eastern Asia-Pacific Business Process Outsourcing (BPO) Market Attractiveness Index
10.1.2 Southern-Eastern Asia-Pacific Business Process Outsourcing (BPO) Market by Value
10.1.3 Southern-Eastern Asia-Pacific Business Process Outsourcing (BPO) Market by Country
10.2 Southern-Eastern Asia-Pacific Business Process Outsourcing (BPO) Market by Type Size Estimation and Forecast
10.3 Southern-Eastern Asia-Pacific Business Process Outsourcing (BPO) Market by Service Size Estimation and Forecast
10.4 Southern-Eastern Asia-Pacific Business Process Outsourcing (BPO) Market by Application Size Estimation and Forecast
10.5 Southern-Eastern Asia-Pacific Business Process Outsourcing (BPO) Market by End-User Size Estimation and Forecast
10.6 Indonesia Market Forecast
10.6.1 Key Players in the Country
10.7 Philippines Market Forecast
10.7.1 Key Players in the Country
10.8 Thailand Market Forecast
10.8.1 Key Players in the Country
10.9 Malaysia Market Forecast
10.9.1 Key Players in the Country
10.10 Singapore Market Forecast
10.10.1 Key Players in the Country
10.11 Rest of Southern-Eastern Asia Market Forecast
11 Eastern Asia-Pacific Business Process Outsourcing (BPO) Market Analysis
11.1 Key Findings
11.1.1 Eastern Asia-Pacific Business Process Outsourcing (BPO) Market Attractiveness Index
11.1.2 Eastern Asia-Pacific Business Process Outsourcing (BPO) Market by Value
11.1.3 Eastern Asia-Pacific Business Process Outsourcing (BPO) Market by Country
11.2 Eastern Asia-Pacific Business Process Outsourcing (BPO) Market by Type
11.3 Eastern Asia-Pacific Business Process Outsourcing (BPO) Market by Service
11.4 Eastern Asia-Pacific Business Process Outsourcing (BPO) Market by Application Size Estimation and Forecast
11.5 Eastern Asia-Pacific Business Process Outsourcing (BPO) Market by End-User Size Estimation and Forecast
11.6 China Market Forecast
11.6.1 Few Key Players in the Country
11.7 Japan Market Forecast
11.7.1 Key Player in the Country
11.8 South Korea Market Forecast
11.8.1 Key Players in the Country
11.9 Australia Market Forecast
11.9.1 Key Players in the Country
11.10 Hong Kong Market Forecast
11.10.1 Key Players in the Country
11.11 Rest of Eastern Asia-Pacific Market Forecast
12 Western Asia-Pacific Business Process Outsourcing (BPO) Market Analysis
12.1 Key Findings
12.1.1 Western Asia-Pacific Business Process Outsourcing (BPO) Market Attractiveness Index
12.1.2 Western Asia-Pacific Business Process Outsourcing (BPO) Market by Value
12.1.3 Western Asia-Pacific Business Process Outsourcing (BPO) Market by Country
12.2 Western Asia-Pacific Business Process Outsourcing (BPO) Market by Type
12.3 Western Asia-Pacific Business Process Outsourcing (BPO) Market by Service Size Estimation and Forecast
12.4 Western Asia-Pacific Business Process Outsourcing (BPO) Market by Application
12.5 Western Asia-Pacific Business Process Outsourcing (BPO) Market by End-User Size Estimation and Forecast
12.6 Turkey Market Forecast
12.7 United Arab Emirates Market Forecast
12.8 Rest of Western Asia Market Forecast
13 Central Asia-Pacific Business Process Outsourcing (BPO) Market Analysis
13.1 Key Findings
13.1.1 Central Asia-Pacific Business Process Outsourcing (BPO) Market Attractiveness Index
13.1.2 Central Asia-Pacific Business Process Outsourcing (BPO) Market by Value
13.2 Central Asia-Pacific Business Process Outsourcing (BPO) Market by Country
13.3 Central Asia-Pacific Business Process Outsourcing (BPO) Market by Type
13.4 Central Asia-Pacific Business Process Outsourcing (BPO) Market by Service
13.5 Central Asia-Pacific Business Process Outsourcing (BPO) Market by Application
13.6 Central Asia-Pacific Business Process Outsourcing (BPO) Market by End-User Size Estimation and Forecast
13.7 Uzbekistan Market Forecast
13.8 Kazakhstan Market Forecast
13.9 Rest of Central Asia Market Forecast
14 Competitive Landscape
14.1 Key Business Strategy Analysis- Acquisition
14.2 Key Business Strategy Analysis- Agreement
14.3 Key Business Strategy Analysis- Investment
14.4 Key Business Strategy Analysis- New Product Launch
14.5 Key Business Strategy Analysis- Partnership
15 Company Profiles
15.1 Accenture Plc
15.1.1 Company Snapshot
15.1.2 Company Overview
15.1.3 Financial Analysis
15.1.4 Product Benchmarking
15.1.5 Strategic Outlook
15.2 IBM Corporation
15.2.1 Company Snapshot
15.2.2 Company Overview
15.2.3 Financial Analysis
15.2.4 Product Benchmarking
15.2.5 Strategic Outlook
15.3 Cognizant
15.3.1 Company Snapshot
15.3.2 Company Overview
15.3.3 Financial Analysis
15.3.4 Product Benchmarking
15.3.5 Strategic Outlook
15.4 Capgemini SE
15.4.1 Company Snapshot
15.4.2 Company Overview
15.4.3 Financial Analysis
15.4.4 Product Benchmarking
15.4.5 Strategic Outlook
15.5 Infosys Limited
15.5.1 Company Snapshot
15.5.2 Company Overview
15.5.3 Financial Analysis
15.5.4 Product Benchmarking
15.5.5 Strategic Outlook
15.6 ADP Inc.
15.6.1 Company Snapshot
15.6.2 Company Overview
15.6.3 Financial Analysis
15.6.4 Product Benchmarking
15.7 Amdocs
15.7.1 Company Snapshot
15.7.2 Company Overview
15.7.3 Financial Analysis
15.7.4 Product Benchmarking
15.7.5 Strategic Outlook
15.8 CBRE Group, Inc
15.8.1 Company Snapshot
15.8.2 Company Overview
15.8.3 Financial Analysis
15.8.4 Product Benchmarking
15.8.5 Strategic Outlook
15.9 Concentrix Corporation
15.9.1 Company Snapshot
15.9.2 Company Overview
15.9.3 Financial Analysis
15.9.4 Product Benchmarking
15.9.5 Strategic Outlook
15.10 HCL Technologies Limited
15.10.1 Company Snapshot
15.10.2 Company Overview
15.10.3 Financial Analysis
15.10.4 Product Benchmarking
15.10.5 Strategic Outlook
16 Conclusion and Recommendations
16.1 Concluding Remarks from Visiongain
16.2 Recommendations for Market Players
16.2.1 Engage Executives in the Process
16.2.2 Identify the Growth Objectives In Advance
16.2.3 Never Undervalue IT Abilities
16.2.4 Take Time with BPO Strategy Implementation
List of Tables
Table 1 Asia-Pacific Business Process Outsourcing (BPO) Market Snapshot, 2023 & 2033 (US$ billion, CAGR %)
Table 2 Asia-Pacific Business Process Outsourcing (BPO) Market Forecast, 2023-2033 (US$ Bn, AGR (%), CAGR (%)) (V-Shaped Recovery Scenario)
Table 3 Asia-Pacific Business Process Outsourcing (BPO) Market by Region, 2023-2033 (US$ Bn, AGR (%), CAGR (%)) (V-Shaped Recovery Scenario)
Table 4 Asia-Pacific Business Process Outsourcing (BPO) Market Forecast, 2023-2033 (US$ Bn, AGR (%), CAGR (%)) (W-Shaped Recovery Scenario)
Table 5 Asia-Pacific Business Process Outsourcing (BPO) Market by Region, 2023-2033 (US$ Bn, AGR (%), CAGR (%)) (W-Shaped Recovery Scenario)
Table 6 Asia-Pacific Business Process Outsourcing (BPO) Market Forecast, 2023-2033 (US$ Bn, AGR (%), CAGR (%)) (U-Shaped Recovery Scenario)
Table 7 Asia-Pacific Business Process Outsourcing (BPO) Market by Region, 2023-2033 (US$ Bn, AGR (%), CAGR (%)) (U-Shaped Recovery Scenario)
Table 8 Asia-Pacific Business Process Outsourcing (BPO) Market Forecast, 2023-2033 (US$ Bn, AGR (%), CAGR (%)) (L-Shaped Recovery Scenario)
Table 9 Asia-Pacific Business Process Outsourcing (BPO) Market by Region, 2023-2033 (US$ Bn, AGR (%), CAGR (%)) (L-Shaped Recovery Scenario)
Table 10 Asia-Pacific Business Process Outsourcing (BPO) Market by Type, 2023-2033 (US$ Bn, AGR (%), CAGR (%))
Table 11 Asia-Pacific Nearshore Market Forecast, 2023-2033 (US$ Bn, AGR (%), CAGR (%))
Table 12 Asia-Pacific Nearshore Market by Region, 2023-2033 (US$ Bn, AGR (%), CAGR (%))
Table 13 Asia-Pacific Off-source Market Forecast, 2023-2033 (US$ Bn, AGR (%), CAGR (%))
Table 14 Asia-Pacific Off-source Market by Region, 2023-2033 (US$ Bn, AGR (%), CAGR (%))
Table 15 Asia-Pacific Onshore Market Forecast, 2023-2033 (US$ Bn, AGR (%), CAGR (%))
Table 16 Asia-Pacific Onshore Market by Region, 2023-2033 (US$ Bn, AGR (%), CAGR (%))
Table 17 Asia-Pacific Business Process Outsourcing (BPO) Market by Service, 2023-2033 (US$ Bn, AGR (%), CAGR (%))
Table 18 Asia-Pacific Voice Processing Market Forecast, 2023-2033 (US$ Bn, AGR (%), CAGR (%))
Table 19 Asia-Pacific Voice Processing Market by Region, 2023-2033 (US$ Bn, AGR (%), CAGR (%))
Table 20 Asia-Pacific Telemarketing Services Market Forecast, 2023-2033 (US$ Bn, AGR (%), CAGR (%))
Table 21 Asia-Pacific Telemarketing Services Market by Region, 2023-2033 (US$ Bn, AGR (%), CAGR (%))
Table 22 Asia-Pacific Visualization Services Market Forecast, 2023-2033 (US$ Bn, AGR (%), CAGR (%))
Table 23 Asia-Pacific Visualization Services Market by Region, 2023-2033 (US$ Bn, AGR (%), CAGR (%))
Table 24 Asia-Pacific Other Services Market Forecast, 2023-2033 (US$ Bn, AGR (%), CAGR (%))
Table 25 Asia-Pacific Other Services Market by Region, 2023-2033 (US$ Bn, AGR (%), CAGR (%))
Table 26 Asia-Pacific Business Process Outsourcing (BPO) Market by Application, 2023-2033 (US$ Bn, AGR (%), CAGR (%))
Table 27 Asia-Pacific Customer Care & Demonstrations Market Forecast, 2023-2033 (US$ Bn, AGR (%), CAGR (%))
Table 28 Asia-Pacific Customer Care & Demonstrations Market by Region, 2023-2033 (US$ Bn, AGR (%), CAGR (%))
Table 29 Asia-Pacific Sales & Marketing Market Forecast, 2023-2033 (US$ Bn, AGR (%), CAGR (%))
Table 30 Asia-Pacific Sales & Marketing Market by Region, 2023-2033 (US$ Bn, AGR (%), CAGR (%))
Table 31 Asia-Pacific Finance & Accounting Market Forecast, 2023-2033 (US$ Bn, AGR (%), CAGR (%))
Table 32 Asia-Pacific Finance & Accounting Market by Region, 2023-2033 (US$ Bn, AGR (%), CAGR (%))
Table 33 Asia-Pacific Human Resource & Development Market Forecast, 2023-2033 (US$ Bn, AGR (%), CAGR (%))
Table 34 Asia-Pacific Human Resource & Development Market by Region, 2023-2033 (US$ Bn, AGR (%), CAGR (%))
Table 35 Asia-Pacific Other Application Market Forecast, 2023-2033 (US$ Bn, AGR (%), CAGR (%))
Table 36 Asia-Pacific Other Application Market by Region, 2023-2033 (US$ Bn, AGR (%), CAGR (%))
Table 37 Asia-Pacific Business Process Outsourcing (BPO) Market by End-User, 2023-2033 (US$ Bn, AGR (%), CAGR (%))
Table 38 Asia-Pacific IT & Telecom Market Forecast, 2023-2033 (US$ Bn, AGR (%), CAGR (%))
Table 39 Asia-Pacific IT & Telecom Market by Region, 2023-2033 (US$ Bn, AGR (%), CAGR (%))
Table 40 Asia-Pacific BFSI Market Forecast, 2023-2033 (US$ Bn, AGR (%), CAGR (%))
Table 41 Asia-Pacific BFSI Market by Region, 2023-2033 (US$ Bn, AGR (%), CAGR (%))
Table 42 Asia-Pacific Healthcare Sector Market Forecast, 2023-2033 (US$ Bn, AGR (%), CAGR (%))
Table 43 Asia-Pacific Healthcare Sector Market by Region, 2023-2033 (US$ Bn, AGR (%), CAGR (%))
Table 44 Asia-Pacific Manufacturing Sector Market Forecast, 2023-2033 (US$ Bn, AGR (%), CAGR (%))
Table 45 Asia-Pacific Manufacturing Sector Market by Region, 2023-2033 (US$ Bn, AGR (%), CAGR (%))
Table 46 Asia-Pacific Retail & E-Commerce Market Forecast, 2023-2033 (US$ Bn, AGR (%), CAGR (%))
Table 47 Asia-Pacific Retail & E-Commerce Market by Region, 2023-2033 (US$ Bn, AGR (%), CAGR (%))
Table 48 Asia-Pacific Other End-User Market Forecast, 2023-2033 (US$ Bn, AGR (%), CAGR (%))
Table 49 Asia-Pacific Other End-User Market by Region, 2023-2033 (US$ Bn, AGR (%), CAGR (%))
Table 50 Asia-Pacific Business Process Outsourcing (BPO) Market Forecast, 2023-2033 (US$ Bn, AGR (%), CAGR (%))
Table 51 Asia-Pacific Business Process Outsourcing (BPO) Market by Region, 2023-2033 (US$ Bn, AGR (%), CAGR (%))
Table 52 Asia-Pacific Business Process Outsourcing (BPO) Market by Type, 2023-2033 (US$ Bn, AGR (%), CAGR (%))
Table 53 Asia-Pacific Business Process Outsourcing (BPO) Market by Service, 2023-2033 (US$ Bn, AGR (%), CAGR (%))
Table 54 Asia-Pacific Business Process Outsourcing (BPO) Market by Application, 2023-2033 (US$ Bn, AGR (%), CAGR (%))
Table 55 Asia-Pacific Business Process Outsourcing (BPO) Market by End-User, 2023-2033 (US$ Bn, AGR (%), CAGR (%))
Table 56 Southern Asia Business Process Outsourcing (BPO) Market by Value, 2023-2033 (US$ Bn, AGR (%), CAGR (%))
Table 57 Southern Asia Business Process Outsourcing (BPO) Market by Country, 2023-2033 (US$ Bn, AGR (%), CAGR (%))
Table 58 Southern Asia Business Process Outsourcing (BPO) Market by Type, 2023-2033 (US$ Bn, AGR (%), CAGR (%))
Table 59 Southern Asia Business Process Outsourcing (BPO) Market by Service, 2023-2033 (US$ Bn, AGR (%), CAGR (%))
Table 60 Southern Asia Business Process Outsourcing (BPO) Market by Application, 2023-2033 (US$ Bn, AGR (%), CAGR (%))
Table 61 Southern Asia Business Process Outsourcing (BPO) Market by End-User, 2023-2033 (US$ Bn, AGR (%), CAGR (%))
Table 62 India Business Process Outsourcing (BPO) Market by Value, 2023-2033 (US$ Bn, AGR (%), CAGR (%))
Table 63 Rest of Southern Asia Business Process Outsourcing (BPO) Market by Value, 2023-2033 (US$ Bn, AGR (%), CAGR (%))
Table 64 South-Eastern Asia Business Process Outsourcing (BPO) Market by Value, 2023-2033 (US$ Bn, AGR (%), CAGR (%))
Table 65 South-Eastern Asia Business Process Outsourcing (BPO) Market by Country, 2023-2033 (US$ Bn, AGR (%), CAGR (%))
Table 66 South-Eastern Asia Business Process Outsourcing (BPO) Market by Type, 2023-2033 (US$ Bn, AGR (%), CAGR (%))
Table 67 South-Eastern Asia Business Process Outsourcing (BPO) Market by Service, 2023-2033 (US$ Bn, AGR (%), CAGR (%))
Table 68 South-Eastern Asia Business Process Outsourcing (BPO) Market by Application, 2023-2033 (US$ Bn, AGR (%), CAGR (%))
Table 69 South-Eastern Asia Business Process Outsourcing (BPO) Market by End-User, 2023-2033 (US$ Bn, AGR (%), CAGR (%))
Table 70 Indonesia Business Process Outsourcing (BPO) Market by Value, 2023-2033 (US$ Bn, AGR (%), CAGR (%))
Table 71 Philippines Business Process Outsourcing (BPO) Market by Value, 2023-2033 (US$ Bn, AGR (%), CAGR (%))
Table 72 Thailand Business Process Outsourcing (BPO) Market by Value, 2023-2033 (US$ Bn, AGR (%), CAGR (%))
Table 73 Malaysia Business Process Outsourcing (BPO) Market by Value, 2023-2033 (US$ Bn, AGR (%), CAGR (%))
Table 74 Singapore Business Process Outsourcing (BPO) Market by Value, 2023-2033 (US$ Bn, AGR (%), CAGR (%))
Table 75 Rest of South-Eastern Asia Business Process Outsourcing (BPO) Market by Value, 2023-2033 (US$ Bn, AGR (%), CAGR (%))
Table 76 Eastern Asia Business Process Outsourcing (BPO) Market by Country, 2023-2033 (US$ Bn, AGR (%), CAGR (%))
Table 77 Eastern Asia Business Process Outsourcing (BPO) Market by Type, 2023-2033 (US$ Bn, AGR (%), CAGR (%))
Table 78 Eastern Asia Business Process Outsourcing (BPO) Market by Service, 2023-2033 (US$ Bn, AGR (%), CAGR (%))
Table 79 Eastern Asia Business Process Outsourcing (BPO) Market by Application, 2023-2033 (US$ Bn, AGR (%), CAGR (%))
Table 80 Eastern Asia Business Process Outsourcing (BPO) Market by End-User, 2023-2033 (US$ Bn, AGR (%), CAGR (%))
Table 81 China Business Process Outsourcing (BPO) Market by Value, 2023-2033 (US$ Bn, AGR (%), CAGR (%))
Table 82 Japan Business Process Outsourcing (BPO) Market by Value, 2023-2033 (US$ Bn, AGR (%), CAGR (%))
Table 83 South Korea Business Process Outsourcing (BPO) Market by Value, 2023-2033 (US$ Bn, AGR (%), CAGR (%))
Table 84 Australia Business Process Outsourcing (BPO) Market by Value, 2023-2033 (US$ Bn, AGR (%), CAGR (%))
Table 85 Hong Kong Business Process Outsourcing (BPO) Market by Value, 2023-2033 (US$ Bn, AGR (%), CAGR (%))
Table 86 Rest of Eastern Asia Business Process Outsourcing (BPO) Market by Value, 2023-2033 (US$ Bn, AGR (%), CAGR (%))
Table 87 Western Asia Business Process Outsourcing (BPO) Market by Value, 2023-2033 (US$ Bn, AGR (%), CAGR (%))
Table 88 Western Asia Business Process Outsourcing (BPO) Market by Country, 2023-2033 (US$ Bn, AGR (%), CAGR (%))
Table 89 Western Asia Business Process Outsourcing (BPO) Market by Type, 2023-2033 (US$ Bn, AGR (%), CAGR (%))
Table 90 Western Asia Business Process Outsourcing (BPO) Market by Service, 2023-2033 (US$ Bn, AGR (%), CAGR (%))
Table 91 Western Asia Business Process Outsourcing (BPO) Market by Application, 2023-2033 (US$ Bn, AGR (%), CAGR (%))
Table 92 Western Asia Business Process Outsourcing (BPO) Market by End-User, 2023-2033 (US$ Bn, AGR (%), CAGR (%))
Table 93 Turkey Business Process Outsourcing (BPO) Market by Value, 2023-2033 (US$ Bn, AGR (%), CAGR (%))
Table 94 United Arab Emirates Business Process Outsourcing (BPO) Market by Value, 2023-2033 (US$ Bn, AGR (%), CAGR (%))
Table 95 Rest of Western Asia Business Process Outsourcing (BPO) Market by Value, 2023-2033 (US$ Bn, AGR (%), CAGR (%))
Table 96 Central Asia Business Process Outsourcing (BPO) Market by Value, 2023-2033 (US$ Bn, AGR (%), CAGR (%))
Table 97 Central Asia Business Process Outsourcing (BPO) Market by Country, 2023-2033 (US$ Bn, AGR (%), CAGR (%))
Table 98 Central Asia Business Process Outsourcing (BPO) Market by Type, 2023-2033 (US$ Bn, AGR (%), CAGR (%))
Table 99 Central Asia Business Process Outsourcing (BPO) Market by Service, 2023-2033 (US$ Bn, AGR (%), CAGR (%))
Table 100 Central Asia Business Process Outsourcing (BPO) Market by Application, 2023-2033 (US$ Bn, AGR (%), CAGR (%))
Table 101 Central Asia Business Process Outsourcing (BPO) Market by End-User, 2023-2033 (US$ Bn, AGR (%), CAGR (%))
Table 102 Uzbekistan Business Process Outsourcing (BPO) Market by Value, 2023-2033 (US$ Bn, AGR (%), CAGR (%))
Table 103 Kazakhstan Business Process Outsourcing (BPO) Market by Value, 2023-2033 (US$ Bn, AGR (%), CAGR (%))
Table 104 Rest of Central Asia Business Process Outsourcing (BPO) Market by Value, 2023-2033 (US$ Bn, AGR (%), CAGR (%))
Table 105 Key Business Strategies Adopted by Key Players in Asia-Pacific Business Process Outsourcing (BPO) Market
Table 106 Key Business Strategies Adopted by Key Players in Asia-Pacific Business Process Outsourcing (BPO) Market
Table 107 Key Business Strategies Adopted by Key Players in Asia-Pacific Business Process Outsourcing (BPO) Market
Table 108 Key Business Strategies Adopted by Key Players in Asia-Pacific Business Process Outsourcing (BPO) Market
Table 109 Key Business Strategies Adopted by Key Players in Asia-Pacific Business Process Outsourcing (BPO) Market
Table 110 Accenture Plc: Key Details, (CEO, HQ, Revenue, Founded, No. of Employees, Company Type, Website, Business Segment)
Table 111 Accenture Plc: Product Benchmarking
Table 112 Accenture Plc: Strategic Outlook
Table 113 IBM Corporation: Key Details, (CEO, HQ, Revenue, Founded, No. of Employees, Company Type, Website, Business Segment)
Table 114 IBM Corporation: Product Benchmarking
Table 115 IBM Corporation: Strategic Outlook
Table 116 Cognizant: Key Details, (CEO, HQ, Revenue, Founded, No. of Employees, Company Type, Website, Business Segment)
Table 117 Cognizant: Product Benchmarking
Table 118 Cognizant: Strategic Outlook
Table 119 Capgemini SE: Key Details, (CEO, HQ, Revenue, Founded, No. of Employees, Company Type, Website, Business Segment)
Table 120 Capgemini SE: Product Benchmarking
Table 121 Capgemini SE: Strategic Outlook
Table 122 Infosys Limited: Key Details, (CEO, HQ, Revenue, Founded, No. of Employees, Company Type, Website, Business Segment)
Table 123 Infosys Limited: Product Benchmarking
Table 124 Infosys Limited: Strategic Outlook
Table 125 ADP, Inc: Key Details, (CEO, HQ, Revenue, Founded, No. of Employees, Company Type, Website, Business Segment)
Table 126 ADP, Inc: Product Benchmarking
Table 127 Amdocs: Key Details, (CEO, HQ, Revenue, Founded, No. of Employees, Company Type, Website, Business Segment)
Table 128 Amdocs: Product Benchmarking
Table 129 Amdocs: Strategic Outlook
Table 130 CBRE Group, Inc: Key Details, (CEO, HQ, Revenue, Founded, No. of Employees, Company Type, Website, Business Segment)
Table 131 CBRE Group, Inc: Product Benchmarking
Table 132 CBRE Group, Inc: Strategic Outlook
Table 133 Concentrix Corporation: Key Details, (CEO, HQ, Revenue, Founded, No. of Employees, Company Type, Website, Business Segment)
Table 134 Concentrix Corporation: Product Benchmarking
Table 135 Concentrix Corporation: Strategic Outlook
Table 136 HCL Technologies Limited: Key Details, (CEO, HQ, Revenue, Founded, No. of Employees, Company Type, Website, Business Segment)
Table 137 HCL Technologies Limited: Product Benchmarking
Table 138 HCL Technologies Limited: Strategic Outlook
List of Figures
Figure 1 Asia-Pacific Business Process Outsourcing (BPO) Market Segmentation
Figure 2 Asia-Pacific Business Process Outsourcing (BPO) Market by Region: Market Attractiveness Index
Figure 3 Asia-Pacific Business Process Outsourcing (BPO) Market by Type: Market Attractiveness Index
Figure 4 Asia-Pacific Business Process Outsourcing (BPO) Market by Services: Market Attractiveness Index
Figure 5 Asia-Pacific Business Process Outsourcing (BPO) Market by Application: Market Attractiveness Index
Figure 6 Asia-Pacific Business Process Outsourcing (BPO) Market by End-User: Market Attractiveness Index
Figure 7 Asia-Pacific Business Process Outsourcing (BPO) Market: Market Dynamics
Figure 8 COVID Impact Analysis: Asia-Pacific Business Process Outsourcing (BPO) Market Recovery Scenarios 2023-2033 (US$ Bn, CAGR (%))
Figure 9 Asia-Pacific Business Process Outsourcing (BPO) Market Forecast, 2023-2033 (US$ Bn, AGR (%)) (V-Shaped Recovery Scenario)
Figure 10 Asia-Pacific Business Process Outsourcing (BPO) Market by Region, 2023-2033 (US$ Bn, AGR (%)) (V-Shaped Recovery Scenario)
Figure 11 Asia-Pacific Business Process Outsourcing (BPO) Market Forecast, 2023-2033 (US$ Bn, AGR (%)) (W-Shaped Recovery Scenario)
Figure 12 Asia-Pacific Business Process Outsourcing (BPO) Market by Region, 2023-2033 (US$ Bn, AGR (%)) (W-Shaped Recovery Scenario)
Figure 13 Asia-Pacific Business Process Outsourcing (BPO) Market Forecast, 2023-2033 (US$ Bn, AGR (%)) (U-Shaped Recovery Scenario)
Figure 14 Asia-Pacific Business Process Outsourcing (BPO) Market by Region, 2023-2033 (US$ Bn, AGR (%)) (U-Shaped Recovery Scenario)
Figure 15 Asia-Pacific Business Process Outsourcing (BPO) Market Forecast, 2023-2033 (US$ Bn, AGR (%)) (L-Shaped Recovery Scenario)
Figure 16 Asia-Pacific Business Process Outsourcing (BPO) Market by Region, 2023-2033 (US$ Bn, AGR (%)) (L-Shaped Recovery Scenario)
Figure 17 Asia-Pacific Business Process Outsourcing (BPO) Market: Porter’s Five Forces Analysis
Figure 18 Asia-Pacific Business Process Outsourcing (BPO) Market: PESTLE Analysis
Figure 19 Asia-Pacific Business Process Outsourcing (BPO) Market Forecast by Type 2023-2033 (Revenue, CAGR%)
Figure 20 Asia-Pacific Business Process Outsourcing (BPO) Market Share Forecast by Type, 2023& 2033 (%)
Figure 21 Asia-Pacific Business Process Outsourcing (BPO) Market by Type, 2023-2033 (US$ Bn, AGR (%))
Figure 22 Asia-Pacific Nearshore Market Forecast, 2023-2033 (US$ Bn, AGR (%))
Figure 23 Asia-Pacific Nearshore Market by Region, 2023-2033 (US$ Bn, AGR (%))
Figure 24 Asia-Pacific Off-source Market Forecast, 2023-2033 (US$ Bn, AGR (%))
Figure 25 Asia-Pacific Off-source Market by Region, 2023-2033 (US$ Bn, AGR (%))
Figure 26 Asia-Pacific Onshore Market Forecast, 2023-2033 (US$ Bn, AGR (%))
Figure 27 Asia-Pacific Onshore Market by Region, 2023-2033 (US$ Bn, AGR (%))
Figure 28 Asia-Pacific Business Process Outsourcing (BPO) Market Forecast by Service Segment: Market Attractiveness Index
Figure 29 Asia-Pacific Business Process Outsourcing (BPO) Market Share Forecast by Service, 2023, 20323(%)
Figure 30 Asia-Pacific Business Process Outsourcing (BPO) Market by Service, 2023-2033 (US$ Bn, AGR (%))
Figure 31 Asia-Pacific Voice Processing Market Forecast, 2023-2033 (US$ Bn, AGR (%))
Figure 32 Asia-Pacific Voice Processing Market by Region, 2023-2033 (US$ Bn, AGR (%))
Figure 33 Asia-Pacific Telemarketing Services Market Forecast, 2023-2033 (US$ Bn, AGR (%))
Figure 34 Asia-Pacific Telemarketing Services Market by Region, 2023-2033 (US$ Bn, AGR (%))
Figure 35 Asia-Pacific Visualization Services Market Forecast, 2023-2033 (US$ Bn, AGR (%))
Figure 36 Asia-Pacific Visualization Services Market by Region, 2023-2033 (US$ Bn, AGR (%))
Figure 37 Asia-Pacific Other Services Market Forecast, 2023-2033 (US$ Bn, AGR (%))
Figure 38 Asia-Pacific Other Services Market by Region, 2023-2033 (US$ Bn, AGR (%))
Figure 39 Asia-Pacific Business Process Outsourcing (BPO) Market Forecast by Application Segment: Market Attractiveness Index
Figure 40 Asia-Pacific Business Process Outsourcing (BPO) Market Share Forecast by Application, 2023, 2033 (%)
Figure 41 Asia-Pacific Business Process Outsourcing (BPO) Market by Application, 2023-2033 (US$ Bn, AGR (%))
Figure 42 Asia-Pacific Customer Care & Demonstrations Market Forecast, 2023-2033 (US$ Bn, AGR (%))
Figure 43 Asia-Pacific Customer Care & Demonstrations Market by Region, 2023-2033 (US$ Bn, AGR (%))
Figure 44 Asia-Pacific Sales & Marketing Market Forecast, 2023-2033 (US$ Bn, AGR (%))
Figure 45 Asia-Pacific Sales & Marketing Market by Region, 2023-2033 (US$ Bn, AGR (%))
Figure 46 Asia-Pacific Finance & Accounting Market Forecast, 2023-2033 (US$ Bn, AGR (%))
Figure 47 Asia-Pacific Finance & Accounting Market by Region, 2023-2033 (US$ Bn, AGR (%))
Figure 48 Asia-Pacific Human Resource & Development Market Forecast, 2023-2033 (US$ Bn, AGR (%))
Figure 49 Asia-Pacific Human Resource & Development Market by Region, 2023-2033 (US$ Bn, AGR (%))
Figure 50 Asia-Pacific Other Application Market Forecast, 2023-2033 (US$ Bn, AGR (%))
Figure 51 Asia-Pacific Other Application Market by Region, 2023-2033 (US$ Bn, AGR (%))
Figure 52 Asia-Pacific Business Process Outsourcing (BPO) Market Forecast by End-User Segment: Market Attractiveness Index
Figure 53 Asia-Pacific Business Process Outsourcing (BPO) Market Share Forecast by End-User, 2023, 2033 (%)
Figure 54 Asia-Pacific Business Process Outsourcing (BPO) Market by End-User, 2023-2033 (US$ Bn, AGR (%))
Figure 55 Asia-Pacific IT & Telecom Market Forecast, 2023-2033 (US$ Bn, AGR (%))
Figure 56 Asia-Pacific IT & Telecom Market by Region, 2023-2033 (US$ Bn, AGR (%))
Figure 57 Asia-Pacific BFSI Market Forecast, 2023-2033 (US$ Bn, AGR (%))
Figure 58 Asia-Pacific BFSI Market by Region, 2023-2033 (US$ Bn, AGR (%))
Figure 60 Asia-Pacific Healthcare Sector Market by Region, 2023-2033 (US$ Bn, AGR (%))
Figure 61 Asia-Pacific Manufacturing Sector Market Forecast, 2023-2033 (US$ Bn, AGR (%))
Figure 62 Asia-Pacific Manufacturing Sector Market by Region, 2023-2033 (US$ Bn, AGR (%))
Figure 64 Asia-Pacific Retail & E-Commerce Market by Region, 2023-2033 (US$ Bn, AGR (%))
Figure 65 Asia-Pacific Other End-User Market Forecast, 2023-2033 (US$ Bn, AGR (%))
Figure 66 Asia-Pacific Other End-User Market by Region, 2023-2033 (US$ Bn, AGR (%))
Figure 67 Asia-Pacific Business Process Outsourcing (BPO) Market Forecast by Region 2023-2033: Market Attractiveness Index
Figure 68 Asia-Pacific Business Process Outsourcing (BPO) Market Share Forecast by Application, 2023, 2033 (%)
Figure 69 Asia-Pacific Business Process Outsourcing (BPO) Market Forecast, 2023-2033 (US$ Bn, AGR (%))
Figure 70 Asia-Pacific Business Process Outsourcing (BPO) Market by Region, 2023-2033 (US$ Bn, AGR (%))
Figure 71 Asia-Pacific Business Process Outsourcing (BPO) Market by Type, 2023-2033 (US$ Bn, AGR (%))
Figure 72 Asia-Pacific Business Process Outsourcing (BPO) Market by Service, 2023-2033 (US$ Bn, AGR (%))
Figure 73 Asia-Pacific Business Process Outsourcing (BPO) Market by Application, 2023-2033 (US$ Bn, AGR (%))
Figure 74 Asia-Pacific Business Process Outsourcing (BPO) Market by End-User, 2023-2033 (US$ Bn, AGR (%))
Figure 75 Southern Asia-Pacific Business Process Outsourcing (BPO) Market by Region: Market Attractiveness Index
Figure 76 Southern Asia Business Process Outsourcing (BPO) Market by Value, 2023-2033 (US$ Bn, AGR (%))
Figure 77 Southern Asia Business Process Outsourcing (BPO) Market by Country, 2023-2033 (US$ Bn, AGR (%))
Figure 78 Southern Asia Business Process Outsourcing (BPO) Market by Type, 2023-2033 (US$ Bn, AGR (%))
Figure 79 Southern Asia Business Process Outsourcing (BPO) Market by Service, 2023-2033 (US$ Bn, AGR (%))
Figure 80 Southern Asia Business Process Outsourcing (BPO) Market by Application, 2023-2033 (US$ Bn, AGR (%))
Figure 81 Southern Asia Business Process Outsourcing (BPO) Market by End-User, 2023-2033 (US$ Bn, AGR (%))
Figure 82 India Business Process Outsourcing (BPO) Market by Value, 2023-2033 (US$ Bn, AGR (%))
Figure 83 Rest of Southern Asia Business Process Outsourcing (BPO) Market by Value, 2023-2033 (US$ Bn, AGR (%))
Figure 84 Southern-Eastern Asia-Pacific Business Process Outsourcing (BPO) Market by Region: Market Attractiveness Index
Figure 85 South-Eastern Asia Business Process Outsourcing (BPO) Market by Value, 2023-2033 (US$ Bn, AGR (%))
Figure 86 South-Eastern Asia Business Process Outsourcing (BPO) Market by Country, 2023-2033 (US$ Bn, AGR (%))
Figure 87 South-Eastern Asia Business Process Outsourcing (BPO) Market by Type, 2023-2033 (US$ Bn, AGR (%))
Figure 88 South-Eastern Asia Business Process Outsourcing (BPO) Market by Service, 2023-2033 (US$ Bn, AGR (%))
Figure 89 South-Eastern Asia Business Process Outsourcing (BPO) Market by Application, 2023-2033 (US$ Bn, AGR (%))
Figure 90 South-Eastern Asia Business Process Outsourcing (BPO) Market by End-User, 2023-2033 (US$ Bn, AGR (%))
Figure 91 Indonesia Business Process Outsourcing (BPO) Market by Value, 2023-2033 (US$ Bn, AGR (%))
Figure 92 Philippines Business Process Outsourcing (BPO) Market by Value, 2023-2033 (US$ Bn, AGR (%))
Figure 93 Thailand Business Process Outsourcing (BPO) Market by Value, 2023-2033 (US$ Bn, AGR (%))
Figure 94 Malaysia Business Process Outsourcing (BPO) Market by Value, 2023-2033 (US$ Bn, AGR (%))
Figure 95 Singapore Business Process Outsourcing (BPO) Market by Value, 2023-2033 (US$ Bn, AGR (%))
Figure 96 Rest of South-Eastern Asia Business Process Outsourcing (BPO) Market by Value, 2023-2033 (US$ Bn, AGR (%))
Figure 97 Eastern Asia-Pacific Business Process Outsourcing (BPO) Market by Region: Market Attractiveness Index
Figure 98 Eastern Asia Business Process Outsourcing (BPO) Market by Value, 2023-2033 (US$ Bn, AGR (%))
Figure 99 Eastern Asia Business Process Outsourcing (BPO) Market by Country, 2023-2033 (US$ Bn, AGR (%))
Figure 100 Eastern Asia Business Process Outsourcing (BPO) Market by Type, 2023-2033 (US$ Bn, AGR (%))
Figure 101 Eastern Asia Business Process Outsourcing (BPO) Market by Service, 2023-2033 (US$ Bn, AGR (%))
Figure 102 Eastern Asia Business Process Outsourcing (BPO) Market by Application, 2023-2033 (US$ Bn, AGR (%))
Figure 103 Eastern Asia Business Process Outsourcing (BPO) Market by End-User, 2023-2033 (US$ Bn, AGR (%))
Figure 104 China Business Process Outsourcing (BPO) Market by Value, 2023-2033 (US$ Bn, AGR (%))
Figure 105 Japan Business Process Outsourcing (BPO) Market by Value, 2023-2033 (US$ Bn, AGR (%))
Figure 106 South Korea Business Process Outsourcing (BPO) Market by Value, 2023-2033 (US$ Bn, AGR (%))
Figure 107 Australia Business Process Outsourcing (BPO) Market by Value, 2023-2033 (US$ Bn, AGR (%))
Figure 108 Hong Kong Business Process Outsourcing (BPO) Market by Value, 2023-2033 (US$ Bn, AGR (%))
Figure 109 Rest of Eastern Asia Business Process Outsourcing (BPO) Market by Value, 2023-2033 (US$ Bn, AGR (%))
Figure 110 Western Asia-Pacific Business Process Outsourcing (BPO) Market by Region: Market Attractiveness Index
Figure 111 Western Asia Business Process Outsourcing (BPO) Market by Value, 2023-2033 (US$ Bn, AGR (%))
Figure 112 Western Asia Business Process Outsourcing (BPO) Market by Country, 2023-2033 (US$ Bn, AGR (%))
Figure 113 Western Asia Business Process Outsourcing (BPO) Market by Type, 2023-2033 (US$ Bn, AGR (%))
Figure 114 Western Asia Business Process Outsourcing (BPO) Market by Service, 2023-2033 (US$ Bn, AGR (%))
Figure 115 Western Asia Business Process Outsourcing (BPO) Market by Application, 2023-2033 (US$ Bn, AGR (%))
Figure 116 Western Asia Business Process Outsourcing (BPO) Market by End-User, 2023-2033 (US$ Bn, AGR (%))
Figure 117 Turkey Business Process Outsourcing (BPO) Market by Value, 2023-2033 (US$ Bn, AGR (%))
Figure 118 United Arab Emirates Business Process Outsourcing (BPO) Market by Value, 2023-2033 (US$ Bn, AGR (%))
Figure 119 Rest of Western Asia Business Process Outsourcing (BPO) Market by Value, 2023-2033 (US$ Bn, AGR (%))
Figure 120 Central Asia-Pacific Business Process Outsourcing (BPO) Market by Region: Market Attractiveness Index
Figure 121 Central Asia Business Process Outsourcing (BPO) Market by Value, 2023-2033 (US$ Bn, AGR (%))
Figure 122 Central Asia Business Process Outsourcing (BPO) Market by Country, 2023-2033 (US$ Bn, AGR (%))
Figure 123 Central Asia Business Process Outsourcing (BPO) Market by Type, 2023-2033 (US$ Bn, AGR (%))
Figure 124 Central Asia Business Process Outsourcing (BPO) Market by Service, 2023-2033 (US$ Bn, AGR (%))
Figure 125 Central Asia Business Process Outsourcing (BPO) Market by Application, 2023-2033 (US$ Bn, AGR (%))
Figure 126 Central Asia Business Process Outsourcing (BPO) Market by End-User, 2023-2033 (US$ Bn, AGR (%))
Figure 127 Uzbekistan Business Process Outsourcing (BPO) Market by Value, 2023-2033 (US$ Bn, AGR (%))
Figure 128 Kazakhstan Business Process Outsourcing (BPO) Market by Value, 2023-2033 (US$ Bn, AGR (%))
Figure 129 Rest of Central Asia Business Process Outsourcing (BPO) Market by Value, 2023-2033 (US$ Bn, AGR (%))
Figure 130 Accenture Plc: Net Revenue, 2017-2021 (US$ million, AGR%)
Figure 131 Accenture Plc: Gross Profit, 2017-2021 (US$ million, AGR%)
Figure 132 Accenture Plc: R&D, 2017-2021 (US$ million, AGR%)
Figure 133 IBM Corporation: Net Revenue, 2017-2021 (US$ million, AGR%)
Figure 134 IBM Corporation: Gross Profit, 2017-2021 (US$ million, AGR%)
Figure 135 IBM Corporation: R&D, 2017-2021 (US$ million, AGR%)
Figure 136 Cognizant: Net Revenue, 2017-2021 (US$ million, AGR%)
Figure 137 Cognizant: Gross Profit, 2017-2021 (US$ million, AGR%)
Figure 138 Capgemini SE: Net Revenue, 2017-2021 (US$ million, AGR%)
Figure 139 Capgemini SE: Gross Profit, 2017-2021 (US$ million, AGR%)
Figure 140 Infosys Limited: Net Revenue, 2017-2021 (US$ million, AGR%)
Figure 141 Infosys Limited: Gross Profit, 2017-2021 (US$ million, AGR%)
Figure 142 Infosys Limited: R&D, 2017-2021 (US$ million, AGR%)
Figure 143 ADP, Inc: Net Revenue, 2017-2021 (US$ million, AGR%)
Figure 144 ADP, Inc.: Gross Profit, 2017-2021 (US$ million, AGR%)
Figure 145 Amdocs: Net Revenue, 2017-2021 (US$ million, AGR%)
Figure 146 Amdocs: Gross Profit, 2017-2021 (US$ million, AGR%)
Figure 147 Amdocs: R&D, 2017-2021 (US$ million, AGR%)
Figure 148 CBRE Group, Inc: Net Revenue, 2017-2021 (US$ million, AGR%)
Figure 149 CBRE Group, Inc: Gross Profit, 2017-2021 (US$ million, AGR%)
Figure 150 Concentrix Corporation: Net Revenue, 2017-2021 (US$ million, AGR%)
Figure 151 Concentrix Corporation: Gross Profit, 2017-2021 (US$ million, AGR%)
Figure 152 HCL Technologies Limited: Net Revenue, 2017-2021 (US$ million, AGR%)
Figure 153 HCL Technologies Limited: Gross Profit, 2017-2021 (US$ million, AGR%)
Figure 154 HCL Technologies Limited: R&D, 2017-2021 (US$ million, AGR%)
ページTOPに戻る
よくあるご質問
Visiongain社はどのような調査会社ですか?
英国の調査会社ヴィジョンゲイン社(Visiongain)は、通信とエネルギーのほか、自動車や化学・医薬品、金属など、広範な市場を対象に調査を行っています。自動車市場については、市場全般に関する調査のほ... もっと見る
調査レポートの納品までの日数はどの程度ですか?
在庫のあるものは速納となりますが、平均的には 3-4日と見て下さい。
但し、一部の調査レポートでは、発注を受けた段階で内容更新をして納品をする場合もあります。
発注をする前のお問合せをお願いします。
注文の手続きはどのようになっていますか?
1)お客様からの御問い合わせをいただきます。
2)見積書やサンプルの提示をいたします。
3)お客様指定、もしくは弊社の発注書をメール添付にて発送してください。
4)データリソース社からレポート発行元の調査会社へ納品手配します。
5) 調査会社からお客様へ納品されます。最近は、pdfにてのメール納品が大半です。
お支払方法の方法はどのようになっていますか?
納品と同時にデータリソース社よりお客様へ請求書(必要に応じて納品書も)を発送いたします。
お客様よりデータリソース社へ(通常は円払い)の御振り込みをお願いします。
請求書は、納品日の日付で発行しますので、翌月最終営業日までの当社指定口座への振込みをお願いします。振込み手数料は御社負担にてお願いします。
お客様の御支払い条件が60日以上の場合は御相談ください。
尚、初めてのお取引先や個人の場合、前払いをお願いすることもあります。ご了承のほど、お願いします。
データリソース社はどのような会社ですか?
当社は、世界各国の主要調査会社・レポート出版社と提携し、世界各国の市場調査レポートや技術動向レポートなどを日本国内の企業・公官庁及び教育研究機関に提供しております。
世界各国の「市場・技術・法規制などの」実情を調査・収集される時には、データリソース社にご相談ください。
お客様の御要望にあったデータや情報を抽出する為のレポート紹介や調査のアドバイスも致します。
|
|


