軍用サイバーセキュリティ市場レポート:2024-2034
Military Cyber Security Market Report 2024-2034
レポート詳細
軍用サイバーセキュリティ市場レポート 2024-2034年 :本レポートは、業界とその基礎となる原動力をより良く理解したい場合、新たな収益ポケットを目指す大手企業にとって貴重なものと... もっと見る
※上記価格は部署ライセンス(Departmental licence)価格です。
その他の価格についてはデータリソースまでお問合せください。
日本語のページは自動翻訳を利用し作成しています。
実際のレポートは英文のみでご納品いたします。

|

|
サマリー
レポート詳細
軍用サイバーセキュリティ市場レポート 2024-2034年:本レポートは、業界とその基礎となる原動力をより良く理解したい場合、新たな収益ポケットを目指す大手企業にとって貴重なものとなるでしょう。異業種への進出や新たな地域での既存事業の拡大を目指す企業にも有用です。
軍用サイバーセキュリティ市場は、サイバー脅威の増加、防衛技術への投資増加を背景に急成長を遂げる
軍用サイバーセキュリティ市場は、サイバー脅威の増加、防衛技術への投資の増加、高度なセキュリティソリューションの軍事作戦への統合を原動力として力強い成長を遂げている。軍事インフラや機密データを標的とした巧妙なサイバー攻撃が急増する中、世界各国の政府は国家安全保障上の利益を守るためにサイバーセキュリティへの取り組みを優先している。このエグゼクティブサマリーでは、軍用サイバーセキュリティ市場を形成する主な推進要因、機会、課題、競争環境について概観する。
軍用サイバーセキュリティ市場を推進する主な要因の1つは、防衛システムや重要インフラを標的とするサイバー脅威の頻度と巧妙さが増していることである。軍用ネットワークのデジタル化と相互接続化によって攻撃対象が拡大し、サイバー攻撃を効果的に検出、防止、対応するための高度なサイバーセキュリティ・ソリューションが必要とされている。さらに、防衛業務におけるクラウドコンピューティング、モノのインターネット(IoT)デバイス、人工知能(AI)技術の採用が拡大しているため、サイバーセキュリティ要件の複雑さが増し、革新的なセキュリティソリューションに対する需要が高まっている。
軍用サイバーセキュリティ市場は、防衛予算の増加、サイバーセキュリティ能力強化に向けた政府の取り組み、防衛機関のサイバー脅威に対する意識の高まりが大きな成長機会をもたらしている。さらに、ブロックチェーン、量子暗号、ゼロトラストアーキテクチャなどの次世代技術の採用が増加しており、サイバーセキュリティベンダーが軍の要件に合わせた最先端のソリューションを開発する新たな道が開けている。さらに、防衛機関、テクノロジー企業、学術機関の連携がイノベーションを促進し、軍事用途の高度なサイバーセキュリティ技術の開発を促進している。
予算制約と資源配分が市場成長を阻害する可能性
予算の制約と資源配分の問題は、軍用サイバーセキュリティ市場の成長と発展に大きな課題をもたらしている。国家安全保障上の利益を守る上でのサイバーセキュリティの重要性が認識されつつあるにもかかわらず、多くの軍事組織はサイバーセキュリティの取り組みに充てられる予算配分の面で制限に直面している。国防支出を担当する政府機関は、しばしば競合する優先事項、限られた財源、財政的制約に遭遇するため、サイバーセキュリティ・プログラムやイニシアティブに適切な資金を配分する妨げになる可能性がある。
市場調査レポートを購入する前にすべき質問とは?
-
軍用サイバーセキュリティ市場はどのように進化しているのか?
-
軍用サイバーセキュリティ市場の推進要因と抑制要因は何か?
-
軍用サイバーセキュリティの各サブマーケットは予測期間中にどのように成長し、2034年にはどれくらいの収益を占めるようになるのか。
-
2024年から2034年にかけて、軍用サイバーセキュリティの各サブマーケットの市場シェアはどのように推移するのか?
-
2024年から2034年にかけて、市場全体を牽引する主な要因は何か?
-
主要な軍用サイバーセキュリティ市場は、マクロ経済の動きに幅広く追随するのか、それとも個々の国の市場が他を凌駕するのか。
-
2034年までに各国市場のシェアはどのように変化し、どの地域が2034年の市場をリードするのか。
-
主要プレーヤーと予測期間中の見通しは?
-
これらの大手企業にとっての軍用サイバーセキュリティプロジェクトとは?
-
2024年から2034年の間に、この業界はどのように進化するのか?現在および今後10年間に実施される軍用サイバーセキュリティプロジェクトにはどのような意味があるのか?
-
軍用サイバーセキュリティ市場をさらに拡大するために、製品の商業化がより必要とされているのでしょうか?
-
軍用サイバーセキュリティ市場はどこに向かっているのか、そしてどのようにすれば市場の最前線に立つことができるのか。
-
新商品や新サービスに最適な投資方法とは?
-
企業を新たな成長軌道に乗せ、C-suiteに移行させるための重要な展望とは?
このことが軍用サイバーセキュリティ市場に現在、そして今後10年間でどのような影響を与えるかを見極める必要がある:
-
455ページに及ぶレポートには、131の表と211の図表が掲載されている。
-
本レポートでは、業界における主要な有利分野を取り上げているため、今すぐターゲットを絞ることができる。
-
世界、地域、国の売上高と成長に関する詳細な分析が含まれている。
-
競合他社が成功した主なトレンド、変化、収益予測をハイライトします。
本レポートは、軍用サイバーセキュリティ市場が今後10年間、COVID-19の景気後退と好転の変動に合わせてどのように発展するかをTODAYに伝えるものである。この市場は、過去10年間のどの時点よりも今が重要である。
2034年までの予測やその他の分析から、商業的な展望が明らかになる
-
2034年までの収益予測に加え、最近の実績、成長率、市場シェアも提供している。
-
ビジネスの展望や展開など、独自の分析が掲載されている。
-
定性的分析(市場力学、促進要因、機会、阻害要因、課題を含む)、コスト構造、軍事サイバーセキュリティ価格上昇の影響、最近の動向をご覧いただけます。
本レポートには、COVID-19が業界と貴社にどのような影響を与えるかについてのデータ分析と貴重な洞察が含まれている。本レポートでは、COVID-19の4つの回収パターンとその影響、すなわち「V」、「L」、「W」、「U」について論じている。
レポート対象セグメント
導入形態別市場セグメント
コンポーネント別市場セグメント
エンドユーザー別市場セグメント
セキュリティ・タイプ別市場セグメント
-
ネットワークセキュリティ
-
エンドポイントセキュリティ
-
アプリケーションセキュリティ
-
クラウドベースセキュリティ
-
データセキュリティ
ソリューション別市場セグメント
-
脅威インテリジェンスとレスポンス管理
-
アイデンティティとアクセス管理(IAM)
-
侵入検知防御システム(IDPS)
-
セキュリティ情報・イベント管理(SIEM)
-
ファイアウォール
-
その他のソリューション
世界市場全体とセグメント別の収益予測に加え、4つの地域と20の主要国市場の収益予測も掲載しています:
北米
欧州
-
ドイツ
-
ロシア
-
イギリス
-
フランス
-
イタリア
-
その他の欧州
アジア太平洋
-
中国
-
日本
-
インド
-
オーストラリア
-
韓国
-
その他のアジア太平洋
ラテンアメリカ
中東・アフリカ
また、2024年から2034年までの軍用サイバーセキュリティ市場における主要企業のプロファイルも掲載している。
主要企業と市場成長の可能性
-
Booz Allen Hamilton Holding Corp.
-
CACI International Inc
-
Cisco Systems Inc.
-
Fortinet Inc
-
General Dynamics Corporation
-
GovCIO
-
Intel Corporation
-
International Business Machines Corp.
-
Leidos Holdings Inc.
-
Lockheed Martin Corporation
-
ManTech International
-
Northrop Grumman Systems Corp.
-
Raytheon Technologies Corporation
-
Thales Group
-
Viasat Inc.
2024年から2034年までの軍用サイバーセキュリティ市場における世界全体の売上高は、金額ベースで2024年に304億米ドルを突破する。2034年まで収益の力強い成長を予測。当調査では、最も大きな可能性を秘めた組織を特定しています。彼らの能力、進歩、商業的展望を発見し、あなたが一歩先を行くのを支援します。
軍用サイバーセキュリティ市場、2024〜2034年レポートはどのように役立つのか?
要約すると、450ページを超えるこのレポートは、以下の知識を提供する:
-
軍用サイバーセキュリティ市場の2024年から2034年までの収益予測 世界および地域レベルでの展開モード、コンポーネント、エンドユーザー、セキュリティタイプ、ソリューションの各予測を掲載 - 業界の展望を発見し、投資と収益に最も有利な場所を見つけることができます。
-
4つの地域と20の主要国市場の2034年までの収益予測 - 北米、ヨーロッパ、アジア太平洋、ラテンアメリカ、中東・アフリカの軍用サイバーセキュリティ市場の2024年から2034年までの市場予測をご覧ください。また、米国、カナダ、ブラジル、ドイツ、フランス、英国、イタリア、中国、インド、日本、オーストラリアなどの主要国の市場も予測しています。
-
2024年から2034年までの軍用サイバーセキュリティ市場に関わる主要企業15社の企業プロファイルを含む。
独自の予測による定量的・定性的分析をご覧ください。私たちのレポートだけに含まれる情報を入手し、貴重なビジネスインテリジェンスで情報を得ることができます。
他にはない情報
私たちの新しいレポートがあれば、知識に遅れをとったり、チャンスを逃したりする可能性が低くなります。弊社のレポートが貴社の調査、分析、意思決定にどのように役立つかをご覧ください。Visiongainの調査は、軍用サイバーセキュリティ市場、2024年から2034年、市場をリードする企業の商業分析を必要とするすべての人のためのものです。データ、トレンド、予測をご覧いただけます。
ページTOPに戻る
目次
目次
1 レポート概要
1.1 研究の目的
1.2 軍用サイバーセキュリティ市場の紹介
1.3 本レポートの内容
1.4 本レポートを読むべき理由
1.5 本分析レポートが回答する主な質問
1.6 本レポートは誰のためのものか?
1.7 調査方法
1.7.1 市場の定義
1.7.2 市場評価・予測手法
1.7.3 データ検証
1.7.3.1 一次調査
1.7.3.2 セカンダリーリサーチ
1.8 よくある質問(FAQ)
1.9 Visiongainの関連レポート
1.10 Visiongainについて
2 エグゼクティブ・サマリー
3 市場概要
3.1 主要な調査結果
3.2 市場ダイナミクス
3.2.1 市場促進要因
3.2.1.1 AI、ML、ブロックチェーンなどの技術の進歩が市場成長を牽引
3.2.1.2 成長する国防予算が市場成長を牽引
3.2.1.3 軍事作戦のデジタル変革が市場成長を牽引
3.2.2 市場抑制要因
3.2.2.1 予算制約と資源配分が市場成長を阻害する可能性
3.2.2.2 軍用サイバーセキュリティにとってサイバー脅威は重大な課題であり、継続的な適応と革新が必要
3.2.2.3 第三者ベンダーや請負業者を含むサプライチェーンにおける脆弱性がサプライチェーン攻撃のリスクをもたらす
3.2.3 市場機会
3.2.3.1 国防機関とサイバーセキュリティ企業間のパートナーシップとコラボレーション
3.2.3.2 サイバーセキュリティと物理的セキュリティ対策の統合は、包括的なセキュリティソリューションを提供する機会をもたらす
3.2.3.3 市場プレイヤーにとっての国際的な事業拡大の機会
3.3 ポーターのファイブフォース分析
3.3.1 サプライヤーの交渉力(中)
3.3.2 買い手の交渉力(高)
3.3.3 競争力(中〜高)
3.3.4 代替品による脅威(低)
3.3.5 新規参入の脅威(低)
3.4 COVID-19の影響分析
3.4.1 "V字型回復"
3.4.2 "U字型回復"
3.4.3 "W字型回復"
3.4.4 "L字型回復"
3.5 PEST分析
4 軍用サイバーセキュリティ市場分析:導入形態別
4.1 主要な調査結果
4.2 導入形態セグメント 市場魅力度指数
4.3 軍用サイバーセキュリティの導入形態市場規模推定と予測
4.4 クラウドベース
4.4.1 2024〜2034年の地域別市場規模(US$ Billion)
4.4.2 地域別市場シェア、2024年・2034年(%)
4.5 オンプレミス型
4.5.1 2024〜2034年の地域別市場規模(US$ Billion)
4.5.2 地域別市場シェア、2024年・2034年(%)
5 軍用サイバーセキュリティ市場分析:コンポーネント別
5.1 主要調査結果
5.2 コンポーネントセグメント 市場魅力度指数
5.3 軍用サイバーセキュリティのコンポーネント別市場規模推定と予測
5.4 ハードウェア
5.4.1 2024〜2034年の地域別市場規模(US$ Billion)
5.4.2 地域別市場シェア、2024年・2034年(%)
5.5 ソフトウェア
5.5.1 2024〜2034年の地域別市場規模(US$ Billion)
5.5.2 地域別市場シェア、2024年・2034年(%)
5.6 サービス
5.6.1 2024〜2034年の地域別市場規模(US$ Billion)
5.6.2 地域別市場シェア、2024年・2034年(%)
6 軍用サイバーセキュリティ市場分析:エンドユーザー別
6.1 主要調査結果
6.2 エンドユーザーセグメント 市場魅力度指数
6.3 軍用サイバーセキュリティのエンドユーザー別市場規模推定と予測
6.4 陸軍
6.4.1 2024〜2034年の地域別市場規模(US$ Billion)
6.4.2 地域別市場シェア、2024年・2034年(%)
6.5 海軍
6.5.1 2024〜2034年の地域別市場規模(US$ Billion)
6.5.2 地域別市場シェア、2024年・2034年(%)
6.6 空軍
6.6.1 2024〜2034年の地域別市場規模(US$ Billion)
6.6.2 地域別市場シェア、2024年・2034年(%)
6.7 サイバーコマンド
6.7.1 2024〜2034年の地域別市場規模(US$ Billion)
6.7.2 地域別市場シェア、2024年・2034年(%)
7 軍用サイバーセキュリティ市場分析:セキュリティタイプ別
7.1 主要な調査結果
7.2 セキュリティタイプ別セグメント 市場魅力度指数
7.3 軍用サイバーセキュリティのセキュリティタイプ別市場規模推定と予測
7.4 ネットワークセキュリティ
7.4.1 2024〜2034年の地域別市場規模(US$ Billion)
7.4.2 地域別市場シェア、2024年・2034年(%)
7.5 エンドポイントセキュリティ
7.5.1 2024〜2034年の地域別市場規模(US$ Billion)
7.5.2 地域別市場シェア、2024年・2034年(%)
7.6 アプリケーションセキュリティ
7.6.1 2024~2034年の地域別市場規模(US$ Billion)
7.6.2 地域別市場シェア、2024年・2034年(%)
7.7 クラウドベースのセキュリティ
7.7.1 2024〜2034年の地域別市場規模(US$ Billion)
7.7.2 地域別市場シェア、2024年・2034年(%)
7.8 データセキュリティ
7.8.1 2024〜2034年の地域別市場規模(US$ Billion)
7.8.2 地域別市場シェア、2024年・2034年(%)
8 軍用サイバーセキュリティ市場分析:ソリューション別
8.1 主要な調査結果
8.2 ソリューションセグメント 市場魅力度指数
8.3 軍用サイバーセキュリティのソリューション別市場規模推定と予測
8.4 脅威インテリジェンスとレスポンス管理
8.4.1 2024〜2034年の地域別市場規模(US$ Million)
8.4.2 地域別市場シェア、2024年・2034年(%)
8.5 アイデンティティとアクセス管理(IAM)
8.5.1 2024~2034年の地域別市場規模(US$ Million)
8.5.2 地域別市場シェア、2024年・2034年(%)
8.6 侵入検知防御システム(IDPS)
8.6.1 2024~2034年の地域別市場規模(US$ Million)
8.6.2 地域別市場シェア、2024年・2034年(%)
8.7 セキュリティ情報・イベント管理(SIEM)
8.7.1 2024~2034年の地域別市場規模(US$ Million)
8.7.2 地域別市場シェア、2024年・2034年(%)
8.8 ファイアウォール
8.8.1 2024~2034年の地域別市場規模(US$ Million)
8.8.2 地域別市場シェア、2024年・2034年(%)
8.9 その他のソリューション
8.9.1 2024年~2034年の地域別市場規模(US$ Million)
8.9.2 地域別市場シェア、2024年・2034年(%)
9 軍用サイバーセキュリティ市場分析:地域別
9.1 主要な調査結果
9.2 地域別市場規模の推定と予測
10 北米の軍事サイバーセキュリティ市場分析
10.1 主要な調査結果
10.2 北米の軍用サイバーセキュリティ市場魅力度指数
10.3 北米の軍用サイバーセキュリティ市場の国別市場規模、2024年、2029年、2034年(US$ Billion
10.4 北米の軍用サイバーセキュリティ市場規模推定と予測
10.5 北米の軍用サイバーセキュリティ市場規模推定と予測:国別
10.6 北米の軍用サイバーセキュリティ市場規模推定と予測:導入形態別
10.7 北米の軍用サイバーセキュリティ市場規模推定と予測:コンポーネント別
10.8 北米の軍用サイバーセキュリティ市場規模推定と予測:エンドユーザー別
10.9 北米の軍用サイバーセキュリティ市場規模推定と予測:セキュリティタイプ別
10.10 北米の軍用サイバーセキュリティ市場規模推定と予測:ソリューション別
10.11 米国の軍事サイバーセキュリティ市場分析
10.12 カナダの軍事サイバーセキュリティ市場分析
11 欧州の軍用サイバーセキュリティ市場分析
11.1 主要な調査結果
11.2 欧州の軍事サイバーセキュリティ市場魅力度指数
11.3 欧州の軍用サイバーセキュリティ市場の国別市場規模、2024年、2029年、2034年(US$ Billion)
11.4 欧州の軍事サイバーセキュリティ市場規模推定と予測
11.5 欧州の軍用サイバーセキュリティ市場規模推定と予測:国別
11.6 欧州の軍用サイバーセキュリティ市場規模推定と予測:導入形態別
11.7 欧州の軍用サイバーセキュリティ市場規模推定と予測:コンポーネント別
11.8 欧州の軍用サイバーセキュリティ市場規模推定と予測:エンドユーザー別
11.9 欧州の軍用サイバーセキュリティ市場規模推定と予測:セキュリティタイプ別
11.10 欧州の軍用サイバーセキュリティ市場規模推定と予測:ソリューション別
11.11 ドイツの軍用サイバーセキュリティ市場分析
11.12 イギリスの軍用サイバーセキュリティ市場分析
11.13 フランスの軍用サイバーセキュリティ市場分析
11.14 イタリアの軍用サイバーセキュリティ市場分析
11.15 ロシアの軍用サイバーセキュリティ市場の分析
11.16 その他の欧州の軍事サイバーセキュリティ市場分析
12 アジア太平洋地域の軍事サイバーセキュリティ市場分析
12.1 主要な調査結果
12.2 アジア太平洋地域の軍用サイバーセキュリティ市場魅力度指数
12.3 アジア太平洋地域の軍用サイバーセキュリティ国別市場、2024年、2029年、2034年(US$ Billion)
12.4 アジア太平洋地域の軍用サイバーセキュリティ市場規模推定と予測
12.5 アジア太平洋地域の軍用サイバーセキュリティ市場規模推定と予測:国別
12.6 アジア太平洋地域の軍用サイバーセキュリティ市場規模推定と予測:導入形態別
12.7 アジア太平洋地域の軍用サイバーセキュリティ市場規模推定と予測:コンポーネント別
12.8 アジア太平洋地域の軍用サイバーセキュリティ市場規模推定と予測:エンドユーザー別
12.9 アジア太平洋地域の軍用サイバーセキュリティ市場規模推定と予測:セキュリティタイプ別
12.10 アジア太平洋地域の軍用サイバーセキュリティ市場規模推定と予測:ソリューション別
12.11 中国の軍用サイバーセキュリティ市場分析
12.12 インドの軍用サイバーセキュリティ市場分析
12.13 日本の軍用サイバーセキュリティ市場分析
12.14 韓国の軍用サイバーセキュリティ市場分析
12.15 オーストラリアの軍事サイバーセキュリティ市場分析
12.16 その他のアジア太平洋地域の軍事サイバーセキュリティ市場分析
13 中東・アフリカの軍用サイバーセキュリティ市場分析
13.1 主要な調査結果
13.2 中東・アフリカ軍用サイバーセキュリティ市場魅力度指数
13.3 中東・アフリカ軍用サイバーセキュリティ国別市場、2024年、2029年、2034年 (US$ Billion)
13.4 中東・アフリカ軍用サイバーセキュリティ市場規模推定と予測
13.5 中東・アフリカ軍用サイバーセキュリティ市場規模推定と予測:国別
13.6 中東・アフリカ軍用サイバーセキュリティ市場規模推定と予測:導入形態別
13.7 中東・アフリカ軍用サイバーセキュリティ市場規模推定と予測:コンポーネント別
13.8 中東・アフリカ軍用サイバーセキュリティ市場規模推定と予測:エンドユーザー別
13.9 中東・アフリカ軍用サイバーセキュリティ市場規模推定と予測:セキュリティタイプ別
13.10 中東・アフリカ軍用サイバーセキュリティ市場規模推定と予測:ソリューション別
13.11 GCCの軍用サイバーセキュリティ市場分析
13.12 南アフリカの軍用サイバーセキュリティ市場分析
13.13 その他の中東・アフリカ地域の軍用サイバーセキュリティ市場分析
14 ラテンアメリカの軍用サイバーセキュリティ市場分析
14.1 主要な調査結果
14.2 ラテンアメリカの軍用サイバーセキュリティ市場魅力度指数
14.3 ラテンアメリカの軍用サイバーセキュリティ国別市場、2024年、2029年、2034年(US$ Billion)
14.4 ラテンアメリカの軍用サイバーセキュリティ市場規模推定と予測
14.5 ラテンアメリカの軍用サイバーセキュリティ市場規模推定と予測:国別
14.6 ラテンアメリカの軍用サイバーセキュリティ市場規模推定と予測:導入形態別
14.7 ラテンアメリカの軍用サイバーセキュリティ市場規模推定と予測:コンポーネント別
14.8 ラテンアメリカの軍用サイバーセキュリティ市場規模推定と予測:エンドユーザー別
14.9 ラテンアメリカの軍用サイバーセキュリティ市場規模推定と予測:セキュリティタイプ別
14.10 ラテンアメリカの軍用サイバーセキュリティ市場規模推定と予測:ソリューション別
14.11 ブラジルの軍用サイバーセキュリティ市場分析
14.12 メキシコの軍用サイバーセキュリティ市場分析
14.13 その他のラテンアメリカの軍事サイバーセキュリティ市場分析
15 会社概要
15.1 競争環境、2023年
15.2 戦略的展望
15.3 Cisco Systems Inc.
15.3.1 会社概要
15.3.2 会社概要
15.3.3 財務分析
15.3.3.1 純収入、2019-2023年
15.3.3.2 R&D、2019-2023年
15.3.3.3 地域別収益シェア、2023年(%)
15.3.3.4 事業セグメント収益シェア、2023年(%)
15.3.4 製品ベンチマーク
15.3.5 戦略的展望
15.4 General Dynamics Corporation
15.4.1 会社概要
15.4.2 会社概要
15.4.3 財務分析
15.4.3.1 純収入、2018-2022年
15.4.3.2 R&D、2018年~2022年
15.4.3.3 地域別収益シェア、2022年(%)
15.4.3.4 事業セグメント収益シェア、2022年(%)
15.4.4 製品ベンチマーク
15.4.5 戦略的展望
15.5 International Business Machines Corp.
15.5.1 会社概要
15.5.2 会社概要
15.5.3 財務分析
15.5.3.1 純収入、2018-2022年
15.5.3.2 R&D、2018-2022年
15.5.3.3 地域別収益シェア、2022年(%)
15.5.3.4 事業セグメント収益シェア、2022年(%)
15.5.4 製品ベンチマーク
15.5.5 戦略的展望
15.6 Leidos Holdings Inc.
15.6.1 会社概要
15.6.2 会社概要
15.6.3 財務分析
15.6.3.1 純収入、2018-2022年
15.6.3.2 R&D、2018年〜2022年
15.6.3.3 地域別収益シェア、2022年(%)
15.6.3.4 事業セグメント収益シェア、2022年(%)
15.6.4 製品ベンチマーク
15.6.5 戦略的展望
15.7 Lockheed Martin Corporation
15.7.1 会社概要
15.7.2 会社概要
15.7.3 財務分析
15.7.3.1 純収入、2018-2022年
15.7.3.2 R&D、2018年〜2022年
15.7.3.3 地域別収益シェア、2022年(%)
15.7.3.4 事業セグメント収益シェア、2022年(%)
15.7.4 製品ベンチマーク
15.7.5 戦略的展望
15.8 Northrop Grumman Systems Corp.
15.8.1 会社概要
15.8.2 会社概要
15.8.3 財務分析
15.8.3.1 純収入、2018-2022年
15.8.3.2 R&D、2018年〜2022年
15.8.3.3 地域別収益シェア、2022年(%)
15.8.3.4 事業セグメント収益シェア、2022年(%)
15.8.4 製品ベンチマーク
15.8.5 戦略的展望
15.9 Raytheon Technologies Corporation
15.9.1 会社概要
15.9.2 会社概要
15.9.3 財務分析
15.9.3.1 純収入(2019-2023年
15.9.3.2 R&D(2019年~2023年
15.9.3.3 地域別収益シェア、2023年(%)
15.9.3.4 事業セグメント収益シェア、2023年(%)
15.9.4 製品ベンチマーク
15.9.5 戦略的展望
15.10 Thales Group
15.10.1 会社概要
15.10.2 会社概要
15.10.3 財務分析
15.10.3.1 純収入、2018年~2022年
15.10.4 製品ベンチマーク
15.10.5 戦略的展望
15.11 Viasat Inc.
15.11.1 会社概要
15.11.2 会社概要
15.11.3 財務分析
15.11.3.1 純収入、2019-2023年
15.11.3.2 R&D、2019-2023年
15.11.3.3 地域別売上高シェア(2023年)
15.11.3.4 事業セグメント収益シェア、2023年(%)
15.11.4 製品ベンチマーク
15.11.5 戦略的展望
15.12 Fortinet, Inc.
15.12.1 会社概要
15.12.2 会社概要
15.12.3 財務分析
15.12.3.1 純収入、2019年~2023年
15.12.3.2 R&D、2019年~2023年
15.12.3.3 地域別収益シェア、2022年(%)
15.12.3.4 事業セグメント収益シェア、2022年(%)
15.12.4 製品ベンチマーク
15.12.5 戦略的展望
15.13 Booz Allen Hamilton Holding Corp.
15.13.1 会社概要
15.13.2 会社概要
15.13.3 財務分析
15.13.3.1 純収入、2019年~2023年
15.13.4 製品ベンチマーク
15.13.5 戦略的展望
15.14 Intel Corporation
15.14.1 会社概要
15.14.2 会社概要
15.14.3 財務分析
15.14.3.1 純収入(2018年~2022年
15.14.3.2 R&D、2018年~2022年
15.14.3.3 事業セグメント収益シェア、2022年(%)
15.14.4 製品ベンチマーク
15.14.5 戦略的展望
15.15 GovCIO
15.15.1 会社概要
15.15.2 会社概要
15.15.3 製品ベンチマーク
15.16 ManTech International
15.16.1 会社概要
15.16.2 会社概要
15.16.3 製品ベンチマーク
15.16.4 戦略的展望
15.17 CACI International Inc.
15.17.1 会社概要
15.17.2 会社概要
15.17.3 財務分析
15.17.3.1 純収入、2019-2023年
15.17.4 製品ベンチマーク
15.17.5 戦略的展望
16 結論と提言
16.1 Visiongainからの結びの言葉
16.2 市場プレイヤーへの提言
ページTOPに戻る
図表リスト
表の一覧
Table 1 Military Cyber Security Market Snapshot, 2024 & 2034 (US$ Billion, CAGR %)
Table 2 Global Military Cyber Security Market by Region, 2024-2034 (US$ Bn, AGR (%), CAGR (%)) (V-Shaped Recovery Scenario)
Table 3 Global Military Cyber Security Market by Region, 2024-2034 (US$ Bn, AGR (%), CAGR (%)) (U-Shaped Recovery Scenario)
Table 4 Global Military Cyber Security Market by Region, 2024-2034 (US$ Bn, AGR (%), CAGR (%)) (W-Shaped Recovery Scenario)
Table 5 Global Military Cyber Security Market by Region, 2024-2034 (US$ Bn, AGR (%), CAGR (%)) (L-Shaped Recovery Scenario)
Table 6 Global Military Cyber Security Market by Deployment Mode, 2024-2034 (US$ Bn, AGR (%), CAGR (%))
Table 7 Cloud-based Market by Region, 2024-2034 (US$ Bn, AGR (%), CAGR (%))
Table 8 On-Premise Market by Region, 2024-2034 (US$ Bn, AGR (%), CAGR (%))
Table 9 Global Military Cyber Security Market by Component, 2024-2034 (US$ Bn, AGR (%), CAGR (%))
Table 10 Hardware Market by Region, 2024-2034 (US$ Bn, AGR (%), CAGR (%))
Table 11 Software Market by Region, 2024-2034 (US$ Bn, AGR (%), CAGR (%))
Table 12 Services Market by Region, 2024-2034 (US$ Bn, AGR (%), CAGR (%))
Table 13 Global Military Cyber Security Market by End-User, 2024-2034 (US$ Bn, AGR (%), CAGR (%))
Table 14 Army Market by Region, 2024-2034 (US$ Bn, AGR (%), CAGR (%))
Table 15 Navy Market by Region, 2024-2034 (US$ Bn, AGR (%), CAGR (%))
Table 16 Air Force Market by Region, 2024-2034 (US$ Bn, AGR (%), CAGR (%))
Table 17 Cyber Commands Market by Region, 2024-2034 (US$ Bn, AGR (%), CAGR (%))
Table 18 Global Military Cyber Security Market by Security Type, 2024-2034 (US$ Bn, AGR (%), CAGR (%))
Table 19 Network Security Market by Region, 2024-2034 (US$ Bn, AGR (%), CAGR (%))
Table 20 Endpoint Security Market by Region, 2024-2034 (US$ Bn, AGR (%), CAGR (%))
Table 21 Application Security Market by Region, 2024-2034 (US$ Bn, AGR (%), CAGR (%))
Table 22 Cloud-based Security Market by Region, 2024-2034 (US$ Bn, AGR (%), CAGR (%))
Table 23 Data Security Market by Region, 2024-2034 (US$ Bn, AGR (%), CAGR (%))
Table 24 Global Military Cyber Security Market by Solution, 2024-2034 (US$ Bn, AGR (%), CAGR (%))
Table 25 Threat Intelligence and Response Management Market by Region, 2024-2034 (US$ Bn, AGR (%), CAGR (%))
Table 26 Identity and Access Management (IAM) Market by Region, 2024-2034 (US$ Bn, AGR (%), CAGR (%))
Table 27 Intrusion Detection and Prevention Systems (IDPS) Market by Region, 2024-2034 (US$ Bn, AGR (%), CAGR (%))
Table 28 Security Information and Event Management (SIEM) Market by Region, 2024-2034 (US$ Bn, AGR (%), CAGR (%))
Table 29 Firewall Market by Region, 2024-2034 (US$ Bn, AGR (%), CAGR (%))
Table 30 Other Solutions Market by Region, 2024-2034 (US$ Bn, AGR (%), CAGR (%))
Table 31 Global Military Cyber Security Market by Region, 2024-2034 (US$ Bn, AGR (%), CAGR (%))
Table 32 North America Military Cyber Security Market by Value, 2024-2034 (US$ Bn, AGR (%), CAGR (%))
Table 33 North America Military Cyber Security Market by Country, 2024-2034 (US$ Bn, AGR (%), CAGR (%))
Table 34 North America Military Cyber Security Market by Deployment Mode, 2024-2034 (US$ Bn, AGR (%), CAGR (%))
Table 35 North America Military Cyber Security Market by Component, 2024-2034 (US$ Bn, AGR (%), CAGR (%))
Table 36 North America Military Cyber Security Market by End-User, 2024-2034 (US$ Bn, AGR (%), CAGR (%))
Table 37 North America Military Cyber Security Market by Security Type, 2024-2034 (US$ Bn, AGR (%), CAGR (%))
Table 38 North America Military Cyber Security Market by Solution, 2024-2034 (US$ Bn, AGR (%), CAGR (%))
Table 39 US Military Cyber Security Market by Value, 2024-2034 (US$ Bn, AGR (%), CAGR (%))
Table 40 Canada Military Cyber Security Market by Value, 2024-2034 (US$ Bn, AGR (%), CAGR (%))
Table 41 Europe Military Cyber Security Market by Value, 2024-2034 (US$ Bn, AGR (%), CAGR (%))
Table 42 Europe Military Cyber Security Market by Country, 2024-2034 (US$ Bn, AGR (%), CAGR (%))
Table 43 Europe Military Cyber Security Market by Deployment Mode, 2024-2034 (US$ Bn, AGR (%), CAGR (%))
Table 44 Europe Military Cyber Security Market by Component, 2024-2034 (US$ Bn, AGR (%), CAGR (%))
Table 45 Europe Military Cyber Security Market by End-User, 2024-2034 (US$ Bn, AGR (%), CAGR (%))
Table 46 Europe Military Cyber Security Market by Security Type, 2024-2034 (US$ Bn, AGR (%), CAGR (%))
Table 47 Europe Military Cyber Security Market by Solution, 2024-2034 (US$ Bn, AGR (%), CAGR (%))
Table 48 Germany Military Cyber Security Market by Value, 2024-2034 (US$ Bn, AGR (%), CAGR (%))
Table 49 UK Military Cyber Security Market by Value, 2024-2034 (US$ Bn, AGR (%), CAGR (%))
Table 50 France Military Cyber Security Market by Value, 2024-2034 (US$ Bn, AGR (%), CAGR (%))
Table 51 Italy Military Cyber Security Market by Value, 2024-2034 (US$ Bn, AGR (%), CAGR (%))
Table 52 Russia Military Cyber Security Market by Value, 2024-2034 (US$ Bn, AGR (%), CAGR (%))
Table 53 Rest of Europe Military Cyber Security Market by Value, 2024-2034 (US$ Bn, AGR (%), CAGR (%))
Table 54 Asia-Pacific Military Cyber Security Market by Value, 2024-2034 (US$ Bn, AGR (%), CAGR (%))
Table 55 Asia-Pacific Military Cyber Security Market by Country, 2024-2034 (US$ Bn, AGR (%), CAGR (%))
Table 56 Asia-Pacific Military Cyber Security Market by Deployment Mode, 2024-2034 (US$ Bn, AGR (%), CAGR (%))
Table 57 Asia-Pacific Military Cyber Security Market by Component, 2024-2034 (US$ Bn, AGR (%), CAGR (%))
Table 58 Asia-Pacific Military Cyber Security Market by End-User, 2024-2034 (US$ Bn, AGR (%), CAGR (%))
Table 59 Asia-Pacific Military Cyber Security Market by Security Type, 2024-2034 (US$ Bn, AGR (%), CAGR (%))
Table 60 Asia-Pacific Military Cyber Security Market by Solution, 2024-2034 (US$ Bn, AGR (%), CAGR (%))
Table 61 China Military Cyber Security Market by Value, 2024-2034 (US$ Bn, AGR (%), CAGR (%))
Table 62 India Military Cyber Security Market by Value, 2024-2034 (US$ Bn, AGR (%), CAGR (%))
Table 63 Japan Military Cyber Security Market by Value, 2024-2034 (US$ Bn, AGR (%), CAGR (%))
Table 64 South Korea Military Cyber Security Market by Value, 2024-2034 (US$ Bn, AGR (%), CAGR (%))
Table 65 Australia Military Cyber Security Market by Value, 2024-2034 (US$ Bn, AGR (%), CAGR (%))
Table 66 Rest of Asia-Pacific Military Cyber Security Market by Value, 2024-2034 (US$ Bn, AGR (%), CAGR (%))
Table 67 Middle East & Africa Military Cyber Security Market by Value, 2024-2034 (US$ Bn, AGR (%), CAGR (%))
Table 68 Middle East & Africa Military Cyber Security Market by Country, 2024-2034 (US$ Bn, AGR (%), CAGR (%))
Table 69 Middle East & Africa Military Cyber Security Market by Deployment Mode, 2024-2034 (US$ Bn, AGR (%), CAGR (%))
Table 70 Middle East & Africa Military Cyber Security Market by Component, 2024-2034 (US$ Bn, AGR (%), CAGR (%))
Table 71 Middle East & Africa Military Cyber Security Market by End-User, 2024-2034 (US$ Bn, AGR (%), CAGR (%))
Table 72 Middle East & Africa Military Cyber Security Market by Security Type, 2024-2034 (US$ Bn, AGR (%), CAGR (%))
Table 73 Middle East & Africa Military Cyber Security Market by Solution, 2024-2034 (US$ Bn, AGR (%), CAGR (%))
Table 74 GCC Military Cyber Security Market by Value, 2024-2034 (US$ Bn, AGR (%), CAGR (%))
Table 75 South Africa Military Cyber Security Market by Value, 2024-2034 (US$ Bn, AGR (%), CAGR (%))
Table 76 Rest of Middle East & Africa Military Cyber Security Market by Value, 2024-2034 (US$ Bn, AGR (%), CAGR (%))
Table 77 Latin America Military Cyber Security Market by Value, 2024-2034 (US$ Bn, AGR (%), CAGR (%))
Table 78 Latin America Military Cyber Security Market by Country, 2024-2034 (US$ Bn, AGR (%), CAGR (%))
Table 79 Latin America Military Cyber Security Market by Deployment Mode, 2024-2034 (US$ Bn, AGR (%), CAGR (%))
Table 80 Latin America Military Cyber Security Market by Component, 2024-2034 (US$ Bn, AGR (%), CAGR (%))
Table 81 Latin America Military Cyber Security Market by End-User, 2024-2034 (US$ Bn, AGR (%), CAGR (%))
Table 82 Latin America Military Cyber Security Market by Security Type, 2024-2034 (US$ Bn, AGR (%), CAGR (%))
Table 83 Latin America Military Cyber Security Market by Solution, 2024-2034 (US$ Bn, AGR (%), CAGR (%))
Table 84 Brazil Military Cyber Security Market by Value, 2024-2034 (US$ Bn, AGR (%), CAGR (%))
Table 85 Mexico Military Cyber Security Market by Value, 2024-2034 (US$ Bn, AGR (%), CAGR (%))
Table 86 Rest of Latin America Military Cyber Security Market by Value, 2024-2034 (US$ Bn, AGR (%), CAGR (%))
Table 87 Strategic Outlook - Contract
Table 88 Cisco Systems Inc.: Key Details, (CEO, HQ, Revenue, Founded, No. of Employees, Company Type, Website, Business Segment)
Table 89 Cisco Systems Inc.: Product Benchmarking
Table 90 Cisco Systems Inc.: Strategic Outlook
Table 91 General Dynamics Corporation: Key Details, (CEO, HQ, Revenue, Founded, No. of Employees, Company Type, Website, Business Segment)
Table 92 General Dynamics Corporation: Product Benchmarking
Table 93 General Dynamics Corporation: Strategic Outlook
Table 94 International Business Machines Corp.: Key Details, (CEO, HQ, Revenue, Founded, No. of Employees, Company Type, Website, Business Segment)
Table 95 International Business Machines Corp.: Product Benchmarking
Table 96 International Business Machines Corp.: Strategic Outlook
Table 97 Leidos Holdings Inc.: Key Details, (CEO, HQ, Revenue, Founded, No. of Employees, Company Type, Website, Business Segment)
Table 98 Leidos Holdings Inc.: Product Benchmarking
Table 99 Leidos Holdings Inc.: Strategic Outlook
Table 100 Lockheed Martin Corporation: Key Details, (CEO, HQ, Revenue, Founded, No. of Employees, Company Type, Website, Business Segment)
Table 101 Lockheed Martin Corporation: Product Benchmarking
Table 102 Lockheed Martin Corporation: Strategic Outlook
Table 103 Northrop Grumman Systems Corp.: Key Details, (CEO, HQ, Revenue, Founded, No. of Employees, Company Type, Website, Business Segment)
Table 104 Northrop Grumman Systems Corp.: Product Benchmarking
Table 105 Northrop Grumman Systems Corp.: Strategic Outlook
Table 106 Raytheon Technologies Corporation: Key Details, (CEO, HQ, Revenue, Founded, No. of Employees, Company Type, Website, Business Segment)
Table 107 Raytheon Technologies Corporation: Product Benchmarking
Table 108 Raytheon Technologies Corporation: Strategic Outlook
Table 109 Thales Group: Key Details, (CEO, HQ, Revenue, Founded, No. of Employees, Company Type, Website, Business Segment)
Table 110 Thales Group: Product Benchmarking
Table 111 Thales Group: Strategic Outlook
Table 112 Viasat: Key Details, (CEO, HQ, Revenue, Founded, No. of Employees, Company Type, Website, Business Segment)
Table 113 Viasat: Product Benchmarking
Table 114 Viasat: Strategic Outlook
Table 115 Fortinet Inc: Key Details, (CEO, HQ, Revenue, Founded, No. of Employees, Company Type, Website, Business Segment)
Table 116 Fortinet Inc: Product Benchmarking
Table 117 Fortinet Inc: Strategic Outlook
Table 118 Booz Allen Hamilton Holding Corp.: Key Details, (CEO, HQ, Revenue, Founded, No. of Employees, Company Type, Website, Business Segment)
Table 119 Booz Allen Hamilton Holding Corp.: Product Benchmarking
Table 120 Booz Allen Hamilton Holding Corp.: Strategic Outlook
Table 121 Intel Corporation: Key Details, (CEO, HQ, Revenue, Founded, No. of Employees, Company Type, Website, Business Segment)
Table 122 Intel Corporation: Product Benchmarking
Table 123 Intel Corporation: Strategic Outlook
Table 124 GovCIO: Key Details, (CEO, HQ, Revenue, Founded, No. of Employees, Company Type, Website, Business Segment)
Table 125 GovCIO: Product Benchmarking
Table 126 ManTech International Corporation: Key Details, (CEO, HQ, Revenue, Founded, No. of Employees, Company Type, Website, Business Segment)
Table 127 ManTech International Corporation: Product Benchmarking
Table 128 ManTech International Corporation: Strategic Outlook
Table 129 CACI International Inc: Key Details, (CEO, HQ, Revenue, Founded, No. of Employees, Company Type, Website, Business Segment)
Table 130 CACI International Inc: Product Benchmarking
Table 131 CACI International Inc: Strategic Outlook
図の一覧
Figure 1 Military Cyber Security Market Segmentation
Figure 2 Military Cyber Security Market by Deployment Mode: Market Attractiveness Index
Figure 3 Military Cyber Security Market by Component: Market Attractiveness Index
Figure 4 Military Cyber Security Market by End-User: Market Attractiveness Index
Figure 5 Military Cyber Security Market by Security Type: Market Attractiveness Index
Figure 6 Military Cyber Security Market by Solution: Market Attractiveness Index
Figure 7 Military Cyber Security Market Attractiveness Index by Region
Figure 8 Military Cyber Security Market: Market Dynamics
Figure 9 Military Cyber Security Market: Porter’s Five Forces Analysis
Figure 10 Global Military Cyber Security Market Share Forecast by COVID, 2024-2034 (%)
Figure 11 Global Military Cyber Security Market by Region, 2024-2034 (US$ Bn, AGR (%)) (V-Shaped Recovery Scenario)
Figure 12 Global Military Cyber Security Market by Region, 2024-2034 (US$ Bn, AGR (%)) (U-Shaped Recovery Scenario)
Figure 13 Global Military Cyber Security Market by Region, 2024-2034 (US$ Bn, AGR (%)) (W-Shaped Recovery Scenario)
Figure 14 Global Military Cyber Security Market by Region, 2024-2034 (US$ Bn, AGR (%)) (L-Shaped Recovery Scenario)
Figure 15 Military Cyber Security Market: PEST Analysis
Figure 16 Military Cyber Security Market by Deployment Mode: Market Attractiveness Index
Figure 17 Global Military Cyber Security Market by Deployment Mode, 2024-2034 (US$ Bn, AGR (%))
Figure 18 Military Cyber Security Market Share Forecast by Deployment Mode, 2024, 2029, 2034 (%)
Figure 19 Cloud-based Market by Region, 2024-2034 (US$ Bn, AGR (%))
Figure 20 Cloud-based Market Share Forecast by Region, 2024 & 2034 (%)
Figure 21 On-Premise Market by Region, 2024-2034 (US$ Bn, AGR (%))
Figure 22 On-Premise Market Share Forecast by Region, 2024 & 2034 (%)
Figure 23 Military Cyber Security Market by Component: Market Attractiveness Index
Figure 24 Global Military Cyber Security Market by Component, 2024-2034 (US$ Bn, AGR (%))
Figure 25 Military Cyber Security Market Share Forecast by Component, 2024, 2029, 2034 (%)
Figure 26 Hardware Market by Region, 2024-2034 (US$ Bn, AGR (%))
Figure 27 Hardware Market Share Forecast by Region, 2024 & 2034 (%)
Figure 28 Software Market by Region, 2024-2034 (US$ Bn, AGR (%))
Figure 29 Software Market Share Forecast by Region, 2024 & 2034 (%)
Figure 30 Services Market by Region, 2024-2034 (US$ Bn, AGR (%))
Figure 31 Services Market Share Forecast by Region, 2024 & 2034 (%)
Figure 32 Military Cyber Security Market by End-User: Market Attractiveness Index
Figure 33 Global Military Cyber Security Market by End-User, 2024-2034 (US$ Bn, AGR (%))
Figure 34 Military Cyber Security Market Share Forecast by End-User, 2024, 2029, 2034 (%)
Figure 35 Army Market by Region, 2024-2034 (US$ Bn, AGR (%))
Figure 36 Army Market Share Forecast by Region, 2024 & 2034 (%)
Figure 37 Navy Market by Region, 2024-2034 (US$ Bn, AGR (%))
Figure 38 Navy Market Share Forecast by Region, 2024 & 2034 (%)
Figure 39 Air Force Market by Region, 2024-2034 (US$ Bn, AGR (%))
Figure 40 Air Force Market Share Forecast by Region, 2024 & 2034 (%)
Figure 41 Cyber Commands Market by Region, 2024-2034 (US$ Bn, AGR (%))
Figure 42 Cyber Commands Market Share Forecast by Region, 2024 & 2034 (%)
Figure 43 Military Cyber Security Market by Security Type: Market Attractiveness Index
Figure 44 Global Military Cyber Security Market by Security Type, 2024-2034 (US$ Bn, AGR (%))
Figure 45 Military Cyber Security Market Share Forecast by Security Type, 2024, 2029, 2034 (%)
Figure 46 Network Security Market by Region, 2024-2034 (US$ Bn, AGR (%))
Figure 47 Network Security Market Share Forecast by Region, 2024 & 2034 (%)
Figure 48 Endpoint Security Market by Region, 2024-2034 (US$ Bn, AGR (%))
Figure 49 Endpoint Security Market Share Forecast by Region, 2024 & 2034 (%)
Figure 50 Application Security Market by Region, 2024-2034 (US$ Bn, AGR (%))
Figure 51 Application Security Market Share Forecast by Region, 2024 & 2034 (%)
Figure 52 Cloud-based Security Market by Region, 2024-2034 (US$ Bn, AGR (%))
Figure 53 Cloud-based Security Market Share Forecast by Region, 2024 & 2034 (%)
Figure 54 Data Security Market by Region, 2024-2034 (US$ Bn, AGR (%))
Figure 55 Data Security Market Share Forecast by Region, 2024 & 2034 (%)
Figure 56 Military Cyber Security Market by Solution: Market Attractiveness Index
Figure 57 Global Military Cyber Security Market by Solution, 2024-2034 (US$ Bn, AGR (%))
Figure 58 Military Cyber Security Market Share Forecast by Solution, 2024, 2029, 2034 (%)
Figure 59 Threat Intelligence and Response Management Market by Region, 2024-2034 (US$ Bn, AGR (%))
Figure 60 Threat Intelligence and Response Management Market Share Forecast by Region, 2024 & 2034 (%)
Figure 61 Identity and Access Management (IAM) Market by Region, 2024-2034 (US$ Bn, AGR (%))
Figure 62 Identity and Access Management (IAM) Market Share Forecast by Region, 2024 & 2034 (%)
Figure 63 Intrusion Detection and Prevention Systems (IDPS) Market by Region, 2024-2034 (US$ Bn, AGR (%))
Figure 64 Intrusion Detection and Prevention Systems (IDPS) Market Share Forecast by Region, 2024 & 2034 (%)
Figure 65 Security Information and Event Management (SIEM) Market by Region, 2024-2034 (US$ Bn, AGR (%))
Figure 66 Security Information and Event Management (SIEM) Market Share Forecast by Region, 2024 & 2034 (%)
Figure 67 Firewall Market by Region, 2024-2034 (US$ Bn, AGR (%))
Figure 68 Firewall Market Share Forecast by Region, 2024 & 2034 (%)
Figure 69 Other Solutions Market by Region, 2024-2034 (US$ Bn, AGR (%))
Figure 70 Other Solutions Market Share Forecast by Region, 2024 & 2034 (%)
Figure 71 Military Cyber Security Market Forecast by Region 2024 and 2034 (Revenue, CAGR%)
Figure 72 Military Cyber Security Market Share Forecast by Region 2024, 2029, 2034 (%)
Figure 73 Global Military Cyber Security Market by Region, 2024-2034 (US$ Bn, AGR (%))
Figure 74 North America Military Cyber Security Market Attractiveness Index
Figure 75 North America Military Cyber Security Market by Region, 2024, 2029 & 2034 (US$ Billion)
Figure 76 North America Military Cyber Security Market by Value, 2024-2034 (US$ Bn, AGR (%))
Figure 77 North America Military Cyber Security Market by Country, 2024-2034 (US$ Bn, AGR (%))
Figure 78 North America Military Cyber Security Market Share Forecast by Country, 2024 & 2034 (%)
Figure 79 North America Military Cyber Security Market by Deployment Mode, 2024-2034 (US$ Bn, AGR (%))
Figure 80 North America Military Cyber Security Market Share Forecast Deployment Mode, 2024 & 2034 (%)
Figure 81 North America Military Cyber Security Market by Component, 2024-2034 (US$ Bn, AGR (%))
Figure 82 North America Military Cyber Security Market Share Forecast by Component, 2024 & 2034 (%)
Figure 83 North America Military Cyber Security Market by End-User, 2024-2034 (US$ Bn, AGR (%))
Figure 84 North America Military Cyber Security Market Share Forecast by End-User, 2024 & 2034 (%)
Figure 85 North America Military Cyber Security Market by Security Type, 2024-2034 (US$ Bn, AGR (%))
Figure 86 North America Military Cyber Security Market Share Forecast by Security Type, 2024 & 2034 (%)
Figure 87 North America Military Cyber Security Market by Solution, 2024-2034 (US$ Bn, AGR (%))
Figure 88 North America Military Cyber Security Market Share Forecast by Solution, 2024 & 2034 (%)
Figure 89 US Military Cyber Security Market by Value, 2024-2034 (US$ Bn, AGR (%))
Figure 90 Canada Military Cyber Security Market by Value, 2024-2034 (US$ Bn, AGR (%))
Figure 91 Europe Military Cyber Security Market Attractiveness Index
Figure 92 Europe Military Cyber Security Market by Region, 2024, 2029 & 2034 (US$ Billion)
Figure 93 Europe Military Cyber Security Market by Value, 2024-2034 (US$ Bn, AGR (%))
Figure 94 Europe Military Cyber Security Market by Country, 2024-2034 (US$ Bn, AGR (%))
Figure 95 Europe Military Cyber Security Market Share Forecast by Country, 2024 & 2034 (%)
Figure 96 Europe Military Cyber Security Market by Deployment Mode, 2024-2034 (US$ Bn, AGR (%))
Figure 97 Europe Military Cyber Security Market Share Forecast Deployment Mode, 2024 & 2034 (%)
Figure 98 Europe Military Cyber Security Market by Component, 2024-2034 (US$ Bn, AGR (%))
Figure 99 Europe Military Cyber Security Market Share Forecast by Component, 2024 & 2034 (%)
Figure 100 Europe Military Cyber Security Market by End-User, 2024-2034 (US$ Bn, AGR (%))
Figure 101 Europe Military Cyber Security Market Share Forecast by End-User, 2024 & 2034 (%)
Figure 102 Europe Military Cyber Security Market by Security Type, 2024-2034 (US$ Bn, AGR (%))
Figure 103 Europe Military Cyber Security Market Share Forecast by Security Type, 2024 & 2034 (%)
Figure 104 Europe Military Cyber Security Market by Solution, 2024-2034 (US$ Bn, AGR (%))
Figure 105 Europe Military Cyber Security Market Share Forecast by Solution, 2024 & 2034 (%)
Figure 106 Germany Military Cyber Security Market by Value, 2024-2034 (US$ Bn, AGR (%))
Figure 107 UK Military Cyber Security Market by Value, 2024-2034 (US$ Bn, AGR (%))
Figure 108 France Military Cyber Security Market by Value, 2024-2034 (US$ Bn, AGR (%))
Figure 109 Italy Military Cyber Security Market by Value, 2024-2034 (US$ Bn, AGR (%))
Figure 110 Russia Military Cyber Security Market by Value, 2024-2034 (US$ Bn, AGR (%))
Figure 111 Rest of Europe Military Cyber Security Market by Value, 2024-2034 (US$ Bn, AGR (%))
Figure 112 Asia-Pacific Military Cyber Security Market Attractiveness Index
Figure 113 Asia-Pacific Military Cyber Security Market by Region, 2024, 2029 & 2034 (US$ Billion)
Figure 114 Asia-Pacific Military Cyber Security Market by Value, 2024-2034 (US$ Bn, AGR (%))
Figure 115 Asia-Pacific Military Cyber Security Market by Country, 2024-2034 (US$ Bn, AGR (%))
Figure 116 Asia-Pacific Military Cyber Security Market Share Forecast by Country, 2024 & 2034 (%)
Figure 117 Asia-Pacific Military Cyber Security Market by Deployment Mode, 2024-2034 (US$ Bn, AGR (%))
Figure 118 Asia-Pacific Military Cyber Security Market Share Forecast Deployment Mode, 2024 & 2034 (%)
Figure 119 Asia-Pacific Military Cyber Security Market by Component, 2024-2034 (US$ Bn, AGR (%))
Figure 120 Asia-Pacific Military Cyber Security Market Share Forecast by Component, 2024 & 2034 (%)
Figure 121 Asia-Pacific Military Cyber Security Market by End-User, 2024-2034 (US$ Bn, AGR (%))
Figure 122 Asia-Pacific Military Cyber Security Market Share Forecast by End-User, 2024 & 2034 (%)
Figure 123 Asia-Pacific Military Cyber Security Market by Security Type, 2024-2034 (US$ Bn, AGR (%))
Figure 124 Asia-Pacific Military Cyber Security Market Share Forecast by Security Type, 2024 & 2034 (%)
Figure 125 Asia-Pacific Military Cyber Security Market by Solution, 2024-2034 (US$ Bn, AGR (%))
Figure 126 Asia-Pacific Military Cyber Security Market Share Forecast by Solution, 2024 & 2034 (%)
Figure 127 China Military Cyber Security Market by Value, 2024-2034 (US$ Bn, AGR (%))
Figure 128 India Military Cyber Security Market by Value, 2024-2034 (US$ Bn, AGR (%))
Figure 129 Japan Military Cyber Security Market by Value, 2024-2034 (US$ Bn, AGR (%))
Figure 130 South Korea Military Cyber Security Market by Value, 2024-2034 (US$ Bn, AGR (%))
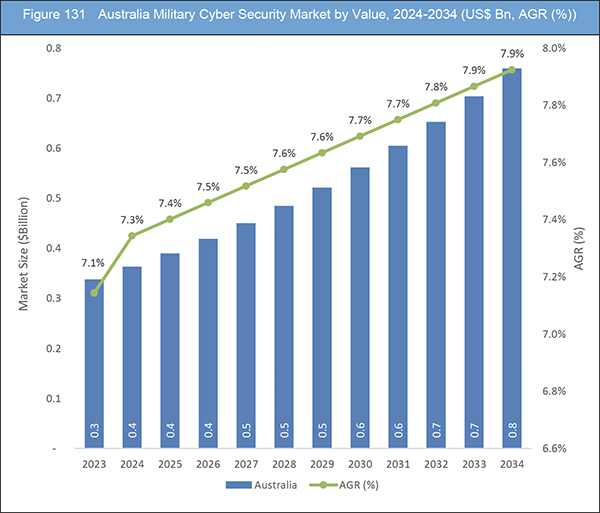
Figure 131 Australia Military Cyber Security Market by Value, 2024-2034 (US$ Bn, AGR (%))
Figure 132 Rest of Asia-Pacific Military Cyber Security Market by Value, 2024-2034 (US$ Bn, AGR (%))
Figure 133 Middle East and Africa Military Cyber Security Market Attractiveness Index
Figure 134 Middle East and Africa Military Cyber Security Market by Region, 2024, 2029 & 2034 (US$ Billion)
Figure 135 Middle East & Africa Military Cyber Security Market by Value, 2024-2034 (US$ Bn, AGR (%))
Figure 136 Middle East & Africa Military Cyber Security Market by Country, 2024-2034 (US$ Bn, AGR (%))
Figure 137 Middle East and Africa Military Cyber Security Market Share Forecast by Country, 2024 & 2034 (%)
Figure 138 Middle East & Africa Military Cyber Security Market by Deployment Mode, 2024-2034 (US$ Bn, AGR (%))
Figure 139 Middle East and Africa Military Cyber Security Market Share Forecast Deployment Mode, 2024 & 2034 (%)
Figure 140 Middle East & Africa Military Cyber Security Market by Component, 2024-2034 (US$ Bn, AGR (%))
Figure 141 Middle East and Africa Military Cyber Security Market Share Forecast by Component, 2024 & 2034 (%)
Figure 142 Middle East & Africa Military Cyber Security Market by End-User, 2024-2034 (US$ Bn, AGR (%))
Figure 143 Middle East and Africa Military Cyber Security Market Share Forecast by End-User, 2024 & 2034 (%)
Figure 144 Middle East & Africa Military Cyber Security Market by Security Type, 2024-2034 (US$ Bn, AGR (%))
Figure 145 Middle East and Africa Military Cyber Security Market Share Forecast by Security Type, 2024 & 2034 (%)
Figure 146 Middle East & Africa Military Cyber Security Market by Solution, 2024-2034 (US$ Bn, AGR (%))
Figure 147 Middle East and Africa Military Cyber Security Market Share Forecast by Solution, 2024 & 2034 (%)
Figure 148 GCC Military Cyber Security Market by Value, 2024-2034 (US$ Bn, AGR (%))
Figure 149 South Africa Military Cyber Security Market by Value, 2024-2034 (US$ Bn, AGR (%))
Figure 150 Rest of Middle East & Africa Military Cyber Security Market by Value, 2024-2034 (US$ Bn, AGR (%))
Figure 151 Latin America Military Cyber Security Market Attractiveness Index
Figure 152 Latin America Military Cyber Security Market by Region, 2024, 2029 & 2034 (US$ Billion)
Figure 153 Latin America Military Cyber Security Market by Value, 2024-2034 (US$ Bn, AGR (%))
Figure 154 Latin America Military Cyber Security Market by Country, 2024-2034 (US$ Bn, AGR (%))
Figure 155 Latin America Military Cyber Security Market Share Forecast by Country, 2024 & 2034 (%)
Figure 156 Latin America Military Cyber Security Market by Deployment Mode, 2024-2034 (US$ Bn, AGR (%))
Figure 157 Latin America Military Cyber Security Market Share Forecast Deployment Mode, 2024 & 2034 (%)
Figure 158 Latin America Military Cyber Security Market by Component, 2024-2034 (US$ Bn, AGR (%))
Figure 159 Latin America Military Cyber Security Market Share Forecast by Component, 2024 & 2034 (%)
Figure 160 Latin America Military Cyber Security Market by End-User, 2024-2034 (US$ Bn, AGR (%))
Figure 161 Latin America Military Cyber Security Market Share Forecast by End-User, 2024 & 2034 (%)
Figure 162 Latin America Military Cyber Security Market by Security Type, 2024-2034 (US$ Bn, AGR (%))
Figure 163 Latin America Military Cyber Security Market Share Forecast by Security Type, 2024 & 2034 (%)
Figure 164 Latin America Military Cyber Security Market by Solution, 2024-2034 (US$ Bn, AGR (%))
Figure 165 Latin America Military Cyber Security Market Share Forecast by Solution, 2024 & 2034 (%)
Figure 166 Brazil Military Cyber Security Market by Value, 2024-2034 (US$ Bn, AGR (%))
Figure 167 Mexico Military Cyber Security Market by Value, 2024-2034 (US$ Bn, AGR (%))
Figure 168 Rest of Latin America Military Cyber Security Market by Value, 2024-2034 (US$ Bn, AGR (%))
Figure 169 Military Cyber Security Market: Company Share, 2023
Figure 170 Cisco Systems Inc.: Net Revenue, 2019-2023 (US$ Million, AGR%)
Figure 171 Cisco Systems Inc.: R&D, 2019-2023 (US$ Million, AGR%)
Figure 172 Cisco Systems Inc.: Regional Revenue Share, 2023 (%)
Figure 173 Cisco Systems Inc.: Business Segment Revenue Share, 2023 (%)
Figure 174 General Dynamics Corporation.: Net Revenue, 2018-2022 (US$ Million, AGR%)
Figure 175 General Dynamics Corporation.: R&D, 2018-2022 (US$ Million, AGR%)
Figure 176 General Dynamics Corporation.: Regional Revenue Share, 2022 (%)
Figure 177 General Dynamics Corporation.: Business Segment Revenue Share, 2022 (%)
Figure 178 International Business Machines Corp.: Net Revenue, 2018-2022 (US$ Million, AGR%)
Figure 179 International Business Machines Corp.: R&D, 2018-2022 (US$ Million, AGR%)
Figure 180 International Business Machines Corp.: Regional Revenue Share, 2022 (%)
Figure 181 International Business Machines Corp.: Business Segment Revenue Share, 2022 (%)
Figure 182 Leidos Holdings Inc.: Net Revenue, 2018-2022 (US$ Million, AGR%)
Figure 183 Leidos Holdings Inc.: R&D, 2018-2022 (US$ Million, AGR%)
Figure 184 Leidos Holdings Inc.: Regional Revenue Share, 2022 (%)
Figure 185 Leidos Holdings Inc.: Business Segment Revenue Share, 2022 (%)
Figure 186 Lockheed Martin Corporation.: Net Revenue, 2018-2022 (US$ Million, AGR%)
Figure 187 Lockheed Martin Corporation.: R&D, 2018-2022 (US$ Million, AGR%)
Figure 188 Lockheed Martin Corporation.: Regional Revenue Share, 2022 (%)
Figure 189 Lockheed Martin Corporation.: Business Segment Revenue Share, 2022 (%)
Figure 190 Northrop Grumman Systems Corp.: Net Revenue, 2018-2022 (US$ Million, AGR%)
Figure 191 Northrop Grumman Systems Corp.: R&D, 2018-2022 (US$ Million, AGR%)
Figure 192 Northrop Grumman Systems Corp.: Regional Revenue Share, 2022 (%)
Figure 193 Northrop Grumman Systems Corp.: Business Segment Revenue Share, 2022 (%)
Figure 194 Raytheon Technologies Corporation.: Net Revenue, 2019-2023 (US$ Million, AGR%)
Figure 195 Raytheon Technologies Corporation.: R&D, 2019-2023 (US$ Million, AGR%)
Figure 196 Raytheon Technologies Corporation.: Regional Revenue Share, 2023 (%)
Figure 197 Raytheon Technologies Corporation.: Business Segment Revenue Share, 2023 (%)
Figure 198 Thales Group.: Net Revenue, 2018-2022 (US$ Million, AGR%)
Figure 199 Viasat.: Net Revenue, 2019-2023 (US$ Million, AGR%)
Figure 200 Viasat.: R&D, 2019-2023 (US$ Million, AGR%)
Figure 201 Viasat.: Regional Revenue Share, 2023 (%)
Figure 202 Viasat.: Business Segment Revenue Share, 2023 (%)
Figure 203 Fortinet Inc.: Net Revenue, 2019-2023 (US$ Million, AGR%)
Figure 204 Fortinet Inc.: R&D, 2019-2023 (US$ Million, AGR%)
Figure 205 Fortinet Inc.: Regional Revenue Share, 2022 (%)
Figure 206 Fortinet Inc.: Business Segment Revenue Share, 2022 (%)
Figure 207 Booz Allen Hamilton Holding Corp.: Net Revenue, 2019-2023 (US$ Million, AGR%)
Figure 208 Intel Corporation.: Net Revenue, 2018-2022 (US$ Million, AGR%)
Figure 209 Intel Corporation.: R&D, 2018-2022 (US$ Million, AGR%)
Figure 210 Intel Corporation.: Business Segment Revenue Share, 2022 (%)
Figure 211 CACI International Inc.: Net Revenue, 2019-2023 (US$ Million, AGR%)
ページTOPに戻る
Summary
Report Details
The Military Cyber Security Market Report 2024-2034: This report will prove invaluable to leading firms striving for new revenue pockets if they wish to better understand the industry and its underlying dynamics. It will be useful for companies that would like to expand into different industries or to expand their existing operations in a new region.
The Military Cybersecurity Market Is Witnessing Robust Growth Driven by Increasing Cyber Threats, Rising Investments in Defence Technology
The military cybersecurity market is witnessing robust growth driven by increasing cyber threats, rising investments in defence technology, and the integration of advanced security solutions into military operations. With the proliferation of sophisticated cyber-attacks targeting military infrastructure and sensitive data, governments worldwide are prioritizing cybersecurity initiatives to safeguard national security interests. This executive summary provides an overview of the key drivers, opportunities, challenges, and competitive landscape shaping the military cybersecurity market.
One of the primary drivers propelling the military cybersecurity market is the escalating frequency and sophistication of cyber threats targeting defence systems and critical infrastructure. The digitization and interconnectedness of military networks have expanded the attack surface, necessitating advanced cybersecurity solutions to detect, prevent, and respond to cyber-attacks effectively. Additionally, the growing adoption of cloud computing, Internet of Things (IoT) devices, and artificial intelligence (AI) technologies in defence operations has increased the complexity of cybersecurity requirements, driving demand for innovative security solutions.
The military cybersecurity market presents significant growth opportunities fuelled by increasing defence budgets, government initiatives to enhance cybersecurity capabilities, and the growing awareness of cyber threats among defence agencies. Moreover, the rising adoption of next-generation technologies such as blockchain, quantum cryptography, and zero-trust architecture offers new avenues for cybersecurity vendors to develop cutting-edge solutions tailored to military requirements. Furthermore, collaborations between defence organizations, technology companies, and academic institutions are fostering innovation and driving the development of advanced cybersecurity technologies for military applications.
Budgetary Constraints and Resources Allocation to Potentially Impede Market Growth
Budgetary constraints and resource allocation issues pose significant challenges to the growth and development of the military cybersecurity market. Despite the increasing recognition of the importance of cybersecurity in safeguarding national security interests, many military organizations face limitations in terms of budgetary allocations dedicated to cybersecurity initiatives. Government agencies responsible for defence spending often encounter competing priorities, limited financial resources, and fiscal constraints, which may hinder the allocation of adequate funding for cybersecurity programs and initiatives.
What Questions Should You Ask before Buying a Market Research Report?
-
How is the military cyber security market evolving?
-
What is driving and restraining the military cyber security market?
-
How will each military cyber security submarket segment grow over the forecast period and how much revenue will these submarkets account for in 2034?
-
How will the market shares for each military cyber security submarket develop from 2024 to 2034?
-
What will be the main driver for the overall market from 2024 to 2034?
-
Will leading military cyber security markets broadly follow the macroeconomic dynamics, or will individual national markets outperform others?
-
How will the market shares of the national markets change by 2034 and which geographical region will lead the market in 2034?
-
Who are the leading players and what are their prospects over the forecast period?
-
What are the military cyber security projects for these leading companies?
-
How will the industry evolve during the period between 2024 and 2034? What are the implications of military cyber security projects taking place now and over the next 10 years?
-
Is there a greater need for product commercialisation to further scale the military cyber security market?
-
Where is the military cyber security market heading and how can you ensure you are at the forefront of the market?
-
What are the best investment options for new product and service lines?
-
What are the key prospects for moving companies into a new growth path and C-suite?
You need to discover how this will impact the military cyber security market today, and over the next 10 years:
-
Our 455-page report provides 131 tables and 211 charts/graphs exclusively to you.
-
The report highlights key lucrative areas in the industry so you can target them – NOW.
-
It contains in-depth analysis of global, regional and national sales and growth.
-
It highlights for you the key successful trends, changes and revenue projections made by your competitors.
This report tells you TODAY how the military cyber security market will develop in the next 10 years, and in line with the variations in COVID-19 economic recession and bounce. This market is more critical now than at any point over the last 10 years.
Forecasts to 2034 and other analyses reveal commercial prospects
-
In addition to revenue forecasting to 2034, our new study provides you with recent results, growth rates, and market shares.
-
You will find original analyses, with business outlooks and developments.
-
Discover qualitative analyses (including market dynamics, drivers, opportunities, restraints and challenges), cost structure, impact of rising military cyber security prices and recent developments.
This report includes data analysis and invaluable insight into how COVID-19 will affect the industry and your company. Four COVID-19 recovery patterns and their impact, namely, “V”, “L”, “W” and “U” are discussed in this report.
Segments Covered in the Report
Market Segment by Deployment Mode
Market Segment by Component
-
Hardware
-
Software
-
Services
Market Segment by End-user
-
Army
-
Navy
-
Air Force
-
Cyber Commands
Market Segment by Security Type
-
Network Security
-
Endpoint Security
-
Application Security
-
Cloud-based Security
-
Data Security
Market Segment by Solution
-
Threat Intelligence and Response Management
-
Identity and Access Management (IAM)
-
Intrusion Detection and Prevention Systems (IDPS)
-
Security Information and Event Management (SIEM)
-
Firewall
-
Other Solutions
In addition to the revenue predictions for the overall world market and segments, you will also find revenue forecasts for four regional and 20 leading national markets:
North America
Europe
-
Germany
-
Russia
-
United Kingdom
-
France
-
Italy
-
Rest of Europe
Asia Pacific
-
China
-
Japan
-
India
-
Australia
-
South Korea
-
Rest of Asia Pacific
Latin America
-
Brazil
-
Mexico
-
Rest of Latin America
Middle East & Africa
-
GCC
-
South Africa
-
Rest of Middle East & Africa
The report also includes profiles and for some of the leading companies in the Military Cyber Security Market, 2024 to 2034, with a focus on this segment of these companies’ operations.
Leading companies and the potential for market growth
-
Booz Allen Hamilton Holding Corp.
-
CACI International Inc
-
Cisco Systems Inc.
-
Fortinet Inc
-
General Dynamics Corporation
-
GovCIO
-
Intel Corporation
-
International Business Machines Corp.
-
Leidos Holdings Inc.
-
Lockheed Martin Corporation
-
ManTech International
-
Northrop Grumman Systems Corp.
-
Raytheon Technologies Corporation
-
Thales Group
-
Viasat Inc.
Overall world revenue for Military Cyber Security Market, 2024 to 2034 in terms of value the market will surpass US$30.4 billion in 2024, our work calculates. We predict strong revenue growth through to 2034. Our work identifies which organizations hold the greatest potential. Discover their capabilities, progress, and commercial prospects, helping you stay ahead.
How will the Military Cyber Security Market, 2024 to 2034 report help you?
In summary, our 450+ page report provides you with the following knowledge:
-
Revenue forecasts to 2034 for Military Cyber Security Market, 2024 to 2034 Market, with forecasts for deployment mode, component, end-user, security type, and solution, each forecast at a global and regional level – discover the industry’s prospects, finding the most lucrative places for investments and revenues.
-
Revenue forecasts to 2034 for four regional and 20 key national markets – See forecasts for the Military Cyber Security Market, 2024 to 2034 market in North America, Europe, Asia-Pacific, Latin America and Middle East & Africa. Also forecasted is the market in the US, Canada, Brazil, Germany, France, UK, Italy, China, India, Japan, and Australia among other prominent economies.
-
Prospects for established firms and those seeking to enter the market – including company profiles for 15 of the major companies involved in the Military Cyber Security Market, 2024 to 2034.
Find quantitative and qualitative analyses with independent predictions. Receive information that only our report contains, staying informed with invaluable business intelligence.
Information found nowhere else
With our new report, you are less likely to fall behind in knowledge or miss out on opportunities. See how our work could benefit your research, analyses, and decisions. Visiongain’s study is for everybody needing commercial analyses for the Military Cyber Security Market, 2024 to 2034, market-leading companies. You will find data, trends and predictions.
ページTOPに戻る
Table of Contents
Table of Contents
1 Report Overview
1.1 Objectives of the Study
1.2 Introduction to Military Cyber Security Market
1.3 What This Report Delivers
1.4 Why You Should Read This Report
1.5 Key Questions Answered by This Analytical Report
1.6 Who Is This Report for?
1.7 Research Methodology
1.7.1 Market Definitions
1.7.2 Market Evaluation & Forecasting Methodology
1.7.3 Data Validation
1.7.3.1 Primary Research
1.7.3.2 Secondary Research
1.8 Frequently Asked Questions (FAQs)
1.9 Associated Visiongain Reports
1.10 About Visiongain
2 Executive Summary
3 Market Overview
3.1 Key Findings
3.2 Market Dynamics
3.2.1 Market Driving Factors
3.2.1.1 Advancements in Technologies such as AI, ML, and Blockchain Present Driving the Market Growth
3.2.1.2 Growing Defence Budgets Driving the Market Growth
3.2.1.3 Digital Transformation of Military Operations Driving the Market Growth
3.2.2 Market Restraining Factors
3.2.2.1 Budgetary Constraints and Resources Allocation to Potentially Impede Market Growth
3.2.2.2 Cyber Threats Poses a Significant Challenge for Military Cyber Security, Requiring Continuous Adaptation and Innovation.
3.2.2.3 Vulnerabilities in the Supply Chain, Including Third-Party Vendors and Contractors, Pose Risks of Supply Chain Attacks
3.2.3 Market Opportunities
3.2.3.1 Partnership and Collaboration Between Défense Organisation and Cybersecurity Companies
3.2.3.2 Integration of Cyber Security with Physical Security Measures Presents Opportunities to Provide Comprehensive Security Solutions
3.2.3.3 International Expansion Opportunities for the Market Player
3.3 Porter’s Five Forces Analysis
3.3.1 Bargaining Power of Suppliers (Medium)
3.3.2 Bargaining Power of Buyers (High)
3.3.3 Competitive Rivalry (Medium to High)
3.3.4 Threat from Substitutes (Low)
3.3.5 Threat of New Entrants (Low)
3.4 COVID-19 Impact Analysis
3.4.1 “V-Shaped Recovery”
3.4.2 “U-Shaped Recovery”
3.4.3 “W-Shaped Recovery”
3.4.4 “L-Shaped Recovery”
3.5 PEST Analysis
4 Military Cyber Security Market Analysis by Deployment Mode
4.1 Key Findings
4.2 Deployment Mode Segment: Market Attractiveness Index
4.3 Military Cyber Security Market Size Estimation and Forecast by Deployment Mode
4.4 Cloud-based
4.4.1 Market Size by Region, 2024-2034 (US$ Billion)
4.4.2 Market Share by Region, 2024 & 2034 (%)
4.5 On-Premise
4.5.1 Market Size by Region, 2024-2034 (US$ Billion)
4.5.2 Market Share by Region, 2024 & 2034 (%)
5 Military Cyber Security Market Analysis by Component
5.1 Key Findings
5.2 Component Segment: Market Attractiveness Index
5.3 Military Cyber Security Market Size Estimation and Forecast by Component
5.4 Hardware
5.4.1 Market Size by Region, 2024-2034 (US$ Billion)
5.4.2 Market Share by Region, 2024 & 2034 (%)
5.5 Software
5.5.1 Market Size by Region, 2024-2034 (US$ Billion)
5.5.2 Market Share by Region, 2024 & 2034 (%)
5.6 Services
5.6.1 Market Size by Region, 2024-2034 (US$ Billion)
5.6.2 Market Share by Region, 2024 & 2034 (%)
6 Military Cyber Security Market Analysis by End-User
6.1 Key Findings
6.2 End-User Segment: Market Attractiveness Index
6.3 Military Cyber Security Market Size Estimation and Forecast by End-User
6.4 Army
6.4.1 Market Size by Region, 2024-2034 (US$ Billion)
6.4.2 Market Share by Region, 2024 & 2034 (%)
6.5 Navy
6.5.1 Market Size by Region, 2024-2034 (US$ Billion)
6.5.2 Market Share by Region, 2024 & 2034 (%)
6.6 Air Force
6.6.1 Market Size by Region, 2024-2034 (US$ Billion)
6.6.2 Market Share by Region, 2024 & 2034 (%)
6.7 Cyber Commands
6.7.1 Market Size by Region, 2024-2034 (US$ Billion)
6.7.2 Market Share by Region, 2024 & 2034 (%)
7 Military Cyber Security Market Analysis by Security Type
7.1 Key Findings
7.2 Security Type Segment: Market Attractiveness Index
7.3 Military Cyber Security Market Size Estimation and Forecast by Security Type
7.4 Network Security
7.4.1 Market Size by Region, 2024-2034 (US$ Billion)
7.4.2 Market Share by Region, 2024 & 2034 (%)
7.5 Endpoint Security
7.5.1 Market Size by Region, 2024-2034 (US$ Billion)
7.5.2 Market Share by Region, 2024 & 2034 (%)
7.6 Application Security
7.6.1 Market Size by Region, 2024-2034 (US$ Billion)
7.6.2 Market Share by Region, 2024 & 2034 (%)
7.7 Cloud-based Security
7.7.1 Market Size by Region, 2024-2034 (US$ Billion)
7.7.2 Market Share by Region, 2024 & 2034 (%)
7.8 Data Security
7.8.1 Market Size by Region, 2024-2034 (US$ Billion)
7.8.2 Market Share by Region, 2024 & 2034 (%)
8 Military Cyber Security Market Analysis by Solution
8.1 Key Findings
8.2 Solution Segment: Market Attractiveness Index
8.3 Military Cyber Security Market Size Estimation and Forecast by Solution
8.4 Threat Intelligence and Response Management
8.4.1 Market Size by Region, 2024-2034 (US$ Million)
8.4.2 Market Share by Region, 2024 & 2034 (%)
8.5 Identity and Access Management (IAM)
8.5.1 Market Size by Region, 2024-2034 (US$ Million)
8.5.2 Market Share by Region, 2024 & 2034 (%)
8.6 Intrusion Detection and Prevention Systems (IDPS)
8.6.1 Market Size by Region, 2024-2034 (US$ Million)
8.6.2 Market Share by Region, 2024 & 2034 (%)
8.7 Security Information and Event Management (SIEM)
8.7.1 Market Size by Region, 2024-2034 (US$ Million)
8.7.2 Market Share by Region, 2024 & 2034 (%)
8.8 Firewall
8.8.1 Market Size by Region, 2024-2034 (US$ Million)
8.8.2 Market Share by Region, 2024 & 2034 (%)
8.9 Other Solutions
8.9.1 Market Size by Region, 2024-2034 (US$ Million)
8.9.2 Market Share by Region, 2024 & 2034 (%)
9 Military Cyber Security Market Analysis by Region
9.1 Key Findings
9.2 Regional Market Size Estimation and Forecast
10 North America Military Cyber Security Market Analysis
10.1 Key Findings
10.2 North America Military Cyber Security Market Attractiveness Index
10.3 North America Military Cyber Security Market by Country, 2024, 2029 & 2034 (US$ Billion)
10.4 North America Military Cyber Security Market Size Estimation and Forecast
10.5 North America Military Cyber Security Market Size Estimation and Forecast by Country
10.6 North America Military Cyber Security Market Size Estimation and Forecast by Deployment Mode
10.7 North America Military Cyber Security Market Size Estimation and Forecast by Component
10.8 North America Military Cyber Security Market Size Estimation and Forecast by End-User
10.9 North America Military Cyber Security Market Size Estimation and Forecast by Security Type
10.10 North America Military Cyber Security Market Size Estimation and Forecast by Solution
10.11 U.S. Military Cyber Security Market Analysis
10.12 Canada Military Cyber Security Market Analysis
11 Europe Military Cyber Security Market Analysis
11.1 Key Findings
11.2 Europe Military Cyber Security Market Attractiveness Index
11.3 Europe Military Cyber Security Market by Country, 2024, 2029 & 2034 (US$ Billion)
11.4 Europe Military Cyber Security Market Size Estimation and Forecast
11.5 Europe Military Cyber Security Market Size Estimation and Forecast by Country
11.6 Europe Military Cyber Security Market Size Estimation and Forecast by Deployment Mode
11.7 Europe Military Cyber Security Market Size Estimation and Forecast by Component
11.8 Europe Military Cyber Security Market Size Estimation and Forecast by End-User
11.9 Europe Military Cyber Security Market Size Estimation and Forecast by Security Type
11.10 Europe Military Cyber Security Market Size Estimation and Forecast by Solution
11.11 Germany Military Cyber Security Market Analysis
11.12 UK Military Cyber Security Market Analysis
11.13 France Military Cyber Security Market Analysis
11.14 Italy Military Cyber Security Market Analysis
11.15 Russia Military Cyber Security Market Analysis
11.16 Rest of Europe Military Cyber Security Market Analysis
12 Asia-Pacific Military Cyber Security Market Analysis
12.1 Key Findings
12.2 Asia-Pacific Military Cyber Security Market Attractiveness Index
12.3 Asia-Pacific Military Cyber Security Market by Country, 2024, 2029 & 2034 (US$ Billion)
12.4 Asia-Pacific Military Cyber Security Market Size Estimation and Forecast
12.5 Asia-Pacific Military Cyber Security Market Size Estimation and Forecast by Country
12.6 Asia-Pacific Military Cyber Security Market Size Estimation and Forecast by Deployment Mode
12.7 Asia-Pacific Military Cyber Security Market Size Estimation and Forecast by Component
12.8 Asia-Pacific Military Cyber Security Market Size Estimation and Forecast by End-User
12.9 Asia-Pacific Military Cyber Security Market Size Estimation and Forecast by Security Type
12.10 Asia-Pacific Military Cyber Security Market Size Estimation and Forecast by Solution
12.11 China Military Cyber Security Market Analysis
12.12 India Military Cyber Security Market Analysis
12.13 Japan Military Cyber Security Market Analysis
12.14 South Korea Military Cyber Security Market Analysis
12.15 Australia Military Cyber Security Market Analysis
12.16 Rest of Asia-Pacific Military Cyber Security Market Analysis
13 Middle East and Africa Military Cyber Security Market Analysis
13.1 Key Findings
13.2 Middle East and Africa Military Cyber Security Market Attractiveness Index
13.3 Middle East and Africa Military Cyber Security Market by Country, 2024, 2029 & 2034 (US$ Billion)
13.4 Middle East and Africa Military Cyber Security Market Size Estimation and Forecast
13.5 Middle East and Africa Military Cyber Security Market Size Estimation and Forecast by Country
13.6 Middle East and Africa Military Cyber Security Market Size Estimation and Forecast by Deployment Mode
13.7 Middle East and Africa Military Cyber Security Market Size Estimation and Forecast by Component
13.8 Middle East and Africa Military Cyber Security Market Size Estimation and Forecast by End-User
13.9 Middle East and Africa Military Cyber Security Market Size Estimation and Forecast by Security Type
13.10 Middle East and Africa Military Cyber Security Market Size Estimation and Forecast by Solution
13.11 GCC Military Cyber Security Market Analysis
13.12 South Africa Military Cyber Security Market Analysis
13.13 Rest of Middle East & Africa Military Cyber Security Market Analysis
14 Latin America Military Cyber Security Market Analysis
14.1 Key Findings
14.2 Latin America Military Cyber Security Market Attractiveness Index
14.3 Latin America Military Cyber Security Market by Country, 2024, 2029 & 2034 (US$ Billion)
14.4 Latin America Military Cyber Security Market Size Estimation and Forecast
14.5 Latin America Military Cyber Security Market Size Estimation and Forecast by Country
14.6 Latin America Military Cyber Security Market Size Estimation and Forecast by Deployment Mode
14.7 Latin America Military Cyber Security Market Size Estimation and Forecast by Component
14.8 Latin America Military Cyber Security Market Size Estimation and Forecast by End-User
14.9 Latin America Military Cyber Security Market Size Estimation and Forecast by Security Type
14.10 Latin America Military Cyber Security Market Size Estimation and Forecast by Solution
14.11 Brazil Military Cyber Security Market Analysis
14.12 Mexico Military Cyber Security Market Analysis
14.13 Rest of Latin America Military Cyber Security Market Analysis
15 Company Profiles
15.1 Competitive Landscape, 2023
15.2 Strategic Outlook
15.3 Cisco Systems Inc.
15.3.1 Company Snapshot
15.3.2 Company Overview
15.3.3 Financial Analysis
15.3.3.1 Net Revenue, 2019-2023
15.3.3.2 R&D, 2019-2023
15.3.3.3 Regional Revenue Share, 2023 (%)
15.3.3.4 Business Segment Revenue Share, 2023 (%)
15.3.4 Product Benchmarking
15.3.5 Strategic Outlook
15.4 General Dynamics Corporation
15.4.1 Company Snapshot
15.4.2 Company Overview
15.4.3 Financial Analysis
15.4.3.1 Net Revenue, 2018-2022
15.4.3.2 R&D, 2018-2022
15.4.3.3 Regional Revenue Share, 2022 (%)
15.4.3.4 Business Segment Revenue Share, 2022 (%)
15.4.4 Product Benchmarking
15.4.5 Strategic Outlook
15.5 International Business Machines Corp.
15.5.1 Company Snapshot
15.5.2 Company Overview
15.5.3 Financial Analysis
15.5.3.1 Net Revenue, 2018-2022
15.5.3.2 R&D, 2018-2022
15.5.3.3 Regional Revenue Share, 2022 (%)
15.5.3.4 Business Segment Revenue Share, 2022 (%)
15.5.4 Product Benchmarking
15.5.5 Strategic Outlook
15.6 Leidos Holdings Inc.
15.6.1 Company Snapshot
15.6.2 Company Overview
15.6.3 Financial Analysis
15.6.3.1 Net Revenue, 2018-2022
15.6.3.2 R&D, 2018-2022
15.6.3.3 Regional Revenue Share, 2022 (%)
15.6.3.4 Business Segment Revenue Share, 2022 (%)
15.6.4 Product Benchmarking
15.6.5 Strategic Outlook
15.7 Lockheed Martin Corporation
15.7.1 Company Snapshot
15.7.2 Company Overview
15.7.3 Financial Analysis
15.7.3.1 Net Revenue, 2018-2022
15.7.3.2 R&D, 2018-2022
15.7.3.3 Regional Revenue Share, 2022 (%)
15.7.3.4 Business Segment Revenue Share, 2022 (%)
15.7.4 Product Benchmarking
15.7.5 Strategic Outlook
15.8 Northrop Grumman Systems Corp.
15.8.1 Company Snapshot
15.8.2 Company Overview
15.8.3 Financial Analysis
15.8.3.1 Net Revenue, 2018-2022
15.8.3.2 R&D, 2018-2022
15.8.3.3 Regional Revenue Share, 2022 (%)
15.8.3.4 Business Segment Revenue Share, 2022 (%)
15.8.4 Product Benchmarking
15.8.5 Strategic Outlook
15.9 Raytheon Technologies Corporation
15.9.1 Company Snapshot
15.9.2 Company Overview
15.9.3 Financial Analysis
15.9.3.1 Net Revenue, 2019-2023
15.9.3.2 R&D, 2019-2023
15.9.3.3 Regional Revenue Share, 2023 (%)
15.9.3.4 Business Segment Revenue Share, 2023 (%)
15.9.4 Product Benchmarking
15.9.5 Strategic Outlook
15.10 Thales Group
15.10.1 Company Snapshot
15.10.2 Company Overview
15.10.3 Financial Analysis
15.10.3.1 Net Revenue, 2018-2022
15.10.4 Product Benchmarking
15.10.5 Strategic Outlook
15.11 Viasat Inc.
15.11.1 Company Snapshot
15.11.2 Company Overview
15.11.3 Financial Analysis
15.11.3.1 Net Revenue, 2019-2023
15.11.3.2 R&D, 2019-2023
15.11.3.3 Regional Revenue Share, 2023 (%)
15.11.3.4 Business Segment Revenue Share, 2023 (%)
15.11.4 Product Benchmarking
15.11.5 Strategic Outlook
15.12 Fortinet, Inc.
15.12.1 Company Snapshot
15.12.2 Company Overview
15.12.3 Financial Analysis
15.12.3.1 Net Revenue, 2019-2023
15.12.3.2 R&D, 2019-2023
15.12.3.3 Regional Revenue Share, 2022 (%)
15.12.3.4 Business Segment Revenue Share, 2022 (%)
15.12.4 Product Benchmarking
15.12.5 Strategic Outlook
15.13 Booz Allen Hamilton Holding Corp.
15.13.1 Company Snapshot
15.13.2 Company Overview
15.13.3 Financial Analysis
15.13.3.1 Net Revenue, 2019-2023
15.13.4 Product Benchmarking
15.13.5 Strategic Outlook
15.14 Intel Corporation
15.14.1 Company Snapshot
15.14.2 Company Overview
15.14.3 Financial Analysis
15.14.3.1 Net Revenue, 2018-2022
15.14.3.2 R&D, 2018-2022
15.14.3.3 Business Segment Revenue Share, 2022 (%)
15.14.4 Product Benchmarking
15.14.5 Strategic Outlook
15.15 GovCIO
15.15.1 Company Snapshot
15.15.2 Company Overview
15.15.3 Product Benchmarking
15.16 ManTech International
15.16.1 Company Snapshot
15.16.2 Company Overview
15.16.3 Product Benchmarking
15.16.4 Strategic Outlook
15.17 CACI International Inc.
15.17.1 Company Snapshot
15.17.2 Company Overview
15.17.3 Financial Analysis
15.17.3.1 Net Revenue, 2019-2023
15.17.4 Product Benchmarking
15.17.5 Strategic Outlook
16 Conclusion and Recommendations
16.1 Concluding Remarks from Visiongain
16.2 Recommendations for Market Players
ページTOPに戻る
List of Tables/Graphs
List of Tables
Table 1 Military Cyber Security Market Snapshot, 2024 & 2034 (US$ Billion, CAGR %)
Table 2 Global Military Cyber Security Market by Region, 2024-2034 (US$ Bn, AGR (%), CAGR (%)) (V-Shaped Recovery Scenario)
Table 3 Global Military Cyber Security Market by Region, 2024-2034 (US$ Bn, AGR (%), CAGR (%)) (U-Shaped Recovery Scenario)
Table 4 Global Military Cyber Security Market by Region, 2024-2034 (US$ Bn, AGR (%), CAGR (%)) (W-Shaped Recovery Scenario)
Table 5 Global Military Cyber Security Market by Region, 2024-2034 (US$ Bn, AGR (%), CAGR (%)) (L-Shaped Recovery Scenario)
Table 6 Global Military Cyber Security Market by Deployment Mode, 2024-2034 (US$ Bn, AGR (%), CAGR (%))
Table 7 Cloud-based Market by Region, 2024-2034 (US$ Bn, AGR (%), CAGR (%))
Table 8 On-Premise Market by Region, 2024-2034 (US$ Bn, AGR (%), CAGR (%))
Table 9 Global Military Cyber Security Market by Component, 2024-2034 (US$ Bn, AGR (%), CAGR (%))
Table 10 Hardware Market by Region, 2024-2034 (US$ Bn, AGR (%), CAGR (%))
Table 11 Software Market by Region, 2024-2034 (US$ Bn, AGR (%), CAGR (%))
Table 12 Services Market by Region, 2024-2034 (US$ Bn, AGR (%), CAGR (%))
Table 13 Global Military Cyber Security Market by End-User, 2024-2034 (US$ Bn, AGR (%), CAGR (%))
Table 14 Army Market by Region, 2024-2034 (US$ Bn, AGR (%), CAGR (%))
Table 15 Navy Market by Region, 2024-2034 (US$ Bn, AGR (%), CAGR (%))
Table 16 Air Force Market by Region, 2024-2034 (US$ Bn, AGR (%), CAGR (%))
Table 17 Cyber Commands Market by Region, 2024-2034 (US$ Bn, AGR (%), CAGR (%))
Table 18 Global Military Cyber Security Market by Security Type, 2024-2034 (US$ Bn, AGR (%), CAGR (%))
Table 19 Network Security Market by Region, 2024-2034 (US$ Bn, AGR (%), CAGR (%))
Table 20 Endpoint Security Market by Region, 2024-2034 (US$ Bn, AGR (%), CAGR (%))
Table 21 Application Security Market by Region, 2024-2034 (US$ Bn, AGR (%), CAGR (%))
Table 22 Cloud-based Security Market by Region, 2024-2034 (US$ Bn, AGR (%), CAGR (%))
Table 23 Data Security Market by Region, 2024-2034 (US$ Bn, AGR (%), CAGR (%))
Table 24 Global Military Cyber Security Market by Solution, 2024-2034 (US$ Bn, AGR (%), CAGR (%))
Table 25 Threat Intelligence and Response Management Market by Region, 2024-2034 (US$ Bn, AGR (%), CAGR (%))
Table 26 Identity and Access Management (IAM) Market by Region, 2024-2034 (US$ Bn, AGR (%), CAGR (%))
Table 27 Intrusion Detection and Prevention Systems (IDPS) Market by Region, 2024-2034 (US$ Bn, AGR (%), CAGR (%))
Table 28 Security Information and Event Management (SIEM) Market by Region, 2024-2034 (US$ Bn, AGR (%), CAGR (%))
Table 29 Firewall Market by Region, 2024-2034 (US$ Bn, AGR (%), CAGR (%))
Table 30 Other Solutions Market by Region, 2024-2034 (US$ Bn, AGR (%), CAGR (%))
Table 31 Global Military Cyber Security Market by Region, 2024-2034 (US$ Bn, AGR (%), CAGR (%))
Table 32 North America Military Cyber Security Market by Value, 2024-2034 (US$ Bn, AGR (%), CAGR (%))
Table 33 North America Military Cyber Security Market by Country, 2024-2034 (US$ Bn, AGR (%), CAGR (%))
Table 34 North America Military Cyber Security Market by Deployment Mode, 2024-2034 (US$ Bn, AGR (%), CAGR (%))
Table 35 North America Military Cyber Security Market by Component, 2024-2034 (US$ Bn, AGR (%), CAGR (%))
Table 36 North America Military Cyber Security Market by End-User, 2024-2034 (US$ Bn, AGR (%), CAGR (%))
Table 37 North America Military Cyber Security Market by Security Type, 2024-2034 (US$ Bn, AGR (%), CAGR (%))
Table 38 North America Military Cyber Security Market by Solution, 2024-2034 (US$ Bn, AGR (%), CAGR (%))
Table 39 US Military Cyber Security Market by Value, 2024-2034 (US$ Bn, AGR (%), CAGR (%))
Table 40 Canada Military Cyber Security Market by Value, 2024-2034 (US$ Bn, AGR (%), CAGR (%))
Table 41 Europe Military Cyber Security Market by Value, 2024-2034 (US$ Bn, AGR (%), CAGR (%))
Table 42 Europe Military Cyber Security Market by Country, 2024-2034 (US$ Bn, AGR (%), CAGR (%))
Table 43 Europe Military Cyber Security Market by Deployment Mode, 2024-2034 (US$ Bn, AGR (%), CAGR (%))
Table 44 Europe Military Cyber Security Market by Component, 2024-2034 (US$ Bn, AGR (%), CAGR (%))
Table 45 Europe Military Cyber Security Market by End-User, 2024-2034 (US$ Bn, AGR (%), CAGR (%))
Table 46 Europe Military Cyber Security Market by Security Type, 2024-2034 (US$ Bn, AGR (%), CAGR (%))
Table 47 Europe Military Cyber Security Market by Solution, 2024-2034 (US$ Bn, AGR (%), CAGR (%))
Table 48 Germany Military Cyber Security Market by Value, 2024-2034 (US$ Bn, AGR (%), CAGR (%))
Table 49 UK Military Cyber Security Market by Value, 2024-2034 (US$ Bn, AGR (%), CAGR (%))
Table 50 France Military Cyber Security Market by Value, 2024-2034 (US$ Bn, AGR (%), CAGR (%))
Table 51 Italy Military Cyber Security Market by Value, 2024-2034 (US$ Bn, AGR (%), CAGR (%))
Table 52 Russia Military Cyber Security Market by Value, 2024-2034 (US$ Bn, AGR (%), CAGR (%))
Table 53 Rest of Europe Military Cyber Security Market by Value, 2024-2034 (US$ Bn, AGR (%), CAGR (%))
Table 54 Asia-Pacific Military Cyber Security Market by Value, 2024-2034 (US$ Bn, AGR (%), CAGR (%))
Table 55 Asia-Pacific Military Cyber Security Market by Country, 2024-2034 (US$ Bn, AGR (%), CAGR (%))
Table 56 Asia-Pacific Military Cyber Security Market by Deployment Mode, 2024-2034 (US$ Bn, AGR (%), CAGR (%))
Table 57 Asia-Pacific Military Cyber Security Market by Component, 2024-2034 (US$ Bn, AGR (%), CAGR (%))
Table 58 Asia-Pacific Military Cyber Security Market by End-User, 2024-2034 (US$ Bn, AGR (%), CAGR (%))
Table 59 Asia-Pacific Military Cyber Security Market by Security Type, 2024-2034 (US$ Bn, AGR (%), CAGR (%))
Table 60 Asia-Pacific Military Cyber Security Market by Solution, 2024-2034 (US$ Bn, AGR (%), CAGR (%))
Table 61 China Military Cyber Security Market by Value, 2024-2034 (US$ Bn, AGR (%), CAGR (%))
Table 62 India Military Cyber Security Market by Value, 2024-2034 (US$ Bn, AGR (%), CAGR (%))
Table 63 Japan Military Cyber Security Market by Value, 2024-2034 (US$ Bn, AGR (%), CAGR (%))
Table 64 South Korea Military Cyber Security Market by Value, 2024-2034 (US$ Bn, AGR (%), CAGR (%))
Table 65 Australia Military Cyber Security Market by Value, 2024-2034 (US$ Bn, AGR (%), CAGR (%))
Table 66 Rest of Asia-Pacific Military Cyber Security Market by Value, 2024-2034 (US$ Bn, AGR (%), CAGR (%))
Table 67 Middle East & Africa Military Cyber Security Market by Value, 2024-2034 (US$ Bn, AGR (%), CAGR (%))
Table 68 Middle East & Africa Military Cyber Security Market by Country, 2024-2034 (US$ Bn, AGR (%), CAGR (%))
Table 69 Middle East & Africa Military Cyber Security Market by Deployment Mode, 2024-2034 (US$ Bn, AGR (%), CAGR (%))
Table 70 Middle East & Africa Military Cyber Security Market by Component, 2024-2034 (US$ Bn, AGR (%), CAGR (%))
Table 71 Middle East & Africa Military Cyber Security Market by End-User, 2024-2034 (US$ Bn, AGR (%), CAGR (%))
Table 72 Middle East & Africa Military Cyber Security Market by Security Type, 2024-2034 (US$ Bn, AGR (%), CAGR (%))
Table 73 Middle East & Africa Military Cyber Security Market by Solution, 2024-2034 (US$ Bn, AGR (%), CAGR (%))
Table 74 GCC Military Cyber Security Market by Value, 2024-2034 (US$ Bn, AGR (%), CAGR (%))
Table 75 South Africa Military Cyber Security Market by Value, 2024-2034 (US$ Bn, AGR (%), CAGR (%))
Table 76 Rest of Middle East & Africa Military Cyber Security Market by Value, 2024-2034 (US$ Bn, AGR (%), CAGR (%))
Table 77 Latin America Military Cyber Security Market by Value, 2024-2034 (US$ Bn, AGR (%), CAGR (%))
Table 78 Latin America Military Cyber Security Market by Country, 2024-2034 (US$ Bn, AGR (%), CAGR (%))
Table 79 Latin America Military Cyber Security Market by Deployment Mode, 2024-2034 (US$ Bn, AGR (%), CAGR (%))
Table 80 Latin America Military Cyber Security Market by Component, 2024-2034 (US$ Bn, AGR (%), CAGR (%))
Table 81 Latin America Military Cyber Security Market by End-User, 2024-2034 (US$ Bn, AGR (%), CAGR (%))
Table 82 Latin America Military Cyber Security Market by Security Type, 2024-2034 (US$ Bn, AGR (%), CAGR (%))
Table 83 Latin America Military Cyber Security Market by Solution, 2024-2034 (US$ Bn, AGR (%), CAGR (%))
Table 84 Brazil Military Cyber Security Market by Value, 2024-2034 (US$ Bn, AGR (%), CAGR (%))
Table 85 Mexico Military Cyber Security Market by Value, 2024-2034 (US$ Bn, AGR (%), CAGR (%))
Table 86 Rest of Latin America Military Cyber Security Market by Value, 2024-2034 (US$ Bn, AGR (%), CAGR (%))
Table 87 Strategic Outlook - Contract
Table 88 Cisco Systems Inc.: Key Details, (CEO, HQ, Revenue, Founded, No. of Employees, Company Type, Website, Business Segment)
Table 89 Cisco Systems Inc.: Product Benchmarking
Table 90 Cisco Systems Inc.: Strategic Outlook
Table 91 General Dynamics Corporation: Key Details, (CEO, HQ, Revenue, Founded, No. of Employees, Company Type, Website, Business Segment)
Table 92 General Dynamics Corporation: Product Benchmarking
Table 93 General Dynamics Corporation: Strategic Outlook
Table 94 International Business Machines Corp.: Key Details, (CEO, HQ, Revenue, Founded, No. of Employees, Company Type, Website, Business Segment)
Table 95 International Business Machines Corp.: Product Benchmarking
Table 96 International Business Machines Corp.: Strategic Outlook
Table 97 Leidos Holdings Inc.: Key Details, (CEO, HQ, Revenue, Founded, No. of Employees, Company Type, Website, Business Segment)
Table 98 Leidos Holdings Inc.: Product Benchmarking
Table 99 Leidos Holdings Inc.: Strategic Outlook
Table 100 Lockheed Martin Corporation: Key Details, (CEO, HQ, Revenue, Founded, No. of Employees, Company Type, Website, Business Segment)
Table 101 Lockheed Martin Corporation: Product Benchmarking
Table 102 Lockheed Martin Corporation: Strategic Outlook
Table 103 Northrop Grumman Systems Corp.: Key Details, (CEO, HQ, Revenue, Founded, No. of Employees, Company Type, Website, Business Segment)
Table 104 Northrop Grumman Systems Corp.: Product Benchmarking
Table 105 Northrop Grumman Systems Corp.: Strategic Outlook
Table 106 Raytheon Technologies Corporation: Key Details, (CEO, HQ, Revenue, Founded, No. of Employees, Company Type, Website, Business Segment)
Table 107 Raytheon Technologies Corporation: Product Benchmarking
Table 108 Raytheon Technologies Corporation: Strategic Outlook
Table 109 Thales Group: Key Details, (CEO, HQ, Revenue, Founded, No. of Employees, Company Type, Website, Business Segment)
Table 110 Thales Group: Product Benchmarking
Table 111 Thales Group: Strategic Outlook
Table 112 Viasat: Key Details, (CEO, HQ, Revenue, Founded, No. of Employees, Company Type, Website, Business Segment)
Table 113 Viasat: Product Benchmarking
Table 114 Viasat: Strategic Outlook
Table 115 Fortinet Inc: Key Details, (CEO, HQ, Revenue, Founded, No. of Employees, Company Type, Website, Business Segment)
Table 116 Fortinet Inc: Product Benchmarking
Table 117 Fortinet Inc: Strategic Outlook
Table 118 Booz Allen Hamilton Holding Corp.: Key Details, (CEO, HQ, Revenue, Founded, No. of Employees, Company Type, Website, Business Segment)
Table 119 Booz Allen Hamilton Holding Corp.: Product Benchmarking
Table 120 Booz Allen Hamilton Holding Corp.: Strategic Outlook
Table 121 Intel Corporation: Key Details, (CEO, HQ, Revenue, Founded, No. of Employees, Company Type, Website, Business Segment)
Table 122 Intel Corporation: Product Benchmarking
Table 123 Intel Corporation: Strategic Outlook
Table 124 GovCIO: Key Details, (CEO, HQ, Revenue, Founded, No. of Employees, Company Type, Website, Business Segment)
Table 125 GovCIO: Product Benchmarking
Table 126 ManTech International Corporation: Key Details, (CEO, HQ, Revenue, Founded, No. of Employees, Company Type, Website, Business Segment)
Table 127 ManTech International Corporation: Product Benchmarking
Table 128 ManTech International Corporation: Strategic Outlook
Table 129 CACI International Inc: Key Details, (CEO, HQ, Revenue, Founded, No. of Employees, Company Type, Website, Business Segment)
Table 130 CACI International Inc: Product Benchmarking
Table 131 CACI International Inc: Strategic Outlook
List of Figures
Figure 1 Military Cyber Security Market Segmentation
Figure 2 Military Cyber Security Market by Deployment Mode: Market Attractiveness Index
Figure 3 Military Cyber Security Market by Component: Market Attractiveness Index
Figure 4 Military Cyber Security Market by End-User: Market Attractiveness Index
Figure 5 Military Cyber Security Market by Security Type: Market Attractiveness Index
Figure 6 Military Cyber Security Market by Solution: Market Attractiveness Index
Figure 7 Military Cyber Security Market Attractiveness Index by Region
Figure 8 Military Cyber Security Market: Market Dynamics
Figure 9 Military Cyber Security Market: Porter’s Five Forces Analysis
Figure 10 Global Military Cyber Security Market Share Forecast by COVID, 2024-2034 (%)
Figure 11 Global Military Cyber Security Market by Region, 2024-2034 (US$ Bn, AGR (%)) (V-Shaped Recovery Scenario)
Figure 12 Global Military Cyber Security Market by Region, 2024-2034 (US$ Bn, AGR (%)) (U-Shaped Recovery Scenario)
Figure 13 Global Military Cyber Security Market by Region, 2024-2034 (US$ Bn, AGR (%)) (W-Shaped Recovery Scenario)
Figure 14 Global Military Cyber Security Market by Region, 2024-2034 (US$ Bn, AGR (%)) (L-Shaped Recovery Scenario)
Figure 15 Military Cyber Security Market: PEST Analysis
Figure 16 Military Cyber Security Market by Deployment Mode: Market Attractiveness Index
Figure 17 Global Military Cyber Security Market by Deployment Mode, 2024-2034 (US$ Bn, AGR (%))
Figure 18 Military Cyber Security Market Share Forecast by Deployment Mode, 2024, 2029, 2034 (%)
Figure 19 Cloud-based Market by Region, 2024-2034 (US$ Bn, AGR (%))
Figure 20 Cloud-based Market Share Forecast by Region, 2024 & 2034 (%)
Figure 21 On-Premise Market by Region, 2024-2034 (US$ Bn, AGR (%))
Figure 22 On-Premise Market Share Forecast by Region, 2024 & 2034 (%)
Figure 23 Military Cyber Security Market by Component: Market Attractiveness Index
Figure 24 Global Military Cyber Security Market by Component, 2024-2034 (US$ Bn, AGR (%))
Figure 25 Military Cyber Security Market Share Forecast by Component, 2024, 2029, 2034 (%)
Figure 26 Hardware Market by Region, 2024-2034 (US$ Bn, AGR (%))
Figure 27 Hardware Market Share Forecast by Region, 2024 & 2034 (%)
Figure 28 Software Market by Region, 2024-2034 (US$ Bn, AGR (%))
Figure 29 Software Market Share Forecast by Region, 2024 & 2034 (%)
Figure 30 Services Market by Region, 2024-2034 (US$ Bn, AGR (%))
Figure 31 Services Market Share Forecast by Region, 2024 & 2034 (%)
Figure 32 Military Cyber Security Market by End-User: Market Attractiveness Index
Figure 33 Global Military Cyber Security Market by End-User, 2024-2034 (US$ Bn, AGR (%))
Figure 34 Military Cyber Security Market Share Forecast by End-User, 2024, 2029, 2034 (%)
Figure 35 Army Market by Region, 2024-2034 (US$ Bn, AGR (%))
Figure 36 Army Market Share Forecast by Region, 2024 & 2034 (%)
Figure 37 Navy Market by Region, 2024-2034 (US$ Bn, AGR (%))
Figure 38 Navy Market Share Forecast by Region, 2024 & 2034 (%)
Figure 39 Air Force Market by Region, 2024-2034 (US$ Bn, AGR (%))
Figure 40 Air Force Market Share Forecast by Region, 2024 & 2034 (%)
Figure 41 Cyber Commands Market by Region, 2024-2034 (US$ Bn, AGR (%))
Figure 42 Cyber Commands Market Share Forecast by Region, 2024 & 2034 (%)
Figure 43 Military Cyber Security Market by Security Type: Market Attractiveness Index
Figure 44 Global Military Cyber Security Market by Security Type, 2024-2034 (US$ Bn, AGR (%))
Figure 45 Military Cyber Security Market Share Forecast by Security Type, 2024, 2029, 2034 (%)
Figure 46 Network Security Market by Region, 2024-2034 (US$ Bn, AGR (%))
Figure 47 Network Security Market Share Forecast by Region, 2024 & 2034 (%)
Figure 48 Endpoint Security Market by Region, 2024-2034 (US$ Bn, AGR (%))
Figure 49 Endpoint Security Market Share Forecast by Region, 2024 & 2034 (%)
Figure 50 Application Security Market by Region, 2024-2034 (US$ Bn, AGR (%))
Figure 51 Application Security Market Share Forecast by Region, 2024 & 2034 (%)
Figure 52 Cloud-based Security Market by Region, 2024-2034 (US$ Bn, AGR (%))
Figure 53 Cloud-based Security Market Share Forecast by Region, 2024 & 2034 (%)
Figure 54 Data Security Market by Region, 2024-2034 (US$ Bn, AGR (%))
Figure 55 Data Security Market Share Forecast by Region, 2024 & 2034 (%)
Figure 56 Military Cyber Security Market by Solution: Market Attractiveness Index
Figure 57 Global Military Cyber Security Market by Solution, 2024-2034 (US$ Bn, AGR (%))
Figure 58 Military Cyber Security Market Share Forecast by Solution, 2024, 2029, 2034 (%)
Figure 59 Threat Intelligence and Response Management Market by Region, 2024-2034 (US$ Bn, AGR (%))
Figure 60 Threat Intelligence and Response Management Market Share Forecast by Region, 2024 & 2034 (%)
Figure 61 Identity and Access Management (IAM) Market by Region, 2024-2034 (US$ Bn, AGR (%))
Figure 62 Identity and Access Management (IAM) Market Share Forecast by Region, 2024 & 2034 (%)
Figure 63 Intrusion Detection and Prevention Systems (IDPS) Market by Region, 2024-2034 (US$ Bn, AGR (%))
Figure 64 Intrusion Detection and Prevention Systems (IDPS) Market Share Forecast by Region, 2024 & 2034 (%)
Figure 65 Security Information and Event Management (SIEM) Market by Region, 2024-2034 (US$ Bn, AGR (%))
Figure 66 Security Information and Event Management (SIEM) Market Share Forecast by Region, 2024 & 2034 (%)
Figure 67 Firewall Market by Region, 2024-2034 (US$ Bn, AGR (%))
Figure 68 Firewall Market Share Forecast by Region, 2024 & 2034 (%)
Figure 69 Other Solutions Market by Region, 2024-2034 (US$ Bn, AGR (%))
Figure 70 Other Solutions Market Share Forecast by Region, 2024 & 2034 (%)
Figure 71 Military Cyber Security Market Forecast by Region 2024 and 2034 (Revenue, CAGR%)
Figure 72 Military Cyber Security Market Share Forecast by Region 2024, 2029, 2034 (%)
Figure 73 Global Military Cyber Security Market by Region, 2024-2034 (US$ Bn, AGR (%))
Figure 74 North America Military Cyber Security Market Attractiveness Index
Figure 75 North America Military Cyber Security Market by Region, 2024, 2029 & 2034 (US$ Billion)
Figure 76 North America Military Cyber Security Market by Value, 2024-2034 (US$ Bn, AGR (%))
Figure 77 North America Military Cyber Security Market by Country, 2024-2034 (US$ Bn, AGR (%))
Figure 78 North America Military Cyber Security Market Share Forecast by Country, 2024 & 2034 (%)
Figure 79 North America Military Cyber Security Market by Deployment Mode, 2024-2034 (US$ Bn, AGR (%))
Figure 80 North America Military Cyber Security Market Share Forecast Deployment Mode, 2024 & 2034 (%)
Figure 81 North America Military Cyber Security Market by Component, 2024-2034 (US$ Bn, AGR (%))
Figure 82 North America Military Cyber Security Market Share Forecast by Component, 2024 & 2034 (%)
Figure 83 North America Military Cyber Security Market by End-User, 2024-2034 (US$ Bn, AGR (%))
Figure 84 North America Military Cyber Security Market Share Forecast by End-User, 2024 & 2034 (%)
Figure 85 North America Military Cyber Security Market by Security Type, 2024-2034 (US$ Bn, AGR (%))
Figure 86 North America Military Cyber Security Market Share Forecast by Security Type, 2024 & 2034 (%)
Figure 87 North America Military Cyber Security Market by Solution, 2024-2034 (US$ Bn, AGR (%))
Figure 88 North America Military Cyber Security Market Share Forecast by Solution, 2024 & 2034 (%)
Figure 89 US Military Cyber Security Market by Value, 2024-2034 (US$ Bn, AGR (%))
Figure 90 Canada Military Cyber Security Market by Value, 2024-2034 (US$ Bn, AGR (%))
Figure 91 Europe Military Cyber Security Market Attractiveness Index
Figure 92 Europe Military Cyber Security Market by Region, 2024, 2029 & 2034 (US$ Billion)
Figure 93 Europe Military Cyber Security Market by Value, 2024-2034 (US$ Bn, AGR (%))
Figure 94 Europe Military Cyber Security Market by Country, 2024-2034 (US$ Bn, AGR (%))
Figure 95 Europe Military Cyber Security Market Share Forecast by Country, 2024 & 2034 (%)
Figure 96 Europe Military Cyber Security Market by Deployment Mode, 2024-2034 (US$ Bn, AGR (%))
Figure 97 Europe Military Cyber Security Market Share Forecast Deployment Mode, 2024 & 2034 (%)
Figure 98 Europe Military Cyber Security Market by Component, 2024-2034 (US$ Bn, AGR (%))
Figure 99 Europe Military Cyber Security Market Share Forecast by Component, 2024 & 2034 (%)
Figure 100 Europe Military Cyber Security Market by End-User, 2024-2034 (US$ Bn, AGR (%))
Figure 101 Europe Military Cyber Security Market Share Forecast by End-User, 2024 & 2034 (%)
Figure 102 Europe Military Cyber Security Market by Security Type, 2024-2034 (US$ Bn, AGR (%))
Figure 103 Europe Military Cyber Security Market Share Forecast by Security Type, 2024 & 2034 (%)
Figure 104 Europe Military Cyber Security Market by Solution, 2024-2034 (US$ Bn, AGR (%))
Figure 105 Europe Military Cyber Security Market Share Forecast by Solution, 2024 & 2034 (%)
Figure 106 Germany Military Cyber Security Market by Value, 2024-2034 (US$ Bn, AGR (%))
Figure 107 UK Military Cyber Security Market by Value, 2024-2034 (US$ Bn, AGR (%))
Figure 108 France Military Cyber Security Market by Value, 2024-2034 (US$ Bn, AGR (%))
Figure 109 Italy Military Cyber Security Market by Value, 2024-2034 (US$ Bn, AGR (%))
Figure 110 Russia Military Cyber Security Market by Value, 2024-2034 (US$ Bn, AGR (%))
Figure 111 Rest of Europe Military Cyber Security Market by Value, 2024-2034 (US$ Bn, AGR (%))
Figure 112 Asia-Pacific Military Cyber Security Market Attractiveness Index
Figure 113 Asia-Pacific Military Cyber Security Market by Region, 2024, 2029 & 2034 (US$ Billion)
Figure 114 Asia-Pacific Military Cyber Security Market by Value, 2024-2034 (US$ Bn, AGR (%))
Figure 115 Asia-Pacific Military Cyber Security Market by Country, 2024-2034 (US$ Bn, AGR (%))
Figure 116 Asia-Pacific Military Cyber Security Market Share Forecast by Country, 2024 & 2034 (%)
Figure 117 Asia-Pacific Military Cyber Security Market by Deployment Mode, 2024-2034 (US$ Bn, AGR (%))
Figure 118 Asia-Pacific Military Cyber Security Market Share Forecast Deployment Mode, 2024 & 2034 (%)
Figure 119 Asia-Pacific Military Cyber Security Market by Component, 2024-2034 (US$ Bn, AGR (%))
Figure 120 Asia-Pacific Military Cyber Security Market Share Forecast by Component, 2024 & 2034 (%)
Figure 121 Asia-Pacific Military Cyber Security Market by End-User, 2024-2034 (US$ Bn, AGR (%))
Figure 122 Asia-Pacific Military Cyber Security Market Share Forecast by End-User, 2024 & 2034 (%)
Figure 123 Asia-Pacific Military Cyber Security Market by Security Type, 2024-2034 (US$ Bn, AGR (%))
Figure 124 Asia-Pacific Military Cyber Security Market Share Forecast by Security Type, 2024 & 2034 (%)
Figure 125 Asia-Pacific Military Cyber Security Market by Solution, 2024-2034 (US$ Bn, AGR (%))
Figure 126 Asia-Pacific Military Cyber Security Market Share Forecast by Solution, 2024 & 2034 (%)
Figure 127 China Military Cyber Security Market by Value, 2024-2034 (US$ Bn, AGR (%))
Figure 128 India Military Cyber Security Market by Value, 2024-2034 (US$ Bn, AGR (%))
Figure 129 Japan Military Cyber Security Market by Value, 2024-2034 (US$ Bn, AGR (%))
Figure 130 South Korea Military Cyber Security Market by Value, 2024-2034 (US$ Bn, AGR (%))
Figure 131 Australia Military Cyber Security Market by Value, 2024-2034 (US$ Bn, AGR (%))
Figure 132 Rest of Asia-Pacific Military Cyber Security Market by Value, 2024-2034 (US$ Bn, AGR (%))
Figure 133 Middle East and Africa Military Cyber Security Market Attractiveness Index
Figure 134 Middle East and Africa Military Cyber Security Market by Region, 2024, 2029 & 2034 (US$ Billion)
Figure 135 Middle East & Africa Military Cyber Security Market by Value, 2024-2034 (US$ Bn, AGR (%))
Figure 136 Middle East & Africa Military Cyber Security Market by Country, 2024-2034 (US$ Bn, AGR (%))
Figure 137 Middle East and Africa Military Cyber Security Market Share Forecast by Country, 2024 & 2034 (%)
Figure 138 Middle East & Africa Military Cyber Security Market by Deployment Mode, 2024-2034 (US$ Bn, AGR (%))
Figure 139 Middle East and Africa Military Cyber Security Market Share Forecast Deployment Mode, 2024 & 2034 (%)
Figure 140 Middle East & Africa Military Cyber Security Market by Component, 2024-2034 (US$ Bn, AGR (%))
Figure 141 Middle East and Africa Military Cyber Security Market Share Forecast by Component, 2024 & 2034 (%)
Figure 142 Middle East & Africa Military Cyber Security Market by End-User, 2024-2034 (US$ Bn, AGR (%))
Figure 143 Middle East and Africa Military Cyber Security Market Share Forecast by End-User, 2024 & 2034 (%)
Figure 144 Middle East & Africa Military Cyber Security Market by Security Type, 2024-2034 (US$ Bn, AGR (%))
Figure 145 Middle East and Africa Military Cyber Security Market Share Forecast by Security Type, 2024 & 2034 (%)
Figure 146 Middle East & Africa Military Cyber Security Market by Solution, 2024-2034 (US$ Bn, AGR (%))
Figure 147 Middle East and Africa Military Cyber Security Market Share Forecast by Solution, 2024 & 2034 (%)
Figure 148 GCC Military Cyber Security Market by Value, 2024-2034 (US$ Bn, AGR (%))
Figure 149 South Africa Military Cyber Security Market by Value, 2024-2034 (US$ Bn, AGR (%))
Figure 150 Rest of Middle East & Africa Military Cyber Security Market by Value, 2024-2034 (US$ Bn, AGR (%))
Figure 151 Latin America Military Cyber Security Market Attractiveness Index
Figure 152 Latin America Military Cyber Security Market by Region, 2024, 2029 & 2034 (US$ Billion)
Figure 153 Latin America Military Cyber Security Market by Value, 2024-2034 (US$ Bn, AGR (%))
Figure 154 Latin America Military Cyber Security Market by Country, 2024-2034 (US$ Bn, AGR (%))
Figure 155 Latin America Military Cyber Security Market Share Forecast by Country, 2024 & 2034 (%)
Figure 156 Latin America Military Cyber Security Market by Deployment Mode, 2024-2034 (US$ Bn, AGR (%))
Figure 157 Latin America Military Cyber Security Market Share Forecast Deployment Mode, 2024 & 2034 (%)
Figure 158 Latin America Military Cyber Security Market by Component, 2024-2034 (US$ Bn, AGR (%))
Figure 159 Latin America Military Cyber Security Market Share Forecast by Component, 2024 & 2034 (%)
Figure 160 Latin America Military Cyber Security Market by End-User, 2024-2034 (US$ Bn, AGR (%))
Figure 161 Latin America Military Cyber Security Market Share Forecast by End-User, 2024 & 2034 (%)
Figure 162 Latin America Military Cyber Security Market by Security Type, 2024-2034 (US$ Bn, AGR (%))
Figure 163 Latin America Military Cyber Security Market Share Forecast by Security Type, 2024 & 2034 (%)
Figure 164 Latin America Military Cyber Security Market by Solution, 2024-2034 (US$ Bn, AGR (%))
Figure 165 Latin America Military Cyber Security Market Share Forecast by Solution, 2024 & 2034 (%)
Figure 166 Brazil Military Cyber Security Market by Value, 2024-2034 (US$ Bn, AGR (%))
Figure 167 Mexico Military Cyber Security Market by Value, 2024-2034 (US$ Bn, AGR (%))
Figure 168 Rest of Latin America Military Cyber Security Market by Value, 2024-2034 (US$ Bn, AGR (%))
Figure 169 Military Cyber Security Market: Company Share, 2023
Figure 170 Cisco Systems Inc.: Net Revenue, 2019-2023 (US$ Million, AGR%)
Figure 171 Cisco Systems Inc.: R&D, 2019-2023 (US$ Million, AGR%)
Figure 172 Cisco Systems Inc.: Regional Revenue Share, 2023 (%)
Figure 173 Cisco Systems Inc.: Business Segment Revenue Share, 2023 (%)
Figure 174 General Dynamics Corporation.: Net Revenue, 2018-2022 (US$ Million, AGR%)
Figure 175 General Dynamics Corporation.: R&D, 2018-2022 (US$ Million, AGR%)
Figure 176 General Dynamics Corporation.: Regional Revenue Share, 2022 (%)
Figure 177 General Dynamics Corporation.: Business Segment Revenue Share, 2022 (%)
Figure 178 International Business Machines Corp.: Net Revenue, 2018-2022 (US$ Million, AGR%)
Figure 179 International Business Machines Corp.: R&D, 2018-2022 (US$ Million, AGR%)
Figure 180 International Business Machines Corp.: Regional Revenue Share, 2022 (%)
Figure 181 International Business Machines Corp.: Business Segment Revenue Share, 2022 (%)
Figure 182 Leidos Holdings Inc.: Net Revenue, 2018-2022 (US$ Million, AGR%)
Figure 183 Leidos Holdings Inc.: R&D, 2018-2022 (US$ Million, AGR%)
Figure 184 Leidos Holdings Inc.: Regional Revenue Share, 2022 (%)
Figure 185 Leidos Holdings Inc.: Business Segment Revenue Share, 2022 (%)
Figure 186 Lockheed Martin Corporation.: Net Revenue, 2018-2022 (US$ Million, AGR%)
Figure 187 Lockheed Martin Corporation.: R&D, 2018-2022 (US$ Million, AGR%)
Figure 188 Lockheed Martin Corporation.: Regional Revenue Share, 2022 (%)
Figure 189 Lockheed Martin Corporation.: Business Segment Revenue Share, 2022 (%)
Figure 190 Northrop Grumman Systems Corp.: Net Revenue, 2018-2022 (US$ Million, AGR%)
Figure 191 Northrop Grumman Systems Corp.: R&D, 2018-2022 (US$ Million, AGR%)
Figure 192 Northrop Grumman Systems Corp.: Regional Revenue Share, 2022 (%)
Figure 193 Northrop Grumman Systems Corp.: Business Segment Revenue Share, 2022 (%)
Figure 194 Raytheon Technologies Corporation.: Net Revenue, 2019-2023 (US$ Million, AGR%)
Figure 195 Raytheon Technologies Corporation.: R&D, 2019-2023 (US$ Million, AGR%)
Figure 196 Raytheon Technologies Corporation.: Regional Revenue Share, 2023 (%)
Figure 197 Raytheon Technologies Corporation.: Business Segment Revenue Share, 2023 (%)
Figure 198 Thales Group.: Net Revenue, 2018-2022 (US$ Million, AGR%)
Figure 199 Viasat.: Net Revenue, 2019-2023 (US$ Million, AGR%)
Figure 200 Viasat.: R&D, 2019-2023 (US$ Million, AGR%)
Figure 201 Viasat.: Regional Revenue Share, 2023 (%)
Figure 202 Viasat.: Business Segment Revenue Share, 2023 (%)
Figure 203 Fortinet Inc.: Net Revenue, 2019-2023 (US$ Million, AGR%)
Figure 204 Fortinet Inc.: R&D, 2019-2023 (US$ Million, AGR%)
Figure 205 Fortinet Inc.: Regional Revenue Share, 2022 (%)
Figure 206 Fortinet Inc.: Business Segment Revenue Share, 2022 (%)
Figure 207 Booz Allen Hamilton Holding Corp.: Net Revenue, 2019-2023 (US$ Million, AGR%)
Figure 208 Intel Corporation.: Net Revenue, 2018-2022 (US$ Million, AGR%)
Figure 209 Intel Corporation.: R&D, 2018-2022 (US$ Million, AGR%)
Figure 210 Intel Corporation.: Business Segment Revenue Share, 2022 (%)
Figure 211 CACI International Inc.: Net Revenue, 2019-2023 (US$ Million, AGR%)
ページTOPに戻る
よくあるご質問
Visiongain社はどのような調査会社ですか?
英国の調査会社ヴィジョンゲイン社(Visiongain)は、通信とエネルギーのほか、自動車や化学・医薬品、金属など、広範な市場を対象に調査を行っています。自動車市場については、市場全般に関する調査のほ... もっと見る
調査レポートの納品までの日数はどの程度ですか?
在庫のあるものは速納となりますが、平均的には 3-4日と見て下さい。
但し、一部の調査レポートでは、発注を受けた段階で内容更新をして納品をする場合もあります。
発注をする前のお問合せをお願いします。
注文の手続きはどのようになっていますか?
1)お客様からの御問い合わせをいただきます。
2)見積書やサンプルの提示をいたします。
3)お客様指定、もしくは弊社の発注書をメール添付にて発送してください。
4)データリソース社からレポート発行元の調査会社へ納品手配します。
5) 調査会社からお客様へ納品されます。最近は、pdfにてのメール納品が大半です。
お支払方法の方法はどのようになっていますか?
納品と同時にデータリソース社よりお客様へ請求書(必要に応じて納品書も)を発送いたします。
お客様よりデータリソース社へ(通常は円払い)の御振り込みをお願いします。
請求書は、納品日の日付で発行しますので、翌月最終営業日までの当社指定口座への振込みをお願いします。振込み手数料は御社負担にてお願いします。
お客様の御支払い条件が60日以上の場合は御相談ください。
尚、初めてのお取引先や個人の場合、前払いをお願いすることもあります。ご了承のほど、お願いします。
データリソース社はどのような会社ですか?
当社は、世界各国の主要調査会社・レポート出版社と提携し、世界各国の市場調査レポートや技術動向レポートなどを日本国内の企業・公官庁及び教育研究機関に提供しております。
世界各国の「市場・技術・法規制などの」実情を調査・収集される時には、データリソース社にご相談ください。
お客様の御要望にあったデータや情報を抽出する為のレポート紹介や調査のアドバイスも致します。
|
|


