量子センサー市場レポート:2024-2034
Quantum Sensors Market Report 2024-2034
レポート詳細
量子センサー市場レポート 2024-2034年 :本レポートは、業界とその根底にあるダイナミクスをより良く理解することを望むならば、新たな収益ポケットを目指している大手企業にとって貴... もっと見る
※上記価格は部署ライセンス(Departmental licence)価格です。
その他の価格についてはデータリソースまでお問合せください。
日本語のページは自動翻訳を利用し作成しています。
実際のレポートは英文のみでご納品いたします。

|

|
サマリー
レポート詳細
量子センサー市場レポート 2024-2034年:本レポートは、業界とその根底にあるダイナミクスをより良く理解することを望むならば、新たな収益ポケットを目指している大手企業にとって貴重なものとなるでしょう。異業種への進出や新地域での既存事業の拡大を目指す企業にも有用です。
量子技術と研究の進歩
世界の量子センサー市場は、量子テクノロジーと量子研究の進歩によって大きく牽引されている。量子力学の科学的理解が進むにつれ、より高度で高感度な量子センサーの開発が可能になる。量子センサーは、重ね合わせとエンタングルメントの原理を利用して、これまでにない精度で物理量を測定する。例えば、マサチューセッツ工科大学(MIT)などの研究機関やIBM、グーグルなどの企業は、量子研究に多額の投資を行っている。これらの進歩は、高感度の磁力計、重力計、原子時計の誕生につながっており、医療用画像からナビゲーションに至るまで、さまざまな用途に欠かせないものとなっている。量子技術の継続的な進歩は、量子センサーの潜在的な用途を拡大し、商用利用をより現実的なものにし、市場成長を牽引している。
量子技術を開発し、扱うことのできる熟練した専門家の不足
量子センサー市場を阻む大きな課題の一つは、量子テクノロジーを開発し、効果的に扱うことのできる熟練した専門家の不足である。量子力学の原理を活用した量子センサーには、量子コンピューティング、ナノテクノロジー、先端物理学の専門知識が必要とされる。しかし、これらの分野に精通した専門家の数は依然として限られており、量子センサー技術の普及と発展のボトルネックとなっている。
複雑な量子システムには、理論的な量子力学だけでなく、実用的なアプリケーションや実験手法の専門知識も必要です。量子センサーの開発には、量子コヒーレンスの維持、センサー性能の最適化、量子システムと既存技術の統合といった技術的課題の克服が必要です。十分なスキルを持った人材がいなければ、企業や研究機関はイノベーション・サイクルの遅れに直面し、様々な産業で量子センサーの能力を十分に発揮することができないかもしれない。
市場調査レポートを購入する前にすべき質問とは?
-
量子センサー市場はどのように進化しているのか?
-
量子センサー市場を牽引しているもの、抑制しているものは何か?
-
量子センサーの各サブマーケットは、予測期間中にどのように成長し、2034年にはどれくらいの売上を占めるようになるのだろうか?
-
2024年から2034年にかけて、量子センサーの各サブマーケットの市場シェアはどのように推移するのか?
-
2024年から2034年にかけて、市場全体を牽引する主な要因は何か?
-
主要な量子センサー市場はマクロ経済の動きに大枠で追随するのか、それとも個々の国の市場が他を凌駕するのか。
-
2034年までに各国市場のシェアはどのように変化し、どの地域が2034年の市場をリードするのか。
-
主要プレーヤーと予測期間中の見通しは?
-
これらの大手企業にとっての量子センサー・プロジェクトとは?
-
2024年から2034年の間に、業界はどのように進化するのか?現在、そして今後10年間に実施される量子センサー・プロジェクトにはどのような意味があるのか?
-
量子センサー市場をさらに拡大するためには、製品の商業化がより必要なのでしょうか?
-
量子センサー市場はどこに向かっているのか、また、どのようにすれば市場の最前線に立つことができるのか。
-
新商品や新サービスに最適な投資方法とは?
-
企業を新たな成長軌道に乗せ、C-suiteに移行させるための重要な展望とは?
現在、そして今後10年間、量子センサー市場にどのような影響を与えるかを見極める必要がある:
-
336ページに及ぶレポートには、112の表と150の図表が掲載されている。
-
本レポートでは、業界における主要な有利分野を取り上げているため、今すぐターゲットを絞ることができる。
-
世界、地域、国の売上高と成長に関する詳細な分析が含まれている。
-
競合他社が成功した主なトレンド、変化、収益予測をハイライトします。
本レポートは、量子センサー市場が今後10年間にどのように発展していくのか、またCOVID-19の景気後退と好転の変動に合わせてどのように発展していくのかをTODAYでお伝えします。この市場は、過去10年間のどの時点よりも今が重要である。
2034年までの予測やその他の分析から、商業的な展望が明らかになる
-
2034年までの収益予測に加え、最近の実績、成長率、市場シェアも提供している。
-
ビジネスの展望や展開など、独自の分析が掲載されている。
-
定性的分析(市場ダイナミクス、促進要因、機会、阻害要因、課題を含む)、コスト構造、量子センサー価格上昇の影響、最近の動向をご覧いただけます。
本レポートには、COVID-19が業界と貴社にどのような影響を与えるかについてのデータ分析と貴重な洞察が含まれている。本レポートでは、COVID-19の4つの回収パターンとその影響、すなわち「V」、「L」、「W」、「U」について論じている。
レポート対象セグメント
コンポーネント別市場セグメント
-
量子ドット
-
量子カスケードレーザー
-
その他のコンポーネント
用途別市場セグメント
プラットフォーム別市場セグメント
-
中性原子
-
トラップされたイオン
-
核磁気共鳴
-
オプトメカニクス
-
その他のプラットフォーム
製品タイプ別市場セグメント
-
原子時計
-
磁力計
-
グラジオメーター
-
イメージング・デバイス
-
量子計測デバイス
-
その他の製品
世界市場全体とセグメント別の収益予測に加え、4つの地域と20の主要国市場の収益予測も掲載しています:
北米
欧州
-
ドイツ
-
スペイン
-
イギリス
-
フランス
-
イタリア
-
その他の欧州地域
アジア太平洋
-
中国
-
日本
-
インド
-
オーストラリア
-
韓国
-
その他のアジア太平洋地域
ラテンアメリカ
中東・アフリカ
また、本レポートには、量子センサー市場の2024年から2034年までの主要企業のプロファイルと、これらの企業の事業のこのセグメントに焦点を当てている。
報告書に掲載されている主要企業
-
AOSense, Inc.
-
Apogee Instruments, Inc.
-
Atomionics Pte. Ltd.
-
Campbell Scientific, Inc.
-
GEM Systems Inc
-
ID Quantique
-
Impedans Ltd
-
Kipp & Zonen
-
LI-COR, Inc.
-
M Squared Ltd
-
Nomad Atomics
-
Q-CTRL
-
Qnami
-
Sea-Bird Scientific
-
Skye Instruments Ltd
2024年から2034年までの量子センサー市場全体の世界売上高(金額ベース)は、2024年に6億3,860万米ドルを突破する。2034年まで収益の力強い伸びを予測。当社の調査では、最も大きな可能性を秘めた企業を特定しています。彼らの能力、進歩、商業的展望を発見し、一歩先を行くお手伝いをします。
2024年から2034年までの量子センサー市場」レポートはどのように役立つのか?
要約すると、330ページを超えるこのレポートは、以下のような知識を提供する:
-
量子センサー市場、2024年から2034年までの収益予測 世界および地域レベルで、コンポーネント、アプリケーション、プラットフォーム、製品タイプごとに予測 - 業界の将来性を発見し、投資と収益に最も有利な場所を見つけます。
-
4つの地域と20の主要国市場の2034年までの収益予測 - 量子センサー市場の2024年から2034年までの北米、ヨーロッパ、アジア太平洋、ラテンアメリカ、中東&アフリカ市場の予測をご覧ください。また、米国、カナダ、ブラジル、ドイツ、フランス、英国、イタリア、中国、インド、日本、オーストラリアなどの著名経済圏の市場も予測しています。
-
2024年から2034年までの量子センサー市場に関わる主要企業15社の企業プロファイルを含む。
独自の予測による定量的・定性的分析をご覧ください。私たちのレポートだけに含まれる情報を入手し、貴重なビジネスインテリジェンスで情報を得ることができます。
他にはない情報
私たちの新しいレポートがあれば、知識に遅れをとったり、チャンスを逃したりする可能性が低くなります。弊社のレポートが貴社の調査、分析、意思決定にどのように役立つかをご覧ください。Visiongainの調査は、量子センサー市場、2024年から2034年、市場をリードする企業の商業分析を必要とするすべての人のためのものです。データ、トレンド、予測をご覧いただけます。
ページTOPに戻る
目次
1 レポート概要
1.1 研究の目的
1.2 量子センサー市場の紹介
1.3 本レポートの特徴
1.4 本レポートを読むべき理由
1.5 本分析レポートが回答する主な質問
1.6 本レポートは誰のためのものか?
1.7 方法論
1.7.1 市場の定義
1.7.2 市場評価・予測手法
1.7.3 データの検証
1.7.3.1 一次調査
1.7.3.2 セカンダリーリサーチ
1.8 よくある質問(FAQ)
1.9 Visiongainの関連レポート
1.10 Visiongainについて
2 エグゼクティブ・サマリー
3 市場概要
3.1 主要な調査結果
3.2 市場ダイナミクス
3.2.1 市場促進要因
3.2.1.1 宇宙産業における量子センサーの利用拡大
3.2.1.2 新興の生物医学・健康科学市場が市場成長を牽引
3.2.1.3 海洋学と海洋アプリケーションにおける正確なナビゲーションのための量子センサーの使用増加
3.2.2 市場抑制要因
3.2.2.1 量子技術を開発・利用できる専門家の不足
3.2.2.2 量子センサーの製造には高価な材料と複雑な製造工程が伴う
3.2.2.3 規制上のハードルが市場成長を妨げる
3.2.3 市場機会
3.2.3.1 市場成長のための政府と民間セクターの投資機会
3.2.3.2 市場プレイヤー間の連携とパートナーシップ 市場成長の機会
3.2.3.3 量子センサー市場における新製品の投入 市場成長の機会
3.3 ポーターのファイブフォース分析
3.3.1 サプライヤーの交渉力(中〜高)
3.3.2 買い手の交渉力(低)
3.3.3 競争力(中~高)
3.3.4 代替品による脅威(低)
3.3.5 新規参入の脅威(中)
3.4 COVID-19の影響分析
3.4.1 "V字型回復"
3.4.2 "U字型回復"
3.4.3 "W字型回復"
3.4.4 "L字型回復"
3.5 PEST分析
4 量子センサー市場分析:コンポーネント別
4.1 主要な調査結果
4.2 コンポーネント・セグメント 市場魅力度指数
4.3 量子センサーのコンポーネント別市場規模推定と予測
4.4 量子ドット
4.4.1 2024〜2034年の地域別市場規模(US$ Million)
4.4.2 地域別市場シェア、2024年・2034年(%)
4.5 量子カスケードレーザー
4.5.1 2024~2034年の地域別市場規模(US$ Million)
4.5.2 地域別市場シェア、2024年・2034年(%)
4.6 その他のコンポーネント
4.6.1 2024〜2034年の地域別市場規模(US$ Million)
4.6.2 地域別市場シェア、2024年・2034年(%)
5 量子センサー市場分析:用途別
5.1 主要調査結果
5.2 アプリケーションセグメント 市場魅力度指数
5.3 用途別量子センサー市場規模の推定と予測
5.4 航空宇宙・防衛
5.4.1 2024〜2034年の地域別市場規模(US$ Million)
5.4.2 地域別市場シェア、2024年・2034年 (%)
5.5 石油・ガス
5.5.1 2024年~2034年の地域別市場規模(US$ Million)
5.5.2 地域別市場シェア、2024年・2034年(%)
5.6 自動車
5.6.1 2024-2034年地域別市場規模(US$ Million)
5.6.2 地域別市場シェア、2024年・2034年(%)
5.7 その他の用途
5.7.1 2024年~2034年の地域別市場規模(US$ Million)
5.7.2 地域別市場シェア、2024年・2034年(%)
6 量子センサー市場分析:プラットフォーム別
6.1 主要調査結果
6.2 プラットフォームセグメント 市場魅力度指数
6.3 プラットフォーム別量子センサー市場規模推定と予測
6.4 中性原子
6.4.1 2024~2034年の地域別市場規模(US$ Million)
6.4.2 地域別市場シェア、2024年・2034年(%)
6.5 トラップイオン
6.5.1 2024~2034年の地域別市場規模(US$ Million)
6.5.2 地域別市場シェア、2024年・2034年(%)
6.6 核磁気共鳴
6.6.1 2024~2034年の地域別市場規模(US$ Million)
6.6.2 地域別市場シェア、2024年・2034年(%)
6.7 オプトメカニクス
6.7.1 2024~2034年の地域別市場規模(US$ Million)
6.7.2 地域別市場シェア、2024年・2034年(%)
6.8 その他のプラットフォーム
6.8.1 2024〜2034年の地域別市場規模(US$ Million)
6.8.2 地域別市場シェア、2024年・2034年(%)
7 量子センサー市場分析:製品タイプ別
7.1 主要な調査結果
7.2 製品タイプ別セグメント 市場魅力度指数
7.3 量子センサーの製品タイプ別市場規模推定と予測
7.4 原子時計
7.4.1 2024~2034年の地域別市場規模(US$ Million)
7.4.2 地域別市場シェア、2024年・2034年(%)
7.5 磁力計
7.5.1 2024~2034年の地域別市場規模(US$ Million)
7.5.2 地域別市場シェア、2024年・2034年(%)
7.6 グラジオメーター
7.6.1 2024~2034年の地域別市場規模(US$ Million)
7.6.2 地域別市場シェア、2024年・2034年(%)
7.7 画像処理装置
7.7.1 2024〜2034年の地域別市場規模(US$ Million)
7.7.2 地域別市場シェア、2024年・2034年(%)
7.8 量子計測機器
7.8.1 2024~2034年の地域別市場規模(US$ Million)
7.8.2 地域別市場シェア、2024年・2034年(%)
7.9 その他の製品
7.9.1 2024〜2034年の地域別市場規模(US$ Million)
7.9.2 地域別市場シェア、2024年・2034年(%)
8 量子センサー市場分析:地域別
8.1 主要な調査結果
8.2 地域別市場規模の推定と予測
9 北米の量子センサー市場分析
9.1 主要な調査結果
9.2 北米の量子センサー市場魅力度指数
9.3 北米の量子センサー国別市場、2024年、2029年、2034年(US$ Million)
9.4 北米の量子センサー市場規模推定と予測
9.5 北米の量子センサー市場規模推定と予測:国別
9.6 北米の量子センサー市場規模推定と予測:コンポーネント別
9.7 北米の量子センサー市場規模推定と予測:用途別
9.8 北米の量子センサー市場規模推定と予測:プラットフォーム別
9.9 北米の量子センサー市場規模推定と予測:製品タイプ別
9.10 アメリカの量子センサー市場分析
9.11 カナダの量子センサー市場分
10 欧州の量子センサー市場分析
10.1 主要な調査結果
10.2 欧州の量子センサー市場魅力度指数
10.3 欧州の量子センサー国別市場、2024年、2029年、2034年(US$ Million)
10.4 欧州の量子センサー市場規模推定と予測
10.5 欧州の量子センサー市場規模推定と予測:国別
10.6 欧州の量子センサー市場規模推定と予測:コンポーネント別
10.7 欧州の量子センサー市場規模推定と予測:用途別
10.8 欧州の量子センサー市場規模推定と予測:プラットフォーム別
10.9 欧州の量子センサー市場規模推定と予測:製品タイプ別
10.10 ドイツの量子センサー市場分析
10.11 イギリスの量子センサー市場分析
10.12 フランスの量子センサー市場分析
10.13 イタリアの量子センサー市場分析
10.14 スペインの量子センサー市場分析
10.15 その他の欧州の量子センサー市場分析
11 アジア太平洋地域の量子センサー市場分析
11.1 主要な調査結果
11.2 アジア太平洋地域の量子センサー市場魅力度指数
11.3 アジア太平洋地域の量子センサー国別市場、2024年、2029年、2034年(US$ Million)
11.4 アジア太平洋地域の量子センサー市場規模推定と予測
11.5 アジア太平洋地域の量子センサー市場規模推定と予測:国別
11.6 アジア太平洋地域の量子センサー市場規模推定と予測:コンポーネント別
11.7 アジア太平洋地域の量子センサー市場規模推定と予測:用途別
11.8 アジア太平洋地域の量子センサー市場規模推定と予測:プラットフォーム別
11.9 アジア太平洋地域の量子センサー市場規模推定と予測:製品タイプ別
11.10 中国の量子センサー市場分析
11.11 インドの量子センサー市場分析
11.12 日本の量子センサー市場分析
11.13 韓国の量子センサーの市場分析
11.14 オーストラリアの量子センサーの市場分析
11.15 その他のアジア太平洋地域の量子センサ市場の分析
12 中東・アフリカの量子センサー市場分析
12.1 主要な調査結果
12.2 中東・アフリカの量子センサー市場魅力度指数
12.3 中東・アフリカの量子センサー国別市場、2024年、2029年、2034年 (US$ Million)
12.4 中東・アフリカの量子センサー市場規模推定と予測
12.5 中東・アフリカの量子センサー市場規模推定と予測:国別
12.6 中東・アフリカの量子センサー市場規模推定と予測:コンポーネント別
12.7 中東・アフリカの量子センサー市場規模推定と予測:用途別
12.8 中東・アフリカの量子センサー市場規模推定と予測:プラットフォーム別
12.9 中東・アフリカの量子センサー市場規模推定と予測:製品タイプ別
12.10 GCCの量子センサー市場分析
12.11 南アフリカの量子センサー市場分析
12.12 その他の中東・アフリカ地域の量子センサー市場分析
13 ラテンアメリカの量子センサー市場分析
13.1 主要な調査結果
13.2 ラテンアメリカの量子センサー市場魅力度指数
13.3 ラテンアメリカの量子センサー国別市場、2024年、2029年、2034年(US$ Million)
13.4 ラテンアメリカの量子センサー市場規模推定と予測
13.5 ラテンアメリカの量子センサー市場規模推定と予測:国別
13.6 ラテンアメリカの量子センサー市場規模推定と予測:コンポーネント別
13.7 ラテンアメリカの量子センサー市場規模推定と予測:用途別
13.8 ラテンアメリカの量子センサー市場規模推定と予測:プラットフォーム別
13.9 ラテンアメリカの量子センサー市場規模推定と予測:製品タイプ別
13.10 ブラジルの量子センサー市場分析
13.11 メキシコの量子センサー市場分析
13.12 その他のラテンアメリカの量子センサー市場分析
14 主要企業のプロファイル
14.1 戦略的展望
14.2 Apogee Instruments, Inc.
14.2.1 会社概要
14.2.2 会社概要
14.2.3 製品ベンチマーク
14.3 ID Quantique
14.3.1 会社概要
14.3.2 会社概要
14.3.3 製品ベンチマーク
14.3.4 戦略的展望
14.4 LI-COR, Inc.
14.4.1 会社概要
14.4.2 会社概要
14.4.3 製品ベンチマーク
14.5 M Squared Ltd
14.5.1 会社概要
14.5.2 会社概要
14.5.3 製品ベンチマーク
14.6 AOSense, Inc.
14.6.1 会社概要
14.6.2 会社概要
14.6.3 製品ベンチマーク
14.7 Campbell Scientific, Inc.
14.7.1 会社概要
14.7.2 会社概要
14.7.3 製品ベンチマーク
14.8 Impedans Ltd
14.8.1 会社概要
14.8.2 会社概要
14.8.3 製品ベンチマーク
14.9 Kipp & Zonen
14.9.1 会社概要
14.9.2 会社概要
14.9.3 製品ベンチマーク
14.10 Sea-Bird Scientific
14.10.1 会社概要
14.10.2 会社概要
14.10.3 製品ベンチマーク
14.11 Atomionics Pte.Ltd.
14.11.1 会社概要
14.11.2 会社概要
14.11.3 製品ベンチマーク
14.12 GEM Systems Inc
14.12.1 会社概要
14.12.2 会社概要
14.12.3 製品ベンチマーク
14.13 Nomad Atomics
14.13.1 会社概要
14.13.2 会社概要
14.13.3 製品ベンチマーク
14.14 Q-CTRL
14.14.1 会社概要
14.14.2 会社概要
14.14.3 製品ベンチマーク
14.14.4 戦略的展望
14.15 Qnami
14.15.1 会社概要
14.15.2 会社概要
14.15.3 製品ベンチマーク
14.15.4 戦略的展望
14.16 Skye Instruments Ltd
14.16.1 会社概要
14.16.2 会社概要
14.16.3 製品ベンチマーク
15 結論と提言
15.1 Visiongainからの結びの言葉
15.2 市場プレイヤーへの提言
ページTOPに戻る
図表リスト
表の一覧
表1 量子センサ市場のスナップショット、2024年~2034年(百万米ドル、CAGR %)
表2 量子センサの世界地域別市場:2024年~2034年 (百万米ドル、AGR (%)、CAGR (%)) (V字回復シナリオ)
表3 量子センサの世界地域別市場:2024-2034年 (US$ Mn, AGR (%), CAGR (%)) (U字型回復シナリオ)
表4 量子センサの世界地域別市場:2024-2034年(100万米ドル、AGR(%)、CAGR(%))(W型回復シナリオ)
表5 量子センサの世界地域別市場:2024-2034年(100万米ドル、AGR(%)、CAGR(%))(L字型回復シナリオ)
表6 量子センサーの世界市場:部品別(2024-2034年:100万ドル、AGR(%)、CAGR(%)
表7 量子ドットの地域別市場:2024年~2034年(100万米ドル、AGR (%)、CAGR (%)
表8 量子カスケードレーザー地域別市場:2024-2034年 (US$ Mn, AGR (%), CAGR (%))
表9 その他のコンポーネントの地域別市場、2024-2034年 (US$ Mn, AGR (%), CAGR (%))
表10 量子センサーの世界市場:用途別、2024-2034年 (US$ Mn, AGR (%), CAGR (%))
表 11 航空宇宙・防衛市場の地域別市場規模(単位:百万米ドル、AGR (%)、CAGR (%)
表12 石油・ガス地域別市場:2024-2034年(100万米ドル、AGR (%)、CAGR (%)
表13 自動車市場:地域別、2024-2034年 (US$ Mn, AGR (%), CAGR (%))
表14 その他の用途の地域別市場、2024-2034年 (US$ Mn, AGR (%), CAGR (%))
表15 量子センサーの世界市場:プラットフォーム別、2024-2034年 (US$ Mn, AGR (%), CAGR (%))
表16 中性原子の地域別市場、2024年~2034年 (US$ Mn, AGR (%), CAGR (%))
表17 トラップドイオン市場:地域別、2024-2034年 (US$ Mn, AGR (%), CAGR (%))
表18 核磁気共鳴の地域別市場、2024-2034年 (US$ Mn, AGR (%), CAGR (%))
表19 オプトメカニクス地域別市場:2024-2034年(100万米ドル、AGR (%)、CAGR (%)
表20 その他のプラットフォーム地域別市場、2024-2034年 (US$ Mn, AGR (%), CAGR (%))
表21 量子センサの世界市場:製品タイプ別、2024-2034年 (US$ Mn, AGR (%), CAGR (%))
表22 原子時計の地域別市場:2024-2034年 (US$ Mn, AGR (%), CAGR (%))
表23 磁力計の地域別市場、2024-2034年 (US$ Mn, AGR (%), CAGR (%))
表24 グラジオメーター地域別市場:2024-2034年 (US$ Mn, AGR (%), CAGR (%))
表25 イメージングデバイス地域別市場:2024-2034年 (US$ Mn, AGR (%), CAGR (%))
表26 量子計測機器の地域別市場:2024-2034年 (US$ Mn, AGR (%), CAGR (%))
表27 その他の製品の地域別市場、2024年~2034年 (US$ Mn, AGR (%), CAGR (%))
表28 量子センサの世界地域別市場、2024-2034年 (US$ Mn, AGR (%), CAGR (%))
表29 北米の量子センサー市場:金額ベース、2024-2034年 (US$ Mn, AGR (%), CAGR (%))
表30 北米の量子センサー市場:国別、2024-2034年 (US$ Mn, AGR (%), CAGR (%))
表31 北米の量子センサー市場:コンポーネント別、2024-2034年 (US$ Mn, AGR (%), CAGR (%))
表32 北米の量子センサー市場:用途別 2024-2034 (US$ Mn, AGR (%), CAGR (%))
表33 北米の量子センサー市場:プラットフォーム別、2024-2034年 (US$ Mn, AGR (%), CAGR (%))
表34 北米の量子センサー市場:製品タイプ別、2024-2034年 (US$ Mn, AGR (%), CAGR (%))
表35 米国量子センサー市場:金額ベース、2024-2034年 (US$ Mn, AGR (%), CAGR (%))
表 36 カナダの量子センサー市場:金額 2024-2034 (US$ Mn, AGR (%), CAGR (%))
表 37 欧州の量子センサー市場:金額 2024-2034 (US$ Mn, AGR (%), CAGR (%))
表 38 欧州の量子センサー市場:国別、2024-2034 (US$ Mn, AGR (%), CAGR (%))
表39 欧州量子センサー市場:コンポーネント別、2024-2034年 (US$ Mn, AGR (%), CAGR (%))
表40 欧州量子センサー市場:用途別 2024-2034 (US$ Mn, AGR (%), CAGR (%))
表41 欧州量子センサー市場:プラットフォーム別、2024-2034年 (US$ Mn, AGR (%), CAGR (%))
表42 欧州量子センサー市場:製品タイプ別、2024-2034年 (US$ Mn, AGR (%), CAGR (%))
表43 ドイツ量子センサー市場:金額ベース、2024-2034年 (US$ Mn, AGR (%), CAGR (%))
表44 英国量子センサー市場:金額 2024-2034 (US$ Mn, AGR (%), CAGR (%))
表45 フランスの量子センサー市場:金額 2024-2034 (US$ Mn, AGR (%), CAGR (%))
表 46 イタリアの量子センサー市場:金額 2024-2034 (US$ Mn, AGR (%), CAGR (%))
表 47 スペインの量子センサー市場:金額 2024-2034 (US$ Mn, AGR (%), CAGR (%))
表 48 残りのヨーロッパの量子センサー市場:金額 2024-2034 (US$ Mn, AGR (%), CAGR (%))
表 49 アジア太平洋地域の量子センサー市場:金額 2024-2034 (US$ Mn, AGR (%), CAGR (%))
表50 アジア太平洋地域の量子センサー国別市場、2024-2034年 (US$ Mn, AGR (%), CAGR (%))
表51 アジア太平洋地域の量子センサー市場:部品別(2024-2034年:100万米ドル、AGR (%)、CAGR (%)
表52 アジア太平洋地域の量子センサー市場:用途別(2024-2034年:US$ Mn, AGR (%), CAGR (%)
表53 アジア太平洋地域の量子センサー市場:プラットフォーム別、2024-2034年 (US$ Mn, AGR (%), CAGR (%))
表54 アジア太平洋地域の量子センサー市場:製品タイプ別、2024年~2034年 (US$ Mn, AGR (%), CAGR (%))
表55 中国量子センサー市場:金額ベース、2024-2034年 (US$ Mn, AGR (%), CAGR (%))
表 56 インドの量子センサー市場:金額 2024-2034 (US$ Mn, AGR (%), CAGR (%))
表 57 日本の量子センサー市場:金額 2024-2034 (US$ Mn, AGR (%), CAGR (%))
表 58 韓国量子センサー市場:金額 2024-2034 (US$ Mn, AGR (%), CAGR (%))
表 59 オーストラリアの量子センサー市場:金額 2024-2034 (US$ Mn, AGR (%), CAGR (%))
表 60 その他のアジア太平洋地域の量子センサー市場:金額 2024-2034 (US$ Mn, AGR (%), CAGR (%))
表 61 中東・アフリカ量子センサー市場:金額 2024-2034 (US$ Mn, AGR (%), CAGR (%))
表 62 中東・アフリカ量子センサー国別市場:2024-2034 (US$ Mn, AGR (%), CAGR (%))
表 63 中東・アフリカ量子センサー部品別市場:2024-2034 (US$ Mn, AGR (%), CAGR (%))
表 64 中東・アフリカ量子センサー市場:用途別 2024-2034 (US$ Mn, AGR (%), CAGR (%))
表65 中東・アフリカ量子センサー市場:プラットフォーム別 2024-2034 (US$ Mn, AGR (%), CAGR (%))
表 66 中東・アフリカ量子センサー市場:製品タイプ別 2024-2034 (US$ Mn, AGR (%), CAGR (%))
表67 GCCの量子センサー市場:金額ベース 2024-2034 (US$ Mn, AGR (%), CAGR (%))
表 68 南アフリカの量子センサー市場:金額 2024-2034 (US$ Mn, AGR (%), CAGR (%))
表 69 中東・アフリカの残りの地域の量子センサー市場:金額 2024-2034 (US$ Mn, AGR (%), CAGR (%))
表 70 中南米の量子センサー市場:金額 2024-2034 (US$ Mn, AGR (%), CAGR (%))
表71 ラテンアメリカの量子センサー市場:国別、2024-2034年 (US$ Mn, AGR (%), CAGR (%))
表72 ラテンアメリカの量子センサー市場:コンポーネント別、2024-2034年 (US$ Mn, AGR (%), CAGR (%))
表73 ラテンアメリカの量子センサー市場:用途別(2024-2034年:100万米ドル、AGR (%)、CAGR (%)
表74 ラテンアメリカの量子センサー市場:プラットフォーム別、2024-2034年 (US$ Mn, AGR (%), CAGR (%))
表75 ラテンアメリカの量子センサー市場:製品タイプ別、2024-2034年 (US$ Mn, AGR (%), CAGR (%))
表76 ブラジル量子センサー市場:金額 2024-2034 (US$ Mn, AGR (%), CAGR (%))
表77 メキシコ量子センサー市場:金額 2024-2034 (US$ Mn, AGR (%), CAGR (%))
表 78 ラテンアメリカの残りの地域の量子センサー市場:金額 2024-2034 (US$ Mn, AGR (%), CAGR (%))
表 79 戦略的展望分析
表 80 Apogee Instruments, Inc:主な詳細(CEO, 本社, 売上高, 設立, 従業員数, 企業タイプ, ウェブサイト, 事業セグメント)
表 81 Apogee Instruments, Inc:製品ベンチマーク
表82 ID Quantique:主な詳細(CEO, 本社, 売上高, 設立, 従業員数, 企業タイプ, ウェブサイト, 事業セグメント)
表83 ID Quantique:製品ベンチマーク
表 84 ID クァンティーク戦略的展望
表 85 LI-COR, Inc:主な詳細(CEO, 本社, 売上高, 設立, 従業員数, 企業タイプ, ウェブサイト, 事業セグメント)
表 86 LI-COR, Inc:製品ベンチマーク
表 87 M Squared Ltd: 主要業績(CEO, 本社, 売上高, 設立, 従業員数, 企業タイプ, ウェブサイト, 事業セグメント)
表 88 M Squared Ltd: 製品ベンチマーク
表 89 AOSense, Inc:主要詳細(CEO, 本社, 売上高, 設立, 従業員数, 企業タイプ, ウェブサイト, 事業セグメント)
表 90 AOSense, Inc:製品ベンチマーク
表91 キャンベル・サイエンティフィック主な詳細(CEO、本社、売上高、設立、従業員数、企業タイプ、ウェブサイト、事業セグメント)
表92 キャンベルサイエンティフィック製品ベンチマーク
表93 Impedans Ltd: 主要業績(CEO, 本社, 売上高, 設立, 従業員数, 企業タイプ, ウェブサイト, 事業セグメント)
表94 Impedans Ltd:製品ベンチマーク
表95 OTTハイドロメット: 主要データ(CEO, 本社, 売上高, 設立, 従業員数, 企業タイプ, ウェブサイト, 事業セグメント)
表96 OTTハイドロメット製品ベンチマーク
表 97 シーバード・サイエンティフィック主な詳細(CEO, 本社, 売上高, 設立, 従業員数, 企業タイプ, ウェブサイト, 事業セグメント)
表 98 シーバード・サイエンティフィック製品ベンチマーク
表 99 Atomionics Pte.Ltd.:主要詳細(CEO, 本社, 売上高, 設立, 従業員数, 企業タイプ, ウェブサイト, 事業セグメント)
表 100 Atomionics Pte.Ltd:製品ベンチマーク
表101 GEM Systems Inc:主な詳細(CEO, 本社, 売上高, 設立, 従業員数, 企業タイプ, ウェブサイト, 事業セグメント)
表 102 GEM Systems Inc:製品ベンチマーク
表103 ノマド・アトミクス主な詳細(CEO, 本社, 売上高, 設立, 従業員数, 企業タイプ, ウェブサイト, 事業セグメント)
表104 ノマド・アトミクス製品ベンチマーク
表105 Q-CTRL:主な詳細(CEO, 本社, 売上高, 設立, 従業員数, 企業タイプ, ウェブサイト, 事業セグメント)
表106 Q-CTRL:製品ベンチマーク
表 107 Q-CTRL:戦略的展望
表108 Qnami:主な詳細(CEO, 本社, 売上高, 設立, 従業員数, 企業タイプ, ウェブサイト, 事業セグメント)
表 109 Qnami:製品ベンチマーク
表110 Qnami:戦略的展望
表111 Skye Instruments Ltd: 主要業績(CEO, 本社, 売上高, 設立, 従業員数, 企業タイプ, ウェブサイト, 事業セグメント)
表112 Skye Instruments Ltd: 製品ベンチマーク
図の一覧
図1 量子センサー市場のセグメンテーション
図 2 量子センサーのコンポーネント別市場:市場魅力度指数
図3 量子センサーの用途別市場:市場魅力度指数
図4 プラットフォーム別量子センサー市場:市場魅力度指数市場魅力度指数
図5 量子センサ市場:製品タイプ別市場魅力度指数
図6 量子センサ市場:地域別魅力度指数
図7 量子センサー市場市場ダイナミクス
図8 量子センサー市場ポーターのファイブフォース分析
図9 量子センサの世界市場:COVID別シェア予測(2024年~2034年)
図10 量子センサの世界市場(地域別):2024年~2034年(US$ Mn, AGR (%))(V字回復シナリオ
図11 量子センサの世界地域別市場:2024年~2034年 (US$ Mn, AGR (%)) (U字回復シナリオ)
図12 量子センサの世界地域別市場:2024年~2034年(100万米ドル、AGR (%))(W字型回復シナリオ)
図13 量子センサの世界地域別市場:2024年~2034年(100万米ドル、AGR (%))(L字型回復シナリオ)
図 14 量子センサー市場PEST分析
図15 量子センサーのコンポーネント別市場市場魅力度指数
図 16 量子センサーの世界市場:コンポーネント別(2024-2034 年)(単位:百万米ドル、AGR (%)
図17 量子センサーの2024年、2029年、2034年コンポーネント別市場シェア予測 (%)
図18 量子ドットの地域別市場規模予測(2024年~2034年、100万米ドル、AGR (%)
図19 量子ドットの地域別市場シェア予測、2024年&2034年(%)
図20 量子カスケードレーザーの地域別市場予測、2024年~2034年 (US$ Mn, AGR (%))
図21 量子カスケードレーザーの地域別市場シェア予測、2024年~2034年 (%)
図22 その他のコンポーネントの地域別市場予測、2024年~2034年 (US$ Mn, AGR (%))
図23 その他のコンポーネントの地域別市場シェア予測、2024年&2034年 (%)
図24 量子センサーの用途別市場市場魅力度指数
図 25 量子センサーの世界市場:用途別(2024 年~2034 年) (US$ Mn, AGR (%))
図 26 2024 年、2029 年、2034 年のアプリケーション別量子センサー市場シェア予測 (%)
図 27 航空宇宙・防衛市場の地域別市場規模(単位:百万米ドル、AGR (%)
図 28 航空宇宙・防衛市場の地域別シェア予測、2024 年~2034 年 (%)
図 29 2024-2034 年地域別石油・ガス市場予測 (US$ Mn, AGR (%))
図 30 地域別石油・ガス市場シェア予測、2024~2034 年 (%)
図31 自動車市場地域別予測(2024年~2034年、100万米ドル、AGR (%)
図32 地域別自動車市場シェア予測、2024年〜2034年 (%)
図33 その他のアプリケーション地域別市場:2024年~2034年(単位:百万米ドル、AGR (%)
図34 その他のアプリケーションの地域別市場シェア予測、2024年~2034年 (%)
図 35 プラットフォーム別量子センサー市場市場魅力度指数
図 36 プラットフォーム別量子センサ世界市場 2024-2034 (US$ Mn, AGR (%))
図37 プラットフォーム別量子センサー市場シェア予測(2024年、2029年、2034年) (%)
図 38 中性原子の地域別市場規模予測(単位:百万米ドル、AGR (%)
図39 中性原子市場地域別シェア予測、2024年&2034年(%)
図40 トラップドイオン地域別市場、2024年~2034年 (US$ Mn, AGR (%))
図41 トラップドイオンの地域別市場シェア予測、2024年~2034年(%)
図42 核磁気共鳴の地域別市場、2024年~2034年 (US $ Mn, AGR (%))
図 43 核磁気共鳴の地域別市場シェア予測、2024 年~2034 年 (%)
図44 オプトメカニクス地域別市場:2024-2034年 (US $ Mn, AGR (%))
図 45 2024-2034 年オプトメカニクス地域別市場シェア予測 (%)
図46 その他のプラットフォーム地域別市場:2024~2034年 (US$ Mn, AGR (%))
図47 その他のプラットフォーム市場地域別シェア予測、2024年&2034年 (%)
図 48 量子センサーの製品タイプ別市場市場魅力度指数
図 49 量子センサの世界市場(製品タイプ別):2024年~2034年 (US$ Mn, AGR (%))
図50 2024年、2029年、2034年の製品タイプ別量子センサー市場シェア予測 (%)
図 51 原子時計の地域別市場予測、2024~2034年 (US$ Mn, AGR (%))
図 52 原子時計の地域別市場シェア予測、2024年&2034年(%)
図 53 磁力計の地域別市場予測、2024~2034年 (US $ Mn, AGR (%))
図 54 磁力計の地域別市場シェア予測、2024年~2034年 (%)
図 55 傾斜計の地域別市場予測、2024~2034年 (US $ Mn, AGR (%))
図 56 グラジオメーター地域別市場シェア予測、2024年&2034年 (%)
図57 画像処理装置地域別市場:2024-2034年 (US $ Mn, AGR (%))
図58 イメージングデバイスの地域別市場シェア予測、2024年~2034年 (%)
図59 量子計測機器の地域別市場規模予測:2024~2034年 (US$ Mn, AGR (%))
図60 量子計測機器の地域別市場シェア予測、2024年~2034年 (%)
図61 その他製品の地域別市場規模予測、2024年~2034年 (US$ Mn, AGR (%))
図62 その他の製品の地域別市場シェア予測、2024年&2034年 (%)
図63 2024年および2034年の地域別量子センサー市場予測(売上高、CAGR)
図64 2024年、2029年、2034年の地域別量子センサー市場シェア予測(%)
図65 量子センサの世界地域別市場予測 2024年~2034年 (US$ Mn, AGR (%))
図 66 北米量子センサー市場魅力度指数
図 67 北米の地域別量子センサー市場(2024 年、2029 年、2034 年)(百万米ドル
図 68 北米の量子センサー市場:金額ベース(2024~2034年、100万米ドル、AGR (%)
図 69 北米の量子センサー国別市場、2024~2034年 (US$ Mn, AGR (%))
図 70 北米の量子センサー国別市場シェア予測、2024 年~2034 年 (%)
図71 北米の量子センサー市場:部品別(2024年~2034年、100万米ドル、AGR (%)
図 72 北米量子センサー市場:コンポーネント別シェア予測、2024年~2034年 (%)
図73 北米の量子センサー市場:アプリケーション別、2024年~2034年 (US$ Mn, AGR (%))
図 74 北米の量子センサー市場:用途別シェア予測、2024年~2034年 (%)
図75 2024~2034年北米量子センサー市場:プラットフォーム別 (US$ Mn, AGR (%))
図76 北米の量子センサー市場:プラットフォーム別シェア予測、2024年~2034年 (%)
図77 北米の量子センサー市場:製品タイプ別、2024年~2034年 (US$ Mn, AGR (%))
図78 北米量子センサー市場:製品タイプ別シェア予測、2024年~2034年 (%)
図 79 米国の量子センサー市場規模別予測(2024~2034 年) (US$ Mn, AGR (%))
図 80 カナダ量子センサー市場:金額 2024-2034 (US$ Mn, AGR (%))
図 81 欧州量子センサー市場魅力度指数
図 82 欧州量子センサー地域別市場(2024 年、2029 年、2034 年)(百万米ドル
図 83 欧州量子センサー市場:金額 2024-2034 (US$ Mn, AGR (%))
図 84 欧州量子センサー国別市場、2024 年~2034 年 (US$ Mn, AGR (%))
図85 欧州量子センサー市場国別シェア予測、2024年~2034年 (%)
図86 欧州の量子センサー市場:部品別(2024年~2034年) (US$ Mn, AGR (%))
図 87 欧州量子センサー市場:コンポーネント別シェア予測、2024 年~2034 年 (%)
図 88 欧州量子センサー市場:アプリケーション別 2024-2034 (US$ Mn, AGR (%))
図 89 欧州量子センサー市場:用途別シェア予測、2024 年~2034 年 (%)
図90 欧州量子センサー市場:プラットフォーム別 2024年~2034年 (US$ Mn, AGR (%))
図91 欧州量子センサー市場:プラットフォーム別シェア予測、2024年~2034年 (%)
図92 欧州量子センサー市場:製品タイプ別、2024年~2034年 (US$ Mn, AGR (%))
図 93 欧州量子センサー市場:製品タイプ別シェア予測、2024年~2034年 (%)
図 94 ドイツ量子センサー市場:金額ベース、2024年~2034年 (US$ Mn, AGR (%))
図 95 イギリス量子センサー市場:金額 2024-2034 (US$ Mn, AGR (%))
図 96 フランス量子センサー市場:金額 2024-2034 (US$ Mn, AGR (%))
図 97 イタリア量子センサー市場:金額 2024-2034 (US$ Mn, AGR (%))
図 98 スペインの量子センサー市場:金額(US$ Mn、AGR (%)
図 99 その他のヨーロッパの量子センサー市場:金額 2024-2034 (US$ Mn, AGR (%))
図 100 アジア太平洋地域の量子センサー市場魅力度指数
図 101 アジア太平洋地域の量子センサー地域別市場(2024 年、2029 年、2034 年)(百万米ドル
図102 アジア太平洋地域の量子センサー市場:金額ベース、2024年~2034年(百万米ドル、AGR (%)
図103 アジア太平洋地域の量子センサー国別市場、2024年~2034年 (US$ Mn, AGR (%))
図104 アジア太平洋地域の量子センサー国別市場シェア予測、2024年~2034年 (%)
図105 アジア太平洋地域の量子センサーのコンポーネント別市場 2024-2034 (US$ Mn, AGR (%))
図106 アジア太平洋地域の量子センサー市場:コンポーネント別シェア予測、2024年~2034年 (%)
図107 アジア太平洋地域の量子センサー市場:アプリケーション別、2024年~2034年 (US $ Mn, AGR (%))
図108 アジア太平洋地域の量子センサー市場:用途別シェア予測、2024年~2034年 (%)
図109 アジア太平洋地域の量子センサー市場:プラットフォーム別 2024年~2034年 (US$ Mn, AGR (%))
図110 アジア太平洋地域の量子センサー市場:プラットフォーム別シェア予測、2024年~2034年 (%)
図111 アジア太平洋地域の量子センサー市場:製品タイプ別、2024年~2034年 (US$ Mn, AGR (%))
図112 アジア太平洋地域の量子センサー市場:製品タイプ別シェア予測、2024年~2034年 (%)
図 113 中国量子センサー市場:金額 2024-2034 (US$ Mn, AGR (%))
図 114 インド量子センサー市場:金額 2024-2034 (US$ Mn, AGR (%))
図 115 日本の量子センサー市場:金額 2024-2034 (US$ Mn, AGR (%))
図 116 韓国量子センサー市場:金額 2024-2034 (US$ Mn, AGR (%))
図 117 オーストラリアの量子センサー市場:金額(US$ Mn、AGR (%)
図 118 その他のアジア太平洋地域の量子センサー市場:金額 2024-2034 (US$ Mn, AGR (%))
図 119 中東・アフリカ量子センサー市場魅力度指数
図 120 中東・アフリカ地域別量子センサー市場(2024 年、2029 年、2034 年)(百万米ドル
図 121 中東・アフリカ量子センサー市場:金額ベース、2024 年~2034 年(百万米ドル、AGR (%)
図 122 中東・アフリカ量子センサー国別市場:2024~2034 年 (US$ Mn, AGR (%))
図 123 中東・アフリカ量子センサー国別市場予測、2024~2034 年 (US$ Mn, AGR (%))
図 124 中東・アフリカ量子センサー部品別市場予測:2024~2034年 (US$ Mn, AGR (%))
図 125 中東・アフリカ量子センサー市場:コンポーネント別シェア予測、2024 年~2034 年 (%)
図 126 中東・アフリカ量子センサー市場:用途別予測(2024~2034 年) (US$ Mn, AGR (%))
図 127 中東・アフリカ量子センサー市場用途別シェア予測、2024~2034 年 (%)
図 128 中東・アフリカの量子センサー市場:プラットフォーム別予測(2024~2034 年) (US$ Mn, AGR (%))
図 129 中東・アフリカ量子センサー市場:プラットフォーム別シェア予測、2024~2034 年 (%)
図 130 中東・アフリカ量子センサー市場:製品タイプ別予測(2024~2034年、100万米ドル、AGR (%)
図 131 2024~2034 年における中東・アフリカ量子センサー市場製品タイプ別シェア予測 (%)
図 132 GCC 量子センサ市場規模別予測(2024~2034 年) (US$ Mn, AGR (%))
図 133 南アフリカの量子センサー市場:金額(US$ Mn、AGR (%)
図 134 中東・アフリカの残りの地域の量子センサー市場:金額(US$ Mn、AGR (%)
図 135 中南米の量子センサー市場魅力度指数
図 136 中南米の地域別量子センサー市場(2024 年、2029 年、2034 年)(百万米ドル
図 137 ラテンアメリカの量子センサー市場:金額ベース(2024~2034年、100万米ドル、AGR (%)
図 138 ラテンアメリカの量子センサー国別市場:2024~2034年 (US$ Mn, AGR (%))
図139 中南米の量子センサー国別市場シェア予測、2024年~2034年 (%)
図140 中南米の量子センサー市場:部品別(2024年~2034年、100万米ドル、AGR (%)
図141 中南米の量子センサー市場:コンポーネント別シェア予測、2024年~2034年 (%)
図142 ラテンアメリカの量子センサー市場:用途別(2024年~2034年、100万米ドル、AGR (%)
図143 ラテンアメリカの量子センサー市場:用途別シェア予測、2024年~2034年 (%)
図144 ラテンアメリカの量子センサー市場:プラットフォーム別 (2024-2034) (US$ Mn, AGR (%))
図 145 中南米の量子センサー市場:プラットフォーム別シェア予測、2024年~2034年 (%)
図 146 ラテンアメリカの量子センサー市場:製品タイプ別(2024年~2034年、100万米ドル、AGR (%)
図 147 ラテンアメリカの量子センサー市場:製品タイプ別シェア予測、2024 年~2034 年 (%)
図 148 ブラジル量子センサー市場:金額ベース、2024~2034 年 (US$ Mn, AGR (%))
図 149 メキシコ量子センサー市場:金額 2024-2034 (US$ Mn, AGR (%))
図 150 その他のラテンアメリカの量子センサー市場:金額 2024-2034 (US$ Mn, AGR (%))
ページTOPに戻る
Summary
Report Details
The Quantum Sensors Market Report 2024-2034: This report will prove invaluable to leading firms striving for new revenue pockets if they wish to better understand the industry and its underlying dynamics. It will be useful for companies that would like to expand into different industries or to expand their existing operations in a new region.
Advancements in Quantum Technology and Research
The global quantum sensors market is significantly driven by advancements in quantum technology and research. As scientific understanding of quantum mechanics improves, the development of more sophisticated and sensitive quantum sensors becomes possible. Quantum sensors exploit the principles of superposition and entanglement to measure physical quantities with unprecedented accuracy. For example, research institutions such as the Massachusetts Institute of Technology (MIT) and companies like IBM and Google are investing heavily in quantum research. These advancements are leading to the creation of highly sensitive magnetometers, gravimeters, and atomic clocks, which are crucial for various applications ranging from medical imaging to navigation. The continuous progress in quantum technology is expanding the potential applications of quantum sensors, making them more viable for commercial use and driving market growth.
Lack of Skilled Professionals Capable of Developing and Working with Quantum Technologies
One of the significant challenges hindering the quantum sensor market is the shortage of skilled professionals capable of developing and effectively working with quantum technologies. Quantum sensors, leveraging principles of quantum mechanics, require specialized knowledge in quantum computing, nanotechnology, and advanced physics. However, the pool of experts proficient in these fields remains limited, posing a bottleneck to the widespread adoption and advancement of quantum sensor technologies.
The complexity of quantum systems demands expertise not only in theoretical quantum mechanics but also in practical applications and experimental methodologies. Developing quantum sensors involves overcoming technical challenges such as maintaining quantum coherence, optimizing sensor performance, and integrating quantum systems with existing technologies. Without a sufficiently skilled workforce, companies and research institutions face delays in innovation cycles and may struggle to fully exploit the capabilities of quantum sensors across various industries.
What Questions Should You Ask before Buying a Market Research Report?
-
How is the quantum sensors market evolving?
-
What is driving and restraining the quantum sensors market?
-
How will each quantum sensors submarket segment grow over the forecast period and how much revenue will these submarkets account for in 2034?
-
How will the market shares for each quantum sensors submarket develop from 2024 to 2034?
-
What will be the main driver for the overall market from 2024 to 2034?
-
Will leading quantum sensors markets broadly follow the macroeconomic dynamics, or will individual national markets outperform others?
-
How will the market shares of the national markets change by 2034 and which geographical region will lead the market in 2034?
-
Who are the leading players and what are their prospects over the forecast period?
-
What are the quantum sensors projects for these leading companies?
-
How will the industry evolve during the period between 2024 and 2034? What are the implications of quantum sensors projects taking place now and over the next 10 years?
-
Is there a greater need for product commercialisation to further scale the quantum sensors market?
-
Where is the quantum sensors market heading and how can you ensure you are at the forefront of the market?
-
What are the best investment options for new product and service lines?
-
What are the key prospects for moving companies into a new growth path and C-suite?
You need to discover how this will impact the quantum sensors market today, and over the next 10 years:
-
Our 336-page report provides 112 tables and 150 charts/graphs exclusively to you.
-
The report highlights key lucrative areas in the industry so you can target them – NOW.
-
It contains in-depth analysis of global, regional and national sales and growth.
-
It highlights for you the key successful trends, changes and revenue projections made by your competitors.
This report tells you TODAY how the quantum sensors market will develop in the next 10 years, and in line with the variations in COVID-19 economic recession and bounce. This market is more critical now than at any point over the last 10 years.
Forecasts to 2034 and other analyses reveal commercial prospects
-
In addition to revenue forecasting to 2034, our new study provides you with recent results, growth rates, and market shares.
-
You will find original analyses, with business outlooks and developments.
-
Discover qualitative analyses (including market dynamics, drivers, opportunities, restraints and challenges), cost structure, impact of rising quantum sensors prices and recent developments.
This report includes data analysis and invaluable insight into how COVID-19 will affect the industry and your company. Four COVID-19 recovery patterns and their impact, namely, “V”, “L”, “W” and “U” are discussed in this report.
Segments Covered in the Report
Market Segment by Component
-
Quantum Dots
-
Quantum Cascade Lasers
-
Other Components
Market Segment by Application
-
Aerospace & Defence
-
Oil & Gas
-
Automotive
-
Other Applications
Market Segment by Platform
-
Neutral Atoms
-
Trapped Ions
-
Nuclear Magnetic Resonance
-
Optomechanics
-
Other Platforms
Market Segment by Product Type
-
Atomic Clocks
-
Magnetometers
-
Gradiometers
-
Imaging Devices
-
Quantum Metrology Devices
-
Other Products
In addition to the revenue predictions for the overall world market and segments, you will also find revenue forecasts for four regional and 20 leading national markets:
North America
Europe
-
Germany
-
Spain
-
United Kingdom
-
France
-
Italy
-
Rest of Europe
Asia Pacific
-
China
-
Japan
-
India
-
Australia
-
South Korea
-
Rest of Asia Pacific
Latin America
-
Brazil
-
Mexico
-
Rest of Latin America
Middle East & Africa
-
GCC
-
South Africa
-
Rest of Middle East & Africa
The report also includes profiles and for some of the leading companies in the Quantum Sensors Market, 2024 to 2034, with a focus on this segment of these companies’ operations.
Leading companies profiled in the report
-
AOSense, Inc.
-
Apogee Instruments, Inc.
-
Atomionics Pte. Ltd.
-
Campbell Scientific, Inc.
-
GEM Systems Inc
-
ID Quantique
-
Impedans Ltd
-
Kipp & Zonen
-
LI-COR, Inc.
-
M Squared Ltd
-
Nomad Atomics
-
Q-CTRL
-
Qnami
-
Sea-Bird Scientific
-
Skye Instruments Ltd
Overall world revenue for Quantum Sensors Market, 2024 to 2034 in terms of value the market will surpass US$638.6 million in 2024, our work calculates. We predict strong revenue growth through to 2034. Our work identifies which organizations hold the greatest potential. Discover their capabilities, progress, and commercial prospects, helping you stay ahead.
How will the Quantum Sensors Market, 2024 to 2034 report help you?
In summary, our 330+ page report provides you with the following knowledge:
-
Revenue forecasts to 2034 for Quantum Sensors Market, 2024 to 2034 Market, with forecasts for component, application, platform, and product type, each forecast at a global and regional level – discover the industry’s prospects, finding the most lucrative places for investments and revenues.
-
Revenue forecasts to 2034 for four regional and 20 key national markets – See forecasts for the Quantum Sensors Market, 2024 to 2034 market in North America, Europe, Asia-Pacific, Latin America and Middle East & Africa. Also forecasted is the market in the US, Canada, Brazil, Germany, France, UK, Italy, China, India, Japan, and Australia among other prominent economies.
-
Prospects for established firms and those seeking to enter the market – including company profiles for 15 of the major companies involved in the Quantum Sensors Market, 2024 to 2034.
Find quantitative and qualitative analyses with independent predictions. Receive information that only our report contains, staying informed with invaluable business intelligence.
Information found nowhere else
With our new report, you are less likely to fall behind in knowledge or miss out on opportunities. See how our work could benefit your research, analyses, and decisions. Visiongain’s study is for everybody needing commercial analyses for the Quantum Sensors Market, 2024 to 2034, market-leading companies. You will find data, trends and predictions.
ページTOPに戻る
Table of Contents
1 Report Overview
1.1 Objectives of the Study
1.2 Introduction to Quantum Sensors Market
1.3 What This Report Delivers
1.4 Why You Should Read This Report
1.5 Key Questions Answered by This Analytical Report
1.6 Who Is This Report for?
1.7 Methodology
1.7.1 Market Definitions
1.7.2 Market Evaluation & Forecasting Methodology
1.7.3 Data Validation
1.7.3.1 Primary Research
1.7.3.2 Secondary Research
1.8 Frequently Asked Questions (FAQs)
1.9 Associated Visiongain Reports
1.10 About Visiongain
2 Executive Summary
3 Market Overview
3.1 Key Findings
3.2 Market Dynamics
3.2.1 Market Driving Factors
3.2.1.1 Growing Use of Quantum Sensor in Space Industry
3.2.1.2 Emerging Biomedical and Health Sciences Market Driving the Market Growth
3.2.1.3 Rising Use of Quantum Sensors for Accurate Navigation in Oceanography and Marine Application
3.2.2 Market Restraining Factors
3.2.2.1 Lack of Skilled Professionals Capable of Developing and Working with Quantum Technologies
3.2.2.2 The Production of Quantum Sensors Involves Expensive Materials and Complex Manufacturing Processes
3.2.2.3 Regulatory Hurdles Hinder the Market Growth
3.2.3 Market Opportunities
3.2.3.1 Government and Private Sectors Investment Opportunities for the Market Growth
3.2.3.2 Collaboration and partnership Between Market Players Opportunities for the Market Growth
3.2.3.3 Launching New Products in the Quantum Sensor Market Opportunities for Market Growth
3.3 Porter’s Five Forces Analysis
3.3.1 Bargaining Power of Suppliers (Medium to High)
3.3.2 Bargaining Power of Buyers (Low)
3.3.3 Competitive Rivalry (Medium to High)
3.3.4 Threat from Substitutes (Low)
3.3.5 Threat of New Entrants (Medium)
3.4 COVID-19 Impact Analysis
3.4.1 “V-Shaped Recovery”
3.4.2 “U-Shaped Recovery”
3.4.3 “W-Shaped Recovery”
3.4.4 “L-Shaped Recovery”
3.5 PEST Analysis
4 Quantum Sensors Market Analysis by Component
4.1 Key Findings
4.2 Component Segment: Market Attractiveness Index
4.3 Quantum Sensors Market Size Estimation and Forecast by Component
4.4 Quantum Dots
4.4.1 Market Size by Region, 2024-2034 (US$ Million)
4.4.2 Market Share by Region, 2024 & 2034 (%)
4.5 Quantum Cascade Lasers
4.5.1 Market Size by Region, 2024-2034 (US$ Million)
4.5.2 Market Share by Region, 2024 & 2034 (%)
4.6 Other Components
4.6.1 Market Size by Region, 2024-2034 (US$ Million)
4.6.2 Market Share by Region, 2024 & 2034 (%)
5 Quantum Sensors Market Analysis by Application
5.1 Key Findings
5.2 Application Segment: Market Attractiveness Index
5.3 Quantum Sensors Market Size Estimation and Forecast by Application
5.4 Aerospace & Defence
5.4.1 Market Size by Region, 2024-2034 (US$ Million)
5.4.2 Market Share by Region, 2024 & 2034 (%)
5.5 Oil & Gas
5.5.1 Market Size by Region, 2024-2034 (US$ Million)
5.5.2 Market Share by Region, 2024 & 2034 (%)
5.6 Automotive
5.6.1 Market Size by Region, 2024-2034 (US$ Million)
5.6.2 Market Share by Region, 2024 & 2034 (%)
5.7 Other Applications
5.7.1 Market Size by Region, 2024-2034 (US$ Million)
5.7.2 Market Share by Region, 2024 & 2034 (%)
6 Quantum Sensors Market Analysis by Platform
6.1 Key Findings
6.2 Platform Segment: Market Attractiveness Index
6.3 Quantum Sensors Market Size Estimation and Forecast by Platform
6.4 Neutral Atoms
6.4.1 Market Size by Region, 2024-2034 (US$ Million)
6.4.2 Market Share by Region, 2024 & 2034 (%)
6.5 Trapped Ions
6.5.1 Market Size by Region, 2024-2034 (US$ Million)
6.5.2 Market Share by Region, 2024 & 2034 (%)
6.6 Nuclear Magnetic Resonance
6.6.1 Market Size by Region, 2024-2034 (US$ Million)
6.6.2 Market Share by Region, 2024 & 2034 (%)
6.7 Opto-mechanics
6.7.1 Market Size by Region, 2024-2034 (US$ Million)
6.7.2 Market Share by Region, 2024 & 2034 (%)
6.8 Other Platforms
6.8.1 Market Size by Region, 2024-2034 (US$ Million)
6.8.2 Market Share by Region, 2024 & 2034 (%)
7 Quantum Sensors Market Analysis by Product Type
7.1 Key Findings
7.2 Product Type Segment: Market Attractiveness Index
7.3 Quantum Sensors Market Size Estimation and Forecast by Product Type
7.4 Atomic Clocks
7.4.1 Market Size by Region, 2024-2034 (US$ Million)
7.4.2 Market Share by Region, 2024 & 2034 (%)
7.5 Magnetometers
7.5.1 Market Size by Region, 2024-2034 (US$ Million)
7.5.2 Market Share by Region, 2024 & 2034 (%)
7.6 Gradiometers
7.6.1 Market Size by Region, 2024-2034 (US$ Million)
7.6.2 Market Share by Region, 2024 & 2034 (%)
7.7 Imaging Devices
7.7.1 Market Size by Region, 2024-2034 (US$ Million)
7.7.2 Market Share by Region, 2024 & 2034 (%)
7.8 Quantum Metrology Devices
7.8.1 Market Size by Region, 2024-2034 (US$ Million)
7.8.2 Market Share by Region, 2024 & 2034 (%)
7.9 Other Products
7.9.1 Market Size by Region, 2024-2034 (US$ Million)
7.9.2 Market Share by Region, 2024 & 2034 (%)
8 Quantum Sensors Market Analysis by Region
8.1 Key Findings
8.2 Regional Market Size Estimation and Forecast
9 North America Quantum Sensors Market Analysis
9.1 Key Findings
9.2 North America Quantum Sensors Market Attractiveness Index
9.3 North America Quantum Sensors Market by Country, 2024, 2029 & 2034 (US$ Million)
9.4 North America Quantum Sensors Market Size Estimation and Forecast
9.5 North America Quantum Sensors Market Size Estimation and Forecast by Country
9.6 North America Quantum Sensors Market Size Estimation and Forecast by Component
9.7 North America Quantum Sensors Market Size Estimation and Forecast by Application
9.8 North America Quantum Sensors Market Size Estimation and Forecast by Platform
9.9 North America Quantum Sensors Market Size Estimation and Forecast by Product Type
9.10 U.S. Quantum Sensors Market Analysis
9.11 Canada Quantum Sensors Market Analysis
10 Europe Quantum Sensors Market Analysis
10.1 Key Findings
10.2 Europe Quantum Sensors Market Attractiveness Index
10.3 Europe Quantum Sensors Market by Country, 2024, 2029 & 2034 (US$ Million)
10.4 Europe Quantum Sensors Market Size Estimation and Forecast
10.5 Europe Quantum Sensors Market Size Estimation and Forecast by Country
10.6 Europe Quantum Sensors Market Size Estimation and Forecast by Component
10.7 Europe Quantum Sensors Market Size Estimation and Forecast by Application
10.8 Europe Quantum Sensors Market Size Estimation and Forecast by Platform
10.9 Europe Quantum Sensors Market Size Estimation and Forecast by Product Type
10.10 Germany Quantum Sensors Market Analysis
10.11 UK Quantum Sensors Market Analysis
10.12 France Quantum Sensors Market Analysis
10.13 Italy Quantum Sensors Market Analysis
10.14 Spain Quantum Sensors Market Analysis
10.15 Rest of Europe Quantum Sensors Market Analysis
11 Asia-Pacific Quantum Sensors Market Analysis
11.1 Key Findings
11.2 Asia-Pacific Quantum Sensors Market Attractiveness Index
11.3 Asia-Pacific Quantum Sensors Market by Country, 2024, 2029 & 2034 (US$ Million)
11.4 Asia-Pacific Quantum Sensors Market Size Estimation and Forecast
11.5 Asia-Pacific Quantum Sensors Market Size Estimation and Forecast by Country
11.6 Asia-Pacific Quantum Sensors Market Size Estimation and Forecast by Component
11.7 Asia-Pacific Quantum Sensors Market Size Estimation and Forecast by Application
11.8 Asia-Pacific Quantum Sensors Market Size Estimation and Forecast by Platform
11.9 Asia-Pacific Quantum Sensors Market Size Estimation and Forecast by Product Type
11.10 China Quantum Sensors Market Analysis
11.11 India Quantum Sensors Market Analysis
11.12 Japan Quantum Sensors Market Analysis
11.13 South Korea Quantum Sensors Market Analysis
11.14 Australia Quantum Sensors Market Analysis
11.15 Rest of Asia-Pacific Quantum Sensors Market Analysis
12 Middle East and Africa Quantum Sensors Market Analysis
12.1 Key Findings
12.2 Middle East and Africa Quantum Sensors Market Attractiveness Index
12.3 Middle East and Africa Quantum Sensors Market by Country, 2024, 2029 & 2034 (US$ Million)
12.4 Middle East and Africa Quantum Sensors Market Size Estimation and Forecast
12.5 Middle East and Africa Quantum Sensors Market Size Estimation and Forecast by Country
12.6 Middle East and Africa Quantum Sensors Market Size Estimation and Forecast by Component
12.7 Middle East and Africa Quantum Sensors Market Size Estimation and Forecast by Application
12.8 Middle East and Africa Quantum Sensors Market Size Estimation and Forecast by Platform
12.9 Middle East and Africa Quantum Sensors Market Size Estimation and Forecast by Product Type
12.10 GCC Quantum Sensors Market Analysis
12.11 South Africa Quantum Sensors Market Analysis
12.12 Rest of Middle East & Africa Quantum Sensors Market Analysis
13 Latin America Quantum Sensors Market Analysis
13.1 Key Findings
13.2 Latin America Quantum Sensors Market Attractiveness Index
13.3 Latin America Quantum Sensors Market by Country, 2024, 2029 & 2034 (US$ Million)
13.4 Latin America Quantum Sensors Market Size Estimation and Forecast
13.5 Latin America Quantum Sensors Market Size Estimation and Forecast by Country
13.6 Latin America Quantum Sensors Market Size Estimation and Forecast by Component
13.7 Latin America Quantum Sensors Market Size Estimation and Forecast by Application
13.8 Latin America Quantum Sensors Market Size Estimation and Forecast by Platform
13.9 Latin America Quantum Sensors Market Size Estimation and Forecast by Product Type
13.10 Brazil Quantum Sensors Market Analysis
13.11 Mexico Quantum Sensors Market Analysis
13.12 Rest of Latin America Quantum Sensors Market Analysis
14 Company Profiles
14.1 Strategic Outlook
14.2 Apogee Instruments, Inc.
14.2.1 Company Snapshot
14.2.2 Company Overview
14.2.3 Product Benchmarking
14.3 ID Quantique
14.3.1 Company Snapshot
14.3.2 Company Overview
14.3.3 Product Benchmarking
14.3.4 Strategic Outlook
14.4 LI-COR, Inc.
14.4.1 Company Snapshot
14.4.2 Company Overview
14.4.3 Product Benchmarking
14.5 M Squared Ltd
14.5.1 Company Snapshot
14.5.2 Company Overview
14.5.3 Product Benchmarking
14.6 AOSense, Inc.
14.6.1 Company Snapshot
14.6.2 Company Overview
14.6.3 Product Benchmarking
14.7 Campbell Scientific, Inc.
14.7.1 Company Snapshot
14.7.2 Company Overview
14.7.3 Product Benchmarking
14.8 Impedans Ltd
14.8.1 Company Snapshot
14.8.2 Company Overview
14.8.3 Product Benchmarking
14.9 Kipp & Zonen
14.9.1 Company Snapshot
14.9.2 Company Overview
14.9.3 Product Benchmarking
14.10 Sea-Bird Scientific
14.10.1 Company Snapshot
14.10.2 Company Overview
14.10.3 Product Benchmarking
14.11 Atomionics Pte. Ltd.
14.11.1 Company Snapshot
14.11.2 Company Overview
14.11.3 Product Benchmarking
14.12 GEM Systems Inc
14.12.1 Company Snapshot
14.12.2 Company Overview
14.12.3 Product Benchmarking
14.13 Nomad Atomics
14.13.1 Company Snapshot
14.13.2 Company Overview
14.13.3 Product Benchmarking
14.14 Q-CTRL
14.14.1 Company Snapshot
14.14.2 Company Overview
14.14.3 Product Benchmarking
14.14.4 Strategic Outlook
14.15 Qnami
14.15.1 Company Snapshot
14.15.2 Company Overview
14.15.3 Product Benchmarking
14.15.4 Strategic Outlook
14.16 Skye Instruments Ltd
14.16.1 Company Snapshot
14.16.2 Company Overview
14.16.3 Product Benchmarking
15 Conclusion and Recommendations
15.1 Concluding Remarks from Visiongain
15.2 Recommendations for Market Players
ページTOPに戻る
List of Tables/Graphs
List of Tables
Table 1 Quantum Sensors Market Snapshot, 2024 & 2034 (US$ Million, CAGR %)
Table 2 Global Quantum Sensors Market by Region, 2024-2034 (US$ Mn, AGR (%), CAGR (%)) (V-Shaped Recovery Scenario)
Table 3 Global Quantum Sensors Market by Region, 2024-2034 (US$ Mn, AGR (%), CAGR (%)) (U-Shaped Recovery Scenario)
Table 4 Global Quantum Sensors Market by Region, 2024-2034 (US$ Mn, AGR (%), CAGR (%)) (W-Shaped Recovery Scenario)
Table 5 Global Quantum Sensors Market by Region, 2024-2034 (US$ Mn, AGR (%), CAGR (%)) (L-Shaped Recovery Scenario)
Table 6 Global Quantum Sensors Market by Component, 2024-2034 (US$ Mn, AGR (%), CAGR (%))
Table 7 Quantum Dots Market by Region, 2024-2034 (US$ Mn, AGR (%), CAGR (%))
Table 8 Quantum Cascade Lasers Market by Region, 2024-2034 (US$ Mn, AGR (%), CAGR (%))
Table 9 Other Components Market by Region, 2024-2034 (US$ Mn, AGR (%), CAGR (%))
Table 10 Global Quantum Sensors Market by Application, 2024-2034 (US$ Mn, AGR (%), CAGR (%))
Table 11 Aerospace & Defence Market by Region, 2024-2034 (US$ Mn, AGR (%), CAGR (%))
Table 12 Oil & Gas Market by Region, 2024-2034 (US$ Mn, AGR (%), CAGR (%))
Table 13 Automotive Market by Region, 2024-2034 (US$ Mn, AGR (%), CAGR (%))
Table 14 Other Applications Market by Region, 2024-2034 (US$ Mn, AGR (%), CAGR (%))
Table 15 Global Quantum Sensors Market by Platform, 2024-2034 (US$ Mn, AGR (%), CAGR (%))
Table 16 Neutral Atoms Market by Region, 2024-2034 (US$ Mn, AGR (%), CAGR (%))
Table 17 Trapped Ions Market by Region, 2024-2034 (US$ Mn, AGR (%), CAGR (%))
Table 18 Nuclear Magnetic Resonance Market by Region, 2024-2034 (US$ Mn, AGR (%), CAGR (%))
Table 19 Opto-mechanics Market by Region, 2024-2034 (US$ Mn, AGR (%), CAGR (%))
Table 20 Other Platforms Market by Region, 2024-2034 (US$ Mn, AGR (%), CAGR (%))
Table 21 Global Quantum Sensors Market by Product Type, 2024-2034 (US$ Mn, AGR (%), CAGR (%))
Table 22 Atomic Clocks Market by Region, 2024-2034 (US$ Mn, AGR (%), CAGR (%))
Table 23 Magnetometers Market by Region, 2024-2034 (US$ Mn, AGR (%), CAGR (%))
Table 24 Gradiometers Market by Region, 2024-2034 (US$ Mn, AGR (%), CAGR (%))
Table 25 Imaging Devices Market by Region, 2024-2034 (US$ Mn, AGR (%), CAGR (%))
Table 26 Quantum Metrology Devices Market by Region, 2024-2034 (US$ Mn, AGR (%), CAGR (%))
Table 27 Other Products Market by Region, 2024-2034 (US$ Mn, AGR (%), CAGR (%))
Table 28 Global Quantum Sensors Market by Region, 2024-2034 (US$ Mn, AGR (%), CAGR (%))
Table 29 North America Quantum Sensors Market by Value, 2024-2034 (US$ Mn, AGR (%), CAGR (%))
Table 30 North America Quantum Sensors Market by Country, 2024-2034 (US$ Mn, AGR (%), CAGR (%))
Table 31 North America Quantum Sensors Market by Component, 2024-2034 (US$ Mn, AGR (%), CAGR (%))
Table 32 North America Quantum Sensors Market by Application, 2024-2034 (US$ Mn, AGR (%), CAGR (%))
Table 33 North America Quantum Sensors Market by Platform, 2024-2034 (US$ Mn, AGR (%), CAGR (%))
Table 34 North America Quantum Sensors Market by Product Type, 2024-2034 (US$ Mn, AGR (%), CAGR (%))
Table 35 US Quantum Sensors Market by Value, 2024-2034 (US$ Mn, AGR (%), CAGR (%))
Table 36 Canada Quantum Sensors Market by Value, 2024-2034 (US$ Mn, AGR (%), CAGR (%))
Table 37 Europe Quantum Sensors Market by Value, 2024-2034 (US$ Mn, AGR (%), CAGR (%))
Table 38 Europe Quantum Sensors Market by Country, 2024-2034 (US$ Mn, AGR (%), CAGR (%))
Table 39 Europe Quantum Sensors Market by Component, 2024-2034 (US$ Mn, AGR (%), CAGR (%))
Table 40 Europe Quantum Sensors Market by Application, 2024-2034 (US$ Mn, AGR (%), CAGR (%))
Table 41 Europe Quantum Sensors Market by Platform, 2024-2034 (US$ Mn, AGR (%), CAGR (%))
Table 42 Europe Quantum Sensors Market by Product Type, 2024-2034 (US$ Mn, AGR (%), CAGR (%))
Table 43 Germany Quantum Sensors Market by Value, 2024-2034 (US$ Mn, AGR (%), CAGR (%))
Table 44 UK Quantum Sensors Market by Value, 2024-2034 (US$ Mn, AGR (%), CAGR (%))
Table 45 France Quantum Sensors Market by Value, 2024-2034 (US$ Mn, AGR (%), CAGR (%))
Table 46 Italy Quantum Sensors Market by Value, 2024-2034 (US$ Mn, AGR (%), CAGR (%))
Table 47 Spain Quantum Sensors Market by Value, 2024-2034 (US$ Mn, AGR (%), CAGR (%))
Table 48 Rest of Europe Quantum Sensors Market by Value, 2024-2034 (US$ Mn, AGR (%), CAGR (%))
Table 49 Asia-Pacific Quantum Sensors Market by Value, 2024-2034 (US$ Mn, AGR (%), CAGR (%))
Table 50 Asia-Pacific Quantum Sensors Market by Country, 2024-2034 (US$ Mn, AGR (%), CAGR (%))
Table 51 Asia-Pacific Quantum Sensors Market by Component, 2024-2034 (US$ Mn, AGR (%), CAGR (%))
Table 52 Asia-Pacific Quantum Sensors Market by Application, 2024-2034 (US$ Mn, AGR (%), CAGR (%))
Table 53 Asia-Pacific Quantum Sensors Market by Platform, 2024-2034 (US$ Mn, AGR (%), CAGR (%))
Table 54 Asia-Pacific Quantum Sensors Market by Product Type, 2024-2034 (US$ Mn, AGR (%), CAGR (%))
Table 55 China Quantum Sensors Market by Value, 2024-2034 (US$ Mn, AGR (%), CAGR (%))
Table 56 India Quantum Sensors Market by Value, 2024-2034 (US$ Mn, AGR (%), CAGR (%))
Table 57 Japan Quantum Sensors Market by Value, 2024-2034 (US$ Mn, AGR (%), CAGR (%))
Table 58 South Korea Quantum Sensors Market by Value, 2024-2034 (US$ Mn, AGR (%), CAGR (%))
Table 59 Australia Quantum Sensors Market by Value, 2024-2034 (US$ Mn, AGR (%), CAGR (%))
Table 60 Rest of Asia-Pacific Quantum Sensors Market by Value, 2024-2034 (US$ Mn, AGR (%), CAGR (%))
Table 61 Middle East & Africa Quantum Sensors Market by Value, 2024-2034 (US$ Mn, AGR (%), CAGR (%))
Table 62 Middle East & Africa Quantum Sensors Market by Country, 2024-2034 (US$ Mn, AGR (%), CAGR (%))
Table 63 Middle East & Africa Quantum Sensors Market by Component, 2024-2034 (US$ Mn, AGR (%), CAGR (%))
Table 64 Middle East & Africa Quantum Sensors Market by Application, 2024-2034 (US$ Mn, AGR (%), CAGR (%))
Table 65 Middle East & Africa Quantum Sensors Market by Platform, 2024-2034 (US$ Mn, AGR (%), CAGR (%))
Table 66 Middle East & Africa Quantum Sensors Market by Product Type, 2024-2034 (US$ Mn, AGR (%), CAGR (%))
Table 67 GCC Quantum Sensors Market by Value, 2024-2034 (US$ Mn, AGR (%), CAGR (%))
Table 68 South Africa Quantum Sensors Market by Value, 2024-2034 (US$ Mn, AGR (%), CAGR (%))
Table 69 Rest of Middle East & Africa Quantum Sensors Market by Value, 2024-2034 (US$ Mn, AGR (%), CAGR (%))
Table 70 Latin America Quantum Sensors Market by Value, 2024-2034 (US$ Mn, AGR (%), CAGR (%))
Table 71 Latin America Quantum Sensors Market by Country, 2024-2034 (US$ Mn, AGR (%), CAGR (%))
Table 72 Latin America Quantum Sensors Market by Component, 2024-2034 (US$ Mn, AGR (%), CAGR (%))
Table 73 Latin America Quantum Sensors Market by Application, 2024-2034 (US$ Mn, AGR (%), CAGR (%))
Table 74 Latin America Quantum Sensors Market by Platform, 2024-2034 (US$ Mn, AGR (%), CAGR (%))
Table 75 Latin America Quantum Sensors Market by Product Type, 2024-2034 (US$ Mn, AGR (%), CAGR (%))
Table 76 Brazil Quantum Sensors Market by Value, 2024-2034 (US$ Mn, AGR (%), CAGR (%))
Table 77 Mexico Quantum Sensors Market by Value, 2024-2034 (US$ Mn, AGR (%), CAGR (%))
Table 78 Rest of Latin America Quantum Sensors Market by Value, 2024-2034 (US$ Mn, AGR (%), CAGR (%))
Table 79 Strategic Outlook Analysis
Table 80 Apogee Instruments, Inc.: Key Details, (CEO, HQ, Revenue, Founded, No. of Employees, Company Type, Website, Business Segment)
Table 81 Apogee Instruments, Inc.: Product Benchmarking
Table 82 ID Quantique: Key Details, (CEO, HQ, Revenue, Founded, No. of Employees, Company Type, Website, Business Segment)
Table 83 ID Quantique: Product Benchmarking
Table 84 ID Quantique: Strategic Outlook
Table 85 LI-COR, Inc.: Key Details, (CEO, HQ, Revenue, Founded, No. of Employees, Company Type, Website, Business Segment)
Table 86 LI-COR, Inc.: Product Benchmarking
Table 87 M Squared Ltd: Key Details, (CEO, HQ, Revenue, Founded, No. of Employees, Company Type, Website, Business Segment)
Table 88 M Squared Ltd: Product Benchmarking
Table 89 AOSense, Inc.: Key Details, (CEO, HQ, Revenue, Founded, No. of Employees, Company Type, Website, Business Segment)
Table 90 AOSense, Inc.: Product Benchmarking
Table 91 Campbell Scientific, Inc.: Key Details, (CEO, HQ, Revenue, Founded, No. of Employees, Company Type, Website, Business Segment)
Table 92 Campbell Scientific, Inc.: Product Benchmarking
Table 93 Impedans Ltd: Key Details, (CEO, HQ, Revenue, Founded, No. of Employees, Company Type, Website, Business Segment)
Table 94 Impedans Ltd: Product Benchmarking
Table 95 OTT HydroMet: Key Details, (CEO, HQ, Revenue, Founded, No. of Employees, Company Type, Website, Business Segment)
Table 96 OTT HydroMet: Product Benchmarking
Table 97 Sea-Bird Scientific: Key Details, (CEO, HQ, Revenue, Founded, No. of Employees, Company Type, Website, Business Segment)
Table 98 Sea-Bird Scientific: Product Benchmarking
Table 99 Atomionics Pte. Ltd.: Key Details, (CEO, HQ, Revenue, Founded, No. of Employees, Company Type, Website, Business Segment)
Table 100 Atomionics Pte. Ltd.: Product Benchmarking
Table 101 GEM Systems Inc: Key Details, (CEO, HQ, Revenue, Founded, No. of Employees, Company Type, Website, Business Segment)
Table 102 GEM Systems Inc: Product Benchmarking
Table 103 Nomad Atomics: Key Details, (CEO, HQ, Revenue, Founded, No. of Employees, Company Type, Website, Business Segment)
Table 104 Nomad Atomics: Product Benchmarking
Table 105 Q-CTRL: Key Details, (CEO, HQ, Revenue, Founded, No. of Employees, Company Type, Website, Business Segment)
Table 106 Q-CTRL: Product Benchmarking
Table 107 Q-CTRL: Strategic Outlook
Table 108 Qnami: Key Details, (CEO, HQ, Revenue, Founded, No. of Employees, Company Type, Website, Business Segment)
Table 109 Qnami: Product Benchmarking
Table 110 Qnami: Strategic Outlook
Table 111 Skye Instruments Ltd: Key Details, (CEO, HQ, Revenue, Founded, No. of Employees, Company Type, Website, Business Segment)
Table 112 Skye Instruments Ltd: Product Benchmarking
List of Figures
Figure 1 Quantum Sensors Market Segmentation
Figure 2 Quantum Sensors Market by Component: Market Attractiveness Index
Figure 3 Quantum Sensors Market by Application: Market Attractiveness Index
Figure 4 Quantum Sensors Market by Platform: Market Attractiveness Index
Figure 5 Quantum Sensors Market by Product Type: Market Attractiveness Index
Figure 6 Quantum Sensors Market Attractiveness Index by Region
Figure 7 Quantum Sensors Market: Market Dynamics
Figure 8 Quantum Sensors Market: Porter’s Five Forces Analysis
Figure 9 Global Quantum Sensors Market Share Forecast by COVID, 2024-2034 (%)
Figure 10 Global Quantum Sensors Market by Region, 2024-2034 (US$ Mn, AGR (%)) (V-Shaped Recovery Scenario)
Figure 11 Global Quantum Sensors Market by Region, 2024-2034 (US$ Mn, AGR (%)) (U-Shaped Recovery Scenario)
Figure 12 Global Quantum Sensors Market by Region, 2024-2034 (US$ Mn, AGR (%)) (W-Shaped Recovery Scenario)
Figure 13 Global Quantum Sensors Market by Region, 2024-2034 (US$ Mn, AGR (%)) (L-Shaped Recovery Scenario)
Figure 14 Quantum Sensors Market: PEST Analysis
Figure 15 Quantum Sensors Market by Component: Market Attractiveness Index
Figure 16 Global Quantum Sensors Market by Component, 2024-2034 (US$ Mn, AGR (%))
Figure 17 Quantum Sensors Market Share Forecast by Component, 2024, 2029, 2034 (%)
Figure 18 Quantum Dots Market by Region, 2024-2034 (US$ Mn, AGR (%))
Figure 19 Quantum Dots Market Share Forecast by Region, 2024 & 2034 (%)
Figure 20 Quantum Cascade Lasers Market by Region, 2024-2034 (US$ Mn, AGR (%))
Figure 21 Quantum Cascade Lasers Market Share Forecast by Region, 2024 & 2034 (%)
Figure 22 Other Components Market by Region, 2024-2034 (US$ Mn, AGR (%))
Figure 23 Other Components Market Share Forecast by Region, 2024 & 2034 (%)
Figure 24 Quantum Sensors Market by Application: Market Attractiveness Index
Figure 25 Global Quantum Sensors Market by Application, 2024-2034 (US$ Mn, AGR (%))
Figure 26 Quantum Sensors Market Share Forecast by Application, 2024, 2029, 2034 (%)
Figure 27 Aerospace & Defence Market by Region, 2024-2034 (US$ Mn, AGR (%))
Figure 28 Aerospace & Defence Market Share Forecast by Region, 2024 & 2034 (%)
Figure 29 Oil & Gas Market by Region, 2024-2034 (US$ Mn, AGR (%))
Figure 30 Oil & Gas Market Share Forecast by Region, 2024 & 2034 (%)
Figure 31 Automotive Market by Region, 2024-2034 (US$ Mn, AGR (%))
Figure 32 Automotive Market Share Forecast by Region, 2024 & 2034 (%)
Figure 33 Other Applications Market by Region, 2024-2034 (US$ Mn, AGR (%))
Figure 34 Other Applications Market Share Forecast by Region, 2024 & 2034 (%)
Figure 35 Quantum Sensors Market by Platform: Market Attractiveness Index
Figure 36 Global Quantum Sensors Market by Platform, 2024-2034 (US$ Mn, AGR (%))
Figure 37 Quantum Sensors Market Share Forecast by Platform, 2024, 2029, 2034 (%)
Figure 38 Neutral Atoms Market by Region, 2024-2034 (US$ Mn, AGR (%))
Figure 39 Neutral Atoms Market Share Forecast by Region, 2024 & 2034 (%)
Figure 40 Trapped Ions Market by Region, 2024-2034 (US$ Mn, AGR (%))
Figure 41 Trapped Ions Market Share Forecast by Region, 2024 & 2034 (%)
Figure 42 Nuclear Magnetic Resonance Market by Region, 2024-2034 (US$ Mn, AGR (%))
Figure 43 Nuclear Magnetic Resonance Market Share Forecast by Region, 2024 & 2034 (%)
Figure 44 Opto-mechanics Market by Region, 2024-2034 (US$ Mn, AGR (%))
Figure 45 Opto-mechanics Market Share Forecast by Region, 2024 & 2034 (%)
Figure 46 Other Platforms Market by Region, 2024-2034 (US$ Mn, AGR (%))
Figure 47 Other Platforms Market Share Forecast by Region, 2024 & 2034 (%)
Figure 48 Quantum Sensors Market by Product Type: Market Attractiveness Index
Figure 49 Global Quantum Sensors Market by Product Type, 2024-2034 (US$ Mn, AGR (%))
Figure 50 Quantum Sensors Market Share Forecast by Product Type, 2024, 2029, 2034 (%)
Figure 51 Atomic Clocks Market by Region, 2024-2034 (US$ Mn, AGR (%))
Figure 52 Atomic Clocks Market Share Forecast by Region, 2024 & 2034 (%)
Figure 53 Magnetometers Market by Region, 2024-2034 (US$ Mn, AGR (%))
Figure 54 Magnetometers Market Share Forecast by Region, 2024 & 2034 (%)
Figure 55 Gradiometers Market by Region, 2024-2034 (US$ Mn, AGR (%))
Figure 56 Gradiometers Market Share Forecast by Region, 2024 & 2034 (%)
Figure 57 Imaging Devices Market by Region, 2024-2034 (US$ Mn, AGR (%))
Figure 58 Imaging Devices Market Share Forecast by Region, 2024 & 2034 (%)
Figure 59 Quantum Metrology Devices Market by Region, 2024-2034 (US$ Mn, AGR (%))
Figure 60 Quantum Metrology Devices Market Share Forecast by Region, 2024 & 2034 (%)
Figure 61 Other Products Market by Region, 2024-2034 (US$ Mn, AGR (%))
Figure 62 Other Products Market Share Forecast by Region, 2024 & 2034 (%)
Figure 63 Quantum Sensors Market Forecast by Region 2024 and 2034 (Revenue, CAGR%)
Figure 64 Quantum Sensors Market Share Forecast by Region 2024, 2029, 2034 (%)
Figure 65 Global Quantum Sensors Market by Region, 2024-2034 (US$ Mn, AGR (%))
Figure 66 North America Quantum Sensors Market Attractiveness Index
Figure 67 North America Quantum Sensors Market by Region, 2024, 2029 & 2034 (US$ Million)
Figure 68 North America Quantum Sensors Market by Value, 2024-2034 (US$ Mn, AGR (%))
Figure 69 North America Quantum Sensors Market by Country, 2024-2034 (US$ Mn, AGR (%))
Figure 70 North America Quantum Sensors Market Share Forecast by Country, 2024 & 2034 (%)
Figure 71 North America Quantum Sensors Market by Component, 2024-2034 (US$ Mn, AGR (%))
Figure 72 North America Quantum Sensors Market Share Forecast Component, 2024 & 2034 (%)
Figure 73 North America Quantum Sensors Market by Application, 2024-2034 (US$ Mn, AGR (%))
Figure 74 North America Quantum Sensors Market Share Forecast by Application, 2024 & 2034 (%)
Figure 75 North America Quantum Sensors Market by Platform, 2024-2034 (US$ Mn, AGR (%))
Figure 76 North America Quantum Sensors Market Share Forecast by Platform, 2024 & 2034 (%)
Figure 77 North America Quantum Sensors Market by Product Type, 2024-2034 (US$ Mn, AGR (%))
Figure 78 North America Quantum Sensors Market Share Forecast by Product Type, 2024 & 2034 (%)
Figure 79 US Quantum Sensors Market by Value, 2024-2034 (US$ Mn, AGR (%))
Figure 80 Canada Quantum Sensors Market by Value, 2024-2034 (US$ Mn, AGR (%))
Figure 81 Europe Quantum Sensors Market Attractiveness Index
Figure 82 Europe Quantum Sensors Market by Region, 2024, 2029 & 2034 (US$ Million)
Figure 83 Europe Quantum Sensors Market by Value, 2024-2034 (US$ Mn, AGR (%))
Figure 84 Europe Quantum Sensors Market by Country, 2024-2034 (US$ Mn, AGR (%))
Figure 85 Europe Quantum Sensors Market Share Forecast by Country, 2024 & 2034 (%)
Figure 86 Europe Quantum Sensors Market by Component, 2024-2034 (US$ Mn, AGR (%))
Figure 87 Europe Quantum Sensors Market Share Forecast Component, 2024 & 2034 (%)
Figure 88 Europe Quantum Sensors Market by Application, 2024-2034 (US$ Mn, AGR (%))
Figure 89 Europe Quantum Sensors Market Share Forecast by Application, 2024 & 2034 (%)
Figure 90 Europe Quantum Sensors Market by Platform, 2024-2034 (US$ Mn, AGR (%))
Figure 91 Europe Quantum Sensors Market Share Forecast by Platform, 2024 & 2034 (%)
Figure 92 Europe Quantum Sensors Market by Product Type, 2024-2034 (US$ Mn, AGR (%))
Figure 93 Europe Quantum Sensors Market Share Forecast by Product Type, 2024 & 2034 (%)
Figure 94 Germany Quantum Sensors Market by Value, 2024-2034 (US$ Mn, AGR (%))
Figure 95 UK Quantum Sensors Market by Value, 2024-2034 (US$ Mn, AGR (%))
Figure 96 France Quantum Sensors Market by Value, 2024-2034 (US$ Mn, AGR (%))
Figure 97 Italy Quantum Sensors Market by Value, 2024-2034 (US$ Mn, AGR (%))
Figure 98 Spain Quantum Sensors Market by Value, 2024-2034 (US$ Mn, AGR (%))
Figure 99 Rest of Europe Quantum Sensors Market by Value, 2024-2034 (US$ Mn, AGR (%))
Figure 100 Asia-Pacific Quantum Sensors Market Attractiveness Index
Figure 101 Asia-Pacific Quantum Sensors Market by Region, 2024, 2029 & 2034 (US$ Million)
Figure 102 Asia-Pacific Quantum Sensors Market by Value, 2024-2034 (US$ Mn, AGR (%))
Figure 103 Asia-Pacific Quantum Sensors Market by Country, 2024-2034 (US$ Mn, AGR (%))
Figure 104 Asia-Pacific Quantum Sensors Market Share Forecast by Country, 2024 & 2034 (%)
Figure 105 Asia-Pacific Quantum Sensors Market by Component, 2024-2034 (US$ Mn, AGR (%))
Figure 106 Asia-Pacific Quantum Sensors Market Share Forecast Component, 2024 & 2034 (%)
Figure 107 Asia-Pacific Quantum Sensors Market by Application, 2024-2034 (US$ Mn, AGR (%))
Figure 108 Asia-Pacific Quantum Sensors Market Share Forecast by Application, 2024 & 2034 (%)
Figure 109 Asia-Pacific Quantum Sensors Market by Platform, 2024-2034 (US$ Mn, AGR (%))
Figure 110 Asia-Pacific Quantum Sensors Market Share Forecast by Platform, 2024 & 2034 (%)
Figure 111 Asia-Pacific Quantum Sensors Market by Product Type, 2024-2034 (US$ Mn, AGR (%))
Figure 112 Asia-Pacific Quantum Sensors Market Share Forecast by Product Type, 2024 & 2034 (%)
Figure 113 China Quantum Sensors Market by Value, 2024-2034 (US$ Mn, AGR (%))
Figure 114 India Quantum Sensors Market by Value, 2024-2034 (US$ Mn, AGR (%))
Figure 115 Japan Quantum Sensors Market by Value, 2024-2034 (US$ Mn, AGR (%))
Figure 116 South Korea Quantum Sensors Market by Value, 2024-2034 (US$ Mn, AGR (%))
Figure 117 Australia Quantum Sensors Market by Value, 2024-2034 (US$ Mn, AGR (%))
Figure 118 Rest of Asia-Pacific Quantum Sensors Market by Value, 2024-2034 (US$ Mn, AGR (%))
Figure 119 Middle East and Africa Quantum Sensors Market Attractiveness Index
Figure 120 Middle East and Africa Quantum Sensors Market by Region, 2024, 2029 & 2034 (US$ Million)
Figure 121 Middle East & Africa Quantum Sensors Market by Value, 2024-2034 (US$ Mn, AGR (%))
Figure 122 Middle East & Africa Quantum Sensors Market by Country, 2024-2034 (US$ Mn, AGR (%))
Figure 123 Middle East and Africa Quantum Sensors Market Share Forecast by Country, 2024 & 2034 (%)
Figure 124 Middle East & Africa Quantum Sensors Market by Component, 2024-2034 (US$ Mn, AGR (%))
Figure 125 Middle East and Africa Quantum Sensors Market Share Forecast Component, 2024 & 2034 (%)
Figure 126 Middle East & Africa Quantum Sensors Market by Application, 2024-2034 (US$ Mn, AGR (%))
Figure 127 Middle East and Africa Quantum Sensors Market Share Forecast by Application, 2024 & 2034 (%)
Figure 128 Middle East & Africa Quantum Sensors Market by Platform, 2024-2034 (US$ Mn, AGR (%))
Figure 129 Middle East and Africa Quantum Sensors Market Share Forecast by Platform, 2024 & 2034 (%)
Figure 130 Middle East & Africa Quantum Sensors Market by Product Type, 2024-2034 (US$ Mn, AGR (%))
Figure 131 Middle East and Africa Quantum Sensors Market Share Forecast by Product Type, 2024 & 2034 (%)
Figure 132 GCC Quantum Sensors Market by Value, 2024-2034 (US$ Mn, AGR (%))
Figure 133 South Africa Quantum Sensors Market by Value, 2024-2034 (US$ Mn, AGR (%))
Figure 134 Rest of Middle East & Africa Quantum Sensors Market by Value, 2024-2034 (US$ Mn, AGR (%))
Figure 135 Latin America Quantum Sensors Market Attractiveness Index
Figure 136 Latin America Quantum Sensors Market by Region, 2024, 2029 & 2034 (US$ Million)
Figure 137 Latin America Quantum Sensors Market by Value, 2024-2034 (US$ Mn, AGR (%))
Figure 138 Latin America Quantum Sensors Market by Country, 2024-2034 (US$ Mn, AGR (%))
Figure 139 Latin America Quantum Sensors Market Share Forecast by Country, 2024 & 2034 (%)
Figure 140 Latin America Quantum Sensors Market by Component, 2024-2034 (US$ Mn, AGR (%))
Figure 141 Latin America Quantum Sensors Market Share Forecast Component, 2024 & 2034 (%)
Figure 142 Latin America Quantum Sensors Market by Application, 2024-2034 (US$ Mn, AGR (%))
Figure 143 Latin America Quantum Sensors Market Share Forecast by Application, 2024 & 2034 (%)
Figure 144 Latin America Quantum Sensors Market by Platform, 2024-2034 (US$ Mn, AGR (%))
Figure 145 Latin America Quantum Sensors Market Share Forecast by Platform, 2024 & 2034 (%)
Figure 146 Latin America Quantum Sensors Market by Product Type, 2024-2034 (US$ Mn, AGR (%))
Figure 147 Latin America Quantum Sensors Market Share Forecast by Product Type, 2024 & 2034 (%)
Figure 148 Brazil Quantum Sensors Market by Value, 2024-2034 (US$ Mn, AGR (%))
Figure 149 Mexico Quantum Sensors Market by Value, 2024-2034 (US$ Mn, AGR (%))
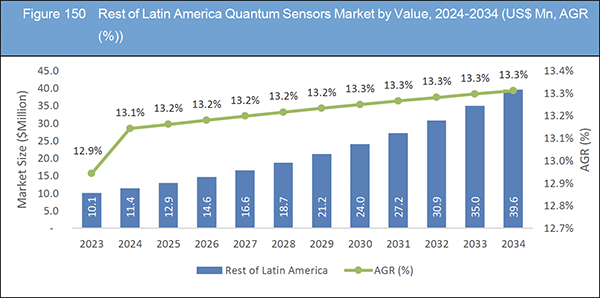
Figure 150 Rest of Latin America Quantum Sensors Market by Value, 2024-2034 (US$ Mn, AGR (%))
ページTOPに戻る
関連レポート(キーワード「センサ」)
よくあるご質問
Visiongain社はどのような調査会社ですか?
英国の調査会社ヴィジョンゲイン社(Visiongain)は、通信とエネルギーのほか、自動車や化学・医薬品、金属など、広範な市場を対象に調査を行っています。自動車市場については、市場全般に関する調査のほ... もっと見る
調査レポートの納品までの日数はどの程度ですか?
在庫のあるものは速納となりますが、平均的には 3-4日と見て下さい。
但し、一部の調査レポートでは、発注を受けた段階で内容更新をして納品をする場合もあります。
発注をする前のお問合せをお願いします。
注文の手続きはどのようになっていますか?
1)お客様からの御問い合わせをいただきます。
2)見積書やサンプルの提示をいたします。
3)お客様指定、もしくは弊社の発注書をメール添付にて発送してください。
4)データリソース社からレポート発行元の調査会社へ納品手配します。
5) 調査会社からお客様へ納品されます。最近は、pdfにてのメール納品が大半です。
お支払方法の方法はどのようになっていますか?
納品と同時にデータリソース社よりお客様へ請求書(必要に応じて納品書も)を発送いたします。
お客様よりデータリソース社へ(通常は円払い)の御振り込みをお願いします。
請求書は、納品日の日付で発行しますので、翌月最終営業日までの当社指定口座への振込みをお願いします。振込み手数料は御社負担にてお願いします。
お客様の御支払い条件が60日以上の場合は御相談ください。
尚、初めてのお取引先や個人の場合、前払いをお願いすることもあります。ご了承のほど、お願いします。
データリソース社はどのような会社ですか?
当社は、世界各国の主要調査会社・レポート出版社と提携し、世界各国の市場調査レポートや技術動向レポートなどを日本国内の企業・公官庁及び教育研究機関に提供しております。
世界各国の「市場・技術・法規制などの」実情を調査・収集される時には、データリソース社にご相談ください。
お客様の御要望にあったデータや情報を抽出する為のレポート紹介や調査のアドバイスも致します。
|
|


