サイバーセキュリティ市場レポート:2023-2033
Cyber Security Market Report 2023-2033
レポート詳細
サイバーセキュリティ市場レポート 2023-2033 :本レポートは、新たな収益の柱を目指す大手企業にとって、業界とその根底にある力学をより深く理解する上で貴重なものとなろう。異業種へ... もっと見る
※上記価格は部署ライセンス(Departmental licence)価格です。
その他の価格についてはデータリソースまでお問合せください。
日本語のページは自動翻訳を利用し作成しています。
実際のレポートは英文のみでご納品いたします。
サマリー
レポート詳細
サイバーセキュリティ市場レポート 2023-2033:本レポートは、新たな収益の柱を目指す大手企業にとって、業界とその根底にある力学をより深く理解する上で貴重なものとなろう。異業種への進出や、新たな地域での既存事業の拡大を希望する企業にとっても有用であろう。
サイバー脅威の増加
世界のサイバーセキュリティ市場は、サイバー脅威の絶え間ない拡大によって牽引されている。デジタルの世界が拡大するにつれ、サイバー犯罪者にとっての機会も拡大している。マルウェア、ランサムウェア、フィッシング攻撃、データ漏洩などのサイバー脅威は、高度化し、頻度も増加し続けている。このため各企業は、自社のデータ、インフラ、評判を保護するために、高度なサイバーセキュリティ・ソリューションへの投資を行わなければならなくなっている。その結果、サイバーセキュリティ市場は、企業が拡大し続けるサイバー脅威から身を守ろうとする中で、大幅な成長を遂げている。
堅牢なサイバーセキュリティ対策の導入は、特にリソースの限られた中小企業にとって高額になる可能性がある
強固なサイバーセキュリティ対策の実施は、相互接続された今日の世界において、デジタル資産や機密情報を保護する上で極めて重要な役割を果たしていることは間違いありません。しかし、そのようなセキュリティ対策の確立と維持に関連するコストは、特に限られたリソースで運営されている中小企業にとって大きな課題となり得ます。中小企業がしばしば直面する財政的な制約は、包括的なサイバーセキュリティ・ソリューションに投資する能力を妨げ、サイバー脅威に対してより脆弱な状態にする可能性があります。高度なセキュリティ技術の取得、定期的なセキュリティ評価の実施、人員のトレーニング、コンプライアンス要件への対応に関連する費用は、すでに厳しい予算を圧迫する可能性があります。その結果、これらの企業は、サイバーセキュリティに資金を割くか、その他の必要不可欠な業務に資金を割くか、難しい決断を迫られることになるかもしれません。
市場調査レポートを購入する前にすべき質問とは?
- サイバーセキュリティ市場はどのように進化しているのか?
- サイバーセキュリティ市場の推進要因と阻害要因は何か?
- 各サイバーセキュリティサブマーケットセグメントは予測期間中にどのように成長し、2033年にはどれくらいの収益を占めるようになるのか?
- 2023年から2033年にかけて、各サイバーセキュリティサブマーケットの市場シェアはどのように推移するのか?
- 2023年から2033年にかけて市場全体を牽引する主な要因は何か?
- 主要なサイバーセキュリティ市場はマクロ経済の動きに幅広く追随するのか、それとも個々の国内市場が他を凌駕するのか?
- 2033年までに各国市場のシェアはどのように変化し、2033年に市場をリードするのはどの地域か?
- 主要プレーヤーは誰か、また予測期間中の見通しはどうか。
- 主要企業のサイバーセキュリティ・プロジェクトとは?
- 2023年から2033年にかけて、業界はどのように進化していくのか?現在および今後10年間に実施されるサイバーセキュリティ・プロジェクトにはどのような意味があるのか?
- サイバーセキュリティ市場をさらに拡大するために、製品の商業化の必要性は高まっているのか?
- サイバーセキュリティ市場はどこへ向かい、どのようにすれば市場の最前線に立つことができるのか?
- 新製品やサービスラインに対する最適な投資オプションは何か?
- 企業を新たな成長軌道に乗せ、C-suiteに移行させるための重要な展望とは?
このことが現在、そして今後10年間のサイバーセキュリティ市場にどのような影響を与えるかを見極める必要がある:
- 478ページにわたる本レポートでは、138の表と209の図表を掲載しています。
- 本レポートでは、業界における主要な有利分野を取り上げているため、今すぐターゲットを絞ることができます。
- 本レポートには、世界、地域、国の売上と成長に関する詳細な分析が含まれています。
- 競合他社が成功した主なトレンド、変化、収益予測をハイライトしています。
本レポートは、サイバーセキュリティ市場が今後10年間でどのように発展するか、またCOVID-19の景気後退と好転の変動に合わせてどのように発展するかをお伝えします。この市場は、過去10年間のどの時点よりも今が重要である。
2033年までの予測やその他の分析から、商業的な展望が明らかになる
- 2033年までの収益予測に加え、直近の業績、成長率、市場シェアもご覧いただけます。
- ビジネスの展望と展開に関する独自の分析をご覧いただけます。
- 定性的分析(市場力学、促進要因、機会、阻害要因、課題を含む)、コスト構造、サイバーセキュリティ価格上昇の影響、最近の動向をご覧いただけます。
本レポートには、COVID-19が業界と貴社にどのような影響を与えるかについてのデータ分析と貴重な洞察が含まれている。本レポートでは、COVID-19の4つの回収パターンとその影響、すなわち「V」、「L」、「W」、「U」について論じている。
レポート対象セグメント
導入形態別市場セグメント
- クラウド
- オンプレミス
コンポーネント別市場セグメント
- ハードウェア
- ソフトウェア
- サービス
セキュリティタイプ別市場セグメント
- ネットワーク・セキュリティ
- クラウドセキュリティ
- アプリケーション・セキュリティ
- エンドポイントとIoTセキュリティ
業種別市場セグメント
- 政府機関
- BFSI
- IT & テレコム
- ヘルスケア
- その他の業種
ソフトウェア別市場セグメント
- アイデンティティ・アクセス管理(IAM)
- アンチウイルス/アンチマルウェア
- ログ管理とSIEM
- 暗号化とトークン化
- コンプライアンスとポリシー管理
- その他のソフトウェア
世界市場全体とセグメント別の収益予測に加え、4つの地域と20の主要国市場の収益予測も掲載しています:
北米
- アメリカ
- カナダ
欧州
- ドイツ
- スペイン
- イギリス
- フランス
- イタリア
- その他の欧州
アジア太平洋
- 中国
- 日本
- インド
- オーストラリア
- 韓国
- その他のアジア太平洋地域
ラテンアメリカ
- ブラジル
- メキシコ
- その他のラテンアメリカ
中東・アフリカ
- GCC
- 南アフリカ
- その他の中東・アフリカ
本レポートでは、2023年から2033年にかけてのサイバーセキュリティ市場における主要企業のプロファイルも掲載している。
報告書に掲載されている主要企業
・ Check Point Software Technologies Ltd
・ Cisco Systems, Inc.
・ CrowdStrike Holdings, Inc.
・ Fortinet, Inc.
・ Gen Digital Inc.
・ Imperva Inc.
・ International Business Machines Corporation (IBM)
・ McAfee Corp
・ Microsoft Corporation
・ Palo Alto Networks, Inc.
・ Proofpoint, Inc.
・ Qualys, Inc.
・ Splunk Inc.
・ Trellix
・ Trend Micro Inc.
2023年から2033年にかけてのサイバーセキュリティ市場全体の世界売上高(金額ベース)は、2023年に2,006億米ドルを突破する。2033年まで収益が大きく伸びると予測している。本調査では、最も大きな可能性を秘めた組織を特定しています。彼らの能力、進歩、商業的展望を発見し、一歩先を行くお手伝いをします。
サイバーセキュリティ市場、2023〜2033年」レポートはどのように役立つのか?
要約すると、470ページを超えるこのレポートは、以下の知識を提供する:
- サイバーセキュリティ市場の2023年から2033年までの収益予測 - 展開モード、コンポーネント、セキュリティタイプ、業種、ソフトウェア、各予測を世界レベルと地域レベルで掲載 - 業界の展望を発見し、投資と収益に最も有利な場所を見つけることができます。
- 4つの地域と20の主要国市場の2033年までの収益予測 - 北米、欧州、アジア太平洋、ラテンアメリカ、中東・アフリカのサイバーセキュリティ市場の2023年から2033年までの予測をご覧ください。また、米国、カナダ、ブラジル、ドイツ、フランス、英国、イタリア、中国、インド、日本、オーストラリアなどの主要国の市場も予測しています。
- 既存企業や市場参入を目指す企業の展望 - サイバーセキュリティ市場に関わる主要企業15社の企業プロファイルを含む、2023年から2033年までの市場。
独自の予測による定量的・定性的分析をご覧ください。私たちのレポートだけに含まれる情報を入手し、貴重なビジネスインテリジェンスで情報を得ることができます。
他では得られない情報
私たちの新しいレポートがあれば、知識に遅れをとったり、チャンスを逃したりする可能性が低くなります。弊社のレポートが貴社の調査、分析、意思決定にどのように役立つかをご覧ください。Visiongainの調査は、サイバーセキュリティ市場、2023年から2033年、市場をリードする企業の商業分析を必要とするすべての人のためのものです。データ、トレンド、予測をご覧いただけます。
ページTOPに戻る
目次
目次
1 レポート概要
1.1 研究の目的
1.2 サイバーセキュリティ市場の紹介
1.3 本レポートの内容
1.4 本レポートを読むべき理由
1.5 本分析レポートが回答する主な質問
1.6 本レポートの対象者
1.7 方法論
1.7.1 市場の定義
1.7.2 市場評価・予測手法
1.7.3 データの検証
1.7.3.1 一次調査
1.7.3.2 セカンダリーリサーチ
1.8 よくある質問(FAQ)
1.9 Visiongainの関連レポート
1.10 Visiongainについて
2 エグゼクティブ・サマリー
3 市場概要
3.1 主要な調査結果
3.2 市場ダイナミクス
3.2.1 市場牽引要因
3.2.1.1 機密データの保護が市場成長を促進する
3.2.1.2 市場成長を促進するサイバーセキュリティ戦略と行動計画
3.2.1.3 モノのインターネット(IoT)、機械学習、クラウドなどの技術の統合が市場成長を促進する
3.2.2 市場抑制要因
3.2.2.1 堅牢なサイバーセキュリティ対策の導入は、特にリソースの限られた中小企業にとっては高額になる可能性がある
3.2.2.2 最新ソフトウェアへの依存の高まりは、サイバー攻撃に対するコンピュータの脆弱性を増大させる
3.2.2.3 発展途上国の中小企業や新興企業の予算不足
3.2.3 市場機会
3.2.3.1 サイバーセキュリティは、競合他社やハッカーから企業秘密や知的財産を守るために使われることが多い
3.2.3.2 規制と政府の友好政策
3.2.3.3 BYODトレンドの増加によるエンドポイントセキュリティセグメントの成長
3.3 ポーターのファイブフォース分析
3.3.1 サプライヤーの交渉力(低~中)
3.3.2 買い手の交渉力(高)
3.3.3 競争力(中~高)
3.3.4 代替品による脅威(低)
3.3.5 新規参入の脅威(中~高)
3.4 COVID-19の影響分析
3.4.1 "V字型回復"
3.4.2 "U字型回復"
3.4.3 "W字型回復"
3.4.4 "L字型回復"
3.5 PEST分析
4 サイバーセキュリティ市場分析:導入形態別
4.1 主要な調査結果
4.2 導入形態セグメント 市場魅力度指数
4.3 導入形態別サイバーセキュリティ市場規模の推定と予測
4.4 クラウド
4.4.1 2023〜2033年の地域別市場規模(US$ Billion)
4.4.2 地域別市場シェア、2023年・2033年(%)
4.5 オンプレミス
4.5.1 2023~2033年の地域別市場規模(US$ Billion)
4.5.2 地域別市場シェア、2023年・2033年(%)
5 サイバーセキュリティ市場分析:コンポーネント別
5.1 主要調査結果
5.2 コンポーネントセグメント 市場魅力度指数
5.3 コンポーネント別サイバーセキュリティ市場規模の推定と予測
5.4 ハードウェア
5.4.1 2023〜2033年の地域別市場規模(US$ Billion)
5.4.2 地域別市場シェア、2023年・2033年(%)
5.5 ソフトウェア
5.5.1 2023~2033年の地域別市場規模(US$ Billion)
5.5.2 地域別市場シェア、2023年・2033年(%)
5.6 サービス
5.6.1 2023~2033年の地域別市場規模(US$ Billion)
5.6.2 地域別市場シェア、2023年・2033年(%)
6 サイバーセキュリティ市場分析:セキュリティタイプ別
6.1 主要な調査結果
6.2 セキュリティタイプ別セグメント 市場魅力度指数
6.3 セキュリティタイプ別サイバーセキュリティ市場規模推定と予測
6.4 ネットワークセキュリティ
6.4.1 2023〜2033年の地域別市場規模(US$ Billion)
6.4.2 地域別市場シェア、2023年・2033年(%)
6.5 クラウドセキュリティ
6.5.1 2023~2033年の地域別市場規模(US$ Billion)
6.5.2 地域別市場シェア、2023年・2033年(%)
6.6 アプリケーションセキュリティ
6.6.1 2023~2033年の地域別市場規模(US$ Billion)
6.6.2 地域別市場シェア、2023年・2033年(%)
6.7 エンドポイントとIoTセキュリティ
6.7.1 2023~2033年の地域別市場規模(US$ Billion)
6.7.2 地域別市場シェア、2023年・2033年(%)
7 サイバーセキュリティ市場分析:業種別
7.1 主要調査結果
7.2 業種別セグメント 市場魅力度指数
7.3 業種別サイバーセキュリティ市場規模推定と予測
7.4 官公庁
7.4.1 2023〜2033年の地域別市場規模(US$ Billion)
7.4.2 地域別市場シェア、2023年・2033年(%)
7.5 BFSI
7.5.1 2023〜2033年の地域別市場規模(US$ Billion)
7.5.2 地域別市場シェア、2023年・2033年(%)
7.6 IT・通信
7.6.1 2023〜2033年の地域別市場規模(US$ Billion)
7.6.2 地域別市場シェア、2023年・2033年(%)
7.7 ヘルスケア
7.7.1 2023〜2033年の地域別市場規模(US$ Billion)
7.7.2 地域別市場シェア、2023年・2033年(%)
7.8 その他の分野
7.8.1 2023〜2033年の地域別市場規模(US$ Billion)
7.8.2 地域別市場シェア、2023年・2033年(%)
8 サイバーセキュリティ市場分析:ソフトウェア別
8.1 主要調査結果
8.2 ソフトウェアセグメント 市場魅力度指数
8.3 業種別サイバーセキュリティ市場規模の推定と予測
8.4 アイデンティティ・アクセス管理(IAM)
8.4.1 2023〜2033年の地域別市場規模(US$ Billion)
8.4.2 地域別市場シェア、2023年・2033年(%)
8.5 アンチウイルス/アンチマルウェア
8.5.1 2023〜2033年の地域別市場規模(US$ Billion)
8.5.2 地域別市場シェア、2023年・2033年(%)
8.6 ログ管理とSIEM
8.6.1 2023~2033年の地域別市場規模(US$ Billion)
8.6.2 地域別市場シェア、2023年~2033年(%)
8.7 暗号化とトークン化
8.7.1 2023〜2033年の地域別市場規模(US$ Billion)
8.7.2 地域別市場シェア、2023年・2033年(%)
8.8 コンプライアンスとポリシー管理
8.8.1 2023〜2033年の地域別市場規模(US$ Billion)
8.8.2 地域別市場シェア、2023年・2033年(%)
8.9 その他のソフトウェア
8.9.1 2023~2033年の地域別市場規模(US$ Billion)
8.9.2 地域別市場シェア、2023年・2033年(%)
9 サイバーセキュリティ市場分析:地域別
9.1 主要な調査結果
9.2 地域別市場規模の推定と予測
10 北米のサイバーセキュリティ市場分析
10.1 主要な調査結果
10.2 北米のサイバーセキュリティ市場魅力度指数
10.3 北米のサイバーセキュリティ国別市場、2023年、2028年、2033年(US$ Billion)
10.4 北米のサイバーセキュリティ市場規模推定と予測
10.5 北米のサイバーセキュリティ市場規模推定と予測:国別
10.6 北米のサイバーセキュリティ市場規模推定と予測:導入形態別
10.7 北米のサイバーセキュリティ市場規模推定と予測:コンポーネント別
10.8 北米のサイバーセキュリティ市場規模推定と予測:セキュリティタイプ別
10.9 北米のサイバーセキュリティ市場規模推定と予測:業種別
10.10 北米のサイバーセキュリティ市場規模推定と予測:ソフトウェア別
10.11 アメリカのサイバーセキュリティ市場分析
10.12 カナダのサイバーセキュリティ市場分析
11 欧州のサイバーセキュリティ市場分析
11.1 主要な調査結果
11.2 欧州サイバーセキュリティ市場魅力度指数
11.3 欧州サイバーセキュリティ市場国別市場規模、2023年、2028年、2033年(US$ Billion)
11.4 欧州のサイバーセキュリティ市場規模推定と予測
11.5 欧州のサイバーセキュリティ市場規模推定と予測:国別
11.6 欧州のサイバーセキュリティ市場規模推定と予測:導入形態別
11.7 欧州のサイバーセキュリティ市場規模推定と予測:コンポーネント別
11.8 欧州のサイバーセキュリティ市場規模推定と予測:セキュリティタイプ別
11.9 欧州のサイバーセキュリティ市場規模推定と予測:業種別
11.10 欧州のサイバーセキュリティ市場規模推定と予測:ソフトウェア別
11.11 ドイツのサイバーセキュリティ市場分析
11.12 イギリスのサイバーセキュリティ市場分析
11.13 フランスのサイバーセキュリティ市場分析
11.14 イタリアのサイバーセキュリティ市場分析
11.15 スペインのサイバーセキュリティ市場分析
11.16 その他の欧州のサイバーセキュリティ市場分析
12 アジア太平洋地域のサイバーセキュリティ市場分析
12.1 主要な調査結果
12.2 アジア太平洋地域のサイバーセキュリティ市場魅力度指数
12.3 アジア太平洋地域のサイバーセキュリティ国別市場、2023年、2028年、2033年(US$ Billion)
12.4 アジア太平洋地域のサイバーセキュリティ市場規模の推定と予測
12.5 アジア太平洋地域のサイバーセキュリティ市場規模推定と予測:国別
12.6 アジア太平洋地域のサイバーセキュリティ市場規模推定と予測:導入形態別
12.7 アジア太平洋地域のサイバーセキュリティ市場規模推定と予測:コンポーネント別
12.8 アジア太平洋地域のサイバーセキュリティ市場規模推定と予測:セキュリティタイプ別
12.9 アジア太平洋地域のサイバーセキュリティ市場規模推定と予測:業種別
12.10 アジア太平洋地域のサイバーセキュリティ市場規模推定と予測:ソフトウェア別
12.11 中国のサイバーセキュリティ市場分析
12.12 インドのサイバーセキュリティ市場分析
12.13 日本サイバーセキュリティ市場分析
12.14 韓国のサイバーセキュリティ市場分析
12.15 オーストラリアのサイバーセキュリティ市場分析
12.16 その他のアジア太平洋地域のサイバーセキュリティ市場分析
13 中東・アフリカのサイバーセキュリティ市場分析
13.1 主要な調査結果
13.2 中東・アフリカのサイバーセキュリティ市場魅力度指数
13.3 中東・アフリカのサイバーセキュリティ国別市場、2023年、2028年、2033年(US$ Billion)
13.4 中東・アフリカのサイバーセキュリティ市場規模推定と予測
13.5 中東・アフリカのサイバーセキュリティ市場規模推定と予測:国別
13.6 中東・アフリカのサイバーセキュリティ市場規模推定と予測:導入形態別
13.7 中東・アフリカのサイバーセキュリティ市場規模推定と予測:コンポーネント別
13.8 中東・アフリカのサイバーセキュリティ市場規模推定と予測:セキュリティタイプ別
13.9 中東・アフリカのサイバーセキュリティ市場規模推定と予測:業種別
13.10 中東・アフリカのサイバーセキュリティ市場規模推定と予測:ソフトウェア別
13.11 GCCのサイバーセキュリティ市場分析
13.12 南アフリカのサイバーセキュリティ市場分析
13.13 その他の中東・アフリカのサイバーセキュリティ市場分析
12 アジア太平洋地域のサイバーセキュリティ市場分析
12.1 主要な調査結果
12.2 アジア太平洋地域のサイバーセキュリティ市場魅力度指数
12.3 アジア太平洋地域のサイバーセキュリティ国別市場、2023年、2028年、2033年(US$ Billion)
12.4 アジア太平洋地域のサイバーセキュリティ市場規模推定と予測
12.5 アジア太平洋地域のサイバーセキュリティ市場規模推定と予測:国別
12.6 アジア太平洋地域のサイバーセキュリティ市場規模推定と予測:導入形態別
12.7 アジア太平洋地域のサイバーセキュリティ市場規模推定と予測:コンポーネント別
12.8 アジア太平洋地域のサイバーセキュリティ市場規模推定と予測:セキュリティタイプ別
12.9 アジア太平洋地域のサイバーセキュリティ市場規模推定と予測:業種別
12.10 アジア太平洋地域のサイバーセキュリティ市場規模推定と予測:ソフトウェア別
12.11 中国のサイバーセキュリティ市場分析
12.12 インドのサイバーセキュリティ市場分析
12.13 日本のサイバーセキュリティ市場分析
12.14 韓国のサイバーセキュリティ市場分析
12.15 オーストラリアのサイバーセキュリティ市場分析
12.16 その他のアジア太平洋地域のサイバーセキュリティ市場分析
15 会社概要
15.1 競争環境、2022年
15.2 戦略的展望
15.3 Microsoft Corporation
15.3.1 会社概要
15.3.2 会社概要
15.3.3 財務分析
15.3.3.1 純収入、2019-2023年
15.3.3.2 R&D、2019-2023年
15.3.3.3 地域別収益シェア、2023年(%)
15.3.3.4 事業セグメント収益シェア、2023年(%)
15.3.4 製品ベンチマーク
15.3.5 戦略的展望
15.4 Cisco Systems, Inc
15.4.1 会社概要
15.4.2 会社概要
15.4.3 財務分析
15.4.3.1 純収入、2019-2023年
15.4.3.2 R&D、2019-2023年
15.4.3.3 地域別収益シェア、2023年(%)
15.4.3.4 事業セグメント収益シェア、2023年(%)
15.4.4 製品ベンチマーク
15.4.5 戦略的展望
15.5 Palo Alto Networks, Inc
15.5.1 会社概要
15.5.2 会社概要
15.5.3 財務分析
15.5.3.1 純収入、2018-2022年
15.5.3.2 R&D、2018年~2022年
15.5.3.3 地域別収益シェア、2022年(%)
15.5.3.4 事業セグメント収益シェア、2022年(%)
15.5.4 製品ベンチマーク
15.5.5 戦略的展望
15.6 Fortinet, Inc
15.6.1 会社概要
15.6.2 会社概要
15.6.3 財務分析
15.6.3.1 純収入、2018-2022年
15.6.3.2 R&D、2018年~2022年
15.6.3.3 地域別収益シェア、2022年(%)
15.6.3.4 事業セグメント収益シェア、2022年(%)
15.6.4 製品ベンチマーク
15.6.5 戦略的展望
15.7 International Business Machines Corporation (IBM)
15.7.1 会社概要
15.7.2 会社概要
15.7.3 財務分析
15.7.3.1 純収入、2018-2022年
15.7.3.2 R&D、2018年~2022年
15.7.3.3 地域別収益シェア、2022年(%)
15.7.3.4 事業セグメント収益シェア、2022年(%)
15.7.4 製品ベンチマーク
15.7.5 戦略的展望
15.8 Check Point Software Technologies Ltd
15.8.1 会社概要
15.8.2 会社概要
15.8.3 財務分析
15.8.3.1 純収入、2018年~2022年
15.8.3.2 売上高、2018年~2022年
15.8.3.3 地域別収益シェア、2022年(%)
15.8.4 製品ベンチマーク
15.8.5 戦略的展望
15.9 McAfee Corp
15.9.1 会社概要
15.9.2 会社概要
15.9.3 製品ベンチマーク
15.9.4 戦略的展望
15.10 Proofpoint, Inc
15.10.1 会社概要
15.10.2 会社概要
15.10.3 製品ベンチマーク
15.10.4 戦略的展望
15.11 Trend Micro Inc
15.11.1 会社概要
15.11.2 会社概要
15.11.3 財務分析
15.11.3.1 純収入、2018年-2022年
15.11.3.2 R&D、2018年~2022年
15.11.3.3 地域別売上高シェア、2022年(%)
15.11.4 製品ベンチマーク
15.11.5 戦略的展望
15.12 CrowdStrike Holdings, Inc
15.12.1 会社概要
15.12.2 会社概要
15.12.3 財務分析
15.12.3.1 純収入、2019-2023年
15.12.3.2 R&D、2019年~2023年
15.12.3.3 事業セグメント収益シェア、2022年(%)
15.12.4 製品ベンチマーク
15.12.5 戦略的展望
15.13 Trellix
15.13.1 会社概要
15.13.2 会社概要
15.13.3 製品ベンチマーク
15.14 Imperva Inc
15.14.1 会社概要
15.14.2 会社概要
15.14.3 製品ベンチマーク
15.14.4 戦略的展望
15.15 Qualys, Inc.
15.15.1 会社概要
15.15.2 会社概要
15.15.3 財務分析
15.15.3.1 純収入、2018-2022年
15.15.3.2 R&D、2018年〜2022年
15.15.3.3 地域別収益シェア、2022年(%)
15.15.4 製品ベンチマーク
15.15.5 戦略的展望
15.16 Gen Digital Inc.
15.16.1 会社概要
15.16.2 会社概要
15.16.3 財務分析
15.16.3.1 純収入、2019-2023年
15.16.3.2 R&D、2019-2023年
15.16.3.3 地域別収益シェア、2023年(%)
15.16.3.4 事業セグメント収益シェア、2023年(%)
15.16.4 製品ベンチマーク
15.16.5 戦略的展望
15.17 Splunk Inc.
15.17.1 会社概要
15.17.2 会社概要
15.17.3 財務分析
15.17.3.1 純収入、2019-2023年
15.17.3.2 売上高、2019年-2023年
15.17.3.3 地域別売上高シェア(2023年)
15.17.4 製品ベンチマーク
15.17.5 戦略的展望
16 結論と提言
16.1 Visiongainの結語
16.2 市場プレイヤーへの提言
ページTOPに戻る
図表リスト
表の一覧
Table 1 Cyber Security Market Snapshot, 2023 & 2033 (US$ Billion, CAGR %)
Table 2 Top 10 Data Breaches and Cyberattacks in 2022
Table 3 Global Cyber Attacks 2021-2022
Table 4 International Civil Aviation Organization, Cybersecurity Action Plan, 2022
Table 5 According to a 2022 report by cybersecurity firm eSentire
Table 6 Global Cyber Security Market by Region, 2023-2033 (US$ Bn, AGR (%), CAGR (%)) (V-Shaped Recovery Scenario)
Table 7 Global Cyber Security Market by Region, 2023-2033 (US$ Bn, AGR (%), CAGR (%)) (U-Shaped Recovery Scenario)
Table 8 Global Cyber Security Market by Region, 2023-2033 (US$ Bn, AGR (%), CAGR (%)) (W-Shaped Recovery Scenario)
Table 9 Global Cyber Security Market by Region, 2023-2033 (US$ Bn, AGR (%), CAGR (%)) (L-Shaped Recovery Scenario)
Table 10 Global Cyber Security Market by Deployment Mode, 2023-2033 (US$ Bn, AGR (%), CAGR (%))
Table 11 Cloud Market by Region, 2023-2033 (US$ Bn, AGR (%), CAGR (%))
Table 12 On-premises Market by Region, 2023-2033 (US$ Bn, AGR (%), CAGR (%))
Table 13 Global Cyber Security Market by Component, 2023-2033 (US$ Bn, AGR (%), CAGR (%))
Table 14 Hardware Market by Region, 2023-2033 (US$ Bn, AGR (%), CAGR (%))
Table 15 Software Market by Region, 2023-2033 (US$ Bn, AGR (%), CAGR (%))
Table 16 Services Market by Region, 2023-2033 (US$ Bn, AGR (%), CAGR (%))
Table 17 Global Cyber Security Market by Security Type, 2023-2033 (US$ Bn, AGR (%), CAGR (%))
Table 18 Network Security Market by Region, 2023-2033 (US$ Bn, AGR (%), CAGR (%))
Table 19 Cloud Security Market by Region, 2023-2033 (US$ Bn, AGR (%), CAGR (%))
Table 20 Application Security Market by Region, 2023-2033 (US$ Bn, AGR (%), CAGR (%))
Table 21 Endpoint and IoT Security Market by Region, 2023-2033 (US$ Bn, AGR (%), CAGR (%))
Table 22 Global Cyber Security Market by Vertical, 2023-2033 (US$ Bn, AGR (%), CAGR (%))
Table 23 Government Market by Region, 2023-2033 (US$ Bn, AGR (%), CAGR (%))
Table 24 BFSI Market by Region, 2023-2033 (US$ Bn, AGR (%), CAGR (%))
Table 25 IT&Telecom Market by Region, 2023-2033 (US$ Bn, AGR (%), CAGR (%))
Table 26 Healthcare Market by Region, 2023-2033 (US$ Bn, AGR (%), CAGR (%))
Table 27 Other Verticals Market by Region, 2023-2033 (US$ Bn, AGR (%), CAGR (%))
Table 28 Global Cyber Security Market by Software, 2023-2033 (US$ Bn, AGR (%), CAGR (%))
Table 29 Identity and Access Management (IAM) Market by Region, 2023-2033 (US$ Bn, AGR (%), CAGR (%))
Table 30 Best Malware Protection Software Solutions 2023
Table 31 Antivirus/Antimalware Market by Region, 2023-2033 (US$ Bn, AGR (%), CAGR (%))
Table 32 Log Management and SIEM Market by Region, 2023-2033 (US$ Bn, AGR (%), CAGR (%))
Table 33 Encryption and Tokenization Market by Region, 2023-2033 (US$ Bn, AGR (%), CAGR (%))
Table 34 Compliance and Policy Management Market by Region, 2023-2033 (US$ Bn, AGR (%), CAGR (%))
Table 35 Other Software Market by Region, 2023-2033 (US$ Bn, AGR (%), CAGR (%))
Table 36 Global Cyber Security Market Forecast, 2023-2033 (US$ Bn, AGR (%), CAGR (%))
Table 37 Cyber Security Market Forecast by Region, 2023-2033 (US$ Billion, AGR%, CAGR%)
Table 38 North America Cyber Security Market by Value, 2023-2033 (US$ Bn, AGR (%), CAGR (%))
Table 39 North America Cyber Security Market by Country, 2023-2033 (US$ Bn, AGR (%), CAGR (%))
Table 40 North America Cyber Security Market by Deployment Mode, 2023-2033 (US$ Bn, AGR (%), CAGR (%))
Table 41 North America Cyber Security Market by Component, 2023-2033 (US$ Bn, AGR (%), CAGR (%))
Table 42 North America Cyber Security Market by Security Type, 2023-2033 (US$ Bn, AGR (%), CAGR (%))
Table 43 North America Cyber Security Market by Vertical, 2023-2033 (US$ Bn, AGR (%), CAGR (%))
Table 44 North America Cyber Security Market by Software, 2023-2033 (US$ Bn, AGR (%), CAGR (%))
Table 45 US Cyber Security Market by Value, 2023-2033 (US$ Bn, AGR (%), CAGR (%))
Table 46 Canada Cyber Security Market by Value, 2023-2033 (US$ Bn, AGR (%), CAGR (%))
Table 47 Europe Cyber Security Market by Value, 2023-2033 (US$ Bn, AGR (%), CAGR (%))
Table 48 Europe Cyber Security Market by Country, 2023-2033 (US$ Bn, AGR (%), CAGR (%))
Table 49 Europe Cyber Security Market by Deployment Mode, 2023-2033 (US$ Bn, AGR (%), CAGR (%))
Table 50 Europe Cyber Security Market by Component, 2023-2033 (US$ Bn, AGR (%), CAGR (%))
Table 51 Europe Cyber Security Market by Security Type, 2023-2033 (US$ Bn, AGR (%), CAGR (%))
Table 52 Europe Cyber Security Market by Vertical, 2023-2033 (US$ Bn, AGR (%), CAGR (%))
Table 53 Europe Cyber Security Market by Software, 2023-2033 (US$ Bn, AGR (%), CAGR (%))
Table 54 Germany Cyber Security Market by Value, 2023-2033 (US$ Bn, AGR (%), CAGR (%))
Table 55 UK Cyber Security Market by Value, 2023-2033 (US$ Bn, AGR (%), CAGR (%))
Table 56 France Cyber Security Market by Value, 2023-2033 (US$ Bn, AGR (%), CAGR (%))
Table 57 Italy Cyber Security Market by Value, 2023-2033 (US$ Bn, AGR (%), CAGR (%))
Table 58 Spain Cyber Security Market by Value, 2023-2033 (US$ Bn, AGR (%), CAGR (%))
Table 59 Rest of Europe Cyber Security Market by Value, 2023-2033 (US$ Bn, AGR (%), CAGR (%))
Table 60 Asia-Pacific Cyber Security Market by Value, 2023-2033 (US$ Bn, AGR (%), CAGR (%))
Table 61 Asia-Pacific Cyber Security Market by Country, 2023-2033 (US$ Bn, AGR (%), CAGR (%))
Table 62 Asia-Pacific Cyber Security Market by Deployment Mode, 2023-2033 (US$ Bn, AGR (%), CAGR (%))
Table 63 Asia-Pacific Cyber Security Market by Component, 2023-2033 (US$ Bn, AGR (%), CAGR (%))
Table 64 Asia-Pacific Cyber Security Market by Security Type, 2023-2033 (US$ Bn, AGR (%), CAGR (%))
Table 65 Asia-Pacific Cyber Security Market by Vertical, 2023-2033 (US$ Bn, AGR (%), CAGR (%))
Table 66 Asia-Pacific Cyber Security Market by Software, 2023-2033 (US$ Bn, AGR (%), CAGR (%))
Table 67 China Cyber Security Market by Value, 2023-2033 (US$ Bn, AGR (%), CAGR (%))
Table 68 India Cyber Security Market by Value, 2023-2033 (US$ Bn, AGR (%), CAGR (%))
Table 69 Japan Cyber Security Market by Value, 2023-2033 (US$ Bn, AGR (%), CAGR (%))
Table 70 South Korea Cyber Security Market by Value, 2023-2033 (US$ Bn, AGR (%), CAGR (%))
Table 71 Australia Cyber Security Market by Value, 2023-2033 (US$ Bn, AGR (%), CAGR (%))
Table 72 Rest of Asia-Pacific Cyber Security Market by Value, 2023-2033 (US$ Bn, AGR (%), CAGR (%))
Table 73 Middle East & Africa Cyber Security Market by Value, 2023-2033 (US$ Bn, AGR (%), CAGR (%))
Table 74 Middle East & Africa Cyber Security Market by Country, 2023-2033 (US$ Bn, AGR (%), CAGR (%))
Table 75 Middle East & Africa Cyber Security Market by Deployment Mode, 2023-2033 (US$ Bn, AGR (%), CAGR (%))
Table 76 Middle East & Africa Cyber Security Market by Component, 2023-2033 (US$ Bn, AGR (%), CAGR (%))
Table 77 Middle East & Africa Cyber Security Market by Security Type, 2023-2033 (US$ Bn, AGR (%), CAGR (%))
Table 78 Middle East & Africa Cyber Security Market by Vertical, 2023-2033 (US$ Bn, AGR (%), CAGR (%))
Table 79 Middle East & Africa Cyber Security Market by Software, 2023-2033 (US$ Bn, AGR (%), CAGR (%))
Table 80 GCC Cyber Security Market by Value, 2023-2033 (US$ Bn, AGR (%), CAGR (%))
Table 81 South Africa Cyber Security Market by Value, 2023-2033 (US$ Bn, AGR (%), CAGR (%))
Table 82 Rest of Middle East & Africa Cyber Security Market by Value, 2023-2033 (US$ Bn, AGR (%), CAGR (%))
Table 83 Latin America Cyber Security Market by Value, 2023-2033 (US$ Bn, AGR (%), CAGR (%))
Table 84 Latin America Cyber Security Market by Country, 2023-2033 (US$ Bn, AGR (%), CAGR (%))
Table 85 Latin America Cyber Security Market by Deployment Mode, 2023-2033 (US$ Bn, AGR (%), CAGR (%))
Table 86 Latin America Cyber Security Market by Component, 2023-2033 (US$ Bn, AGR (%), CAGR (%))
Table 87 Latin America Cyber Security Market by Security Type, 2023-2033 (US$ Bn, AGR (%), CAGR (%))
Table 88 Latin America Cyber Security Market by Vertical, 2023-2033 (US$ Bn, AGR (%), CAGR (%))
Table 89 Latin America Cyber Security Market by Software, 2023-2033 (US$ Bn, AGR (%), CAGR (%))
Table 90 Brazil Cyber Security Market by Value, 2023-2033 (US$ Bn, AGR (%), CAGR (%))
Table 91 Mexico Cyber Security Market by Value, 2023-2033 (US$ Bn, AGR (%), CAGR (%))
Table 92 Rest of Latin America Cyber Security Market by Value, 2023-2033 (US$ Bn, AGR (%), CAGR (%))
Table 93 Strategic Outlook - Contract
Table 94 Microsoft Corporation :Key Details, (CEO, HQ, Revenue, Founded, No. of Employees, Company Type, Website, Business Segment)
Table 95 Microsoft Corporation: Product Benchmarking
Table 96 Microsoft Corporation: Strategic Outlook
Table 97 Cisco Systems, Inc:Key Details, (CEO, HQ, Revenue, Founded, No. of Employees, Company Type, Website, Business Segment)
Table 98 Cisco Systems, Inc: Product Benchmarking
Table 99 Cisco Systems, Inc: Strategic Outlook
Table 100 Palo Alto Networks, Inc: Key Details, (CEO, HQ, Revenue, Founded, No. of Employees, Company Type, Website, Business Segment)
Table 101 Palo Alto Networks, Inc: Product Benchmarking
Table 102 Palo Alto Networks, Inc: Strategic Outlook
Table 103 Fortinet, Inc :Key Details, (CEO, HQ, Revenue, Founded, No. of Employees, Company Type, Website, Business Segment)
Table 104 Fortinet, Inc: Product Benchmarking
Table 105 Fortinet, Inc: Strategic Outlook
Table 106 International Business Machines Corporation (IBM):Key Details, (CEO, HQ, Revenue, Founded, No. of Employees, Company Type, Website, Business Segment)
Table 107 International Business Machines Corporation (IBM): Product Benchmarking
Table 108 International Business Machines Corporation (IBM): Strategic Outlook
Table 109 Check Point Software Technologies Ltd:Key Details, (CEO, HQ, Revenue, Founded, No. of Employees, Company Type, Website, Business Segment)
Table 110 Check Point Software Technologies Ltd.: Product Benchmarking
Table 111 Check Point Software Technologies Ltd: Strategic Outlook
Table 112 McAfee Corp:Key Details, (CEO, HQ, Revenue, Founded, No. of Employees, Company Type, Website, Business Segment)
Table 113 McAfee Corp: Product Benchmarking
Table 114 McAfee Corp: Strategic Outlook
Table 115 Proofpoint, Inc: Key Details, (CEO, HQ, Revenue, Founded, No. of Employees, Company Type, Website, Business Segment)
Table 116 Proofpoint, Inc: Product Benchmarking
Table 117 Proofpoint, Inc: Strategic Outlook
Table 118 Trend Micro Inc: Key Details, (CEO, HQ, Revenue, Founded, No. of Employees, Company Type, Website, Business Segment)
Table 119 Trend Micro Inc: Product Benchmarking
Table 120 Trend Micro Inc: Strategic Outlook
Table 121 CrowdStrike Holdings, Inc:Key Details, (CEO, HQ, Revenue, Founded, No. of Employees, Company Type, Website, Business Segment)
Table 122 CrowdStrike Holdings, Inc: Product Benchmarking
Table 123 CrowdStrike Holdings, Inc: Strategic Outlook
Table 124 Trellix: Key Details, (CEO, HQ, Revenue, Founded, No. of Employees, Company Type, Website, Business Segment)
Table 125 Trellix: Product Benchmarking
Table 126 Trellix: Strategic Outlook
Table 127 Imperva Inc:Key Details, (CEO, HQ, Revenue, Founded, No. of Employees, Company Type, Website, Business Segment)
Table 128 Imperva Inc: Product Benchmarking
Table 129 Imperva Inc: Strategic Outlook
Table 130 Qualys, Inc. :Key Details, (CEO, HQ, Revenue, Founded, No. of Employees, Company Type, Website, Business Segment)
Table 131 Qualys, Inc.: Product Benchmarking
Table 132 Qualys, Inc.: Strategic Outlook
Table 133 Gen Digital Inc.: Key Details, (CEO, HQ, Revenue, Founded, No. of Employees, Company Type, Website, Business Segment)
Table 134 Gen Digital Inc: Product Benchmarking
Table 135 Gen Digital Inc: Strategic Outlook
Table 136 Splunk Inc.: Key Details, (CEO, HQ, Revenue, Founded, No. of Employees, Company Type, Website, Business Segment)
Table 137 Splunk Inc: Product Benchmarking
Table 138 Splunk Inc: Strategic Outlook
図の一覧
Figure 1 Cyber Security Market Segmentation
Figure 2 Cyber Security Market by Deployment Mode: Market Attractiveness Index
Figure 3 Cyber Security Market by Component: Market Attractiveness Index
Figure 4 Cyber Security Market by Security Type: Market Attractiveness Index
Figure 5 Cyber Security Market by Vertical: Market Attractiveness Index
Figure 6 Cyber Security Market by Software: Market Attractiveness Index
Figure 7 Cyber Security Market Attractiveness Index by Region
Figure 8 Cyber Security Market: Market Dynamics
Figure 9 Cyber Security Market: Porter’s Five Forces Analysis
Figure 10 Global Cyber Security Market Share Forecast by COVID, 2023-2033 (%)
Figure 11 Global Cyber Security Market by Region, 2023-2033 (US$ Bn, AGR (%)) (V-Shaped Recovery Scenario)
Figure 12 Global Cyber Security Market by Region, 2023-2033 (US$ Bn, AGR (%)) (U-Shaped Recovery Scenario)
Figure 13 Global Cyber Security Market by Region, 2023-2033 (US$ Bn, AGR (%)) (W-Shaped Recovery Scenario)
Figure 14 Global Cyber Security Market by Region, 2023-2033 (US$ Bn, AGR (%)) (L-Shaped Recovery Scenario)
Figure 15 Cyber Security Market: PEST Analysis
Figure 16 Cyber Security Market by Deployment Mode: Market Attractiveness Index
Figure 17 Global Cyber Security Market by Deployment Mode, 2023-2033 (US$ Bn, AGR (%))
Figure 18 Cyber Security Market Share Forecast by Deployment Mode, 2023, 2028, 2033 (%)
Figure 19 Cloud Market by Region, 2023-2033 (US$ Bn, AGR (%))
Figure 20 Cloud Market Share Forecast by Region, 2023 & 2033 (%)
Figure 21 On-premises Market by Region, 2023-2033 (US$ Bn, AGR (%))
Figure 22 On-premises Market Share Forecast by Region, 2023 & 2033 (%)
Figure 23 Cyber Security Market by Component: Market Attractiveness Index
Figure 24 Global Cyber Security Market by Component, 2023-2033 (US$ Bn, AGR (%))
Figure 25 Cyber Security Market Share Forecast by Component, 2023, 2028, 2033 (%)
Figure 26 Hardware Market by Region, 2023-2033 (US$ Bn, AGR (%))
Figure 27 Hardware Market Share Forecast by Region, 2023 & 2033 (%)
Figure 28 Software Market by Region, 2023-2033 (US$ Bn, AGR (%))
Figure 29 Software Market Share Forecast by Region, 2023 & 2033 (%)
Figure 30 Services Market by Region, 2023-2033 (US$ Bn, AGR (%))
Figure 31 Services Market Share Forecast by Region, 2023 & 2033 (%)
Figure 32 Cyber Security Market by Security Type: Market Attractiveness Index
Figure 33 Global Cyber Security Market by Security Type, 2023-2033 (US$ Bn, AGR (%))
Figure 34 Cyber Security Market Share Forecast by Security Type, 2023, 2028, 2033 (%)
Figure 35 Network Security Market by Region, 2023-2033 (US$ Bn, AGR (%))
Figure 36 Network Security Market Share Forecast by Region, 2023 & 2033 (%)
Figure 37 Cloud Security Market by Region, 2023-2033 (US$ Bn, AGR (%))
Figure 38 Cloud Security Market Share Forecast by Region, 2023 & 2033 (%)
Figure 39 Application Security Market by Region, 2023-2033 (US$ Bn, AGR (%))
Figure 40 Application Security Market Share Forecast by Region, 2023 & 2033 (%)
Figure 41 Endpoint and IoT Security Market by Region, 2023-2033 (US$ Bn, AGR (%))
Figure 42 Endpoint and IOT Security Market Share Forecast by Region, 2023 & 2033 (%)
Figure 43 Cyber Security Market by Vertical: Market Attractiveness Index
Figure 44 Global Cyber Security Market by Vertical, 2023-2033 (US$ Bn, AGR (%))
Figure 45 Cyber Security Market Share Forecast by Vertical, 2023, 2028, 2033 (%)
Figure 46 Government Market by Region, 2023-2033 (US$ Bn, AGR (%))
Figure 47 Government Market Share Forecast by Region, 2023 & 2033 (%)
Figure 48 BFSI Market by Region, 2023-2033 (US$ Bn, AGR (%))
Figure 49 BFSI Market Share Forecast by Region, 2023 & 2033 (%)
Figure 50 IT&Telecom Market by Region, 2023-2033 (US$ Bn, AGR (%))
Figure 51 IT&Telecom Market Share Forecast by Region, 2023 & 2033 (%)
Figure 52 Healthcare Market by Region, 2023-2033 (US$ Bn, AGR (%))
Figure 53 Healthcare Market Share Forecast by Region, 2023 & 2033 (%)
Figure 54 Other Verticals Market by Region, 2023-2033 (US$ Bn, AGR (%))
Figure 55 Other Verticals Market Share Forecast by Region, 2023 & 2033 (%)
Figure 56 Cyber Security Market by Software: Market Attractiveness Index
Figure 57 Global Cyber Security Market by Software, 2023-2033 (US$ Bn, AGR (%))
Figure 58 Cyber Security Market Share Forecast by Software, 2023, 2028, 2033 (%)
Figure 59 Identity and Access Management (IAM) Market by Region, 2023-2033 (US$ Bn, AGR (%))
Figure 60 Identity and Access Management (IAM) Market Share Forecast by Region, 2023 & 2033 (%)
Figure 61 Antivirus/Antimalware Market by Region, 2023-2033 (US$ Bn, AGR (%))
Figure 62 Antivirus/Antimalware Market Share Forecast by Region, 2023 & 2033 (%)
Figure 63 Log Management and SIEM Market by Region, 2023-2033 (US$ Bn, AGR (%))
Figure 64 Log Management and SIEM Market Share Forecast by Region, 2023 & 2033 (%)
Figure 65 Encryption and Tokenization Market by Region, 2023-2033 (US$ Bn, AGR (%))
Figure 66 Encryption and Tokenization Market Share Forecast by Region, 2023 & 2033 (%)
Figure 67 Compliance and Policy Management Market by Region, 2023-2033 (US$ Bn, AGR (%))
Figure 68 Compliance and Policy Management Market Share Forecast by Region, 2023 & 2033 (%)
Figure 69 Other Software Market by Region, 2023-2033 (US$ Bn, AGR (%))
Figure 70 Other Software Market Share Forecast by Region, 2023 & 2033 (%)
Figure 71 Cyber Security Market Forecast by Region 2023 and 2033 (Revenue, CAGR%)
Figure 72 Global Cyber Security Market Forecast, 2023-2033 (US$ Bn, AGR (%))
Figure 73 Cyber Security Market Share Forecast by Region 2023, 2028, 2033 (%)
Figure 74 Cyber Security Market by Region, 2023-2033 (US$ Billion, AGR %)
Figure 75 North America Cyber Security Market Attractiveness Index
Figure 76 North America Cyber Security Market by Region, 2023, 2028 & 2033 (US$ Billion)
Figure 77 North America Cyber Security Market by Value, 2023-2033 (US$ Bn, AGR (%))
Figure 78 North America Cyber Security Market by Country, 2023-2033 (US$ Bn, AGR (%))
Figure 79 North America Cyber Security Market Share Forecast by Country, 2023 & 2033 (%)
Figure 80 North America Cyber Security Market by Deployment Mode, 2023-2033 (US$ Bn, AGR (%))
Figure 81 North America Cyber Security Market Share Forecast Deployment Mode, 2023 & 2033 (%)
Figure 82 North America Cyber Security Market by Component, 2023-2033 (US$ Bn, AGR (%))
Figure 83 North America Cyber Security Market Share Forecast by Component, 2023 & 2033 (%)
Figure 84 North America Cyber Security Market by Security Type, 2023-2033 (US$ Bn, AGR (%))
Figure 85 North America Cyber Security Market Share Forecast by Security Type, 2023 & 2033 (%)
Figure 86 North America Cyber Security Market by Vertical, 2023-2033 (US$ Bn, AGR (%))
Figure 87 North America Cyber Security Market Share Forecast by Vertical, 2023 & 2033 (%)
Figure 88 North America Cyber Security Market by Software, 2023-2033 (US$ Bn, AGR (%))
Figure 89 North America Cyber Security Market Share Forecast by Software, 2023 & 2033 (%)
Figure 90 US Cyber Security Market by Value, 2023-2033 (US$ Bn, AGR (%))
Figure 91 Canada Cyber Security Market by Value, 2023-2033 (US$ Bn, AGR (%))
Figure 92 Europe Cyber Security Market Attractiveness Index
Figure 93 Europe Cyber Security Market by Region, 2023, 2028 & 2033 (US$ Billion)
Figure 94 Europe Cyber Security Market by Value, 2023-2033 (US$ Bn, AGR (%))
Figure 95 Europe Cyber Security Market by Country, 2023-2033 (US$ Bn, AGR (%))
Figure 96 Europe Cyber Security Market Share Forecast by Country, 2023 & 2033 (%)
Figure 97 Europe Cyber Security Market by Deployment Mode, 2023-2033 (US$ Bn, AGR (%))
Figure 98 Europe Cyber Security Market Share Forecast Deployment Mode, 2023 & 2033 (%)
Figure 99 Europe Cyber Security Market by Component, 2023-2033 (US$ Bn, AGR (%))
Figure 100 Europe Cyber Security Market Share Forecast by Component, 2023 & 2033 (%)
Figure 101 Europe Cyber Security Market by Security Type, 2023-2033 (US$ Bn, AGR (%))
Figure 102 Europe Cyber Security Market Share Forecast by Security Type, 2023 & 2033 (%)
Figure 103 Europe Cyber Security Market by Vertical, 2023-2033 (US$ Bn, AGR (%))
Figure 104 Europe Cyber Security Market Share Forecast by Vertical, 2023 & 2033 (%)
Figure 105 Europe Cyber Security Market by Software, 2023-2033 (US$ Bn, AGR (%))
Figure 106 Europe Cyber Security Market Share Forecast by Software, 2023 & 2033 (%)
Figure 107 Germany Cyber Security Market by Value, 2023-2033 (US$ Bn, AGR (%))
Figure 108 UK Cyber Security Market by Value, 2023-2033 (US$ Bn, AGR (%))
Figure 109 France Cyber Security Market by Value, 2023-2033 (US$ Bn, AGR (%))
Figure 110 Italy Cyber Security Market by Value, 2023-2033 (US$ Bn, AGR (%))
Figure 111 Spain Cyber Security Market by Value, 2023-2033 (US$ Bn, AGR (%))
Figure 112 Rest of Europe Cyber Security Market by Value, 2023-2033 (US$ Bn, AGR (%))
Figure 113 Asia-Pacific Cyber Security Market Attractiveness Index
Figure 114 Asia-Pacific Cyber Security Market by Region, 2023, 2028 & 2033 (US$ Billion)
Figure 115 Asia-Pacific Cyber Security Market by Value, 2023-2033 (US$ Bn, AGR (%))
Figure 116 Asia-Pacific Cyber Security Market by Country, 2023-2033 (US$ Bn, AGR (%))
Figure 117 Asia-Pacific Cyber Security Market Share Forecast by Country, 2023 & 2033 (%)
Figure 118 Asia-Pacific Cyber Security Market by Deployment Mode, 2023-2033 (US$ Bn, AGR (%))
Figure 119 Asia-Pacific Cyber Security Market Share Forecast Deployment Mode, 2023 & 2033 (%)
Figure 120 Asia-Pacific Cyber Security Market by Component, 2023-2033 (US$ Bn, AGR (%))
Figure 121 Asia-Pacific Cyber Security Market Share Forecast by Component, 2023 & 2033 (%)
Figure 122 Asia-Pacific Cyber Security Market by Security Type, 2023-2033 (US$ Bn, AGR (%))
Figure 123 Asia-Pacific Cyber Security Market Share Forecast by Security Type, 2023 & 2033 (%)
Figure 124 Asia-Pacific Cyber Security Market by Vertical, 2023-2033 (US$ Bn, AGR (%))
Figure 125 Asia-Pacific Cyber Security Market Share Forecast by Vertical, 2023 & 2033 (%)
Figure 126 Asia-Pacific Cyber Security Market by Software, 2023-2033 (US$ Bn, AGR (%))
Figure 127 Asia-Pacific Cyber Security Market Share Forecast by Software, 2023 & 2033 (%)
Figure 128 China Cyber Security Market by Value, 2023-2033 (US$ Bn, AGR (%))
Figure 129 India Cyber Security Market by Value, 2023-2033 (US$ Bn, AGR (%))
Figure 130 Japan Cyber Security Market by Value, 2023-2033 (US$ Bn, AGR (%))
Figure 131 South Korea Cyber Security Market by Value, 2023-2033 (US$ Bn, AGR (%))
Figure 132 Australia Cyber Security Market by Value, 2023-2033 (US$ Bn, AGR (%))
Figure 133 Rest of Asia-Pacific Cyber Security Market by Value, 2023-2033 (US$ Bn, AGR (%))
Figure 134 Middle East and Africa Cyber Security Market Attractiveness Index
Figure 135 Middle East and Africa Cyber Security Market by Region, 2023, 2028 & 2033 (US$ Billion)
Figure 136 Middle East & Africa Cyber Security Market by Value, 2023-2033 (US$ Bn, AGR (%))
Figure 137 Middle East & Africa Cyber Security Market by Country, 2023-2033 (US$ Bn, AGR (%))
Figure 138 Middle East and Africa Cyber Security Market Share Forecast by Country, 2023 & 2033 (%)
Figure 139 Middle East & Africa Cyber Security Market by Deployment Mode, 2023-2033 (US$ Bn, AGR (%))
Figure 140 Middle East and Africa Cyber Security Market Share Forecast Deployment Mode, 2023 & 2033 (%)
Figure 141 Middle East & Africa Cyber Security Market by Component, 2023-2033 (US$ Bn, AGR (%))
Figure 142 Middle East and Africa Cyber Security Market Share Forecast by Component, 2023 & 2033 (%)
Figure 143 Middle East & Africa Cyber Security Market by Security Type, 2023-2033 (US$ Bn, AGR (%))
Figure 144 Middle East and Africa Cyber Security Market Share Forecast by Security Type, 2023 & 2033 (%)
Figure 145 Middle East & Africa Cyber Security Market by Vertical, 2023-2033 (US$ Bn, AGR (%))
Figure 146 Middle East and Africa Cyber Security Market Share Forecast by Vertical, 2023 & 2033 (%)
Figure 147 Middle East & Africa Cyber Security Market by Software, 2023-2033 (US$ Bn, AGR (%))
Figure 148 Middle East and Africa Cyber Security Market Share Forecast by Software, 2023 & 2033 (%)
Figure 149 GCC Cyber Security Market by Value, 2023-2033 (US$ Bn, AGR (%))
Figure 150 South Africa Cyber Security Market by Value, 2023-2033 (US$ Bn, AGR (%))
Figure 151 Rest of Middle East & Africa Cyber Security Market by Value, 2023-2033 (US$ Bn, AGR (%))
Figure 152 Latin America Cyber Security Market Attractiveness Index
Figure 153 Latin America Cyber Security Market by Region, 2023, 2028 & 2033 (US$ Billion)
Figure 154 Latin America Cyber Security Market by Value, 2023-2033 (US$ Bn, AGR (%))
Figure 155 Latin America Cyber Security Market by Country, 2023-2033 (US$ Bn, AGR (%))
Figure 156 Latin America Cyber Security Market Share Forecast by Country, 2023 & 2033 (%)
Figure 157 Latin America Cyber Security Market by Deployment Mode, 2023-2033 (US$ Bn, AGR (%))
Figure 158 Latin America Cyber Security Market Share Forecast Deployment Mode, 2023 & 2033 (%)
Figure 159 Latin America Cyber Security Market by Component, 2023-2033 (US$ Bn, AGR (%))
Figure 160 Latin America Cyber Security Market Share Forecast by Component, 2023 & 2033 (%)
Figure 161 Latin America Cyber Security Market by Security Type, 2023-2033 (US$ Bn, AGR (%))
Figure 162 Latin America Cyber Security Market Share Forecast by Security Type, 2023 & 2033 (%)
Figure 163 Latin America Cyber Security Market by Vertical, 2023-2033 (US$ Bn, AGR (%))
Figure 164 Latin America Cyber Security Market Share Forecast by Vertical, 2023 & 2033 (%)
Figure 165 Latin America Cyber Security Market by Software, 2023-2033 (US$ Bn, AGR (%))
Figure 166 Latin America Cyber Security Market Share Forecast by Software, 2023 & 2033 (%)
Figure 167 Brazil Cyber Security Market by Value, 2023-2033 (US$ Bn, AGR (%))
Figure 168 Mexico Cyber Security Market by Value, 2023-2033 (US$ Bn, AGR (%))
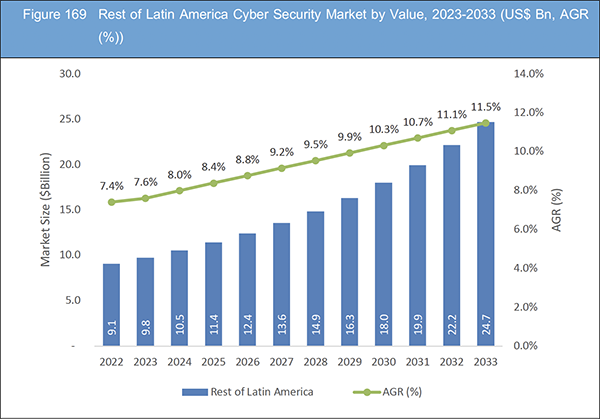
Figure 169 Rest of Latin America Cyber Security Market by Value, 2023-2033 (US$ Bn, AGR (%))
Figure 170 Cyber Security Market: Company Share, 2022
Figure 171 Microsoft Corporation.: Net Revenue2019-2023 (US$ Million, AGR%)
Figure 172 Microsoft Corporation.: R&D, 2019-2023 (US$ Million, AGR%)
Figure 173 Microsoft Corporation.: Regional Revenue Share, 2023 (%)
Figure 174 Microsoft Corporation.: Business Segment Revenue Share, 2023 (%)
Figure 175 Cisco Systems, Inc.: Net Revenue2019-2023 (US$ Million, AGR%)
Figure 176 Cisco Systems, Inc.: R&D, 2019-2023 (US$ Million, AGR%)
Figure 177 Cisco Systems, Inc.: Regional Revenue Share, 2023 (%)
Figure 178 Cisco Systems, Inc.: Business Segment Revenue Share, 2023 (%)
Figure 179 Palo Alto Networks, Inc.: Net Revenue, 2018-2022 (US$ Million, AGR%)
Figure 180 Palo Alto Networks, Inc.: R&D, 2018-2022 (US$ Million, AGR%)
Figure 181 Palo Alto Networks, Inc.: Regional Revenue Share, 2022 (%)
Figure 182 Palo Alto Networks, Inc.: Business Segment Revenue Share, 2022 (%)
Figure 183 Fortinet, Inc.: Net Revenue, 2018-2022 (US$ Million, AGR%)
Figure 184 Fortinet, Inc.: R&D, 2018-2022 (US$ Million, AGR%)
Figure 185 Fortinet, Inc.: Regional Revenue Share, 2022 (%)
Figure 186 Fortinet, Inc.: Business Segment Revenue Share, 2022 (%)
Figure 187 International Business Machines Corporation (IBM).: Net Revenue, 2018-2022 (US$ Million, AGR%)
Figure 188 International Business Machines Corporation (IBM).: R&D, 2018-2022 (US$ Million, AGR%)
Figure 189 International Business Machines Corporation (IBM).: Regional Revenue Share, 2022 (%)
Figure 190 International Business Machines Corporation (IBM).: Business Segment Revenue Share, 2022 (%)
Figure 191 Check Point Software Technologies Ltd.: Net Revenue, 2018-2022 (US$ Million, AGR%)
Figure 192 Check Point Software Technologies Ltd.: R&D, 2018-2022 (US$ Million, AGR%)
Figure 193 Check Point Software Technologies Ltd.: Regional Revenue Share, 2022 (%)
Figure 194 Trend Micro Inc.: Net Revenue, 2018-2022 (US$ Million, AGR%)
Figure 195 Trend Micro Inc.: R&D, 2018-2022 (US$ Million, AGR%)
Figure 196 Trend Micro Inc.: Regional Revenue Share, 2022 (%)
Figure 197 CrowdStrike Holdings, Inc.: Net Revenue ,2019-2023 (US$ Million, AGR%)
Figure 198 CrowdStrike Holdings, Inc.: R&D, 2019-2023 (US$ Million, AGR%)
Figure 199 CrowdStrike Holdings, Inc.: Business Segment Revenue Share, 2022 (%)
Figure 200 Qualys, Inc. Net Revenue, 2018-2022 (US$ Million, AGR%)
Figure 201 Qualys, Inc.: R&D, 2018-2022 (US$ Million, AGR%)
Figure 202 Qualys, Inc..: Regional Revenue Share, 2022 (%)
Figure 203 Gen Digital Inc.: Net Revenue ,2019-2023 (US$ Million, AGR%)
Figure 204 Gen Digital Inc.: R&D, 2019-2023 (US$ Million, AGR%)
Figure 205 Gen Digital Inc.: Regional Revenue Share, 2023 (%)
Figure 206 Gen Digital Inc.: Business Segment Revenue Share, 2023 (%)
Figure 207 Splunk Inc Net Revenue, 2019-2023 (US$ Million, AGR%)
Figure 208 Splunk Inc.: R&D, 2019-2023 (US$ Million, AGR%)
Figure 209 Splunk Inc.: Regional Revenue Share, 2023 (%)
ページTOPに戻る
Summary
Report Details
The Cyber Security Market Report 2023-2033: This report will prove invaluable to leading firms striving for new revenue pockets if they wish to better understand the industry and its underlying dynamics. It will be useful for companies that would like to expand into different industries or to expand their existing operations in a new region.
Increasing Cyber Threat Landscape
The global cybersecurity market is driven by the relentless growth of the cyber threat landscape. As the digital world expands, so do the opportunities for cybercriminals. Cyber threats such as malware, ransomware, phishing attacks, and data breaches continue to evolve in sophistication and frequency. This forces organisations to invest in advanced cybersecurity solutions to protect their data, infrastructure, and reputation. As a result, the cybersecurity market is witnessing substantial growth as businesses seek to defend themselves against an ever-expanding array of cyber threats.
Implementing Robust Cyber Security Measures Can be Expensive, Especially for Small Businesses with Limited Resources
The implementation of robust cybersecurity measures undoubtedly plays a crucial role in safeguarding digital assets and sensitive information in today’s interconnected world. However, the cost associated with establishing and maintaining such security measures can present significant challenges, particularly for small businesses operating with limited resources. The financial constraints often faced by small businesses can hinder their ability to invest in comprehensive cybersecurity solutions, leaving them more vulnerable to cyber threats. The expenses related to acquiring advanced security technologies, conducting regular security assessments, training personnel, and addressing compliance requirements can strain already tight budgets. As a result, these businesses might face a difficult decision between allocating funds to cybersecurity or other essential operational needs.
What Questions Should You Ask before Buying a Market Research Report?
• How is the cyber security market evolving?
• What is driving and restraining the cyber security market?
• How will each cyber security submarket segment grow over the forecast period and how much revenue will these submarkets account for in 2033?
• How will the market shares for each cyber security submarket develop from 2023 to 2033?
• What will be the main driver for the overall market from 2023 to 2033?
• Will leading cyber security markets broadly follow the macroeconomic dynamics, or will individual national markets outperform others?
• How will the market shares of the national markets change by 2033 and which geographical region will lead the market in 2033?
• Who are the leading players and what are their prospects over the forecast period?
• What are the cyber security projects for these leading companies?
• How will the industry evolve during the period between 2023 and 2033? What are the implications of cyber security projects taking place now and over the next 10 years?
• Is there a greater need for product commercialisation to further scale the cyber security market?
• Where is the cyber security market heading and how can you ensure you are at the forefront of the market?
• What are the best investment options for new product and service lines?
• What are the key prospects for moving companies into a new growth path and C-suite?
You need to discover how this will impact the cyber security market today, and over the next 10 years:
• Our 478-page report provides 138 tables and 209 charts/graphs exclusively to you.
• The report highlights key lucrative areas in the industry so you can target them – NOW.
• It contains in-depth analysis of global, regional and national sales and growth.
• It highlights for you the key successful trends, changes and revenue projections made by your competitors.
This report tells you TODAY how the cyber security market will develop in the next 10 years, and in line with the variations in COVID-19 economic recession and bounce. This market is more critical now than at any point over the last 10 years.
Forecasts to 2033 and other analyses reveal commercial prospects
• In addition to revenue forecasting to 2033, our new study provides you with recent results, growth rates, and market shares.
• You will find original analyses, with business outlooks and developments.
• Discover qualitative analyses (including market dynamics, drivers, opportunities, restraints and challenges), cost structure, impact of rising cyber security prices and recent developments.
This report includes data analysis and invaluable insight into how COVID-19 will affect the industry and your company. Four COVID-19 recovery patterns and their impact, namely, “V”, “L”, “W” and “U” are discussed in this report.
Segments Covered in the Report
Market Segment by Deployment Mode
• Cloud
• On-premises
Market Segment by Component
• Hardware
• Software
• Services
Market Segment by Security Type
• Network Security
• Cloud Security
• Application Security
• Endpoint and IoT Security
Market Segment by Vertical
• Government
• BFSI
• IT & Telecom
• Healthcare
• Other Verticals
Market Segment by Software
• Identity and Access Management (IAM)
• Antivirus/Antimalware
• Log Management and SIEM
• Encryption and Tokenisation
• Compliance and Policy Management
• Other Software
In addition to the revenue predictions for the overall world market and segments, you will also find revenue forecasts for four regional and 20 leading national markets:
North America
• U.S.
• Canada
Europe
• Germany
• Spain
• United Kingdom
• France
• Italy
• Rest of Europe
Asia Pacific
• China
• Japan
• India
• Australia
• South Korea
• Rest of Asia Pacific
Latin America
• Brazil
• Mexico
• Rest of Latin America
Middle East & Africa
• GCC
• South Africa
• Rest of Middle East & Africa
The report also includes profiles and for some of the leading companies in the Cyber Security Market, 2023 to 2033, with a focus on this segment of these companies’ operations.
Leading companies profiled in the report
• Check Point Software Technologies Ltd
• Cisco Systems, Inc.
• CrowdStrike Holdings, Inc.
• Fortinet, Inc.
• Gen Digital Inc.
• Imperva Inc.
• International Business Machines Corporation (IBM)
• McAfee Corp
• Microsoft Corporation
• Palo Alto Networks, Inc.
• Proofpoint, Inc.
• Qualys, Inc.
• Splunk Inc.
• Trellix
• Trend Micro Inc.
Overall world revenue for Cyber Security Market, 2023 to 2033 in terms of value the market will surpass US$200.6 billion in 2023, our work calculates. We predict strong revenue growth through to 2033. Our work identifies which organisations hold the greatest potential. Discover their capabilities, progress, and commercial prospects, helping you stay ahead.
How will the Cyber Security Market, 2023 to 2033 report help you?
In summary, our 470+ page report provides you with the following knowledge:
• Revenue forecasts to 2033 for Cyber Security Market, 2023 to 2033 Market, with forecasts for deployment mode, component, security type, vertical, software, each forecast at a global and regional level – discover the industry’s prospects, finding the most lucrative places for investments and revenues.
• Revenue forecasts to 2033 for four regional and 20 key national markets – See forecasts for the Cyber Security Market, 2023 to 2033 market in North America, Europe, Asia-Pacific, Latin America and Middle East & Africa. Also forecasted is the market in the US, Canada, Brazil, Germany, France, UK, Italy, China, India, Japan, and Australia among other prominent economies.
• Prospects for established firms and those seeking to enter the market – including company profiles for 15 of the major companies involved in the Cyber Security Market, 2023 to 2033.
Find quantitative and qualitative analyses with independent predictions. Receive information that only our report contains, staying informed with invaluable business intelligence.
Information found nowhere else
With our new report, you are less likely to fall behind in knowledge or miss out on opportunities. See how our work could benefit your research, analyses, and decisions. Visiongain’s study is for everybody needing commercial analyses for the Cyber Security Market, 2023 to 2033, market-leading companies. You will find data, trends and predictions.
ページTOPに戻る
Table of Contents
Table of Contents
1 Report Overview
1.1 Objectives of the Study
1.2 Introduction to Cyber Security Market
1.3 What This Report Delivers
1.4 Why You Should Read This Report
1.5 Key Questions Answered by This Analytical Report
1.6 Who Is This Report for?
1.7 Methodology
1.7.1 Market Definitions
1.7.2 Market Evaluation & Forecasting Methodology
1.7.3 Data Validation
1.7.3.1 Primary Research
1.7.3.2 Secondary Research
1.8 Frequently Asked Questions (FAQs)
1.9 Associated Visiongain Reports
1.10 About Visiongain
2 Executive Summary
3 Market Overview
3.1 Key Findings
3.2 Market Dynamics
3.2.1 Market Driving Factors
3.2.1.1 Protection of Sensitive Data to Drive the Market Growth
3.2.1.2 Cybersecurity Strategy and Action Plan Driving the Market Growth
3.2.1.3 Integration of Technologies Such as the Internet of Things(IOT), Machine Learning, and Cloud to Drive the Market Growth
3.2.2 Market Restraining Factors
3.2.2.1 Implementing Robust Cyber Security Measures Can be Expensive, Especially for Small Businesses with Limited Resources
3.2.2.2 Increasing Reliance On Modern Software Increases The Vulnerability Of Computers To Cyberattacks
3.2.2.3 Lack of Budget Among SMEs and Start-Ups in Developing Economies
3.2.3 Market Opportunities
3.2.3.1 Cyber Security Is Often Used To Protect Company Secrets And Intellectual Property From Competitors or Hackers
3.2.3.2 Regulation and Government Friendly Policy
3.2.3.3 Growth of Endpoint Security Segment Due to Increased BYOD Trend
3.3 Porter’s Five Forces Analysis
3.3.1 Bargaining Power of Suppliers (Low to Medium)
3.3.2 Bargaining Power of Buyers (High)
3.3.3 Competitive Rivalry (Medium to High)
3.3.4 Threat from Substitutes (Low)
3.3.5 Threat of New Entrants (moderate to High)
3.4 COVID-19 Impact Analysis
3.4.1 “V-Shaped Recovery”
3.4.2 “U-Shaped Recovery”
3.4.3 “W-Shaped Recovery”
3.4.4 “L-Shaped Recovery”
3.5 PEST Analysis
4 Cyber Security Market Analysis by Deployment Mode
4.1 Key Findings
4.2 Deployment Mode Segment: Market Attractiveness Index
4.3 Cyber Security Market Size Estimation and Forecast by Deployment Mode
4.4 Cloud
4.4.1 Market Size by Region, 2023-2033 (US$ Billion)
4.4.2 Market Share by Region, 2023 & 2033 (%)
4.5 On-premises
4.5.1 Market Size by Region, 2023-2033 (US$ Billion)
4.5.2 Market Share by Region, 2023 & 2033 (%)
5 Cyber Security Market Analysis by Component
5.1 Key Findings
5.2 Component Segment: Market Attractiveness Index
5.3 Cyber Security Market Size Estimation and Forecast by Component
5.4 Hardware
5.4.1 Market Size by Region, 2023-2033 (US$ Billion)
5.4.2 Market Share by Region, 2023 & 2033 (%)
5.5 Software
5.5.1 Market Size by Region, 2023-2033 (US$ Billion)
5.5.2 Market Share by Region, 2023 & 2033 (%)
5.6 Services
5.6.1 Market Size by Region, 2023-2033 (US$ Billion)
5.6.2 Market Share by Region, 2023 & 2033 (%)
6 Cyber Security Market Analysis by Security Type
6.1 Key Findings
6.2 Security Type Segment: Market Attractiveness Index
6.3 Cyber Security Market Size Estimation and Forecast by Security Type
6.4 Network Security
6.4.1 Market Size by Region, 2023-2033 (US$ Billion)
6.4.2 Market Share by Region, 2023 & 2033 (%)
6.5 Cloud Security
6.5.1 Market Size by Region, 2023-2033 (US$ Billion)
6.5.2 Market Share by Region, 2023 & 2033 (%)
6.6 Application Security
6.6.1 Market Size by Region, 2023-2033 (US$ Billion)
6.6.2 Market Share by Region, 2023 & 2033 (%)
6.7 Endpoint and IoT Security
6.7.1 Market Size by Region, 2023-2033 (US$ Billion)
6.7.2 Market Share by Region, 2023 & 2033 (%)
7 Cyber Security Market Analysis by Vertical
7.1 Key Findings
7.2 Vertical Segment: Market Attractiveness Index
7.3 Cyber Security Market Size Estimation and Forecast by Vertical
7.4 Government
7.4.1 Market Size by Region, 2023-2033 (US$ Billion)
7.4.2 Market Share by Region, 2023 & 2033 (%)
7.5 BFSI
7.5.1 Market Size by Region, 2023-2033 (US$ Billion)
7.5.2 Market Share by Region, 2023 & 2033 (%)
7.6 IT&Telecom
7.6.1 Market Size by Region, 2023-2033 (US$ Billion)
7.6.2 Market Share by Region, 2023 & 2033 (%)
7.7 Healthcare
7.7.1 Market Size by Region, 2023-2033 (US$ Billion)
7.7.2 Market Share by Region, 2023 & 2033 (%)
7.8 Other Verticals
7.8.1 Market Size by Region, 2023-2033 (US$ Billion)
7.8.2 Market Share by Region, 2023 & 2033 (%)
8 Cyber Security Market Analysis by Software
8.1 Key Findings
8.2 Software Segment: Market Attractiveness Index
8.3 Cyber Security Market Size Estimation and Forecast by Vertical
8.4 Identity and Access Management (IAM)
8.4.1 Market Size by Region, 2023-2033 (US$ Billion)
8.4.2 Market Share by Region, 2023 & 2033 (%)
8.5 Antivirus/Antimalware
8.5.1 Market Size by Region, 2023-2033 (US$ Billion)
8.5.2 Market Share by Region, 2023 & 2033 (%)
8.6 Log Management and SIEM
8.6.1 Market Size by Region, 2023-2033 (US$ Billion)
8.6.2 Market Share by Region, 2023 & 2033 (%)
8.7 Encryption and Tokenization
8.7.1 Market Size by Region, 2023-2033 (US$ Billion)
8.7.2 Market Share by Region, 2023 & 2033 (%)
8.8 Compliance and Policy Management
8.8.1 Market Size by Region, 2023-2033 (US$ Billion)
8.8.2 Market Share by Region, 2023 & 2033 (%)
8.9 Other Software
8.9.1 Market Size by Region, 2023-2033 (US$ Billion)
8.9.2 Market Share by Region, 2023 & 2033 (%)
9 Cyber Security Market Analysis by Region
9.1 Key Findings
9.2 Regional Market Size Estimation and Forecast
10 North America Cyber Security Market Analysis
10.1 Key Findings
10.2 North America Cyber Security Market Attractiveness Index
10.3 North America Cyber Security Market by Country, 2023, 2028 & 2033 (US$ Billion)
10.4 North America Cyber Security Market Size Estimation and Forecast
10.5 North America Cyber Security Market Size Estimation and Forecast by Country
10.6 North America Cyber Security Market Size Estimation and Forecast by Deployment Mode
10.7 North America Cyber Security Market Size Estimation and Forecast by Component
10.8 North America Cyber Security Market Size Estimation and Forecast by Security Type
10.9 North America Cyber Security Market Size Estimation and Forecast by Vertical
10.10 North America Cyber Security Market Size Estimation and Forecast by Software
10.11 U.S. Cyber Security Market Analysis
10.12 Canada Cyber Security Market Analysis
11 Europe Cyber Security Market Analysis
11.1 Key Findings
11.2 Europe Cyber Security Market Attractiveness Index
11.3 Europe Cyber Security Market by Country, 2023, 2028 & 2033 (US$ Billion)
11.4 Europe Cyber Security Market Size Estimation and Forecast
11.5 Europe Cyber Security Market Size Estimation and Forecast by Country
11.6 Europe Cyber Security Market Size Estimation and Forecast by Deployment Mode
11.7 Europe Cyber Security Market Size Estimation and Forecast by Component
11.8 Europe Cyber Security Market Size Estimation and Forecast by Security Type
11.9 Europe Cyber Security Market Size Estimation and Forecast by Vertical
11.10 Europe Cyber Security Market Size Estimation and Forecast by Software
11.11 Germany Cyber Security Market Analysis
11.12 UK Cyber Security Market Analysis
11.13 France Cyber Security Market Analysis
11.14 Italy Cyber Security Market Analysis
11.15 Spain Cyber Security Market Analysis
11.16 Rest of Europe Cyber Security Market Analysis
12 Asia-Pacific Cyber Security Market Analysis
12.1 Key Findings
12.2 Asia-Pacific Cyber Security Market Attractiveness Index
12.3 Asia-Pacific Cyber Security Market by Country, 2023, 2028 & 2033 (US$ Billion)
12.4 Asia-Pacific Cyber Security Market Size Estimation and Forecast
12.5 Asia-Pacific Cyber Security Market Size Estimation and Forecast by Country
12.6 Asia-Pacific Cyber Security Market Size Estimation and Forecast by Deployment Mode
12.7 Asia-Pacific Cyber Security Market Size Estimation and Forecast by Component
12.8 Asia-Pacific Cyber Security Market Size Estimation and Forecast by Security Type
12.9 Asia-Pacific Cyber Security Market Size Estimation and Forecast by Vertical
12.10 Asia-Pacific Cyber Security Market Size Estimation and Forecast by Software
12.11 China Cyber Security Market Analysis
12.12 India Cyber Security Market Analysis
12.13 Japan Cyber Security Market Analysis
12.14 South Korea Cyber Security Market Analysis
12.15 Australia Cyber Security Market Analysis
12.16 Rest of Asia-Pacific Cyber Security Market Analysis
13 Middle East and Africa Cyber Security Market Analysis
13.1 Key Findings
13.2 Middle East and Africa Cyber Security Market Attractiveness Index
13.3 Middle East and Africa Cyber Security Market by Country, 2023, 2028 & 2033 (US$ Billion)
13.4 Middle East and Africa Cyber Security Market Size Estimation and Forecast
13.5 Middle East and Africa Cyber Security Market Size Estimation and Forecast by Country
13.6 Middle East and Africa Cyber Security Market Size Estimation and Forecast by Deployment Mode
13.7 Middle East and Africa Cyber Security Market Size Estimation and Forecast by Component
13.8 Middle East and Africa Cyber Security Market Size Estimation and Forecast by Security Type
13.9 Middle East and Africa Cyber Security Market Size Estimation and Forecast by Vertical
13.10 Middle East and Africa Cyber Security Market Size Estimation and Forecast by Software
13.11 GCC Cyber Security Market Analysis
13.12 South Africa Cyber Security Market Analysis
13.13 Rest of Middle East & Africa Cyber Security Market Analysis
14 Latin America Cyber Security Market Analysis
14.1 Key Findings
14.2 Latin America Cyber Security Market Attractiveness Index
14.3 Latin America Cyber Security Market by Country, 2023, 2028 & 2033 (US$ Billion)
14.4 Latin America Cyber Security Market Size Estimation and Forecast
14.5 Latin America Cyber Security Market Size Estimation and Forecast by Country
14.6 Latin America Cyber Security Market Size Estimation and Forecast by Deployment Mode
14.7 Latin America Cyber Security Market Size Estimation and Forecast by Component
14.8 Latin America Cyber Security Market Size Estimation and Forecast by Security Type
14.9 Latin America Cyber Security Market Size Estimation and Forecast by Vertical
14.10 Latin America Cyber Security Market Size Estimation and Forecast by Software
14.11 Brazil Cyber Security Market Analysis
14.12 Mexico Cyber Security Market Analysis
14.13 Rest of Latin America Cyber Security Market Analysis
15 Company Profiles
15.1 Competitive Landscape, 2022
15.2 Strategic Outlook
15.3 Microsoft Corporation
15.3.1 Company Snapshot
15.3.2 Company Overview
15.3.3 Financial Analysis
15.3.3.1 Net Revenue, 2019-2023
15.3.3.2 R&D, 2019-2023
15.3.3.3 Regional Revenue Share, 2023 (%)
15.3.3.4 Business Segment Revenue Share, 2023 (%)
15.3.4 Product Benchmarking
15.3.5 Strategic Outlook
15.4 Cisco Systems, Inc
15.4.1 Company Snapshot
15.4.2 Company Overview
15.4.3 Financial Analysis
15.4.3.1 Net Revenue, 2019-2023
15.4.3.2 R&D, 2019-2023
15.4.3.3 Regional Revenue Share, 2023 (%)
15.4.3.4 Business Segment Revenue Share, 2023 (%)
15.4.4 Product Benchmarking
15.4.5 Strategic Outlook
15.5 Palo Alto Networks, Inc
15.5.1 Company Snapshot
15.5.2 Company Overview
15.5.3 Financial Analysis
15.5.3.1 Net Revenue, 2018-2022
15.5.3.2 R&D, 2018-2022
15.5.3.3 Regional Revenue Share, 2022 (%)
15.5.3.4 Business Segment Revenue Share, 2022 (%)
15.5.4 Product Benchmarking
15.5.5 Strategic Outlook
15.6 Fortinet, Inc
15.6.1 Company Snapshot
15.6.2 Company Overview
15.6.3 Financial Analysis
15.6.3.1 Net Revenue, 2018-2022
15.6.3.2 R&D, 2018-2022
15.6.3.3 Regional Revenue Share, 2022 (%)
15.6.3.4 Business Segment Revenue Share, 2022 (%)
15.6.4 Product Benchmarking
15.6.5 Strategic Outlook
15.7 International Business Machines Corporation (IBM)
15.7.1 Company Snapshot
15.7.2 Company Overview
15.7.3 Financial Analysis
15.7.3.1 Net Revenue, 2018-2022
15.7.3.2 R&D, 2018-2022
15.7.3.3 Regional Revenue Share, 2022 (%)
15.7.3.4 Business Segment Revenue Share, 2022 (%)
15.7.4 Product Benchmarking
15.7.5 Strategic Outlook
15.8 Check Point Software Technologies Ltd
15.8.1 Company Snapshot
15.8.2 Company Overview
15.8.3 Financial Analysis
15.8.3.1 Net Revenue, 2018-2022
15.8.3.2 R&D, 2018-2022
15.8.3.3 Regional Revenue Share, 2022 (%)
15.8.4 Product Benchmarking
15.8.5 Strategic Outlook
15.9 McAfee Corp
15.9.1 Company Snapshot
15.9.2 Company Overview
15.9.3 Product Benchmarking
15.9.4 Strategic Outlook
15.10 Proofpoint, Inc
15.10.1 Company Snapshot
15.10.2 Company Overview
15.10.3 Product Benchmarking
15.10.4 Strategic Outlook
15.11 Trend Micro Inc
15.11.1 Company Snapshot
15.11.2 Company Overview
15.11.3 Financial Analysis
15.11.3.1 Net Revenue, 2018-2022
15.11.3.2 R&D, 2018-2022
15.11.3.3 Regional Revenue Share, 2022 (%)
15.11.4 Product Benchmarking
15.11.5 Strategic Outlook
15.12 CrowdStrike Holdings, Inc
15.12.1 Company Snapshot
15.12.2 Company Overview
15.12.3 Financial Analysis
15.12.3.1 Net Revenue, 2019-2023
15.12.3.2 R&D, 2019-2023
15.12.3.3 Business Segment Revenue Share, 2022 (%)
15.12.4 Product Benchmarking
15.12.5 Strategic Outlook
15.13 Trellix
15.13.1 Company Snapshot
15.13.2 Company Overview
15.13.3 Product Benchmarking
15.14 Imperva Inc
15.14.1 Company Snapshot
15.14.2 Company Overview
15.14.3 Product Benchmarking
15.14.4 Strategic Outlook
15.15 Qualys, Inc.
15.15.1 Company Snapshot
15.15.2 Company Overview
15.15.3 Financial Analysis
15.15.3.1 Net Revenue, 2018-2022
15.15.3.2 R&D, 2018-2022
15.15.3.3 Regional Revenue Share, 2022 (%)
15.15.4 Product Benchmarking
15.15.5 Strategic Outlook
15.16 Gen Digital Inc.
15.16.1 Company Snapshot
15.16.2 Company Overview
15.16.3 Financial Analysis
15.16.3.1 Net Revenue, 2019-2023
15.16.3.2 R&D, 2019-2023
15.16.3.3 Regional Revenue Share, 2023 (%)
15.16.3.4 Business Segment Revenue Share, 2023 (%)
15.16.4 Product Benchmarking
15.16.5 Strategic Outlook
15.17 Splunk Inc.
15.17.1 Company Snapshot
15.17.2 Company Overview
15.17.3 Financial Analysis
15.17.3.1 Net Revenue, 2019-2023
15.17.3.2 R&D, 2019-2023
15.17.3.3 Regional Revenue Share, 2023 (%)
15.17.4 Product Benchmarking
15.17.5 Strategic Outlook
16 Conclusion and Recommendations
16.1 Concluding Remarks from Visiongain
16.2 Recommendations for Market Players
ページTOPに戻る
List of Tables/Graphs
List of Tables
Table 1 Cyber Security Market Snapshot, 2023 & 2033 (US$ Billion, CAGR %)
Table 2 Top 10 Data Breaches and Cyberattacks in 2022
Table 3 Global Cyber Attacks 2021-2022
Table 4 International Civil Aviation Organization, Cybersecurity Action Plan, 2022
Table 5 According to a 2022 report by cybersecurity firm eSentire
Table 6 Global Cyber Security Market by Region, 2023-2033 (US$ Bn, AGR (%), CAGR (%)) (V-Shaped Recovery Scenario)
Table 7 Global Cyber Security Market by Region, 2023-2033 (US$ Bn, AGR (%), CAGR (%)) (U-Shaped Recovery Scenario)
Table 8 Global Cyber Security Market by Region, 2023-2033 (US$ Bn, AGR (%), CAGR (%)) (W-Shaped Recovery Scenario)
Table 9 Global Cyber Security Market by Region, 2023-2033 (US$ Bn, AGR (%), CAGR (%)) (L-Shaped Recovery Scenario)
Table 10 Global Cyber Security Market by Deployment Mode, 2023-2033 (US$ Bn, AGR (%), CAGR (%))
Table 11 Cloud Market by Region, 2023-2033 (US$ Bn, AGR (%), CAGR (%))
Table 12 On-premises Market by Region, 2023-2033 (US$ Bn, AGR (%), CAGR (%))
Table 13 Global Cyber Security Market by Component, 2023-2033 (US$ Bn, AGR (%), CAGR (%))
Table 14 Hardware Market by Region, 2023-2033 (US$ Bn, AGR (%), CAGR (%))
Table 15 Software Market by Region, 2023-2033 (US$ Bn, AGR (%), CAGR (%))
Table 16 Services Market by Region, 2023-2033 (US$ Bn, AGR (%), CAGR (%))
Table 17 Global Cyber Security Market by Security Type, 2023-2033 (US$ Bn, AGR (%), CAGR (%))
Table 18 Network Security Market by Region, 2023-2033 (US$ Bn, AGR (%), CAGR (%))
Table 19 Cloud Security Market by Region, 2023-2033 (US$ Bn, AGR (%), CAGR (%))
Table 20 Application Security Market by Region, 2023-2033 (US$ Bn, AGR (%), CAGR (%))
Table 21 Endpoint and IoT Security Market by Region, 2023-2033 (US$ Bn, AGR (%), CAGR (%))
Table 22 Global Cyber Security Market by Vertical, 2023-2033 (US$ Bn, AGR (%), CAGR (%))
Table 23 Government Market by Region, 2023-2033 (US$ Bn, AGR (%), CAGR (%))
Table 24 BFSI Market by Region, 2023-2033 (US$ Bn, AGR (%), CAGR (%))
Table 25 IT&Telecom Market by Region, 2023-2033 (US$ Bn, AGR (%), CAGR (%))
Table 26 Healthcare Market by Region, 2023-2033 (US$ Bn, AGR (%), CAGR (%))
Table 27 Other Verticals Market by Region, 2023-2033 (US$ Bn, AGR (%), CAGR (%))
Table 28 Global Cyber Security Market by Software, 2023-2033 (US$ Bn, AGR (%), CAGR (%))
Table 29 Identity and Access Management (IAM) Market by Region, 2023-2033 (US$ Bn, AGR (%), CAGR (%))
Table 30 Best Malware Protection Software Solutions 2023
Table 31 Antivirus/Antimalware Market by Region, 2023-2033 (US$ Bn, AGR (%), CAGR (%))
Table 32 Log Management and SIEM Market by Region, 2023-2033 (US$ Bn, AGR (%), CAGR (%))
Table 33 Encryption and Tokenization Market by Region, 2023-2033 (US$ Bn, AGR (%), CAGR (%))
Table 34 Compliance and Policy Management Market by Region, 2023-2033 (US$ Bn, AGR (%), CAGR (%))
Table 35 Other Software Market by Region, 2023-2033 (US$ Bn, AGR (%), CAGR (%))
Table 36 Global Cyber Security Market Forecast, 2023-2033 (US$ Bn, AGR (%), CAGR (%))
Table 37 Cyber Security Market Forecast by Region, 2023-2033 (US$ Billion, AGR%, CAGR%)
Table 38 North America Cyber Security Market by Value, 2023-2033 (US$ Bn, AGR (%), CAGR (%))
Table 39 North America Cyber Security Market by Country, 2023-2033 (US$ Bn, AGR (%), CAGR (%))
Table 40 North America Cyber Security Market by Deployment Mode, 2023-2033 (US$ Bn, AGR (%), CAGR (%))
Table 41 North America Cyber Security Market by Component, 2023-2033 (US$ Bn, AGR (%), CAGR (%))
Table 42 North America Cyber Security Market by Security Type, 2023-2033 (US$ Bn, AGR (%), CAGR (%))
Table 43 North America Cyber Security Market by Vertical, 2023-2033 (US$ Bn, AGR (%), CAGR (%))
Table 44 North America Cyber Security Market by Software, 2023-2033 (US$ Bn, AGR (%), CAGR (%))
Table 45 US Cyber Security Market by Value, 2023-2033 (US$ Bn, AGR (%), CAGR (%))
Table 46 Canada Cyber Security Market by Value, 2023-2033 (US$ Bn, AGR (%), CAGR (%))
Table 47 Europe Cyber Security Market by Value, 2023-2033 (US$ Bn, AGR (%), CAGR (%))
Table 48 Europe Cyber Security Market by Country, 2023-2033 (US$ Bn, AGR (%), CAGR (%))
Table 49 Europe Cyber Security Market by Deployment Mode, 2023-2033 (US$ Bn, AGR (%), CAGR (%))
Table 50 Europe Cyber Security Market by Component, 2023-2033 (US$ Bn, AGR (%), CAGR (%))
Table 51 Europe Cyber Security Market by Security Type, 2023-2033 (US$ Bn, AGR (%), CAGR (%))
Table 52 Europe Cyber Security Market by Vertical, 2023-2033 (US$ Bn, AGR (%), CAGR (%))
Table 53 Europe Cyber Security Market by Software, 2023-2033 (US$ Bn, AGR (%), CAGR (%))
Table 54 Germany Cyber Security Market by Value, 2023-2033 (US$ Bn, AGR (%), CAGR (%))
Table 55 UK Cyber Security Market by Value, 2023-2033 (US$ Bn, AGR (%), CAGR (%))
Table 56 France Cyber Security Market by Value, 2023-2033 (US$ Bn, AGR (%), CAGR (%))
Table 57 Italy Cyber Security Market by Value, 2023-2033 (US$ Bn, AGR (%), CAGR (%))
Table 58 Spain Cyber Security Market by Value, 2023-2033 (US$ Bn, AGR (%), CAGR (%))
Table 59 Rest of Europe Cyber Security Market by Value, 2023-2033 (US$ Bn, AGR (%), CAGR (%))
Table 60 Asia-Pacific Cyber Security Market by Value, 2023-2033 (US$ Bn, AGR (%), CAGR (%))
Table 61 Asia-Pacific Cyber Security Market by Country, 2023-2033 (US$ Bn, AGR (%), CAGR (%))
Table 62 Asia-Pacific Cyber Security Market by Deployment Mode, 2023-2033 (US$ Bn, AGR (%), CAGR (%))
Table 63 Asia-Pacific Cyber Security Market by Component, 2023-2033 (US$ Bn, AGR (%), CAGR (%))
Table 64 Asia-Pacific Cyber Security Market by Security Type, 2023-2033 (US$ Bn, AGR (%), CAGR (%))
Table 65 Asia-Pacific Cyber Security Market by Vertical, 2023-2033 (US$ Bn, AGR (%), CAGR (%))
Table 66 Asia-Pacific Cyber Security Market by Software, 2023-2033 (US$ Bn, AGR (%), CAGR (%))
Table 67 China Cyber Security Market by Value, 2023-2033 (US$ Bn, AGR (%), CAGR (%))
Table 68 India Cyber Security Market by Value, 2023-2033 (US$ Bn, AGR (%), CAGR (%))
Table 69 Japan Cyber Security Market by Value, 2023-2033 (US$ Bn, AGR (%), CAGR (%))
Table 70 South Korea Cyber Security Market by Value, 2023-2033 (US$ Bn, AGR (%), CAGR (%))
Table 71 Australia Cyber Security Market by Value, 2023-2033 (US$ Bn, AGR (%), CAGR (%))
Table 72 Rest of Asia-Pacific Cyber Security Market by Value, 2023-2033 (US$ Bn, AGR (%), CAGR (%))
Table 73 Middle East & Africa Cyber Security Market by Value, 2023-2033 (US$ Bn, AGR (%), CAGR (%))
Table 74 Middle East & Africa Cyber Security Market by Country, 2023-2033 (US$ Bn, AGR (%), CAGR (%))
Table 75 Middle East & Africa Cyber Security Market by Deployment Mode, 2023-2033 (US$ Bn, AGR (%), CAGR (%))
Table 76 Middle East & Africa Cyber Security Market by Component, 2023-2033 (US$ Bn, AGR (%), CAGR (%))
Table 77 Middle East & Africa Cyber Security Market by Security Type, 2023-2033 (US$ Bn, AGR (%), CAGR (%))
Table 78 Middle East & Africa Cyber Security Market by Vertical, 2023-2033 (US$ Bn, AGR (%), CAGR (%))
Table 79 Middle East & Africa Cyber Security Market by Software, 2023-2033 (US$ Bn, AGR (%), CAGR (%))
Table 80 GCC Cyber Security Market by Value, 2023-2033 (US$ Bn, AGR (%), CAGR (%))
Table 81 South Africa Cyber Security Market by Value, 2023-2033 (US$ Bn, AGR (%), CAGR (%))
Table 82 Rest of Middle East & Africa Cyber Security Market by Value, 2023-2033 (US$ Bn, AGR (%), CAGR (%))
Table 83 Latin America Cyber Security Market by Value, 2023-2033 (US$ Bn, AGR (%), CAGR (%))
Table 84 Latin America Cyber Security Market by Country, 2023-2033 (US$ Bn, AGR (%), CAGR (%))
Table 85 Latin America Cyber Security Market by Deployment Mode, 2023-2033 (US$ Bn, AGR (%), CAGR (%))
Table 86 Latin America Cyber Security Market by Component, 2023-2033 (US$ Bn, AGR (%), CAGR (%))
Table 87 Latin America Cyber Security Market by Security Type, 2023-2033 (US$ Bn, AGR (%), CAGR (%))
Table 88 Latin America Cyber Security Market by Vertical, 2023-2033 (US$ Bn, AGR (%), CAGR (%))
Table 89 Latin America Cyber Security Market by Software, 2023-2033 (US$ Bn, AGR (%), CAGR (%))
Table 90 Brazil Cyber Security Market by Value, 2023-2033 (US$ Bn, AGR (%), CAGR (%))
Table 91 Mexico Cyber Security Market by Value, 2023-2033 (US$ Bn, AGR (%), CAGR (%))
Table 92 Rest of Latin America Cyber Security Market by Value, 2023-2033 (US$ Bn, AGR (%), CAGR (%))
Table 93 Strategic Outlook - Contract
Table 94 Microsoft Corporation :Key Details, (CEO, HQ, Revenue, Founded, No. of Employees, Company Type, Website, Business Segment)
Table 95 Microsoft Corporation: Product Benchmarking
Table 96 Microsoft Corporation: Strategic Outlook
Table 97 Cisco Systems, Inc:Key Details, (CEO, HQ, Revenue, Founded, No. of Employees, Company Type, Website, Business Segment)
Table 98 Cisco Systems, Inc: Product Benchmarking
Table 99 Cisco Systems, Inc: Strategic Outlook
Table 100 Palo Alto Networks, Inc: Key Details, (CEO, HQ, Revenue, Founded, No. of Employees, Company Type, Website, Business Segment)
Table 101 Palo Alto Networks, Inc: Product Benchmarking
Table 102 Palo Alto Networks, Inc: Strategic Outlook
Table 103 Fortinet, Inc :Key Details, (CEO, HQ, Revenue, Founded, No. of Employees, Company Type, Website, Business Segment)
Table 104 Fortinet, Inc: Product Benchmarking
Table 105 Fortinet, Inc: Strategic Outlook
Table 106 International Business Machines Corporation (IBM):Key Details, (CEO, HQ, Revenue, Founded, No. of Employees, Company Type, Website, Business Segment)
Table 107 International Business Machines Corporation (IBM): Product Benchmarking
Table 108 International Business Machines Corporation (IBM): Strategic Outlook
Table 109 Check Point Software Technologies Ltd:Key Details, (CEO, HQ, Revenue, Founded, No. of Employees, Company Type, Website, Business Segment)
Table 110 Check Point Software Technologies Ltd.: Product Benchmarking
Table 111 Check Point Software Technologies Ltd: Strategic Outlook
Table 112 McAfee Corp:Key Details, (CEO, HQ, Revenue, Founded, No. of Employees, Company Type, Website, Business Segment)
Table 113 McAfee Corp: Product Benchmarking
Table 114 McAfee Corp: Strategic Outlook
Table 115 Proofpoint, Inc: Key Details, (CEO, HQ, Revenue, Founded, No. of Employees, Company Type, Website, Business Segment)
Table 116 Proofpoint, Inc: Product Benchmarking
Table 117 Proofpoint, Inc: Strategic Outlook
Table 118 Trend Micro Inc: Key Details, (CEO, HQ, Revenue, Founded, No. of Employees, Company Type, Website, Business Segment)
Table 119 Trend Micro Inc: Product Benchmarking
Table 120 Trend Micro Inc: Strategic Outlook
Table 121 CrowdStrike Holdings, Inc:Key Details, (CEO, HQ, Revenue, Founded, No. of Employees, Company Type, Website, Business Segment)
Table 122 CrowdStrike Holdings, Inc: Product Benchmarking
Table 123 CrowdStrike Holdings, Inc: Strategic Outlook
Table 124 Trellix: Key Details, (CEO, HQ, Revenue, Founded, No. of Employees, Company Type, Website, Business Segment)
Table 125 Trellix: Product Benchmarking
Table 126 Trellix: Strategic Outlook
Table 127 Imperva Inc:Key Details, (CEO, HQ, Revenue, Founded, No. of Employees, Company Type, Website, Business Segment)
Table 128 Imperva Inc: Product Benchmarking
Table 129 Imperva Inc: Strategic Outlook
Table 130 Qualys, Inc. :Key Details, (CEO, HQ, Revenue, Founded, No. of Employees, Company Type, Website, Business Segment)
Table 131 Qualys, Inc.: Product Benchmarking
Table 132 Qualys, Inc.: Strategic Outlook
Table 133 Gen Digital Inc.: Key Details, (CEO, HQ, Revenue, Founded, No. of Employees, Company Type, Website, Business Segment)
Table 134 Gen Digital Inc: Product Benchmarking
Table 135 Gen Digital Inc: Strategic Outlook
Table 136 Splunk Inc.: Key Details, (CEO, HQ, Revenue, Founded, No. of Employees, Company Type, Website, Business Segment)
Table 137 Splunk Inc: Product Benchmarking
Table 138 Splunk Inc: Strategic Outlook
List of Figures
Figure 1 Cyber Security Market Segmentation
Figure 2 Cyber Security Market by Deployment Mode: Market Attractiveness Index
Figure 3 Cyber Security Market by Component: Market Attractiveness Index
Figure 4 Cyber Security Market by Security Type: Market Attractiveness Index
Figure 5 Cyber Security Market by Vertical: Market Attractiveness Index
Figure 6 Cyber Security Market by Software: Market Attractiveness Index
Figure 7 Cyber Security Market Attractiveness Index by Region
Figure 8 Cyber Security Market: Market Dynamics
Figure 9 Cyber Security Market: Porter’s Five Forces Analysis
Figure 10 Global Cyber Security Market Share Forecast by COVID, 2023-2033 (%)
Figure 11 Global Cyber Security Market by Region, 2023-2033 (US$ Bn, AGR (%)) (V-Shaped Recovery Scenario)
Figure 12 Global Cyber Security Market by Region, 2023-2033 (US$ Bn, AGR (%)) (U-Shaped Recovery Scenario)
Figure 13 Global Cyber Security Market by Region, 2023-2033 (US$ Bn, AGR (%)) (W-Shaped Recovery Scenario)
Figure 14 Global Cyber Security Market by Region, 2023-2033 (US$ Bn, AGR (%)) (L-Shaped Recovery Scenario)
Figure 15 Cyber Security Market: PEST Analysis
Figure 16 Cyber Security Market by Deployment Mode: Market Attractiveness Index
Figure 17 Global Cyber Security Market by Deployment Mode, 2023-2033 (US$ Bn, AGR (%))
Figure 18 Cyber Security Market Share Forecast by Deployment Mode, 2023, 2028, 2033 (%)
Figure 19 Cloud Market by Region, 2023-2033 (US$ Bn, AGR (%))
Figure 20 Cloud Market Share Forecast by Region, 2023 & 2033 (%)
Figure 21 On-premises Market by Region, 2023-2033 (US$ Bn, AGR (%))
Figure 22 On-premises Market Share Forecast by Region, 2023 & 2033 (%)
Figure 23 Cyber Security Market by Component: Market Attractiveness Index
Figure 24 Global Cyber Security Market by Component, 2023-2033 (US$ Bn, AGR (%))
Figure 25 Cyber Security Market Share Forecast by Component, 2023, 2028, 2033 (%)
Figure 26 Hardware Market by Region, 2023-2033 (US$ Bn, AGR (%))
Figure 27 Hardware Market Share Forecast by Region, 2023 & 2033 (%)
Figure 28 Software Market by Region, 2023-2033 (US$ Bn, AGR (%))
Figure 29 Software Market Share Forecast by Region, 2023 & 2033 (%)
Figure 30 Services Market by Region, 2023-2033 (US$ Bn, AGR (%))
Figure 31 Services Market Share Forecast by Region, 2023 & 2033 (%)
Figure 32 Cyber Security Market by Security Type: Market Attractiveness Index
Figure 33 Global Cyber Security Market by Security Type, 2023-2033 (US$ Bn, AGR (%))
Figure 34 Cyber Security Market Share Forecast by Security Type, 2023, 2028, 2033 (%)
Figure 35 Network Security Market by Region, 2023-2033 (US$ Bn, AGR (%))
Figure 36 Network Security Market Share Forecast by Region, 2023 & 2033 (%)
Figure 37 Cloud Security Market by Region, 2023-2033 (US$ Bn, AGR (%))
Figure 38 Cloud Security Market Share Forecast by Region, 2023 & 2033 (%)
Figure 39 Application Security Market by Region, 2023-2033 (US$ Bn, AGR (%))
Figure 40 Application Security Market Share Forecast by Region, 2023 & 2033 (%)
Figure 41 Endpoint and IoT Security Market by Region, 2023-2033 (US$ Bn, AGR (%))
Figure 42 Endpoint and IOT Security Market Share Forecast by Region, 2023 & 2033 (%)
Figure 43 Cyber Security Market by Vertical: Market Attractiveness Index
Figure 44 Global Cyber Security Market by Vertical, 2023-2033 (US$ Bn, AGR (%))
Figure 45 Cyber Security Market Share Forecast by Vertical, 2023, 2028, 2033 (%)
Figure 46 Government Market by Region, 2023-2033 (US$ Bn, AGR (%))
Figure 47 Government Market Share Forecast by Region, 2023 & 2033 (%)
Figure 48 BFSI Market by Region, 2023-2033 (US$ Bn, AGR (%))
Figure 49 BFSI Market Share Forecast by Region, 2023 & 2033 (%)
Figure 50 IT&Telecom Market by Region, 2023-2033 (US$ Bn, AGR (%))
Figure 51 IT&Telecom Market Share Forecast by Region, 2023 & 2033 (%)
Figure 52 Healthcare Market by Region, 2023-2033 (US$ Bn, AGR (%))
Figure 53 Healthcare Market Share Forecast by Region, 2023 & 2033 (%)
Figure 54 Other Verticals Market by Region, 2023-2033 (US$ Bn, AGR (%))
Figure 55 Other Verticals Market Share Forecast by Region, 2023 & 2033 (%)
Figure 56 Cyber Security Market by Software: Market Attractiveness Index
Figure 57 Global Cyber Security Market by Software, 2023-2033 (US$ Bn, AGR (%))
Figure 58 Cyber Security Market Share Forecast by Software, 2023, 2028, 2033 (%)
Figure 59 Identity and Access Management (IAM) Market by Region, 2023-2033 (US$ Bn, AGR (%))
Figure 60 Identity and Access Management (IAM) Market Share Forecast by Region, 2023 & 2033 (%)
Figure 61 Antivirus/Antimalware Market by Region, 2023-2033 (US$ Bn, AGR (%))
Figure 62 Antivirus/Antimalware Market Share Forecast by Region, 2023 & 2033 (%)
Figure 63 Log Management and SIEM Market by Region, 2023-2033 (US$ Bn, AGR (%))
Figure 64 Log Management and SIEM Market Share Forecast by Region, 2023 & 2033 (%)
Figure 65 Encryption and Tokenization Market by Region, 2023-2033 (US$ Bn, AGR (%))
Figure 66 Encryption and Tokenization Market Share Forecast by Region, 2023 & 2033 (%)
Figure 67 Compliance and Policy Management Market by Region, 2023-2033 (US$ Bn, AGR (%))
Figure 68 Compliance and Policy Management Market Share Forecast by Region, 2023 & 2033 (%)
Figure 69 Other Software Market by Region, 2023-2033 (US$ Bn, AGR (%))
Figure 70 Other Software Market Share Forecast by Region, 2023 & 2033 (%)
Figure 71 Cyber Security Market Forecast by Region 2023 and 2033 (Revenue, CAGR%)
Figure 72 Global Cyber Security Market Forecast, 2023-2033 (US$ Bn, AGR (%))
Figure 73 Cyber Security Market Share Forecast by Region 2023, 2028, 2033 (%)
Figure 74 Cyber Security Market by Region, 2023-2033 (US$ Billion, AGR %)
Figure 75 North America Cyber Security Market Attractiveness Index
Figure 76 North America Cyber Security Market by Region, 2023, 2028 & 2033 (US$ Billion)
Figure 77 North America Cyber Security Market by Value, 2023-2033 (US$ Bn, AGR (%))
Figure 78 North America Cyber Security Market by Country, 2023-2033 (US$ Bn, AGR (%))
Figure 79 North America Cyber Security Market Share Forecast by Country, 2023 & 2033 (%)
Figure 80 North America Cyber Security Market by Deployment Mode, 2023-2033 (US$ Bn, AGR (%))
Figure 81 North America Cyber Security Market Share Forecast Deployment Mode, 2023 & 2033 (%)
Figure 82 North America Cyber Security Market by Component, 2023-2033 (US$ Bn, AGR (%))
Figure 83 North America Cyber Security Market Share Forecast by Component, 2023 & 2033 (%)
Figure 84 North America Cyber Security Market by Security Type, 2023-2033 (US$ Bn, AGR (%))
Figure 85 North America Cyber Security Market Share Forecast by Security Type, 2023 & 2033 (%)
Figure 86 North America Cyber Security Market by Vertical, 2023-2033 (US$ Bn, AGR (%))
Figure 87 North America Cyber Security Market Share Forecast by Vertical, 2023 & 2033 (%)
Figure 88 North America Cyber Security Market by Software, 2023-2033 (US$ Bn, AGR (%))
Figure 89 North America Cyber Security Market Share Forecast by Software, 2023 & 2033 (%)
Figure 90 US Cyber Security Market by Value, 2023-2033 (US$ Bn, AGR (%))
Figure 91 Canada Cyber Security Market by Value, 2023-2033 (US$ Bn, AGR (%))
Figure 92 Europe Cyber Security Market Attractiveness Index
Figure 93 Europe Cyber Security Market by Region, 2023, 2028 & 2033 (US$ Billion)
Figure 94 Europe Cyber Security Market by Value, 2023-2033 (US$ Bn, AGR (%))
Figure 95 Europe Cyber Security Market by Country, 2023-2033 (US$ Bn, AGR (%))
Figure 96 Europe Cyber Security Market Share Forecast by Country, 2023 & 2033 (%)
Figure 97 Europe Cyber Security Market by Deployment Mode, 2023-2033 (US$ Bn, AGR (%))
Figure 98 Europe Cyber Security Market Share Forecast Deployment Mode, 2023 & 2033 (%)
Figure 99 Europe Cyber Security Market by Component, 2023-2033 (US$ Bn, AGR (%))
Figure 100 Europe Cyber Security Market Share Forecast by Component, 2023 & 2033 (%)
Figure 101 Europe Cyber Security Market by Security Type, 2023-2033 (US$ Bn, AGR (%))
Figure 102 Europe Cyber Security Market Share Forecast by Security Type, 2023 & 2033 (%)
Figure 103 Europe Cyber Security Market by Vertical, 2023-2033 (US$ Bn, AGR (%))
Figure 104 Europe Cyber Security Market Share Forecast by Vertical, 2023 & 2033 (%)
Figure 105 Europe Cyber Security Market by Software, 2023-2033 (US$ Bn, AGR (%))
Figure 106 Europe Cyber Security Market Share Forecast by Software, 2023 & 2033 (%)
Figure 107 Germany Cyber Security Market by Value, 2023-2033 (US$ Bn, AGR (%))
Figure 108 UK Cyber Security Market by Value, 2023-2033 (US$ Bn, AGR (%))
Figure 109 France Cyber Security Market by Value, 2023-2033 (US$ Bn, AGR (%))
Figure 110 Italy Cyber Security Market by Value, 2023-2033 (US$ Bn, AGR (%))
Figure 111 Spain Cyber Security Market by Value, 2023-2033 (US$ Bn, AGR (%))
Figure 112 Rest of Europe Cyber Security Market by Value, 2023-2033 (US$ Bn, AGR (%))
Figure 113 Asia-Pacific Cyber Security Market Attractiveness Index
Figure 114 Asia-Pacific Cyber Security Market by Region, 2023, 2028 & 2033 (US$ Billion)
Figure 115 Asia-Pacific Cyber Security Market by Value, 2023-2033 (US$ Bn, AGR (%))
Figure 116 Asia-Pacific Cyber Security Market by Country, 2023-2033 (US$ Bn, AGR (%))
Figure 117 Asia-Pacific Cyber Security Market Share Forecast by Country, 2023 & 2033 (%)
Figure 118 Asia-Pacific Cyber Security Market by Deployment Mode, 2023-2033 (US$ Bn, AGR (%))
Figure 119 Asia-Pacific Cyber Security Market Share Forecast Deployment Mode, 2023 & 2033 (%)
Figure 120 Asia-Pacific Cyber Security Market by Component, 2023-2033 (US$ Bn, AGR (%))
Figure 121 Asia-Pacific Cyber Security Market Share Forecast by Component, 2023 & 2033 (%)
Figure 122 Asia-Pacific Cyber Security Market by Security Type, 2023-2033 (US$ Bn, AGR (%))
Figure 123 Asia-Pacific Cyber Security Market Share Forecast by Security Type, 2023 & 2033 (%)
Figure 124 Asia-Pacific Cyber Security Market by Vertical, 2023-2033 (US$ Bn, AGR (%))
Figure 125 Asia-Pacific Cyber Security Market Share Forecast by Vertical, 2023 & 2033 (%)
Figure 126 Asia-Pacific Cyber Security Market by Software, 2023-2033 (US$ Bn, AGR (%))
Figure 127 Asia-Pacific Cyber Security Market Share Forecast by Software, 2023 & 2033 (%)
Figure 128 China Cyber Security Market by Value, 2023-2033 (US$ Bn, AGR (%))
Figure 129 India Cyber Security Market by Value, 2023-2033 (US$ Bn, AGR (%))
Figure 130 Japan Cyber Security Market by Value, 2023-2033 (US$ Bn, AGR (%))
Figure 131 South Korea Cyber Security Market by Value, 2023-2033 (US$ Bn, AGR (%))
Figure 132 Australia Cyber Security Market by Value, 2023-2033 (US$ Bn, AGR (%))
Figure 133 Rest of Asia-Pacific Cyber Security Market by Value, 2023-2033 (US$ Bn, AGR (%))
Figure 134 Middle East and Africa Cyber Security Market Attractiveness Index
Figure 135 Middle East and Africa Cyber Security Market by Region, 2023, 2028 & 2033 (US$ Billion)
Figure 136 Middle East & Africa Cyber Security Market by Value, 2023-2033 (US$ Bn, AGR (%))
Figure 137 Middle East & Africa Cyber Security Market by Country, 2023-2033 (US$ Bn, AGR (%))
Figure 138 Middle East and Africa Cyber Security Market Share Forecast by Country, 2023 & 2033 (%)
Figure 139 Middle East & Africa Cyber Security Market by Deployment Mode, 2023-2033 (US$ Bn, AGR (%))
Figure 140 Middle East and Africa Cyber Security Market Share Forecast Deployment Mode, 2023 & 2033 (%)
Figure 141 Middle East & Africa Cyber Security Market by Component, 2023-2033 (US$ Bn, AGR (%))
Figure 142 Middle East and Africa Cyber Security Market Share Forecast by Component, 2023 & 2033 (%)
Figure 143 Middle East & Africa Cyber Security Market by Security Type, 2023-2033 (US$ Bn, AGR (%))
Figure 144 Middle East and Africa Cyber Security Market Share Forecast by Security Type, 2023 & 2033 (%)
Figure 145 Middle East & Africa Cyber Security Market by Vertical, 2023-2033 (US$ Bn, AGR (%))
Figure 146 Middle East and Africa Cyber Security Market Share Forecast by Vertical, 2023 & 2033 (%)
Figure 147 Middle East & Africa Cyber Security Market by Software, 2023-2033 (US$ Bn, AGR (%))
Figure 148 Middle East and Africa Cyber Security Market Share Forecast by Software, 2023 & 2033 (%)
Figure 149 GCC Cyber Security Market by Value, 2023-2033 (US$ Bn, AGR (%))
Figure 150 South Africa Cyber Security Market by Value, 2023-2033 (US$ Bn, AGR (%))
Figure 151 Rest of Middle East & Africa Cyber Security Market by Value, 2023-2033 (US$ Bn, AGR (%))
Figure 152 Latin America Cyber Security Market Attractiveness Index
Figure 153 Latin America Cyber Security Market by Region, 2023, 2028 & 2033 (US$ Billion)
Figure 154 Latin America Cyber Security Market by Value, 2023-2033 (US$ Bn, AGR (%))
Figure 155 Latin America Cyber Security Market by Country, 2023-2033 (US$ Bn, AGR (%))
Figure 156 Latin America Cyber Security Market Share Forecast by Country, 2023 & 2033 (%)
Figure 157 Latin America Cyber Security Market by Deployment Mode, 2023-2033 (US$ Bn, AGR (%))
Figure 158 Latin America Cyber Security Market Share Forecast Deployment Mode, 2023 & 2033 (%)
Figure 159 Latin America Cyber Security Market by Component, 2023-2033 (US$ Bn, AGR (%))
Figure 160 Latin America Cyber Security Market Share Forecast by Component, 2023 & 2033 (%)
Figure 161 Latin America Cyber Security Market by Security Type, 2023-2033 (US$ Bn, AGR (%))
Figure 162 Latin America Cyber Security Market Share Forecast by Security Type, 2023 & 2033 (%)
Figure 163 Latin America Cyber Security Market by Vertical, 2023-2033 (US$ Bn, AGR (%))
Figure 164 Latin America Cyber Security Market Share Forecast by Vertical, 2023 & 2033 (%)
Figure 165 Latin America Cyber Security Market by Software, 2023-2033 (US$ Bn, AGR (%))
Figure 166 Latin America Cyber Security Market Share Forecast by Software, 2023 & 2033 (%)
Figure 167 Brazil Cyber Security Market by Value, 2023-2033 (US$ Bn, AGR (%))
Figure 168 Mexico Cyber Security Market by Value, 2023-2033 (US$ Bn, AGR (%))
Figure 169 Rest of Latin America Cyber Security Market by Value, 2023-2033 (US$ Bn, AGR (%))
Figure 170 Cyber Security Market: Company Share, 2022
Figure 171 Microsoft Corporation.: Net Revenue2019-2023 (US$ Million, AGR%)
Figure 172 Microsoft Corporation.: R&D, 2019-2023 (US$ Million, AGR%)
Figure 173 Microsoft Corporation.: Regional Revenue Share, 2023 (%)
Figure 174 Microsoft Corporation.: Business Segment Revenue Share, 2023 (%)
Figure 175 Cisco Systems, Inc.: Net Revenue2019-2023 (US$ Million, AGR%)
Figure 176 Cisco Systems, Inc.: R&D, 2019-2023 (US$ Million, AGR%)
Figure 177 Cisco Systems, Inc.: Regional Revenue Share, 2023 (%)
Figure 178 Cisco Systems, Inc.: Business Segment Revenue Share, 2023 (%)
Figure 179 Palo Alto Networks, Inc.: Net Revenue, 2018-2022 (US$ Million, AGR%)
Figure 180 Palo Alto Networks, Inc.: R&D, 2018-2022 (US$ Million, AGR%)
Figure 181 Palo Alto Networks, Inc.: Regional Revenue Share, 2022 (%)
Figure 182 Palo Alto Networks, Inc.: Business Segment Revenue Share, 2022 (%)
Figure 183 Fortinet, Inc.: Net Revenue, 2018-2022 (US$ Million, AGR%)
Figure 184 Fortinet, Inc.: R&D, 2018-2022 (US$ Million, AGR%)
Figure 185 Fortinet, Inc.: Regional Revenue Share, 2022 (%)
Figure 186 Fortinet, Inc.: Business Segment Revenue Share, 2022 (%)
Figure 187 International Business Machines Corporation (IBM).: Net Revenue, 2018-2022 (US$ Million, AGR%)
Figure 188 International Business Machines Corporation (IBM).: R&D, 2018-2022 (US$ Million, AGR%)
Figure 189 International Business Machines Corporation (IBM).: Regional Revenue Share, 2022 (%)
Figure 190 International Business Machines Corporation (IBM).: Business Segment Revenue Share, 2022 (%)
Figure 191 Check Point Software Technologies Ltd.: Net Revenue, 2018-2022 (US$ Million, AGR%)
Figure 192 Check Point Software Technologies Ltd.: R&D, 2018-2022 (US$ Million, AGR%)
Figure 193 Check Point Software Technologies Ltd.: Regional Revenue Share, 2022 (%)
Figure 194 Trend Micro Inc.: Net Revenue, 2018-2022 (US$ Million, AGR%)
Figure 195 Trend Micro Inc.: R&D, 2018-2022 (US$ Million, AGR%)
Figure 196 Trend Micro Inc.: Regional Revenue Share, 2022 (%)
Figure 197 CrowdStrike Holdings, Inc.: Net Revenue ,2019-2023 (US$ Million, AGR%)
Figure 198 CrowdStrike Holdings, Inc.: R&D, 2019-2023 (US$ Million, AGR%)
Figure 199 CrowdStrike Holdings, Inc.: Business Segment Revenue Share, 2022 (%)
Figure 200 Qualys, Inc. Net Revenue, 2018-2022 (US$ Million, AGR%)
Figure 201 Qualys, Inc.: R&D, 2018-2022 (US$ Million, AGR%)
Figure 202 Qualys, Inc..: Regional Revenue Share, 2022 (%)
Figure 203 Gen Digital Inc.: Net Revenue ,2019-2023 (US$ Million, AGR%)
Figure 204 Gen Digital Inc.: R&D, 2019-2023 (US$ Million, AGR%)
Figure 205 Gen Digital Inc.: Regional Revenue Share, 2023 (%)
Figure 206 Gen Digital Inc.: Business Segment Revenue Share, 2023 (%)
Figure 207 Splunk Inc Net Revenue, 2019-2023 (US$ Million, AGR%)
Figure 208 Splunk Inc.: R&D, 2019-2023 (US$ Million, AGR%)
Figure 209 Splunk Inc.: Regional Revenue Share, 2023 (%)
ページTOPに戻る
Visiongain社のAI・サイバー分野での最新刊レポート
本レポートと同じKEY WORD(cyber security)の最新刊レポート
よくあるご質問
Visiongain社はどのような調査会社ですか?
英国の調査会社ヴィジョンゲイン社(Visiongain)は、通信とエネルギーのほか、自動車や化学・医薬品、金属など、広範な市場を対象に調査を行っています。自動車市場については、市場全般に関する調査のほ... もっと見る
調査レポートの納品までの日数はどの程度ですか?
在庫のあるものは速納となりますが、平均的には 3-4日と見て下さい。
但し、一部の調査レポートでは、発注を受けた段階で内容更新をして納品をする場合もあります。
発注をする前のお問合せをお願いします。
注文の手続きはどのようになっていますか?
1)お客様からの御問い合わせをいただきます。
2)見積書やサンプルの提示をいたします。
3)お客様指定、もしくは弊社の発注書をメール添付にて発送してください。
4)データリソース社からレポート発行元の調査会社へ納品手配します。
5) 調査会社からお客様へ納品されます。最近は、pdfにてのメール納品が大半です。
お支払方法の方法はどのようになっていますか?
納品と同時にデータリソース社よりお客様へ請求書(必要に応じて納品書も)を発送いたします。
お客様よりデータリソース社へ(通常は円払い)の御振り込みをお願いします。
請求書は、納品日の日付で発行しますので、翌月最終営業日までの当社指定口座への振込みをお願いします。振込み手数料は御社負担にてお願いします。
お客様の御支払い条件が60日以上の場合は御相談ください。
尚、初めてのお取引先や個人の場合、前払いをお願いすることもあります。ご了承のほど、お願いします。
データリソース社はどのような会社ですか?
当社は、世界各国の主要調査会社・レポート出版社と提携し、世界各国の市場調査レポートや技術動向レポートなどを日本国内の企業・公官庁及び教育研究機関に提供しております。
世界各国の「市場・技術・法規制などの」実情を調査・収集される時には、データリソース社にご相談ください。
お客様の御要望にあったデータや情報を抽出する為のレポート紹介や調査のアドバイスも致します。
|
|

