マネージドセキュリティサービス市場レポート:2023-2033
Managed Security Services Market Report 2023-2033
レポート詳細
マネージドセキュリティサービス市場レポート 2023-2033 : 本レポートは、業界とその基礎となる力学をよりよく理解したい場合、新たな収益ポケットを目指す大手企業にとって貴重なもの... もっと見る
※上記価格は部署ライセンス(Departmental licence)価格です。
その他の価格についてはデータリソースまでお問合せください。
日本語のページは自動翻訳を利用し作成しています。
実際のレポートは英文のみでご納品いたします。

|

|
サマリー
レポート詳細
マネージドセキュリティサービス市場レポート 2023-2033: 本レポートは、業界とその基礎となる力学をよりよく理解したい場合、新たな収益ポケットを目指す大手企業にとって貴重なものとなります。また、異業種への進出や新地域での既存事業の拡大を目指す企業にとっても有益なレポートです。
サイバーセキュリティの脅威状況の増加
サイバーセキュリティの脅威の容赦ない増大により、組織はセキュリティ対策を強化しなければならないという危機感を抱いています。高度なマルウェアやランサムウェアなどのサイバー脅威の出現は、企業に大きなリスクをもたらしています。例えば、2017年に発生したWannaCryランサムウェア攻撃は、世界中の数千の組織に影響を与え、堅牢なセキュリティソリューションの必要性を浮き彫りにしました。マネージドセキュリティサービスは、進化するサイバー脅威から組織を保護するために、高度な脅威インテリジェンス、監視、対応能力を提供します。
コンプライアンスと法規制の要件
組織は、業界特有の規制やデータ保護法に準拠する必要があります。PCI DSS(Payment Card Industry Data Security Standard)やHIPAA(Health Insurance Portability and Accountability Act)などのコンプライアンス基準は、強固なセキュリティ対策を要求します。マネージド・セキュリティ・サービスは、セキュリティ対策の実施と維持、定期的な監査の実施、規制要件の遵守を徹底するための専門知識を提供し、組織のコンプライアンス達成を支援します。
マーケットリサーチレポートを購入する前に、どのような質問をするべきか?
- マネージドセキュリティサービス市場はどのように進化しているのか?
- マネージドセキュリティサービス市場を牽引し、抑制しているものは何か?
- マネージドセキュリティサービスの各サブマーケットセグメントは予測期間中にどのように成長し、これらのサブマーケットが2033年に占める売上はどの程度になるのか?
- 2023年から2033年にかけて、マネージドセキュリティサービスの各サブマーケットの市場シェアはどのように推移するのか?
- 2023年から2033年にかけて、市場全体の主な牽引役となるのは何か?
- 主要なマネージドセキュリティサービス市場はマクロ経済ダイナミクスに広く追随するのか、それとも個々の国内市場が他を凌駕するのか?
- 2033年までに各国市場のシェアはどのように変化し、2033年に市場をリードするのはどの地域か?
- 主要プレイヤーは誰で、予測期間中の見通しは?
- これらの主要企業のマネージドセキュリティサービスプロジェクトはどのようなものか?
- 2023年から2033年の間に、業界はどのように進化していくのか?現在および今後10年間に行われるマネージドセキュリティサービスのプロジェクトには、どのような意味があるのか?
- マネージドセキュリティサービス市場をさらに拡大するために、製品の商業化の必要性は高まっているのでしょうか?
- マネージドセキュリティサービス市場の方向性と、市場の最前線に立つための方法とは?
- 新製品やサービスラインに対する最適な投資オプションは何か?
- 企業を新たな成長軌道に乗せ、C-suiteに移行させるための重要な展望は何か?
このことが、現在、そして今後10年間のマネージドセキュリティサービス市場にどのような影響を与えるかを見極める必要があります:
- 442ページにわたる本レポートでは、131の表と193のチャート/グラフを独占的に提供します。
- 本レポートでは、業界における主要な収益性の高い分野を取り上げているため、今すぐその分野をターゲットにすることができます。
- 世界、地域、国の売上と成長を詳細に分析しています。
- 競合他社が成功した主要なトレンド、変化、収益予測をハイライトしています。
本レポートは、マネージドセキュリティサービス市場が今後10年間にどのように発展するか、またCOVID-19の景気後退や景気回復の変動に合わせて、今日あなたにお伝えします。この市場は、過去10年間のどの時点よりも今が重要である。
2033年までの予測やその他の分析により、商業的な展望を明らかにする。
- 今回の調査では、2033年までの収益予測に加え、直近の実績、成長率、市場シェアも掲載しています。
- ビジネスの展望や展開など、独自の分析がご覧いただけます。
- 定性的分析(市場力学、促進要因、機会、阻害要因、課題を含む)、コスト構造、マネージドセキュリティサービス価格上昇の影響、最近の動向をご覧いただけます。
本レポートでは、COVID-19が業界や貴社にどのような影響を与えるかについて、データ分析および貴重な知見を提供しています。COVID-19の4つの回収パターン、すなわち「V」「L」「W」「U」の回収パターンとその影響について考察しています。
報告書の対象セグメント
タイプ別市場セグメント
- 完全管理型セキュリティサービス
- 共同管理型セキュリティサービス
企業規模別市場セグメント
- 大企業
- 中堅企業
- 中小企業
ソリューションタイプ別市場セグメント
- 侵入検知・防御
- 脅威防御
- 分散型サービス拒否
- その他のソリューションタイプ
産業別市場セグメント
- BFSI
- ヘルスケア
- 製造業
- 通信・IT
- その他の業種
サービスタイプ別市場セグメント
- マネージドIAM
- マネージド脆弱性管理
- マネージドリスク&コンプライアンス
- 検知と対応のマネージド
- マネージドSIEMとログ管理
- その他のサービスタイプ
世界市場全体およびセグメントの収益予測に加え、4地域および主要20カ国市場の収益予測も掲載しています:
北米
- アメリカ
- カナダ
欧州
- ドイツ
- ロシア
- イギリス
- フランス
- イタリア
- その他の欧州
アジア太平洋地域
- 中国
- 日本
- インド
- オーストラリア
- 韓国
- その他のアジア太平洋地域
ラテンアメリカ
- ブラジル
- メキシコ
- その他のラテンアメリカ地域
中近東・アフリカ
- GCC
- 南アフリカ
- その他の中近東・アフリカ
レポートには、マネージドセキュリティサービス市場の2023年から2033年にかけての主要企業のプロファイルと、これらの企業のこのセグメントに焦点を当てたいくつかの企業も含まれています。
主要企業と市場成長の可能性
・ Accenture plc
・ AT&T Inc.
・ Capgemini SE
・ CrowdStrike Holdings, Inc.
・ DXC Technology
・ F5, Inc
・ Fujitsu Limited
・ International Business Machines Corporation
・ Kroll Inc.
・ Kudelski Security
・ Nippon Telegraph and Telephone Corporation
・ Orange Cyberdefense
・ Proficio
・ Secureworks Inc.
・ Trustwave Holdings
マネージドセキュリティサービス市場の世界全体の収益、2023年から2033年までの金額ベースで、市場は2023年に304億米ドルを突破すると当研究所が算出した。2033年まで収益が大きく成長すると予測しています。当社の調査では、最も大きな可能性を秘めた企業を特定しています。彼らの能力、進歩、商業的展望を発見することで、一歩先を行くことができるようになります。
マネージドセキュリティサービス市場、2023年から2033年までのレポートはどのように役立つのでしょうか?
要約すると、440ページ以上のレポートでは、以下のような知識を得ることができます:
- マネージドセキュリティサービス市場の2023年から2033年までの収益予測 企業規模、ソリューションタイプ、業種、サービスタイプ、タイプ、企業規模の各予測を世界および地域レベルで掲載 - 業界の展望を発見し、投資や収益に最も有利な場所を見つけることができます。
- 4つの地域と20の主要国市場の2033年までの収益予測 - マネージドセキュリティサービス市場、2023年から2033年の北米、ヨーロッパ、アジア太平洋、ラテンアメリカ、中東&アフリカの市場予測をご覧いただけます。また、米国、カナダ、ブラジル、ドイツ、フランス、英国、イタリア、中国、インド、日本、オーストラリアなど、著名な経済圏の市場も予測されています。
- マネージドセキュリティサービス市場に関わる主要企業15社の企業プロファイルを含む、2023年から2033年までの既存企業および市場参入を目指す企業の展望。
独自の予測による定量・定性分析をご覧いただけます。私たちのレポートだけが持つ情報を入手し、貴重なビジネスインテリジェンスとして情報を得ることができます。
他にはない情報
私たちの新しいレポートがあれば、知識に遅れをとったり、チャンスを逃したりする可能性は低くなります。私たちの仕事があなたの調査、分析、意思決定にどのように役立つかをご覧ください。Visiongainの研究は、マネージドセキュリティサービス市場、2023年から2033年、市場をリードする企業のための商業分析を必要とするすべての人のためのものです。データ、トレンド、予測を見つけることができます。
ページTOPに戻る
目次
目次
1 レポートの概要
1.1 調査の目的
1.2 マネージドセキュリティサービス市場の紹介
1.3 本レポートが提供するもの
1.4 本レポートを読むべき理由
1.5 本分析レポートが回答する主な質問事項
1.6 本レポートは誰のためのものか?
1.7 調査方法
1.7.1 市場の定義
1.7.2 市場評価・予測手法
1.7.3 データ検証
1.7.3.1 プライマリーリサーチ
1.7.3.2 セカンダリーリサーチ
1.8 よくある質問(FAQ)
1.9 関連するVisiongainのレポート
1.10 Visiongainについて
2 エグゼクティブサマリー
3 市場の概要
3.1 主要な調査結果
3.2 マーケットダイナミクス
3.2.1 市場の推進要因
3.2.1.1 マネージドセキュリティサービス市場は、サイバー脅威の複雑化と頻度の増加が原動力になっている
3.2.1.2 セキュリティ規制や業界標準への準拠がマネージドセキュリティサービス採用の重要な推進要因となっている
3.2.1.3 熟練したサイバーセキュリティ専門家の不足がマネージドセキュリティサービス市場の重要な促進要因となっている
3.2.1.4 サイバー脅威はいつでも発生する可能性があり、組織には24時間体制のセキュリティ監視とインシデントレスポンス能力が必要
3.2.2 市場の抑制要因
3.2.2.1 マネージドセキュリティサービスを検討する組織の主な抑制要因の一つは関連するコストである
3.2.2.2 マネージドセキュリティサービスの採用は、組織のセキュリティ運用の重要な側面を扱うサードパーティーのサービスプロバイダーに依存することにつながる
3.2.2.3 マネージドセキュリティサービスを導入する場合、既存のセキュリティインフラストラクチャやツールを使用している組織では、統合や互換性の問題に直面することがある。
3.2.2.4 マネージドセキュリティサービスプロバイダーにセキュリティ運用を委託する場合、組織はセキュリティ環境のコントロールと可視性の喪失を認識する可能性がある。
3.2.3 市場の可能性
3.2.3.1 サイバー犯罪者がより高度な技術を用いるようになり、組織はリスクを効果的に軽減するために専門的な知識と高度なセキュリティ・ソリューションを求めている
3.2.3.2 クラウドコンピューティングの急速な普及は、マネージドセキュリティサービスプロバイダーにとって大きなビジネスチャンスとなる
3.2.3.3 コネクテッドデバイスとモノのインターネット(Iot)の普及が、マネージドセキュリティサービスプロバイダーの新たなビジネスチャンスを開く
3.2.3.4 マネージド・ディテクション&レスポンス(MDR)サービスに対する需要の高まりが、MSSPに大きなチャンスをもたらす
3.3 COVID-19の影響度分析
3.4 V字回復シナリオ
3.4.1 W字型回復シナリオ
3.4.2 U字型回復シナリオ
3.4.3 L字型回復シナリオ
3.5 ポーターのファイブフォース分析
3.5.1 新規参入の脅威
3.5.2 買い手のバーゲニングパワー
3.5.3 供給者のバーゲニングパワー
3.5.4 代替品の脅威
3.5.5 競争相手のライバルの強さ
3.6 ペストル分析
3.6.1 政治的要因
3.6.2 経済的要因
3.6.3 社会的要因
3.6.4 技術的要因
3.6.5 環境要因
3.6.6 法的要因
3.7 SWOT分析
3.7.1 強み
3.7.2 弱さ
3.7.3 機会
3.7.4 脅威
3.8 2023年のMSSPサービスのトレンド
3.8.1 クラウド型セキュリティサービス
3.8.2 メール認証サービス
3.8.3 DevSecOps
3.8.4 ゼロトラストセキュリティ
3.8.5 ブロックチェーンセキュリティ
4 マネージドセキュリティサービス市場分析:タイプ別
4.1 主要な調査結果
4.2 タイプ別セグメント市場魅力度指数
4.2.1 マネージドセキュリティサービス市場:タイプ別
4.3 フルマネージドセキュリティサービス
4.3.1 地域別市場、2023年~2033年(US$Bn)
4.3.2 2023年・2033年地域別市場シェア(%)
4.4 コ・マネージド・セキュリティ・サービス
4.4.1 地域別市場、2023年~2033年(US$Bn)
4.4.2 2023年・2033年地域別市場シェア(%)
5 マネージドセキュリティサービス市場分析:企業規模別
5.1 主要な調査結果
5.2 企業規模別セグメント: 市場魅力度指数
5.2.1 マネージドセキュリティサービス市場:企業規模別
5.3 大企業
5.3.1 地域別市場、2023年~2033年(US$Bn)
5.3.2 2023年・2033年地域別市場シェア(%)
5.4 中堅企業
5.4.1 地域別市場、2023年~2033年(US$Bn)
5.4.2 2023年・2033年地域別市場シェア(%)
5.5 中小企業
5.5.1 地域別市場、2023年~2033年(US$Bn)
5.5.2 2023年・2033年地域別市場シェア(%)
6 マネージドセキュリティサービス市場分析:ソリューションタイプ別
6.1 主要な調査結果
6.2 ソリューションタイプのセグメント 市場魅力度指数
6.2.1 マネージドセキュリティサービス市場:ソリューションタイプ別
6.3 侵入検知と防止
6.3.1 地域別市場、2023年~2033年(US$Bn)
6.3.2 2023年・2033年地域別市場シェア(%)
6.4 脅威防御
6.4.1 地域別市場、2023年~2033年(US$Bn)
6.4.2 2023年・2033年地域別市場シェア(%)
6.5 分散型サービス拒否(DDoS)
6.5.1 地域別市場、2023年~2033年(US$Bn)
6.5.2 2023年・2033年地域別市場シェア(%)
6.6 その他のソリューションタイプ
6.6.1 地域別市場、2023年~2033年(US$Bn)
6.6.2 2023年・2033年地域別市場シェア(%)
7 マネージドセキュリティサービス市場分析:産業別
7.1 主要な調査結果
7.2 バーティカルセグメント 市場魅力度指数
7.2.1 マネージドセキュリティサービス市場:産業別
7.3 BFSI
7.3.1 地域別市場、2023年~2033年(US$Bn)
7.3.2 2023年・2033年地域別市場シェア(%)
7.4 ヘルスケア
7.4.1 地域別市場、2023年~2033年(US$Bn)
7.4.2 2023年・2033年地域別市場シェア(%)
7.5 製造業
7.5.1 地域別市場、2023年~2033年(US$Bn)
7.5.2 2023年・2033年地域別市場シェア(%)
7.6 テレコム&IT
7.6.1 地域別市場、2023年~2033年(US$Bn)
7.6.2 2023年・2033年地域別市場シェア(%)
7.7 その他バーティカル
7.7.1 地域別市場、2023年~2033年(US$Bn)
7.7.2 2023年・2033年地域別市場シェア(%)
8 マネージドセキュリティサービス市場分析:サービスタイプ別
8.1 主要な調査結果
8.2 サービスタイプ別セグメント 市場魅力度指数
8.2.1 マネージドセキュリティサービス市場:サービスタイプ別
8.3 マネージドIAM
8.3.1 地域別市場、2023年~2033年(US$Bn)
8.3.2 2023年・2033年地域別市場シェア(%)
8.4 マネージド脆弱性管理
8.4.1 地域別市場、2023年~2033年(US$Bn)
8.4.2 2023年・2033年地域別市場シェア(%)
8.5 マネージドリスク&コンプライアンス
8.5.1 地域別市場、2023年~2033年(US$Bn)
8.5.2 2023年・2033年地域別市場シェア(%)
8.6 検知と対応のマネージド
8.6.1 地域別市場、2023年~2033年(US$Bn)
8.6.2 2023年・2033年地域別市場シェア(%)
8.7 マネージドSIEMとログ管理
8.7.1 地域別市場、2023年~2033年(US$Bn)
8.7.2 2023年・2033年地域別市場シェア(%)
8.8 その他のサービスタイプ
8.8.1 地域別市場、2023年~2033年(US$Bn)
8.8.2 2023年・2033年地域別市場シェア(%)
9 マネージドセキュリティサービス市場分析:地域別
9.1 主要な調査結果
9.2 マネージドセキュリティサービス市場:地域別
10 北米のマネージドセキュリティサービス市場分析
10.1 主要な調査結果
10.2 北米のマネージドセキュリティサービス市場魅力度指数
10.3 北米のマネージドセキュリティサービス市場:国別、2023年、2028年、2033年(US$ Billion)
10.4 北米のマネージドセキュリティサービス市場:金額ベース
10.5 北米のマネージドセキュリティサービス市場:国別
10.6 北米のマネージドセキュリティサービス市場:タイプ別
10.7 北米のマネージドセキュリティサービス市場:企業規模別
10.8 北米のマネージドセキュリティサービス市場:ソリューションタイプ別
10.9 北米のマネージドセキュリティサービス市場:産業別
10.10 北米のマネージドセキュリティサービス市場:サービスタイプ別
10.11 米国のマネージドセキュリティサービス市場分析
10.12 カナダのマネージドセキュリティサービス市場の分析
11 欧州のマネージドセキュリティサービス市場分析
11.1 主要な調査結果
11.2 欧州のマネージドセキュリティサービス市場魅力度指数
11.3 欧州のマネージドセキュリティサービス市場:国別、2023年、2028年、2033年(US$Billion)
11.4 欧州のマネージドセキュリティサービス市場:金額ベース
11.5 欧州のマネージドセキュリティサービス市場:国別
11.6 欧州のマネージドセキュリティサービス市場:タイプ別
11.7 欧州のマネージドセキュリティサービス市場:企業規模別
11.8 欧州のマネージドセキュリティサービス市場:ソリューションタイプ別
11.9 欧州のマネージドセキュリティサービス市場:産業別
11.10 欧州のマネージドセキュリティサービス市場:サービスタイプ別
11.11 ドイツのマネージドセキュリティサービス市場分析
11.12 イギリスのマネージドセキュリティサービス市場の分析
11.13 フランスのマネージドセキュリティサービス市場の分析
11.14 イタリアのマネージドセキュリティサービスの市場分析
11.15 ロシアのマネージドセキュリティサービス市場の分析
11.16 その他の欧州のマネージドセキュリティサービスの市場分析
12 アジア太平洋地域のマネージドセキュリティサービス市場分析
12.1 主要な調査結果
12.2 アジア太平洋地域のマネージドセキュリティサービス市場魅力度指数
12.3 アジア太平洋地域のマネージドセキュリティサービス市場:国別推移、2023年、2028年、2033年(US$Billion)
12.4 アジア太平洋地域のマネージドセキュリティサービス市場:金額ベース
12.5 アジア太平洋地域のマネージドセキュリティサービス市場:国別
12.6 アジア太平洋地域のマネージドセキュリティサービス市場:タイプ別
12.7 アジア太平洋地域のマネージドセキュリティサービス市場:企業規模別
12.8 アジア太平洋地域のマネージドセキュリティサービス市場:ソリューションタイプ別
12.9 アジア太平洋地域のマネージドセキュリティサービス市場:産業別
12.10 アジア太平洋地域のマネージドセキュリティサービス市場:サービスタイプ別
12.11 中国 マネージドセキュリティサービスの市場分析
12.12 インドのマネージドセキュリティサービス市場の分析
12.13 日本マネージドセキュリティサービス市場の分析
12.14 韓国マネージドセキュリティサービス市場の分析
12.15 オーストラリアのマネージドセキュリティサービス市場の分析
12.16 その他のアジア太平洋地域のマネージドセキュリティサービスの市場分析
13 中東・アフリカのマネージドセキュリティサービス市場分析
13.1 主要な調査結果
13.2 中東・アフリカのマネージドセキュリティサービス市場魅力度指数
13.3 中東・アフリカのマネージドセキュリティサービス市場:国別、2023年、2028年、2033年(US$Billion)
13.4 中東・アフリカのマネージドセキュリティサービス市場:金額ベース
13.5 中東・アフリカのマネージドセキュリティサービス市場:国別
13.6 中東・アフリカのマネージドセキュリティサービス市場:タイプ別
13.7 中東・アフリカのマネージドセキュリティサービス市場:企業規模別
13.8 中東・アフリカのマネージドセキュリティサービス市場:ソリューションタイプ別
13.9 中東・アフリカのマネージドセキュリティサービス市場:産業別
13.10 中東・アフリカ マネージドセキュリティサービス市場:サービスタイプ別
13.11 GCCのマネージドセキュリティサービス市場分析
13.12 南アフリカのマネージドセキュリティサービス市場の分析
13.13 その他のMEAマネージドセキュリティサービスの市場分析
14 ラテンアメリカのマネージドセキュリティサービス市場分析
14.1 主要な調査結果
14.2 ラテンアメリカのマネージドセキュリティサービス市場魅力度指数
14.3 ラテンアメリカのマネージドセキュリティサービス市場:国別、2023年、2028年、2033年(US$Billion)
14.4 ラテンアメリカのマネージドセキュリティサービス市場:金額ベース
14.5 ラテンアメリカのマネージドセキュリティサービス市場:国別
14.6 ラテンアメリカのマネージドセキュリティサービス市場:タイプ別
14.7 ラテンアメリカのマネージドセキュリティサービス市場:企業規模別
14.8 ラテンアメリカのマネージドセキュリティサービス市場:ソリューションタイプ別
14.9 ラテンアメリカのマネージドセキュリティサービス市場:産業別
14.10 ラテンアメリカのマネージドセキュリティサービス市場:サービスタイプ別
14.11 ブラジルのマネージドセキュリティサービス市場分析
14.12 メキシコのマネージドセキュリティサービス市場の分析
14.13 その他のラテンアメリカ地域のマネージドセキュリティサービス市場の分析
15 会社概要
15.1 競争環境、2022年
15.2 戦略的な展望
15.2.1 買収
15.2.2 契約
15.2.3 コラボレーション
15.2.4 エクスパンション
15.2.5 新製品発売
15.2.6 パートナーシップ
15.3 International Business Machines Corporation
15.3.1 企業スナップショット
15.3.2 会社概要
15.3.3 財務分析
15.3.3.1 純収益、2018年~2022年
15.3.3.2 R&D、2018年~2022年
15.3.3.3 地域別収入シェア、2022年(%)
15.3.3.4 事業セグメント別売上高シェア、2022年(%)
15.3.4 製品のベンチマーキング
15.3.5 戦略的な展望
15.4 AT&T Inc.
15.4.1 企業スナップショット
15.4.2 会社概要
15.4.3 財務分析
15.4.3.1 純収益、2018年~2022年
15.4.3.2 地域別収入シェア、2022年(%)
15.4.3.3 事業セグメント別収益シェア、2022年(%)
15.4.4 製品のベンチマーキング
15.4.5 戦略的な展望
15.5 Nippon Telegraph and Telephone Corporation
15.5.1 企業スナップショット
15.5.2 会社概要
15.5.3 財務分析
15.5.3.1 純収益、2018年~2022年
15.5.3.2 R&D、2018年~2022年
15.5.3.3 事業セグメントの売上高シェア、2022年(%)
15.5.4 製品のベンチマーキング
15.5.5 戦略的な展望
15.6 Accenture plc
15.6.1 企業スナップショット
15.6.2 会社概要
15.6.3 財務分析
15.6.3.1 純収益、2018年〜2022年
15.6.3.2 R&D、2018年〜2022年
15.6.3.3 地域別売上高シェア、2022年(%)
15.6.4 製品ベンチマーキング
15.6.5 戦略的な展望
15.7 DXC Technology
15.7.1 企業スナップショット
15.7.2 会社概要
15.7.3 財務分析
15.7.3.1 純収益、2018年〜2022年
15.7.3.2 地域別収益シェア、2022年(%)
15.7.3.3 事業セグメント別収益シェア、2022年(%)
15.7.4 製品のベンチマーキング
15.7.5 戦略的な展望
15.8 Secureworks Inc.
15.8.1 企業スナップショット
15.8.2 会社概要
15.8.3 財務分析
15.8.3.1 純収益、2018年〜2022年
15.8.3.2 R&D、2018年〜2022年
15.8.3.3 事業セグメントの売上高シェア、2022年(%)
15.8.4 製品のベンチマーキング
15.8.5 戦略的な展望
15.9 Trustwave Holdings
15.9.1 企業スナップショット
15.9.2 会社概要
15.9.3 製品ベンチマーク
15.9.4 戦略的な展望
15.10 Orange Cyberdefense
15.10.1 企業スナップショット
15.10.2 会社概要
15.10.3 製品ベンチマーク
15.10.4 戦略的な展望
15.11 Fujitsu Limited
15.11.1 企業スナップショット
15.11.2 会社概要
15.11.3 財務分析
15.11.3.1 純収益、2018年~2022年
15.11.3.2 R&D、2018年~2022年
15.11.3.3 地域別収入シェア、2022年(%)
15.11.3.4 事業セグメント別売上高シェア、2022年(%)
15.11.4 製品のベンチマーキング
15.11.5 戦略的な展望
15.12 Kudelski Security
15.12.1 企業スナップショット
15.12.2 会社概要
15.12.3 製品ベンチマーク
15.12.4 戦略的な展望
15.13 Proficio
15.13.1 企業スナップショット
15.13.2 会社概要
15.13.3 製品ベンチマーク
15.13.4 戦略的な展望
15.14 CrowdStrike Holdings, Inc
15.14.1 企業スナップショット
15.14.2 会社概要
15.14.3 財務分析
15.14.3.1 純収益、2018年~2022年
15.14.3.2 R&D、2018年~2022年
15.14.3.3 事業セグメントの売上高シェア、2022年(%)
15.14.4 製品のベンチマーキング
15.14.5 戦略的な展望
15.15 F5, Inc.
15.15.1 企業スナップショット
15.15.2 会社概要
15.15.3 財務分析
15.15.3.1 純収益、2018年〜2022年
15.15.3.2 R&D、2018年~2022年
15.15.3.3 地域別売上高シェア、2022年(%)
15.15.4 製品のベンチマーキング
15.15.5 戦略的な展望
15.16 Capgemini SE
15.16.1 企業スナップショット
15.16.2 会社概要
15.16.3 財務分析
15.16.3.1 純収益、2018年〜2022年
15.16.3.2 地域別収益シェア、2022年(%)
15.16.3.3 事業セグメント別収益シェア、2022年(%)
15.16.4 製品のベンチマーキング
15.16.5 戦略的な展望
15.17 Kroll Inc.
15.17.1 企業スナップショット
15.17.2 会社概要
15.17.3 製品ベンチマーク
15.17.4 戦略的な展望
16 結論と提言
16.1 Visiongainからの結びの言葉
16.2 市場関係者への提言
ページTOPに戻る
図表リスト
表の一覧
Table 1 Managed Security Services Market Snapshot, 2023 & 2033 (US$Billion, CAGR %)
Table 2 Managed Security Services Market by Region, 2023-2033 (US$Bn, AGR (%), CAGR (%)) (V-Shaped Recovery Scenario)
Table 3 Managed Security Services Market by Region, 2023-2033 (US$Bn, AGR (%), CAGR (%)) (W-Shaped Recovery Scenario)
Table 4 Managed Security Services Market by Region, 2023-2033 (US$Bn, AGR (%), CAGR (%)) (U-Shaped Recovery Scenario)
Table 5 Managed Security Services Market by Region, 2023-2033 (US$Bn, AGR (%), CAGR (%)) (L-Shaped Recovery Scenario)
Table 6 Managed Security Services Market by Type, 2023-2033 (US$Bn, AGR (%), CAGR (%))
Table 7 Fully Managed Security Services Market by Region, 2023-2033 (US$Bn, AGR (%), CAGR (%))
Table 8 Co-managed Security Services Market by Region, 2023-2033 (US$Bn, AGR (%), CAGR (%))
Table 9 Managed Security Services Market by Enterprises Size, 2023-2033 (US$Bn, AGR (%), CAGR (%))
Table 10 Large Enterprises Market by Region, 2023-2033 (US$Bn, AGR (%), CAGR (%))
Table 11 Medium-sized Enterprises Market by Region, 2023-2033 (US$Bn, AGR (%), CAGR (%))
Table 12 Small-sized Enterprises Market by Region, 2023-2033 (US$Bn, AGR (%), CAGR (%))
Table 13 Managed Security Services Market by Solution Type, 2023-2033 (US$Bn, AGR (%), CAGR (%))
Table 14 Intrusion Detection and Prevention Market by Region, 2023-2033 (US$Bn, AGR (%), CAGR (%))
Table 15 Threat Prevention Market by Region, 2023-2033 (US$Bn, AGR (%), CAGR (%))
Table 16 Distributed Denial of Services Market by Region, 2023-2033 (US$Bn, AGR (%), CAGR (%))
Table 17 Other Solution Type Market by Region, 2023-2033 (US$Bn, AGR (%), CAGR (%))
Table 18 Managed Security Services Market by Vertical, 2023-2033 (US$Bn, AGR (%), CAGR (%))
Table 19 BFSI Market by Region, 2023-2033 (US$Bn, AGR (%), CAGR (%))
Table 20 Healthcare Market by Region, 2023-2033 (US$Bn, AGR (%), CAGR (%))
Table 21 Manufacturing Market by Region, 2023-2033 (US$Bn, AGR (%), CAGR (%))
Table 22 Telecom & IT Market by Region, 2023-2033 (US$Bn, AGR (%), CAGR (%))
Table 23 Other Vertical Market by Region, 2023-2033 (US$Bn, AGR (%), CAGR (%))
Table 24 Managed Security Services Market by Service Type, 2023-2033 (US$Bn, AGR (%), CAGR (%))
Table 25 Managed IAM Market by Region, 2023-2033 (US$Bn, AGR (%), CAGR (%))
Table 26 Managed Vulnerability Management Market by Region, 2023-2033 (US$Bn, AGR (%), CAGR (%))
Table 27 Managed Risk and Compliance Market by Region, 2023-2033 (US$Bn, AGR (%), CAGR (%))
Table 28 Managed Detection and Response Market by Region, 2023-2033 (US$Bn, AGR (%), CAGR (%))
Table 29 Managed SIEM and Log Management Market by Region, 2023-2033 (US$Bn, AGR (%), CAGR (%))
Table 30 Other Service Type Market by Region, 2023-2033 (US$Bn, AGR (%), CAGR (%))
Table 31 Managed Security Services Market by Region, 2023-2033 (US$Bn, AGR (%), CAGR (%))
Table 32 North America Managed Security Services Market by Value, 2023-2033 (US$Bn, AGR (%), CAGR (%))
Table 33 North America Managed Security Services Market by Country, 2023-2033 (US$Bn, AGR (%), CAGR (%))
Table 34 North America Managed Security Services Market by Type, 2023-2033 (US$Bn, AGR (%), CAGR (%))
Table 35 North America Managed Security Services Market by Enterprises Size, 2023-2033 (US$Bn, AGR (%), CAGR (%))
Table 36 North America Managed Security Services Market by Solution Type, 2023-2033 (US$Bn, AGR (%), CAGR (%))
Table 37 North America Managed Security Services Market by Vertical, 2023-2033 (US$Bn, AGR (%), CAGR (%))
Table 38 North America Managed Security Services Market by Service Type, 2023-2033 (US$Bn, AGR (%), CAGR (%))
Table 39 US Managed Security Services Market by Value, 2023-2033 (US$Bn, AGR (%), CAGR (%))
Table 40 Canada Managed Security Services Market by Value, 2023-2033 (US$Bn, AGR (%), CAGR (%))
Table 41 Europe Managed Security Services Market by Value, 2023-2033 (US$Bn, AGR (%), CAGR (%))
Table 42 Europe Managed Security Services Market by Country, 2023-2033 (US$Bn, AGR (%), CAGR (%))
Table 43 Europe Managed Security Services Market by Type, 2023-2033 (US$Bn, AGR (%), CAGR (%))
Table 44 Europe Managed Security Services Market by Enterprises Size, 2023-2033 (US$Bn, AGR (%), CAGR (%))
Table 45 Europe Managed Security Services Market by Solution Type, 2023-2033 (US$Bn, AGR (%), CAGR (%))
Table 46 Europe Managed Security Services Market by Vertical, 2023-2033 (US$Bn, AGR (%), CAGR (%))
Table 47 Europe Managed Security Services Market by Service Type, 2023-2033 (US$Bn, AGR (%), CAGR (%))
Table 48 Germany Managed Security Services Market by Value, 2023-2033 (US$Bn, AGR (%), CAGR (%))
Table 49 UK Managed Security Services Market by Value, 2023-2033 (US$Bn, AGR (%), CAGR (%))
Table 50 France Managed Security Services Market by Value, 2023-2033 (US$Bn, AGR (%), CAGR (%))
Table 51 Italy Managed Security Services Market by Value, 2023-2033 (US$Bn, AGR (%), CAGR (%))
Table 52 Russia Managed Security Services Market by Value, 2023-2033 (US$Bn, AGR (%), CAGR (%))
Table 53 Rest of Europe Managed Security Services Market by Value, 2023-2033 (US$Bn, AGR (%), CAGR (%))
Table 54 Asia-Pacific Managed Security Services Market by Value, 2023-2033 (US$Bn, AGR (%), CAGR (%))
Table 55 Asia-Pacific Managed Security Services Market by Country, 2023-2033 (US$Bn, AGR (%), CAGR (%))
Table 56 Asia-Pacific Managed Security Services Market by Type, 2023-2033 (US$Bn, AGR (%), CAGR (%))
Table 57 Asia-Pacific Managed Security Services Market by Enterprises Size, 2023-2033 (US$Bn, AGR (%), CAGR (%))
Table 58 Asia-Pacific Managed Security Services Market by Solution Type, 2023-2033 (US$Bn, AGR (%), CAGR (%))
Table 59 Asia-Pacific Managed Security Services Market by Vertical, 2023-2033 (US$Bn, AGR (%), CAGR (%))
Table 60 Asia-Pacific Managed Security Services Market by Service Type, 2023-2033 (US$Bn, AGR (%), CAGR (%))
Table 61 China Managed Security Services Market by Value, 2023-2033 (US$Bn, AGR (%), CAGR (%))
Table 62 India Managed Security Services Market by Value, 2023-2033 (US$Bn, AGR (%), CAGR (%))
Table 63 Japan Managed Security Services Market by Value, 2023-2033 (US$Bn, AGR (%), CAGR (%))
Table 64 South Korea Managed Security Services Market by Value, 2023-2033 (US$Bn, AGR (%), CAGR (%))
Table 65 Australia Managed Security Services Market by Value, 2023-2033 (US$Bn, AGR (%), CAGR (%))
Table 66 Rest of Asia-Pacific Managed Security Services Market by Value, 2023-2033 (US$Bn, AGR (%), CAGR (%))
Table 67 Middle East & Africa Managed Security Services Market by Value, 2023-2033 (US$Bn, AGR (%), CAGR (%))
Table 68 Middle East & Africa Managed Security Services Market by Country, 2023-2033 (US$Bn, AGR (%), CAGR (%))
Table 69 Middle East & Africa Managed Security Services Market by Type, 2023-2033 (US$Bn, AGR (%), CAGR (%))
Table 70 Middle East & Africa Managed Security Services Market by Enterprises Size, 2023-2033 (US$Bn, AGR (%), CAGR (%))
Table 71 Middle East & Africa Managed Security Services Market by Solution Type, 2023-2033 (US$Bn, AGR (%), CAGR (%))
Table 72 Middle East & Africa Managed Security Services Market by Vertical, 2023-2033 (US$Bn, AGR (%), CAGR (%))
Table 73 Middle East & Africa Managed Security Services Market by Service Type, 2023-2033 (US$Bn, AGR (%), CAGR (%))
Table 74 GCC Managed Security Services Market by Value, 2023-2033 (US$Bn, AGR (%), CAGR (%))
Table 75 South Africa Managed Security Services Market by Value, 2023-2033 (US$Bn, AGR (%), CAGR (%))
Table 76 Rest of Middle East & Africa Managed Security Services Market by Value, 2023-2033 (US$Bn, AGR (%), CAGR (%))
Table 77 Latin America Managed Security Services Market by Value, 2023-2033 (US$Bn, AGR (%), CAGR (%))
Table 78 Latin America Managed Security Services Market by Country, 2023-2033 (US$Bn, AGR (%), CAGR (%))
Table 79 Latin America Managed Security Services Market by Type, 2023-2033 (US$Bn, AGR (%), CAGR (%))
Table 80 Latin America Managed Security Services Market by Enterprises Size, 2023-2033 (US$Bn, AGR (%), CAGR (%))
Table 81 Latin America Managed Security Services Market by Solution Type, 2023-2033 (US$Bn, AGR (%), CAGR (%))
Table 82 Latin America Managed Security Services Market by Vertical, 2023-2033 (US$Bn, AGR (%), CAGR (%))
Table 83 Latin America Managed Security Services Market by Service Type, 2023-2033 (US$Bn, AGR (%), CAGR (%))
Table 84 Brazil Managed Security Services Market by Value, 2023-2033 (US$Bn, AGR (%), CAGR (%))
Table 85 Mexico Managed Security Services Market by Value, 2023-2033 (US$Bn, AGR (%), CAGR (%))
Table 86 Rest of Latin America Managed Security Services Market by Value, 2023-2033 (US$Bn, AGR (%), CAGR (%))
Table 87 International Business Machines Corporation: Key Details, (CEO, HQ, Revenue, Founded, No. of Employees, Company Type, Website, Business Segment)
Table 88 International Business Machines Corporation: Product Benchmarking
Table 89 International Business Machines Corporation: Strategic Outlook
Table 90 AT&T Inc.: Key Details, (CEO, HQ, Revenue, Founded, No. of Employees, Company Type, Website, Business Segment)
Table 91 AT&T Inc.: Product Benchmarking
Table 92 AT&T Inc.: Strategic Outlook
Table 93 Nippon Telegraph and Telephone Corporation: Key Details, (CEO, HQ, Revenue, Founded, No. of Employees, Company Type, Website, Business Segment)
Table 94 Nippon Telegraph and Telephone Corporation: Product Benchmarking
Table 95 Nippon Telegraph and Telephone Corporation: Strategic Outlook
Table 96 Accenture plc: Key Details, (CEO, HQ, Revenue, Founded, No. of Employees, Company Type, Website, Business Segment)
Table 97 Accenture plc: Product Benchmarking
Table 98 Accenture plc: Strategic Outlook
Table 99 DXC Technology: Key Details, (CEO, HQ, Revenue, Founded, No. of Employees, Company Type, Website, Business Segment)
Table 100 DXC Technology: Product Benchmarking
Table 101 DXC Technology: Strategic Outlook
Table 102 Secureworks Inc.: Key Details, (CEO, HQ, Revenue, Founded, No. of Employees, Company Type, Website, Business Segment)
Table 103 Secureworks Inc.: Product Benchmarking
Table 104 Secureworks Inc.: Strategic Outlook
Table 105 Trustwave Holdings: Key Details, (CEO, HQ, Revenue, Founded, No. of Employees, Company Type, Website, Business Segment)
Table 106 Trustwave Holdings: Product Benchmarking
Table 107 Trustwave Holdings: Strategic Outlook
Table 108 Orange Cyberdefense: Key Details, (CEO, HQ, Revenue, Founded, No. of Employees, Company Type, Website, Business Segment)
Table 109 Orange Cyberdefense: Product Benchmarking
Table 110 Orange Cyberdefense: Strategic Outlook
Table 111 Fujitsu Limited: Key Details, (CEO, HQ, Revenue, Founded, No. of Employees, Company Type, Website, Business Segment)
Table 112 Fujitsu Limited: Product Benchmarking
Table 113 Fujitsu Limited: Strategic Outlook
Table 114 Kudelski Security: Key Details, (CEO, HQ, Revenue, Founded, No. of Employees, Company Type, Website, Business Segment)
Table 115 Kudelski Security: Product Benchmarking
Table 116 Kudelski Security: Strategic Outlook
Table 117 Proficio: Key Details, (CEO, HQ, Revenue, Founded, No. of Employees, Company Type, Website, Business Segment)
Table 118 Proficio: Product Benchmarking
Table 119 Proficio: Strategic Outlook
Table 120 CrowdStrike Holdings, Inc.: Key Details, (CEO, HQ, Revenue, Founded, No. of Employees, Company Type, Website, Business Segment)
Table 121 CrowdStrike Holdings, Inc.: Product Benchmarking
Table 122 CrowdStrike Holdings, Inc.: Strategic Outlook
Table 123 F5, Inc: Key Details, (CEO, HQ, Revenue, Founded, No. of Employees, Company Type, Website, Business Segment)
Table 124 F5, Inc: Product Benchmarking
Table 125 F5, Inc: Strategic Outlook
Table 126 Capgemini SE: Key Details, (CEO, HQ, Revenue, Founded, No. of Employees, Company Type, Website, Business Segment)
Table 127 Capgemini SE: Product Benchmarking
Table 128 Capgemini SE: Strategic Outlook
Table 129 Kroll Inc.: Key Details, (CEO, HQ, Revenue, Founded, No. of Employees, Company Type, Website, Business Segment)
Table 130 Kroll Inc.: Product Benchmarking
Table 131 Kroll Inc.: Strategic Outlook
図の一覧
Figure 1 Managed Security Services Market Segmentation
Figure 2 Managed Security Services Market by Type: Market Attractiveness Index
Figure 3 Managed Security Services Market by Enterprises Size: Market Attractiveness Index
Figure 4 Managed Security Services Market by Solution Type: Market Attractiveness Index
Figure 5 Managed Security Services Market by Vertical: Market Attractiveness Index
Figure 6 Managed Security Services Market by Service Type: Market Attractiveness Index
Figure 7 Managed Security Services Market Attractiveness Index by Region
Figure 8 Managed Security Services Market: Market Dynamics
Figure 9 Managed Security Services Market by Region, 2023-2033 (US$Bn, AGR (%)) (V-Shaped Recovery Scenario)
Figure 10 Managed Security Services Market by Region, 2023-2033 (US$Bn, AGR (%)) (W-Shaped Recovery Scenario)
Figure 11 Managed Security Services Market by Region, 2023-2033 (US$Bn, AGR (%)) (U-Shaped Recovery Scenario)
Figure 12 Managed Security Services Market by Region, 2023-2033 (US$Bn, AGR (%)) (L-Shaped Recovery Scenario)
Figure 13 Managed Security Services Market: Porter’s Five Forces Analysis
Figure 14 Managed Security Services Market by Type: Market Attractiveness Index
Figure 15 Managed Security Services Market by Type, 2023-2033 (US$Bn, AGR (%))
Figure 16 Fully Managed Security Services Market by Region, 2023-2033 (US$Bn, AGR (%))
Figure 17 Fully Managed Security Services Segment Market Share Forecast by Region, 2023 & 2033 (%)
Figure 18 Co-managed Security Services Market by Region, 2023-2033 (US$Bn, AGR (%))
Figure 19 Co-managed Security Services Segment Market Share Forecast by Region, 2023 & 2033 (%)
Figure 20 Managed Security Services Market by Enterprises Size: Market Attractiveness Index
Figure 21 Managed Security Services Market by Enterprises Size, 2023-2033 (US$Bn, AGR (%))
Figure 22 Large Enterprises Market by Region, 2023-2033 (US$Bn, AGR (%))
Figure 23 Large Enterprises Segment Market Share Forecast by Region, 2023 & 2033 (%)
Figure 24 Medium-sized Enterprises Market by Region, 2023-2033 (US$Bn, AGR (%))
Figure 25 Medium-sized Enterprises Segment Market Share Forecast by Region, 2023 & 2033 (%)
Figure 26 Small-sized Enterprises Market by Region, 2023-2033 (US$Bn, AGR (%))
Figure 27 Small-sized Enterprises Segment Market Share Forecast by Region, 2023 & 2033 (%)
Figure 28 Managed Security Services Market by Solution Type: Market Attractiveness Index
Figure 29 Managed Security Services Market by Solution Type, 2023-2033 (US$Bn, AGR (%))
Figure 30 Intrusion Detection and Prevention Market by Region, 2023-2033 (US$Bn, AGR (%))
Figure 31 Intrusion Detection and Prevention Segment Market Share Forecast by Region, 2023 & 2033 (%)
Figure 32 Threat Prevention Market by Region, 2023-2033 (US$Bn, AGR (%))
Figure 33 Threat Prevention Segment Market Share Forecast by Region, 2023 & 2033 (%)
Figure 34 Distributed Denial of Services Market by Region, 2023-2033 (US$Bn, AGR (%))
Figure 35 Distributed Denial of Services Segment Market Share Forecast by Region, 2023 & 2033 (%)
Figure 36 Other Solution Type Market by Region, 2023-2033 (US$Bn, AGR (%))
Figure 37 Other Solution Type Segment Market Share Forecast by Region, 2023 & 2033 (%)
Figure 38 Managed Security Services Market by Vertical: Market Attractiveness Index
Figure 39 Managed Security Services Market by Vertical, 2023-2033 (US$Bn, AGR (%))
Figure 40 BFSI Market by Region, 2023-2033 (US$Bn, AGR (%))
Figure 41 BFSI Segment Market Share Forecast by Region, 2023 & 2033 (%)
Figure 42 Healthcare Market by Region, 2023-2033 (US$Bn, AGR (%))
Figure 43 Healthcare Segment Market Share Forecast by Region, 2023 & 2033 (%)
Figure 44 Manufacturing Market by Region, 2023-2033 (US$Bn, AGR (%))
Figure 45 Manufacturing Segment Market Share Forecast by Region, 2023 & 2033 (%)
Figure 46 Telecom & IT Market by Region, 2023-2033 (US$Bn, AGR (%))
Figure 47 Telecom & IT Segment Market Share Forecast by Region, 2023 & 2033 (%)
Figure 48 Other Vertical Market by Region, 2023-2033 (US$Bn, AGR (%))
Figure 49 Other Vertical Segment Market Share Forecast by Region, 2023 & 2033 (%)
Figure 50 Managed Security Services Market by Service Type: Market Attractiveness Index
Figure 51 Managed Security Services Market by Service Type, 2023-2033 (US$Bn, AGR%))
Figure 52 Managed IAM Market by Region, 2023-2033 (US$Bn, AGR (%))
Figure 53 Managed IAM Segment Market Share Forecast by Region, 2023 & 2033 (%)
Figure 54 Managed Vulnerability Management Market by Region, 2023-2033 (US$Bn, AGR (%))
Figure 55 Managed Vulnerability Management Segment Market Share Forecast by Region, 2023 & 2033 (%)
Figure 56 Managed Risk and Compliance Market by Region, 2023-2033 (US$Bn, AGR (%))
Figure 57 Managed Risk and Compliance Segment Market Share Forecast by Region, 2023 & 2033 (%)
Figure 58 Managed Detection and Response Market by Region, 2023-2033 (US$Bn, AGR (%))
Figure 59 Managed Detection and Response Segment Market Share Forecast by Region, 2023 & 2033 (%)
Figure 60 Managed SIEM and Log Management Market by Region, 2023-2033 (US$Bn, AGR (%))
Figure 61 Managed SIEM and Log Management Segment Market Share Forecast by Region, 2023 & 2033 (%)
Figure 62 Other Service Type Market by Region, 2023-2033 (US$Bn, AGR (%))
Figure 63 Other Service Type Segment Market Share Forecast by Region, 2023 & 2033 (%)
Figure 64 Managed Security Services Market Forecast by Region 2023 and 2033 (Revenue, CAGR%)
Figure 65 Managed Security Services Market by Region, 2023-2033 (US$Bn, AGR (%)
Figure 66 North America Managed Security Services Market Attractiveness Index
Figure 67 North America Managed Security Services Market by Region, 2023, 2028 & 2033 (US$Billion)
Figure 68 North America Managed Security Services Market by Value, 2023-2033 (US$Bn, AGR (%))
Figure 69 North America Managed Security Services Market by Country, 2023-2033 (US$Bn, AGR (%))
Figure 70 North America Managed Security Services Market Share Forecast by Country, 2023 & 2033 (%)
Figure 71 North America Managed Security Services Market by Type, 2023-2033 (US$Bn, AGR (%))
Figure 72 North America Managed Security Services Market Share Forecast by Type, 2023 & 2033 (%)
Figure 73 North America Managed Security Services Market by Enterprises Size, 2023-2033 (US$Bn, AGR (%))
Figure 74 North America Managed Security Services Market Share Forecast by Enterprises Size, 2023 & 2033 (%)
Figure 75 North America Managed Security Services Market by Solution Type, 2023-2033 (US$Bn, AGR (%))
Figure 76 North America Managed Security Services Market Share Forecast by Solution Type, 2023 & 2033 (%)
Figure 77 North America Managed Security Services Market by Vertical, 2023-2033 (US$Bn, AGR (%))
Figure 78 North America Managed Security Services Market Share Forecast by Vertical, 2023 & 2033 (%)
Figure 79 North America Managed Security Services Market by Service Type, 2023-2033 (US$Bn, AGR (%))
Figure 80 North America Managed Security Services Market Share Forecast by Service Type, 2023 & 2033 (%)
Figure 81 US Managed Security Services Market by Value, 2023-2033 (US$Bn, AGR (%))
Figure 82 Canada Managed Security Services Market by Value, 2023-2033 (US$Bn, AGR (%))
Figure 83 Europe Managed Security Services Market Attractiveness Index
Figure 84 Europe Managed Security Services Market by Region, 2023, 2028 & 2033 (US$Billion)
Figure 85 Europe Managed Security Services Market by Value, 2023-2033 (US$Bn, AGR (%))
Figure 86 Europe Managed Security Services Market by Country, 2023-2033 (US$Bn, AGR (%))
Figure 87 Europe Managed Security Services Market Share Forecast by Country, 2023 & 2033 (%)
Figure 88 Europe Managed Security Services Market by Type, 2023-2033 (US$Bn, AGR (%))
Figure 89 Europe Managed Security Services Market Share Forecast by Type, 2023 & 2033 (%)
Figure 90 Europe Managed Security Services Market by Enterprises Size, 2023-2033 (US$Bn, AGR (%))
Figure 91 Europe Managed Security Services Market Share Forecast by Enterprises Size, 2023 & 2033 (%)
Figure 92 Europe Managed Security Services Market by Solution Type, 2023-2033 (US$Bn, AGR (%))
Figure 93 Europe Managed Security Services Market Share Forecast by Solution Type, 2023 & 2033 (%)
Figure 94 Europe Managed Security Services Market by Vertical, 2023-2033 (US$Bn, AGR (%))
Figure 95 Europe Managed Security Services Market Share Forecast by Vertical, 2023 & 2033 (%)
Figure 96 Europe Managed Security Services Market by Service Type, 2023-2033 (US$Bn, AGR (%))
Figure 97 Europe Managed Security Services Market Share Forecast by Service Type, 2023 & 2033 (%)
Figure 98 Germany Managed Security Services Market by Value, 2023-2033 (US$Bn, AGR (%))
Figure 99 UK Managed Security Services Market by Value, 2023-2033 (US$Bn, AGR (%))
Figure 100 France Managed Security Services Market by Value, 2023-2033 (US$Bn, AGR (%))
Figure 101 Italy Managed Security Services Market by Value, 2023-2033 (US$Bn, AGR (%))
Figure 102 Russia Managed Security Services Market by Value, 2023-2033 (US$Bn, AGR (%))
Figure 103 Rest of Europe Managed Security Services Market by Value, 2023-2033 (US$Bn, AGR (%))
Figure 104 Asia-Pacific Managed Security Services Market Attractiveness Index
Figure 105 Asia-Pacific Managed Security Services Market by Region, 2023, 2028 & 2033 (US$Billion)
Figure 106 Asia-Pacific Managed Security Services Market by Value, 2023-2033 (US$Bn, AGR (%))
Figure 107 Asia-Pacific Managed Security Services Market by Country, 2023-2033 (US$Bn, AGR (%))
Figure 108 Asia-Pacific Managed Security Services Market Share Forecast by Country, 2023 & 2033 (%)
Figure 109 Asia-Pacific Managed Security Services Market by Type, 2023-2033 (US$Bn, AGR (%))
Figure 110 Asia-Pacific Managed Security Services Market Share Forecast by Type, 2023 & 2033 (%)
Figure 111 Asia-Pacific Managed Security Services Market by Enterprises Size, 2023-2033 (US$Bn, AGR (%))
Figure 112 Asia-Pacific Managed Security Services Market Share Forecast by Enterprises Size, 2023 & 2033 (%)
Figure 113 Asia-Pacific Managed Security Services Market by Solution Type, 2023-2033 (US$Bn, AGR (%))
Figure 114 Asia-Pacific Managed Security Services Market Share Forecast by Solution Type, 2023 & 2033 (%)
Figure 115 Asia-Pacific Managed Security Services Market by Vertical, 2023-2033 (US$Bn, AGR (%))
Figure 116 Asia-Pacific Managed Security Services Market Share Forecast by Vertical, 2023 & 2033 (%)
Figure 117 Asia-Pacific Managed Security Services Market by Service Type, 2023-2033 (US$Bn, AGR (%))
Figure 118 Asia-Pacific Managed Security Services Market Share Forecast by Service Type, 2023 & 2033 (%)
Figure 119 China Managed Security Services Market by Value, 2023-2033 (US$Bn, AGR (%))
Figure 120 India Managed Security Services Market by Value, 2023-2033 (US$Bn, AGR (%))
Figure 121 Japan Managed Security Services Market by Value, 2023-2033 (US$Bn, AGR (%))
Figure 122 South Korea Managed Security Services Market by Value, 2023-2033 (US$Bn, AGR (%))
Figure 123 Australia Managed Security Services Market by Value, 2023-2033 (US$Bn, AGR (%))
Figure 124 Rest of Asia-Pacific Managed Security Services Market by Value, 2023-2033 (US$Bn, AGR (%))
Figure 125 Middle East & Africa Managed Security Services Market Attractiveness Index
Figure 126 Middle East & Africa Managed Security Services Market by Region, 2023, 2028 & 2033 (US$Billion)
Figure 127 Middle East & Africa Managed Security Services Market by Value, 2023-2033 (US$Bn, AGR (%))
Figure 128 Middle East & Africa Managed Security Services Market by Country, 2023-2033 (US$Bn, AGR (%))
Figure 129 Middle East & Africa Managed Security Services Market Share Forecast by Country, 2023 & 2033 (%)
Figure 130 Middle East & Africa Managed Security Services Market by Type, 2023-2033 (US$Bn, AGR (%))
Figure 131 Middle East & Africa Managed Security Services Market Share Forecast by Type, 2023 & 2033 (%)
Figure 132 Middle East & Africa Managed Security Services Market by Enterprises Size, 2023-2033 (US$Bn, AGR (%))
Figure 133 Middle East & Africa Managed Security Services Market Share Forecast by Enterprises Size, 2023 & 2033 (%)
Figure 134 Middle East & Africa Managed Security Services Market by Solution Type, 2023-2033 (US$Bn, AGR (%))
Figure 135 Middle East & Africa Managed Security Services Market Share Forecast by Solution Type, 2023 & 2033 (%)
Figure 136 Middle East & Africa Managed Security Services Market by Vertical, 2023-2033 (US$Bn, AGR (%))
Figure 137 Middle East & Africa Managed Security Services Market Share Forecast by Vertical, 2023 & 2033 (%)
Figure 138 Middle East & Africa Managed Security Services Market by Service Type, 2023-2033 (US$Bn, AGR (%))
Figure 139 Middle East & Africa Managed Security Services Market Share Forecast by Service Type, 2023 & 2033 (%)
Figure 140 GCC Managed Security Services Market by Value, 2023-2033 (US$Bn, AGR (%))
Figure 141 South Africa Managed Security Services Market by Value, 2023-2033 (US$Bn, AGR (%))
Figure 142 Rest of Middle East & Africa Managed Security Services Market by Value, 2023-2033 (US$Bn, AGR (%))
Figure 143 Latin America Managed Security Services Market Attractiveness Index
Figure 144 Latin America Managed Security Services Market by Region, 2023, 2028 & 2033 (US$Billion)
Figure 145 Latin America Managed Security Services Market by Value, 2023-2033 (US$Bn, AGR (%))
Figure 146 Latin America Managed Security Services Market by Country, 2023-2033 (US$Bn, AGR (%))
Figure 147 Latin America Managed Security Services Market Share Forecast by Country, 2023 & 2033 (%)
Figure 148 Latin America Managed Security Services Market by Type, 2023-2033 (US$Bn, AGR (%))
Figure 149 Latin America Managed Security Services Market Share Forecast by Type, 2023 & 2033 (%)
Figure 150 Latin America Managed Security Services Market by Enterprises Size, 2023-2033 (US$Bn, AGR (%))
Figure 151 Latin America Managed Security Services Market Share Forecast by Enterprises Size, 2023 & 2033 (%)
Figure 152 Latin America Managed Security Services Market by Solution Type, 2023-2033 (US$Bn, AGR (%))
Figure 153 Latin America Managed Security Services Market Share Forecast by Solution Type, 2023 & 2033 (%)
Figure 154 Latin America Managed Security Services Market by Vertical, 2023-2033 (US$Bn, AGR (%))
Figure 155 Latin America Managed Security Services Market Share Forecast by Vertical, 2023 & 2033 (%)
Figure 156 Latin America Managed Security Services Market by Service Type, 2023-2033 (US$Bn, AGR (%))
Figure 157 Latin America Managed Security Services Market Share Forecast by Service Type, 2023 & 2033 (%)
Figure 158 Brazil Managed Security Services Market by Value, 2023-2033 (US$Bn, AGR (%))
Figure 159 Mexico Managed Security Services Market by Value, 2023-2033 (US$Bn, AGR (%))
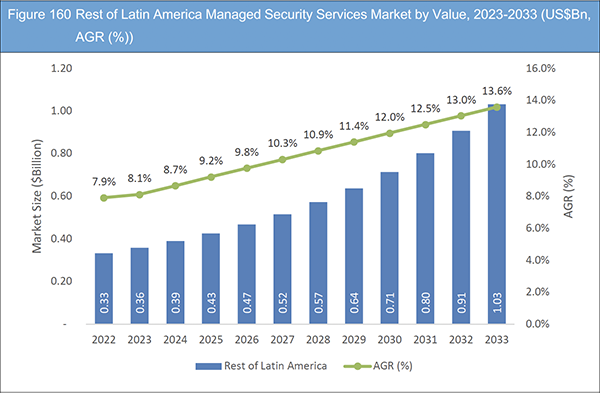
Figure 160 Rest of Latin America Managed Security Services Market by Value, 2023-2033 (US$Bn, AGR (%))
Figure 161 Managed Security Services Market: Company Share, 2022
Figure 162 International Business Machines Corporation: Net Revenue, 2018-2022 (US$million, AGR%)
Figure 163 International Business Machines Corporation: R&D, 2018-2022 (US$million, AGR%)
Figure 164 International Business Machines Corporation: Regional Revenue Shares, 2022 (%)
Figure 165 International Business Machines Corporation: Business Segment Revenue Shares, 2022 (%)
Figure 166 AT&T Inc.: Net Revenue, 2018-2022 (US$million, AGR%)
Figure 167 AT&T Inc.: Regional Revenue Shares, 2022 (%)
Figure 168 AT&T Inc.: Business Segment Revenue Shares, 2022 (%)
Figure 169 Nippon Telegraph and Telephone Corporation: Net Revenue, 2018-2022 (US$million, AGR%)
Figure 170 Nippon Telegraph and Telephone Corporation: R&D, 2018-2022 (US$million, AGR%)
Figure 171 Nippon Telegraph and Telephone Corporation: Business Segment Revenue Shares, 2022 (%)
Figure 172 Accenture plc: Net Revenue, 2018-2022 (US$million, AGR%)
Figure 173 Accenture plc: R&D, 2018-2022 (US$million, AGR%)
Figure 174 Accenture plc: Regional Revenue Shares, 2022 (%)
Figure 175 DXC Technology: Net Revenue, 2018-2022 (US$million, AGR%)
Figure 176 DXC Technology: Regional Revenue Shares, 2022 (%)
Figure 177 DXC Technology: Business Segment Revenue Shares, 2022 (%)
Figure 178 Secureworks Inc.: Net Revenue, 2018-2022 (US$million, AGR%)
Figure 179 Secureworks Inc.: R&D, 2018-2022 (US$million, AGR%)
Figure 180 Secureworks Inc.: Business Segment Revenue Shares, 2022 (%)
Figure 181 Fujitsu Limited: Net Revenue, 2018-2022 (US$million, AGR%)
Figure 182 Fujitsu Limited: R&D, 2018-2022 (US$million, AGR%)
Figure 183 Fujitsu Limited: Regional Revenue Shares, 2022 (%)
Figure 184 Fujitsu Limited: Business Segment Revenue Shares, 2022 (%)
Figure 185 CrowdStrike Holdings, Inc.: Net Revenue, 2018-2022 (US$million, AGR%)
Figure 186 CrowdStrike Holdings, Inc.: R&D, 2018-2022 (US$million, AGR%)
Figure 187 CrowdStrike Holdings, Inc.: Business Segment Revenue Shares, 2022 (%)
Figure 188 F5, Inc: Net Revenue, 2018-2022 (US$million, AGR%)
Figure 189 F5, Inc: R&D, 2018-2022 (US$million, AGR%)
Figure 190 F5, Inc: Regional Revenue Shares, 2022 (%)
Figure 191 Capgemini SE: Net Revenue, 2018-2022 (US$million, AGR%)
Figure 192 Capgemini SE: Regional Revenue Shares, 2022 (%)
Figure 193 Capgemini SE: Business Segment Revenue Shares, 2022 (%)
ページTOPに戻る
Summary
Report Details
The Managed Security Services Market Report 2023-2033: This report will prove invaluable to leading firms striving for new revenue pockets if they wish to better understand the industry and its underlying dynamics. It will be useful for companies that would like to expand into different industries or to expand their existing operations in a new region.
Increasing Cybersecurity Threat Landscape
The relentless growth of the cybersecurity threat landscape has created a sense of urgency for organizations to strengthen their security measures. The emergence of sophisticated malware, ransomware, and other cyber threats poses significant risks to businesses. For example, the WannaCry ransomware attack in 2017 affected thousands of organizations worldwide, highlighting the need for robust security solutions. Managed Security Services provide advanced threat intelligence, monitoring, and response capabilities to protect organizations from evolving cyber threats.
Compliance and Regulatory Requirements
Organizations must comply with industry-specific regulations and data protection laws. Compliance standards such as the Payment Card Industry Data Security Standard (PCI DSS) and the Health Insurance Portability and Accountability Act (HIPAA) require robust security measures. Managed Security Services assist organizations in achieving compliance by providing expertise in implementing and maintaining security controls, conducting regular audits, and ensuring adherence to regulatory requirements.
What Questions Should You Ask before Buying a Market Research Report?
• How is the managed security services market evolving?
• What is driving and restraining the managed security services market?
• How will each managed security services submarket segment grow over the forecast period and how much revenue will these submarkets account for in 2033?
• How will the market shares for each managed security services submarket develop from 2023 to 2033?
• What will be the main driver for the overall market from 2023 to 2033?
• Will leading managed security services markets broadly follow the macroeconomic dynamics, or will individual national markets outperform others?
• How will the market shares of the national markets change by 2033 and which geographical region will lead the market in 2033?
• Who are the leading players and what are their prospects over the forecast period?
• What are the managed security services projects for these leading companies?
• How will the industry evolve during the period between 2023 and 2033? What are the implications of managed security services projects taking place now and over the next 10 years?
• Is there a greater need for product commercialisation to further scale the managed security services market?
• Where is the managed security services market heading and how can you ensure you are at the forefront of the market?
• What are the best investment options for new product and service lines?
• What are the key prospects for moving companies into a new growth path and C-suite?
You need to discover how this will impact the managed security services market today, and over the next 10 years:
• Our 442-page report provides 131 tables and 193 charts/graphs exclusively to you.
• The report highlights key lucrative areas in the industry so you can target them – NOW.
• It contains in-depth analysis of global, regional and national sales and growth.
• It highlights for you the key successful trends, changes and revenue projections made by your competitors.
This report tells you TODAY how the managed security services market will develop in the next 10 years, and in line with the variations in COVID-19 economic recession and bounce. This market is more critical now than at any point over the last 10 years.
Forecasts to 2033 and other analyses reveal commercial prospects
• In addition to revenue forecasting to 2033, our new study provides you with recent results, growth rates, and market shares.
• You will find original analyses, with business outlooks and developments.
• Discover qualitative analyses (including market dynamics, drivers, opportunities, restraints and challenges), cost structure, impact of rising managed security services prices and recent developments.
This report includes data analysis and invaluable insight into how COVID-19 will affect the industry and your company. Four COVID-19 recovery patterns and their impact, namely, “V”, “L”, “W” and “U” are discussed in this report.
Segments Covered in the Report
Market Segment by Type
• Fully Managed Security Services
• Co-managed Security Services
Market Segment by Enterprises Size
• Large Enterprises
• Medium-sized Enterprises
• Small-sized Enterprises
Market Segment by Solution Type
• Intrusion Detection and Prevention
• Threat Prevention
• Distributed Denial of Services
• Other Solution Type
Market Segment by Vertical
• BFSI
• Healthcare
• Manufacturing
• Telecom & IT
• Other Vertical
Market Segment by Service Type
• Managed IAM
• Managed Vulnerability Management
• Managed Risk and Compliance
• Managed Detection and Response
• Managed SIEM and Log Management
• Other Service Type
In addition to the revenue predictions for the overall world market and segments, you will also find revenue forecasts for four regional and 20 leading national markets:
North America
• U.S.
• Canada
Europe
• Germany
• Russia
• United Kingdom
• France
• Italy
• Rest of Europe
Asia Pacific
• China
• Japan
• India
• Australia
• South Korea
• Rest of Asia Pacific
Latin America
• Brazil
• Mexico
• Rest of Latin America
Middle East & Africa
• GCC
• South Africa
• Rest of Middle East & Africa
The report also includes profiles and for some of the leading companies in the Managed Security Services Market, 2023 to 2033, with a focus on this segment of these companies’ operations.
Leading companies and the potential for market growth
• Accenture plc
• AT&T Inc.
• Capgemini SE
• CrowdStrike Holdings, Inc.
• DXC Technology
• F5, Inc
• Fujitsu Limited
• International Business Machines Corporation
• Kroll Inc.
• Kudelski Security
• Nippon Telegraph and Telephone Corporation
• Orange Cyberdefense
• Proficio
• Secureworks Inc.
• Trustwave Holdings
Overall world revenue for managed security services market, 2023 to 2033 in terms of value the market will surpass US$30.4 billion in 2023, our work calculates. We predict strong revenue growth through to 2033. Our work identifies which organizations hold the greatest potential. Discover their capabilities, progress, and commercial prospects, helping you stay ahead.
How will the Managed Security Services Market, 2023 to 2033 report help you?
In summary, our 440+ page report provides you with the following knowledge:
• Revenue forecasts to 2033 for Managed Security Services Market, 2023 to 2033 Market, with forecasts for enterprise size, solution type, vertical, service type, type and company size, each forecast at a global and regional level – discover the industry’s prospects, finding the most lucrative places for investments and revenues.
• Revenue forecasts to 2033 for four regional and 20 key national markets – See forecasts for the Managed Security Services Market, 2023 to 2033 market in North America, Europe, Asia-Pacific, Latin America and Middle East & Africa. Also forecasted is the market in the US, Canada, Brazil, Germany, France, UK, Italy, China, India, Japan, and Australia among other prominent economies.
• Prospects for established firms and those seeking to enter the market – including company profiles for 15 of the major companies involved in the Managed Security Services Market, 2023 to 2033.
Find quantitative and qualitative analyses with independent predictions. Receive information that only our report contains, staying informed with invaluable business intelligence.
Information found nowhere else
With our new report, you are less likely to fall behind in knowledge or miss out on opportunities. See how our work could benefit your research, analyses, and decisions. Visiongain’s study is for everybody needing commercial analyses for the Managed Security Services Market, 2023 to 2033, market-leading companies. You will find data, trends and predictions.
ページTOPに戻る
Table of Contents
Table of Contents
1 Report Overview
1.1 Objectives of the Study
1.2 Introduction to Managed Security Services Market
1.3 What This Report Delivers
1.4 Why You Should Read This Report
1.5 Key Questions Answered by This Analytical Report
1.6 Who Is This Report for?
1.7 Research Methodology
1.7.1 Market Definitions
1.7.2 Market Evaluation & Forecasting Methodology
1.7.3 Data Validation
1.7.3.1 Primary Research
1.7.3.2 Secondary Research
1.8 Frequently Asked Questions (FAQs)
1.9 Associated Visiongain Reports
1.10 About Visiongain
2 Executive Summary
3 Market Overview
3.1 Key Findings
3.2 Market Dynamics
3.2.1 Market Driving Factors
3.2.1.1 The Managed Security Services Market Is Driven by the Growing Complexity and Frequency of Cyber Threats
3.2.1.2 Compliance With Security Regulations and Industry Standards Is a Crucial Driver for the Adoption of Managed Security Services
3.2.1.3 The Shortage of Skilled Cybersecurity Professionals Is a Significant Driver for the Managed Security Services Market
3.2.1.4 Cyber Threats Can Occur at Any Time, Requiring Organizations to Have Round-The-Clock Security Monitoring and Incident Response Capabilities
3.2.2 Market Restraining Factors
3.2.2.1 One of the Primary Restraints for Organizations Considering Managed Security Services Is the Associated Costs
3.2.2.2 Adopting Managed Security Services Involves Relying on Third-Party Service Providers to Handle Critical Aspects of an Organization's Security Operations
3.2.2.3 Organizations Already Operating With Existing Security Infrastructure and Tools May Face Integration and Compatibility Challenges When Adopting Managed Security Services
3.2.2.4 When Outsourcing Security Operations to Managed Security Service Providers, Organizations May Experience a Perceived Loss of Control and Visibility into Their Security Environment
3.2.3 Market Opportunities
3.2.3.1 As Cybercriminals Employ More Advanced Techniques, Organizations Are Seeking Specialized Expertise and Advanced Security Solutions to Effectively Mitigate Risks
3.2.3.2 The Rapid Adoption of Cloud Computing Presents a Vast Opportunity for Managed Security Service Providers
3.2.3.3 The Proliferation of Connected Devices and the Internet of Things (Iot) Opens Up New Opportunities for Managed Security Service Providers
3.2.3.4 The Increasing Demand for Managed Detection and Response (MDR) Services Presents a Significant Opportunity for Mssps
3.3 COVID-19 Impact Analysis
3.4 V-Shaped Recovery Scenario
3.4.1 W-Shaped Recovery Scenario
3.4.2 U-Shaped Recovery Scenario
3.4.3 L-Shaped Recovery Scenario
3.5 Porter’s Five Forces Analysis
3.5.1 Threat of New Entrants
3.5.2 Bargaining Power of Buyers
3.5.3 Bargaining Power of Suppliers
3.5.4 Threat of Substitutes
3.5.5 Intensity of Competitive Rivalry
3.6 PESTLE Analysis
3.6.1 Political Factors
3.6.2 Economic Factors
3.6.3 Sociocultural Factors
3.6.4 Technological Factors
3.6.5 Environmental Factors
3.6.6 Legal Factors
3.7 SWOT Analysis
3.7.1 Strengths
3.7.2 Weaknesses
3.7.3 Opportunities
3.7.4 Threats
3.8 Trending MSSP Services in 2023
3.8.1 Cloud-based Security Services
3.8.2 Email Authentication Services
3.8.3 DevSecOps
3.8.4 Zero Trust Security
3.8.5 Blockchain Security
4 Managed Security Services Market Analysis by Type
4.1 Key Findings
4.2 Type Segment: Market Attractiveness Index
4.2.1 Managed Security Services Market by Type
4.3 Fully Managed Security Services
4.3.1 Market by Region, 2023-2033 (US$Bn)
4.3.2 Market Share by Region, 2023 & 2033 (%)
4.4 Co-managed Security Services
4.4.1 Market by Region, 2023-2033 (US$Bn)
4.4.2 Market Share by Region, 2023 & 2033 (%)
5 Managed Security Services Market Analysis by Enterprises Size
5.1 Key Findings
5.2 Enterprises Size Segment: Market Attractiveness Index
5.2.1 Managed Security Services Market by Enterprises Size
5.3 Large Enterprises
5.3.1 Market by Region, 2023-2033 (US$Bn)
5.3.2 Market Share by Region, 2023 & 2033 (%)
5.4 Medium-sized Enterprises
5.4.1 Market by Region, 2023-2033 (US$Bn)
5.4.2 Market Share by Region, 2023 & 2033 (%)
5.5 Small-sized Enterprises
5.5.1 Market by Region, 2023-2033 (US$Bn)
5.5.2 Market Share by Region, 2023 & 2033 (%)
6 Managed Security Services Market Analysis by Solution Type
6.1 Key Findings
6.2 Solution Type Segment: Market Attractiveness Index
6.2.1 Managed Security Services Market by Solution Type
6.3 Intrusion Detection and Prevention
6.3.1 Market by Region, 2023-2033 (US$Bn)
6.3.2 Market Share by Region, 2023 & 2033 (%)
6.4 Threat Prevention
6.4.1 Market by Region, 2023-2033 (US$Bn)
6.4.2 Market Share by Region, 2023 & 2033 (%)
6.5 Distributed Denial of Service (DDoS)
6.5.1 Market by Region, 2023-2033 (US$Bn)
6.5.2 Market Share by Region, 2023 & 2033 (%)
6.6 Other Solution Type
6.6.1 Market by Region, 2023-2033 (US$Bn)
6.6.2 Market Share by Region, 2023 & 2033 (%)
7 Managed Security Services Market Analysis by Vertical
7.1 Key Findings
7.2 Vertical Segment: Market Attractiveness Index
7.2.1 Managed Security Services Market by Vertical
7.3 BFSI
7.3.1 Market by Region, 2023-2033 (US$Bn)
7.3.2 Market Share by Region, 2023 & 2033 (%)
7.4 Healthcare
7.4.1 Market by Region, 2023-2033 (US$Bn)
7.4.2 Market Share by Region, 2023 & 2033 (%)
7.5 Manufacturing
7.5.1 Market by Region, 2023-2033 (US$Bn)
7.5.2 Market Share by Region, 2023 & 2033 (%)
7.6 Telecom & IT
7.6.1 Market by Region, 2023-2033 (US$Bn)
7.6.2 Market Share by Region, 2023 & 2033 (%)
7.7 Other Vertical
7.7.1 Market by Region, 2023-2033 (US$Bn)
7.7.2 Market Share by Region, 2023 & 2033 (%)
8 Managed Security Services Market Analysis by Service Type
8.1 Key Findings
8.2 Service Type Segment: Market Attractiveness Index
8.2.1 Managed Security Services Market by Service Type
8.3 Managed IAM
8.3.1 Market by Region, 2023-2033 (US$Bn)
8.3.2 Market Share by Region, 2023 & 2033 (%)
8.4 Managed Vulnerability Management
8.4.1 Market by Region, 2023-2033 (US$Bn)
8.4.2 Market Share by Region, 2023 & 2033 (%)
8.5 Managed Risk and Compliance
8.5.1 Market by Region, 2023-2033 (US$Bn)
8.5.2 Market Share by Region, 2023 & 2033 (%)
8.6 Managed Detection and Response
8.6.1 Market by Region, 2023-2033 (US$Bn)
8.6.2 Market Share by Region, 2023 & 2033 (%)
8.7 Managed SIEM and Log Management
8.7.1 Market by Region, 2023-2033 (US$Bn)
8.7.2 Market Share by Region, 2023 & 2033 (%)
8.8 Other Service Type
8.8.1 Market by Region, 2023-2033 (US$Bn)
8.8.2 Market Share by Region, 2023 & 2033 (%)
9 Managed Security Services Market Analysis by Region
9.1 Key Findings
9.2 Managed Security Services Market by Region
10 North America Managed Security Services Market Analysis
10.1 Key Findings
10.2 North America Managed Security Services Market Attractiveness Index
10.3 North America Managed Security Services Market by Country, 2023, 2028 & 2033 (US$Billion)
10.4 North America Managed Security Services Market by Value
10.5 North America Managed Security Services Market by Country
10.6 North America Managed Security Services Market by Type
10.7 North America Managed Security Services Market by Enterprises Size
10.8 North America Managed Security Services Market by Solution Type
10.9 North America Managed Security Services Market by Vertical
10.10 North America Managed Security Services Market by Service Type
10.11 U.S. Managed Security Services Market Analysis
10.12 Canada Managed Security Services Market Analysis
11 Europe Managed Security Services Market Analysis
11.1 Key Findings
11.2 Europe Managed Security Services Market Attractiveness Index
11.3 Europe Managed Security Services Market by Country, 2023, 2028 & 2033 (US$Billion)
11.4 Europe Managed Security Services Market by Value
11.5 Europe Managed Security Services Market by Country
11.6 Europe Managed Security Services Market by Type
11.7 Europe Managed Security Services Market by Enterprises Size
11.8 Europe Managed Security Services Market by Solution Type
11.9 Europe Managed Security Services Market by Vertical
11.10 Europe Managed Security Services Market by Service Type
11.11 Germany Managed Security Services Market Analysis
11.12 UK Managed Security Services Market Analysis
11.13 France Managed Security Services Market Analysis
11.14 Italy Managed Security Services Market Analysis
11.15 Russia Managed Security Services Market Analysis
11.16 Rest of Europe Managed Security Services Market Analysis
12 Asia-Pacific Managed Security Services Market Analysis
12.1 Key Findings
12.2 Asia-Pacific Managed Security Services Market Attractiveness Index
12.3 Asia-Pacific Managed Security Services Market by Country, 2023, 2028 & 2033 (US$Billion)
12.4 Asia-Pacific Managed Security Services Market by Value
12.5 Asia-Pacific Managed Security Services Market by Country
12.6 Asia-Pacific Managed Security Services Market by Type
12.7 Asia-Pacific Managed Security Services Market by Enterprises Size
12.8 Asia-Pacific Managed Security Services Market by Solution Type
12.9 Asia-Pacific Managed Security Services Market by Vertical
12.10 Asia-Pacific Managed Security Services Market by Service Type
12.11 China Managed Security Services Market Analysis
12.12 India Managed Security Services Market Analysis
12.13 Japan Managed Security Services Market Analysis
12.14 South Korea Managed Security Services Market Analysis
12.15 Australia Managed Security Services Market Analysis
12.16 Rest of Asia-Pacific Managed Security Services Market Analysis
13 Middle East & Africa Managed Security Services Market Analysis
13.1 Key Findings
13.2 Middle East & Africa Managed Security Services Market Attractiveness Index
13.3 Middle East & Africa Managed Security Services Market by Country, 2023, 2028 & 2033 (US$Billion)
13.4 Middle East & Africa Managed Security Services Market by Value
13.5 Middle East & Africa Managed Security Services Market by Country
13.6 Middle East & Africa Managed Security Services Market by Type
13.7 Middle East & Africa Managed Security Services Market by Enterprises Size
13.8 Middle East & Africa Managed Security Services Market by Solution Type
13.9 Middle East & Africa Managed Security Services Market by Vertical
13.10 Middle East & Africa Managed Security Services Market by Service Type
13.11 GCC Managed Security Services Market Analysis
13.12 South Africa Managed Security Services Market Analysis
13.13 Rest of MEA Managed Security Services Market Analysis
14 Latin America Managed Security Services Market Analysis
14.1 Key Findings
14.2 Latin America Managed Security Services Market Attractiveness Index
14.3 Latin America Managed Security Services Market by Country, 2023, 2028 & 2033 (US$Billion)
14.4 Latin America Managed Security Services Market by Value
14.5 Latin America Managed Security Services Market by Country
14.6 Latin America Managed Security Services Market by Type
14.7 Latin America Managed Security Services Market by Enterprises Size
14.8 Latin America Managed Security Services Market by Solution Type
14.9 Latin America Managed Security Services Market by Vertical
14.10 Latin America Managed Security Services Market by Service Type
14.11 Brazil Managed Security Services Market Analysis
14.12 Mexico Managed Security Services Market Analysis
14.13 Rest of Latin America Managed Security Services Market Analysis
15 Company Profiles
15.1 Competitive Landscape, 2022
15.2 Strategic Outlook
15.2.1 Acquisition
15.2.2 Agreement
15.2.3 Collaboration
15.2.4 Expansion
15.2.5 New Product Launch
15.2.6 Partnership
15.3 International Business Machines Corporation
15.3.1 Company Snapshot
15.3.2 Company Overview
15.3.3 Financial Analysis
15.3.3.1 Net Revenue, 2018-2022
15.3.3.2 R&D, 2018-2022
15.3.3.3 Regional Revenue Shares, 2022 (%)
15.3.3.4 Business Segment Revenue Shares, 2022 (%)
15.3.4 Product Benchmarking
15.3.5 Strategic Outlook
15.4 AT&T Inc.
15.4.1 Company Snapshot
15.4.2 Company Overview
15.4.3 Financial Analysis
15.4.3.1 Net Revenue, 2018-2022
15.4.3.2 Regional Revenue Shares, 2022 (%)
15.4.3.3 Business Segment Revenue Shares, 2022 (%)
15.4.4 Product Benchmarking
15.4.5 Strategic Outlook
15.5 Nippon Telegraph and Telephone Corporation
15.5.1 Company Snapshot
15.5.2 Company Overview
15.5.3 Financial Analysis
15.5.3.1 Net Revenue, 2018-2022
15.5.3.2 R&D, 2018-2022
15.5.3.3 Business Segment Revenue Shares, 2022 (%)
15.5.4 Product Benchmarking
15.5.5 Strategic Outlook
15.6 Accenture plc
15.6.1 Company Snapshot
15.6.2 Company Overview
15.6.3 Financial Analysis
15.6.3.1 Net Revenue, 2018-2022
15.6.3.2 R&D, 2018-2022
15.6.3.3 Regional Revenue Shares, 2022 (%)
15.6.4 Product Benchmarking
15.6.5 Strategic Outlook
15.7 DXC Technology
15.7.1 Company Snapshot
15.7.2 Company Overview
15.7.3 Financial Analysis
15.7.3.1 Net Revenue, 2018-2022
15.7.3.2 Regional Revenue Shares, 2022 (%)
15.7.3.3 Business Segment Revenue Shares, 2022 (%)
15.7.4 Product Benchmarking
15.7.5 Strategic Outlook
15.8 Secureworks Inc.
15.8.1 Company Snapshot
15.8.2 Company Overview
15.8.3 Financial Analysis
15.8.3.1 Net Revenue, 2018-2022
15.8.3.2 R&D, 2018-2022
15.8.3.3 Business Segment Revenue Shares, 2022 (%)
15.8.4 Product Benchmarking
15.8.5 Strategic Outlook
15.9 Trustwave Holdings
15.9.1 Company Snapshot
15.9.2 Company Overview
15.9.3 Product Benchmarking
15.9.4 Strategic Outlook
15.10 Orange Cyberdefense
15.10.1 Company Snapshot
15.10.2 Company Overview
15.10.3 Product Benchmarking
15.10.4 Strategic Outlook
15.11 Fujitsu Limited
15.11.1 Company Snapshot
15.11.2 Company Overview
15.11.3 Financial Analysis
15.11.3.1 Net Revenue, 2018-2022
15.11.3.2 R&D, 2018-2022
15.11.3.3 Regional Revenue Shares, 2022 (%)
15.11.3.4 Business Segment Revenue Shares, 2022 (%)
15.11.4 Product Benchmarking
15.11.5 Strategic Outlook
15.12 Kudelski Security
15.12.1 Company Snapshot
15.12.2 Company Overview
15.12.3 Product Benchmarking
15.12.4 Strategic Outlook
15.13 Proficio
15.13.1 Company Snapshot
15.13.2 Company Overview
15.13.3 Product Benchmarking
15.13.4 Strategic Outlook
15.14 CrowdStrike Holdings, Inc
15.14.1 Company Snapshot
15.14.2 Company Overview
15.14.3 Financial Analysis
15.14.3.1 Net Revenue, 2018-2022
15.14.3.2 R&D, 2018-2022
15.14.3.3 Business Segment Revenue Shares, 2022 (%)
15.14.4 Product Benchmarking
15.14.5 Strategic Outlook
15.15 F5, Inc
15.15.1 Company Snapshot
15.15.2 Company Overview
15.15.3 Financial Analysis
15.15.3.1 Net Revenue, 2018-2022
15.15.3.2 R&D, 2018-2022
15.15.3.3 Regional Revenue Shares, 2022 (%)
15.15.4 Product Benchmarking
15.15.5 Strategic Outlook
15.16 Capgemini SE
15.16.1 Company Snapshot
15.16.2 Company Overview
15.16.3 Financial Analysis
15.16.3.1 Net Revenue, 2018-2022
15.16.3.2 Regional Revenue Shares, 2022 (%)
15.16.3.3 Business Segment Revenue Shares, 2022 (%)
15.16.4 Product Benchmarking
15.16.5 Strategic Outlook
15.17 Kroll Inc.
15.17.1 Company Snapshot
15.17.2 Company Overview
15.17.3 Product Benchmarking
15.17.4 Strategic Outlook
16 Conclusion and Recommendations
16.1 Concluding Remarks from Visiongain
16.2 Recommendations for Market Players
ページTOPに戻る
List of Tables/Graphs
List of Tables
Table 1 Managed Security Services Market Snapshot, 2023 & 2033 (US$Billion, CAGR %)
Table 2 Managed Security Services Market by Region, 2023-2033 (US$Bn, AGR (%), CAGR (%)) (V-Shaped Recovery Scenario)
Table 3 Managed Security Services Market by Region, 2023-2033 (US$Bn, AGR (%), CAGR (%)) (W-Shaped Recovery Scenario)
Table 4 Managed Security Services Market by Region, 2023-2033 (US$Bn, AGR (%), CAGR (%)) (U-Shaped Recovery Scenario)
Table 5 Managed Security Services Market by Region, 2023-2033 (US$Bn, AGR (%), CAGR (%)) (L-Shaped Recovery Scenario)
Table 6 Managed Security Services Market by Type, 2023-2033 (US$Bn, AGR (%), CAGR (%))
Table 7 Fully Managed Security Services Market by Region, 2023-2033 (US$Bn, AGR (%), CAGR (%))
Table 8 Co-managed Security Services Market by Region, 2023-2033 (US$Bn, AGR (%), CAGR (%))
Table 9 Managed Security Services Market by Enterprises Size, 2023-2033 (US$Bn, AGR (%), CAGR (%))
Table 10 Large Enterprises Market by Region, 2023-2033 (US$Bn, AGR (%), CAGR (%))
Table 11 Medium-sized Enterprises Market by Region, 2023-2033 (US$Bn, AGR (%), CAGR (%))
Table 12 Small-sized Enterprises Market by Region, 2023-2033 (US$Bn, AGR (%), CAGR (%))
Table 13 Managed Security Services Market by Solution Type, 2023-2033 (US$Bn, AGR (%), CAGR (%))
Table 14 Intrusion Detection and Prevention Market by Region, 2023-2033 (US$Bn, AGR (%), CAGR (%))
Table 15 Threat Prevention Market by Region, 2023-2033 (US$Bn, AGR (%), CAGR (%))
Table 16 Distributed Denial of Services Market by Region, 2023-2033 (US$Bn, AGR (%), CAGR (%))
Table 17 Other Solution Type Market by Region, 2023-2033 (US$Bn, AGR (%), CAGR (%))
Table 18 Managed Security Services Market by Vertical, 2023-2033 (US$Bn, AGR (%), CAGR (%))
Table 19 BFSI Market by Region, 2023-2033 (US$Bn, AGR (%), CAGR (%))
Table 20 Healthcare Market by Region, 2023-2033 (US$Bn, AGR (%), CAGR (%))
Table 21 Manufacturing Market by Region, 2023-2033 (US$Bn, AGR (%), CAGR (%))
Table 22 Telecom & IT Market by Region, 2023-2033 (US$Bn, AGR (%), CAGR (%))
Table 23 Other Vertical Market by Region, 2023-2033 (US$Bn, AGR (%), CAGR (%))
Table 24 Managed Security Services Market by Service Type, 2023-2033 (US$Bn, AGR (%), CAGR (%))
Table 25 Managed IAM Market by Region, 2023-2033 (US$Bn, AGR (%), CAGR (%))
Table 26 Managed Vulnerability Management Market by Region, 2023-2033 (US$Bn, AGR (%), CAGR (%))
Table 27 Managed Risk and Compliance Market by Region, 2023-2033 (US$Bn, AGR (%), CAGR (%))
Table 28 Managed Detection and Response Market by Region, 2023-2033 (US$Bn, AGR (%), CAGR (%))
Table 29 Managed SIEM and Log Management Market by Region, 2023-2033 (US$Bn, AGR (%), CAGR (%))
Table 30 Other Service Type Market by Region, 2023-2033 (US$Bn, AGR (%), CAGR (%))
Table 31 Managed Security Services Market by Region, 2023-2033 (US$Bn, AGR (%), CAGR (%))
Table 32 North America Managed Security Services Market by Value, 2023-2033 (US$Bn, AGR (%), CAGR (%))
Table 33 North America Managed Security Services Market by Country, 2023-2033 (US$Bn, AGR (%), CAGR (%))
Table 34 North America Managed Security Services Market by Type, 2023-2033 (US$Bn, AGR (%), CAGR (%))
Table 35 North America Managed Security Services Market by Enterprises Size, 2023-2033 (US$Bn, AGR (%), CAGR (%))
Table 36 North America Managed Security Services Market by Solution Type, 2023-2033 (US$Bn, AGR (%), CAGR (%))
Table 37 North America Managed Security Services Market by Vertical, 2023-2033 (US$Bn, AGR (%), CAGR (%))
Table 38 North America Managed Security Services Market by Service Type, 2023-2033 (US$Bn, AGR (%), CAGR (%))
Table 39 US Managed Security Services Market by Value, 2023-2033 (US$Bn, AGR (%), CAGR (%))
Table 40 Canada Managed Security Services Market by Value, 2023-2033 (US$Bn, AGR (%), CAGR (%))
Table 41 Europe Managed Security Services Market by Value, 2023-2033 (US$Bn, AGR (%), CAGR (%))
Table 42 Europe Managed Security Services Market by Country, 2023-2033 (US$Bn, AGR (%), CAGR (%))
Table 43 Europe Managed Security Services Market by Type, 2023-2033 (US$Bn, AGR (%), CAGR (%))
Table 44 Europe Managed Security Services Market by Enterprises Size, 2023-2033 (US$Bn, AGR (%), CAGR (%))
Table 45 Europe Managed Security Services Market by Solution Type, 2023-2033 (US$Bn, AGR (%), CAGR (%))
Table 46 Europe Managed Security Services Market by Vertical, 2023-2033 (US$Bn, AGR (%), CAGR (%))
Table 47 Europe Managed Security Services Market by Service Type, 2023-2033 (US$Bn, AGR (%), CAGR (%))
Table 48 Germany Managed Security Services Market by Value, 2023-2033 (US$Bn, AGR (%), CAGR (%))
Table 49 UK Managed Security Services Market by Value, 2023-2033 (US$Bn, AGR (%), CAGR (%))
Table 50 France Managed Security Services Market by Value, 2023-2033 (US$Bn, AGR (%), CAGR (%))
Table 51 Italy Managed Security Services Market by Value, 2023-2033 (US$Bn, AGR (%), CAGR (%))
Table 52 Russia Managed Security Services Market by Value, 2023-2033 (US$Bn, AGR (%), CAGR (%))
Table 53 Rest of Europe Managed Security Services Market by Value, 2023-2033 (US$Bn, AGR (%), CAGR (%))
Table 54 Asia-Pacific Managed Security Services Market by Value, 2023-2033 (US$Bn, AGR (%), CAGR (%))
Table 55 Asia-Pacific Managed Security Services Market by Country, 2023-2033 (US$Bn, AGR (%), CAGR (%))
Table 56 Asia-Pacific Managed Security Services Market by Type, 2023-2033 (US$Bn, AGR (%), CAGR (%))
Table 57 Asia-Pacific Managed Security Services Market by Enterprises Size, 2023-2033 (US$Bn, AGR (%), CAGR (%))
Table 58 Asia-Pacific Managed Security Services Market by Solution Type, 2023-2033 (US$Bn, AGR (%), CAGR (%))
Table 59 Asia-Pacific Managed Security Services Market by Vertical, 2023-2033 (US$Bn, AGR (%), CAGR (%))
Table 60 Asia-Pacific Managed Security Services Market by Service Type, 2023-2033 (US$Bn, AGR (%), CAGR (%))
Table 61 China Managed Security Services Market by Value, 2023-2033 (US$Bn, AGR (%), CAGR (%))
Table 62 India Managed Security Services Market by Value, 2023-2033 (US$Bn, AGR (%), CAGR (%))
Table 63 Japan Managed Security Services Market by Value, 2023-2033 (US$Bn, AGR (%), CAGR (%))
Table 64 South Korea Managed Security Services Market by Value, 2023-2033 (US$Bn, AGR (%), CAGR (%))
Table 65 Australia Managed Security Services Market by Value, 2023-2033 (US$Bn, AGR (%), CAGR (%))
Table 66 Rest of Asia-Pacific Managed Security Services Market by Value, 2023-2033 (US$Bn, AGR (%), CAGR (%))
Table 67 Middle East & Africa Managed Security Services Market by Value, 2023-2033 (US$Bn, AGR (%), CAGR (%))
Table 68 Middle East & Africa Managed Security Services Market by Country, 2023-2033 (US$Bn, AGR (%), CAGR (%))
Table 69 Middle East & Africa Managed Security Services Market by Type, 2023-2033 (US$Bn, AGR (%), CAGR (%))
Table 70 Middle East & Africa Managed Security Services Market by Enterprises Size, 2023-2033 (US$Bn, AGR (%), CAGR (%))
Table 71 Middle East & Africa Managed Security Services Market by Solution Type, 2023-2033 (US$Bn, AGR (%), CAGR (%))
Table 72 Middle East & Africa Managed Security Services Market by Vertical, 2023-2033 (US$Bn, AGR (%), CAGR (%))
Table 73 Middle East & Africa Managed Security Services Market by Service Type, 2023-2033 (US$Bn, AGR (%), CAGR (%))
Table 74 GCC Managed Security Services Market by Value, 2023-2033 (US$Bn, AGR (%), CAGR (%))
Table 75 South Africa Managed Security Services Market by Value, 2023-2033 (US$Bn, AGR (%), CAGR (%))
Table 76 Rest of Middle East & Africa Managed Security Services Market by Value, 2023-2033 (US$Bn, AGR (%), CAGR (%))
Table 77 Latin America Managed Security Services Market by Value, 2023-2033 (US$Bn, AGR (%), CAGR (%))
Table 78 Latin America Managed Security Services Market by Country, 2023-2033 (US$Bn, AGR (%), CAGR (%))
Table 79 Latin America Managed Security Services Market by Type, 2023-2033 (US$Bn, AGR (%), CAGR (%))
Table 80 Latin America Managed Security Services Market by Enterprises Size, 2023-2033 (US$Bn, AGR (%), CAGR (%))
Table 81 Latin America Managed Security Services Market by Solution Type, 2023-2033 (US$Bn, AGR (%), CAGR (%))
Table 82 Latin America Managed Security Services Market by Vertical, 2023-2033 (US$Bn, AGR (%), CAGR (%))
Table 83 Latin America Managed Security Services Market by Service Type, 2023-2033 (US$Bn, AGR (%), CAGR (%))
Table 84 Brazil Managed Security Services Market by Value, 2023-2033 (US$Bn, AGR (%), CAGR (%))
Table 85 Mexico Managed Security Services Market by Value, 2023-2033 (US$Bn, AGR (%), CAGR (%))
Table 86 Rest of Latin America Managed Security Services Market by Value, 2023-2033 (US$Bn, AGR (%), CAGR (%))
Table 87 International Business Machines Corporation: Key Details, (CEO, HQ, Revenue, Founded, No. of Employees, Company Type, Website, Business Segment)
Table 88 International Business Machines Corporation: Product Benchmarking
Table 89 International Business Machines Corporation: Strategic Outlook
Table 90 AT&T Inc.: Key Details, (CEO, HQ, Revenue, Founded, No. of Employees, Company Type, Website, Business Segment)
Table 91 AT&T Inc.: Product Benchmarking
Table 92 AT&T Inc.: Strategic Outlook
Table 93 Nippon Telegraph and Telephone Corporation: Key Details, (CEO, HQ, Revenue, Founded, No. of Employees, Company Type, Website, Business Segment)
Table 94 Nippon Telegraph and Telephone Corporation: Product Benchmarking
Table 95 Nippon Telegraph and Telephone Corporation: Strategic Outlook
Table 96 Accenture plc: Key Details, (CEO, HQ, Revenue, Founded, No. of Employees, Company Type, Website, Business Segment)
Table 97 Accenture plc: Product Benchmarking
Table 98 Accenture plc: Strategic Outlook
Table 99 DXC Technology: Key Details, (CEO, HQ, Revenue, Founded, No. of Employees, Company Type, Website, Business Segment)
Table 100 DXC Technology: Product Benchmarking
Table 101 DXC Technology: Strategic Outlook
Table 102 Secureworks Inc.: Key Details, (CEO, HQ, Revenue, Founded, No. of Employees, Company Type, Website, Business Segment)
Table 103 Secureworks Inc.: Product Benchmarking
Table 104 Secureworks Inc.: Strategic Outlook
Table 105 Trustwave Holdings: Key Details, (CEO, HQ, Revenue, Founded, No. of Employees, Company Type, Website, Business Segment)
Table 106 Trustwave Holdings: Product Benchmarking
Table 107 Trustwave Holdings: Strategic Outlook
Table 108 Orange Cyberdefense: Key Details, (CEO, HQ, Revenue, Founded, No. of Employees, Company Type, Website, Business Segment)
Table 109 Orange Cyberdefense: Product Benchmarking
Table 110 Orange Cyberdefense: Strategic Outlook
Table 111 Fujitsu Limited: Key Details, (CEO, HQ, Revenue, Founded, No. of Employees, Company Type, Website, Business Segment)
Table 112 Fujitsu Limited: Product Benchmarking
Table 113 Fujitsu Limited: Strategic Outlook
Table 114 Kudelski Security: Key Details, (CEO, HQ, Revenue, Founded, No. of Employees, Company Type, Website, Business Segment)
Table 115 Kudelski Security: Product Benchmarking
Table 116 Kudelski Security: Strategic Outlook
Table 117 Proficio: Key Details, (CEO, HQ, Revenue, Founded, No. of Employees, Company Type, Website, Business Segment)
Table 118 Proficio: Product Benchmarking
Table 119 Proficio: Strategic Outlook
Table 120 CrowdStrike Holdings, Inc.: Key Details, (CEO, HQ, Revenue, Founded, No. of Employees, Company Type, Website, Business Segment)
Table 121 CrowdStrike Holdings, Inc.: Product Benchmarking
Table 122 CrowdStrike Holdings, Inc.: Strategic Outlook
Table 123 F5, Inc: Key Details, (CEO, HQ, Revenue, Founded, No. of Employees, Company Type, Website, Business Segment)
Table 124 F5, Inc: Product Benchmarking
Table 125 F5, Inc: Strategic Outlook
Table 126 Capgemini SE: Key Details, (CEO, HQ, Revenue, Founded, No. of Employees, Company Type, Website, Business Segment)
Table 127 Capgemini SE: Product Benchmarking
Table 128 Capgemini SE: Strategic Outlook
Table 129 Kroll Inc.: Key Details, (CEO, HQ, Revenue, Founded, No. of Employees, Company Type, Website, Business Segment)
Table 130 Kroll Inc.: Product Benchmarking
Table 131 Kroll Inc.: Strategic Outlook
List of Figures
Figure 1 Managed Security Services Market Segmentation
Figure 2 Managed Security Services Market by Type: Market Attractiveness Index
Figure 3 Managed Security Services Market by Enterprises Size: Market Attractiveness Index
Figure 4 Managed Security Services Market by Solution Type: Market Attractiveness Index
Figure 5 Managed Security Services Market by Vertical: Market Attractiveness Index
Figure 6 Managed Security Services Market by Service Type: Market Attractiveness Index
Figure 7 Managed Security Services Market Attractiveness Index by Region
Figure 8 Managed Security Services Market: Market Dynamics
Figure 9 Managed Security Services Market by Region, 2023-2033 (US$Bn, AGR (%)) (V-Shaped Recovery Scenario)
Figure 10 Managed Security Services Market by Region, 2023-2033 (US$Bn, AGR (%)) (W-Shaped Recovery Scenario)
Figure 11 Managed Security Services Market by Region, 2023-2033 (US$Bn, AGR (%)) (U-Shaped Recovery Scenario)
Figure 12 Managed Security Services Market by Region, 2023-2033 (US$Bn, AGR (%)) (L-Shaped Recovery Scenario)
Figure 13 Managed Security Services Market: Porter’s Five Forces Analysis
Figure 14 Managed Security Services Market by Type: Market Attractiveness Index
Figure 15 Managed Security Services Market by Type, 2023-2033 (US$Bn, AGR (%))
Figure 16 Fully Managed Security Services Market by Region, 2023-2033 (US$Bn, AGR (%))
Figure 17 Fully Managed Security Services Segment Market Share Forecast by Region, 2023 & 2033 (%)
Figure 18 Co-managed Security Services Market by Region, 2023-2033 (US$Bn, AGR (%))
Figure 19 Co-managed Security Services Segment Market Share Forecast by Region, 2023 & 2033 (%)
Figure 20 Managed Security Services Market by Enterprises Size: Market Attractiveness Index
Figure 21 Managed Security Services Market by Enterprises Size, 2023-2033 (US$Bn, AGR (%))
Figure 22 Large Enterprises Market by Region, 2023-2033 (US$Bn, AGR (%))
Figure 23 Large Enterprises Segment Market Share Forecast by Region, 2023 & 2033 (%)
Figure 24 Medium-sized Enterprises Market by Region, 2023-2033 (US$Bn, AGR (%))
Figure 25 Medium-sized Enterprises Segment Market Share Forecast by Region, 2023 & 2033 (%)
Figure 26 Small-sized Enterprises Market by Region, 2023-2033 (US$Bn, AGR (%))
Figure 27 Small-sized Enterprises Segment Market Share Forecast by Region, 2023 & 2033 (%)
Figure 28 Managed Security Services Market by Solution Type: Market Attractiveness Index
Figure 29 Managed Security Services Market by Solution Type, 2023-2033 (US$Bn, AGR (%))
Figure 30 Intrusion Detection and Prevention Market by Region, 2023-2033 (US$Bn, AGR (%))
Figure 31 Intrusion Detection and Prevention Segment Market Share Forecast by Region, 2023 & 2033 (%)
Figure 32 Threat Prevention Market by Region, 2023-2033 (US$Bn, AGR (%))
Figure 33 Threat Prevention Segment Market Share Forecast by Region, 2023 & 2033 (%)
Figure 34 Distributed Denial of Services Market by Region, 2023-2033 (US$Bn, AGR (%))
Figure 35 Distributed Denial of Services Segment Market Share Forecast by Region, 2023 & 2033 (%)
Figure 36 Other Solution Type Market by Region, 2023-2033 (US$Bn, AGR (%))
Figure 37 Other Solution Type Segment Market Share Forecast by Region, 2023 & 2033 (%)
Figure 38 Managed Security Services Market by Vertical: Market Attractiveness Index
Figure 39 Managed Security Services Market by Vertical, 2023-2033 (US$Bn, AGR (%))
Figure 40 BFSI Market by Region, 2023-2033 (US$Bn, AGR (%))
Figure 41 BFSI Segment Market Share Forecast by Region, 2023 & 2033 (%)
Figure 42 Healthcare Market by Region, 2023-2033 (US$Bn, AGR (%))
Figure 43 Healthcare Segment Market Share Forecast by Region, 2023 & 2033 (%)
Figure 44 Manufacturing Market by Region, 2023-2033 (US$Bn, AGR (%))
Figure 45 Manufacturing Segment Market Share Forecast by Region, 2023 & 2033 (%)
Figure 46 Telecom & IT Market by Region, 2023-2033 (US$Bn, AGR (%))
Figure 47 Telecom & IT Segment Market Share Forecast by Region, 2023 & 2033 (%)
Figure 48 Other Vertical Market by Region, 2023-2033 (US$Bn, AGR (%))
Figure 49 Other Vertical Segment Market Share Forecast by Region, 2023 & 2033 (%)
Figure 50 Managed Security Services Market by Service Type: Market Attractiveness Index
Figure 51 Managed Security Services Market by Service Type, 2023-2033 (US$Bn, AGR%))
Figure 52 Managed IAM Market by Region, 2023-2033 (US$Bn, AGR (%))
Figure 53 Managed IAM Segment Market Share Forecast by Region, 2023 & 2033 (%)
Figure 54 Managed Vulnerability Management Market by Region, 2023-2033 (US$Bn, AGR (%))
Figure 55 Managed Vulnerability Management Segment Market Share Forecast by Region, 2023 & 2033 (%)
Figure 56 Managed Risk and Compliance Market by Region, 2023-2033 (US$Bn, AGR (%))
Figure 57 Managed Risk and Compliance Segment Market Share Forecast by Region, 2023 & 2033 (%)
Figure 58 Managed Detection and Response Market by Region, 2023-2033 (US$Bn, AGR (%))
Figure 59 Managed Detection and Response Segment Market Share Forecast by Region, 2023 & 2033 (%)
Figure 60 Managed SIEM and Log Management Market by Region, 2023-2033 (US$Bn, AGR (%))
Figure 61 Managed SIEM and Log Management Segment Market Share Forecast by Region, 2023 & 2033 (%)
Figure 62 Other Service Type Market by Region, 2023-2033 (US$Bn, AGR (%))
Figure 63 Other Service Type Segment Market Share Forecast by Region, 2023 & 2033 (%)
Figure 64 Managed Security Services Market Forecast by Region 2023 and 2033 (Revenue, CAGR%)
Figure 65 Managed Security Services Market by Region, 2023-2033 (US$Bn, AGR (%)
Figure 66 North America Managed Security Services Market Attractiveness Index
Figure 67 North America Managed Security Services Market by Region, 2023, 2028 & 2033 (US$Billion)
Figure 68 North America Managed Security Services Market by Value, 2023-2033 (US$Bn, AGR (%))
Figure 69 North America Managed Security Services Market by Country, 2023-2033 (US$Bn, AGR (%))
Figure 70 North America Managed Security Services Market Share Forecast by Country, 2023 & 2033 (%)
Figure 71 North America Managed Security Services Market by Type, 2023-2033 (US$Bn, AGR (%))
Figure 72 North America Managed Security Services Market Share Forecast by Type, 2023 & 2033 (%)
Figure 73 North America Managed Security Services Market by Enterprises Size, 2023-2033 (US$Bn, AGR (%))
Figure 74 North America Managed Security Services Market Share Forecast by Enterprises Size, 2023 & 2033 (%)
Figure 75 North America Managed Security Services Market by Solution Type, 2023-2033 (US$Bn, AGR (%))
Figure 76 North America Managed Security Services Market Share Forecast by Solution Type, 2023 & 2033 (%)
Figure 77 North America Managed Security Services Market by Vertical, 2023-2033 (US$Bn, AGR (%))
Figure 78 North America Managed Security Services Market Share Forecast by Vertical, 2023 & 2033 (%)
Figure 79 North America Managed Security Services Market by Service Type, 2023-2033 (US$Bn, AGR (%))
Figure 80 North America Managed Security Services Market Share Forecast by Service Type, 2023 & 2033 (%)
Figure 81 US Managed Security Services Market by Value, 2023-2033 (US$Bn, AGR (%))
Figure 82 Canada Managed Security Services Market by Value, 2023-2033 (US$Bn, AGR (%))
Figure 83 Europe Managed Security Services Market Attractiveness Index
Figure 84 Europe Managed Security Services Market by Region, 2023, 2028 & 2033 (US$Billion)
Figure 85 Europe Managed Security Services Market by Value, 2023-2033 (US$Bn, AGR (%))
Figure 86 Europe Managed Security Services Market by Country, 2023-2033 (US$Bn, AGR (%))
Figure 87 Europe Managed Security Services Market Share Forecast by Country, 2023 & 2033 (%)
Figure 88 Europe Managed Security Services Market by Type, 2023-2033 (US$Bn, AGR (%))
Figure 89 Europe Managed Security Services Market Share Forecast by Type, 2023 & 2033 (%)
Figure 90 Europe Managed Security Services Market by Enterprises Size, 2023-2033 (US$Bn, AGR (%))
Figure 91 Europe Managed Security Services Market Share Forecast by Enterprises Size, 2023 & 2033 (%)
Figure 92 Europe Managed Security Services Market by Solution Type, 2023-2033 (US$Bn, AGR (%))
Figure 93 Europe Managed Security Services Market Share Forecast by Solution Type, 2023 & 2033 (%)
Figure 94 Europe Managed Security Services Market by Vertical, 2023-2033 (US$Bn, AGR (%))
Figure 95 Europe Managed Security Services Market Share Forecast by Vertical, 2023 & 2033 (%)
Figure 96 Europe Managed Security Services Market by Service Type, 2023-2033 (US$Bn, AGR (%))
Figure 97 Europe Managed Security Services Market Share Forecast by Service Type, 2023 & 2033 (%)
Figure 98 Germany Managed Security Services Market by Value, 2023-2033 (US$Bn, AGR (%))
Figure 99 UK Managed Security Services Market by Value, 2023-2033 (US$Bn, AGR (%))
Figure 100 France Managed Security Services Market by Value, 2023-2033 (US$Bn, AGR (%))
Figure 101 Italy Managed Security Services Market by Value, 2023-2033 (US$Bn, AGR (%))
Figure 102 Russia Managed Security Services Market by Value, 2023-2033 (US$Bn, AGR (%))
Figure 103 Rest of Europe Managed Security Services Market by Value, 2023-2033 (US$Bn, AGR (%))
Figure 104 Asia-Pacific Managed Security Services Market Attractiveness Index
Figure 105 Asia-Pacific Managed Security Services Market by Region, 2023, 2028 & 2033 (US$Billion)
Figure 106 Asia-Pacific Managed Security Services Market by Value, 2023-2033 (US$Bn, AGR (%))
Figure 107 Asia-Pacific Managed Security Services Market by Country, 2023-2033 (US$Bn, AGR (%))
Figure 108 Asia-Pacific Managed Security Services Market Share Forecast by Country, 2023 & 2033 (%)
Figure 109 Asia-Pacific Managed Security Services Market by Type, 2023-2033 (US$Bn, AGR (%))
Figure 110 Asia-Pacific Managed Security Services Market Share Forecast by Type, 2023 & 2033 (%)
Figure 111 Asia-Pacific Managed Security Services Market by Enterprises Size, 2023-2033 (US$Bn, AGR (%))
Figure 112 Asia-Pacific Managed Security Services Market Share Forecast by Enterprises Size, 2023 & 2033 (%)
Figure 113 Asia-Pacific Managed Security Services Market by Solution Type, 2023-2033 (US$Bn, AGR (%))
Figure 114 Asia-Pacific Managed Security Services Market Share Forecast by Solution Type, 2023 & 2033 (%)
Figure 115 Asia-Pacific Managed Security Services Market by Vertical, 2023-2033 (US$Bn, AGR (%))
Figure 116 Asia-Pacific Managed Security Services Market Share Forecast by Vertical, 2023 & 2033 (%)
Figure 117 Asia-Pacific Managed Security Services Market by Service Type, 2023-2033 (US$Bn, AGR (%))
Figure 118 Asia-Pacific Managed Security Services Market Share Forecast by Service Type, 2023 & 2033 (%)
Figure 119 China Managed Security Services Market by Value, 2023-2033 (US$Bn, AGR (%))
Figure 120 India Managed Security Services Market by Value, 2023-2033 (US$Bn, AGR (%))
Figure 121 Japan Managed Security Services Market by Value, 2023-2033 (US$Bn, AGR (%))
Figure 122 South Korea Managed Security Services Market by Value, 2023-2033 (US$Bn, AGR (%))
Figure 123 Australia Managed Security Services Market by Value, 2023-2033 (US$Bn, AGR (%))
Figure 124 Rest of Asia-Pacific Managed Security Services Market by Value, 2023-2033 (US$Bn, AGR (%))
Figure 125 Middle East & Africa Managed Security Services Market Attractiveness Index
Figure 126 Middle East & Africa Managed Security Services Market by Region, 2023, 2028 & 2033 (US$Billion)
Figure 127 Middle East & Africa Managed Security Services Market by Value, 2023-2033 (US$Bn, AGR (%))
Figure 128 Middle East & Africa Managed Security Services Market by Country, 2023-2033 (US$Bn, AGR (%))
Figure 129 Middle East & Africa Managed Security Services Market Share Forecast by Country, 2023 & 2033 (%)
Figure 130 Middle East & Africa Managed Security Services Market by Type, 2023-2033 (US$Bn, AGR (%))
Figure 131 Middle East & Africa Managed Security Services Market Share Forecast by Type, 2023 & 2033 (%)
Figure 132 Middle East & Africa Managed Security Services Market by Enterprises Size, 2023-2033 (US$Bn, AGR (%))
Figure 133 Middle East & Africa Managed Security Services Market Share Forecast by Enterprises Size, 2023 & 2033 (%)
Figure 134 Middle East & Africa Managed Security Services Market by Solution Type, 2023-2033 (US$Bn, AGR (%))
Figure 135 Middle East & Africa Managed Security Services Market Share Forecast by Solution Type, 2023 & 2033 (%)
Figure 136 Middle East & Africa Managed Security Services Market by Vertical, 2023-2033 (US$Bn, AGR (%))
Figure 137 Middle East & Africa Managed Security Services Market Share Forecast by Vertical, 2023 & 2033 (%)
Figure 138 Middle East & Africa Managed Security Services Market by Service Type, 2023-2033 (US$Bn, AGR (%))
Figure 139 Middle East & Africa Managed Security Services Market Share Forecast by Service Type, 2023 & 2033 (%)
Figure 140 GCC Managed Security Services Market by Value, 2023-2033 (US$Bn, AGR (%))
Figure 141 South Africa Managed Security Services Market by Value, 2023-2033 (US$Bn, AGR (%))
Figure 142 Rest of Middle East & Africa Managed Security Services Market by Value, 2023-2033 (US$Bn, AGR (%))
Figure 143 Latin America Managed Security Services Market Attractiveness Index
Figure 144 Latin America Managed Security Services Market by Region, 2023, 2028 & 2033 (US$Billion)
Figure 145 Latin America Managed Security Services Market by Value, 2023-2033 (US$Bn, AGR (%))
Figure 146 Latin America Managed Security Services Market by Country, 2023-2033 (US$Bn, AGR (%))
Figure 147 Latin America Managed Security Services Market Share Forecast by Country, 2023 & 2033 (%)
Figure 148 Latin America Managed Security Services Market by Type, 2023-2033 (US$Bn, AGR (%))
Figure 149 Latin America Managed Security Services Market Share Forecast by Type, 2023 & 2033 (%)
Figure 150 Latin America Managed Security Services Market by Enterprises Size, 2023-2033 (US$Bn, AGR (%))
Figure 151 Latin America Managed Security Services Market Share Forecast by Enterprises Size, 2023 & 2033 (%)
Figure 152 Latin America Managed Security Services Market by Solution Type, 2023-2033 (US$Bn, AGR (%))
Figure 153 Latin America Managed Security Services Market Share Forecast by Solution Type, 2023 & 2033 (%)
Figure 154 Latin America Managed Security Services Market by Vertical, 2023-2033 (US$Bn, AGR (%))
Figure 155 Latin America Managed Security Services Market Share Forecast by Vertical, 2023 & 2033 (%)
Figure 156 Latin America Managed Security Services Market by Service Type, 2023-2033 (US$Bn, AGR (%))
Figure 157 Latin America Managed Security Services Market Share Forecast by Service Type, 2023 & 2033 (%)
Figure 158 Brazil Managed Security Services Market by Value, 2023-2033 (US$Bn, AGR (%))
Figure 159 Mexico Managed Security Services Market by Value, 2023-2033 (US$Bn, AGR (%))
Figure 160 Rest of Latin America Managed Security Services Market by Value, 2023-2033 (US$Bn, AGR (%))
Figure 161 Managed Security Services Market: Company Share, 2022
Figure 162 International Business Machines Corporation: Net Revenue, 2018-2022 (US$million, AGR%)
Figure 163 International Business Machines Corporation: R&D, 2018-2022 (US$million, AGR%)
Figure 164 International Business Machines Corporation: Regional Revenue Shares, 2022 (%)
Figure 165 International Business Machines Corporation: Business Segment Revenue Shares, 2022 (%)
Figure 166 AT&T Inc.: Net Revenue, 2018-2022 (US$million, AGR%)
Figure 167 AT&T Inc.: Regional Revenue Shares, 2022 (%)
Figure 168 AT&T Inc.: Business Segment Revenue Shares, 2022 (%)
Figure 169 Nippon Telegraph and Telephone Corporation: Net Revenue, 2018-2022 (US$million, AGR%)
Figure 170 Nippon Telegraph and Telephone Corporation: R&D, 2018-2022 (US$million, AGR%)
Figure 171 Nippon Telegraph and Telephone Corporation: Business Segment Revenue Shares, 2022 (%)
Figure 172 Accenture plc: Net Revenue, 2018-2022 (US$million, AGR%)
Figure 173 Accenture plc: R&D, 2018-2022 (US$million, AGR%)
Figure 174 Accenture plc: Regional Revenue Shares, 2022 (%)
Figure 175 DXC Technology: Net Revenue, 2018-2022 (US$million, AGR%)
Figure 176 DXC Technology: Regional Revenue Shares, 2022 (%)
Figure 177 DXC Technology: Business Segment Revenue Shares, 2022 (%)
Figure 178 Secureworks Inc.: Net Revenue, 2018-2022 (US$million, AGR%)
Figure 179 Secureworks Inc.: R&D, 2018-2022 (US$million, AGR%)
Figure 180 Secureworks Inc.: Business Segment Revenue Shares, 2022 (%)
Figure 181 Fujitsu Limited: Net Revenue, 2018-2022 (US$million, AGR%)
Figure 182 Fujitsu Limited: R&D, 2018-2022 (US$million, AGR%)
Figure 183 Fujitsu Limited: Regional Revenue Shares, 2022 (%)
Figure 184 Fujitsu Limited: Business Segment Revenue Shares, 2022 (%)
Figure 185 CrowdStrike Holdings, Inc.: Net Revenue, 2018-2022 (US$million, AGR%)
Figure 186 CrowdStrike Holdings, Inc.: R&D, 2018-2022 (US$million, AGR%)
Figure 187 CrowdStrike Holdings, Inc.: Business Segment Revenue Shares, 2022 (%)
Figure 188 F5, Inc: Net Revenue, 2018-2022 (US$million, AGR%)
Figure 189 F5, Inc: R&D, 2018-2022 (US$million, AGR%)
Figure 190 F5, Inc: Regional Revenue Shares, 2022 (%)
Figure 191 Capgemini SE: Net Revenue, 2018-2022 (US$million, AGR%)
Figure 192 Capgemini SE: Regional Revenue Shares, 2022 (%)
Figure 193 Capgemini SE: Business Segment Revenue Shares, 2022 (%)
ページTOPに戻る
よくあるご質問
Visiongain社はどのような調査会社ですか?
英国の調査会社ヴィジョンゲイン社(Visiongain)は、通信とエネルギーのほか、自動車や化学・医薬品、金属など、広範な市場を対象に調査を行っています。自動車市場については、市場全般に関する調査のほ... もっと見る
調査レポートの納品までの日数はどの程度ですか?
在庫のあるものは速納となりますが、平均的には 3-4日と見て下さい。
但し、一部の調査レポートでは、発注を受けた段階で内容更新をして納品をする場合もあります。
発注をする前のお問合せをお願いします。
注文の手続きはどのようになっていますか?
1)お客様からの御問い合わせをいただきます。
2)見積書やサンプルの提示をいたします。
3)お客様指定、もしくは弊社の発注書をメール添付にて発送してください。
4)データリソース社からレポート発行元の調査会社へ納品手配します。
5) 調査会社からお客様へ納品されます。最近は、pdfにてのメール納品が大半です。
お支払方法の方法はどのようになっていますか?
納品と同時にデータリソース社よりお客様へ請求書(必要に応じて納品書も)を発送いたします。
お客様よりデータリソース社へ(通常は円払い)の御振り込みをお願いします。
請求書は、納品日の日付で発行しますので、翌月最終営業日までの当社指定口座への振込みをお願いします。振込み手数料は御社負担にてお願いします。
お客様の御支払い条件が60日以上の場合は御相談ください。
尚、初めてのお取引先や個人の場合、前払いをお願いすることもあります。ご了承のほど、お願いします。
データリソース社はどのような会社ですか?
当社は、世界各国の主要調査会社・レポート出版社と提携し、世界各国の市場調査レポートや技術動向レポートなどを日本国内の企業・公官庁及び教育研究機関に提供しております。
世界各国の「市場・技術・法規制などの」実情を調査・収集される時には、データリソース社にご相談ください。
お客様の御要望にあったデータや情報を抽出する為のレポート紹介や調査のアドバイスも致します。
|
|

