デジタルツインと予知保全市場レポート:2024-2024
Digital Twins and Predictive Maintenance Market Report 2024-2024
レポート詳細
デジタルツインズと予知保全市場レポート 2024-2034年: この調査レポートは、業界とその基礎となるダイナミクスをより良く理解することを望むなら、新たな収益ポケットを目指す大手企... もっと見る
※上記価格は部署ライセンス(Departmental licence)価格です。
その他の価格についてはデータリソースまでお問合せください。
日本語のページは自動翻訳を利用し作成しています。
実際のレポートは英文のみでご納品いたします。

|

|
サマリー
レポート詳細
デジタルツインズと予知保全市場レポート 2024-2034年:この調査レポートは、業界とその基礎となるダイナミクスをより良く理解することを望むなら、新たな収益ポケットを目指す大手企業にとって貴重なものとなるでしょう。また、異業種への進出や新規地域での既存事業の拡大を目指す企業にも有用です。
デジタルツインと予知保全市場は技術の進歩に牽引され急成長を遂げる
デジタルツインと予知保全市場は、技術の進歩、IoTソリューションの採用拡大、さまざまな業種におけるダウンタイムの最小化と業務効率の向上に対するニーズの高まりによって、力強い成長を遂げている。物理的な資産やシステムを仮想的に表現できるデジタルツイン技術は、予知保全技術と相まって、組織が資産や運用を管理する方法に革命をもたらしている。
デジタルツインと予知保全市場の主な推進要因の1つは、計画外のダウンタイムを削減し、保全スケジュールを最適化する需要の高まりである。製造業、エネルギー、自動車、航空宇宙、ヘルスケアなどの業界では、デジタルツイン技術と予知保全ソリューションを活用して、潜在的な問題を未然に特定し、コストのかかる故障に拡大する前に対処する動きが加速している。さらに、IoTセンサーや接続されたデバイスの普及により、膨大な量のデータが生成され、資産のパフォーマンスと健全性に関する貴重な洞察を組織に提供しています。
同市場は、デジタルツインと予知保全ソリューションを提供するベンダーにとって、提供製品を拡大し、多様な業界のニーズに対応する大きな機会を提供している。企業が資産パフォーマンスの向上、メンテナンスコストの削減、業務効率の強化に努める中、高度な分析、機械学習、AIを活用した予知保全ソリューションへの需要が高まっている。さらに、デジタルツインと拡張現実(AR)や仮想現実(VR)などの新技術の統合は、没入型かつインタラクティブなメンテナンス体験の新たな機会をもたらす。
デジタルツイン技術導入に必要な高額資本が市場成長の妨げに
インフラプロジェクトにおけるデジタルツイン・テクノロジーの導入は、その展開に必要な資本要件が高いため、大きなハードルに直面している。デジタルツイン技術は、インフラ整備に革命をもたらし、効率性、公平性、回復力といった進化するニーズに応える可能性を秘めているにもかかわらず、必要な先行投資が市場成長への課題となっている。社会の基幹サービスに対する需要がインフラ容量を上回る時代において、各国政府は、緊縮する公共予算とサプライチェーンの圧力の中で、革新的な解決策を見出す必要に迫られている。
市場調査レポートを購入する前にすべき質問とは?
-
デジタルツインと予知保全市場はどのように進化しているのか?
-
デジタルツインと予知保全市場を促進し、抑制しているものは何か?
-
デジタルツインと予知保全の各サブマーケットは予測期間中にどのように成長し、2034年にはどれくらいの収益を占めるようになるのか?
-
2024年から2034年にかけて、デジタルツインと予知保全の各サブマーケットの市場シェアはどのように推移するのか?
-
2024年から2034年にかけて、市場全体を牽引する主な要因は何か?
-
デジタルツインと予知保全の主要市場は、マクロ経済の動きに幅広く追随するのだろうか、それとも個々の国の市場が他を凌駕するのだろうか。
-
2034年までに各国市場のシェアはどのように変化し、どの地域が2034年の市場をリードするのか。
-
主要プレーヤーと予測期間中の見通しは?
-
これらの大手企業におけるデジタルツインと予知保全プロジェクトとは?
-
2024年から2034年の間に、業界はどのように進化するのか?デジタルツインと予知保全プロジェクトは、現在、そして今後10年間でどのような意味を持つのか?
-
デジタルツインと予知保全の市場をさらに拡大するために、製品化の必要性は高まっているのでしょうか?
-
デジタルツインと予知保全の市場はどこに向かっているのか。
-
新商品や新サービスに最適な投資方法とは?
-
企業を新たな成長軌道に乗せ、C-suiteに移行させるための重要な展望とは?
デジタルツインと予知保全の市場が現在、そして今後10年間でどのような影響を受けるかを知る必要がある:
-
130の表と223の図表で構成される437ページのレポート。
-
本レポートでは、業界における主要な有利分野を取り上げているため、今すぐターゲットを絞ることができる。
-
世界、地域、国の売上高と成長に関する詳細な分析が含まれている。
-
競合他社が成功した主なトレンド、変化、収益予測をハイライトします。
本レポートは、デジタルツインと予知保全市場が今後10年間、COVID-19の景気後退と好転の変動に合わせてどのように発展するかをTODAYでお伝えします。この市場は過去10年間のどの時点よりも今が重要である。
2034年までの予測やその他の分析から、商業的な展望が明らかになる
-
2034年までの収益予測に加え、最近の実績、成長率、市場シェアも提供している。
-
ビジネスの展望や展開など、独自の分析が掲載されている。
-
定性的分析(市場ダイナミクス、促進要因、機会、阻害要因、課題を含む)、コスト構造、デジタルツインや予知保全価格の上昇による影響、最近の動向についてご覧いただけます。
本レポートには、COVID-19が業界と貴社にどのような影響を与えるかについてのデータ分析と貴重な洞察が含まれている。本レポートでは、COVID-19の4つの回収パターンとその影響、すなわち「V」、「L」、「W」、「U」について論じている。
レポート対象セグメント
技術別市場セグメント
コンポーネント別市場セグメント
DT技術別市場セグメント
-
バーチャル・プロトタイプ
-
製品ツイン
-
プロセス・ツイン
-
ツインシステム
PM技術別市場セグメント
-
コンディション・モニタリング
-
データ分析
-
機械学習
-
人工知能
-
予後診断
産業別市場セグメント
-
製造業
-
エネルギーと公益事業
-
自動車
-
航空宇宙・防衛
-
ヘルスケア
-
その他の事業
世界市場全体とセグメント別の収益予測に加え、4つの地域と20の主要国市場の収益予測も掲載しています:
北米
欧州
-
ドイツ
-
スペイン
-
イギリス
-
フランス
-
イタリア
-
その他の欧州
アジア太平洋
-
中国
-
日本
-
インド
-
オーストラリア
-
韓国
-
その他のアジア太平洋
ラテンアメリカ
中東・アフリカ
また、2024年から2034年までのデジタルツインと予知保全市場の主要企業のプロファイルも掲載している。
報告書に掲載されている主要企業
-
ABB Ltd
-
Ansys, Inc.
-
Aspen Technology, Inc.
-
Autodesk, Inc.
-
Cisco Systems, Inc.
-
Dassault Systèmes SE
-
General Electric Company
-
Hitachi, Ltd
-
Honeywell International Inc.
-
International Business Machines Corporation
-
Microsoft Corporation
-
Rockwell Automation, Inc.
-
SAP SE
-
Schneider Electric SE
-
Siemens AG
デジタルツインと予知保全市場の2024年から2034年までの世界全体の売上高(金額ベース)は、2024年に346億米ドルを突破する。2034年まで収益は力強く成長すると予測している。当調査では、最も大きな可能性を秘めた組織を特定しています。彼らの能力、進歩、商業的展望を発見し、あなたが一歩先を行くのを支援します。
デジタルツインと予知保全市場、2024〜2034年』レポートはどのようにお役に立つでしょうか?
要約すると、430ページを超えるこのレポートは、以下のような知識を提供する:
-
デジタルツインズと予知保全市場の2024年から2034年までの収益予測 技術、コンポーネント、DT技術、PM技術、業種別に、それぞれ世界レベルと地域レベルで予測 - 業界の将来性を発見し、投資と収益に最も有利な場所を見つけます。
-
4つの地域と20の主要国市場の2034年までの収益予測 - 北米、ヨーロッパ、アジア太平洋、ラテンアメリカ、中東&アフリカのデジタルツインと予知保全市場の2024年から2034年までの市場予測をご覧ください。また、米国、カナダ、ブラジル、ドイツ、フランス、英国、イタリア、中国、インド、日本、オーストラリアなどの著名経済圏の市場も予測しています。
-
2024年から2034年までのデジタルツインと予知保全市場に関わる主要企業15社の企業プロファイルを含む。
独自の予測による定量的・定性的分析をご覧ください。私たちのレポートだけに含まれる情報を入手し、貴重なビジネスインテリジェンスで情報を得ることができます。
他にはない情報
私たちの新しいレポートがあれば、知識に遅れをとったり、チャンスを逃したりする可能性が低くなります。Visiongainの調査レポートが貴社の調査、分析、意思決定にどのように役立つかをご覧ください。Visiongainの調査は、デジタルツインと予知保全市場、2024年から2034年、市場をリードする企業の商業分析を必要とするすべての人のためのものです。データ、トレンド、予測をご覧いただけます。
ページTOPに戻る
目次
1 レポート概要
1.1 調査の目的
1.2 デジタルツインと予知保全市場の紹介
1.3 本レポートの内容
1.4 本レポートを読むべき理由
1.5 本分析レポートが回答する主な質問
1.6 本レポートの対象者
1.7 方法論
1.7.1 市場の定義
1.7.2 市場評価・予測手法
1.7.3 データの検証
1.7.3.1 一次調査
1.7.3.2 セカンダリーリサーチ
1.8 よくある質問(FAQ)
1.9 Visiongainの関連レポート
1.10 Visiongainについて
2 エグゼクティブ・サマリー
3 市場概要
3.1 主要な調査結果
3.2 市場ダイナミクス
3.2.1 市場牽引要因
3.2.1.1 予知保全への関心の高まりが市場成長を牽引
3.2.1.2 医療業界からのデジタルツイン技術に対する需要の急増
3.2.1.3 予知保全におけるAIと機械学習
3.2.2 市場抑制要因
3.2.2.1 デジタルツイン技術導入のための高額な資本要件が市場成長の阻害要因
3.2.2.2 デジタル・ツイン技術がサイバー攻撃を受けやすいことが市場成長を妨げる
3.2.2.3 熟練労働者の不足が市場成長を妨げる
3.2.3 市場機会
3.2.3.1 人間が管理するデジタルツインの開発が市場成長の機会
3.2.3.2 市場プレイヤー間のコラボレーションとパートナーシップの機会
3.2.3.3 市場とビジネスの拡大 市場プレーヤーにとっての機会
3.3 ポーターのファイブフォース分析
3.3.1 サプライヤーの交渉力(中)
3.3.2 買い手の交渉力(中〜高)
3.3.3 競争力(中~高)
3.3.4 代替品による脅威(低)
3.3.5 新規参入企業の脅威(高)
3.4 COVID-19の影響分析
3.4.1 "V字型回復"
3.4.2 "U字型回復"
3.4.3 "W字型回復"
3.4.4 "L字型回復"
3.5 PEST分析
4 デジタルツインと予知保全市場分析:技術別
4.1 主要な調査結果
4.2 技術セグメント 市場魅力度指数
4.3 デジタルツインと予知保全の技術別市場規模推定と予測
4.4 デジタルツイン技術
4.4.1 2024〜2034年の地域別市場規模(US$ Billion)
4.4.2 地域別市場シェア、2024年・2034年(%)
4.5 予知保全技術
4.5.1 2024〜2034年の地域別市場規模(US$ Billion)
4.5.2 地域別市場シェア、2024年・2034年(%)
5 デジタルツインと予知保全市場分析:コンポーネント別
5.1 主要調査結果
5.2 コンポーネントセグメント 市場魅力度指数
5.3 デジタルツインと予知保全のコンポーネント別市場規模推定と予測
5.4 テクノロジー
5.4.1 2024〜2034年の地域別市場規模(US$ Billion)
5.4.2 地域別市場シェア、2024年・2034年(%)
5.5 ソリューション
5.5.1 2024〜2034年の地域別市場規模(US$ Billion)
5.5.2 地域別市場シェア、2024年・2034年(%)
5.6 サービス
5.6.1 2024〜2034年の地域別市場規模(US$ Billion)
5.6.2 地域別市場シェア、2024年・2034年(%)
6 デジタルツインと予知保全市場分析:DT技術別
6.1 主要調査結果
6.2 DT技術セグメント 市場魅力度指数
6.3 デジタルツインと予知保全のDT技術別市場規模推定と予測
6.4 仮想プロトタイプ
6.4.1 2024〜2034年の地域別市場規模(US$ Billion)
6.4.2 地域別市場シェア、2024年・2034年(%)
6.5 プロダクトツイン
6.5.1 2024〜2034年の地域別市場規模(US$ Billion)
6.5.2 地域別市場シェア、2024年・2034年(%)
6.6 プロセスツイン
6.6.1 2024〜2034年の地域別市場規模(US$ Billion)
6.6.2 地域別市場シェア、2024年・2034年(%)
6.7 システムツイン
6.7.1 2024〜2034年の地域別市場規模(US$ Billion)
6.7.2 地域別市場シェア、2024年・2034年(%)
7 デジタルツインと予知保全市場分析:PM技術別
7.1 主要な調査結果
7.2 PM技術セグメント 市場魅力度指数
7.3 PM技術別のデジタルツインと予知保全市場規模の推定と予測
7.4 コンディションモニタリング
7.4.1 2024〜2034年の地域別市場規模(US$ Billion)
7.4.2 地域別市場シェア、2024年・2034年(%)
7.5 データ分析
7.5.1 2024〜2034年の地域別市場規模(US$ Billion)
7.5.2 地域別市場シェア、2024年・2034年(%)
7.6 機械学習
7.6.1 2024〜2034年の地域別市場規模(US$ Billion)
7.6.2 地域別市場シェア、2024年・2034年(%)
7.7 人工知能
7.7.1 2024〜2034年の地域別市場規模(US$ Billion)
7.7.2 地域別市場シェア、2024年・2034年(%)
7.8 プログノスティックス
7.8.1 2024〜2034年の地域別市場規模(US$ Billion)
7.8.2 地域別市場シェア、2024年・2034年(%)
8 デジタルツインと予知保全市場分析:産業分野別
8.1 主要調査結果
8.2 産業分野別セグメント: 市場魅力度指数
8.3 産業分野別デジタルツインと予知保全市場規模の推定と予測
8.4 製造業
8.4.1 2024〜2034年の地域別市場規模(US$ Million)
8.4.2 地域別市場シェア、2024年・2034年(%)
8.5 エネルギー・公益事業
8.5.1 2024〜2034年の地域別市場規模(US$ Million)
8.5.2 地域別市場シェア、2024年・2034年(%)
8.6 自動車
8.6.1 2024年~2034年の地域別市場規模(US$ Million)
8.6.2 地域別市場シェア、2024年・2034年(%)
8.7 航空宇宙・防衛
8.7.1 2024年~2034年の地域別市場規模(US$ Million)
8.7.2 地域別市場シェア、2024年・2034年(%)
8.8 ヘルスケア
8.8.1 2024〜2034年の地域別市場規模(US$ Million)
8.8.2 地域別市場シェア、2024年・2034年(%)
8.9 その他の分野
8.9.1 2024年~2034年の地域別市場規模(US$ Million)
8.9.2 地域別市場シェア、2024年・2034年(%)
9 デジタルツインと予知保全市場分析:地域別
9.1 主要な調査結果
9.2 地域別市場規模の推定と予測
10 北米のデジタルツインと予知保全市場分析
10.1 主要な調査結果
10.2 北米のデジタルツインズと予知保全市場の魅力度指数
10.3 北米のデジタルツインズと予知保全の国別市場、2024年、2029年、2034年 (US$ Billion)
10.4 北米のデジタルツインズと予知保全市場規模推定と予測
10.5 北米のデジタルツインズと予知保全市場規模推定と予測:国別
10.6 北米のデジタルツインズと予知保全市場規模推定と予測:技術別
10.7 北米のデジタルツインズと予知保全市場規模推定と予測:コンポーネント別
10.8 北米のデジタルツインズと予知保全市場規模推定と予測:DT技術別
10.9 北米のデジタルツインと予知保全の市場規模推定と予測:PM技術別
10.10 北米のデジタルツインと予知保全の市場規模推定と予測:産業分野別
10.11 アメリカのデジタルツインズと予知保全市場分析
10.12 カナダのデジタルツインと予知保全市場分析
11 欧州のデジタルツインと予知保全市場分析
11.1 主要な調査結果
11.2 欧州のデジタルツインと予知保全市場の魅力度指数
11.3 欧州のデジタルツインズと予知保全の国別市場、2024年、2029年、2034年 (US$ Billion)
11.4 欧州のデジタルツインズと予知保全市場規模推定と予測
11.5 欧州のデジタルツインズと予知保全市場規模推定と予測:国別
11.6 欧州のデジタルツインズと予知保全市場規模推定と予測:技術別
11.7 欧州のデジタルツインズと予知保全市場規模推定と予測:コンポーネント別
11.8 欧州のデジタルツインズと予知保全市場規模推定と予測:DT技術別
11.9 欧州のデジタルツインズと予知保全市場規模推定と予測:PM技術別
11.10 欧州のデジタルツインズと予知保全市場規模推定と予測:産業分野別
11.11 ドイツのデジタルツインズと予知保全市場分析
11.12 イギリスのデジタルツインズと予知保全市場分析
11.13 フランスのデジタルツインズと予知保全市場分析
11.14 イタリアのデジタルツインズと予知保全市場分析
11.15 スペインのデジタルツインズと予知保全市場分析
11.16 その他の欧州のデジタルツインズと予測保守市場分析
12 アジア太平洋地域のデジタルツインと予知保全市場分析
12.1 主要な調査結果
12.2 アジア太平洋地域のデジタルツインズと予知保全市場魅力度指数
12.3 アジア太平洋地域のデジタルツインズと予知保全国別市場、2024年、2029年、2034年 (US$ Billion)
12.4 アジア太平洋地域のデジタルツインズと予知保全市場規模の推定と予測
12.5 アジア太平洋地域のデジタルツインズと予知保全市場規模推定と予測:国別
12.6 アジア太平洋地域のデジタルツインズと予知保全市場規模推定と予測:技術別
12.7 アジア太平洋地域のデジタルツインズと予知保全市場規模推定と予測:コンポーネント別
12.8 アジア太平洋地域のデジタルツインズと予知保全市場規模推定と予測:DT技術別
12.9 アジア太平洋地域のデジタルツインズと予知保全市場規模推定と予測:PM技術別
12.10 アジア太平洋地域のデジタルツインズと予知保全市場規模推定と予測:産業分野別
12.11 中国 デジタルツインズと予知保全の市場分析
12.12 インドのデジタルツインズと予知保全市場の分析
12.13 日本のデジタルツインズと予知保全市場の分析
12.14 韓国のデジタルツインズと予知保全市場の分析
12.15 オーストラリアのデジタルツインズと予知保全市場の分析
12.16 その他のアジア太平洋地域のデジタルツインズと予測保守市場の分析
13 中東・アフリカのデジタルツインと予知保全市場分析
13.1 主要な調査結果
13.2 中東・アフリカのデジタルツインズと予知保全市場魅力度指数
13.3 中東・アフリカのデジタルツインズと予知保全の国別市場、2024年、2029年、2034年 (US$ Billion)
13.4 中東・アフリカのデジタルツインズと予知保全市場規模推定と予測
13.5 中東・アフリカのデジタルツインズと予知保全市場規模推定と予測:国別
13.6 中東・アフリカのデジタルツインズと予知保全市場規模推定と予測:技術別
13.7 中東・アフリカのデジタルツインズと予測保守市場規模推定と予測:コンポーネント別
13.8 中東・アフリカのデジタルツインズと予知保全市場規模推定と予測:DT技術別
13.9 中東・アフリカのデジタルツインズと予知保全市場規模推定と予測:PM技術別
13.10 中東・アフリカのデジタルツインズと予測保守市場規模推定と予測:産業分野別
13.11 GCCのデジタルツインズと予知保全市場分析
13.12 南アフリカのデジタルツインと予知保全市場分析
13.13 その他の中東・アフリカ地域のデジタルツインズと予測保守市場分析
14 ラテンアメリカのデジタルツインと予知保全市場分析
14.1 主要な調査結果
14.2 ラテンアメリカのデジタルツインズと予知保全市場魅力度指数
14.3 ラテンアメリカのデジタルツインズと予知保全の国別市場、2024年、2029年、2034年 (US$ Billion)
14.4 ラテンアメリカのデジタルツインズと予知保全市場規模推定と予測
14.5 ラテンアメリカのデジタルツインズと予知保全市場規模推定と予測:国別
14.6 ラテンアメリカのデジタルツインズと予知保全市場規模推定と予測:技術別
14.7 ラテンアメリカのデジタルツインズと予知保全市場規模推定と予測:コンポーネント別
14.8 ラテンアメリカのデジタルツインズと予知保全市場規模推定と予測:DT技術別
14.9 ラテンアメリカのデジタルツインズと予知保全市場規模推定と予測:PM技術別
14.10 ラテンアメリカのデジタルツインズと予知保全市場規模推定と予測:産業分野別
14.11 ブラジルのデジタルツインズと予知保全市場分析
14.12 メキシコのデジタルツインズと予知保全市場分析
14.13 その他のラテンアメリカのデジタルツインズと予知保全市場分析
15 会社概要
15.1 競争環境、2023年
15.2 戦略的展望
15.3 Siemens AG
15.3.1 会社概要
15.3.2 会社概要
15.3.3 財務分析
15.3.3.1 純収入、2019年~2023年
15.3.3.2 R&D、2019年~2023年
15.3.3.3 地域別収益シェア、2023年(%)
15.3.3.4 事業セグメント収益シェア、2023年(%)
15.3.4 製品ベンチマーク
15.3.5 戦略的展望
15.4 General Electric Company
15.4.1 会社概要
15.4.2 会社概要
15.4.3 財務分析
15.4.3.1 純収入、2019-2023年
15.4.3.2 R&D、2019-2023年
15.4.3.3 地域別収益シェア、2023年(%)
15.4.3.4 事業セグメント収益シェア、2023年(%)
15.4.4 製品ベンチマーク
15.5 International Business Machines Corporation
15.5.1 会社概要
15.5.2 会社概要
15.5.3 財務分析
15.5.3.1 純収入、2019-2023年
15.5.3.2 R&D、2019-2023年
15.5.3.3 地域別収益シェア、2023年(%)
15.5.3.4 事業セグメント収益シェア、2023年(%)
15.5.4 製品ベンチマーク
15.5.5 戦略的展望
15.6 Microsoft Corporation
15.6.1 会社概要
15.6.2 会社概要
15.6.3 財務分析
15.6.3.1 純収入、2019-2023年
15.6.3.2 R&D、2019-2023年
15.6.3.3 地域別収益シェア、2023年(%)
15.6.3.4 事業セグメント収益シェア、2023年(%)
15.6.4 製品ベンチマーク
15.6.5 戦略的展望
15.7 Cisco Systems, Inc.
15.7.1 会社概要
15.7.2 会社概要
15.7.3 財務分析
15.7.3.1 純収入、2019-2023年
15.7.3.2 R&D、2019-2023年
15.7.3.3 地域別売上高シェア(2023年)
15.7.3.4 事業セグメント収益シェア、2023年(%)
15.7.4 製品ベンチマーク
15.7.5 戦略的展望
15.8 Honeywell International Inc
15.8.1 会社概要
15.8.2 会社概要
15.8.3 財務分析
15.8.3.1 純収入、2019-2023年
15.8.3.2 R&D、2019-2023年
15.8.3.3 地域別収益シェア、2023年(%)
15.8.3.4 事業セグメント収益シェア、2023年(%)
15.8.4 製品ベンチマーク
15.8.5 戦略的展望
15.9 ABB
15.9.1 会社概要
15.9.2 会社概要
15.9.3 財務分析
15.9.3.1 純収入(2019-2023年
15.9.3.2 R&D、2019年~2023年
15.9.3.3 事業セグメント収益シェア、2023年(%)
15.9.4 製品ベンチマーク
15.9.5 戦略的展望
15.10 Schneider Electric SE
15.10.1 会社概要
15.10.2 会社概要
15.10.3 財務分析
15.10.3.1 純収入、2018年~2022年
15.10.3.2 R&D、2018年~2022年
15.10.3.3 地域別収入シェア、2022年(%)
15.10.3.4 事業セグメント収益シェア、2022年(%)
15.10.4 製品ベンチマーク
15.10.5 戦略的展望
15.11 Hitachi, Ltd
15.11.1 会社概要
15.11.2 会社概要
15.11.3 財務分析
15.11.3.1 純売上高、2019年~2023年
15.11.3.2 地域別売上高シェア、2023年(%)
15.11.3.3 事業セグメント別売上高シェア、2023年(%)
15.11.4 製品ベンチマーク
15.11.5 戦略的展望
15.12 Rockwell Automation, Inc.
15.12.1 会社概要
15.12.2 会社概要
15.12.3 財務分析
15.12.3.1 純収入、2019-2023年
15.12.3.2 R&D、2019年~2023年
15.12.3.3 地域別収益シェア、2023年(%)
15.12.3.4 事業セグメント収益シェア、2023年(%)
15.12.4 製品ベンチマーク
15.12.5 戦略的展望
15.13 Autodesk, Inc.
15.13.1 会社概要
15.13.2 会社概要
15.13.3 財務分析
15.13.3.1 純収入、2020-2024年
15.13.3.2 R&D、2020-2024年
15.13.3.3 地域別売上シェア、2023年(%)
15.13.4 製品ベンチマーク
15.14 Dassault Systèmes SE
15.14.1 会社概要
15.14.2 会社概要
15.14.3 財務分析
15.14.3.1 純収入、2019-2023年
15.14.3.2 売上高、2019-2023年
15.14.3.3 地域別売上高シェア(2023年)
15.14.4 製品ベンチマーク
15.14.5 戦略的展望
15.15 SAP SE
15.15.1 会社概要
15.15.2 会社概要
15.15.3 財務分析
15.15.3.1 純収入、2019-2023年
15.15.3.2 R&D、2019年~2023年
15.15.3.3 地域別売上高シェア(2023年)
15.15.4 製品ベンチマーク
15.15.5 戦略的展望
15.16 Ansys, Inc.
15.16.1 会社概要
15.16.2 会社概要
15.16.3 財務分析
15.16.3.1 純収入、2019-2023年
15.16.3.2 R&D、2019年~2023年
15.16.3.3 地域別売上高シェア(2023年)
15.16.4 製品ベンチマーク
15.16.5 戦略的展望
15.17 Aspen Technology, Inc.
15.17.1 会社概要
15.17.2 会社概要
15.17.3 財務分析
15.17.3.1 純収入(2019-2023年
15.17.3.2 R&D、2019-2023年
15.17.3.3 地域別売上高シェア、2023年(%)
15.17.3.4 事業セグメント収益シェア、2023年(%)
15.17.4 製品ベンチマーク
15.17.5 戦略的展望
16 結論と提言
16.1 ビジョンゲインからの結びの言葉
16.2 市場プレイヤーへの提言
ページTOPに戻る
図表リスト テーブル一覧
表1 デジタルツインズと予知保全市場のスナップショット、2024年~2034年(10億米ドル、CAGR %)
表2 デジタルツインズと予知保全の世界地域別市場:2024年~2034年(10億米ドル、AGR(%)、CAGR(%))(V字回復シナリオ)
表3 デジタルツインズと予知保全の世界地域別市場:2024~2034年(億米ドル、AGR (%)、CAGR (%))(U字型回復シナリオ)
表4 デジタルツインズと予知保全の世界地域別市場:2024~2034年(億米ドル、AGR (%)、CAGR (%))(W字型回復シナリオ)
表5 デジタルツインズと予知保全の世界地域別市場:2024~2034年(億米ドル、AGR(%)、CAGR(%))(L字型回復シナリオ)
表6 デジタルツインと予知保全の世界市場:技術別、2024-2034年(億米ドル、AGR (%)、CAGR (%)
表7 デジタルツイン技術地域別市場:2024-2034年(億米ドル、AGR (%)、CAGR (%)
表8 予知保全技術の地域別市場、2024-2034年(億米ドル、AGR (%)、CAGR (%)
表9 デジタルツインと予知保全の世界市場:コンポーネント別、2024-2034年 (億米ドル、AGR (%)、CAGR (%)
表10 テクノロジー地域別市場:2024-2034年(億米ドル、AGR (%)、CAGR (%)
表11 ソリューション市場:地域別(2024-2034年、10億米ドル、AGR (%)、CAGR (%)
表12 地域別サービス市場、2024-2034年 (億米ドル、AGR (%)、CAGR (%)
表13 デジタルツインと予知保全の世界市場:DT技術別、2024-2034年 (億米ドル、AGR (%)、CAGR (%)
表14 仮想プロトタイプの地域別市場:2024年~2034年(億米ドル、AGR (%)、CAGR (%)
表15 プロダクトツインの地域別市場:2024-2034年(億米ドル、AGR (%)、CAGR (%)
表16 プロセスツインの地域別市場:2024-2034年(億米ドル、AGR (%)、CAGR (%)
表17 システムツインの地域別市場:2024-2034年(億米ドル、AGR (%)、CAGR (%)
表18 デジタルツインと予知保全の世界市場:PM技術別、2024-2034年 (億米ドル、AGR (%)、CAGR (%)
表19 コンディションモニタリングの地域別市場:2024年~2034年(億米ドル、AGR (%)、CAGR (%)
表20 データ分析市場:地域別、2024-2034年(億米ドル、AGR (%)、CAGR (%)
表21 機械学習市場:地域別、2024-2034年(億米ドル、AGR (%)、CAGR (%)
表22 人工知能市場:地域別、2024〜2034年(億米ドル、AGR (%)、CAGR (%)
表23 予後診断市場:地域別、2024-2034年(億米ドル、AGR (%)、CAGR (%)
表24 デジタルツインと予知保全の世界市場:産業分野別、2024-2034年(億米ドル、AGR (%)、CAGR (%)
表25 製造業の地域別市場:2024年~2034年(億米ドル、AGR (%)、CAGR (%)
表26 エネルギー・公益事業の地域別市場:2024-2034年(億米ドル、AGR (%)、CAGR (%)
表27 自動車市場:地域別 2024-2034 (億米ドル、AGR (%)、CAGR (%))
表28 航空宇宙・防衛市場:地域別市場規模(2024-2034年、10億米ドル、AGR (%)、CAGR (%)
表29 ヘルスケア地域別市場:2024-2034年(億米ドル、AGR (%)、CAGR (%)
表30 その他の垂直市場:地域別市場規模(2024-2034年、10億米ドル、AGR (%)、CAGR (%)
表31 デジタルツインと予知保全の世界地域別市場:2024-2034年(億米ドル、AGR (%)、CAGR (%)
表32 北米のデジタルツインズと予知保全市場:金額ベース、2024-2034年 (億米ドル、AGR (%)、CAGR (%)
表33 北米のデジタルツインズと予知保全の国別市場:2024-2034年 (億米ドル、AGR (%)、CAGR (%)
表34 北米のデジタルツインズと予知保全市場:技術別、2024-2034年 (億米ドル、AGR (%)、CAGR (%)
表35 北米のデジタルツインズと予知保全市場:コンポーネント別、2024-2034年 (億米ドル、AGR (%)、CAGR (%)
表36 北米のデジタルツインズと予知保全市場:DT技術別、2024-2034年 (億米ドル、AGR (%)、CAGR (%))
表37 北米のデジタルツインズと予知保全市場:PM技術別:2024-2034年 (億米ドル、AGR (%)、CAGR (%)
表38 北米のデジタルツインズと予知保全市場:産業別、2024-2034年 (億米ドル、AGR (%)、CAGR (%)
表39 米国のデジタルツインズと予知保全市場:金額ベース、2024-2034年 (億米ドル、AGR (%)、CAGR (%)
表40 カナダのデジタルツインズと予知保全市場:金額 2024-2034 (億米ドル、AGR (%)、CAGR (%))
表 41 欧州のデジタルツインズと予知保全市場:金額 2024-2034 (億米ドル、AGR (%)、CAGR (%))
表42 欧州のデジタルツインズと予知保全の国別市場:2024-2034年 (億米ドル、AGR (%)、CAGR (%)
表43 欧州のデジタルツインズと予知保全の技術別市場:2024-2034年 (億米ドル、AGR (%)、CAGR (%)
表44 欧州のデジタルツインズと予知保全市場:コンポーネント別(2024-2034年:億米ドル、AGR (%)、CAGR (%)
表45 欧州のデジタルツインズと予知保全市場:DT技術別、2024-2034年 (億米ドル、AGR (%)、CAGR (%)
表46 欧州のデジタルツインズと予知保全市場:PM技術別:2024-2034年 (億米ドル、AGR (%)、CAGR (%)
表47 欧州のデジタルツインズと予知保全市場:産業別、2024-2034年 (億米ドル、AGR (%)、CAGR (%)
表48 ドイツのデジタルツインズと予知保全市場:金額ベース、2024-2034年 (億米ドル、AGR (%)、CAGR (%)
表 49 イギリスのデジタルツインズと予知保全市場:金額 2024-2034 (億米ドル、AGR (%)、CAGR (%))
表50 フランスのデジタルツインズと予知保全市場:金額 2024-2034 (億米ドル、AGR (%)、CAGR (%))
表51 イタリアのデジタルツインズと予知保全市場:金額 2024-2034 (億米ドル、AGR (%)、CAGR (%))
表 52 スペインのデジタルツインズと予知保全市場:金額 2024-2034 (億米ドル、AGR (%)、CAGR (%))
表53 欧州以外の地域のデジタルツインズと予知保全市場:金額 2024-2034 (億米ドル、AGR (%)、CAGR (%))
表54 アジア太平洋地域のデジタルツインズと予知保全市場:金額 2024-2034 (億米ドル、AGR (%)、CAGR (%))
表55 アジア太平洋地域のデジタルツインズと予知保全の国別市場:2024-2034年 (億米ドル、AGR (%)、CAGR (%)
表56 アジア太平洋地域のデジタルツインズと予知保全の技術別市場:2024年~2034年(億米ドル、AGR (%)、CAGR (%)
表57 アジア太平洋地域のデジタルツインズと予知保全市場:コンポーネント別、2024-2034年 (億米ドル、AGR (%)、CAGR (%)
表58 アジア太平洋地域のデジタルツインズと予知保全市場:DT技術別、2024-2034年 (億米ドル、AGR (%)、CAGR (%)
表59 アジア太平洋地域のデジタルツインズと予知保全市場:PM技術別、2024-2034年 (億米ドル、AGR (%)、CAGR (%)
表60 アジア太平洋地域のデジタルツインズと予知保全市場:産業別、2024-2034年 (億米ドル、AGR (%)、CAGR (%)
表61 中国のデジタルツインズと予知保全市場:金額ベース、2024-2034年 (億米ドル、AGR (%)、CAGR (%)
表62 インドのデジタルツインズと予知保全市場:金額 2024-2034 (億米ドル、AGR (%)、CAGR (%))
表63 日本のデジタルツインズと予知保全市場:金額 2024-2034 (億米ドル、AGR (%)、CAGR (%))
表64 韓国のデジタルツインズと予知保全市場:金額 2024-2034 (億米ドル、AGR (%)、CAGR (%))
表65 オーストラリアのデジタルツインズと予知保全市場:金額 2024-2034 (億米ドル、AGR (%)、CAGR (%))
表 66 その他のアジア太平洋地域のデジタルツインズと予知保全市場:金額 2024-2034 (億米ドル、AGR (%)、CAGR (%))
表67 中東・アフリカのデジタルツインズと予知保全市場:2024-2034年(億米ドル、AGR (%)、CAGR (%)
表68 中東・アフリカのデジタルツインズと予知保全の国別市場:2024-2034年 (億米ドル、AGR (%)、CAGR (%)
表69 中東・アフリカのデジタルツインズと予知保全市場:技術別、2024-2034年 (億米ドル、AGR (%)、CAGR (%)
表70 中東・アフリカのデジタルツインズと予知保全市場:コンポーネント別(2024-2034年:億米ドル、AGR (%)、CAGR (%)
表71 中東・アフリカのデジタルツインと予知保全市場:DT技術別、2024~2034年 (億米ドル、AGR (%)、CAGR (%)
表72 中東・アフリカのデジタルツインと予知保全市場:PM技術別:2024-2034年 (億米ドル、AGR (%)、CAGR (%)
表73 中東・アフリカのデジタルツインと予知保全市場:産業分野別(2024~2034年:億米ドル、AGR (%)、CAGR (%)
表74 GCCのデジタルツインズと予知保全市場:金額ベース、2024-2034年 (億米ドル、AGR (%)、CAGR (%)
表 75 南アフリカのデジタルツインズと予知保全市場:金額 2024-2034 (億米ドル、AGR (%)、CAGR (%))
表76 中東・アフリカの残りの地域のデジタルツインズと予知保全市場:金額 2024-2034 (億米ドル、AGR (%)、CAGR (%))
表77 中南米のデジタルツインズと予知保全市場:2024-2034年(億米ドル、AGR (%)、CAGR (%)
表78 中南米のデジタルツインズと予知保全の国別市場:2024-2034年 (億米ドル、AGR (%)、CAGR (%)
表79 中南米のデジタルツインズと予知保全市場:技術別、2024-2034年 (億米ドル、AGR (%)、CAGR (%)
表80 中南米のデジタルツインズと予知保全市場:コンポーネント別(2024-2034年:億米ドル、AGR (%)、CAGR (%)
表81 中南米のデジタルツインズと予知保全市場:DT技術別、2024-2034年 (億米ドル、AGR (%)、CAGR (%))
表82 中南米のデジタルツインズと予知保全市場:PM技術別:2024-2034年 (億米ドル、AGR (%)、CAGR (%)
表83 中南米のデジタルツインズと予知保全市場:産業別、2024-2034年 (億米ドル、AGR (%)、CAGR (%)
表84 ブラジルのデジタルツインズと予知保全市場:金額 2024-2034 (億米ドル、AGR (%)、CAGR (%))
表 85 メキシコのデジタルツインズと予知保全市場:金額 2024-2034 (億米ドル、AGR (%)、CAGR (%))
表86 ラテンアメリカの残りの地域のデジタルツインズと予知保全市場:金額 2024-2034 (億米ドル、AGR (%)、CAGR (%))
表 87 戦略的展望 - 契約
表88 シーメンスAG: 主要詳細(CEO, 本社, 売上高, 設立, 従業員数, 企業タイプ, ウェブサイト, 事業セグメント)
表 89 シーメンスAG: 製品ベンチマーク
表90 シーメンスAG:戦略的展望
表91 ゼネラル・エレクトリック社主な詳細(CEO, 本社, 売上高, 設立, 従業員数, 企業タイプ, ウェブサイト, 事業セグメント)
表 92 ゼネラル・エレクトリック社製品ベンチマーク
表93 インターナショナル・ビジネス・マシーンズ・コーポレーション主な詳細(CEO, 本社, 売上高, 設立, 従業員数, 企業タイプ, ウェブサイト, 事業セグメント)
表94 インターナショナル・ビジネス・マシーンズ・コーポレーション製品ベンチマーク
表95 インターナショナル・ビジネス・マシーンズ・コーポレーション戦略的展望
表96 マイクロソフト・コーポレーション主な内容(CEO, 本社, 売上高, 設立, 従業員数, 企業タイプ, ウェブサイト, 事業セグメント)
表 97 マイクロソフト コーポレーション製品ベンチマーク
表 98 マイクロソフト コーポレーション戦略的展望
表99 シスコシステムズ主な詳細(CEO, 本社, 売上高, 設立, 従業員数, 企業タイプ, ウェブサイト, 事業セグメント)
表100 シスコシステムズ製品ベンチマーク
表101 シスコシステムズ戦略的展望
表102 ハネウェル・インターナショナルInc:主な詳細(CEO, 本社, 売上高, 設立, 従業員数, 企業タイプ, ウェブサイト, 事業セグメント)
表 103 ハネウェル・インターナショナルInc:製品ベンチマーク
表 104 ハネウェル・インターナショナルInc:戦略的展望
表105 ABB Ltd: 主要業績(CEO, 本社, 売上高, 設立, 従業員数, 企業タイプ, ウェブサイト, 事業セグメント)
表106 ABB社:製品ベンチマーク
表 107 ABB社:戦略的展望
表108 シュナイダーエレクトリックSE: 主要詳細(CEO, 本社, 売上高, 設立, 従業員数, 企業タイプ, ウェブサイト, 事業セグメント)
表 109 シュナイダーエレクトリック SE: 製品ベンチマーク
表110 シュナイダーエレクトリックSE:戦略的展望
表111 日立製作所:主要業績(CEO, 本社, 売上高, 設立, 従業員数, 企業タイプ, ウェブサイト, 事業セグメント)
表112 日立製作所:製品ベンチマーク
表113 日立製作所:戦略的展望
表114 ロックウェル・オートメーション:戦略的展望主な詳細(CEO、本社、売上高、設立、従業員数、企業タイプ、ウェブサイト、事業セグメント)
表 115 ロックウェル・オートメーションInc:製品ベンチマーク
表 116 ロックウェル・オートメーション, Inc:戦略的展望
表 117 オートデスク主な詳細(CEO, 本社, 売上高, 設立, 従業員数, 企業タイプ, ウェブサイト, 事業セグメント)
表 118 Autodesk, Inc:製品ベンチマーク
表 119 Dassault Systèmes SE: 主要詳細(CEO, 本社, 売上高, 設立, 従業員数, 企業タイプ, ウェブサイト, 事業セグメント)
表120 Dassault Systèmes SE: 製品ベンチマーク
表121 ダッソー・システム&メスSE:戦略的展望
表122 SAP SE:主要詳細(CEO、本社、売上高、設立、従業員数、企業タイプ、ウェブサイト、事業セグメント)
表 123 SAP SE: 製品ベンチマーク
表124 SAP SE:戦略的展望
表125 アンシス主な詳細(CEO, 本社, 売上高, 設立, 従業員数, 企業タイプ, ウェブサイト, 事業セグメント)
表 126 アンシス, Inc:製品ベンチマーク
表 127 アンシス戦略的展望
表 128 アスペンテクノロジー主な詳細(CEO, 本社, 売上高, 設立, 従業員数, 企業タイプ, ウェブサイト, 事業セグメント)
表 129 アスペンテクノロジー:製品ベンチマーク
表130 アスペンテクノロジー:戦略的展望戦略的展望
 
図表一覧
図1 デジタルツインズと予知保全市場のセグメンテーション
図2 技術別デジタルツインと予知保全市場市場魅力度指数
図3 デジタルツインと予知保全市場:コンポーネント別市場魅力度指数
図4 デジタルツインと予知保全市場:DT技術別市場魅力度指数
図5 デジタルツインと予知保全市場:PM技術別:市場魅力度指数市場魅力度指数
図6 デジタルツインと予知保全:産業分野別市場市場魅力度指数
図7 デジタルツインズと予知保全市場:地域別市場魅力度指数
図8 デジタルツインズと予知保全市場:市場魅力度指数市場ダイナミクス
図9 デジタルツインズと予知保全市場:市場ダイナミクスポーターのファイブフォース分析
図10 デジタルツインズと予知保全の世界市場:COVID別シェア予測(2024年~2034年)
図11 デジタルツインズと予知保全の世界市場:地域別予測(2024年~2034年、10億米ドル、AGR (%))(V字回復シナリオ)
図12 デジタルツインズと予知保全の世界地域別市場:2024~2034年(億米ドル、AGR (%))(U字回復シナリオ)
図13 デジタルツインズと予知保全の世界地域別市場:2024~2034年(10億米ドル、AGR (%))(W字型回復シナリオ)
図14 デジタルツインズと予知保全の世界地域別市場:2024~2034年(億米ドル、AGR (%))(L字型回復シナリオ)
図15 デジタルツインズと予知保全市場:PEST分析
図16 デジタルツインズと予知保全市場:技術別市場魅力度指数
図17 デジタルツインズと予知保全の世界市場:技術別、2024年~2034年(10億米ドル、AGR (%)
図18 デジタルツインと予知保全の技術別市場シェア予測:2024年、2029年、2034年 (%)
図19 デジタルツイン技術地域別市場:2024~2034年(億米ドル、AGR (%)
図 20 デジタルツイン技術の地域別市場シェア予測、2024年&2034年(%)
図21 予知保全技術の地域別市場規模予測(2024~2034年、10億米ドル、AGR (%)
図22 予知保全技術の地域別市場シェア予測、2024年&2034年(%)
図23 コンポーネント別デジタルツインと予知保全市場:市場魅力度指数
図24 デジタルツインと予知保全の世界市場(コンポーネント別):2024年~2034年 (億米ドル、AGR (%)
図25 デジタルツインと予知保全のコンポーネント別市場シェア予測、2024年、2029年、2034年 (%)
図26 地域別テクノロジー市場予測(2024~2034年、10億米ドル、AGR (%)
図27 地域別テクノロジー市場シェア予測、2024年&2034年(%)
図28 地域別ソリューション市場:2024~2034年(億米ドル、AGR (%)
図29 地域別ソリューション市場シェア予測、2024年~2034年(%)
図30 2024~2034年の地域別サービス市場(億米ドル、AGR (%)
図31 地域別サービス市場シェア予測、2024年&2034年(%)
図32 DT技術別デジタルツインと予知保全市場:市場魅力度指数
図33 デジタルツインズと予知保全の世界市場(DT技術別):2024年~2034年 (億米ドル、AGR (%)
図34 デジタルツインと予知保全のDT技術別市場シェア予測、2024年、2029年、2034年 (%)
図 35 仮想プロトタイプの地域別市場予測(2024~2034年、10億米ドル、AGR (%)
図36 バーチャルプロトタイプの地域別市場シェア予測、2024年&2034年(%)
図37 プロダクトツインの地域別市場規模予測(2024〜2034年、10億米ドル、AGR (%)
図38 プロダクトツインの地域別市場シェア予測、2024年&2034年(%)
図39 プロセスツインの地域別市場規模予測:2024~2034年(億米ドル、AGR (%)
図40 プロセスツインの地域別市場シェア予測、2024年~2034年 (%)
図 41 2024-2034 地域別システムツイン市場予測(億米ドル、AGR (%)
図42 地域別システムツイン市場シェア予測、2024年&2034年 (%)
図 43 PM技術別のデジタルツインと予知保全市場:市場魅力度指数
図44 PM技術別デジタルツインと予知保全の世界市場:2024年~2034年 (億米ドル、AGR (%)
図45 デジタルツインと予知保全のPM技術別市場シェア予測:2024年、2029年、2034年 (%)
図 46 コンディションモニタリング市場:地域別予測(2024年~2034年、10億米ドル、AGR (%)
図47 コンディションモニタリング市場地域別シェア予測、2024年&2034年(%)
図48 データ分析市場:地域別(2024年~2034年、10億米ドル、AGR (%)
図49 データ分析市場の地域別シェア予測、2024年&2034年(%)
図50 機械学習の地域別市場規模予測(2024年~2034年、10億米ドル、AGR (%)
図51 機械学習の地域別市場シェア予測、2024年〜2034年(%)
図52 人工知能市場:地域別(2024年~2034年、10億米ドル、AGR (%)
図53 人工知能市場の地域別シェア予測、2024年&2034年(%)
図54 予後診断市場:地域別(2024年~2034年、10億米ドル、AGR (%)
図55 地域別予後予測市場シェア、2024年~2034年(%)
図56 産業分野別デジタルツインと予知保全市場:市場魅力度指数
図 57 産業分野別デジタルツインズと予知保全の世界市場:2024年~2034年 (億米ドル、AGR (%))
図 58 産業分野別デジタルツインと予知保全の世界市場シェア予測(2024年、2029年、2034年) (%)
図59 製造業の地域別市場予測(2024年~2034年、10億米ドル、AGR (%)
図60 製造業の地域別市場シェア予測、2024年&2034年(%)
図61 地域別エネルギー・公益事業市場、2024年~2034年(億米ドル、AGR (%)
図62 エネルギー・公益事業の地域別市場シェア予測、2024年~2034年(%)
図63 自動車市場の地域別予測(2024~2034年、億米ドル、AGR (%)
図64 地域別自動車市場シェア予測、2024年&2034年(%)
図65 航空宇宙・防衛市場の地域別推移(2024~2034年、10億米ドル、AGR (%)
図66 航空宇宙・防衛市場の地域別シェア予測、2024年&2034年(%)
図67 2024〜2034年の地域別ヘルスケア市場(億米ドル、AGR (%)
図68 ヘルスケアの地域別市場シェア予測、2024年&2034年(%)
図69 その他の垂直市場:地域別市場規模予測(2024年〜2034年、10億米ドル、AGR (%)
図70 その他の垂直市場地域別シェア予測、2024年&2034年(%)
図 71 デジタルツインズと予知保全の地域別市場予測(売上高、CAGR)
図72 デジタルツインと予知保全の地域別市場シェア予測:2024年、2029年、2034年(%)
図73 デジタルツインズと予知保全の世界地域別市場予測(2024年~2034年、10億米ドル、AGR (%)
図 74 北米のデジタルツインズと予知保全市場魅力度指数
図75 北米のデジタルツインズと予知保全の地域別市場(2024年、2029年&2034年) (億米ドル
図76 北米のデジタルツインズと予知保全市場:金額ベース(2024年~2034年、10億米ドル、AGR (%)
図77 北米のデジタルツインズと予知保全の国別市場:2024年~2034年(億米ドル、AGR (%)
図78 北米のデジタルツインズと予知保全の国別市場シェア予測、2024年&2034年 (%)
図79 北米のデジタルツインズと予知保全の技術別市場:2024年~2034年(億米ドル、AGR (%)
図80 北米のデジタルツインズと予知保全市場:技術別シェア予測、2024年~2034年 (%)
図81 北米のデジタルツインズと予測保守市場:コンポーネント別(2024年~2034年、10億米ドル、AGR (%)
図82 北米のデジタルツインズと予知保全のコンポーネント別市場シェア予測、2024年 & 2034年 (%)
図83 北米のデジタルツインと予知保全市場:DT技術別、2024年~2034年 (億米ドル、AGR (%)
図84 北米のデジタルツインズと予知保全市場:DT技術別シェア予測、2024年~2034年 (%)
図85 北米のデジタルツインと予知保全市場:PM技術別、2024年~2034年 (億米ドル、AGR (%)
図 86 北米のデジタルツインズと予知保全市場:PM技術別シェア予測、2024年~2034年 (%)
図87 北米のデジタルツインと予知保全市場:産業別 2024-2034 (億米ドル、AGR (%)
図 88 北米のデジタルツインズと予知保全の産業分野別市場シェア予測、2024 年 & 2034 年 (%)
図 89 米国のデジタルツインズと予測保守市場:金額ベース、2024~2034年 (億米ドル、AGR (%)
図 90 カナダのデジタルツインズと予知保全市場:金額 2024-2034 (US$ Bn, AGR (%))
図 91 欧州のデジタルツインズと予知保全市場の魅力度指数
図92 欧州デジタルツインズと予知保全の地域別市場(2024年、2029年&2034年) (億米ドル
図 93 欧州のデジタルツインズと予知保全市場:金額ベース(2024~2034年、10億ドル、AGR (%)
図94 欧州デジタルツインズと予知保全の国別市場:2024~2034年(億米ドル、AGR (%)
図95 欧州デジタルツインズと予知保全の国別市場シェア予測、2024年&2034年 (%)
図96 欧州デジタルツインズと予知保全の技術別市場:2024年~2034年(億米ドル、AGR (%)
図 97 欧州のデジタルツインズと予知保全市場:技術別シェア予測、2024年~2034年 (%)
図 98 欧州のデジタルツインズと予知保全市場:コンポーネント別、2024~2034年 (億米ドル、AGR (%)
図 99 欧州のデジタルツインズと予知保全のコンポーネント別市場シェア予測、2024 年 & 2034 年 (%)
図100 欧州デジタルツインと予知保全のDT技術別市場:2024~2034年(億米ドル、AGR (%)
図101 欧州デジタルツインズと予知保全のDT技術別市場予測、2024年~2034年 (%)
図102 欧州のデジタルツインと予知保全市場:PM技術別、2024年~2034年 (億米ドル、AGR (%)
図 103 欧州のデジタルツインズと予知保全市場:PM技術別シェア予測、2024年~2034年 (%)
図104 欧州のデジタルツインと予知保全市場:産業分野別、2024年~2034年 (億米ドル、AGR (%)
図 105 欧州デジタルツインズと予知保全の産業分野別市場シェア予測、2024年 & 2034年 (%)
図 106 ドイツのデジタルツインズと予測保守市場:金額ベース、2024年~2034年 (億米ドル、AGR (%)
図 107 イギリスのデジタルツインズと予知保全市場:金額 2024-2034 (US$ Bn, AGR (%))
図 108 フランスのデジタルツインズと予知保全市場の金額:2024-2034 (億米ドル、AGR (%)
図 109 イタリアのデジタルツインズと予知保全市場の金額:2024-2034年 (億米ドル、AGR (%)
図 110 スペインのデジタルツインズと予知保全市場の金額:2024-2034年 (億米ドル、AGR (%)
図111 欧州以外の地域のデジタルツインズと予知保全市場:金額 2024-2034 (億米ドル、AGR (%))
図 112 アジア太平洋地域のデジタルツインズと予知保全市場魅力度指数
図 113 アジア太平洋地域のデジタルツインズと予知保全市場:地域別(2024年、2029年、2034年) (億米ドル
図114 アジア太平洋地域のデジタルツインズと予知保全市場:金額ベース(2024年~2034年、10億米ドル、AGR (%)
図 115 アジア太平洋地域のデジタルツインズと予知保全の国別市場:2024年~2034年 (億米ドル、AGR (%)
図116 アジア太平洋地域のデジタルツインズと予知保全の国別市場シェア予測、2024年 & 2034年 (%)
図 117 アジア太平洋地域のデジタルツインズと予知保全の技術別市場:2024年~2034年 (億米ドル、AGR (%)
図 118 アジア太平洋地域のデジタルツインズと予知保全市場の技術別シェア予測、2024 年 ~ 2034 年 (%)
図119 アジア太平洋地域のデジタルツインズと予知保全のコンポーネント別市場:2024年~2034年 (億米ドル、AGR (%)
図 120 アジア太平洋地域のデジタルツインズと予知保全の部品別市場シェア予測、2024 年 & 2034 年 (%)
図121 アジア太平洋地域のデジタルツインと予知保全市場:DT技術別、2024年~2034年 (億米ドル、AGR (%)
図 122 アジア太平洋地域のデジタルツインズと予知保全のDT技術別市場シェア予測、2024年 & 2034年 (%)
図123 アジア太平洋地域のデジタルツインと予知保全市場:PM技術別、2024年~2034年 (億米ドル、AGR (%)
図 124 アジア太平洋地域のデジタルツインズと予知保全のPM技術別市場予測、2024年 & 2034年 (%)
図125 アジア太平洋地域のデジタルツインと予知保全市場:産業分野別、2024年~2034年 (億米ドル、AGR (%)
図 126 アジア太平洋地域のデジタルツインズと予知保全市場:産業別シェア予測 (2024 年/2034 年)
図 127 中国のデジタルツインズと予測保守市場:金額ベース、2024~2034年 (億米ドル、AGR (%)
図 128 インドのデジタルツインズと予知保全市場の金額:2024~2034年 (億米ドル、AGR (%)
図 129 日本のデジタルツインズと予知保全市場の金額推移、2024~2034 年 (億米ドル、AGR (%)
図 130 韓国のデジタルツインズと予知保全市場の金額推移、2024~2034 年 (億米ドル、AGR (%)
図 131 オーストラリアのデジタルツインズと予知保全の市場:金額 2024-2034 (US$ Bn, AGR (%))
図 132 その他のアジア太平洋地域のデジタルツインズと予知保全市場:金額 2024-2034 (US$ Bn, AGR (%))
図 133 中東およびアフリカのデジタルツインズと予知保全市場魅力度指数
図134 中東・アフリカのデジタルツインズと予知保全の地域別市場(2024年、2029年&2034年) (億米ドル
図135 中東・アフリカのデジタルツインズと予測保守市場:金額ベース(2024年~2034年、10億米ドル、AGR (%)
図 136 中東・アフリカのデジタルツインズと予知保全の国別市場:2024~2034年 (億米ドル、AGR (%)
図 137 中東・アフリカのデジタルツインズと予知保全の国別市場シェア予測、2024 ~ 2034年 (%)
図 138 中東・アフリカのデジタルツインズと予知保全の技術別市場:2024~2034年 (億米ドル、AGR (%)
図 139 中東・アフリカのデジタルツインと予知保全市場:技術別シェア予測(2024 年~2034 年) (%)
図 140 中東・アフリカのデジタルツインと予測保守市場:コンポーネント別(2024~2034 年) (億米ドル、AGR (%)
図 141 2024-2034 コンポーネント別中東・アフリカデジタルツインと予知保全市場シェア予測 (単位:億米ドル、AGR (%)
図142 中東・アフリカのデジタルツインと予知保全市場:DT技術別、2024年~2034年 (億米ドル、AGR (%)
図143 中東・アフリカのデジタルツインと予知保全市場:DT技術別シェア予測(2024年~2034年)
図 144 中東・アフリカのデジタルツインと予知保全市場:PM技術別、2024年~2034年 (億米ドル、AGR (%)
図 145 中東・アフリカのデジタルツインと予知保全市場:PM 技術別 2024-2034 年予測 (US 億ドル、AGR (%))
図 146 中東・アフリカのデジタルツインと予知保全市場:産業別 2024-2034 (億米ドル、AGR (%)
図 147 中東・アフリカのデジタルツインズと予知保全市場:産業別シェア予測 (2024~2034 年) (%)
図 148 GCC デジタルツインズと予知保全の金額別市場予測(2024~2034 年) (億米ドル、AGR (%)
図 149 南アフリカのデジタルツインズと予知保全市場の金額:2024-2034年 (億米ドル、AGR (%))
図 150 中東・アフリカの残りの地域のデジタルツインズと予知保全市場:金額 2024-2034 (US$ Bn, AGR (%))
図 151 中南米のデジタルツインズと予知保全市場の魅力度指数
図152 中南米のデジタルツインズと予知保全の地域別市場(2024年、2029年&2034年) (億米ドル
図153 中南米のデジタルツインズと予知保全市場:金額ベース(2024年~2034年、10億ドル、AGR (%)
図154 中南米のデジタルツインズと予知保全の国別市場:2024~2034年(億米ドル、AGR (%)
図155 中南米のデジタルツインズと予知保全の国別市場シェア予測、2024年 & 2034年 (%)
図156 中南米のデジタルツインズと予知保全の技術別市場:2024年~2034年(億米ドル、AGR (%)
図157 中南米のデジタルツインズと予知保全市場シェア予測技術、2024年~2034年 (%)
図158 中南米のデジタルツインズと予測保守市場:コンポーネント別(2024年~2034年、億米ドル、AGR (%)
図159 中南米のデジタルツインズと予知保全のコンポーネント別市場シェア予測、2024年 & 2034年 (%)
図160 中南米のデジタルツインと予知保全市場:DT技術別、2024年~2034年(億米ドル、AGR (%)
図161 中南米のデジタルツインズと予知保全市場:DT技術別シェア予測、2024年~2034年 (%)
図162 中南米のデジタルツインズと予知保全市場:PM技術別、2024~2034年 (億米ドル、AGR (%))
図 163 中南米のデジタルツインズと予知保全市場:PM技術別シェア予測、2024年~2034年 (%)
図 164 中南米のデジタルツインズと予知保全市場:産業別 2024-2034 (億米ドル、AGR (%)
図 165 中南米のデジタルツインズと予知保全市場:産業分野別シェア予測(2024 年/2034 年)
図 166 ブラジルのデジタルツインズと予測保守市場:金額ベース(2024~2034 年) (億米ドル、AGR (%)
図 167 メキシコのデジタルツインズと予知保全市場の金額:2024~2034年 (億米ドル、AGR (%)
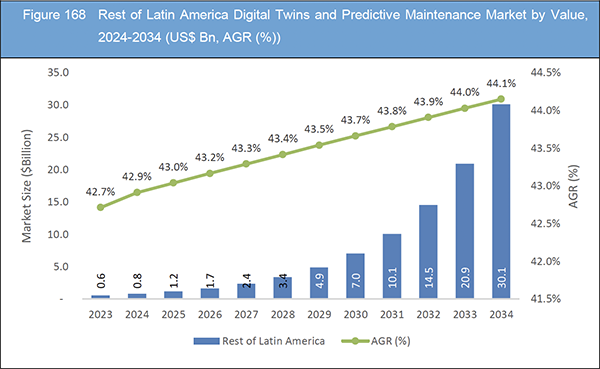
図 168 ラテンアメリカの残りの地域のデジタルツインズと予知保全市場:金額 2024-2034 (US$ Bn, AGR (%))
図 169 デジタルツインズと予知保全市場:企業シェア(2023年
図170 シーメンスAG.:純収入、2019年~2023年(百万米ドル、AGR)
図171 シーメンスAG.:R&D、2019年~2023年(百万米ドル、AGR)
図172 シーメンスAG.:地域別売上高シェア、2023年(%)
図 173 シーメンスAG.:事業別売上高シェア、2023年(%)
図 174 ゼネラル・エレクトリック社:純収入、2019年~2023年(百万米ドル、AGR)
図 175 ゼネラル・エレクトリック社:R&D, 2019-2023 (百万米ドル, AGR%)
図 176 ゼネラル・エレクトリック社:地域別売上高シェア(%)
図 177 ゼネラル・エレクトリック社:事業セグメント別売上高シェア、2023 年(%)
図 178 International Business Machines Corporation:純収入、2019 年~2023 年(百万米ドル、AGR)
図 179 International Business Machines Corporation:R&D, 2019-2023 (百万米ドル, AGR%)
図 180 International Business Machines Corporation:地域別売上高シェア、2023 年
図 181 International Business Machines Corporation:事業セグメント別売上高シェア、2023 年 (%)
図 182 マイクロソフトコーポレーション純収入、2019年~2023年(百万米ドル、AGR)
図 183 マイクロソフトコーポレーションR&D, 2019-2023 (百万米ドル, AGR%)
図 184 マイクロソフトコーポレーション地域別売上高シェア(%)
図 185 マイクロソフトコーポレーション:事業セグメント別売上高シェア、2023年(%)
図 186 Cisco Systems, Inc:純収入、2019年~2023年(百万米ドル、AGR)
図 187 Cisco Systems, Inc:R&D、2019年-2023年(百万米ドル、AGR)
図 188 シスコシステムズ社:地域別売上高シェア、2023年
図 189 シスコシステムズ, Inc:事業セグメント別売上高シェア、2023 年(%)
図 190 ハネウェル・インターナショナル・インク:純収入、2019年~2023年(百万米ドル、AGR)
図 191 ハネウェル・インターナショナル・インク:R&D、2019年~2023年(百万米ドル、AGR)
図 192 ハネウェル・インターナショナル・インク:地域別売上高シェア、2023 年
図 193 ハネウェル・インターナショナルInc:事業セグメント別売上高シェア、2023年(%)
図 194 ABB Ltd.:純収入、2019年~2023年(百万米ドル、AGR)
図 195 ABB Ltd:R&D, 2019-2023 (百万米ドル, AGR%)
図 196 ABB Ltd.:事業セグメント別売上高シェア(%)(2023 年
図 197 シュナイダーエレクトリック SE.:純収入、2018 年~2022 年(百万米ドル、AGR)
図 198 シュナイダーエレクトリック SE.:研究開発、2018 年~2022 年(百万米ドル、AGR)
図 199 シュナイダーエレクトリック SE.:地域別収益シェア、2022 年 (%)
図 200 シュナイダーエレクトリック SE.:事業別売上高シェア、2022 年(%)
図 201 日立製作所:純収入、2019 年~2023 年(百万米ドル、AGR)
図 202 日立製作所:地域別売上高シェア、2023年(%)
図 203 日立製作所:事業別売上高シェア、2023 年(%)
図 204 Rockwell Automation, Inc.:純収入、2019 年~2023 年(百万米ドル、AGR)
図 205 Rockwell Automation, Inc:R&D、2019年~2023年(百万米ドル、AGR)
図 206 ロックウェル・オートメーション, Inc:地域別売上高シェア、2023 年 (%)
図 207 Rockwell Automation, Inc.:事業別売上高シェア、2023 年(%)
図 208 Autodesk, Inc.:純収入、2020 年~2024 年(百万米ドル、AGR%)
図 209 Autodesk, Inc:R&D, 2020-2024 (百万米ドル, AGR%)
図 210 Autodesk, Inc:地域別売上高シェア、2023 年
図 211 Dassault Systèmes SE.:純収入、2019 年~2023 年(百万米ドル、AGR)
図 212 Dassault Systèmes SE.:R&D、2019年~2023年(百万米ドル、AGR)
図 213 Dassault Systèmes SE.:地域別売上高シェア、2023 年 (%)
図 214 SAP SE.:純収入、2019年~2023年(百万米ドル、AGR)
図 215 SAP SE.:R&D、2019年~2023年(百万米ドル、AGR)
図 216 SAP SE.:地域別売上高シェア、2023 年 (%)
図 217 Ansys, Inc.:純収入、2019 年~2023 年(百万米ドル、AGR)
図 218 Ansys, Inc:R&D、2019年~2023年(百万米ドル、AGR)
図 219 Ansys, Inc:地域別売上高シェア、2023 年
図 220 アスペンテクノロジー社:純収入、2019年~2023年(百万米ドル、AGR)
図 221 Aspen Technology, Inc:R&D、2019年-2023年(百万米ドル、AGR)
図 222 アスペンテクノロジー, Inc:地域別売上高シェア、2023年
図 223 アスペンテクノロジー:事業セグメント別売上高シェア、2023 年 (%)
ページTOPに戻る
Summary
Report Details
The Digital Twins and Predictive Maintenance Market Report 2024-2034: This report will prove invaluable to leading firms striving for new revenue pockets if they wish to better understand the industry and its underlying dynamics. It will be useful for companies that would like to expand into different industries or to expand their existing operations in a new region.
The Digital Twins and Predictive Maintenance Market Is Experiencing Robust Growth Driven by Advancements in Technology
The digital twins and predictive maintenance market is experiencing robust growth driven by advancements in technology, increasing adoption of IoT solutions, and the growing need to minimize downtime and enhance operational efficiency across various industry verticals. Digital twin technology, which enables virtual representations of physical assets or systems, coupled with predictive maintenance techniques, is revolutionizing how organizations manage their assets and operations.
One of the primary drivers of the digital twins and predictive maintenance market is the rising demand for reducing unplanned downtime and optimizing maintenance schedules. Organizations across industries such as manufacturing, energy, automotive, aerospace, and healthcare are increasingly leveraging digital twin technology and predictive maintenance solutions to proactively identify and address potential issues before they escalate into costly failures. Additionally, the proliferation of IoT sensors and connected devices is generating vast amounts of data, providing organizations with valuable insights into asset performance and health.
The market presents significant opportunities for vendors offering digital twin and predictive maintenance solutions to expand their offerings and cater to diverse industry needs. As organizations strive to improve asset performance, reduce maintenance costs, and enhance operational efficiency, there is a growing demand for advanced analytics, machine learning, and AI-driven predictive maintenance solutions. Moreover, the integration of digital twins with emerging technologies such as augmented reality (AR) and virtual reality (VR) presents new opportunities for immersive and interactive maintenance experiences.
High Capital Requirement to Implement Digital Twin Technology Hinder the Market Growth
The implementation of digital twin technology in infrastructure projects faces a significant hurdle due to the high capital requirement associated with its deployment. Despite its potential to revolutionize infrastructure delivery and meet evolving efficiency, equity, and resilience needs, the upfront investment required poses a challenge to market growth. In an era where society’s demand for core services surpasses infrastructure capacity, governments are pressured to find innovative solutions within tightening public budgets and amidst supply chain pressures.
What Questions Should You Ask before Buying a Market Research Report?
-
How is the digital twins and predictive maintenance market evolving?
-
What is driving and restraining the digital twins and predictive maintenance market?
-
How will each digital twins and predictive maintenance submarket segment grow over the forecast period and how much revenue will these submarkets account for in 2034?
-
How will the market shares for each digital twins and predictive maintenance submarket develop from 2024 to 2034?
-
What will be the main driver for the overall market from 2024 to 2034?
-
Will leading digital twins and predictive maintenance markets broadly follow the macroeconomic dynamics, or will individual national markets outperform others?
-
How will the market shares of the national markets change by 2034 and which geographical region will lead the market in 2034?
-
Who are the leading players and what are their prospects over the forecast period?
-
What are the digital twins and predictive maintenance projects for these leading companies?
-
How will the industry evolve during the period between 2024 and 2034? What are the implications of digital twins and predictive maintenance projects taking place now and over the next 10 years?
-
Is there a greater need for product commercialisation to further scale the digital twins and predictive maintenance market?
-
Where is the digital twins and predictive maintenance market heading and how can you ensure you are at the forefront of the market?
-
What are the best investment options for new product and service lines?
-
What are the key prospects for moving companies into a new growth path and C-suite?
You need to discover how this will impact the digital twins and predictive maintenance market today, and over the next 10 years:
-
Our 437-page report provides 130 tables and 223 charts/graphs exclusively to you.
-
The report highlights key lucrative areas in the industry so you can target them – NOW.
-
It contains in-depth analysis of global, regional and national sales and growth.
-
It highlights for you the key successful trends, changes and revenue projections made by your competitors.
This report tells you TODAY how the digital twins and predictive maintenance market will develop in the next 10 years, and in line with the variations in COVID-19 economic recession and bounce. This market is more critical now than at any point over the last 10 years.
Forecasts to 2034 and other analyses reveal commercial prospects
-
In addition to revenue forecasting to 2034, our new study provides you with recent results, growth rates, and market shares.
-
You will find original analyses, with business outlooks and developments.
-
Discover qualitative analyses (including market dynamics, drivers, opportunities, restraints and challenges), cost structure, impact of rising digital twins and predictive maintenance prices and recent developments.
This report includes data analysis and invaluable insight into how COVID-19 will affect the industry and your company. Four COVID-19 recovery patterns and their impact, namely, “V”, “L”, “W” and “U” are discussed in this report.
Segments Covered in the Report
Market Segment by Technology
-
Digital Twin Technology
-
Predictive Maintenance Technology
Market Segment by Component
-
Technologies
-
Solutions
-
Services
Market Segment by DT Technology
-
Virtual Prototype
-
Product Twin
-
Process Twin
-
System Twin
Market Segment by PM Technology
-
Condition Monitoring
-
Data Analytics
-
Machine Learning
-
Artificial Intelligence
-
Prognostics
Market Segment by Industry Vertical
-
Manufacturing
-
Energy and Utilities
-
Automotive
-
Aerospace and Defense
-
Healthcare
-
Other Verticals
In addition to the revenue predictions for the overall world market and segments, you will also find revenue forecasts for four regional and 20 leading national markets:
North America
Europe
-
Germany
-
Spain
-
United Kingdom
-
France
-
Italy
-
Rest of Europe
Asia Pacific
-
China
-
Japan
-
India
-
Australia
-
South Korea
-
Rest of Asia Pacific
Latin America
-
Brazil
-
Mexico
-
Rest of Latin America
Middle East & Africa
-
GCC
-
South Africa
-
Rest of Middle East & Africa
The report also includes profiles and for some of the leading companies in the Digital Twins and Predictive Maintenance Market, 2024 to 2034, with a focus on this segment of these companies’ operations.
Leading companies profiled in the report
-
ABB Ltd
-
Ansys, Inc.
-
Aspen Technology, Inc.
-
Autodesk, Inc.
-
Cisco Systems, Inc.
-
Dassault Systèmes SE
-
General Electric Company
-
Hitachi, Ltd
-
Honeywell International Inc.
-
International Business Machines Corporation
-
Microsoft Corporation
-
Rockwell Automation, Inc.
-
SAP SE
-
Schneider Electric SE
-
Siemens AG
Overall world revenue for Digital Twins and Predictive Maintenance Market, 2024 to 2034 in terms of value the market will surpass US$34.6 billion in 2024, our work calculates. We predict strong revenue growth through to 2034. Our work identifies which organizations hold the greatest potential. Discover their capabilities, progress, and commercial prospects, helping you stay ahead.
How will the Digital Twins and Predictive Maintenance Market, 2024 to 2034 report help you?
In summary, our 430+ page report provides you with the following knowledge:
-
Revenue forecasts to 2034 for Digital Twins and Predictive Maintenance Market, 2024 to 2034 Market, with forecasts for technology, component, DT technology, PM technology, and industry vertical, each forecast at a global and regional level – discover the industry’s prospects, finding the most lucrative places for investments and revenues.
-
Revenue forecasts to 2034 for four regional and 20 key national markets – See forecasts for the Digital Twins and Predictive Maintenance Market, 2024 to 2034 market in North America, Europe, Asia-Pacific, Latin America and Middle East & Africa. Also forecasted is the market in the US, Canada, Brazil, Germany, France, UK, Italy, China, India, Japan, and Australia among other prominent economies.
-
Prospects for established firms and those seeking to enter the market – including company profiles for 15 of the major companies involved in the Digital Twins and Predictive Maintenance Market, 2024 to 2034.
Find quantitative and qualitative analyses with independent predictions. Receive information that only our report contains, staying informed with invaluable business intelligence.
Information found nowhere else
With our new report, you are less likely to fall behind in knowledge or miss out on opportunities. See how our work could benefit your research, analyses, and decisions. Visiongain’s study is for everybody needing commercial analyses for the Digital Twins and Predictive Maintenance Market, 2024 to 2034, market-leading companies. You will find data, trends and predictions.
ページTOPに戻る
Table of Contents
1 Report Overview
1.1 Objectives of the Study
1.2 Introduction to Digital Twins and Predictive Maintenance Market
1.3 What This Report Delivers
1.4 Why You Should Read This Report
1.5 Key Questions Answered by This Analytical Report
1.6 Who Is This Report for?
1.7 Methodology
1.7.1 Market Definitions
1.7.2 Market Evaluation & Forecasting Methodology
1.7.3 Data Validation
1.7.3.1 Primary Research
1.7.3.2 Secondary Research
1.8 Frequently Asked Questions (FAQs)
1.9 Associated Visiongain Reports
1.10 About Visiongain
2 Executive Summary
3 Market Overview
3.1 Key Findings
3.2 Market Dynamics
3.2.1 Market Driving Factors
3.2.1.1 Growing Focus on Predictive Maintenance Driving the Market Growth
3.2.1.2 Surging Demand for Digital Twin Technology From Healthcare Industry
3.2.1.3 AI and Machine Learning in Predictive Maintenance
3.2.2 Market Restraining Factors
3.2.2.1 High Capital Requirement to Implement Digital Twin Technology Hinder the Market Growth
3.2.2.2 Susceptibility of Digital Twin Technology to Cyberattacks Hinder the Market Growth
3.2.2.3 Shortage of Skilled Workforce Hinder the Market Growth
3.2.3 Market Opportunities
3.2.3.1 Development of Human-Cantered Digital Twins Opportunities for the Market Growth
3.2.3.2 Collaboration and Partnership Between Opportunities for Market Players
3.2.3.3 Expansion of Market and Businesses Opportunities for the Market Players
3.3 Porter’s Five Forces Analysis
3.3.1 Bargaining Power of Suppliers (Medium)
3.3.2 Bargaining Power of Buyers (Medium to High)
3.3.3 Competitive Rivalry (Medium to High)
3.3.4 Threat from Substitutes (Low)
3.3.5 Threat of New Entrants (High)
3.4 COVID-19 Impact Analysis
3.4.1 “V-Shaped Recovery”
3.4.2 “U-Shaped Recovery”
3.4.3 “W-Shaped Recovery”
3.4.4 “L-Shaped Recovery”
3.5 PEST Analysis
4 Digital Twins and Predictive Maintenance Market Analysis by Technology
4.1 Key Findings
4.2 Technology Segment: Market Attractiveness Index
4.3 Digital Twins and Predictive Maintenance Market Size Estimation and Forecast by Technology
4.4 Digital Twin Technology
4.4.1 Market Size by Region, 2024-2034 (US$ Billion)
4.4.2 Market Share by Region, 2024 & 2034 (%)
4.5 Predictive Maintenance Technology
4.5.1 Market Size by Region, 2024-2034 (US$ Billion)
4.5.2 Market Share by Region, 2024 & 2034 (%)
5 Digital Twins and Predictive Maintenance Market Analysis by Component
5.1 Key Findings
5.2 Component Segment: Market Attractiveness Index
5.3 Digital Twins and Predictive Maintenance Market Size Estimation and Forecast by Component
5.4 Technologies
5.4.1 Market Size by Region, 2024-2034 (US$ Billion)
5.4.2 Market Share by Region, 2024 & 2034 (%)
5.5 Solutions
5.5.1 Market Size by Region, 2024-2034 (US$ Billion)
5.5.2 Market Share by Region, 2024 & 2034 (%)
5.6 Services
5.6.1 Market Size by Region, 2024-2034 (US$ Billion)
5.6.2 Market Share by Region, 2024 & 2034 (%)
6 Digital Twins and Predictive Maintenance Market Analysis by DT Technology
6.1 Key Findings
6.2 DT Technology Segment: Market Attractiveness Index
6.3 Digital Twins and Predictive Maintenance Market Size Estimation and Forecast by DT Technology
6.4 Virtual Prototype
6.4.1 Market Size by Region, 2024-2034 (US$ Billion)
6.4.2 Market Share by Region, 2024 & 2034 (%)
6.5 Product Twin
6.5.1 Market Size by Region, 2024-2034 (US$ Billion)
6.5.2 Market Share by Region, 2024 & 2034 (%)
6.6 Process Twin
6.6.1 Market Size by Region, 2024-2034 (US$ Billion)
6.6.2 Market Share by Region, 2024 & 2034 (%)
6.7 System Twin
6.7.1 Market Size by Region, 2024-2034 (US$ Billion)
6.7.2 Market Share by Region, 2024 & 2034 (%)
7 Digital Twins and Predictive Maintenance Market Analysis by PM Technology
7.1 Key Findings
7.2 PM Technology Segment: Market Attractiveness Index
7.3 Digital Twins and Predictive Maintenance Market Size Estimation and Forecast by PM Technology
7.4 Condition Monitoring
7.4.1 Market Size by Region, 2024-2034 (US$ Billion)
7.4.2 Market Share by Region, 2024 & 2034 (%)
7.5 Data Analytics
7.5.1 Market Size by Region, 2024-2034 (US$ Billion)
7.5.2 Market Share by Region, 2024 & 2034 (%)
7.6 Machine Learning
7.6.1 Market Size by Region, 2024-2034 (US$ Billion)
7.6.2 Market Share by Region, 2024 & 2034 (%)
7.7 Artificial Intelligence
7.7.1 Market Size by Region, 2024-2034 (US$ Billion)
7.7.2 Market Share by Region, 2024 & 2034 (%)
7.8 Prognostics
7.8.1 Market Size by Region, 2024-2034 (US$ Billion)
7.8.2 Market Share by Region, 2024 & 2034 (%)
8 Digital Twins and Predictive Maintenance Market Analysis by Industry Vertical
8.1 Key Findings
8.2 Industry Vertical Segment: Market Attractiveness Index
8.3 Digital Twins and Predictive Maintenance Market Size Estimation and Forecast by Industry Vertical
8.4 Manufacturing
8.4.1 Market Size by Region, 2024-2034 (US$ Million)
8.4.2 Market Share by Region, 2024 & 2034 (%)
8.5 Energy and Utilities
8.5.1 Market Size by Region, 2024-2034 (US$ Million)
8.5.2 Market Share by Region, 2024 & 2034 (%)
8.6 Automotive
8.6.1 Market Size by Region, 2024-2034 (US$ Million)
8.6.2 Market Share by Region, 2024 & 2034 (%)
8.7 Aerospace and Defence
8.7.1 Market Size by Region, 2024-2034 (US$ Million)
8.7.2 Market Share by Region, 2024 & 2034 (%)
8.8 Healthcare
8.8.1 Market Size by Region, 2024-2034 (US$ Million)
8.8.2 Market Share by Region, 2024 & 2034 (%)
8.9 Other Verticals
8.9.1 Market Size by Region, 2024-2034 (US$ Million)
8.9.2 Market Share by Region, 2024 & 2034 (%)
9 Digital Twins and Predictive Maintenance Market Analysis by Region
9.1 Key Findings
9.2 Regional Market Size Estimation and Forecast
10 North America Digital Twins and Predictive Maintenance Market Analysis
10.1 Key Findings
10.2 North America Digital Twins and Predictive Maintenance Market Attractiveness Index
10.3 North America Digital Twins and Predictive Maintenance Market by Country, 2024, 2029 & 2034 (US$ Billion)
10.4 North America Digital Twins and Predictive Maintenance Market Size Estimation and Forecast
10.5 North America Digital Twins and Predictive Maintenance Market Size Estimation and Forecast by Country
10.6 North America Digital Twins and Predictive Maintenance Market Size Estimation and Forecast by Technology
10.7 North America Digital Twins and Predictive Maintenance Market Size Estimation and Forecast by Component
10.8 North America Digital Twins and Predictive Maintenance Market Size Estimation and Forecast by DT Technology
10.9 North America Digital Twins and Predictive Maintenance Market Size Estimation and Forecast by PM Technology
10.10 North America Digital Twins and Predictive Maintenance Market Size Estimation and Forecast by Industry Vertical
10.11 U.S. Digital Twins and Predictive Maintenance Market Analysis
10.12 Canada Digital Twins and Predictive Maintenance Market Analysis
11 Europe Digital Twins and Predictive Maintenance Market Analysis
11.1 Key Findings
11.2 Europe Digital Twins and Predictive Maintenance Market Attractiveness Index
11.3 Europe Digital Twins and Predictive Maintenance Market by Country, 2024, 2029 & 2034 (US$ Billion)
11.4 Europe Digital Twins and Predictive Maintenance Market Size Estimation and Forecast
11.5 Europe Digital Twins and Predictive Maintenance Market Size Estimation and Forecast by Country
11.6 Europe Digital Twins and Predictive Maintenance Market Size Estimation and Forecast by Technology
11.7 Europe Digital Twins and Predictive Maintenance Market Size Estimation and Forecast by Component
11.8 Europe Digital Twins and Predictive Maintenance Market Size Estimation and Forecast by DT Technology
11.9 Europe Digital Twins and Predictive Maintenance Market Size Estimation and Forecast by PM Technology
11.10 Europe Digital Twins and Predictive Maintenance Market Size Estimation and Forecast by Industry Vertical
11.11 Germany Digital Twins and Predictive Maintenance Market Analysis
11.12 UK Digital Twins and Predictive Maintenance Market Analysis
11.13 France Digital Twins and Predictive Maintenance Market Analysis
11.14 Italy Digital Twins and Predictive Maintenance Market Analysis
11.15 Spain Digital Twins and Predictive Maintenance Market Analysis
11.16 Rest of Europe Digital Twins and Predictive Maintenance Market Analysis
12 Asia-Pacific Digital Twins and Predictive Maintenance Market Analysis
12.1 Key Findings
12.2 Asia-Pacific Digital Twins and Predictive Maintenance Market Attractiveness Index
12.3 Asia-Pacific Digital Twins and Predictive Maintenance Market by Country, 2024, 2029 & 2034 (US$ Billion)
12.4 Asia-Pacific Digital Twins and Predictive Maintenance Market Size Estimation and Forecast
12.5 Asia-Pacific Digital Twins and Predictive Maintenance Market Size Estimation and Forecast by Country
12.6 Asia-Pacific Digital Twins and Predictive Maintenance Market Size Estimation and Forecast by Technology
12.7 Asia-Pacific Digital Twins and Predictive Maintenance Market Size Estimation and Forecast by Component
12.8 Asia-Pacific Digital Twins and Predictive Maintenance Market Size Estimation and Forecast by DT Technology
12.9 Asia-Pacific Digital Twins and Predictive Maintenance Market Size Estimation and Forecast by PM Technology
12.10 Asia-Pacific Digital Twins and Predictive Maintenance Market Size Estimation and Forecast by Industry Vertical
12.11 China Digital Twins and Predictive Maintenance Market Analysis
12.12 India Digital Twins and Predictive Maintenance Market Analysis
12.13 Japan Digital Twins and Predictive Maintenance Market Analysis
12.14 South Korea Digital Twins and Predictive Maintenance Market Analysis
12.15 Australia Digital Twins and Predictive Maintenance Market Analysis
12.16 Rest of Asia-Pacific Digital Twins and Predictive Maintenance Market Analysis
13 Middle East and Africa Digital Twins and Predictive Maintenance Market Analysis
13.1 Key Findings
13.2 Middle East and Africa Digital Twins and Predictive Maintenance Market Attractiveness Index
13.3 Middle East and Africa Digital Twins and Predictive Maintenance Market by Country, 2024, 2029 & 2034 (US$ Billion)
13.4 Middle East and Africa Digital Twins and Predictive Maintenance Market Size Estimation and Forecast
13.5 Middle East and Africa Digital Twins and Predictive Maintenance Market Size Estimation and Forecast by Country
13.6 Middle East and Africa Digital Twins and Predictive Maintenance Market Size Estimation and Forecast by Technology
13.7 Middle East and Africa Digital Twins and Predictive Maintenance Market Size Estimation and Forecast by Component
13.8 Middle East and Africa Digital Twins and Predictive Maintenance Market Size Estimation and Forecast by DT Technology
13.9 Middle East and Africa Digital Twins and Predictive Maintenance Market Size Estimation and Forecast by PM Technology
13.10 Middle East and Africa Digital Twins and Predictive Maintenance Market Size Estimation and Forecast by Industry Vertical
13.11 GCC Digital Twins and Predictive Maintenance Market Analysis
13.12 South Africa Digital Twins and Predictive Maintenance Market Analysis
13.13 Rest of Middle East & Africa Digital Twins and Predictive Maintenance Market Analysis
14 Latin America Digital Twins and Predictive Maintenance Market Analysis
14.1 Key Findings
14.2 Latin America Digital Twins and Predictive Maintenance Market Attractiveness Index
14.3 Latin America Digital Twins and Predictive Maintenance Market by Country, 2024, 2029 & 2034 (US$ Billion)
14.4 Latin America Digital Twins and Predictive Maintenance Market Size Estimation and Forecast
14.5 Latin America Digital Twins and Predictive Maintenance Market Size Estimation and Forecast by Country
14.6 Latin America Digital Twins and Predictive Maintenance Market Size Estimation and Forecast by Technology
14.7 Latin America Digital Twins and Predictive Maintenance Market Size Estimation and Forecast by Component
14.8 Latin America Digital Twins and Predictive Maintenance Market Size Estimation and Forecast by DT Technology
14.9 Latin America Digital Twins and Predictive Maintenance Market Size Estimation and Forecast by PM Technology
14.10 Latin America Digital Twins and Predictive Maintenance Market Size Estimation and Forecast by Industry Vertical
14.11 Brazil Digital Twins and Predictive Maintenance Market Analysis
14.12 Mexico Digital Twins and Predictive Maintenance Market Analysis
14.13 Rest of Latin America Digital Twins and Predictive Maintenance Market Analysis
15 Company Profiles
15.1 Competitive Landscape, 2023
15.2 Strategic Outlook
15.3 Siemens AG
15.3.1 Company Snapshot
15.3.2 Company Overview
15.3.3 Financial Analysis
15.3.3.1 Net Revenue, 2019 -2023
15.3.3.2 R&D, 2019-2023
15.3.3.3 Regional Revenue Share, 2023 (%)
15.3.3.4 Business Segment Revenue Share, 2023 (%)
15.3.4 Product Benchmarking
15.3.5 Strategic Outlook
15.4 General Electric Company
15.4.1 Company Snapshot
15.4.2 Company Overview
15.4.3 Financial Analysis
15.4.3.1 Net Revenue, 2019-2023
15.4.3.2 R&D, 2019-2023
15.4.3.3 Regional Revenue Share, 2023 (%)
15.4.3.4 Business Segment Revenue Share, 2023 (%)
15.4.4 Product Benchmarking
15.5 International Business Machines Corporation
15.5.1 Company Snapshot
15.5.2 Company Overview
15.5.3 Financial Analysis
15.5.3.1 Net Revenue, 2019-2023
15.5.3.2 R&D, 2019-2023
15.5.3.3 Regional Revenue Share, 2023 (%)
15.5.3.4 Business Segment Revenue Share, 2023 (%)
15.5.4 Product Benchmarking
15.5.5 Strategic Outlook
15.6 Microsoft Corporation
15.6.1 Company Snapshot
15.6.2 Company Overview
15.6.3 Financial Analysis
15.6.3.1 Net Revenue, 2019-2023
15.6.3.2 R&D, 2019-2023
15.6.3.3 Regional Revenue Share, 2023 (%)
15.6.3.4 Business Segment Revenue Share, 2023 (%)
15.6.4 Product Benchmarking
15.6.5 Strategic Outlook
15.7 Cisco Systems, Inc.
15.7.1 Company Snapshot
15.7.2 Company Overview
15.7.3 Financial Analysis
15.7.3.1 Net Revenue, 2019-2023
15.7.3.2 R&D, 2019-2023
15.7.3.3 Regional Revenue Share, 2023 (%)
15.7.3.4 Business Segment Revenue Share, 2023 (%)
15.7.4 Product Benchmarking
15.7.5 Strategic Outlook
15.8 Honeywell International Inc
15.8.1 Company Snapshot
15.8.2 Company Overview
15.8.3 Financial Analysis
15.8.3.1 Net Revenue, 2019-2023
15.8.3.2 R&D, 2019-2023
15.8.3.3 Regional Revenue Share, 2023 (%)
15.8.3.4 Business Segment Revenue Share, 2023 (%)
15.8.4 Product Benchmarking
15.8.5 Strategic Outlook
15.9 ABB Ltd
15.9.1 Company Snapshot
15.9.2 Company Overview
15.9.3 Financial Analysis
15.9.3.1 Net Revenue, 2019-2023
15.9.3.2 R&D, 2019-2023
15.9.3.3 Business Segment Revenue Share, 2023 (%)
15.9.4 Product Benchmarking
15.9.5 Strategic Outlook
15.10 Schneider Electric SE
15.10.1 Company Snapshot
15.10.2 Company Overview
15.10.3 Financial Analysis
15.10.3.1 Net Revenue, 2018-2022
15.10.3.2 R&D, 2018-2022
15.10.3.3 Regional Revenue Share, 2022 (%)
15.10.3.4 Business Segment Revenue Share, 2022 (%)
15.10.4 Product Benchmarking
15.10.5 Strategic Outlook
15.11 Hitachi, Ltd
15.11.1 Company Snapshot
15.11.2 Company Overview
15.11.3 Financial Analysis
15.11.3.1 Net Revenue, 2019-2023
15.11.3.2 Regional Revenue Share, 2023 (%)
15.11.3.3 Business Segment Revenue Share, 2023 (%)
15.11.4 Product Benchmarking
15.11.5 Strategic Outlook
15.12 Rockwell Automation, Inc.
15.12.1 Company Snapshot
15.12.2 Company Overview
15.12.3 Financial Analysis
15.12.3.1 Net Revenue, 2019-2023
15.12.3.2 R&D, 2019-2023
15.12.3.3 Regional Revenue Share, 2023 (%)
15.12.3.4 Business Segment Revenue Share, 2023 (%)
15.12.4 Product Benchmarking
15.12.5 Strategic Outlook
15.13 Autodesk, Inc.
15.13.1 Company Snapshot
15.13.2 Company Overview
15.13.3 Financial Analysis
15.13.3.1 Net Revenue, 2020-2024
15.13.3.2 R&D, 2020-2024
15.13.3.3 Regional Revenue Share, 2023 (%)
15.13.4 Product Benchmarking
15.14 Dassault Systèmes SE
15.14.1 Company Snapshot
15.14.2 Company Overview
15.14.3 Financial Analysis
15.14.3.1 Net Revenue, 2019-2023
15.14.3.2 R&D, 2019-2023
15.14.3.3 Regional Revenue Share, 2023 (%)
15.14.4 Product Benchmarking
15.14.5 Strategic Outlook
15.15 SAP SE
15.15.1 Company Snapshot
15.15.2 Company Overview
15.15.3 Financial Analysis
15.15.3.1 Net Revenue, 2019-2023
15.15.3.2 R&D, 2019-2023
15.15.3.3 Regional Revenue Share, 2023 (%)
15.15.4 Product Benchmarking
15.15.5 Strategic Outlook
15.16 Ansys, Inc.
15.16.1 Company Snapshot
15.16.2 Company Overview
15.16.3 Financial Analysis
15.16.3.1 Net Revenue, 2019-2023
15.16.3.2 R&D, 2019-2023
15.16.3.3 Regional Revenue Share, 2023 (%)
15.16.4 Product Benchmarking
15.16.5 Strategic Outlook
15.17 Aspen Technology, Inc.
15.17.1 Company Snapshot
15.17.2 Company Overview
15.17.3 Financial Analysis
15.17.3.1 Net Revenue, 2019-2023
15.17.3.2 R&D, 2019-2023
15.17.3.3 Regional Revenue Share, 2023 (%)
15.17.3.4 Business Segment Revenue Share, 2023 (%)
15.17.4 Product Benchmarking
15.17.5 Strategic Outlook
16 Conclusion and Recommendations
16.1 Concluding Remarks from Visiongain
16.2 Recommendations for Market Players
ページTOPに戻る
List of Tables/Graphs
List of Tables
Table 1 Digital Twins and Predictive Maintenance Market Snapshot, 2024 & 2034 (US$ Billion, CAGR %)
Table 2 Global Digital Twins and Predictive Maintenance Market by Region, 2024-2034 (US$ Bn, AGR (%), CAGR (%)) (V-Shaped Recovery Scenario)
Table 3 Global Digital Twins and Predictive Maintenance Market by Region, 2024-2034 (US$ Bn, AGR (%), CAGR (%)) (U-Shaped Recovery Scenario)
Table 4 Global Digital Twins and Predictive Maintenance Market by Region, 2024-2034 (US$ Bn, AGR (%), CAGR (%)) (W-Shaped Recovery Scenario)
Table 5 Global Digital Twins and Predictive Maintenance Market by Region, 2024-2034 (US$ Bn, AGR (%), CAGR (%)) (L-Shaped Recovery Scenario)
Table 6 Global Digital Twins and Predictive Maintenance Market by Technology, 2024-2034 (US$ Bn, AGR (%), CAGR (%))
Table 7 Digital Twin Technology Market by Region, 2024-2034 (US$ Bn, AGR (%), CAGR (%))
Table 8 Predictive Maintenance Technology Market by Region, 2024-2034 (US$ Bn, AGR (%), CAGR (%))
Table 9 Global Digital Twins and Predictive Maintenance Market by Component, 2024-2034 (US$ Bn, AGR (%), CAGR (%))
Table 10 Technologies Market by Region, 2024-2034 (US$ Bn, AGR (%), CAGR (%))
Table 11 Solutions Market by Region, 2024-2034 (US$ Bn, AGR (%), CAGR (%))
Table 12 Services Market by Region, 2024-2034 (US$ Bn, AGR (%), CAGR (%))
Table 13 Global Digital Twins and Predictive Maintenance Market by DT Technology, 2024-2034 (US$ Bn, AGR (%), CAGR (%))
Table 14 Virtual Prototype Market by Region, 2024-2034 (US$ Bn, AGR (%), CAGR (%))
Table 15 Product Twin Market by Region, 2024-2034 (US$ Bn, AGR (%), CAGR (%))
Table 16 Process Twin Market by Region, 2024-2034 (US$ Bn, AGR (%), CAGR (%))
Table 17 System Twin Market by Region, 2024-2034 (US$ Bn, AGR (%), CAGR (%))
Table 18 Global Digital Twins and Predictive Maintenance Market by PM Technology, 2024-2034 (US$ Bn, AGR (%), CAGR (%))
Table 19 Condition Monitoring Market by Region, 2024-2034 (US$ Bn, AGR (%), CAGR (%))
Table 20 Data Analytics Market by Region, 2024-2034 (US$ Bn, AGR (%), CAGR (%))
Table 21 Machine Learning Market by Region, 2024-2034 (US$ Bn, AGR (%), CAGR (%))
Table 22 Artificial Intelligence Market by Region, 2024-2034 (US$ Bn, AGR (%), CAGR (%))
Table 23 Prognostics Market by Region, 2024-2034 (US$ Bn, AGR (%), CAGR (%))
Table 24 Global Digital Twins and Predictive Maintenance Market by Industry Vertical, 2024-2034 (US$ Bn, AGR (%), CAGR (%))
Table 25 Manufacturing Market by Region, 2024-2034 (US$ Bn, AGR (%), CAGR (%))
Table 26 Energy and Utilities Market by Region, 2024-2034 (US$ Bn, AGR (%), CAGR (%))
Table 27 Automotive Market by Region, 2024-2034 (US$ Bn, AGR (%), CAGR (%))
Table 28 Aerospace and Defence Market by Region, 2024-2034 (US$ Bn, AGR (%), CAGR (%))
Table 29 Healthcare Market by Region, 2024-2034 (US$ Bn, AGR (%), CAGR (%))
Table 30 Other Verticals Market by Region, 2024-2034 (US$ Bn, AGR (%), CAGR (%))
Table 31 Global Digital Twins and Predictive Maintenance Market by Region, 2024-2034 (US$ Bn, AGR (%), CAGR (%))
Table 32 North America Digital Twins and Predictive Maintenance Market by Value, 2024-2034 (US$ Bn, AGR (%), CAGR (%))
Table 33 North America Digital Twins and Predictive Maintenance Market by Country, 2024-2034 (US$ Bn, AGR (%), CAGR (%))
Table 34 North America Digital Twins and Predictive Maintenance Market by Technology, 2024-2034 (US$ Bn, AGR (%), CAGR (%))
Table 35 North America Digital Twins and Predictive Maintenance Market by Component, 2024-2034 (US$ Bn, AGR (%), CAGR (%))
Table 36 North America Digital Twins and Predictive Maintenance Market by DT Technology, 2024-2034 (US$ Bn, AGR (%), CAGR (%))
Table 37 North America Digital Twins and Predictive Maintenance Market by PM Technology, 2024-2034 (US$ Bn, AGR (%), CAGR (%))
Table 38 North America Digital Twins and Predictive Maintenance Market by Industry Vertical, 2024-2034 (US$ Bn, AGR (%), CAGR (%))
Table 39 US Digital Twins and Predictive Maintenance Market by Value, 2024-2034 (US$ Bn, AGR (%), CAGR (%))
Table 40 Canada Digital Twins and Predictive Maintenance Market by Value, 2024-2034 (US$ Bn, AGR (%), CAGR (%))
Table 41 Europe Digital Twins and Predictive Maintenance Market by Value, 2024-2034 (US$ Bn, AGR (%), CAGR (%))
Table 42 Europe Digital Twins and Predictive Maintenance Market by Country, 2024-2034 (US$ Bn, AGR (%), CAGR (%))
Table 43 Europe Digital Twins and Predictive Maintenance Market by Technology, 2024-2034 (US$ Bn, AGR (%), CAGR (%))
Table 44 Europe Digital Twins and Predictive Maintenance Market by Component, 2024-2034 (US$ Bn, AGR (%), CAGR (%))
Table 45 Europe Digital Twins and Predictive Maintenance Market by DT Technology, 2024-2034 (US$ Bn, AGR (%), CAGR (%))
Table 46 Europe Digital Twins and Predictive Maintenance Market by PM Technology, 2024-2034 (US$ Bn, AGR (%), CAGR (%))
Table 47 Europe Digital Twins and Predictive Maintenance Market by Industry Vertical, 2024-2034 (US$ Bn, AGR (%), CAGR (%))
Table 48 Germany Digital Twins and Predictive Maintenance Market by Value, 2024-2034 (US$ Bn, AGR (%), CAGR (%))
Table 49 UK Digital Twins and Predictive Maintenance Market by Value, 2024-2034 (US$ Bn, AGR (%), CAGR (%))
Table 50 France Digital Twins and Predictive Maintenance Market by Value, 2024-2034 (US$ Bn, AGR (%), CAGR (%))
Table 51 Italy Digital Twins and Predictive Maintenance Market by Value, 2024-2034 (US$ Bn, AGR (%), CAGR (%))
Table 52 Spain Digital Twins and Predictive Maintenance Market by Value, 2024-2034 (US$ Bn, AGR (%), CAGR (%))
Table 53 Rest of Europe Digital Twins and Predictive Maintenance Market by Value, 2024-2034 (US$ Bn, AGR (%), CAGR (%))
Table 54 Asia-Pacific Digital Twins and Predictive Maintenance Market by Value, 2024-2034 (US$ Bn, AGR (%), CAGR (%))
Table 55 Asia-Pacific Digital Twins and Predictive Maintenance Market by Country, 2024-2034 (US$ Bn, AGR (%), CAGR (%))
Table 56 Asia-Pacific Digital Twins and Predictive Maintenance Market by Technology, 2024-2034 (US$ Bn, AGR (%), CAGR (%))
Table 57 Asia-Pacific Digital Twins and Predictive Maintenance Market by Component, 2024-2034 (US$ Bn, AGR (%), CAGR (%))
Table 58 Asia-Pacific Digital Twins and Predictive Maintenance Market by DT Technology, 2024-2034 (US$ Bn, AGR (%), CAGR (%))
Table 59 Asia-Pacific Digital Twins and Predictive Maintenance Market by PM Technology, 2024-2034 (US$ Bn, AGR (%), CAGR (%))
Table 60 Asia-Pacific Digital Twins and Predictive Maintenance Market by Industry Vertical, 2024-2034 (US$ Bn, AGR (%), CAGR (%))
Table 61 China Digital Twins and Predictive Maintenance Market by Value, 2024-2034 (US$ Bn, AGR (%), CAGR (%))
Table 62 India Digital Twins and Predictive Maintenance Market by Value, 2024-2034 (US$ Bn, AGR (%), CAGR (%))
Table 63 Japan Digital Twins and Predictive Maintenance Market by Value, 2024-2034 (US$ Bn, AGR (%), CAGR (%))
Table 64 South Korea Digital Twins and Predictive Maintenance Market by Value, 2024-2034 (US$ Bn, AGR (%), CAGR (%))
Table 65 Australia Digital Twins and Predictive Maintenance Market by Value, 2024-2034 (US$ Bn, AGR (%), CAGR (%))
Table 66 Rest of Asia-Pacific Digital Twins and Predictive Maintenance Market by Value, 2024-2034 (US$ Bn, AGR (%), CAGR (%))
Table 67 Middle East & Africa Digital Twins and Predictive Maintenance Market by Value, 2024-2034 (US$ Bn, AGR (%), CAGR (%))
Table 68 Middle East & Africa Digital Twins and Predictive Maintenance Market by Country, 2024-2034 (US$ Bn, AGR (%), CAGR (%))
Table 69 Middle East & Africa Digital Twins and Predictive Maintenance Market by Technology, 2024-2034 (US$ Bn, AGR (%), CAGR (%))
Table 70 Middle East & Africa Digital Twins and Predictive Maintenance Market by Component, 2024-2034 (US$ Bn, AGR (%), CAGR (%))
Table 71 Middle East & Africa Digital Twins and Predictive Maintenance Market by DT Technology, 2024-2034 (US$ Bn, AGR (%), CAGR (%))
Table 72 Middle East & Africa Digital Twins and Predictive Maintenance Market by PM Technology, 2024-2034 (US$ Bn, AGR (%), CAGR (%))
Table 73 Middle East & Africa Digital Twins and Predictive Maintenance Market by Industry Vertical, 2024-2034 (US$ Bn, AGR (%), CAGR (%))
Table 74 GCC Digital Twins and Predictive Maintenance Market by Value, 2024-2034 (US$ Bn, AGR (%), CAGR (%))
Table 75 South Africa Digital Twins and Predictive Maintenance Market by Value, 2024-2034 (US$ Bn, AGR (%), CAGR (%))
Table 76 Rest of Middle East & Africa Digital Twins and Predictive Maintenance Market by Value, 2024-2034 (US$ Bn, AGR (%), CAGR (%))
Table 77 Latin America Digital Twins and Predictive Maintenance Market by Value, 2024-2034 (US$ Bn, AGR (%), CAGR (%))
Table 78 Latin America Digital Twins and Predictive Maintenance Market by Country, 2024-2034 (US$ Bn, AGR (%), CAGR (%))
Table 79 Latin America Digital Twins and Predictive Maintenance Market by Technology, 2024-2034 (US$ Bn, AGR (%), CAGR (%))
Table 80 Latin America Digital Twins and Predictive Maintenance Market by Component, 2024-2034 (US$ Bn, AGR (%), CAGR (%))
Table 81 Latin America Digital Twins and Predictive Maintenance Market by DT Technology, 2024-2034 (US$ Bn, AGR (%), CAGR (%))
Table 82 Latin America Digital Twins and Predictive Maintenance Market by PM Technology, 2024-2034 (US$ Bn, AGR (%), CAGR (%))
Table 83 Latin America Digital Twins and Predictive Maintenance Market by Industry Vertical, 2024-2034 (US$ Bn, AGR (%), CAGR (%))
Table 84 Brazil Digital Twins and Predictive Maintenance Market by Value, 2024-2034 (US$ Bn, AGR (%), CAGR (%))
Table 85 Mexico Digital Twins and Predictive Maintenance Market by Value, 2024-2034 (US$ Bn, AGR (%), CAGR (%))
Table 86 Rest of Latin America Digital Twins and Predictive Maintenance Market by Value, 2024-2034 (US$ Bn, AGR (%), CAGR (%))
Table 87 Strategic Outlook - Contract
Table 88 Siemens AG: Key Details, (CEO, HQ, Revenue, Founded, No. of Employees, Company Type, Website, Business Segment)
Table 89 Siemens AG: Product Benchmarking
Table 90 Siemens AG: Strategic Outlook
Table 91 General Electric Company: Key Details, (CEO, HQ, Revenue, Founded, No. of Employees, Company Type, Website, Business Segment)
Table 92 General Electric Company: Product Benchmarking
Table 93 International Business Machines Corporation: Key Details, (CEO, HQ, Revenue, Founded, No. of Employees, Company Type, Website, Business Segment)
Table 94 International Business Machines Corporation: Product Benchmarking
Table 95 International Business Machines Corporation: Strategic Outlook
Table 96 Microsoft Corporation: Key Details, (CEO, HQ, Revenue, Founded, No. of Employees, Company Type, Website, Business Segment)
Table 97 Microsoft Corporation: Product Benchmarking
Table 98 Microsoft Corporation: Strategic Outlook
Table 99 Cisco Systems, Inc: Key Details, (CEO, HQ, Revenue, Founded, No. of Employees, Company Type, Website, Business Segment)
Table 100 Cisco Systems, Inc: Product Benchmarking
Table 101 Cisco Systems, Inc: Strategic Outlook
Table 102 Honeywell International Inc: Key Details, (CEO, HQ, Revenue, Founded, No. of Employees, Company Type, Website, Business Segment)
Table 103 Honeywell International Inc: Product Benchmarking
Table 104 Honeywell International Inc: Strategic Outlook
Table 105 ABB Ltd: Key Details, (CEO, HQ, Revenue, Founded, No. of Employees, Company Type, Website, Business Segment)
Table 106 ABB Ltd: Product Benchmarking
Table 107 ABB Ltd: Strategic Outlook
Table 108 Schneider Electric SE: Key Details, (CEO, HQ, Revenue, Founded, No. of Employees, Company Type, Website, Business Segment)
Table 109 Schneider Electric SE: Product Benchmarking
Table 110 Schneider Electric SE: Strategic Outlook
Table 111 Hitachi, Ltd: Key Details, (CEO, HQ, Revenue, Founded, No. of Employees, Company Type, Website, Business Segment)
Table 112 Hitachi, Ltd: Product Benchmarking
Table 113 Hitachi, Ltd: Strategic Outlook
Table 114 Rockwell Automation, Inc.: Key Details, (CEO, HQ, Revenue, Founded, No. of Employees, Company Type, Website, Business Segment)
Table 115 Rockwell Automation, Inc.: Product Benchmarking
Table 116 Rockwell Automation, Inc.: Strategic Outlook
Table 117 Autodesk, Inc.: Key Details, (CEO, HQ, Revenue, Founded, No. of Employees, Company Type, Website, Business Segment)
Table 118 Autodesk, Inc.: Product Benchmarking
Table 119 Dassault Systèmes SE: Key Details, (CEO, HQ, Revenue, Founded, No. of Employees, Company Type, Website, Business Segment)
Table 120 Dassault Systèmes SE: Product Benchmarking
Table 121 Dassault Systèmes SE: Strategic Outlook
Table 122 SAP SE: Key Details, (CEO, HQ, Revenue, Founded, No. of Employees, Company Type, Website, Business Segment)
Table 123 SAP SE: Product Benchmarking
Table 124 SAP SE: Strategic Outlook
Table 125 Ansys, Inc.: Key Details, (CEO, HQ, Revenue, Founded, No. of Employees, Company Type, Website, Business Segment)
Table 126 Ansys, Inc.: Product Benchmarking
Table 127 Ansys, Inc.: Strategic Outlook
Table 128 Aspen Technology, Inc.: Key Details, (CEO, HQ, Revenue, Founded, No. of Employees, Company Type, Website, Business Segment)
Table 129 Aspen Technology, Inc.: Product Benchmarking
Table 130 Aspen Technology, Inc.: Strategic Outlook
List of Figures
Figure 1 Digital Twins and Predictive Maintenance Market Segmentation
Figure 2 Digital Twins and Predictive Maintenance Market by Technology: Market Attractiveness Index
Figure 3 Digital Twins and Predictive Maintenance Market by Component: Market Attractiveness Index
Figure 4 Digital Twins and Predictive Maintenance Market by DT Technology: Market Attractiveness Index
Figure 5 Digital Twins and Predictive Maintenance Market by PM Technology: Market Attractiveness Index
Figure 6 Digital Twins and Predictive Maintenance Market by Industry Vertical: Market Attractiveness Index
Figure 7 Digital Twins and Predictive Maintenance Market Attractiveness Index by Region
Figure 8 Digital Twins and Predictive Maintenance Market: Market Dynamics
Figure 9 Digital Twins and Predictive Maintenance Market: Porter’s Five Forces Analysis
Figure 10 Global Digital Twins and Predictive Maintenance Market Share Forecast by COVID, 2024-2034 (%)
Figure 11 Global Digital Twins and Predictive Maintenance Market by Region, 2024-2034 (US$ Bn, AGR (%)) (V-Shaped Recovery Scenario)
Figure 12 Global Digital Twins and Predictive Maintenance Market by Region, 2024-2034 (US$ Bn, AGR (%)) (U-Shaped Recovery Scenario)
Figure 13 Global Digital Twins and Predictive Maintenance Market by Region, 2024-2034 (US$ Bn, AGR (%)) (W-Shaped Recovery Scenario)
Figure 14 Global Digital Twins and Predictive Maintenance Market by Region, 2024-2034 (US$ Bn, AGR (%)) (L-Shaped Recovery Scenario)
Figure 15 Digital Twins and Predictive Maintenance Market: PEST Analysis
Figure 16 Digital Twins and Predictive Maintenance Market by Technology: Market Attractiveness Index
Figure 17 Global Digital Twins and Predictive Maintenance Market by Technology, 2024-2034 (US$ Bn, AGR (%))
Figure 18 Digital Twins and Predictive Maintenance Market Share Forecast by Technology, 2024, 2029, 2034 (%)
Figure 19 Digital Twin Technology Market by Region, 2024-2034 (US$ Bn, AGR (%))
Figure 20 Digital Twin Technology Market Share Forecast by Region, 2024 & 2034 (%)
Figure 21 Predictive Maintenance Technology Market by Region, 2024-2034 (US$ Bn, AGR (%))
Figure 22 Predictive Maintenance Technology Market Share Forecast by Region, 2024 & 2034 (%)
Figure 23 Digital Twins and Predictive Maintenance Market by Component: Market Attractiveness Index
Figure 24 Global Digital Twins and Predictive Maintenance Market by Component, 2024-2034 (US$ Bn, AGR (%))
Figure 25 Digital Twins and Predictive Maintenance Market Share Forecast by Component, 2024, 2029, 2034 (%)
Figure 26 Technologies Market by Region, 2024-2034 (US$ Bn, AGR (%))
Figure 27 Technologies Market Share Forecast by Region, 2024 & 2034 (%)
Figure 28 Solutions Market by Region, 2024-2034 (US$ Bn, AGR (%))
Figure 29 Solutions Market Share Forecast by Region, 2024 & 2034 (%)
Figure 30 Services Market by Region, 2024-2034 (US$ Bn, AGR (%))
Figure 31 Services Market Share Forecast by Region, 2024 & 2034 (%)
Figure 32 Digital Twins and Predictive Maintenance Market by DT Technology: Market Attractiveness Index
Figure 33 Global Digital Twins and Predictive Maintenance Market by DT Technology, 2024-2034 (US$ Bn, AGR (%))
Figure 34 Digital Twins and Predictive Maintenance Market Share Forecast by DT Technology, 2024, 2029, 2034 (%)
Figure 35 Virtual Prototype Market by Region, 2024-2034 (US$ Bn, AGR (%))
Figure 36 Virtual Prototype Market Share Forecast by Region, 2024 & 2034 (%)
Figure 37 Product Twin Market by Region, 2024-2034 (US$ Bn, AGR (%))
Figure 38 Product Twin Market Share Forecast by Region, 2024 & 2034 (%)
Figure 39 Process Twin Market by Region, 2024-2034 (US$ Bn, AGR (%))
Figure 40 Process Twin Market Share Forecast by Region, 2024 & 2034 (%)
Figure 41 System Twin Market by Region, 2024-2034 (US$ Bn, AGR (%))
Figure 42 System Twin Market Share Forecast by Region, 2024 & 2034 (%)
Figure 43 Digital Twins and Predictive Maintenance Market by PM Technology: Market Attractiveness Index
Figure 44 Global Digital Twins and Predictive Maintenance Market by PM Technology, 2024-2034 (US$ Bn, AGR (%))
Figure 45 Digital Twins and Predictive Maintenance Market Share Forecast by PM Technology, 2024, 2029, 2034 (%)
Figure 46 Condition Monitoring Market by Region, 2024-2034 (US$ Bn, AGR (%))
Figure 47 Condition Monitoring Market Share Forecast by Region, 2024 & 2034 (%)
Figure 48 Data Analytics Market by Region, 2024-2034 (US$ Bn, AGR (%))
Figure 49 Data Analytics Market Share Forecast by Region, 2024 & 2034 (%)
Figure 50 Machine Learning Market by Region, 2024-2034 (US$ Bn, AGR (%))
Figure 51 Machine Learning Market Share Forecast by Region, 2024 & 2034 (%)
Figure 52 Artificial Intelligence Market by Region, 2024-2034 (US$ Bn, AGR (%))
Figure 53 Artificial Intelligence Market Share Forecast by Region, 2024 & 2034 (%)
Figure 54 Prognostics Market by Region, 2024-2034 (US$ Bn, AGR (%))
Figure 55 Prognostics Market Share Forecast by Region, 2024 & 2034 (%)
Figure 56 Digital Twins and Predictive Maintenance Market by Industry Vertical: Market Attractiveness Index
Figure 57 Global Digital Twins and Predictive Maintenance Market by Industry Vertical, 2024-2034 (US$ Bn, AGR (%))
Figure 58 Digital Twins and Predictive Maintenance Market Share Forecast by Industry Vertical, 2024, 2029, 2034 (%)
Figure 59 Manufacturing Market by Region, 2024-2034 (US$ Bn, AGR (%))
Figure 60 Manufacturing Market Share Forecast by Region, 2024 & 2034 (%)
Figure 61 Energy and Utilities Market by Region, 2024-2034 (US$ Bn, AGR (%))
Figure 62 Energy and Utilities Market Share Forecast by Region, 2024 & 2034 (%)
Figure 63 Automotive Market by Region, 2024-2034 (US$ Bn, AGR (%))
Figure 64 Automotive Market Share Forecast by Region, 2024 & 2034 (%)
Figure 65 Aerospace and Defence Market by Region, 2024-2034 (US$ Bn, AGR (%))
Figure 66 Aerospace and Defence Market Share Forecast by Region, 2024 & 2034 (%)
Figure 67 Healthcare Market by Region, 2024-2034 (US$ Bn, AGR (%))
Figure 68 Healthcare Market Share Forecast by Region, 2024 & 2034 (%)
Figure 69 Other Verticals Market by Region, 2024-2034 (US$ Bn, AGR (%))
Figure 70 Other Verticals Market Share Forecast by Region, 2024 & 2034 (%)
Figure 71 Digital Twins and Predictive Maintenance Market Forecast by Region 2024 and 2034 (Revenue, CAGR%)
Figure 72 Digital Twins and Predictive Maintenance Market Share Forecast by Region 2024, 2029, 2034 (%)
Figure 73 Global Digital Twins and Predictive Maintenance Market by Region, 2024-2034 (US$ Bn, AGR (%))
Figure 74 North America Digital Twins and Predictive Maintenance Market Attractiveness Index
Figure 75 North America Digital Twins and Predictive Maintenance Market by Region, 2024, 2029 & 2034 (US$ Billion)
Figure 76 North America Digital Twins and Predictive Maintenance Market by Value, 2024-2034 (US$ Bn, AGR (%))
Figure 77 North America Digital Twins and Predictive Maintenance Market by Country, 2024-2034 (US$ Bn, AGR (%))
Figure 78 North America Digital Twins and Predictive Maintenance Market Share Forecast by Country, 2024 & 2034 (%)
Figure 79 North America Digital Twins and Predictive Maintenance Market by Technology, 2024-2034 (US$ Bn, AGR (%))
Figure 80 North America Digital Twins and Predictive Maintenance Market Share Forecast Technology, 2024 & 2034 (%)
Figure 81 North America Digital Twins and Predictive Maintenance Market by Component, 2024-2034 (US$ Bn, AGR (%))
Figure 82 North America Digital Twins and Predictive Maintenance Market Share Forecast by Component, 2024 & 2034 (%)
Figure 83 North America Digital Twins and Predictive Maintenance Market by DT Technology, 2024-2034 (US$ Bn, AGR (%))
Figure 84 North America Digital Twins and Predictive Maintenance Market Share Forecast by DT Technology, 2024 & 2034 (%)
Figure 85 North America Digital Twins and Predictive Maintenance Market by PM Technology, 2024-2034 (US$ Bn, AGR (%))
Figure 86 North America Digital Twins and Predictive Maintenance Market Share Forecast by PM Technology, 2024 & 2034 (%)
Figure 87 North America Digital Twins and Predictive Maintenance Market by Industry Vertical, 2024-2034 (US$ Bn, AGR (%))
Figure 88 North America Digital Twins and Predictive Maintenance Market Share Forecast by Industry Vertical, 2024 & 2034 (%)
Figure 89 US Digital Twins and Predictive Maintenance Market by Value, 2024-2034 (US$ Bn, AGR (%))
Figure 90 Canada Digital Twins and Predictive Maintenance Market by Value, 2024-2034 (US$ Bn, AGR (%))
Figure 91 Europe Digital Twins and Predictive Maintenance Market Attractiveness Index
Figure 92 Europe Digital Twins and Predictive Maintenance Market by Region, 2024, 2029 & 2034 (US$ Billion)
Figure 93 Europe Digital Twins and Predictive Maintenance Market by Value, 2024-2034 (US$ Bn, AGR (%))
Figure 94 Europe Digital Twins and Predictive Maintenance Market by Country, 2024-2034 (US$ Bn, AGR (%))
Figure 95 Europe Digital Twins and Predictive Maintenance Market Share Forecast by Country, 2024 & 2034 (%)
Figure 96 Europe Digital Twins and Predictive Maintenance Market by Technology, 2024-2034 (US$ Bn, AGR (%))
Figure 97 Europe Digital Twins and Predictive Maintenance Market Share Forecast Technology, 2024 & 2034 (%)
Figure 98 Europe Digital Twins and Predictive Maintenance Market by Component, 2024-2034 (US$ Bn, AGR (%))
Figure 99 Europe Digital Twins and Predictive Maintenance Market Share Forecast by Component, 2024 & 2034 (%)
Figure 100 Europe Digital Twins and Predictive Maintenance Market by DT Technology, 2024-2034 (US$ Bn, AGR (%))
Figure 101 Europe Digital Twins and Predictive Maintenance Market Share Forecast by DT Technology, 2024 & 2034 (%)
Figure 102 Europe Digital Twins and Predictive Maintenance Market by PM Technology, 2024-2034 (US$ Bn, AGR (%))
Figure 103 Europe Digital Twins and Predictive Maintenance Market Share Forecast by PM Technology, 2024 & 2034 (%)
Figure 104 Europe Digital Twins and Predictive Maintenance Market by Industry Vertical, 2024-2034 (US$ Bn, AGR (%))
Figure 105 Europe Digital Twins and Predictive Maintenance Market Share Forecast by Industry Vertical, 2024 & 2034 (%)
Figure 106 Germany Digital Twins and Predictive Maintenance Market by Value, 2024-2034 (US$ Bn, AGR (%))
Figure 107 UK Digital Twins and Predictive Maintenance Market by Value, 2024-2034 (US$ Bn, AGR (%))
Figure 108 France Digital Twins and Predictive Maintenance Market by Value, 2024-2034 (US$ Bn, AGR (%))
Figure 109 Italy Digital Twins and Predictive Maintenance Market by Value, 2024-2034 (US$ Bn, AGR (%))
Figure 110 Spain Digital Twins and Predictive Maintenance Market by Value, 2024-2034 (US$ Bn, AGR (%))
Figure 111 Rest of Europe Digital Twins and Predictive Maintenance Market by Value, 2024-2034 (US$ Bn, AGR (%))
Figure 112 Asia-Pacific Digital Twins and Predictive Maintenance Market Attractiveness Index
Figure 113 Asia-Pacific Digital Twins and Predictive Maintenance Market by Region, 2024, 2029 & 2034 (US$ Billion)
Figure 114 Asia-Pacific Digital Twins and Predictive Maintenance Market by Value, 2024-2034 (US$ Bn, AGR (%))
Figure 115 Asia-Pacific Digital Twins and Predictive Maintenance Market by Country, 2024-2034 (US$ Bn, AGR (%))
Figure 116 Asia-Pacific Digital Twins and Predictive Maintenance Market Share Forecast by Country, 2024 & 2034 (%)
Figure 117 Asia-Pacific Digital Twins and Predictive Maintenance Market by Technology, 2024-2034 (US$ Bn, AGR (%))
Figure 118 Asia-Pacific Digital Twins and Predictive Maintenance Market Share Forecast Technology, 2024 & 2034 (%)
Figure 119 Asia-Pacific Digital Twins and Predictive Maintenance Market by Component, 2024-2034 (US$ Bn, AGR (%))
Figure 120 Asia-Pacific Digital Twins and Predictive Maintenance Market Share Forecast by Component, 2024 & 2034 (%)
Figure 121 Asia-Pacific Digital Twins and Predictive Maintenance Market by DT Technology, 2024-2034 (US$ Bn, AGR (%))
Figure 122 Asia-Pacific Digital Twins and Predictive Maintenance Market Share Forecast by DT Technology, 2024 & 2034 (%)
Figure 123 Asia-Pacific Digital Twins and Predictive Maintenance Market by PM Technology, 2024-2034 (US$ Bn, AGR (%))
Figure 124 Asia-Pacific Digital Twins and Predictive Maintenance Market Share Forecast by PM Technology, 2024 & 2034 (%)
Figure 125 Asia-Pacific Digital Twins and Predictive Maintenance Market by Industry Vertical, 2024-2034 (US$ Bn, AGR (%))
Figure 126 Asia-Pacific Digital Twins and Predictive Maintenance Market Share Forecast by Industry Vertical, 2024 & 2034 (%)
Figure 127 China Digital Twins and Predictive Maintenance Market by Value, 2024-2034 (US$ Bn, AGR (%))
Figure 128 India Digital Twins and Predictive Maintenance Market by Value, 2024-2034 (US$ Bn, AGR (%))
Figure 129 Japan Digital Twins and Predictive Maintenance Market by Value, 2024-2034 (US$ Bn, AGR (%))
Figure 130 South Korea Digital Twins and Predictive Maintenance Market by Value, 2024-2034 (US$ Bn, AGR (%))
Figure 131 Australia Digital Twins and Predictive Maintenance Market by Value, 2024-2034 (US$ Bn, AGR (%))
Figure 132 Rest of Asia-Pacific Digital Twins and Predictive Maintenance Market by Value, 2024-2034 (US$ Bn, AGR (%))
Figure 133 Middle East and Africa Digital Twins and Predictive Maintenance Market Attractiveness Index
Figure 134 Middle East and Africa Digital Twins and Predictive Maintenance Market by Region, 2024, 2029 & 2034 (US$ Billion)
Figure 135 Middle East & Africa Digital Twins and Predictive Maintenance Market by Value, 2024-2034 (US$ Bn, AGR (%))
Figure 136 Middle East & Africa Digital Twins and Predictive Maintenance Market by Country, 2024-2034 (US$ Bn, AGR (%))
Figure 137 Middle East and Africa Digital Twins and Predictive Maintenance Market Share Forecast by Country, 2024 & 2034 (%)
Figure 138 Middle East & Africa Digital Twins and Predictive Maintenance Market by Technology, 2024-2034 (US$ Bn, AGR (%))
Figure 139 Middle East and Africa Digital Twins and Predictive Maintenance Market Share Forecast Technology, 2024 & 2034 (%)
Figure 140 Middle East & Africa Digital Twins and Predictive Maintenance Market by Component, 2024-2034 (US$ Bn, AGR (%))
Figure 141 Middle East and Africa Digital Twins and Predictive Maintenance Market Share Forecast by Component, 2024 & 2034 (%)
Figure 142 Middle East & Africa Digital Twins and Predictive Maintenance Market by DT Technology, 2024-2034 (US$ Bn, AGR (%))
Figure 143 Middle East and Africa Digital Twins and Predictive Maintenance Market Share Forecast by DT Technology, 2024 & 2034 (%)
Figure 144 Middle East & Africa Digital Twins and Predictive Maintenance Market by PM Technology, 2024-2034 (US$ Bn, AGR (%))
Figure 145 Middle East and Africa Digital Twins and Predictive Maintenance Market Share Forecast by PM Technology, 2024 & 2034 (%)
Figure 146 Middle East & Africa Digital Twins and Predictive Maintenance Market by Industry Vertical, 2024-2034 (US$ Bn, AGR (%))
Figure 147 Middle East and Africa Digital Twins and Predictive Maintenance Market Share Forecast by Industry Vertical, 2024 & 2034 (%)
Figure 148 GCC Digital Twins and Predictive Maintenance Market by Value, 2024-2034 (US$ Bn, AGR (%))
Figure 149 South Africa Digital Twins and Predictive Maintenance Market by Value, 2024-2034 (US$ Bn, AGR (%))
Figure 150 Rest of Middle East & Africa Digital Twins and Predictive Maintenance Market by Value, 2024-2034 (US$ Bn, AGR (%))
Figure 151 Latin America Digital Twins and Predictive Maintenance Market Attractiveness Index
Figure 152 Latin America Digital Twins and Predictive Maintenance Market by Region, 2024, 2029 & 2034 (US$ Billion)
Figure 153 Latin America Digital Twins and Predictive Maintenance Market by Value, 2024-2034 (US$ Bn, AGR (%))
Figure 154 Latin America Digital Twins and Predictive Maintenance Market by Country, 2024-2034 (US$ Bn, AGR (%))
Figure 155 Latin America Digital Twins and Predictive Maintenance Market Share Forecast by Country, 2024 & 2034 (%)
Figure 156 Latin America Digital Twins and Predictive Maintenance Market by Technology, 2024-2034 (US$ Bn, AGR (%))
Figure 157 Latin America Digital Twins and Predictive Maintenance Market Share Forecast Technology, 2024 & 2034 (%)
Figure 158 Latin America Digital Twins and Predictive Maintenance Market by Component, 2024-2034 (US$ Bn, AGR (%))
Figure 159 Latin America Digital Twins and Predictive Maintenance Market Share Forecast by Component, 2024 & 2034 (%)
Figure 160 Latin America Digital Twins and Predictive Maintenance Market by DT Technology, 2024-2034 (US$ Bn, AGR (%))
Figure 161 Latin America Digital Twins and Predictive Maintenance Market Share Forecast by DT Technology, 2024 & 2034 (%)
Figure 162 Latin America Digital Twins and Predictive Maintenance Market by PM Technology, 2024-2034 (US$ Bn, AGR (%))
Figure 163 Latin America Digital Twins and Predictive Maintenance Market Share Forecast by PM Technology, 2024 & 2034 (%)
Figure 164 Latin America Digital Twins and Predictive Maintenance Market by Industry Vertical, 2024-2034 (US$ Bn, AGR (%))
Figure 165 Latin America Digital Twins and Predictive Maintenance Market Share Forecast by Industry Vertical, 2024 & 2034 (%)
Figure 166 Brazil Digital Twins and Predictive Maintenance Market by Value, 2024-2034 (US$ Bn, AGR (%))
Figure 167 Mexico Digital Twins and Predictive Maintenance Market by Value, 2024-2034 (US$ Bn, AGR (%))
Figure 168 Rest of Latin America Digital Twins and Predictive Maintenance Market by Value, 2024-2034 (US$ Bn, AGR (%))
Figure 169 Digital Twins and Predictive Maintenance Market: Company Share, 2023
Figure 170 Siemens AG.: Net Revenue, 2019-2023 (US$ Million, AGR%)
Figure 171 Siemens AG.: R&D, 2019-2023 (US$ Million, AGR%)
Figure 172 Siemens AG.: Regional Revenue Share, 2023 (%)
Figure 173 Siemens AG.: Business Segment Revenue Share, 2023 (%)
Figure 174 General Electric Company.: Net Revenue, 2019-2023 (US$ Million, AGR%)
Figure 175 General Electric Company.: R&D, 2019-2023 (US$ Million, AGR%)
Figure 176 General Electric Company.: Regional Revenue Share, 2023 (%)
Figure 177 General Electric Company.: Business Segment Revenue Share, 2023 (%)
Figure 178 International Business Machines Corporation.: Net Revenue, 2019-2023 (US$ Million, AGR%)
Figure 179 International Business Machines Corporation.: R&D, 2019-2023 (US$ Million, AGR%)
Figure 180 International Business Machines Corporation.: Regional Revenue Share, 2023 (%)
Figure 181 International Business Machines Corporation.: Business Segment Revenue Share, 2023 (%)
Figure 182 Microsoft Corporation.: Net Revenue, 2019-2023 (US$ Million, AGR%)
Figure 183 Microsoft Corporation.: R&D, 2019-2023 (US$ Million, AGR%)
Figure 184 Microsoft Corporation.: Regional Revenue Share, 2023 (%)
Figure 185 Microsoft Corporation.: Business Segment Revenue Share, 2023 (%)
Figure 186 Cisco Systems, Inc.: Net Revenue, 2019-2023 (US$ Million, AGR%)
Figure 187 Cisco Systems, Inc.: R&D, 2019-2023 (US$ Million, AGR%)
Figure 188 Cisco Systems, Inc.: Regional Revenue Share, 2023 (%)
Figure 189 Cisco Systems, Inc.: Business Segment Revenue Share, 2023 (%)
Figure 190 Honeywell International Inc.: Net Revenue, 2019-2023 (US$ Million, AGR%)
Figure 191 Honeywell International Inc.: R&D, 2019-2023 (US$ Million, AGR%)
Figure 192 Honeywell International Inc.: Regional Revenue Share, 2023 (%)
Figure 193 Honeywell International Inc.: Business Segment Revenue Share, 2023 (%)
Figure 194 ABB Ltd.: Net Revenue, 2019-2023 (US$ Million, AGR%)
Figure 195 ABB Ltd.: R&D, 2019-2023 (US$ Million, AGR%)
Figure 196 ABB Ltd.: Business Segment Revenue Share, 2023 (%)
Figure 197 Schneider Electric SE.: Net Revenue, 2018-2022 (US$ Million, AGR%)
Figure 198 Schneider Electric SE.: R&D, 2018-2022 (US$ Million, AGR%)
Figure 199 Schneider Electric SE.: Regional Revenue Share, 2022 (%)
Figure 200 Schneider Electric SE.: Business Segment Revenue Share, 2022 (%)
Figure 201 Hitachi, Ltd.: Net Revenue, 2019-2023 (US$ Million, AGR%)
Figure 202 Hitachi, Ltd.: Regional Revenue Share, 2023 (%)
Figure 203 Hitachi, Ltd.: Business Segment Revenue Share, 2023 (%)
Figure 204 Rockwell Automation, Inc..: Net Revenue, 2019-2023 (US$ Million, AGR%)
Figure 205 Rockwell Automation, Inc..: R&D, 2019-2023 (US$ Million, AGR%)
Figure 206 Rockwell Automation, Inc..: Regional Revenue Share, 2023 (%)
Figure 207 Rockwell Automation, Inc..: Business Segment Revenue Share, 2023 (%)
Figure 208 Autodesk, Inc..: Net Revenue, 2020-2024 (US$ Million, AGR%)
Figure 209 Autodesk, Inc..: R&D, 2020-2024 (US$ Million, AGR%)
Figure 210 Autodesk, Inc..: Regional Revenue Share, 2023 (%)
Figure 211 Dassault Systèmes SE.: Net Revenue, 2019-2023 (US$ Million, AGR%)
Figure 212 Dassault Systèmes SE.: R&D, 2019-2023 (US$ Million, AGR%)
Figure 213 Dassault Systèmes SE.: Regional Revenue Share, 2023 (%)
Figure 214 SAP SE.: Net Revenue, 2019-2023 (US$ Million, AGR%)
Figure 215 SAP SE.: R&D, 2019-2023 (US$ Million, AGR%)
Figure 216 SAP SE.: Regional Revenue Share, 2023 (%)
Figure 217 Ansys, Inc..: Net Revenue, 2019-2023 (US$ Million, AGR%)
Figure 218 Ansys, Inc..: R&D, 2019-2023 (US$ Million, AGR%)
Figure 219 Ansys, Inc..: Regional Revenue Share, 2023 (%)
Figure 220 Aspen Technology, Inc..: Net Revenue, 2019-2023 (US$ Million, AGR%)
Figure 221 Aspen Technology, Inc..: R&D, 2019-2023 (US$ Million, AGR%)
Figure 222 Aspen Technology, Inc..: Regional Revenue Share, 2023 (%)
Figure 223 Aspen Technology, Inc..: Business Segment Revenue Share, 2023 (%)
ページTOPに戻る
本レポートと同じKEY WORD()の最新刊レポート
- 本レポートと同じKEY WORDの最新刊レポートはありません。
よくあるご質問
Visiongain社はどのような調査会社ですか?
英国の調査会社ヴィジョンゲイン社(Visiongain)は、通信とエネルギーのほか、自動車や化学・医薬品、金属など、広範な市場を対象に調査を行っています。自動車市場については、市場全般に関する調査のほ... もっと見る
調査レポートの納品までの日数はどの程度ですか?
在庫のあるものは速納となりますが、平均的には 3-4日と見て下さい。
但し、一部の調査レポートでは、発注を受けた段階で内容更新をして納品をする場合もあります。
発注をする前のお問合せをお願いします。
注文の手続きはどのようになっていますか?
1)お客様からの御問い合わせをいただきます。
2)見積書やサンプルの提示をいたします。
3)お客様指定、もしくは弊社の発注書をメール添付にて発送してください。
4)データリソース社からレポート発行元の調査会社へ納品手配します。
5) 調査会社からお客様へ納品されます。最近は、pdfにてのメール納品が大半です。
お支払方法の方法はどのようになっていますか?
納品と同時にデータリソース社よりお客様へ請求書(必要に応じて納品書も)を発送いたします。
お客様よりデータリソース社へ(通常は円払い)の御振り込みをお願いします。
請求書は、納品日の日付で発行しますので、翌月最終営業日までの当社指定口座への振込みをお願いします。振込み手数料は御社負担にてお願いします。
お客様の御支払い条件が60日以上の場合は御相談ください。
尚、初めてのお取引先や個人の場合、前払いをお願いすることもあります。ご了承のほど、お願いします。
データリソース社はどのような会社ですか?
当社は、世界各国の主要調査会社・レポート出版社と提携し、世界各国の市場調査レポートや技術動向レポートなどを日本国内の企業・公官庁及び教育研究機関に提供しております。
世界各国の「市場・技術・法規制などの」実情を調査・収集される時には、データリソース社にご相談ください。
お客様の御要望にあったデータや情報を抽出する為のレポート紹介や調査のアドバイスも致します。
|
|

