脅威インテリジェンス市場レポート:2023-2033
Threat Intelligence Market Report 2023-2033
レポート詳細
脅威インテリジェンス市場レポート 2023-2033年 :新たな収益の柱を目指す大手企業にとって、業界とその根底にあるダイナミクスをより深く理解する上で貴重なものとなるでしょう。異業... もっと見る
※上記価格は部署ライセンス(Departmental licence)価格です。
その他の価格についてはデータリソースまでお問合せください。
日本語のページは自動翻訳を利用し作成しています。
実際のレポートは英文のみでご納品いたします。

|

|
サマリー
レポート詳細
脅威インテリジェンス市場レポート 2023-2033年:新たな収益の柱を目指す大手企業にとって、業界とその根底にあるダイナミクスをより深く理解する上で貴重なものとなるでしょう。異業種への進出や新規地域での既存事業の拡大を目指す企業にも有用です。
サイバー攻撃の頻度と影響の増大
サイバー攻撃は、業界を問わず、その頻度と影響力を増している。注目を集めたデータ漏洩やランサムウェアのインシデントは、組織が直面する金銭的・風評的ダメージの可能性を示しています。このような脅威に効果的に対処するために、企業は最新の攻撃傾向に関するタイムリーで正確な情報を必要としています。脅威インテリジェンスは、新たな脅威に関するリアルタイムのデータを提供することで、企業は潜在的な侵害を予測し、緩和することができます。このインテリジェンスを活用することで、企業はインシデント対応能力を強化し、攻撃の影響を最小限に抑え、貴重な資産を保護することができます。
高度化するサイバー脅威
テクノロジーの進化に伴い、サイバー脅威も進化しています。サイバー犯罪者は常に、ネットワークに侵入し、データを盗み、業務を妨害するための洗練されたテクニックやツールを開発しています。この複雑さにより、組織は進化する脅威の状況を先取りすることが不可欠となっています。脅威インテリジェンスは、新たな攻撃ベクトル、高度なマルウェア、敵が使用する戦術など、新たな脅威に関する貴重な洞察を提供します。脅威インテリジェンスを活用することで、組織は積極的に脆弱性を特定し、防御を強化し、巧妙なサイバー攻撃の被害に遭うリスクを最小限に抑えることができます。
市場調査レポートを購入する前にすべき質問とは?
- 脅威インテリジェンス市場はどのように進化しているのか?
- 脅威インテリジェンス市場の推進要因と阻害要因は何か?
- 各脅威インテリジェンスサブマーケットセグメントは予測期間中にどのように成長し、2033年にはどれくらいの売上を占めるようになるのか?
- 2023年から2033年にかけて、各脅威インテリジェンスサブマーケットの市場シェアはどのように推移するのか?
- 2023年から2033年にかけて市場全体を牽引する主な要因は何か?
- 主要な脅威インテリジェンス市場はマクロ経済のダイナミクスに概ね追随するのか、それとも個々の国内市場が他を凌駕するのか?
- 2033年までに各国市場の市場シェアはどのように変化し、2033年に市場をリードするのはどの地域か?
- 主要プレーヤーは誰で、予測期間中の見通しは?
- これら主要企業の脅威情報プロジェクトとは?
- 2023年から2033年にかけて、業界はどのように進化していくのか?現在および今後10年間に実施される脅威インテリジェンスプロジェクトにはどのような意味があるのか?
- 脅威インテリジェンス市場をさらに拡大するために、製品の商業化の必要性は高まっているか?
- 脅威インテリジェンス市場はどこへ向かっているのか、そしてどのようにすれば市場の最前線に確実に立てるのか?
- 新製品や新サービスへの最適な投資方法とは?
- 企業を新たな成長軌道に乗せ、C-suiteに移行させるための重要な展望とは?
このことが現在、そして今後10年の間に脅威インテリジェンス市場にどのような影響を与えるかを見極める必要がある:
- 340ページにわたる本レポートでは、140の表と201の図表を掲載しています。
- 本レポートでは、業界における主要な有利分野をハイライトしているため、今すぐターゲットを絞ることができます。
- 世界、地域、国の売上と成長に関する詳細な分析が含まれています。
- 競合他社が成功した主なトレンド、変化、収益予測をハイライトしています。
本レポートは、脅威インテリジェンス市場が今後10年間でどのように発展していくのか、またCOVID-19の景気後退と好転の変動に合わせてどのように発展していくのかをお伝えします。この市場は、過去10年間のどの時点よりも今が重要です。
2033年までの予測やその他の分析から、商業的な展望が明らかになる
- 2033年までの収益予測に加え、直近の業績、成長率、市場シェアもご覧いただけます。
- ビジネスの展望と展開に関する独自の分析をご覧いただけます。
- 定性的分析(市場ダイナミクス、促進要因、機会、阻害要因、課題を含む)、コスト構造、脅威情報価格上昇の影響、最近の動向をご覧いただけます。
本レポートには、COVID-19が業界と貴社にどのような影響を与えるかについてのデータ分析と貴重な洞察が含まれている。本レポートでは、COVID-19の4つの回収パターンとその影響、すなわち「V」、「L」、「W」、「U」について論じている。
レポート対象セグメント
導入形態別セグメント
- クラウド
- オンプレミス
用途別セグメント
- セキュリティ情報・イベント管理(SIEM)
- 政府、リスク、コンプライアンス(GRC)
- 事業継続計画と管理
サービス別セグメント
- プロフェッショナルサービス
- マネージドサービス
コンポーネント別セグメント
- ソリューション
- サービス
- その他コンポーネント
エンドユーザー別セグメント
- IT・ITeS
- BFSI
- ヘルスケア・ライフサイエンス
- 小売・eコマース
- 製造業
- その他エンドユーザー
世界市場全体と各分野の収益予測に加え、4つの地域と16の主要国市場の収益予測も掲載している:
北米
- アメリカ
- カナダ
欧州
- ドイツ
- スペイン
- イギリス
- フランス
- イタリア
- その他の欧州地域
アジア太平洋
- 中国
- 日本
- インド
- オーストラリア
- 韓国
- その他のアジア太平洋地域
ラテンアメリカ
- ブラジル
- メキシコ
- その他ラテンアメリカ
中東・アフリカ
- GCC
- 南アフリカ
- その他の中東・アフリカ
本レポートでは、脅威インテリジェンス市場の2023年から2033年にかけての主要企業のプロファイルも掲載している。
主要企業と市場成長の可能性
・ Anomali
・ AT&T Inc.
・ Check Point Software Technologies Ltd
・ Cisco Systems, Inc.
・ CrowdStrike Holdings, Inc.
・ Cyware
・ DXC Technology
・ Forcepoint LLC
・ Fortinet, Inc.
・ International Business Machines Corporation
・ Juniper Networks, Inc.
・ McAfee Corp.
・ Mimecast Limited
・ ThreatConnect, Inc.
・ Trend Micro Inc.
脅威インテリジェンス市場全体の世界売上高、2023年~2033年、金額ベースでは2023年に95億5,000万米ドルを超えると弊社では算出。2033年まで収益が大きく伸びると予測している。当調査では、最も大きな可能性を秘めた組織を特定しています。彼らの能力、進歩、商業的展望を発見し、一歩先を行くお手伝いをします。
脅威インテリジェンス市場、2023-2033年レポートはどのように役立つのか?
要約すると、340ページを超えるこのレポートは、以下の知識を提供する:
- 脅威インテリジェンス市場2023年~2033年、地域別市場規模の2033年までの収益予測 - 展開モード、アプリケーション、サービス、コンポーネント、エンドユーザー、企業規模の各予測を世界レベル、地域レベルで掲載。
- 4つの地域と20の主要国市場の2033年までの収益予測 - 北米、ヨーロッパ、アジア太平洋、ラテンアメリカ、中東&アフリカの脅威インテリジェンス市場2023年から2033年までの市場予測をご覧ください。また、米国、カナダ、ブラジル、ドイツ、フランス、英国、イタリア、中国、インド、日本、オーストラリアなどの著名な経済圏の市場も予測しています。
- 2023年から2033年までの脅威インテリジェンス市場に関与する主要企業15社の企業プロファイルを含む。
独自の予測による定量的・定性的分析をご覧ください。私たちのレポートだけに含まれる情報を入手し、貴重なビジネスインテリジェンスで情報を得ることができます。
他にはない情報
私たちの新しいレポートがあれば、知識に遅れをとったり、チャンスを逃したりする可能性が低くなります。弊社の調査レポートが貴社の調査、分析、意思決定にどのように役立つかをご覧ください。Visiongainの調査は、脅威インテリジェンス市場、2023年から2033年、市場をリードする企業の商業分析を必要とするすべての人のためのものです。データ、トレンド、予測をご覧いただけます。
ページTOPに戻る
目次
目次
1 レポート概要
1.1 研究の目的
1.2 脅威インテリジェンス市場の紹介
1.3 本レポートの内容
1.4 本レポートを読むべき理由
1.5 本分析レポートが回答する主な質問
1.6 本レポートの対象者
1.7 調査方法
1.7.1 市場の定義
1.7.1.1 脅威インテリジェンス市場の展開モード
1.7.1.2 脅威インテリジェンス市場のアプリケーション
1.7.1.3 脅威インテリジェンス市場のサービス
1.7.1.4 脅威インテリジェンス市場の構成要素
1.7.1.5 脅威インテリジェンス市場のエンドユーザー
1.7.2 市場評価と予測手法
1.7.3 データの検証
1.7.3.1 一次調査
1.7.3.2 セカンダリリサーチ
1.8 よくある質問(FAQ)
1.9 Visiongainの関連レポート
1.10 Visiongainについて
2 エグゼクティブ・サマリー
2.1 セグメント分析
2.1.1 展開モードセグメント:市場魅力度指数
2.1.2 アプリケーションセグメント:市場魅力度指数
2.1.3 サービスセグメント:市場魅力度指数
2.1.4 コンポーネントセグメント市場魅力度指数
2.1.5 エンドユーザーセグメント:市場魅力度指数市場魅力度指数
2.2 地域別分析
3 市場概要
3.1 主要な調査結果
3.2 市場ダイナミクス
3.2.1 市場促進要因
3.2.1.1 サイバー脅威の高度化
3.2.1.2 規制遵守要件の高まり
3.2.1.3 サイバー攻撃とデータ漏洩の増加
3.2.2 市場抑制要因
3.2.2.1 熟練労働力の不足と人材格差
3.2.2.2 複雑性と相互運用性の課題
3.2.2.3 コストと予算の制約
3.2.3 市場機会
3.2.3.1 クラウドとIoT技術の採用増加
3.2.3.2 脅威インテリジェンスにおける人工知能(AI)と機械学習(ML)の統合
3.2.3.3 業界に特化した脅威インテリジェンス・ソリューション
3.3 COVID-19 影響分析
3.3.1 V字回復
3.3.2 W字型リカバリー
3.3.3 U字型リカバリー
3.3.1 L字型回復
3.4 ポーターのファイブフォース分析
3.4.1 サプライヤーの交渉力(低い)
3.4.2 買い手の交渉力(高)
3.4.3 競争上のライバル(高)
3.4.4 代替品による脅威(低い)
3.4.5 新規参入企業の脅威(中程度)
3.5 PEST分析
3.5.1 政治的要因
3.5.2 経済的要因
3.5.3 社会文化的要因
3.5.4 技術的要因
4 脅威インテリジェンス市場分析:導入形態別
4.1 主要な調査結果
4.2 展開モードセグメント 市場魅力度指数
4.3 導入形態別脅威インテリジェンス市場規模推定と予測
4.4 クラウド市場
4.4.1 2023年~2033年、地域別市場規模(US$ Billion)
4.4.2 地域別市場シェア、2023年・2033年 (%)
4.5 オンプレミス市場
4.5.1 2023年~2033年、地域別市場規模(US$ Billion)
4.5.2 地域別市場シェア、2023年・2033年(%)
5 脅威インテリジェンス市場分析:用途別
5.1 主要調査結果
5.2 用途セグメント: 市場魅力度指数
5.3 用途別脅威インテリジェンス市場規模の推定と予測
5.4 SIEM市場
5.4.1 2023年~2033年、地域別市場規模(US$ Billion)
5.4.2 地域別市場シェア、2023年・2033年(%)
5.5 GRC市場
5.5.1 2023年~2033年、地域別市場規模(US$ Billion)
5.5.2 地域別市場シェア、2023年・2033年(%)
5.6 事業継続計画と管理市場
5.6.1 2023年~2033年、地域別市場規模(US$ Billion)
5.6.2 地域別市場シェア、2023年・2033年(%)
6 脅威インテリジェンス市場分析:サービス別
6.1 主要調査結果
6.2 サービスセグメント別 市場魅力度指数
6.3 サービス別脅威インテリジェンス市場規模推定と予測
6.4 プロフェッショナルサービス市場
6.4.1 2023年~2033年、地域別市場規模(US$ Billion)
6.4.2 地域別市場シェア、2023年・2033年 (%)
6.5 マネージドサービス市場
6.5.1 2023年~2033年、地域別市場規模(US$ Billion)
6.5.2 地域別市場シェア、2023年・2033年(%)
7 脅威インテリジェンス市場分析:コンポーネント別
7.1 主要調査結果
7.2 コンポーネントセグメント: 市場魅力度指数
7.3 脅威インテリジェンスのコンポーネント別市場規模推定と予測
7.4 ソリューション市場
7.4.1 2023年~2033年、地域別市場規模(US$ Billion)
7.4.2 地域別市場シェア、2023年・2033年(%)
7.5 サービス市場
7.5.1 2023年~2033年、地域別市場規模(US$ Billion)
7.5.2 地域別市場シェア、2023年・2033年(%)
7.6 その他コンポーネント市場
7.6.1 2023年~2033年、地域別市場規模(US$ Billion)
7.6.2 地域別市場シェア、2023年・2033年(%)
8 脅威インテリジェンス市場分析:エンドユーザー別
8.1 主要調査結果
8.2 エンドユーザーセグメント: 市場魅力度指数
8.3 エンドユーザー別脅威インテリジェンス市場規模推定と予測
8.4 ITおよびITeS市場
8.4.1 2023年~2033年、地域別市場規模(US$ Billion)
8.4.2 地域別市場シェア、2023年・2033年(%)
8.5 BFSI市場
8.5.1 2023年~2033年、地域別市場規模(US$ Billion)
8.5.2 地域別市場シェア、2023年・2033年(%)
8.6 ヘルスケア・ライフサイエンス市場
8.6.1 2023年~2033年、地域別市場規模(US$ Billion)
8.6.2 地域別市場シェア、2023年・2033年(%)
8.7 小売・Eコマース市場
8.7.1 2023年~2033年、地域別市場規模(US$ Billion)
8.7.2 地域別市場シェア、2023年・2033年(%)
8.8 製造業市場
8.8.1 2023年~2033年、地域別市場規模(US$ Billion)
8.8.2 地域別市場シェア、2023年・2033年(%)
8.9 その他のエンドユーザー市場
8.9.1 2023年~2033年、地域別市場規模(US$ Billion)
8.9.2 地域別市場シェア、2023年・2033年(%)
9 脅威インテリジェンス市場分析:地域別
9.1 主要な調査結果
9.2 地域別市場規模の推定と予測
10 北米の脅威インテリジェンス市場分析
10.1 主要な調査結果
10.2 北米の脅威インテリジェンス市場魅力度指数
10.3 北米の脅威インテリジェンス市場:国別、2023年、2028年、2033年(US$ Million)
10.4 北米の脅威インテリジェンス市場規模推定と予測:金額別
10.5 北米の脅威インテリジェンス市場規模推定と予測:国別
10.6 北米の脅威インテリジェンス市場規模推定と予測:導入形態別
10.7 北米の脅威インテリジェンス市場規模推定と予測:用途別
10.8 北米の脅威インテリジェンス市場規模推定と予測:サービス別
10.9 北米の脅威インテリジェンス市場規模推定と予測:コンポーネント別
10.10 北米脅威インテリジェンス市場規模推定と予測:エンドユーザー別
10.11 米国の脅威インテリジェンス市場分析
10.12 カナダの脅威インテリジェンス市場分析
11 欧州の脅威インテリジェンス市場分析
11.1 主要な調査結果
11.2 欧州脅威インテリジェンス市場魅力度指数
11.3 欧州の脅威インテリジェンス市場:国別、2023年、2028年、2033年(US$ Million)
11.4 欧州の脅威インテリジェンス市場規模推定と予測:金額別
11.5 欧州の脅威インテリジェンス市場規模推定と予測:国別
11.6 欧州の脅威インテリジェンス市場規模推定と予測:導入形態別
11.7 欧州の脅威インテリジェンス市場規模推定と予測:用途別
11.8 欧州の脅威インテリジェンス市場規模推定と予測:サービス別
11.9 欧州の脅威インテリジェンス市場規模推定と予測:コンポーネント別
11.10 欧州の脅威インテリジェンス市場規模推定と予測:エンドユーザー別
11.11 ドイツの脅威インテリジェンス市場分析
11.12 イギリスの脅威インテリジェンス市場分析
11.13 フランスの脅威インテリジェンス市場分析
11.14 イタリアの脅威インテリジェンス市場の分析
11.15 ロシアの脅威インテリジェンス市場の分析
11.16 その他の欧州の脅威インテリジェンス市場分析
12 アジア太平洋地域の脅威インテリジェンス市場分析
12.1 主要な調査結果
12.2 アジア太平洋地域の脅威インテリジェンス市場魅力度指数
12.3 アジア太平洋地域の脅威インテリジェンス市場:国別、2023年、2028年、2033年 (US$ Million)
12.4 アジア太平洋地域の脅威インテリジェンス市場規模推定と予測:金額別
12.5 アジア太平洋地域の脅威インテリジェンス市場規模推定と予測:国別
12.6 アジア太平洋地域の脅威インテリジェンス市場規模推定と予測:導入形態別
12.7 アジア太平洋地域の脅威インテリジェンス市場規模推定と予測:用途別
12.8 アジア太平洋地域の脅威インテリジェンス市場規模推定と予測:サービス別
12.9 アジア太平洋地域の脅威インテリジェンス市場規模推定と予測:コンポーネント別
12.10 アジア太平洋地域の脅威インテリジェンス市場規模推定と予測:エンドユーザー別
12.11 中国の脅威インテリジェンス市場分析
12.12 インドの脅威インテリジェンス市場分析
12.13 日本の脅威インテリジェンス市場の分析
12.14 韓国の脅威インテリジェンス市場の分析
12.15 オーストラリアの脅威インテリジェンス市場の分析
12.16 その他のアジア太平洋地域の脅威インテリジェンス市場分析
13 中東・アフリカの脅威インテリジェンス市場分析
13.1 主要な調査結果
13.2 中東・アフリカの脅威インテリジェンス市場魅力度指数
13.3 中東・アフリカの脅威インテリジェンス市場:国別、2023年、2028年、2033年(US$ Million)
13.4 中東・アフリカの脅威インテリジェンス市場規模推定と予測:金額
13.5 中東・アフリカの脅威インテリジェンス市場規模推定と予測:国別
13.6 中東・アフリカの脅威インテリジェンス市場規模推定と予測:導入形態別
13.7 中東・アフリカの脅威インテリジェンス市場規模推定と予測:用途別
13.8 中東・アフリカの脅威インテリジェンス市場規模推定と予測:サービス別
13.9 中東・アフリカの脅威インテリジェンス市場規模推定と予測:コンポーネント別
13.10 中東・アフリカの脅威インテリジェンス市場規模推定と予測:エンドユーザー別
13.11 GCCの脅威インテリジェンス市場分析
13.12 南アフリカの脅威インテリジェンス市場分析
13.13 その他の中東・アフリカ地域の脅威インテリジェンス市場分析
14 ラテンアメリカの脅威インテリジェンス市場分析
14.1 主要な調査結果
14.2 ラテンアメリカの脅威インテリジェンス市場魅力度指数
14.3 ラテンアメリカの脅威インテリジェンス市場:国別、2023年、2028年、2033年(US$ Million)
14.4 ラテンアメリカの脅威インテリジェンス市場規模推定と予測:金額別
14.5 ラテンアメリカの脅威インテリジェンス市場規模推定と予測:国別
14.6 ラテンアメリカの脅威インテリジェンス市場規模推定と予測:導入形態別
14.7 ラテンアメリカの脅威インテリジェンス市場規模推定と予測:用途別
14.8 ラテンアメリカの脅威インテリジェンス市場規模推定と予測:サービス別
14.9 ラテンアメリカの脅威インテリジェンス市場規模推定と予測:コンポーネント別
14.10 ラテンアメリカの脅威インテリジェンス市場規模推定と予測:エンドユーザー別
14.11 ブラジルの脅威インテリジェンス市場分析
14.12 メキシコの脅威インテリジェンス市場分析
14.13 その他のラテンアメリカの脅威インテリジェンス市場分析
15 会社概要
15.1 競争環境、2022年
15.2 戦略的展望
15.1 International Business Machines Corporation
15.1.1 会社概要
15.1.2 会社概要
15.1.3 財務分析
15.1.3.1 純収入、2018-2022年
15.1.3.2 R&D、2018-2022年
15.1.3.3 地域別売上シェア、2022年(%)
15.1.3.4 事業セグメント別売上シェア、2022年(%)
15.1.4 製品ベンチマーク
15.1.5 戦略的展望
15.2 Cisco Systems, Inc
15.2.1 会社概要
15.2.2 会社概要
15.2.3 財務分析
15.2.3.1 純収入、2018-2022年
15.2.3.2 R&D、2018-2022年
15.2.3.3 地域別収益シェア、2022年(%)
15.2.3.4 事業セグメント収益シェア、2022年(%)
15.2.4 製品ベンチマーク
15.2.5 戦略的展望
15.3 Trend Micro Inc.
15.3.1 会社概要
15.3.2 会社概要
15.3.3 財務分析
15.3.3.1 純収入、2018年~2022年
15.3.3.2 R&D、2018年~2022年
15.3.3.3 地域別収益シェア、2022年(%)
15.3.4 製品ベンチマーク
15.3.5 戦略的展望
15.4 McAfee Corp.
15.4.1 会社概要
15.4.2 会社概要
15.4.3 製品ベンチマーク
15.4.4 戦略的展望
15.5 Mimecast Limited
15.5.1 会社概要
15.5.2 会社概要
15.5.3 製品ベンチマーク
15.6 AT&T Inc.
15.6.1 会社概要
15.6.2 会社概要
15.6.3 財務分析
15.6.3.1 純収入、2018年〜2022年
15.6.3.2 地域別収益シェア、2022年(%)
15.6.3.3 事業セグメント別売上シェア、2022年(%)
15.6.4 製品ベンチマーク
15.6.5 戦略的展望
15.7 Check Point Software Technologies Ltd
15.7.1 会社概要
15.7.2 会社概要
15.7.3 財務分析
15.7.3.1 純収入(2018年~2022年
15.7.3.2 R&D、2018年~2022年
15.7.3.3 地域別収益シェア、2022年(%)
15.7.4 製品ベンチマーク
15.7.5 戦略的展望
15.8 DXC Technology
15.8.1 会社概要
15.8.2 会社概要
15.8.3 財務分析
15.8.3.1 純収入、2018年~2022年
15.8.3.2 地域別収益シェア、2022年(%)
15.8.3.3 事業セグメント別収益シェア、2022年(%)
15.8.4 製品ベンチマーク
15.8.5 戦略的展望
15.9 CrowdStrike Holdings, Inc
15.9.1 会社概要
15.9.2 会社概要
15.9.3 財務分析
15.9.3.1 純収入、2018-2022年
15.9.3.2 R&D、2018年~2022年
15.9.3.3 事業セグメント収益シェア、2022年(%)
15.9.4 製品ベンチマーク
15.9.5 戦略的展望
15.10 Juniper Networks, Inc
15.10.1 会社概要
15.10.2 会社概要
15.10.3 財務分析
15.10.3.1 純収入、2018-2022年
15.10.3.2 R&D、2018年~2022年
15.10.3.3 地域別収益シェア、2022年(%)
15.10.3.4 事業セグメント収益シェア、2022年(%)
15.10.4 製品ベンチマーク
15.10.5 戦略的展望
15.11 Fortinet, Inc.
15.11.1 会社概要
15.11.2 会社概要
15.11.3 財務分析
15.11.3.1 純収入、2018年~2022年
15.11.3.2 R&D、2018年~2022年
15.11.3.3 地域別収益シェア、2022年(%)
15.11.3.4 事業セグメント収益シェア、2022年(%)
15.11.4 製品ベンチマーク
15.11.5 戦略的展望
15.12 Forcepoint LLC
15.12.1 会社概要
15.12.2 会社概要
15.12.3 製品ベンチマーク
15.13 Anomali
15.13.1 会社概要
15.13.2 会社概要
15.13.3 製品ベンチマーク
15.13.4 戦略的展望
15.14 ThreatConnect, Inc
15.14.1 会社概要
15.14.2 会社概要
15.14.3 製品ベンチマーク
15.14.4 戦略的展望
15.15 Cyware
15.15.1 会社概要
15.15.2 会社概要
15.15.3 製品ベンチマーク
15.15.4 戦略的展望
16 結論と提言
16.1 Visiongainからの結びの言葉
16.2 市場プレイヤーへの提言
ページTOPに戻る
図表リスト
表の一覧
Table 1 Threat Intelligence Market Snapshot, 2023 & 2033 (US$ Billion, CAGR %)
Table 2 Global Threat Intelligence Market Forecast, 2023-2033 (US$ Bn, AGR (%), CAGR (%)) (V-Shaped Recovery Scenario)
Table 3 Global Threat Intelligence Market by Region, 2023-2033 (US$ Bn, AGR (%), CAGR (%)) (V-Shaped Recovery Scenario)
Table 4 Global Threat Intelligence Market Forecast, 2023-2033 (US$ Bn, AGR (%), CAGR (%)) (W-Shaped Recovery Scenario)
Table 5 Global Threat Intelligence Market by Region, 2023-2033 (US$ Bn, AGR (%), CAGR (%)) (W-Shaped Recovery Scenario)
Table 6 Global Threat Intelligence Market Forecast, 2023-2033 (US$ Bn, AGR (%), CAGR (%)) (U-Shaped Recovery Scenario)
Table 7 Global Threat Intelligence Market by Region, 2023-2033 (US$ Bn, AGR (%), CAGR (%)) (U-Shaped Recovery Scenario)
Table 8 Global Threat Intelligence Market Forecast, 2023-2033 (US$ Bn, AGR (%), CAGR (%)) (L-Shaped Recovery Scenario)
Table 9 Global Threat Intelligence Market by Region, 2023-2033 (US$ Bn, AGR (%), CAGR (%)) (L-Shaped Recovery Scenario)
Table 10 Global Threat Intelligence Market by Deployment Mode, 2023-2033 (US$ Bn, AGR (%), CAGR (%))
Table 11 Cloud Market by Region, 2023-2033 (US$ Bn, AGR (%), CAGR (%))
Table 12 On-premises Market by Region, 2023-2033 (US$ Bn, AGR (%), CAGR (%))
Table 13 Global Threat Intelligence Market by Application, 2023-2033 (US$ Bn, AGR (%), CAGR (%))
Table 14 Security Information and Event Management (SIEM) Market by Region, 2023-2033 (US$ Bn, AGR (%), CAGR (%))
Table 15 Government, Risk, and Compliance (GRC) Market by Region, 2023-2033 (US$ Bn, AGR (%), CAGR (%))
Table 16 Business Continuity Planning and Management Market by Region, 2023-2033 (US$ Bn, AGR (%), CAGR (%))
Table 17 Global Threat Intelligence Market by Services, 2023-2033 (US$ Bn, AGR (%), CAGR (%))
Table 18 Professional Services Market by Region, 2023-2033 (US$ Bn, AGR (%), CAGR (%))
Table 19 Managed Services Market by Region, 2023-2033 (US$ Bn, AGR (%), CAGR (%))
Table 20 Global Threat Intelligence Market by Component, 2023-2033 (US$ Bn, AGR (%), CAGR (%))
Table 21 Solutions Market by Region, 2023-2033 (US$ Bn, AGR (%), CAGR (%))
Table 22 Services Market by Region, 2023-2033 (US$ Bn, AGR (%), CAGR (%))
Table 23 Other Component Market by Region, 2023-2033 (US$ Bn, AGR (%), CAGR (%))
Table 24 Global Threat Intelligence Market by End-User, 2023-2033 (US$ Bn, AGR (%), CAGR (%))
Table 25 IT and ITeS Market by Region, 2023-2033 (US$ Bn, AGR (%), CAGR (%))
Table 26 BFSI Market by Region, 2023-2033 (US$ Bn, AGR (%), CAGR (%))
Table 27 Healthcare and Life Sciences Market by Region, 2023-2033 (US$ Bn, AGR (%), CAGR (%))
Table 28 Retail and eCommerce Market by Region, 2023-2033 (US$ Bn, AGR (%), CAGR (%))
Table 29 Manufacturing Market by Region, 2023-2033 (US$ Bn, AGR (%), CAGR (%))
Table 30 Other End-User Market by Region, 2023-2033 (US$ Bn, AGR (%), CAGR (%))
Table 31 Global Threat Intelligence Market Forecast, 2023-2033 (US$ Bn, AGR (%), CAGR (%))
Table 32 Global Threat Intelligence Market by Region, 2023-2033 (US$ Bn, AGR (%), CAGR (%))
Table 33 Global Threat Intelligence Market by Deployment Mode, 2023-2033 (US$ Bn, AGR (%), CAGR (%))
Table 34 Global Threat Intelligence Market by Application, 2023-2033 (US$ Bn, AGR (%), CAGR (%))
Table 35 Global Threat Intelligence Market by Services, 2023-2033 (US$ Bn, AGR (%), CAGR (%))
Table 36 Global Threat Intelligence Market by Component, 2023-2033 (US$ Bn, AGR (%), CAGR (%))
Table 37 Global Threat Intelligence Market by End-User, 2023-2033 (US$ Bn, AGR (%), CAGR (%))
Table 38 North America Threat Intelligence Market by Value, 2023-2033 (US$ Bn, AGR (%), CAGR (%))
Table 39 North America Threat Intelligence Market by Country, 2023-2033 (US$ Bn, AGR (%), CAGR (%))
Table 40 North America Threat Intelligence Market by Deployment Mode, 2023-2033 (US$ Bn, AGR (%), CAGR (%))
Table 41 North America Threat Intelligence Market by Application, 2023-2033 (US$ Bn, AGR (%), CAGR (%))
Table 42 North America Threat Intelligence Market by Services, 2023-2033 (US$ Bn, AGR (%), CAGR (%))
Table 43 North America Threat Intelligence Market by Component, 2023-2033 (US$ Bn, AGR (%), CAGR (%))
Table 44 North America Threat Intelligence Market by End-User, 2023-2033 (US$ Bn, AGR (%), CAGR (%))
Table 45 US Threat Intelligence Market by Value, 2023-2033 (US$ Bn, AGR (%), CAGR (%))
Table 46 Canada Threat Intelligence Market by Value, 2023-2033 (US$ Bn, AGR (%), CAGR (%))
Table 47 Europe Threat Intelligence Market by Value, 2023-2033 (US$ Bn, AGR (%), CAGR (%))
Table 48 Europe Threat Intelligence Market by Country, 2023-2033 (US$ Bn, AGR (%), CAGR (%))
Table 49 Europe Threat Intelligence Market by Deployment Mode, 2023-2033 (US$ Bn, AGR (%), CAGR (%))
Table 50 Europe Threat Intelligence Market by Application, 2023-2033 (US$ Bn, AGR (%), CAGR (%))
Table 51 Europe Threat Intelligence Market by Services, 2023-2033 (US$ Bn, AGR (%), CAGR (%))
Table 52 Europe Threat Intelligence Market by Component, 2023-2033 (US$ Bn, AGR (%), CAGR (%))
Table 53 Europe Threat Intelligence Market by End-User, 2023-2033 (US$ Bn, AGR (%), CAGR (%))
Table 54 Germany Threat Intelligence Market by Value, 2023-2033 (US$ Bn, AGR (%), CAGR (%))
Table 55 UK Threat Intelligence Market by Value, 2023-2033 (US$ Bn, AGR (%), CAGR (%))
Table 56 France Threat Intelligence Market by Value, 2023-2033 (US$ Bn, AGR (%), CAGR (%))
Table 57 Italy Threat Intelligence Market by Value, 2023-2033 (US$ Bn, AGR (%), CAGR (%))
Table 58 Russia Threat Intelligence Market by Value, 2023-2033 (US$ Bn, AGR (%), CAGR (%))
Table 59 Rest of Europe Threat Intelligence Market by Value, 2023-2033 (US$ Bn, AGR (%), CAGR (%))
Table 60 Asia-Pacific Threat Intelligence Market by Value, 2023-2033 (US$ Bn, AGR (%), CAGR (%))
Table 61 Asia-Pacific Threat Intelligence Market by Country, 2023-2033 (US$ Bn, AGR (%), CAGR (%))
Table 62 Asia-Pacific Threat Intelligence Market by Deployment Mode, 2023-2033 (US$ Bn, AGR (%), CAGR (%))
Table 63 Asia-Pacific Threat Intelligence Market by Application, 2023-2033 (US$ Bn, AGR (%), CAGR (%))
Table 64 Asia-Pacific Threat Intelligence Market by Services, 2023-2033 (US$ Bn, AGR (%), CAGR (%))
Table 65 Asia-Pacific Threat Intelligence Market by Component, 2023-2033 (US$ Bn, AGR (%), CAGR (%))
Table 66 Asia-Pacific Threat Intelligence Market by End-User, 2023-2033 (US$ Bn, AGR (%), CAGR (%))
Table 67 China Threat Intelligence Market by Value, 2023-2033 (US$ Bn, AGR (%), CAGR (%))
Table 68 India Threat Intelligence Market by Value, 2023-2033 (US$ Bn, AGR (%), CAGR (%))
Table 69 Japan Threat Intelligence Market by Value, 2023-2033 (US$ Bn, AGR (%), CAGR (%))
Table 70 South Korea Threat Intelligence Market by Value, 2023-2033 (US$ Bn, AGR (%), CAGR (%))
Table 71 Australia Threat Intelligence Market by Value, 2023-2033 (US$ Bn, AGR (%), CAGR (%))
Table 72 Rest of Asia-Pacific Threat Intelligence Market by Value, 2023-2033 (US$ Bn, AGR (%), CAGR (%))
Table 73 Middle East & Africa Threat Intelligence Market by Value, 2023-2033 (US$ Bn, AGR (%), CAGR (%))
Table 74 Middle East & Africa Threat Intelligence Market by Country, 2023-2033 (US$ Bn, AGR (%), CAGR (%))
Table 75 Middle East & Africa Threat Intelligence Market by Deployment Mode, 2023-2033 (US$ Bn, AGR (%), CAGR (%))
Table 76 Middle East & Africa Threat Intelligence Market by Application, 2023-2033 (US$ Bn, AGR (%), CAGR (%))
Table 77 Middle East & Africa Threat Intelligence Market by Services, 2023-2033 (US$ Bn, AGR (%), CAGR (%))
Table 78 Middle East & Africa Threat Intelligence Market by Component, 2023-2033 (US$ Bn, AGR (%), CAGR (%))
Table 79 Middle East & Africa Threat Intelligence Market by End-User, 2023-2033 (US$ Bn, AGR (%), CAGR (%))
Table 80 GCC Threat Intelligence Market by Value, 2023-2033 (US$ Bn, AGR (%), CAGR (%))
Table 81 South Africa Threat Intelligence Market by Value, 2023-2033 (US$ Bn, AGR (%), CAGR (%))
Table 82 Rest of Middle East & Africa Threat Intelligence Market by Value, 2023-2033 (US$ Bn, AGR (%), CAGR (%))
Table 83 Latin America Threat Intelligence Market by Value, 2023-2033 (US$ Bn, AGR (%), CAGR (%))
Table 84 Latin America Threat Intelligence Market by Country, 2023-2033 (US$ Bn, AGR (%), CAGR (%))
Table 85 Latin America Threat Intelligence Market by Deployment Mode, 2023-2033 (US$ Bn, AGR (%), CAGR (%))
Table 86 Latin America Threat Intelligence Market by Application, 2023-2033 (US$ Bn, AGR (%), CAGR (%))
Table 87 Latin America Threat Intelligence Market by Services, 2023-2033 (US$ Bn, AGR (%), CAGR (%))
Table 88 Latin America Threat Intelligence Market by Component, 2023-2033 (US$ Bn, AGR (%), CAGR (%))
Table 89 Latin America Threat Intelligence Market by End-User, 2023-2033 (US$ Bn, AGR (%), CAGR (%))
Table 90 Brazil Threat Intelligence Market by Value, 2023-2033 (US$ Bn, AGR (%), CAGR (%))
Table 91 Mexico Threat Intelligence Market by Value, 2023-2033 (US$ Bn, AGR (%), CAGR (%))
Table 92 Rest of Latin America Threat Intelligence Market by Value, 2023-2033 (US$ Bn, AGR (%), CAGR (%))
Table 93 Strategic Outlook : New Product Launch
Table 94 Strategic Outlook : Collaboration
Table 95 Strategic Outlook : Acquisition
Table 96 Strategic Outlook : Partnership
Table 97 Strategic Outlook : Expansion
Table 98 International Business Machines Corporation Key Details, (CEO, HQ, Revenue, Founded, No. of Employees, Company Type, Website, Business Segment)
Table 99 International Business Machines Corporation: Product Benchmarking
Table 100 International Business Machines Corporation: Strategic Outlook
Table 101 Cisco Systems, Inc Key Details, (CEO, HQ, Revenue, Founded, No. of Employees, Company Type, Website, Business Segment)
Table 102 Cisco Systems, Inc: Product Benchmarking
Table 103 Cisco Systems, Inc: Strategic Outlook
Table 104 Trend Micro Inc.Key Details, (CEO, HQ, Revenue, Founded, No. of Employees, Company Type, Website, Business Segment)
Table 105 Trend Micro Inc.: Product Benchmarking
Table 106 Trend Micro Inc.: Strategic Outlook
Table 107 McAfee Corp.Key Details, (CEO, HQ, Revenue, Founded, No. of Employees, Company Type, Website, Business Segment)
Table 108 McAfee Corp.: Product Benchmarking
Table 109 McAfee Corp.: Strategic Outlook
Table 110 Mimecast LimitedKey Details, (CEO, HQ, Revenue, Founded, No. of Employees, Company Type, Website, Business Segment)
Table 111 Mimecast Limited: Product Benchmarking
Table 112 AT&T Inc Key Details, (CEO, HQ, Revenue, Founded, No. of Employees, Company Type, Website, Business Segment)
Table 113 AT&T Inc: Product Benchmarking
Table 114 AT&T Inc: Strategic Outlook
Table 115 Check Point Software Technologies Ltd Key Details, (CEO, HQ, Revenue, Founded, No. of Employees, Company Type, Website, Business Segment)
Table 116 Check Point Software Technologies Ltd: Product Benchmarking
Table 117 Check Point Software Technologies Ltd: Strategic Outlook
Table 118 DXC Technology Key Details, (CEO, HQ, Revenue, Founded, No. of Employees, Company Type, Website, Business Segment)
Table 119 DXC Technology: Product Benchmarking
Table 120 DXC Technology: Strategic Outlook
Table 121 CrowdStrike Holdings, Inc Key Details, (CEO, HQ, Revenue, Founded, No. of Employees, Company Type, Website, Business Segment)
Table 122 CrowdStrike Holdings, Inc: Product Benchmarking
Table 123 CrowdStrike Holdings, Inc: Strategic Outlook
Table 124 Juniper Networks, Inc Key Details, (CEO, HQ, Revenue, Founded, No. of Employees, Company Type, Website, Business Segment)
Table 125 Juniper Networks, Inc: Product Benchmarking
Table 126 Juniper Networks, Inc: Strategic Outlook
Table 127 Fortinet, Inc : Key Details, (CEO, HQ, Revenue, Founded, No. of Employees, Company Type, Website, Business Segment)
Table 128 Fortinet, Inc: Product Benchmarking
Table 129 Fortinet, Inc: Strategic Outlook
Table 130 Forcepoint LLC Key Details, (CEO, HQ, Revenue, Founded, No. of Employees, Company Type, Website, Business Segment)
Table 131 Forcepoint LLC: Product Benchmarking
Table 132 Anomali :Key Details, (CEO, HQ, Revenue, Founded, No. of Employees, Company Type, Website, Business Segment)
Table 133 Anomali: Product Benchmarking
Table 134 Anomali: Strategic Outlook
Table 135 ThreatConnect, Inc Key Details, (CEO, HQ, Revenue, Founded, No. of Employees, Company Type, Website, Business Segment)
Table 136 ThreatConnect, Inc: Product Benchmarking
Table 137 ThreatConnect, Inc: Strategic Outlook
Table 138 Cyware Key Details, (CEO, HQ, Revenue, Founded, No. of Employees, Company Type, Website, Business Segment)
Table 139 Cyware: Product Benchmarking
Table 140 Cyware: Strategic Outlook
図の一覧
Figure 1 Threat Intelligence Market Segmentation
Figure 2 Threat Intelligence Market by Deployment Mode: Market Attractiveness Index
Figure 3 Threat Intelligence Market by Application: Market Attractiveness Index
Figure 4 Threat Intelligence Market by Services: Market Attractiveness Index
Figure 5 Threat Intelligence Market by Component: Market Attractiveness Index
Figure 6 Threat Intelligence Market by End-User: Market Attractiveness Index
Figure 7 Threat Intelligence Market Attractiveness Index by Region
Figure 8 Threat Intelligence Market: Market Dynamics
Figure 9 Global Threat Intelligence Market Forecast, 2023-2033 (US$ Bn, AGR (%)) (V-Shaped Recovery Scenario)
Figure 10 Global Threat Intelligence Market by Region, 2023-2033 (US$ Bn, AGR (%)) (V-Shaped Recovery Scenario)
Figure 11 Global Threat Intelligence Market Forecast, 2023-2033 (US$ Bn, AGR (%)) (W-Shaped Recovery Scenario)
Figure 12 Global Threat Intelligence Market by Region, 2023-2033 (US$ Bn, AGR (%))) (W-Shaped Recovery Scenario)
Figure 13 Global Threat Intelligence Market Forecast, 2023-2033 (US$ Bn, AGR (%)) (U-Shaped Recovery Scenario)
Figure 14 Global Threat Intelligence Market by Region, 2023-2033 (US$ Bn, AGR (%)) (U-Shaped Recovery Scenario)
Figure 15 Global Threat Intelligence Market Forecast, 2023-2033 (US$ Bn, AGR (%)) (L-Shaped Recovery Scenario)
Figure 16 Global Threat Intelligence Market by Region, 2023-2033 (US$ Bn, AGR (%)) (L-Shaped Recovery Scenario)
Figure 17 Threat Intelligence Market: Porter’s Five Forces Analysis
Figure 18 Threat Intelligence Market: PEST Analysis
Figure 19 Threat Intelligence Market by Deployment Mode: Market Attractiveness Index
Figure 20 Global Threat Intelligence Market by Deployment Mode, 2023-2033 (US$ Bn, AGR (%))
Figure 21 Global Threat Intelligence Market Forecast by Deployment Mode, 2023-2033 (%)
Figure 22 Cloud Market by Region, 2023-2033 (US$ Bn, AGR (%))
Figure 23 Deployment Mode Segment Market Share Forecast by Region, 2023 & 2033 (%)
Figure 24 On-premises Market by Region, 2023-2033 (US$ Bn, AGR (%))
Figure 25 Deployment Mode Segment Market Share Forecast by Region, 2023 & 2033 (%)
Figure 26 Threat Intelligence Market by Application: Market Attractiveness Index
Figure 27 Global Threat Intelligence Market by Application, 2023-2033 (US$ Bn, AGR (%))
Figure 28 Global Threat Intelligence Market Forecast by Application, 2023-2033 (%)
Figure 29 Security Information and Event Management (SIEM) Market by Region, 2023-2033 (US$ Bn, AGR (%))
Figure 30 Application Segment Market Share Forecast by Region, 2023 & 2033 (%)
Figure 31 Government, Risk, and Compliance (GRC) Market by Region, 2023-2033 (US$ Bn, AGR (%))
Figure 32 Application Segment Market Share Forecast by Region, 2023 & 2033 (%)
Figure 33 Business Continuity Planning and Management Market by Region, 2023-2033 (US$ Bn, AGR (%))
Figure 34 Application Segment Market Share Forecast by Region, 2023 & 2033 (%)
Figure 35 Threat Intelligence Market by Services: Market Attractiveness Index
Figure 36 Global Threat Intelligence Market by Services, 2023-2033 (US$ Bn, AGR (%))
Figure 37 Global Threat Intelligence Market Forecast by Services, 2023-2033 (%)
Figure 38 Professional Services Market by Region, 2023-2033 (US$ Bn, AGR (%))
Figure 39 Services Segment Market Share Forecast by Region, 2023 & 2033 (%)
Figure 40 Managed Services Market by Region, 2023-2033 (US$ Bn, AGR (%))
Figure 41 Services Segment Market Share Forecast by Region, 2023 & 2033 (%)
Figure 42 Threat Intelligence Market by Component: Market Attractiveness Index
Figure 43 Global Threat Intelligence Market by Component, 2023-2033 (US$ Bn, AGR (%))
Figure 44 Global Threat Intelligence Market Forecast by Component, 2023-2033 (%)
Figure 45 Solutions Market by Region, 2023-2033 (US$ Bn, AGR (%))
Figure 46 Components Segment Market Share Forecast by Region, 2023 & 2033 (%)
Figure 47 Services Market by Region, 2023-2033 (US$ Bn, AGR (%))
Figure 48 Components Segment Market Share Forecast by Region, 2023 & 2033 (%)
Figure 49 Other Component Market by Region, 2023-2033 (US$ Bn, AGR (%))
Figure 50 Components Segment Market Share Forecast by Region, 2023 & 2033 (%)
Figure 51 Threat Intelligence Market by End-User: Market Attractiveness Index
Figure 52 Global Threat Intelligence Market by End-User, 2023-2033 (US$ Bn, AGR (%))
Figure 53 Global Threat Intelligence Market Forecast by End-User, 2023-2033 (%)
Figure 54 IT and ITeS Market by Region, 2023-2033 (US$ Bn, AGR (%))
Figure 55 End-Users Segment Market Share Forecast by Region, 2023 & 2033 (%)
Figure 56 BFSI Market by Region, 2023-2033 (US$ Bn, AGR (%))
Figure 57 End-Users Segment Market Share Forecast by Region, 2023 & 2033 (%)
Figure 58 Healthcare and Life Sciences Market by Region, 2023-2033 (US$ Bn, AGR (%))
Figure 59 End-Users Segment Market Share Forecast by Region, 2023 & 2033 (%)
Figure 60 Retail and eCommerce Market by Region, 2023-2033 (US$ Bn, AGR (%))
Figure 61 End-Users Segment Market Share Forecast by Region, 2023 & 2033 (%)
Figure 62 Manufacturing Market by Region, 2023-2033 (US$ Bn, AGR (%))
Figure 63 End-Users Segment Market Share Forecast by Region, 2023 & 2033 (%)
Figure 64 Other End-User Market by Region, 2023-2033 (US$ Bn, AGR (%))
Figure 65 End-Users Segment Market Share Forecast by Region, 2023 & 2033 (%)
Figure 66 Threat Intelligence Market Forecast by Region 2023 and 2033 (Revenue, CAGR%)
Figure 67 Threat Intelligence Market Share Forecast by Region 2023, 2028, 2033 (%)
Figure 68 Global Threat Intelligence Market Forecast, 2023-2033 (US$ Bn, AGR (%))
Figure 69 Global Threat Intelligence Market by Region, 2023-2033 (US$ Bn, AGR (%))
Figure 70 Global Threat Intelligence Market by Deployment Mode, 2023-2033 (US$ Bn, AGR (%))
Figure 71 Global Threat Intelligence Market by Application, 2023-2033 (US$ Bn, AGR (%))
Figure 72 Global Threat Intelligence Market by Services, 2023-2033 (US$ Bn, AGR (%))
Figure 73 Global Threat Intelligence Market by Component, 2023-2033 (US$ Bn, AGR (%))
Figure 74 Global Threat Intelligence Market by End-User, 2023-2033 (US$ Bn, AGR (%))
Figure 75 North America Threat Intelligence Market Attractiveness Index
Figure 76 North America Threat Intelligence Market by Region, 2023, 2028 & 2033 (US$ Million)
Figure 77 North America Threat Intelligence Market by Value, 2023-2033 (US$ Bn, AGR (%))
Figure 78 North America Threat Intelligence Market by Country, 2023-2033 (US$ Bn, AGR (%))
Figure 79 North America Threat Intelligence Market Forecast by Country, 2023-2033 (%)
Figure 80 North America Threat Intelligence Market by Deployment Mode, 2023-2033 (US$ Bn, AGR (%))
Figure 81 North America Threat Intelligence Market Forecast by Deployment Mode, 2023-2033 (%)
Figure 82 North America Threat Intelligence Market by Application, 2023-2033 (US$ Bn, AGR (%))
Figure 83 North America Threat Intelligence Market Forecast by Application, 2023-2033 (%)
Figure 84 North America Threat Intelligence Market by Services, 2023-2033 (US$ Bn, AGR (%))
Figure 85 North America Threat Intelligence Market Forecast by Services, 2023-2033 (%)
Figure 86 North America Threat Intelligence Market by Component, 2023-2033 (US$ Bn, AGR (%))
Figure 87 North America Threat Intelligence Market Forecast by Component, 2023-2033 (%)
Figure 88 North America Threat Intelligence Market by End-User, 2023-2033 (US$ Bn, AGR (%))
Figure 89 North America Threat Intelligence Market Forecast by End-User, 2023-2033 (%)
Figure 90 US Threat Intelligence Market by Value, 2023-2033 (US$ Bn, AGR (%))
Figure 91 Canada Threat Intelligence Market by Value, 2023-2033 (US$ Bn, AGR (%))
Figure 92 Europe Threat Intelligence Market Attractiveness Index
Figure 93 Europe Threat Intelligence Market by Region, 2023, 2028 & 2033 (US$ Million)
Figure 94 Europe Threat Intelligence Market by Value, 2023-2033 (US$ Bn, AGR (%))
Figure 95 Europe Threat Intelligence Market by Country, 2023-2033 (US$ Bn, AGR (%))
Figure 96 Europe Threat Intelligence Market Forecast by Country, 2023-2033 (%)
Figure 97 Europe Threat Intelligence Market by Deployment Mode, 2023-2033 (US$ Bn, AGR (%))
Figure 98 Europe Threat Intelligence Market Forecast by Deployment Mode, 2023-2033 (%)
Figure 99 Europe Threat Intelligence Market by Application, 2023-2033 (US$ Bn, AGR (%))
Figure 100 Europe Threat Intelligence Market Forecast by Application, 2023-2033 (%)
Figure 101 Europe Threat Intelligence Market by Services, 2023-2033 (US$ Bn, AGR (%))
Figure 102 Europe Threat Intelligence Market Forecast by Services, 2023-2033 (%)
Figure 103 Europe Threat Intelligence Market by Component, 2023-2033 (US$ Bn, AGR (%))
Figure 104 Europe Threat Intelligence Market Forecast by Component, 2023-2033 (%)
Figure 105 Europe Threat Intelligence Market by End-User, 2023-2033 (US$ Bn, AGR (%))
Figure 106 Europe Threat Intelligence Market Forecast by End-User, 2023-2033 (%)
Figure 107 Germany Threat Intelligence Market by Value, 2023-2033 (US$ Bn, AGR (%))
Figure 108 UK Threat Intelligence Market by Value, 2023-2033 (US$ Bn, AGR (%))
Figure 109 France Threat Intelligence Market by Value, 2023-2033 (US$ Bn, AGR (%))
Figure 110 Italy Threat Intelligence Market by Value, 2023-2033 (US$ Bn, AGR (%))
Figure 111 Russia Threat Intelligence Market by Value, 2023-2033 (US$ Bn, AGR (%))
Figure 112 Rest of Europe Threat Intelligence Market by Value, 2023-2033 (US$ Bn, AGR (%))
Figure 113 Asia Pacific Threat Intelligence Market Attractiveness Index
Figure 114 Asia Pacific Threat Intelligence Market by Region, 2023, 2028 & 2033 (US$ Million)
Figure 115 Asia-Pacific Threat Intelligence Market by Value, 2023-2033 (US$ Bn, AGR (%))
Figure 116 Asia-Pacific Threat Intelligence Market by Country, 2023-2033 (US$ Bn, AGR (%))
Figure 117 Asia-Pacific Threat Intelligence Market Forecast by Country, 2023-2033 (%)
Figure 118 Asia-Pacific Threat Intelligence Market by Deployment Mode, 2023-2033 (US$ Bn, AGR (%))
Figure 119 Asia-Pacific Threat Intelligence Market Forecast by Deployment Mode, 2023-2033 (%)
Figure 120 Asia-Pacific Threat Intelligence Market by Application, 2023-2033 (US$ Bn, AGR (%))
Figure 121 Asia-Pacific Threat Intelligence Market Forecast by Application, 2023-2033 (%)
Figure 122 Asia-Pacific Threat Intelligence Market by Services, 2023-2033 (US$ Bn, AGR (%))
Figure 123 Asia-Pacific Threat Intelligence Market Forecast by Services, 2023-2033 (%)
Figure 124 Asia-Pacific Threat Intelligence Market by Component, 2023-2033 (US$ Bn, AGR (%))
Figure 125 Asia-Pacific Threat Intelligence Market Forecast by Component, 2023-2033 (%)
Figure 126 Asia-Pacific Threat Intelligence Market by End-User, 2023-2033 (US$ Bn, AGR (%))
Figure 127 Asia-Pacific Threat Intelligence Market Forecast by End-Usert, 2023-2033 (%)
Figure 128 China Threat Intelligence Market by Value, 2023-2033 (US$ Bn, AGR (%))
Figure 129 India Threat Intelligence Market by Value, 2023-2033 (US$ Bn, AGR (%))
Figure 130 Japan Threat Intelligence Market by Value, 2023-2033 (US$ Bn, AGR (%))
Figure 131 South Korea Threat Intelligence Market by Value, 2023-2033 (US$ Bn, AGR (%))
Figure 132 Australia Threat Intelligence Market by Value, 2023-2033 (US$ Bn, AGR (%))
Figure 133 Rest of Asia-Pacific Threat Intelligence Market by Value, 2023-2033 (US$ Bn, AGR (%))
Figure 134 Middle East & Africa Threat Intelligence Market Attractiveness Index
Figure 135 Middle East & Africa Threat Intelligence Market by Region, 2023, 2028 & 2033 (US$ Million)
Figure 136 Middle East & Africa Threat Intelligence Market by Value, 2023-2033 (US$ Bn, AGR (%))
Figure 137 Middle East & Africa Threat Intelligence Market by Country, 2023-2033 (US$ Bn, AGR (%))
Figure 138 Middle East & Africa Threat Intelligence Market Forecast by Component, 2023-2033 (%)
Figure 139 Middle East & Africa Threat Intelligence Market by Deployment Mode, 2023-2033 (US$ Bn, AGR (%))
Figure 140 Middle East & Africa Threat Intelligence Market Forecast by Deployment Mode, 2023-2033 (%)
Figure 141 Middle East & Africa Threat Intelligence Market by Application, 2023-2033 (US$ Bn, AGR (%))
Figure 142 Middle East & Africa Threat Intelligence Market Forecast by Application, 2023-2033 (%)
Figure 143 Middle East & Africa Threat Intelligence Market by Services, 2023-2033 (US$ Bn, AGR (%))
Figure 144 Middle East & Africa Threat Intelligence Market Forecast by Services, 2023-2033 (%)
Figure 145 Middle East & Africa Threat Intelligence Market by Component, 2023-2033 (US$ Bn, AGR (%))
Figure 146 Middle East & Africa Threat Intelligence Market Forecast by Component, 2023-2033 (%)
Figure 147 Middle East & Africa Threat Intelligence Market by End-User, 2023-2033 (US$ Bn, AGR (%))
Figure 148 Middle East & Africa Threat Intelligence Market Forecast by End-User, 2023-2033 (%)
Figure 149 GCC Threat Intelligence Market by Value, 2023-2033 (US$ Bn, AGR (%))
Figure 150 South Africa Threat Intelligence Market by Value, 2023-2033 (US$ Bn, AGR (%))
Figure 151 Rest of Middle East & Africa Threat Intelligence Market by Value, 2023-2033 (US$ Bn, AGR (%))
Figure 152 Latin America Threat Intelligence Market Attractiveness Index
Figure 153 Latin America Threat Intelligence Market by Region, 2023, 2028 & 2033 (US$ Million)
Figure 154 Latin America Threat Intelligence Market by Value, 2023-2033 (US$ Bn, AGR (%))
Figure 155 Latin America Threat Intelligence Market by Country, 2023-2033 (US$ Bn, AGR (%))
Figure 156 Latin America Threat Intelligence Market Forecast by Country, 2023-2033 (%)
Figure 157 Latin America Threat Intelligence Market by Deployment Mode, 2023-2033 (US$ Bn, AGR (%))
Figure 158 Latin America Threat Intelligence Market Forecast by Deployment Mode, 2023-2033 (%)
Figure 159 Latin America Threat Intelligence Market by Application, 2023-2033 (US$ Bn, AGR (%))
Figure 160 Latin America Threat Intelligence Market Forecast by Application, 2023-2033 (%)
Figure 161 Latin America Threat Intelligence Market by Services, 2023-2033 (US$ Bn, AGR (%))
Figure 162 Latin America Threat Intelligence Market Forecast by Services, 2023-2033 (%)
Figure 163 Latin America Threat Intelligence Market by Component, 2023-2033 (US$ Bn, AGR (%))
Figure 164 Latin America Threat Intelligence Market Forecast by Component, 2023-2033 (%)
Figure 165 Latin America Threat Intelligence Market by End-User, 2023-2033 (US$ Bn, AGR (%))
Figure 166 Latin America Threat Intelligence Market Forecast by End-User, 2023-2033 (%)
Figure 167 Brazil Threat Intelligence Market by Value, 2023-2033 (US$ Bn, AGR (%))
Figure 168 Mexico Threat Intelligence Market by Value, 2023-2033 (US$ Bn, AGR (%))
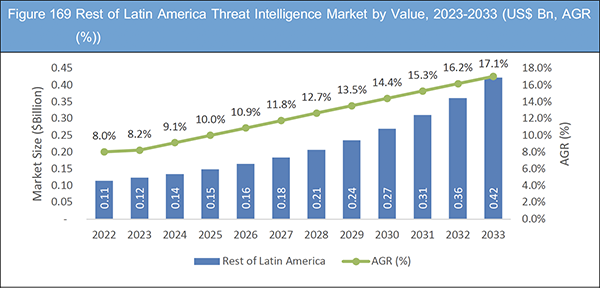
Figure 169 Rest of Latin America Threat Intelligence Market by Value, 2023-2033 (US$ Bn, AGR (%))
Figure 170 Threat Intelligence Market: Company Share, 2022
Figure 171 International Business Machines Corporation: Net Revenue, 2018-2022 (US$ Million, AGR%)
Figure 172 International Business Machines Corporation: R&D, 2018-2022 (US$ Million, AGR%)
Figure 173 International Business Machines Corporation: Regional Revenue Share, 2022 (%)
Figure 174 International Business Machines Corporation: Business Segment Revenue Share, 2022 (%)
Figure 175 Cisco Systems, Inc: Net Revenue, 2018-2022 (US$ Million, AGR%)
Figure 176 Cisco Systems, Inc: R&D, 2018-2022 (US$ Million, AGR%)
Figure 177 Cisco Systems, Inc: Regional Revenue Share, 2022 (%)
Figure 178 Cisco Systems, Inc: Business Segment Revenue Share, 2022 (%)
Figure 179 Trend Micro Inc.: Net Revenue, 2018-2022 (US$ Million, AGR%)
Figure 180 Trend Micro Inc.: R&D, 2018-2022 (US$ Million, AGR%)
Figure 181 Trend Micro Inc.: Regional Revenue Share, 2022 (%)
Figure 182 AT&T Inc: Net Revenue, 2018-2022 (US$ Million, AGR%)
Figure 183 AT&T Inc: Regional Revenue Share, 2022 (%)
Figure 184 AT&T Inc: Business Segment Revenue Share, 2022 (%)
Figure 185 Check Point Software Technologies Ltd: Net Revenue, 2018-2022 (US$ Million, AGR%)
Figure 186 Check Point Software Technologies Ltd: R&D, 2018-2022 (US$ Million, AGR%)
Figure 187 Check Point Software Technologies Ltd: Regional Revenue Share, 2022 (%)
Figure 188 DXC Technology: Net Revenue, 2018-2022 (US$ Million, AGR%)
Figure 189 DXC Technology: Regional Revenue Share, 2022 (%)
Figure 190 DXC Technology: Business Segment Revenue Share, 2022 (%)
Figure 191 CrowdStrike Holdings, Inc: Net Revenue, 2018-2022 (US$ Million, AGR%)
Figure 192 CrowdStrike Holdings, Inc: R&D, 2018-2022 (US$ Million, AGR%)
Figure 193 CrowdStrike Holdings, Inc: Business Segment Revenue Share, 2022 (%)
Figure 194 Juniper Networks, Inc: Net Revenue, 2018-2022 (US$ Million, AGR%)
Figure 195 Juniper Networks, Inc: R&D, 2018-2022 (US$ Million, AGR%)
Figure 196 Juniper Networks, Inc: Regional Revenue Share, 2022 (%)
Figure 197 Juniper Networks, Inc: Business Segment Revenue Share, 2022 (%)
Figure 198 Fortinet, Inc: Net Revenue, 2018-2022 (US$ Million, AGR%)
Figure 199 Fortinet, Inc: R&D, 2018-2022 (US$ Million, AGR%)
Figure 200 Fortinet, Inc: Regional Revenue Share, 2022 (%)
Figure 201 Fortinet, Inc: Business Segment Revenue Share, 2022 (%)
ページTOPに戻る
Summary
Report Details
The Threat Intelligence Market Report 2023-2033: This report will prove invaluable to leading firms striving for new revenue pockets if they wish to better understand the industry and its underlying dynamics. It will be useful for companies that would like to expand into different industries or to expand their existing operations in a new region.
Growing Frequency and Impact of Cyber Attacks
Cyber-attacks have become more frequent and impactful across industries. High-profile data breaches and ransomware incidents have demonstrated the potential financial and reputational damage that organizations face. To effectively combat these threats, organizations require timely and accurate information about the latest attack trends. Threat intelligence offers real-time data on emerging threats, enabling organizations to anticipate and mitigate potential breaches. By leveraging this intelligence, organizations can strengthen their incident response capabilities, minimize the impact of attacks, and protect their valuable assets.
Increasing Sophistication of Cyber Threats
As technology evolves, so do cyber threats. Cybercriminals constantly develop sophisticated techniques and tools to breach networks, steal data, and disrupt operations. This complexity makes it essential for organizations to stay ahead of the evolving threat landscape. Threat intelligence provides valuable insights into emerging threats, including new attack vectors, advanced malware, and tactics used by adversaries. By leveraging threat intelligence, organizations can proactively identify vulnerabilities, strengthen their defences, and minimize the risk of falling victim to sophisticated cyber-attacks.
What Questions Should You Ask before Buying a Market Research Report?
• How is the threat intelligence market evolving?
• What is driving and restraining the threat intelligence market?
• How will each threat intelligence submarket segment grow over the forecast period and how much revenue will these submarkets account for in 2033?
• How will the market shares for each threat intelligence submarket develop from 2023 to 2033?
• What will be the main driver for the overall market from 2023 to 2033?
• Will leading threat intelligence markets broadly follow the macroeconomic dynamics, or will individual national markets outperform others?
• How will the market shares of the national markets change by 2033 and which geographical region will lead the market in 2033?
• Who are the leading players and what are their prospects over the forecast period?
• What are the threat intelligence projects for these leading companies?
• How will the industry evolve during the period between 2023 and 2033? What are the implications of threat intelligence projects taking place now and over the next 10 years?
• Is there a greater need for product commercialisation to further scale the threat intelligence market?
• Where is the threat intelligence market heading and how can you ensure you are at the forefront of the market?
• What are the best investment options for new product and service lines?
• What are the key prospects for moving companies into a new growth path and C-suite?
You need to discover how this will impact the threat intelligence market today, and over the next 10 years:
• Our 340-page report provides 140 tables and 201 charts/graphs exclusively to you.
• The report highlights key lucrative areas in the industry so you can target them – NOW.
• It contains in-depth analysis of global, regional and national sales and growth.
• It highlights for you the key successful trends, changes and revenue projections made by your competitors.
This report tells you TODAY how the threat intelligence market will develop in the next 10 years, and in line with the variations in COVID-19 economic recession and bounce. This market is more critical now than at any point over the last 10 years.
Forecasts to 2033 and other analyses reveal commercial prospects
• In addition to revenue forecasting to 2033, our new study provides you with recent results, growth rates, and market shares.
• You will find original analyses, with business outlooks and developments.
• Discover qualitative analyses (including market dynamics, drivers, opportunities, restraints and challenges), cost structure, impact of rising threat intelligence prices and recent developments.
This report includes data analysis and invaluable insight into how COVID-19 will affect the industry and your company. Four COVID-19 recovery patterns and their impact, namely, “V”, “L”, “W” and “U” are discussed in this report.
Segments Covered in the Report
Market Segment by Deployment Mode
• Cloud
• On-premises
Market Segment by Application
• Security Information and Event Management (SIEM)
• Government, Risk, and Compliance (GRC)
• Business Continuity Planning and Management
Market Segment by Services
• Professional Services
• Managed Services
Market Segment by Component
• Solutions
• Services
• Other Component
Market Segment by End-User
• IT and ITeS
• BFSI
• Healthcare and Life Sciences
• Retail and eCommerce
• Manufacturing
• Other End-User
In addition to the revenue predictions for the overall world market and segments, you will also find revenue forecasts for four regional and 16 leading national markets:
North America
• U.S.
• Canada
Europe
• Germany
• Spain
• United Kingdom
• France
• Italy
• Rest of Europe
Asia Pacific
• China
• Japan
• India
• Australia
• South Korea
• Rest of Asia Pacific
Latin America
• Brazil
• Mexico
• Rest of Latin America
Middle East & Africa
• GCC
• South Africa
• Rest of Middle East & Africa
The report also includes profiles and for some of the leading companies in the Threat Intelligence Market, 2023 to 2033, with a focus on this segment of these companies’ operations.
Leading companies and the potential for market growth
• Anomali
• AT&T Inc.
• Check Point Software Technologies Ltd
• Cisco Systems, Inc.
• CrowdStrike Holdings, Inc.
• Cyware
• DXC Technology
• Forcepoint LLC
• Fortinet, Inc.
• International Business Machines Corporation
• Juniper Networks, Inc.
• McAfee Corp.
• Mimecast Limited
• ThreatConnect, Inc.
• Trend Micro Inc.
Overall world revenue for Threat Intelligence Market, 2023 to 2033 in terms of value the market will surpass US$9.55 billion in 2023, our work calculates. We predict strong revenue growth through to 2033. Our work identifies which organizations hold the greatest potential. Discover their capabilities, progress, and commercial prospects, helping you stay ahead.
How will the Threat Intelligence Market, 2023 to 2033 report help you?
In summary, our 340+ page report provides you with the following knowledge:
• Revenue forecasts to 2033 for Threat Intelligence Market, 2023 to 2033 Market, with forecasts for deployment mode, application, services, component, end-user and company size, each forecast at a global and regional level – discover the industry’s prospects, finding the most lucrative places for investments and revenues.
• Revenue forecasts to 2033 for four regional and 20 key national markets – See forecasts for the Threat Intelligence Market, 2023 to 2033 market in North America, Europe, Asia-Pacific, Latin America and Middle East & Africa. Also forecasted is the market in the US, Canada, Brazil, Germany, France, UK, Italy, China, India, Japan, and Australia among other prominent economies.
• Prospects for established firms and those seeking to enter the market – including company profiles for 15 of the major companies involved in the Threat Intelligence Market, 2023 to 2033.
Find quantitative and qualitative analyses with independent predictions. Receive information that only our report contains, staying informed with invaluable business intelligence.
Information found nowhere else
With our new report, you are less likely to fall behind in knowledge or miss out on opportunities. See how our work could benefit your research, analyses, and decisions. Visiongain’s study is for everybody needing commercial analyses for the Threat Intelligence Market, 2023 to 2033, market-leading companies. You will find data, trends and predictions.
ページTOPに戻る
Table of Contents
Table of Contents
1 Report Overview
1.1 Objectives of the Study
1.2 Introduction to Threat Intelligence Market
1.3 What This Report Delivers
1.4 Why You Should Read This Report
1.5 Key Questions Answered by this Analytical Report
1.6 Who Is this Report for?
1.7 Research Methodology
1.7.1 Market Definitions
1.7.1.1 Deployment Modes of Threat Intelligence Market
1.7.1.2 Applications of Threat Intelligence Market:
1.7.1.3 Services of Threat Intelligence Market
1.7.1.4 Components of the Threat Intelligence Market:
1.7.1.5 End-Users of the Threat Intelligence Market
1.7.2 Market Evaluation & Forecasting Methodology
1.7.3 Data Validation
1.7.3.1 Primary Research
1.7.3.2 Secondary Research
1.8 Frequently Asked Questions (FAQs)
1.9 Associated Visiongain Reports
1.10 About Visiongain
2 Executive Summary
2.1 Segment Analysis
2.1.1 Deployment Mode Segment: Market Attractiveness Index
2.1.2 Application Segment: Market Attractiveness Index
2.1.3 Services Segment: Market Attractiveness Index
2.1.4 Component Segment: Market Attractiveness Index
2.1.5 End-User Segment: Market Attractiveness Index
2.2 Regional Analysis
3 Market Overview
3.1 Key Findings
3.2 Market Dynamics
3.2.1 Market Driving Factors
3.2.1.1 Increasing Sophistication of Cyber Threats
3.2.1.2 Growing Regulatory Compliance Requirements
3.2.1.3 Rise in Cyber Attacks and Data Breaches
3.2.2 Market Restraining Factors
3.2.2.1 Lack of Skilled Workforce and Talent Gap
3.2.2.2 Complexity And Interoperability Challenges
3.2.2.3 Cost and Budget Constraints
3.2.3 Market Opportunities
3.2.3.1 Increasing Adoption of Cloud and IoT Technologies
3.2.3.2 Integration of Artificial Intelligence (AI) and Machine Learning (ML) in Threat Intelligence
3.2.3.3 Industry-Specific Threat Intelligence Solutions
3.3 COVID-19 Impact Analysis
3.3.1 V-Shaped Recovery
3.3.2 W-Shaped Recovery
3.3.3 U-Shaped Recovery
3.3.1 L-Shaped Recovery
3.4 Porter’s Five Forces Analysis
3.4.1 Bargaining Power of Suppliers (Low)
3.4.2 Bargaining Power of Buyers (High)
3.4.3 Competitive Rivalry (High)
3.4.4 Threat from Substitutes (Low)
3.4.5 Threat of New Entrants (Moderate)
3.5 PEST Analysis
3.5.1 Political Factors
3.5.2 Economic Factors
3.5.3 Sociocultural Factors
3.5.4 Technological Factors
4 Threat Intelligence Market Analysis by Deployment Mode
4.1 Key Findings
4.2 Deployment Mode Segment: Market Attractiveness Index
4.3 Threat Intelligence Market Size Estimation and Forecast by Deployment Mode
4.4 Cloud Market
4.4.1 Market Size by Region, 2023-2033 (US$ Billion)
4.4.2 Market Share by Region, 2023 & 2033 (%)
4.5 On-Premise Market
4.5.1 Market Size by Region, 2023-2033 (US$ Billion)
4.5.2 Market Share by Region, 2023 & 2033 (%)
5 Threat Intelligence Market Analysis by Application
5.1 Key Findings
5.2 Application Segment: Market Attractiveness Index
5.3 Threat Intelligence Market Size Estimation and Forecast by Application
5.4 SIEM Market
5.4.1 Market Size by Region, 2023-2033 (US$ Billion)
5.4.2 Market Share by Region, 2023 & 2033 (%)
5.5 GRC Market
5.5.1 Market Size by Region, 2023-2033 (US$ Billion)
5.5.2 Market Share by Region, 2023 & 2033 (%)
5.6 Business Continuity Planning and Management Market
5.6.1 Market Size by Region, 2023-2033 (US$ Billion)
5.6.2 Market Share by Region, 2023 & 2033 (%)
6 Threat Intelligence Market Analysis by Services
6.1 Key Findings
6.2 Services Segment: Market Attractiveness Index
6.3 Threat Intelligence Market Size Estimation and Forecast by Services
6.4 Professional Services Market
6.4.1 Market Size by Region, 2023-2033 (US$ Billion)
6.4.2 Market Share by Region, 2023 & 2033 (%)
6.5 Managed Services Market
6.5.1 Market Size by Region, 2023-2033 (US$ Billion)
6.5.2 Market Share by Region, 2023 & 2033 (%)
7 Threat Intelligence Market Analysis by Component
7.1 Key Findings
7.2 Component Segment: Market Attractiveness Index
7.3 Threat Intelligence Market Size Estimation and Forecast by Component
7.4 Solutions Market
7.4.1 Market Size by Region, 2023-2033 (US$ Billion)
7.4.2 Market Share by Region, 2023 & 2033 (%)
7.5 Services Market
7.5.1 Market Size by Region, 2023-2033 (US$ Billion)
7.5.2 Market Share by Region, 2023 & 2033 (%)
7.6 Other Component Market
7.6.1 Market Size by Region, 2023-2033 (US$ Billion)
7.6.2 Market Share by Region, 2023 & 2033 (%)
8 Threat Intelligence Market Analysis by End-User
8.1 Key Findings
8.2 End-User Segment: Market Attractiveness Index
8.3 Threat Intelligence Market Size Estimation and Forecast by End-User
8.4 IT and ITeS Market
8.4.1 Market Size by Region, 2023-2033 (US$ Billion)
8.4.2 Market Share by Region, 2023 & 2033 (%)
8.5 BFSI Market
8.5.1 Market Size by Region, 2023-2033 (US$ Billion)
8.5.2 Market Share by Region, 2023 & 2033 (%)
8.6 Healthcare and Life Sciences Market
8.6.1 Market Size by Region, 2023-2033 (US$ Billion)
8.6.2 Market Share by Region, 2023 & 2033 (%)
8.7 Retail and E-Commerce Market
8.7.1 Market Size by Region, 2023-2033 (US$ Billion)
8.7.2 Market Share by Region, 2023 & 2033 (%)
8.8 Manufacturing Market
8.8.1 Market Size by Region, 2023-2033 (US$ Billion)
8.8.2 Market Share by Region, 2023 & 2033 (%)
8.9 Other End-User Market
8.9.1 Market Size by Region, 2023-2033 (US$ Billion)
8.9.2 Market Share by Region, 2023 & 2033 (%)
9 Threat Intelligence Market Analysis by Region
9.1 Key Findings
9.2 Regional Market Size Estimation and Forecast
10 North America Threat Intelligence Market Analysis
10.1 Key Findings
10.2 North America Threat Intelligence Market Attractiveness Index
10.3 North America Threat Intelligence Market by Country, 2023, 2028 & 2033 (US$ Million)
10.4 North America Threat Intelligence Market Size Estimation and Forecast by Value
10.5 North America Threat Intelligence Market Size Estimation and Forecast by Country
10.6 North America Threat Intelligence Market Size Estimation and Forecast by Deployment Mode
10.7 North America Threat Intelligence Market Size Estimation and Forecast by Application
10.8 North America Threat Intelligence Market Size Estimation and Forecast by Services
10.9 North America Threat Intelligence Market Size Estimation and Forecast by Component
10.10 North America Threat Intelligence Market Size Estimation and Forecast by End-User
10.11 US Threat Intelligence Market Analysis
10.12 Canada Threat Intelligence Market Analysis
11 Europe Threat Intelligence Market Analysis
11.1 Key Findings
11.2 Europe Threat Intelligence Market Attractiveness Index
11.3 Europe Threat Intelligence Market by Country, 2023, 2028 & 2033 (US$ Million)
11.4 Europe Threat Intelligence Market Size Estimation and Forecast by Value
11.5 Europe Threat Intelligence Market Size Estimation and Forecast by Country
11.6 Europe Threat Intelligence Market Size Estimation and Forecast by Deployment Mode
11.7 Europe Threat Intelligence Market Size Estimation and Forecast by Application
11.8 Europe Threat Intelligence Market Size Estimation and Forecast by Services
11.9 Europe Threat Intelligence Market Size Estimation and Forecast by Component
11.10 Europe Threat Intelligence Market Size Estimation and Forecast by End-User
11.11 Germany Threat Intelligence Market Analysis
11.12 UK Threat Intelligence Market Analysis
11.13 France Threat Intelligence Market Analysis
11.14 Italy Threat Intelligence Market Analysis
11.15 Russia Threat Intelligence Market Analysis
11.16 Rest of Europe Threat Intelligence Market Analysis
12 Asia Pacific Threat Intelligence Market Analysis
12.1 Key Findings
12.2 Asia Pacific Threat Intelligence Market Attractiveness Index
12.3 Asia Pacific Threat Intelligence Market by Country, 2023, 2028 & 2033 (US$ Million)
12.4 Asia Pacific Threat Intelligence Market Size Estimation and Forecast by Value
12.5 Asia Pacific Threat Intelligence Market Size Estimation and Forecast by Country
12.6 Asia Pacific Threat Intelligence Market Size Estimation and Forecast by Deployment Mode
12.7 Asia Pacific Threat Intelligence Market Size Estimation and Forecast by Application
12.8 Asia Pacific Threat Intelligence Market Size Estimation and Forecast by Services
12.9 Asia Pacific Threat Intelligence Market Size Estimation and Forecast by Component
12.10 Asia Pacific Threat Intelligence Market Size Estimation and Forecast by End-User
12.11 China Threat Intelligence Market Analysis
12.12 India Threat Intelligence Market Analysis
12.13 Japan Threat Intelligence Market Analysis
12.14 South Korea Threat Intelligence Market Analysis
12.15 Australia Threat Intelligence Market Analysis
12.16 Rest of Asia Pacific Threat Intelligence Market Analysis
13 Middle East & Africa Threat Intelligence Market Analysis
13.1 Key Findings
13.2 Middle East & Africa Threat Intelligence Market Attractiveness Index
13.3 Middle East & Africa Threat Intelligence Market by Country, 2023, 2028 & 2033 (US$ Million)
13.4 Middle East & Africa Threat Intelligence Market Size Estimation and Forecast by Value
13.5 Middle East & Africa Threat Intelligence Market Size Estimation and Forecast by Country
13.6 Middle East & Africa Threat Intelligence Market Size Estimation and Forecast by Deployment Mode
13.7 Middle East & Africa Threat Intelligence Market Size Estimation and Forecast by Application
13.8 Middle East & Africa Threat Intelligence Market Size Estimation and Forecast by Services
13.9 Middle East & Africa Threat Intelligence Market Size Estimation and Forecast by Component
13.10 Middle East & Africa Threat Intelligence Market Size Estimation and Forecast by End-User
13.11 GCC Threat Intelligence Market Analysis
13.12 South Africa Threat Intelligence Market Analysis
13.13 Rest of Middle East & Africa Threat Intelligence Market Analysis
14 Latin America Threat Intelligence Market Analysis
14.1 Key Findings
14.2 Latin America Threat Intelligence Market Attractiveness Index
14.3 Latin America Threat Intelligence Market by Country, 2023, 2028 & 2033 (US$ Million)
14.4 Latin America Threat Intelligence Market Size Estimation and Forecast by Value
14.5 Latin America Threat Intelligence Market Size Estimation and Forecast by Country
14.6 Latin America Threat Intelligence Market Size Estimation and Forecast by Deployment Mode
14.7 Latin America Threat Intelligence Market Size Estimation and Forecast by Application
14.8 Latin America Threat Intelligence Market Size Estimation and Forecast by Services
14.9 Latin America Threat Intelligence Market Size Estimation and Forecast by Component
14.10 Latin America Threat Intelligence Market Size Estimation and Forecast by End-User
14.11 Brazil Threat Intelligence Market Analysis
14.12 Mexico Threat Intelligence Market Analysis
14.13 Rest of Latin America Threat Intelligence Market Analysis
15 Company Profiles
15.1 Competitive Landscape, 2022
15.2 Strategic Outlook
15.1 International Business Machines Corporation
15.1.1 Company Snapshot
15.1.2 Company Overview
15.1.3 Financial Analysis
15.1.3.1 Net Revenue, 2018-2022
15.1.3.2 R&D, 2018-2022
15.1.3.3 Regional Revenue Share, 2022 (%)
15.1.3.4 Business Segment Revenue Share, 2022 (%)
15.1.4 Product Benchmarking
15.1.5 Strategic Outlook
15.2 Cisco Systems, Inc
15.2.1 Company Snapshot
15.2.2 Company Overview
15.2.3 Financial Analysis
15.2.3.1 Net Revenue, 2018-2022
15.2.3.2 R&D, 2018-2022
15.2.3.3 Regional Revenue Share, 2022 (%)
15.2.3.4 Business Segment Revenue Share, 2022 (%)
15.2.4 Product Benchmarking
15.2.5 Strategic Outlook
15.3 Trend Micro Inc.
15.3.1 Company Snapshot
15.3.2 Company Overview
15.3.3 Financial Analysis
15.3.3.1 Net Revenue, 2018-2022
15.3.3.2 R&D, 2018-2022
15.3.3.3 Regional Revenue Share, 2022 (%)
15.3.4 Product Benchmarking
15.3.5 Strategic Outlook
15.4 McAfee Corp.
15.4.1 Company Snapshot
15.4.2 Company Overview
15.4.3 Product Benchmarking
15.4.4 Strategic Outlook
15.5 Mimecast Limited
15.5.1 Company Snapshot
15.5.2 Company Overview
15.5.3 Product Benchmarking
15.6 AT&T Inc.
15.6.1 Company Snapshot
15.6.2 Company Overview
15.6.3 Financial Analysis
15.6.3.1 Net Revenue, 2018-2022
15.6.3.2 Regional Revenue Share, 2022 (%)
15.6.3.3 Business Segment Revenue Share, 2022 (%)
15.6.4 Product Benchmarking
15.6.5 Strategic Outlook
15.7 Check Point Software Technologies Ltd
15.7.1 Company Snapshot
15.7.2 Company Overview
15.7.3 Financial Analysis
15.7.3.1 Net Revenue, 2018-2022
15.7.3.2 R&D, 2018-2022
15.7.3.3 Regional Revenue Share, 2022 (%)
15.7.4 Product Benchmarking
15.7.5 Strategic Outlook
15.8 DXC Technology
15.8.1 Company Snapshot
15.8.2 Company Overview
15.8.3 Financial Analysis
15.8.3.1 Net Revenue, 2018-2022
15.8.3.2 Regional Revenue Share, 2022 (%)
15.8.3.3 Business Segment Revenue Share, 2022 (%)
15.8.4 Product Benchmarking
15.8.5 Strategic Outlook
15.9 CrowdStrike Holdings, Inc
15.9.1 Company Snapshot
15.9.2 Company Overview
15.9.3 Financial Analysis
15.9.3.1 Net Revenue, 2018-2022
15.9.3.2 R&D, 2018-2022
15.9.3.3 Business Segment Revenue Share, 2022 (%)
15.9.4 Product Benchmarking
15.9.5 Strategic Outlook
15.10 Juniper Networks, Inc
15.10.1 Company Snapshot
15.10.2 Company Overview
15.10.3 Financial Analysis
15.10.3.1 Net Revenue, 2018-2022
15.10.3.2 R&D, 2018-2022
15.10.3.3 Regional Revenue Share, 2022 (%)
15.10.3.4 Business Segment Revenue Share, 2022 (%)
15.10.4 Product Benchmarking
15.10.5 Strategic Outlook
15.11 Fortinet, Inc.
15.11.1 Company Snapshot
15.11.2 Company Overview
15.11.3 Financial Analysis
15.11.3.1 Net Revenue, 2018-2022
15.11.3.2 R&D, 2018-2022
15.11.3.3 Regional Revenue Share, 2022 (%)
15.11.3.4 Business Segment Revenue Share, 2022 (%)
15.11.4 Product Benchmarking
15.11.5 Strategic Outlook
15.12 Forcepoint LLC
15.12.1 Company Snapshot
15.12.2 Company Overview
15.12.3 Product Benchmarking
15.13 Anomali
15.13.1 Company Snapshot
15.13.2 Company Overview
15.13.3 Product Benchmarking
15.13.4 Strategic Outlook
15.14 ThreatConnect, Inc
15.14.1 Company Snapshot
15.14.2 Company Overview
15.14.3 Product Benchmarking
15.14.4 Strategic Outlook
15.15 Cyware
15.15.1 Company Snapshot
15.15.2 Company Overview
15.15.3 Product Benchmarking
15.15.4 Strategic Outlook
16 Conclusion and Recommendations
16.1 Concluding Remarks from Visiongain
16.2 Recommendations for Market Players
ページTOPに戻る
List of Tables/Graphs
List of Tables
Table 1 Threat Intelligence Market Snapshot, 2023 & 2033 (US$ Billion, CAGR %)
Table 2 Global Threat Intelligence Market Forecast, 2023-2033 (US$ Bn, AGR (%), CAGR (%)) (V-Shaped Recovery Scenario)
Table 3 Global Threat Intelligence Market by Region, 2023-2033 (US$ Bn, AGR (%), CAGR (%)) (V-Shaped Recovery Scenario)
Table 4 Global Threat Intelligence Market Forecast, 2023-2033 (US$ Bn, AGR (%), CAGR (%)) (W-Shaped Recovery Scenario)
Table 5 Global Threat Intelligence Market by Region, 2023-2033 (US$ Bn, AGR (%), CAGR (%)) (W-Shaped Recovery Scenario)
Table 6 Global Threat Intelligence Market Forecast, 2023-2033 (US$ Bn, AGR (%), CAGR (%)) (U-Shaped Recovery Scenario)
Table 7 Global Threat Intelligence Market by Region, 2023-2033 (US$ Bn, AGR (%), CAGR (%)) (U-Shaped Recovery Scenario)
Table 8 Global Threat Intelligence Market Forecast, 2023-2033 (US$ Bn, AGR (%), CAGR (%)) (L-Shaped Recovery Scenario)
Table 9 Global Threat Intelligence Market by Region, 2023-2033 (US$ Bn, AGR (%), CAGR (%)) (L-Shaped Recovery Scenario)
Table 10 Global Threat Intelligence Market by Deployment Mode, 2023-2033 (US$ Bn, AGR (%), CAGR (%))
Table 11 Cloud Market by Region, 2023-2033 (US$ Bn, AGR (%), CAGR (%))
Table 12 On-premises Market by Region, 2023-2033 (US$ Bn, AGR (%), CAGR (%))
Table 13 Global Threat Intelligence Market by Application, 2023-2033 (US$ Bn, AGR (%), CAGR (%))
Table 14 Security Information and Event Management (SIEM) Market by Region, 2023-2033 (US$ Bn, AGR (%), CAGR (%))
Table 15 Government, Risk, and Compliance (GRC) Market by Region, 2023-2033 (US$ Bn, AGR (%), CAGR (%))
Table 16 Business Continuity Planning and Management Market by Region, 2023-2033 (US$ Bn, AGR (%), CAGR (%))
Table 17 Global Threat Intelligence Market by Services, 2023-2033 (US$ Bn, AGR (%), CAGR (%))
Table 18 Professional Services Market by Region, 2023-2033 (US$ Bn, AGR (%), CAGR (%))
Table 19 Managed Services Market by Region, 2023-2033 (US$ Bn, AGR (%), CAGR (%))
Table 20 Global Threat Intelligence Market by Component, 2023-2033 (US$ Bn, AGR (%), CAGR (%))
Table 21 Solutions Market by Region, 2023-2033 (US$ Bn, AGR (%), CAGR (%))
Table 22 Services Market by Region, 2023-2033 (US$ Bn, AGR (%), CAGR (%))
Table 23 Other Component Market by Region, 2023-2033 (US$ Bn, AGR (%), CAGR (%))
Table 24 Global Threat Intelligence Market by End-User, 2023-2033 (US$ Bn, AGR (%), CAGR (%))
Table 25 IT and ITeS Market by Region, 2023-2033 (US$ Bn, AGR (%), CAGR (%))
Table 26 BFSI Market by Region, 2023-2033 (US$ Bn, AGR (%), CAGR (%))
Table 27 Healthcare and Life Sciences Market by Region, 2023-2033 (US$ Bn, AGR (%), CAGR (%))
Table 28 Retail and eCommerce Market by Region, 2023-2033 (US$ Bn, AGR (%), CAGR (%))
Table 29 Manufacturing Market by Region, 2023-2033 (US$ Bn, AGR (%), CAGR (%))
Table 30 Other End-User Market by Region, 2023-2033 (US$ Bn, AGR (%), CAGR (%))
Table 31 Global Threat Intelligence Market Forecast, 2023-2033 (US$ Bn, AGR (%), CAGR (%))
Table 32 Global Threat Intelligence Market by Region, 2023-2033 (US$ Bn, AGR (%), CAGR (%))
Table 33 Global Threat Intelligence Market by Deployment Mode, 2023-2033 (US$ Bn, AGR (%), CAGR (%))
Table 34 Global Threat Intelligence Market by Application, 2023-2033 (US$ Bn, AGR (%), CAGR (%))
Table 35 Global Threat Intelligence Market by Services, 2023-2033 (US$ Bn, AGR (%), CAGR (%))
Table 36 Global Threat Intelligence Market by Component, 2023-2033 (US$ Bn, AGR (%), CAGR (%))
Table 37 Global Threat Intelligence Market by End-User, 2023-2033 (US$ Bn, AGR (%), CAGR (%))
Table 38 North America Threat Intelligence Market by Value, 2023-2033 (US$ Bn, AGR (%), CAGR (%))
Table 39 North America Threat Intelligence Market by Country, 2023-2033 (US$ Bn, AGR (%), CAGR (%))
Table 40 North America Threat Intelligence Market by Deployment Mode, 2023-2033 (US$ Bn, AGR (%), CAGR (%))
Table 41 North America Threat Intelligence Market by Application, 2023-2033 (US$ Bn, AGR (%), CAGR (%))
Table 42 North America Threat Intelligence Market by Services, 2023-2033 (US$ Bn, AGR (%), CAGR (%))
Table 43 North America Threat Intelligence Market by Component, 2023-2033 (US$ Bn, AGR (%), CAGR (%))
Table 44 North America Threat Intelligence Market by End-User, 2023-2033 (US$ Bn, AGR (%), CAGR (%))
Table 45 US Threat Intelligence Market by Value, 2023-2033 (US$ Bn, AGR (%), CAGR (%))
Table 46 Canada Threat Intelligence Market by Value, 2023-2033 (US$ Bn, AGR (%), CAGR (%))
Table 47 Europe Threat Intelligence Market by Value, 2023-2033 (US$ Bn, AGR (%), CAGR (%))
Table 48 Europe Threat Intelligence Market by Country, 2023-2033 (US$ Bn, AGR (%), CAGR (%))
Table 49 Europe Threat Intelligence Market by Deployment Mode, 2023-2033 (US$ Bn, AGR (%), CAGR (%))
Table 50 Europe Threat Intelligence Market by Application, 2023-2033 (US$ Bn, AGR (%), CAGR (%))
Table 51 Europe Threat Intelligence Market by Services, 2023-2033 (US$ Bn, AGR (%), CAGR (%))
Table 52 Europe Threat Intelligence Market by Component, 2023-2033 (US$ Bn, AGR (%), CAGR (%))
Table 53 Europe Threat Intelligence Market by End-User, 2023-2033 (US$ Bn, AGR (%), CAGR (%))
Table 54 Germany Threat Intelligence Market by Value, 2023-2033 (US$ Bn, AGR (%), CAGR (%))
Table 55 UK Threat Intelligence Market by Value, 2023-2033 (US$ Bn, AGR (%), CAGR (%))
Table 56 France Threat Intelligence Market by Value, 2023-2033 (US$ Bn, AGR (%), CAGR (%))
Table 57 Italy Threat Intelligence Market by Value, 2023-2033 (US$ Bn, AGR (%), CAGR (%))
Table 58 Russia Threat Intelligence Market by Value, 2023-2033 (US$ Bn, AGR (%), CAGR (%))
Table 59 Rest of Europe Threat Intelligence Market by Value, 2023-2033 (US$ Bn, AGR (%), CAGR (%))
Table 60 Asia-Pacific Threat Intelligence Market by Value, 2023-2033 (US$ Bn, AGR (%), CAGR (%))
Table 61 Asia-Pacific Threat Intelligence Market by Country, 2023-2033 (US$ Bn, AGR (%), CAGR (%))
Table 62 Asia-Pacific Threat Intelligence Market by Deployment Mode, 2023-2033 (US$ Bn, AGR (%), CAGR (%))
Table 63 Asia-Pacific Threat Intelligence Market by Application, 2023-2033 (US$ Bn, AGR (%), CAGR (%))
Table 64 Asia-Pacific Threat Intelligence Market by Services, 2023-2033 (US$ Bn, AGR (%), CAGR (%))
Table 65 Asia-Pacific Threat Intelligence Market by Component, 2023-2033 (US$ Bn, AGR (%), CAGR (%))
Table 66 Asia-Pacific Threat Intelligence Market by End-User, 2023-2033 (US$ Bn, AGR (%), CAGR (%))
Table 67 China Threat Intelligence Market by Value, 2023-2033 (US$ Bn, AGR (%), CAGR (%))
Table 68 India Threat Intelligence Market by Value, 2023-2033 (US$ Bn, AGR (%), CAGR (%))
Table 69 Japan Threat Intelligence Market by Value, 2023-2033 (US$ Bn, AGR (%), CAGR (%))
Table 70 South Korea Threat Intelligence Market by Value, 2023-2033 (US$ Bn, AGR (%), CAGR (%))
Table 71 Australia Threat Intelligence Market by Value, 2023-2033 (US$ Bn, AGR (%), CAGR (%))
Table 72 Rest of Asia-Pacific Threat Intelligence Market by Value, 2023-2033 (US$ Bn, AGR (%), CAGR (%))
Table 73 Middle East & Africa Threat Intelligence Market by Value, 2023-2033 (US$ Bn, AGR (%), CAGR (%))
Table 74 Middle East & Africa Threat Intelligence Market by Country, 2023-2033 (US$ Bn, AGR (%), CAGR (%))
Table 75 Middle East & Africa Threat Intelligence Market by Deployment Mode, 2023-2033 (US$ Bn, AGR (%), CAGR (%))
Table 76 Middle East & Africa Threat Intelligence Market by Application, 2023-2033 (US$ Bn, AGR (%), CAGR (%))
Table 77 Middle East & Africa Threat Intelligence Market by Services, 2023-2033 (US$ Bn, AGR (%), CAGR (%))
Table 78 Middle East & Africa Threat Intelligence Market by Component, 2023-2033 (US$ Bn, AGR (%), CAGR (%))
Table 79 Middle East & Africa Threat Intelligence Market by End-User, 2023-2033 (US$ Bn, AGR (%), CAGR (%))
Table 80 GCC Threat Intelligence Market by Value, 2023-2033 (US$ Bn, AGR (%), CAGR (%))
Table 81 South Africa Threat Intelligence Market by Value, 2023-2033 (US$ Bn, AGR (%), CAGR (%))
Table 82 Rest of Middle East & Africa Threat Intelligence Market by Value, 2023-2033 (US$ Bn, AGR (%), CAGR (%))
Table 83 Latin America Threat Intelligence Market by Value, 2023-2033 (US$ Bn, AGR (%), CAGR (%))
Table 84 Latin America Threat Intelligence Market by Country, 2023-2033 (US$ Bn, AGR (%), CAGR (%))
Table 85 Latin America Threat Intelligence Market by Deployment Mode, 2023-2033 (US$ Bn, AGR (%), CAGR (%))
Table 86 Latin America Threat Intelligence Market by Application, 2023-2033 (US$ Bn, AGR (%), CAGR (%))
Table 87 Latin America Threat Intelligence Market by Services, 2023-2033 (US$ Bn, AGR (%), CAGR (%))
Table 88 Latin America Threat Intelligence Market by Component, 2023-2033 (US$ Bn, AGR (%), CAGR (%))
Table 89 Latin America Threat Intelligence Market by End-User, 2023-2033 (US$ Bn, AGR (%), CAGR (%))
Table 90 Brazil Threat Intelligence Market by Value, 2023-2033 (US$ Bn, AGR (%), CAGR (%))
Table 91 Mexico Threat Intelligence Market by Value, 2023-2033 (US$ Bn, AGR (%), CAGR (%))
Table 92 Rest of Latin America Threat Intelligence Market by Value, 2023-2033 (US$ Bn, AGR (%), CAGR (%))
Table 93 Strategic Outlook : New Product Launch
Table 94 Strategic Outlook : Collaboration
Table 95 Strategic Outlook : Acquisition
Table 96 Strategic Outlook : Partnership
Table 97 Strategic Outlook : Expansion
Table 98 International Business Machines Corporation Key Details, (CEO, HQ, Revenue, Founded, No. of Employees, Company Type, Website, Business Segment)
Table 99 International Business Machines Corporation: Product Benchmarking
Table 100 International Business Machines Corporation: Strategic Outlook
Table 101 Cisco Systems, Inc Key Details, (CEO, HQ, Revenue, Founded, No. of Employees, Company Type, Website, Business Segment)
Table 102 Cisco Systems, Inc: Product Benchmarking
Table 103 Cisco Systems, Inc: Strategic Outlook
Table 104 Trend Micro Inc.Key Details, (CEO, HQ, Revenue, Founded, No. of Employees, Company Type, Website, Business Segment)
Table 105 Trend Micro Inc.: Product Benchmarking
Table 106 Trend Micro Inc.: Strategic Outlook
Table 107 McAfee Corp.Key Details, (CEO, HQ, Revenue, Founded, No. of Employees, Company Type, Website, Business Segment)
Table 108 McAfee Corp.: Product Benchmarking
Table 109 McAfee Corp.: Strategic Outlook
Table 110 Mimecast LimitedKey Details, (CEO, HQ, Revenue, Founded, No. of Employees, Company Type, Website, Business Segment)
Table 111 Mimecast Limited: Product Benchmarking
Table 112 AT&T Inc Key Details, (CEO, HQ, Revenue, Founded, No. of Employees, Company Type, Website, Business Segment)
Table 113 AT&T Inc: Product Benchmarking
Table 114 AT&T Inc: Strategic Outlook
Table 115 Check Point Software Technologies Ltd Key Details, (CEO, HQ, Revenue, Founded, No. of Employees, Company Type, Website, Business Segment)
Table 116 Check Point Software Technologies Ltd: Product Benchmarking
Table 117 Check Point Software Technologies Ltd: Strategic Outlook
Table 118 DXC Technology Key Details, (CEO, HQ, Revenue, Founded, No. of Employees, Company Type, Website, Business Segment)
Table 119 DXC Technology: Product Benchmarking
Table 120 DXC Technology: Strategic Outlook
Table 121 CrowdStrike Holdings, Inc Key Details, (CEO, HQ, Revenue, Founded, No. of Employees, Company Type, Website, Business Segment)
Table 122 CrowdStrike Holdings, Inc: Product Benchmarking
Table 123 CrowdStrike Holdings, Inc: Strategic Outlook
Table 124 Juniper Networks, Inc Key Details, (CEO, HQ, Revenue, Founded, No. of Employees, Company Type, Website, Business Segment)
Table 125 Juniper Networks, Inc: Product Benchmarking
Table 126 Juniper Networks, Inc: Strategic Outlook
Table 127 Fortinet, Inc : Key Details, (CEO, HQ, Revenue, Founded, No. of Employees, Company Type, Website, Business Segment)
Table 128 Fortinet, Inc: Product Benchmarking
Table 129 Fortinet, Inc: Strategic Outlook
Table 130 Forcepoint LLC Key Details, (CEO, HQ, Revenue, Founded, No. of Employees, Company Type, Website, Business Segment)
Table 131 Forcepoint LLC: Product Benchmarking
Table 132 Anomali :Key Details, (CEO, HQ, Revenue, Founded, No. of Employees, Company Type, Website, Business Segment)
Table 133 Anomali: Product Benchmarking
Table 134 Anomali: Strategic Outlook
Table 135 ThreatConnect, Inc Key Details, (CEO, HQ, Revenue, Founded, No. of Employees, Company Type, Website, Business Segment)
Table 136 ThreatConnect, Inc: Product Benchmarking
Table 137 ThreatConnect, Inc: Strategic Outlook
Table 138 Cyware Key Details, (CEO, HQ, Revenue, Founded, No. of Employees, Company Type, Website, Business Segment)
Table 139 Cyware: Product Benchmarking
Table 140 Cyware: Strategic Outlook
List of Figures
Figure 1 Threat Intelligence Market Segmentation
Figure 2 Threat Intelligence Market by Deployment Mode: Market Attractiveness Index
Figure 3 Threat Intelligence Market by Application: Market Attractiveness Index
Figure 4 Threat Intelligence Market by Services: Market Attractiveness Index
Figure 5 Threat Intelligence Market by Component: Market Attractiveness Index
Figure 6 Threat Intelligence Market by End-User: Market Attractiveness Index
Figure 7 Threat Intelligence Market Attractiveness Index by Region
Figure 8 Threat Intelligence Market: Market Dynamics
Figure 9 Global Threat Intelligence Market Forecast, 2023-2033 (US$ Bn, AGR (%)) (V-Shaped Recovery Scenario)
Figure 10 Global Threat Intelligence Market by Region, 2023-2033 (US$ Bn, AGR (%)) (V-Shaped Recovery Scenario)
Figure 11 Global Threat Intelligence Market Forecast, 2023-2033 (US$ Bn, AGR (%)) (W-Shaped Recovery Scenario)
Figure 12 Global Threat Intelligence Market by Region, 2023-2033 (US$ Bn, AGR (%))) (W-Shaped Recovery Scenario)
Figure 13 Global Threat Intelligence Market Forecast, 2023-2033 (US$ Bn, AGR (%)) (U-Shaped Recovery Scenario)
Figure 14 Global Threat Intelligence Market by Region, 2023-2033 (US$ Bn, AGR (%)) (U-Shaped Recovery Scenario)
Figure 15 Global Threat Intelligence Market Forecast, 2023-2033 (US$ Bn, AGR (%)) (L-Shaped Recovery Scenario)
Figure 16 Global Threat Intelligence Market by Region, 2023-2033 (US$ Bn, AGR (%)) (L-Shaped Recovery Scenario)
Figure 17 Threat Intelligence Market: Porter’s Five Forces Analysis
Figure 18 Threat Intelligence Market: PEST Analysis
Figure 19 Threat Intelligence Market by Deployment Mode: Market Attractiveness Index
Figure 20 Global Threat Intelligence Market by Deployment Mode, 2023-2033 (US$ Bn, AGR (%))
Figure 21 Global Threat Intelligence Market Forecast by Deployment Mode, 2023-2033 (%)
Figure 22 Cloud Market by Region, 2023-2033 (US$ Bn, AGR (%))
Figure 23 Deployment Mode Segment Market Share Forecast by Region, 2023 & 2033 (%)
Figure 24 On-premises Market by Region, 2023-2033 (US$ Bn, AGR (%))
Figure 25 Deployment Mode Segment Market Share Forecast by Region, 2023 & 2033 (%)
Figure 26 Threat Intelligence Market by Application: Market Attractiveness Index
Figure 27 Global Threat Intelligence Market by Application, 2023-2033 (US$ Bn, AGR (%))
Figure 28 Global Threat Intelligence Market Forecast by Application, 2023-2033 (%)
Figure 29 Security Information and Event Management (SIEM) Market by Region, 2023-2033 (US$ Bn, AGR (%))
Figure 30 Application Segment Market Share Forecast by Region, 2023 & 2033 (%)
Figure 31 Government, Risk, and Compliance (GRC) Market by Region, 2023-2033 (US$ Bn, AGR (%))
Figure 32 Application Segment Market Share Forecast by Region, 2023 & 2033 (%)
Figure 33 Business Continuity Planning and Management Market by Region, 2023-2033 (US$ Bn, AGR (%))
Figure 34 Application Segment Market Share Forecast by Region, 2023 & 2033 (%)
Figure 35 Threat Intelligence Market by Services: Market Attractiveness Index
Figure 36 Global Threat Intelligence Market by Services, 2023-2033 (US$ Bn, AGR (%))
Figure 37 Global Threat Intelligence Market Forecast by Services, 2023-2033 (%)
Figure 38 Professional Services Market by Region, 2023-2033 (US$ Bn, AGR (%))
Figure 39 Services Segment Market Share Forecast by Region, 2023 & 2033 (%)
Figure 40 Managed Services Market by Region, 2023-2033 (US$ Bn, AGR (%))
Figure 41 Services Segment Market Share Forecast by Region, 2023 & 2033 (%)
Figure 42 Threat Intelligence Market by Component: Market Attractiveness Index
Figure 43 Global Threat Intelligence Market by Component, 2023-2033 (US$ Bn, AGR (%))
Figure 44 Global Threat Intelligence Market Forecast by Component, 2023-2033 (%)
Figure 45 Solutions Market by Region, 2023-2033 (US$ Bn, AGR (%))
Figure 46 Components Segment Market Share Forecast by Region, 2023 & 2033 (%)
Figure 47 Services Market by Region, 2023-2033 (US$ Bn, AGR (%))
Figure 48 Components Segment Market Share Forecast by Region, 2023 & 2033 (%)
Figure 49 Other Component Market by Region, 2023-2033 (US$ Bn, AGR (%))
Figure 50 Components Segment Market Share Forecast by Region, 2023 & 2033 (%)
Figure 51 Threat Intelligence Market by End-User: Market Attractiveness Index
Figure 52 Global Threat Intelligence Market by End-User, 2023-2033 (US$ Bn, AGR (%))
Figure 53 Global Threat Intelligence Market Forecast by End-User, 2023-2033 (%)
Figure 54 IT and ITeS Market by Region, 2023-2033 (US$ Bn, AGR (%))
Figure 55 End-Users Segment Market Share Forecast by Region, 2023 & 2033 (%)
Figure 56 BFSI Market by Region, 2023-2033 (US$ Bn, AGR (%))
Figure 57 End-Users Segment Market Share Forecast by Region, 2023 & 2033 (%)
Figure 58 Healthcare and Life Sciences Market by Region, 2023-2033 (US$ Bn, AGR (%))
Figure 59 End-Users Segment Market Share Forecast by Region, 2023 & 2033 (%)
Figure 60 Retail and eCommerce Market by Region, 2023-2033 (US$ Bn, AGR (%))
Figure 61 End-Users Segment Market Share Forecast by Region, 2023 & 2033 (%)
Figure 62 Manufacturing Market by Region, 2023-2033 (US$ Bn, AGR (%))
Figure 63 End-Users Segment Market Share Forecast by Region, 2023 & 2033 (%)
Figure 64 Other End-User Market by Region, 2023-2033 (US$ Bn, AGR (%))
Figure 65 End-Users Segment Market Share Forecast by Region, 2023 & 2033 (%)
Figure 66 Threat Intelligence Market Forecast by Region 2023 and 2033 (Revenue, CAGR%)
Figure 67 Threat Intelligence Market Share Forecast by Region 2023, 2028, 2033 (%)
Figure 68 Global Threat Intelligence Market Forecast, 2023-2033 (US$ Bn, AGR (%))
Figure 69 Global Threat Intelligence Market by Region, 2023-2033 (US$ Bn, AGR (%))
Figure 70 Global Threat Intelligence Market by Deployment Mode, 2023-2033 (US$ Bn, AGR (%))
Figure 71 Global Threat Intelligence Market by Application, 2023-2033 (US$ Bn, AGR (%))
Figure 72 Global Threat Intelligence Market by Services, 2023-2033 (US$ Bn, AGR (%))
Figure 73 Global Threat Intelligence Market by Component, 2023-2033 (US$ Bn, AGR (%))
Figure 74 Global Threat Intelligence Market by End-User, 2023-2033 (US$ Bn, AGR (%))
Figure 75 North America Threat Intelligence Market Attractiveness Index
Figure 76 North America Threat Intelligence Market by Region, 2023, 2028 & 2033 (US$ Million)
Figure 77 North America Threat Intelligence Market by Value, 2023-2033 (US$ Bn, AGR (%))
Figure 78 North America Threat Intelligence Market by Country, 2023-2033 (US$ Bn, AGR (%))
Figure 79 North America Threat Intelligence Market Forecast by Country, 2023-2033 (%)
Figure 80 North America Threat Intelligence Market by Deployment Mode, 2023-2033 (US$ Bn, AGR (%))
Figure 81 North America Threat Intelligence Market Forecast by Deployment Mode, 2023-2033 (%)
Figure 82 North America Threat Intelligence Market by Application, 2023-2033 (US$ Bn, AGR (%))
Figure 83 North America Threat Intelligence Market Forecast by Application, 2023-2033 (%)
Figure 84 North America Threat Intelligence Market by Services, 2023-2033 (US$ Bn, AGR (%))
Figure 85 North America Threat Intelligence Market Forecast by Services, 2023-2033 (%)
Figure 86 North America Threat Intelligence Market by Component, 2023-2033 (US$ Bn, AGR (%))
Figure 87 North America Threat Intelligence Market Forecast by Component, 2023-2033 (%)
Figure 88 North America Threat Intelligence Market by End-User, 2023-2033 (US$ Bn, AGR (%))
Figure 89 North America Threat Intelligence Market Forecast by End-User, 2023-2033 (%)
Figure 90 US Threat Intelligence Market by Value, 2023-2033 (US$ Bn, AGR (%))
Figure 91 Canada Threat Intelligence Market by Value, 2023-2033 (US$ Bn, AGR (%))
Figure 92 Europe Threat Intelligence Market Attractiveness Index
Figure 93 Europe Threat Intelligence Market by Region, 2023, 2028 & 2033 (US$ Million)
Figure 94 Europe Threat Intelligence Market by Value, 2023-2033 (US$ Bn, AGR (%))
Figure 95 Europe Threat Intelligence Market by Country, 2023-2033 (US$ Bn, AGR (%))
Figure 96 Europe Threat Intelligence Market Forecast by Country, 2023-2033 (%)
Figure 97 Europe Threat Intelligence Market by Deployment Mode, 2023-2033 (US$ Bn, AGR (%))
Figure 98 Europe Threat Intelligence Market Forecast by Deployment Mode, 2023-2033 (%)
Figure 99 Europe Threat Intelligence Market by Application, 2023-2033 (US$ Bn, AGR (%))
Figure 100 Europe Threat Intelligence Market Forecast by Application, 2023-2033 (%)
Figure 101 Europe Threat Intelligence Market by Services, 2023-2033 (US$ Bn, AGR (%))
Figure 102 Europe Threat Intelligence Market Forecast by Services, 2023-2033 (%)
Figure 103 Europe Threat Intelligence Market by Component, 2023-2033 (US$ Bn, AGR (%))
Figure 104 Europe Threat Intelligence Market Forecast by Component, 2023-2033 (%)
Figure 105 Europe Threat Intelligence Market by End-User, 2023-2033 (US$ Bn, AGR (%))
Figure 106 Europe Threat Intelligence Market Forecast by End-User, 2023-2033 (%)
Figure 107 Germany Threat Intelligence Market by Value, 2023-2033 (US$ Bn, AGR (%))
Figure 108 UK Threat Intelligence Market by Value, 2023-2033 (US$ Bn, AGR (%))
Figure 109 France Threat Intelligence Market by Value, 2023-2033 (US$ Bn, AGR (%))
Figure 110 Italy Threat Intelligence Market by Value, 2023-2033 (US$ Bn, AGR (%))
Figure 111 Russia Threat Intelligence Market by Value, 2023-2033 (US$ Bn, AGR (%))
Figure 112 Rest of Europe Threat Intelligence Market by Value, 2023-2033 (US$ Bn, AGR (%))
Figure 113 Asia Pacific Threat Intelligence Market Attractiveness Index
Figure 114 Asia Pacific Threat Intelligence Market by Region, 2023, 2028 & 2033 (US$ Million)
Figure 115 Asia-Pacific Threat Intelligence Market by Value, 2023-2033 (US$ Bn, AGR (%))
Figure 116 Asia-Pacific Threat Intelligence Market by Country, 2023-2033 (US$ Bn, AGR (%))
Figure 117 Asia-Pacific Threat Intelligence Market Forecast by Country, 2023-2033 (%)
Figure 118 Asia-Pacific Threat Intelligence Market by Deployment Mode, 2023-2033 (US$ Bn, AGR (%))
Figure 119 Asia-Pacific Threat Intelligence Market Forecast by Deployment Mode, 2023-2033 (%)
Figure 120 Asia-Pacific Threat Intelligence Market by Application, 2023-2033 (US$ Bn, AGR (%))
Figure 121 Asia-Pacific Threat Intelligence Market Forecast by Application, 2023-2033 (%)
Figure 122 Asia-Pacific Threat Intelligence Market by Services, 2023-2033 (US$ Bn, AGR (%))
Figure 123 Asia-Pacific Threat Intelligence Market Forecast by Services, 2023-2033 (%)
Figure 124 Asia-Pacific Threat Intelligence Market by Component, 2023-2033 (US$ Bn, AGR (%))
Figure 125 Asia-Pacific Threat Intelligence Market Forecast by Component, 2023-2033 (%)
Figure 126 Asia-Pacific Threat Intelligence Market by End-User, 2023-2033 (US$ Bn, AGR (%))
Figure 127 Asia-Pacific Threat Intelligence Market Forecast by End-Usert, 2023-2033 (%)
Figure 128 China Threat Intelligence Market by Value, 2023-2033 (US$ Bn, AGR (%))
Figure 129 India Threat Intelligence Market by Value, 2023-2033 (US$ Bn, AGR (%))
Figure 130 Japan Threat Intelligence Market by Value, 2023-2033 (US$ Bn, AGR (%))
Figure 131 South Korea Threat Intelligence Market by Value, 2023-2033 (US$ Bn, AGR (%))
Figure 132 Australia Threat Intelligence Market by Value, 2023-2033 (US$ Bn, AGR (%))
Figure 133 Rest of Asia-Pacific Threat Intelligence Market by Value, 2023-2033 (US$ Bn, AGR (%))
Figure 134 Middle East & Africa Threat Intelligence Market Attractiveness Index
Figure 135 Middle East & Africa Threat Intelligence Market by Region, 2023, 2028 & 2033 (US$ Million)
Figure 136 Middle East & Africa Threat Intelligence Market by Value, 2023-2033 (US$ Bn, AGR (%))
Figure 137 Middle East & Africa Threat Intelligence Market by Country, 2023-2033 (US$ Bn, AGR (%))
Figure 138 Middle East & Africa Threat Intelligence Market Forecast by Component, 2023-2033 (%)
Figure 139 Middle East & Africa Threat Intelligence Market by Deployment Mode, 2023-2033 (US$ Bn, AGR (%))
Figure 140 Middle East & Africa Threat Intelligence Market Forecast by Deployment Mode, 2023-2033 (%)
Figure 141 Middle East & Africa Threat Intelligence Market by Application, 2023-2033 (US$ Bn, AGR (%))
Figure 142 Middle East & Africa Threat Intelligence Market Forecast by Application, 2023-2033 (%)
Figure 143 Middle East & Africa Threat Intelligence Market by Services, 2023-2033 (US$ Bn, AGR (%))
Figure 144 Middle East & Africa Threat Intelligence Market Forecast by Services, 2023-2033 (%)
Figure 145 Middle East & Africa Threat Intelligence Market by Component, 2023-2033 (US$ Bn, AGR (%))
Figure 146 Middle East & Africa Threat Intelligence Market Forecast by Component, 2023-2033 (%)
Figure 147 Middle East & Africa Threat Intelligence Market by End-User, 2023-2033 (US$ Bn, AGR (%))
Figure 148 Middle East & Africa Threat Intelligence Market Forecast by End-User, 2023-2033 (%)
Figure 149 GCC Threat Intelligence Market by Value, 2023-2033 (US$ Bn, AGR (%))
Figure 150 South Africa Threat Intelligence Market by Value, 2023-2033 (US$ Bn, AGR (%))
Figure 151 Rest of Middle East & Africa Threat Intelligence Market by Value, 2023-2033 (US$ Bn, AGR (%))
Figure 152 Latin America Threat Intelligence Market Attractiveness Index
Figure 153 Latin America Threat Intelligence Market by Region, 2023, 2028 & 2033 (US$ Million)
Figure 154 Latin America Threat Intelligence Market by Value, 2023-2033 (US$ Bn, AGR (%))
Figure 155 Latin America Threat Intelligence Market by Country, 2023-2033 (US$ Bn, AGR (%))
Figure 156 Latin America Threat Intelligence Market Forecast by Country, 2023-2033 (%)
Figure 157 Latin America Threat Intelligence Market by Deployment Mode, 2023-2033 (US$ Bn, AGR (%))
Figure 158 Latin America Threat Intelligence Market Forecast by Deployment Mode, 2023-2033 (%)
Figure 159 Latin America Threat Intelligence Market by Application, 2023-2033 (US$ Bn, AGR (%))
Figure 160 Latin America Threat Intelligence Market Forecast by Application, 2023-2033 (%)
Figure 161 Latin America Threat Intelligence Market by Services, 2023-2033 (US$ Bn, AGR (%))
Figure 162 Latin America Threat Intelligence Market Forecast by Services, 2023-2033 (%)
Figure 163 Latin America Threat Intelligence Market by Component, 2023-2033 (US$ Bn, AGR (%))
Figure 164 Latin America Threat Intelligence Market Forecast by Component, 2023-2033 (%)
Figure 165 Latin America Threat Intelligence Market by End-User, 2023-2033 (US$ Bn, AGR (%))
Figure 166 Latin America Threat Intelligence Market Forecast by End-User, 2023-2033 (%)
Figure 167 Brazil Threat Intelligence Market by Value, 2023-2033 (US$ Bn, AGR (%))
Figure 168 Mexico Threat Intelligence Market by Value, 2023-2033 (US$ Bn, AGR (%))
Figure 169 Rest of Latin America Threat Intelligence Market by Value, 2023-2033 (US$ Bn, AGR (%))
Figure 170 Threat Intelligence Market: Company Share, 2022
Figure 171 International Business Machines Corporation: Net Revenue, 2018-2022 (US$ Million, AGR%)
Figure 172 International Business Machines Corporation: R&D, 2018-2022 (US$ Million, AGR%)
Figure 173 International Business Machines Corporation: Regional Revenue Share, 2022 (%)
Figure 174 International Business Machines Corporation: Business Segment Revenue Share, 2022 (%)
Figure 175 Cisco Systems, Inc: Net Revenue, 2018-2022 (US$ Million, AGR%)
Figure 176 Cisco Systems, Inc: R&D, 2018-2022 (US$ Million, AGR%)
Figure 177 Cisco Systems, Inc: Regional Revenue Share, 2022 (%)
Figure 178 Cisco Systems, Inc: Business Segment Revenue Share, 2022 (%)
Figure 179 Trend Micro Inc.: Net Revenue, 2018-2022 (US$ Million, AGR%)
Figure 180 Trend Micro Inc.: R&D, 2018-2022 (US$ Million, AGR%)
Figure 181 Trend Micro Inc.: Regional Revenue Share, 2022 (%)
Figure 182 AT&T Inc: Net Revenue, 2018-2022 (US$ Million, AGR%)
Figure 183 AT&T Inc: Regional Revenue Share, 2022 (%)
Figure 184 AT&T Inc: Business Segment Revenue Share, 2022 (%)
Figure 185 Check Point Software Technologies Ltd: Net Revenue, 2018-2022 (US$ Million, AGR%)
Figure 186 Check Point Software Technologies Ltd: R&D, 2018-2022 (US$ Million, AGR%)
Figure 187 Check Point Software Technologies Ltd: Regional Revenue Share, 2022 (%)
Figure 188 DXC Technology: Net Revenue, 2018-2022 (US$ Million, AGR%)
Figure 189 DXC Technology: Regional Revenue Share, 2022 (%)
Figure 190 DXC Technology: Business Segment Revenue Share, 2022 (%)
Figure 191 CrowdStrike Holdings, Inc: Net Revenue, 2018-2022 (US$ Million, AGR%)
Figure 192 CrowdStrike Holdings, Inc: R&D, 2018-2022 (US$ Million, AGR%)
Figure 193 CrowdStrike Holdings, Inc: Business Segment Revenue Share, 2022 (%)
Figure 194 Juniper Networks, Inc: Net Revenue, 2018-2022 (US$ Million, AGR%)
Figure 195 Juniper Networks, Inc: R&D, 2018-2022 (US$ Million, AGR%)
Figure 196 Juniper Networks, Inc: Regional Revenue Share, 2022 (%)
Figure 197 Juniper Networks, Inc: Business Segment Revenue Share, 2022 (%)
Figure 198 Fortinet, Inc: Net Revenue, 2018-2022 (US$ Million, AGR%)
Figure 199 Fortinet, Inc: R&D, 2018-2022 (US$ Million, AGR%)
Figure 200 Fortinet, Inc: Regional Revenue Share, 2022 (%)
Figure 201 Fortinet, Inc: Business Segment Revenue Share, 2022 (%)
ページTOPに戻る
- 本レポートと同じKEY WORDの最新刊レポートはありません。
よくあるご質問
Visiongain社はどのような調査会社ですか?
英国の調査会社ヴィジョンゲイン社(Visiongain)は、通信とエネルギーのほか、自動車や化学・医薬品、金属など、広範な市場を対象に調査を行っています。自動車市場については、市場全般に関する調査のほ... もっと見る
調査レポートの納品までの日数はどの程度ですか?
在庫のあるものは速納となりますが、平均的には 3-4日と見て下さい。
但し、一部の調査レポートでは、発注を受けた段階で内容更新をして納品をする場合もあります。
発注をする前のお問合せをお願いします。
注文の手続きはどのようになっていますか?
1)お客様からの御問い合わせをいただきます。
2)見積書やサンプルの提示をいたします。
3)お客様指定、もしくは弊社の発注書をメール添付にて発送してください。
4)データリソース社からレポート発行元の調査会社へ納品手配します。
5) 調査会社からお客様へ納品されます。最近は、pdfにてのメール納品が大半です。
お支払方法の方法はどのようになっていますか?
納品と同時にデータリソース社よりお客様へ請求書(必要に応じて納品書も)を発送いたします。
お客様よりデータリソース社へ(通常は円払い)の御振り込みをお願いします。
請求書は、納品日の日付で発行しますので、翌月最終営業日までの当社指定口座への振込みをお願いします。振込み手数料は御社負担にてお願いします。
お客様の御支払い条件が60日以上の場合は御相談ください。
尚、初めてのお取引先や個人の場合、前払いをお願いすることもあります。ご了承のほど、お願いします。
データリソース社はどのような会社ですか?
当社は、世界各国の主要調査会社・レポート出版社と提携し、世界各国の市場調査レポートや技術動向レポートなどを日本国内の企業・公官庁及び教育研究機関に提供しております。
世界各国の「市場・技術・法規制などの」実情を調査・収集される時には、データリソース社にご相談ください。
お客様の御要望にあったデータや情報を抽出する為のレポート紹介や調査のアドバイスも致します。
|
|

