EV用オンボードチャージャー市場レポート:2022-2032
EV On-Board Battery Charger Market Report 2022-2032
レポート詳細
EV用オンボードチャージャー市場レポート 2022-2032 :本レポートは、新たな収益の柱を目指すリーディングカンパニーが、業界とその背景にあるダイナミクスをより深く理解する上で、非常... もっと見る
※上記価格は部署ライセンス(Departmental licence)価格です。
その他の価格についてはデータリソースまでお問合せください。
日本語のページは自動翻訳を利用し作成しています。
実際のレポートは英文のみでご納品いたします。

|

|
サマリー
レポート詳細
EV用オンボードチャージャー市場レポート 2022-2032:本レポートは、新たな収益の柱を目指すリーディングカンパニーが、業界とその背景にあるダイナミクスをより深く理解する上で、非常に有益なものとなるでしょう。また、異業種への進出や新地域での既存事業の拡大を目指す企業にとっても有用なレポートです。
電気自動車販売の驚異的な成長、急速充電器への需要の高まり、公共充電ステーションでの電気自動車充電の高コストなどの要因が市場成長を促進しています。
EV用オンボードチャージャーの世界市場を推進する主な要因としては、電気自動車販売の驚異的な成長、急速充電器に対する需要の高まり、公共の充電ステーションでの電気自動車充電の高コストなどが挙げられます。また、世界的なスマートシティの急速な拡大が、車載充電器メーカーにビジネスチャンスをもたらすと期待されています。電気自動車(EV)用オンボードチャージャー市場の成長には、政府の取り組みが必要です。この領域における政府の取り組みの一環として、政府は電気自動車(EV)の開発に投資しています。これにより、電気自動車(EV)やオンボードチャージャー推進タイプの開発への投資や研究が進むことになります。
一方、急速充電器の普及が進み、オンボードチャージャーの標準化が進んでいないことが、世界的に電気自動車の市場成長を抑制しています。需要の増加にもかかわらず、電気自動車業界を悩ませている問題があります。アジアやアフリカの発展途上国の多くは、電気自動車の充電ステーションに関してインフラが貧弱であり、これが成長の妨げになっています。
インフラ不足の課題
発展途上国の多くはインフラ網が整備されていないため、電気自動車用車載充電器の市場にブレーキがかかっています。例えば、電気自動車をフル充電するのに1時間以上かかる地域もあり、多くの人にとっての足かせになっています。このような地域で電気自動車市場が成長するためには、充電ステーション網が不可欠である。政府は、電気自動車の充電インフラの成長を促進するために、補助金やインセンティブといった戦略を練る必要があります。インド、ブラジル、南アフリカ、アルゼンチンなどの国々では、公共の充電ステーションなどの重要な都市インフラが限られています。このことは、EV用オンボードチャージャーメーカーにとって課題となることが予想されます。
マーケットリサーチレポートを購入する前に聞くべき質問とは?
- EV用オンボードチャージャー市場はどのように進化しているのか?
- EV用オンボードチャージャー市場の推進要因と抑制要因は何か?
- EV用オンボードチャージャーの各サブ市場セグメントは予測期間中にどのように成長し、2032年にこれらのサブ市場が占める収益はどの程度になるのでしょうか?
- 2022年から2032年にかけて、各EV用オンボードチャージャーサブマーケットの市場シェアはどのように推移するのでしょうか?
- 2022年から2032年にかけて、市場全体の主なドライバーは何でしょうか?
- EV用オンボードチャージャーの主要市場はマクロ経済ダイナミクスに概ね追随するのか、それとも個々の国市場が他を凌駕するのか?
- 2032年までに各国市場のシェアはどのように変化し、どの地域が2032年に市場をリードするのでしょうか?
- 主要プレイヤーは誰か、また予測期間中の展望は?
- これらの主要企業のEV用オンボードチャージャープロジェクトはどのようなものでしょうか?
- 2022年から2032年の間に、業界はどのように進化するのか?現在および今後10年間に行われるEV用オンボードチャージャープロジェクトにはどのような意味があるのでしょうか?
- EV用オンボードチャージャー市場をさらに拡大するために、製品の商業化の必要性は高いですか?
- EV用オンボードチャージャー市場はどこへ向かっているのか?また、市場の最前線に立つにはどうすればよいのでしょうか?
- 新製品・新サービスへの最適な投資方法とは?
- 企業を新たな成長軌道に乗せるための重要な展望とは?C-suite?
このことが、現在、そして今後10年間のEV車載充電器市場にどのような影響を与えるかを知る必要があります。
- 337ページにわたる本レポートでは、123の表と233のグラフを独占的に提供します。
- このレポートでは、業界における主要な収益性の高い分野をハイライトしているため、今すぐターゲットにすることができます。
- 世界、地域、国別の売上高と成長率を詳細に分析
- 競合他社が成功した主要トレンド、変化、収益予測にハイライトを当てています。
このレポートは、EV用オンボードチャージャー市場が今後10年間でどのように発展し、COVID-19の景気後退と回復の変動に連動していくかをお伝えします。この市場は、過去10年間のどの時点よりも今が重要であります。
COVID-19のバリエーションは、お客様の市場に特化した経済データを提供します。
2032年までの予測やその他の分析により、商業的な展望が明らかになる
- 2032年までの売上予測に加え、直近の実績、成長率、市場シェアも掲載。
- ビジネスの展望や展開など、独自の分析をご覧いただけます。
- 定性的分析(市場力学、ドライバー、機会、阻害要因、課題など)、コスト構造、EV用オンボードチャージャー価格上昇の影響、最近の動向などをご覧いただけます。
本レポートでは、COVID-19が業界と貴社にどのような影響を及ぼすかについて、データ分析と貴重な洞察を掲載しています。COVID-19の4つの回収パターンとその影響、すなわちV、L、W、Uを本レポートで取り上げています。
報告書の対象セグメント
車両タイプ別
- 乗用車
- バス、小型トラック
- 中型車
- 大型車
- 農業用トラクター
- 建設機械
- 鉱業用車両
- 電気・ハイブリッドボート
推進タイプ別
- BEV
- HEV
- PHEV
出力別
- 10kW未満
- 10kW~20kW
- 20kW以上
世界市場全体およびセグメントの収益予測に加え、4地域および20の主要国市場の収益予測も掲載しています。
北米
- アメリカ
- カナダ
欧州
- ドイツ
- 北欧
- 英国
- フランス
- イタリア
- その他の地域
アジア太平洋地域
- 中国
- 日本
- インド
- オーストラリア
- 韓国
- その他のアジア太平洋地域
ラテンアメリカ 中東・アフリカ
EV用オンボードチャージャー市場の2022年から2032年にかけての主要企業のプロファイルと、これらの企業のこのセグメントに焦点をあてた情報も掲載しています。
主要企業と市場成長の可能性
・ AVID Propulsion type Limited
・ Bel Fuse Inc.
・ BRUSA Elektronik
・ Delphi Technologies
・ Eaton
・ EVolve Electrics
・ Ficosa
・ Infineon Technologies
・ Innoelectric
・ LG Electronics (LG Magna e-Powertrain Co Ltd.)
・ Stercom Power Solutions
・ STMICROELECTRONICS
・ Tata Autocomp Systems Ltd
・ Toyota Industries Corporation
・ Xepics Group
EV用オンボードチャージャー市場の世界全体収益、金額ベースで2022年から2032年まで、市場は2022年に213億米ドルを突破する、と当研究所は算出しています。また、2032年までの間に大幅な売上増を見込んでいます。このレポートでは、最も大きな可能性を秘めた企業を特定しています。彼らの能力、進歩、商業的展望を知ることで、一歩先を行くことができます。
EV用オンボードチャージャー市場、2022年から2032年までの市場レポートがどのように役立つのでしょうか?
300ページを超えるレポートでは、要約すると以下のような知識を得ることができます。
- EV用オンボードチャージャー市場の2032年までの収益予測、世界と地域レベルでプロセス、上流、下流、タイプ企業規模をそれぞれ予測-業界の展望を発見し、投資と収益に最も有利な場所を見出す
- 4地域と20主要国市場の2032年までの収益予測 - EV用オンボードチャージャー市場、北米、欧州、アジア太平洋、LAMEAの2022年から2032年までの市場予測をご覧いただけます。また、米国、カナダ、メキシコ、ブラジル、ドイツ、フランス、英国、イタリア、中国、インド、日本、オーストラリアなどの主要経済圏の市場も予測されています。
- EV用オンボードチャージャー市場の2022年から2032年までの市場に関する主要企業20社の企業プロファイルを含む、既存企業および市場参入を目指す企業の展望。
定量的・定性的な分析と独自の予測をご覧いただけます。私たちのレポートだけが持つ情報を入手し、貴重なビジネスインテリジェンスを得ることができます。
他にはない情報
私たちの新しいレポートタイトルで、知識の遅れを取り戻し、チャンスを逃す可能性が低くなります。私たちの研究が貴社の調査、分析、意思決定にどのように役立つかをご覧ください。Visiongainの調査は、EV用オンボードチャージャー市場、2022年から2032年市場や大手企業のための商業分析を必要とするすべての人のためのものです。データ、トレンド、予測を見つけることができます。
ページTOPに戻る
目次
目次
1.レポートの概要
1.1 調査の目的
1.2 EV用オンボードチャージャー市場の紹介
1.3 本レポートが提供するもの
1.4 本レポートを読むべき理由
1.5 本分析レポートが回答する主な質問には以下が含まれます。
1.6 本レポートは誰のためのものなのか?
1.7 方法論
1.7.1 市場の定義
1.7.2 市場評価・予測手法
1.7.3 データの検証
1.8 よくある質問と回答(FAQ)
1.9 関連するVisiongainレポート
1.10 Visiongainについて
2 エグゼクティブサマリー
3 プレミアムインサイト
3.1 地域別スナップショット。EV車載充電器の世界市場
3.2車両タイプセグメント市場魅力度指標
3.3 推進系セグメント市場魅力度指標
3.4 出力セグメント市場魅力度指数
4 市場の概要
4.1 主要な調査結果
4.2 マーケットダイナミクス
4.2.1 市場の推進要因
4.2.2 抑制要因
4.2.3 好機
4.3 COVID-19影響度分析
4.4 ポーターのファイブフォース分析
4.4.1 サプライヤーパワー
4.4.2 バイヤーパワー
4.4.3 競合他社の競争力
4.4.4 代替品による脅威
4.4.5 新規参入者の脅威
4.5 PESTLE分析
5 世界のEV用オンボードチャージャー市場分析:車両タイプ別
5.1 主な調査結果
5.2 車載用充電器の世界市場規模予測・車両タイプ別予測
5.3 車種別セグメント成長展望
5.4 世界のEV用オンボードチャージャー市場シェア:車種別(2022年&2032年)
5.5 乗用車
5.5.1 EV用オンボードチャージャーの世界市場:地域別
5.5.2 EV用オンボードチャージャーの地域別世界市場シェア(2022年~2032年)(%)
5.6 バス
5.6.1 バス用EVオンボードチャージャーの世界市場(地域別)
5.6.2 バス用EVオンボードチャージャーの世界市場:地域別シェア(2022年〜2032年)
5.7 小型トラック
5.7.1 小型トラック用EVオンボードチャージャーの世界市場(地域別)
5.7.2 小型トラック用EVオンボードチャージャーの世界市場:地域別シェア(2022年〜2032年)
5.8 中型車
5.8.1 中型車用EVオンボードチャージャーの世界市場(地域別)
5.8.2 中型車用EVオンボードチャージャーの世界市場:地域別シェア(2022年〜2032年)
5.9 大型車
5.9.1 大型車用EVオンボードチャージャーの世界市場(地域別)
5.9.2 大型車用EVオンボードチャージャーの世界市場:地域別シェア(2022年〜2032年)
5.10 農業用トラクター
5.10.1 農業用トラクター用EVオンボードチャージャーの世界市場(地域別)
5.10.2 農業用トラクター用EVオンボードチャージャーの世界市場:地域別シェア(2022年〜2032年)
5.11 建設機械
5.11.1 建設機械用EVオンボードチャージャーの世界市場(地域別)
5.11.2 建設機械用EVオンボードチャージャーの世界市場:地域別シェア(2022年〜2032年)
5.12 鉱山用車両
5.12.1 採掘車用EVオンボードチャージャーの世界市場(地域別)
5.12.2 採掘車用EVオンボードチャージャーの世界市場:地域別シェア(2022年〜2032年)
5.13 電気・ハイブリッドボート船
5.13.1 電気・ハイブリッドボート船用EVオンボードチャージャーの世界市場(地域別)
5.13.2 電気・ハイブリッドボート船用EVオンボードチャージャーの世界市場:地域別シェア(2022-2032年)
6 世界のEV用オンボードチャージャー市場分析:推進タイプ別
6.1 主要な調査結果
6.2 推進タイプ別EV用オンボードチャージャー世界市場規模予測・予測
6.3 推進タイプ別成長展望
6.4 EV用オンボードチャージャーの推進タイプ別世界市場シェア(2022年&2032年)
6.5 BEV
6.5.1 BEV用EVオンボードチャージャーの世界市場(地域別)
6.5.2 BEV用EVオンボードチャージャーの世界市場、地域別シェア(2022年~2032年)
6.6 HEV
6.6.1 HEV用EVオンボードチャージャーの世界市場(地域別)
6.6.2 HEV用EVオンボードチャージャーの世界市場:地域別シェア(2022年〜2032年)
6.7 PHEV
6.7.1 PHEV用EVオンボードチャージャーの世界市場(地域別)
6.7.2 PHEV用EVオンボードチャージャーの世界市場:地域別シェア(2022年〜2032年)
7 世界のEV用オンボードチャージャー市場分析:出力別
7.1 主な調査結果
7.2 EV用オンボードチャージャーの出力別世界市場規模の推定と予測
7.3 出力別成長展望
7.4 EEV用オンボードチャージャーの出力別世界市場シェア(2022年&2032年)
7.5 10kW未満
7.5.1 10kW未満EV用オンボードチャージャーの世界市場(地域別)
7.5.2 10kW未満EV用オンボードチャージャーの世界市場、地域別シェア(2022年〜2032年)
7.6 10kW〜20kW
7.6.1 10kW~20kWEV用オンボードチャージャーの世界市場(地域別)
7.6.2 10kW〜20kWEV用オンボードチャージャーの世界市場、地域別シェア、2022年〜2032年(%)
7.7 20kW以上
7.7.1 20kW以上のEVオンボードチャージャーの世界市場(地域別)
7.7.2 20kW以上のEVオンボードチャージャーの世界市場、地域別シェア、2022-2032年(%)
8 世界のEEV用オンボードチャージャー市場分析:地域別
8.1 主な調査結果
8.2 地域別市場規模の推定と予測
8.3 COVID-19の影響度分析。回復シナリオ(V, U, W, L)
9 北米のEV用オンボードチャージャー市場分析
9.1 主な調査結果
9.2 北米のEV用オンボードチャージャー市場の魅力度指数
9.3 北米のEV用オンボードチャージャーの国別市場規模推移(2022年、2027年、2032年)(10億米ドル
9.4 北米EV用オンボードチャージャーの国別市場規模予測・予想
9.5 北米のEV用オンボードチャージャー市場の車種別市場規模予測・予想
9.6 北米EV用オンボードチャージャーの推進タイプ別市場規模予測・予想
9.7 北米EV用オンボードチャージャーの出力別市場規模予測・予想
9.8 米国
9.8.1 米国のEV用オンボードチャージャー市場:車両タイプ別
9.8.2 米国のEV用オンボードチャージャー市場:推進タイプ別
9.8.3 米国のEV用オンボードチャージャー市場:出力別
9.9 カナダ
9.9.1 カナダのEV用オンボードチャージャー市場:車両タイプ別
9.9.2 カナダのEV用オンボードチャージャー市場:推進タイプ別
9.9.3 カナダのEV用オンボードチャージャー市場:出力別
10 欧州のEV用オンボードチャージャー市場分析
10.1 主要な調査結果
10.2 欧州のEV用オンボードチャージャー市場の魅力度指数
10.3 欧州EV用オンボードチャージャー国別市場 2022年、2027年&2032年(10億USドル)
10.4 欧州EV用オンボードチャージャーの国別市場規模予測・予想
10.5 欧州のEV用オンボードチャージャーの車種別市場規模予測・予測
10.6 欧州のEV用オンボードチャージャーの推進タイプ別市場規模予測・予想
10.7 欧州のEV用オンボードチャージャーの出力別市場規模予測・予想
10.8 英国
10.8.1 イギリスのEV用オンボードチャージャー市場:車両タイプ別
10.8.2 イギリスのEV用オンボードチャージャー市場:推進タイプ別
10.8.3 イギリスのEV用オンボードチャージャー市場:出力別
10.9 ドイツ
10.9.1 ドイツのEV用オンボードチャージャー市場:車両タイプ別
10.9.2 ドイツのEV用オンボードチャージャー市場:推進タイプ別
10.9.3 ドイツのEV用オンボードチャージャー市場:出力別
10.10 フランス
10.10.1 フランスのEV用オンボードチャージャー市場:車両タイプ別
10.10.2 フランスのEV用オンボードチャージャー市場:推進タイプ別
10.10.3 フランスEV用オンボードチャージャー市場:出力別
10.11 イタリア
10.11.1 イタリアのEV用オンボードチャージャー市場:車両タイプ別
10.11.2 イタリアのEV用オンボードチャージャー市場:推進タイプ別
10.11.3 イタリアのEV用オンボードチャージャー市場:出力別
10.12 北欧
10.12.1 北欧のEV用オンボードチャージャー市場:車両タイプ別
10.12.2 北欧のEV用オンボードチャージャー市場:推進タイプ別
10.12.3 北欧のEV用オンボードチャージャー市場:出力別
10.13 欧州のその他の地域
10.13.1 欧州のEV用オンボードチャージャー市場:車両タイプ別
10.13.2 欧州のEV用オンボードチャージャー市場:推進タイプ別
10.13.3 欧州のEV用オンボードチャージャー市場:出力別
11 アジア太平洋地域のEV用オンボードチャージャー市場分析
11.1 主な調査結果
11.2 アジア太平洋地域のEV用オンボードチャージャー市場の魅力度指数
11.3 アジア太平洋地域のEV用オンボードチャージャーの国別市場規模予測(2022年、2027年、2032年)(10億USドル
11.4 アジア太平洋地域のEV用オンボードチャージャーの国別市場規模予測・予想
11.5 アジア太平洋地域のEV用オンボードチャージャー市場の車種別市場規模予測・予測
11.6 アジア太平洋地域のEV用オンボードチャージャー市場の推進タイプ別市場規模予測・予想
11.7 アジア太平洋地域のEV用オンボードチャージャーの出力別市場規模予測・予想
11.8 中国
11.8.1 中国のEV用オンボードチャージャー市場:車両タイプ別
11.8.2 中国のEV用オンボードチャージャー市場:推進タイプ別
11.8.3 中国のEV用オンボードチャージャー市場:出力別
11.9 オーストラリア
11.9.1 オーストラリアのEV用オンボードチャージャー市場:車両タイプ別
11.9.2 オーストラリアのEV用オンボードチャージャー市場:推進タイプ別
11.9.3 オーストラリアのEV用オンボードチャージャー市場:出力別
11.10 インド
11.10.1 インドのEV用オンボードチャージャー市場:車両タイプ別
11.10.2 インドのEV用オンボードチャージャー市場:推進タイプ別
11.10.3 インドのEV用オンボードチャージャー市場:出力別
11.11 日本
11.11.1 日本のEV用オンボードチャージャー市場:車両タイプ別
11.11.2 日本EV用オンボードチャージャー市場:推進タイプ別
11.11.3 日本のEV用オンボードチャージャー市場:出力別
11.12 韓国
11.12.1 韓国のEV用オンボードチャージャー市場:車両タイプ別
11.12.2 韓国のEV用オンボードチャージャー市場:推進タイプ別
11.12.3 韓国のEV用オンボードチャージャー市場:出力別
11.13 アジア太平洋地域のその他の地域
11.13.1 アジア太平洋地域のEV用オンボードチャージャー市場:車両タイプ別
11.13.2 アジア太平洋地域のEV用オンボードチャージャー市場:推進タイプ別
11.13.3 アジア太平洋地域のEV用オンボードチャージャー市場:出力別
12 LAMEAのEV用オンボードチャージャー市場分析
12.1 主要な調査結果
12.2 LAMEAのEV用オンボードチャージャー市場の魅力度指数
12.3 LAMEAのEV用オンボードチャージャーの国別市場規模予測(2022年、2027年、2032年)(10億USドル
12.4 LAMEAのEV用オンボードチャージャーの国別市場規模予測・予想
12.5 LAMEAのEV用オンボードチャージャーの車種別市場規模予測・予想
12.6 LAMEAのEV用オンボードチャージャーの推進タイプ別市場規模予測・予想
12.7 LAMEAのEV用オンボードチャージャーの出力別市場規模予測・予想
12.8 中南米
12.8.1 中南米のEV用オンボードチャージャー市場:車両タイプ別
12.8.2 中南米のEV用オンボードチャージャー市場:推進タイプ別
12.8.3 中南米のEV用オンボードチャージャー市場:出力別
12.9 中東・アフリカ
12.9.1 中東・アフリカEV用オンボードチャージャー市場:車両タイプ別
12.9.2 中東・アフリカEV用オンボードチャージャー市場:推進タイプ別
12.9.3 中東・アフリカEV用オンボードチャージャー市場:出力別
13 競合他社の状況
13.1 企業シェア分析
13.2 主要事業戦略分析
14社プロフィール
14.1 イノエレクトリック社
14.1.1 企業スナップショット
14.1.2 会社概要
14.1.3 製品ベンチマーク
14.1.4 戦略的展望
14.2 フィコサ
14.2.1 企業スナップショット
14.2.2 会社概要
14.2.3 ベンチマーキング
14.2.4 戦略的展望
14.3 アビッド プロパルジョン タイプ リミテッド
14.3.1 会社概要
14.3.2 会社概要
14.3.3 製品ベンチマーク
14.4 BRUSA Elektronik
14.4.1 企業スナップショット
14.4.2 会社概要
14.4.3 製品ベンチマーク
14.4.4 戦略的展望
14.5 豊田自動織機
14.5.1 企業スナップショット
14.5.2 会社概要
14.5.3 財務分析
14.5.4 製品ベンチマーク
14.5.5 戦略的展望
14.6 スターコムパワーソリューションズ
14.6.1 企業スナップショット
14.6.2 会社概要
14.6.3 製品ベンチマーク
14.6.4 戦略的展望
14.7 イートン
14.7.1 企業スナップショット
14.7.2 会社概要
14.7.3 財務分析
14.7.4 製品ベンチマーク
14.7.5 戦略的展望
14.8 デルファイ・テクノロジー
14.8.1 企業スナップショット
14.8.2 会社概要
14.8.3 財務分析
14.8.4 製品ベンチマーク
14.8.5 戦略的な展望
14.9 インフィニオン・テクノロジーズ
14.9.1 企業スナップショット
14.9.2 会社概要
14.9.3 財務分析
14.9.4 製品ベンチマーク
14.9.5 戦略的展望
14.10 ストマイクロエレクトロニクス
14.10.1 会社概要
14.10.2 会社概要
14.10.3 財務分析
14.10.4 製品ベンチマーク
14.10.5 戦略的展望
15 Visiongain社からの結語
16 市場関係者への提言
表の一覧
Table 1 Global EV-onboard battery charger Market Snapshot, 2022 & 2032 (US$ billion, CAGR %)
Table 2 Global EV-onboard battery charger Market by Region, 2022-2032 (USD Mn, AGR (%), CAGR(%)): “V” Shaped Recovery Scenario
Table 3 Global EV-onboard battery charger Market by Region, 2022-2032 (USD Mn, AGR (%), CAGR(%)): “U” Shaped Recovery Scenario
Table 4 Global EV-onboard battery charger Market by Region, 2022-2032 (USD Mn, AGR (%), CAGR(%)): “W” Shaped Recovery Scenario
Table 5 Global EV-onboard battery charger Market by Region, 2022-2032 (USD Mn, AGR (%), CAGR(%)): “L” Shaped Recovery Scenario
Table 6 Global EV On-Board Battery Charger Market, By Vehicle Type, 2022 - 2032 (US$ billion, AGR%, CAGR%)
Table 7 Global EV On-Board Battery Charger Market for Passenger Car, By Region, 2022 - 2032 (US$ billion, AGR%, CAGR%)
Table 8 Global EV On-Board Battery Charger Market for Buses, By Region, 2022 - 2032 (US$ billion, AGR%, CAGR%)
Table 9 Global EV On-Board Battery Charger Market for Vans, By Region, 2022 - 2032 (US$ million, AGR%, CAGR%)
Table 10 Global EV On-Board Battery Charger Market for Medium Duty Vehicles, By Region, 2022 - 2032 (US$ million, AGR%, CAGR%)
Table 11 Global EV On-Board Battery Charger Market for Heavy Duty Vehicles, By Region, 2022 - 2032 (US$ million, AGR%, CAGR%)
Table 12 Global EV On-Board Battery Charger Market for Agriculture Tractors, By Region, 2022 - 2032 (US$ million, AGR%, CAGR%)
Table 13 Global EV On-Board Battery Charger Market for Construction Equipment, By Region, 2022 - 2032 (US$ million, AGR%, CAGR%)
Table 14 Global EV On-Board Battery Charger Market for Mining Vehicles, By Region, 2022 - 2032 (US$ million, AGR%, CAGR%)
Table 15 Global EV On-Board Battery Charger Market for Electric and Hybrid Boat Ships, By Region, 2022 - 2032 (US$ million, AGR%, CAGR%)
Table 16 Global EV On-Board Battery Charger Market, By Propulsion Type, 2022 - 2032 (US$ billion, AGR%, CAGR%)
Table 17 Global BEV On-Board Battery Charger Market, By Region, 2022 - 2032 (US$ billion, AGR%, CAGR%)
Table 18 Global HEV On-Board Battery Charger Market, By Region, 2022 - 2032 (US$ billion, AGR%, CAGR%)
Table 19 Global PHEV On-Board Battery Charger Market, By Region, 2022 - 2032 (US$ billion, AGR%, CAGR%)
Table 20 Global EV On-Board Battery Charger Market, By Power Output, 2022 - 2032 (US$ billion, AGR%, CAGR%)
Table 21 Global Less than 10kW EV On-Board Battery Charger Market, By Region, 2022 - 2032 (US$ billion, AGR%, CAGR%)
Table 22 Global 10kW to 20kW EV On-Board Battery Charger Market, By Region, 2022 - 2032 (US$ billion, AGR%, CAGR%)
Table 23 Global More than 20kW EV On-Board Battery Charger Market, By Region, 2022 - 2032 (US$ billion, AGR%, CAGR%)
Table 24 Global EV On-Board Battery Charger Market, By Region, 2022 - 2032 (US$ billion, AGR%, CAGR%)
Table 25 Global EV-onboard battery charger Market by Region, 2022-2032 (USD Mn, AGR (%), CAGR(%)): “V” Shaped Recovery Scenario
Table 26 Global EV-onboard battery charger Market by Region, 2022-2032 (USD Mn, AGR (%), CAGR(%)): “U” Shaped Recovery Scenario
Table 27 Global EV-onboard battery charger Market by Region, 2022-2032 (USD Mn, AGR (%), CAGR(%)): “W” Shaped Recovery Scenario
Table 28 Global EV-onboard battery charger Market by Region, 2022-2032 (USD Mn, AGR (%), CAGR(%)): “L” Shaped Recovery Scenario
Table 29 North America EV On-Board Battery Charger Market, By Country, 2022 - 2032 (US$ billion, AGR%, CAGR%)
Table 30 North America EV On-Board Battery Charger Market, By Vehicle Type, 2022 - 2032 (US$ billion, AGR%, CAGR%)
Table 31 North America EV On-Board Battery Charger Market, By Propulsion Type, 2022 - 2032 (US$ billion, AGR%, CAGR%)
Table 32 North America EV On-Board Battery Charger Market, By Power Output, 2022 - 2032 (US$ billion, AGR%, CAGR%)
Table 33 U.S. EV On-Board Battery Charger Market, By Vehicle Type, 2022 - 2032 (US$ billion, AGR%, CAGR%)
Table 34 U.S. EV On-Board Battery Charger Market, By Propulsion Type, 2022 - 2032 (US$ billion, AGR%, CAGR%)
Table 35 U.S. EV On-Board Battery Charger Market, By Power Output, 2022 - 2032 (US$ billion, AGR%, CAGR%)
Table 36 Canada EV On-Board Battery Charger Market, By Vehicle Type, 2022 - 2032 (US$ billion, AGR%, CAGR%)
Table 37 Canada EV On-Board Battery Charger Market, By Propulsion Type, 2022 - 2032 (US$ billion, AGR%, CAGR%)
Table 38 Canada EV On-Board Battery Charger Market, By Power Output, 2022 - 2032 (US$ billion, AGR%, CAGR%)
Table 39 Europe EV On-Board Battery Charger Market, By Country, 2022 - 2032 (US$ billion, AGR%, CAGR%)
Table 40 Europe EV On-Board Battery Charger Market, By Vehicle Type, 2022 - 2032 (US$ billion, AGR%, CAGR%)
Table 41 Europe EV On-Board Battery Charger Market, By Propulsion Type, 2022 - 2032 (US$ billion, AGR%, CAGR%)
Table 42 Europe EV On-Board Battery Charger Market, By Power Output, 2022 - 2032 (US$ billion, AGR%, CAGR%)
Table 43 U.K. EV On-Board Battery Charger Market, By Vehicle Type, 2022 - 2032 (US$ billion, AGR%, CAGR%)
Table 44 U.K. EV On-Board Battery Charger Market, By Propulsion Type, 2022 - 2032 (US$ billion, AGR%, CAGR%)
Table 45 U.K. EV On-Board Battery Charger Market, By Power Output, 2022 - 2032 (US$ billion, AGR%, CAGR%)
Table 46 Germany EV On-Board Battery Charger Market, By Vehicle Type, 2022 - 2032 (US$ billion, AGR%, CAGR%)
Table 47 Germany EV On-Board Battery Charger Market, By Propulsion Type, 2022 - 2032 (US$ billion, AGR%, CAGR%)
Table 48 Germany EV On-Board Battery Charger Market, By Power Output, 2022 - 2032 (US$ billion, AGR%, CAGR%)
Table 49 France EV On-Board Battery Charger Market, By Vehicle Type, 2022 - 2032 (US$ billion, AGR%, CAGR%)
Table 50 France EV On-Board Battery Charger Market, By Propulsion Type, 2022 - 2032 (US$ billion, AGR%, CAGR%)
Table 51 France EV On-Board Battery Charger Market, By Power Output, 2022 - 2032 (US$ billion, AGR%, CAGR%)
Table 52 Italy EV On-Board Battery Charger Market, By Vehicle Type, 2022 - 2032 (US$ billion, AGR%, CAGR%)
Table 53 Italy EV On-Board Battery Charger Market, By Propulsion Type, 2022 - 2032 (US$ billion, AGR%, CAGR%)
Table 54 Italy EV On-Board Battery Charger Market, By Power Output, 2022 - 2032 (US$ billion, AGR%, CAGR%)
Table 55 Nordic EV On-Board Battery Charger Market, By Vehicle Type, 2022 - 2032 (US$ billion, AGR%, CAGR%)
Table 56 Nordic EV On-Board Battery Charger Market, By Propulsion Type, 2022 - 2032 (US$ billion, AGR%, CAGR%)
Table 57 Nordic EV On-Board Battery Charger Market, By Power Output, 2022 - 2032 (US$ billion, AGR%, CAGR%)
Table 58 Rest of Europe EV On-Board Battery Charger Market, By Vehicle Type, 2022 - 2032 (US$ billion, AGR%, CAGR%)
Table 59 Rest of Europe EV On-Board Battery Charger Market, By Propulsion Type, 2022 - 2032 (US$ billion, AGR%, CAGR%)
Table 60 Rest of Europe EV On-Board Battery Charger Market, By Power Output, 2022 - 2032 (US$ billion, AGR%, CAGR%)
Table 61 Asia Pacific EV On-Board Battery Charger Market, By Country, 2022 - 2032 (US$ billion, AGR%, CAGR%)
Table 62 Asia Pacific EV On-Board Battery Charger Market, By Vehicle Type, 2022 - 2032 (US$ billion, AGR%, CAGR%)
Table 63 Asia Pacific EV On-Board Battery Charger Market, By Propulsion Type, 2022 - 2032 (US$ billion, AGR%, CAGR%)
Table 64 Asia Pacific EV On-Board Battery Charger Market, By Power Output, 2022 - 2032 (US$ billion, AGR%, CAGR%)
Table 65 China EV On-Board Battery Charger Market, By Vehicle Type, 2022 - 2032 (US$ billion, AGR%, CAGR%)
Table 66 China EV On-Board Battery Charger Market, By Propulsion Type, 2022 - 2032 (US$ billion, AGR%, CAGR%)
Table 67 China EV On-Board Battery Charger Market, By Power Output, 2022 - 2032 (US$ billion, AGR%, CAGR%)
Table 68 Australia EV On-Board Battery Charger Market, By Vehicle Type, 2022 - 2032 (US$ billion, AGR%, CAGR%)
Table 69 Australia EV On-Board Battery Charger Market, By Propulsion Type, 2022 - 2032 (US$ billion, AGR%, CAGR%)
Table 70 Australia EV On-Board Battery Charger Market, By Power Output, 2022 - 2032 (US$ billion, AGR%, CAGR%)
Table 71 India EV On-Board Battery Charger Market, By Vehicle Type, 2022 - 2032 (US$ billion, AGR%, CAGR%)
Table 72 India EV On-Board Battery Charger Market, By Propulsion Type, 2022 - 2032 (US$ billion, AGR%, CAGR%)
Table 73 India EV On-Board Battery Charger Market, By Power Output, 2022 - 2032 (US$ billion, AGR%, CAGR%)
Table 74 India EV On-Board Battery Charger Market, By Vehicle Type, 2022 - 2032 (US$ billion, AGR%, CAGR%)
Table 75 India EV On-Board Battery Charger Market, By Propulsion Type, 2022 - 2032 (US$ billion, AGR%, CAGR%)
Table 76 India EV On-Board Battery Charger Market, By Power Output, 2022 - 2032 (US$ billion, AGR%, CAGR%)
Table 77 South Korea EV On-Board Battery Charger Market, By Vehicle Type, 2022 - 2032 (US$ billion, AGR%, CAGR%)
Table 78 South Korea EV On-Board Battery Charger Market, By Propulsion Type, 2022 - 2032 (US$ billion, AGR%, CAGR%)
Table 79 South Korea EV On-Board Battery Charger Market, By Power Output, 2022 - 2032 (US$ billion, AGR%, CAGR%)
Table 80 Rest of Asia Pacific EV On-Board Battery Charger Market, By Vehicle Type, 2022 - 2032 (US$ billion, AGR%, CAGR%)
Table 81 Rest of Asia Pacific EV On-Board Battery Charger Market, By Propulsion Type, 2022 - 2032 (US$ billion, AGR%, CAGR%)
Table 82 Rest of Asia Pacific EV On-Board Battery Charger Market, By Power Output, 2022 - 2032 (US$ billion, AGR%, CAGR%)
Table 83 LAMEA EV On-Board Battery Charger Market, By Country, 2022 - 2032 (US$ billion, AGR%, CAGR%)
Table 84 LAMEA EV On-Board Battery Charger Market, By Vehicle Type, 2022 - 2032 (US$ billion, AGR%, CAGR%)
Table 85 LAMEA EV On-Board Battery Charger Market, By Propulsion Type, 2022 - 2032 (US$ billion, AGR%, CAGR%)
Table 86 LAMEA EV On-Board Battery Charger Market, By Power Output, 2022 - 2032 (US$ billion, AGR%, CAGR%)
Table 87 Latin America EV On-Board Battery Charger Market, By Vehicle Type, 2022 - 2032 (US$ billion, AGR%, CAGR%)
Table 88 Latin America EV On-Board Battery Charger Market, By Propulsion Type, 2022 - 2032 (US$ billion, AGR%, CAGR%)
Table 89 Latin America EV On-Board Battery Charger Market, By Power Output, 2022 - 2032 (US$ billion, AGR%, CAGR%)
Table 90 Middle East & Africa EV On-Board Battery Charger Market, By Vehicle Type, 2022 - 2032 (US$ billion, AGR%, CAGR%)
Table 91 Middle East & Africa EV On-Board Battery Charger Market, By Propulsion Type, 2022 - 2032 (US$ billion, AGR%, CAGR%)
Table 92 Middle East & Africa EV On-Board Battery Charger Market, By Power Output, 2022 - 2032 (US$ billion, AGR%, CAGR%)
Table 93 EV-onboard battery charger Market Key Player Ranking, 2021
Table 94 Key Business Strategies Adopted by Key Players in Global EV-onboard battery charger Market
Table 95 Innoelectric: Key Details, (CEO, HQ, Revenue, Founded, No. of Employees, Company Type, Website, Business Segment)
Table 96 Innoelectric: Product Benchmarking
Table 97 Innoelectric: Strategic Outlook
Table 98 Ficosa: Key Details, (CEO, HQ, Revenue, Founded, No. of Employees, Company Type, Website, Business Segment)
Table 99 Ficosa: Product Benchmarking
Table 100 Ficosa: Strategic Outlook
Table 101 AVID Propulsion type Limited: Key Details, (CEO, HQ, Revenue, Founded, No. of Employees, Company Type, Website, Business Segment)
Table 102 AVID Propulsion type Limited: Product Benchmarking
Table 103 BRUSA Elektronik: Key Details, (CEO, HQ, Revenue, Founded, No. of Employees, Company Type, Website, Business Segment)
Table 104 BRUSA Elektronik: Product Benchmarking
Table 105 Abbott: Strategic Outlook
Table 106 Toyota Industries Corporation: Key Details, (CEO, HQ, Revenue, Founded, No. of Employees, Company Type, Website, Business Segment)
Table 107 Toyota Industries Corporation: Product Benchmarking
Table 108 Toyota Industries Corporation: Strategic Outlook
Table 109 Stercom Power Solutions: Key Details, (CEO, HQ, Revenue, Founded, No. of Employees, Company Type, Website, Business Segment)
Table 110 Stercom Power Solutions: Product Benchmarking
Table 111 Abbott: Strategic Outlook
Table 112 Eaton: Key Details, (CEO, HQ, Revenue, Founded, No. of Employees, Company Type, Website, Business Segment)
Table 113 Eaton: Product Benchmarking
Table 114 Eaton: Strategic Outlook
Table 115 Delphi Technologies: Key Details, (CEO, HQ, Revenue, Founded, No. of Employees, Company Type, Website, Business Segment)
Table 116 Delphi Technologies: Product Benchmarking
Table 117 Delphi Technologies: Strategic Outlook
Table 118 Infineon Technologies: Key Details, (CEO, HQ, Revenue, Founded, No. of Employees, Company Type, Website, Business Segment)
Table 119 Infineon Technologies: Product Benchmarking
Table 120 Infineon Technologies: Strategic Outlook
Table 121 STMICROELECTRONICS: Key Details, (CEO, HQ, Revenue, Founded, No. of Employees, Company Type, Website, Business Segment)
Table 122 STMICROELECTRONICS: Product Benchmarking
Table 123 STMICROELECTRONICS: Strategic Outlook
図の一覧
Figure 1 Global EV-onboard battery charger Market Segmentation
Figure 2 Breakdown of Primary Interviews: By Company Type, Designation, & Region
Figure 3 Global EV-onboard battery charger Market Forecast by Region: Market Attractiveness Index
Figure 4 Global EV-onboard battery charger Market by Vehicle type: Market Attractiveness Index
Figure 5 Global EV-onboard battery charger Market by Propulsion type: Market Attractiveness Index
Figure 6 Global EV-onboard battery charger Market by Power output: Market Attractiveness Index
Figure 7 Global EV-onboard battery charger Market: Market Dynamics
Figure 8 Global BEV and PHEV Sales (in '000 Units), Market Share (%)
Figure 9 Global COVID Impact Analysis: EV-onboard battery charger Market Recovery Scenarios
Figure 10 Global EV-onboard battery charger Market by Region, 2022-2032 (USD Mn, AGR (%), CAGR (%)): “V” Shaped Recovery
Figure 11 Global EV-onboard battery charger Market by Region, 2022-2032 (USD Mn, AGR (%), CAGR (%)): “U” Shaped Recovery
Figure 12 Global EV-onboard battery charger Market by Region, 2022-2032 (USD Mn, AGR (%), CAGR (%)): “W” Shaped Recovery
Figure 13 Global EV-onboard battery charger Market by Region, 2022-2032 (USD Mn, AGR (%), CAGR (%)): “L” Shaped Recovery
Figure 14 Global EV-onboard battery charger Market: Porter’s Five Forces Analysis
Figure 15 Global EV-onboard battery charger Market: PESTLE Analysis
Figure 16 Global EV-onboard battery charger Market Forecast by Vehicle type, 2022-2032 (US$ billion, AGR %)
Figure 17 Global EV-onboard battery charger Market attractiveness index (Revenue, CAGR%)
Figure 18 Global EV-onboard battery charger Market Share Forecast by Vehicle type, 2022, 2027, 2032 (%)
Figure 19 Global EV On-Board Battery Charger Market for Passenger Car, By Region, 2022 - 2032
Figure 20 Global EV On-Board Battery Charger Market Share for Passenger Car by Region, 2022-2032 (%)
Figure 21 Global EV On-Board Battery Charger Market for Buses, By Region, 2022 - 2032
Figure 22 Global EV On-Board Battery Charger Market Share for Buses by Region, 2022-2032 (%)
Figure 23 Global EV On-Board Battery Charger Market for Vans, By Region, 2022 - 2032
Figure 24 Global EV On-Board Battery Charger Market Share for Vans by Region, 2022-2032 (%)
Figure 25 Global EV On-Board Battery Charger Market for Medium Duty Vehicles, By Region, 2022 - 2032
Figure 26 Global EV On-Board Battery Charger Market Share for Medium Duty Vehicles by Region, 2022-2032 (%)
Figure 27 Global EV On-Board Battery Charger Market for Heavy Duty Vehicles, By Region, 2022 - 2032
Figure 28 Global EV On-Board Battery Charger Market Share for Heavy Duty Vehicles by Region, 2022-2032 (%)
Figure 29 Global EV On-Board Battery Charger Market for Agriculture Tractors, By Region, 2022 - 2032
Figure 30 Global EV On-Board Battery Charger Market Share for Agriculture Tractors by Region, 2022-2032 (%)
Figure 31 Global EV On-Board Battery Charger Market for Construction Equipment, By Region, 2022 - 2032
Figure 32 Global EV On-Board Battery Charger Market Share for Construction Equipment by Region, 2022-2032 (%)
Figure 33 Global EV On-Board Battery Charger Market for Mining Vehicles, By Region, 2022 - 2032
Figure 34 Global EV On-Board Battery Charger Market Share for Mining Vehicles by Region, 2022-2032 (%)
Figure 35 Global EV On-Board Battery Charger Market for Electric And Hybrid Boat Ships, By Region, 2022 - 2032
Figure 36 Global EV On-Board Battery Charger Market Share for Electric And Hybrid Boat Ships by Region, 2022-2032 (%)
Figure 37 Global EV-onboard battery charger Market Forecast by Propulsion type, 2022-2032 (US$ billion, AGR %)
Figure 38 Global EV-onboard battery charger market by Propulsion type attractiveness index (Revenue, CAGR%)
Figure 39 Global EV-onboard battery charger Market Share Forecast by Propulsion type, 2022, 2027, 2032 (%)
Figure 40 Global EV On-Board Battery Charger Market for BEV, By Region, 2022 - 2032
Figure 41 Global EV On-Board Battery Charger Market Share for BEV by Region, 2022-2032 (%)
Figure 42 Global EV On-Board Battery Charger Market for HEV, By Region, 2022 - 2032
Figure 43 Global EV On-Board Battery Charger Market Share for HEV by Region, 2022-2032 (%)
Figure 44 Global EV On-Board Battery Charger Market for PHEV, By Region, 2022 - 2032
Figure 45 Global EV On-Board Battery Charger Market Share for PHEV by Region, 2022-2032 (%)
Figure 46 Global EV-onboard battery charger Market Forecast by Power Output, 2022-2032 (US$ billion, AGR %)
Figure 47 Global EV-onboard battery charger market by propultion type attractiveness index (Revenue, CAGR%)
Figure 48 Global EV-onboard battery charger Market Share Forecast by Vehicle type, 2022, 2027, 2032 (%)
Figure 49 Global Less than 10kW EV On-Board Battery Charger Market, By Region, 2022 - 2032
Figure 50 Global Less than 10kW EV On-Board Battery Charger Market Share by Region, 2022-2032 (%)
Figure 51 Global 10kW to 20kW EV On-Board Battery Charger Market, By Region, 2022 - 2032
Figure 52 Global 10kW to 20kW EV On-Board Battery Charger Market Share by Region, 2022-2032 (%)
Figure 53 Global More than 20kW EV On-Board Battery Charger Market, By Region, 2022 - 2032
Figure 54 Global More than 20kW EV On-Board Battery Charger Market Share by Region, 2022-2032 (%)
Figure 55 Global EV-onboard battery charger Market Forecast by Region 2022, 2027, 2032 (Revenue, CAGR%)
Figure 56 Global EV-onboard battery charger Market Share Forecast by Region 2022, 2027, 2032(%)
Figure 57 Global EV-onboard battery charger Market by Region, 2022-2032 (USD Mn, AGR (%), CAGR (%))
Figure 58 Global EV-onboard battery charger Market by Region, 2022-2032 (USD Mn, AGR (%), CAGR (%)): “V” Shaped Recovery
Figure 59 Global EV-onboard battery charger Market by Region, 2022-2032 (USD Mn, AGR (%), CAGR (%)): “U” Shaped Recovery
Figure 60 Global EV-onboard battery charger Market by Region, 2022-2032 (USD Mn, AGR (%), CAGR (%)): “W” Shaped Recovery
Figure 61 Global EV-onboard battery charger Market by Region, 2022-2032 (USD Mn, AGR (%), CAGR (%)): “L” Shaped Recovery
Figure 62 North America EV-onboard battery charger Market Attractiveness Index
Figure 63 North America EV-onboard battery charger Market by Region, 2022, 2027 & 2032 (US$ billion)
Figure 64 North America EV-onboard battery charger Market Forecast by Country, 2022-2032 (US$ billion, AGR %)
Figure 65 North America EV-onboard battery charger Market Share Forecast by Country, 2022 & 2032 (%)
Figure 66 North America EV-onboard battery charger Market Forecast by Vehicle type, 2022-2032 (US$ billion, AGR %)
Figure 67 North America EV-onboard battery charger Market Share Forecast by Vehicle type, 2022 & 2032 (%)
Figure 68 North America EV-onboard battery charger Market Forecast by Propulsion type, 2022-2032 (US$ billion, AGR %)
Figure 69 North America EV-onboard battery charger Market Share Forecast by Propulsion type, 2022 & 2032 (%)
Figure 70 North America EV-onboard battery charger Market Forecast by Power output, 2022-2032 (US$ billion, AGR %)
Figure 71 North America EV-onboard battery charger Market Share Forecast by Power output, 2022 & 2032 (%)
Figure 72 U.S. EV-onboard battery charger Market Forecast, 2022-2032 (US$ billion, AGR %)
Figure 73 U.S. EV-onboard battery charger Market Forecast by Vehicle type, 2022-2032 (US$ billion, AGR %)
Figure 74 U.S. EV-onboard battery charger Market Share Forecast by Vehicle type, 2022 & 2032 (%)
Figure 75 U.S. EV-onboard battery charger Market Forecast by Propulsion type, 2022-2032 (US$ billion, AGR %)
Figure 76 U.S. EV-onboard battery charger Market Share Forecast by Propulsion type, 2022 & 2032 (%)
Figure 77 U.S. EV-onboard battery charger Market Forecast by Power output, 2022-2032 (US$ billion, AGR %)
Figure 78 U.S. EV-onboard battery charger Market Share Forecast by Power output, 2022 & 2032 (%)
Figure 79 Canada EV-onboard battery charger Market Forecast, 2022-2032 (US$ billion, AGR %)
Figure 80 Canada EV-onboard battery charger Market Forecast by Vehicle type, 2022-2032 (US$ billion, AGR %)
Figure 81 Canada EV-onboard battery charger Market Share Forecast by Vehicle type, 2022 & 2032 (%)
Figure 82 Canada EV-onboard battery charger Market Forecast by Propulsion type, 2022-2032 (US$ billion, AGR %)
Figure 83 Canada EV-onboard battery charger Market Share Forecast by Propulsion type, 2022 & 2032 (%)
Figure 84 Canada EV-onboard battery charger Market Forecast by Power output, 2022-2032 (US$ billion, AGR %)
Figure 85 Canada EV-onboard battery charger Market Share Forecast by Power output, 2022 & 2032 (%)
Figure 86 Europe EV-onboard battery charger Market Attractiveness Index
Figure 87 Europe EV-onboard battery charger Market by Region, 2022, 2027 & 2032 (US$ billion)
Figure 88 Europe EV-onboard battery charger Market Forecast by Country, 2022-2032 (US$ billion, AGR %)
Figure 89 Europe EV-onboard battery charger Market Share Forecast by Country, 2022 & 2032 (%)
Figure 90 Europe EV-onboard battery charger Market Forecast by Vehicle type, 2022-2032 (US$ billion, AGR %)
Figure 91 Europe EV-onboard battery charger Market Share Forecast by Vehicle type, 2022 & 2032 (%)
Figure 92 Euorpe EV-onboard battery charger Market Forecast by Propulsion type, 2022-2032 (US$ billion, AGR %)
Figure 93 Europe EV-onboard battery charger Market Share Forecast by Propulsion type, 2022 & 2032 (%)
Figure 94 Europe EV-onboard battery charger Market Forecast by Power output, 2022-2032 (US$ billion, AGR %)
Figure 95 Europe EV-onboard battery charger Market Share Forecast by Power output, 2022 & 2032 (%)
Figure 96 U.K EV-onboard battery charger Market Forecast, 2022-2032 (US$ billion, AGR %)
Figure 97 U.K. EV-onboard battery charger Market Forecast by Vehicle type, 2022-2032 (US$ billion, AGR %)
Figure 98 U.K. EV-onboard battery charger Market Share Forecast by Vehicle type, 2022 & 2032 (%)
Figure 99 U.K. EV-onboard battery charger Market Forecast by Propulsion type, 2022-2032 (US$ billion, AGR %)
Figure 100 U.K. EV-onboard battery charger Market Share Forecast by Propulsion type, 2022 & 2032 (%)
Figure 101 U.K. EV-onboard battery charger Market Forecast by Power output, 2022-2032 (US$ billion, AGR %)
Figure 102 U.K. EV-onboard battery charger Market Share Forecast by Power output, 2022 & 2032 (%)
Figure 103 Germany EV-onboard battery charger Market Forecast, 2022-2032 (US$ billion, AGR %)
Figure 104 Germany EV-onboard battery charger Market Forecast by Vehicle type, 2022-2032 (US$ billion, AGR %)
Figure 105 Germany EV-onboard battery charger Market Share Forecast by Vehicle type, 2022 & 2032 (%)
Figure 106 Germany EV-onboard battery charger Market Forecast by Propulsion type, 2022-2032 (US$ billion, AGR %)
Figure 107 Germany EV-onboard battery charger Market Share Forecast by Propulsion type, 2022 & 2032 (%)
Figure 108 Germany EV-onboard battery charger Market Forecast by Power output, 2022-2032 (US$ billion, AGR %)
Figure 109 Germany EV-onboard battery charger Market Share Forecast by Power output, 2022 & 2032 (%)
Figure 110 France EV-onboard battery charger Market Forecast, 2022-2032 (US$ billion, AGR %)
Figure 111 France EV-onboard battery charger Market Forecast by Vehicle type, 2022-2032 (US$ billion, AGR %)
Figure 112 France EV-onboard battery charger Market Share Forecast by Vehicle type, 2022 & 2032 (%)
Figure 113 France EV-onboard battery charger Market Forecast by Propulsion type, 2022-2032 (US$ billion, AGR %)
Figure 114 France EV-onboard battery charger Market Share Forecast by Propulsion type, 2022 & 2032 (%)
Figure 115 France EV-onboard battery charger Market Forecast by Power output, 2022-2032 (US$ billion, AGR %)
Figure 116 France EV-onboard battery charger Market Share Forecast by Power output, 2022 & 2032 (%)
Figure 117 Italy EV-onboard battery charger Market Forecast, 2022-2032 (US$ billion, AGR %)
Figure 118 Italy EV-onboard battery charger Market Forecast by Vehicle type, 2022-2032 (US$ billion, AGR %)
Figure 119 Italy EV-onboard battery charger Market Share Forecast by Vehicle type, 2022 & 2032 (%)
Figure 120 Italy EV-onboard battery charger Market Forecast by Propulsion type, 2022-2032 (US$ billion, AGR %)
Figure 121 Italy EV-onboard battery charger Market Share Forecast by Propulsion type, 2022 & 2032 (%)
Figure 122 Italy EV-onboard battery charger Market Forecast by Power output, 2022-2032 (US$ billion, AGR %)
Figure 123 Italy EV-onboard battery charger Market Share Forecast by power output, 2022 & 2032 (%)
Figure 124 Nordic EV-onboard battery charger Market Forecast, 2022-2032 (US$ billion, AGR %)
Figure 125 Nordic EV-onboard battery charger Market Forecast by Vehicle type, 2022-2032 (US$ billion, AGR %)
Figure 126 Nordic EV-onboard battery charger Market Share Forecast by Vehicle type, 2022 & 2032 (%)
Figure 127 Nordic EV-onboard battery charger Market Forecast by Propulsion type, 2022-2032 (US$ billion, AGR %)
Figure 128 Nordic EV-onboard battery charger Market Share Forecast by Propulsion type, 2022 & 2032 (%)
Figure 129 Nordic EV-onboard battery charger Market Forecast by Power output, 2022-2032 (US$ billion, AGR %)
Figure 130 Nordic EV-onboard battery charger Market Share Forecast by power output, 2022 & 2032 (%)
Figure 131 Rest of Europe EV-onboard battery charger Market Forecast, 2022-2032 (US$ billion, AGR %)
Figure 132 Rest of Europe EV-onboard battery charger Market Forecast by Vehicle type, 2022-2032 (US$ billion, AGR %)
Figure 133 Rest of Europe EV-onboard battery charger Market Share Forecast by Vehicle type, 2022 & 2032 (%)
Figure 134 Rest of Europe EV-onboard battery charger Market Forecast by Propulsion type, 2022-2032 (US$ billion, AGR %)
Figure 135 Rest of Europe EV-onboard battery charger Market Share Forecast by Propulsion type, 2022 & 2032 (%)
Figure 136 Rest of Europe EV-onboard battery charger Market Forecast by Power output, 2022-2032 (US$ billion, AGR %)
Figure 137 Rest of Europe EV-onboard battery charger Market Share Forecast by power output, 2022 & 2032 (%)
Figure 138 Asia Pacific EV-onboard battery charger Market Attractiveness Index
Figure 139 Asia Pacific EV-onboard battery charger Market by Region, 2022, 2027 & 2032 (US$ billion)
Figure 140 Asia Pacific EV-onboard battery charger Market Forecast by Country, 2022-2032 (US$ billion, AGR %)
Figure 141 Asia Pacific EV-onboard battery charger Market Share Forecast by Country, 2022 & 2032 (%)
Figure 142 Asia Pacific EV-onboard battery charger Market Forecast by Vehicle type, 2022-2032 (US$ billion, AGR %)
Figure 143 Asia Pacific EV-onboard battery charger Market Share Forecast by Vehicle type, 2022 & 2032 (%)
Figure 144 Asia Pacific EV-onboard battery charger Market Forecast by Propulsion type, 2022-2032 (US$ billion, AGR %)
Figure 145 Asia Pacific EV-onboard battery charger Market Share Forecast by Propulsion type, 2022 & 2032 (%)
Figure 146 Asia Pacific EV-onboard battery charger Market Forecast by Power output, 2022-2032 (US$ billion, AGR %)
Figure 147 Asia Pacific EV-onboard battery charger Market Share Forecast by Power output, 2022 & 2032 (%)
Figure 148 China EV-onboard battery charger Market Forecast, 2022-2032 (US$ billion, AGR %)
Figure 149 CHINA EV-onboard battery charger Market Forecast by Vehicle type, 2022-2032 (US$ billion, AGR %)
Figure 150 CHINA EV-onboard battery charger Market Share Forecast by Vehicle type, 2022 & 2032 (%)
Figure 151 China EV-onboard battery charger Market Forecast by Propulsion type, 2022-2032 (US$ billion, AGR %)
Figure 152 China EV-onboard battery charger Market Share Forecast by Propulsion type, 2022 & 2032 (%)
Figure 153 China EV-onboard battery charger Market Forecast by Power output, 2022-2032 (US$ billion, AGR %)
Figure 154 China EV-onboard battery charger Market Share Forecast by Power output, 2022 & 2032 (%)
Figure 155 Australia EV-onboard battery charger Market Forecast, 2022-2032 (US$ billion, AGR %)
Figure 156 Australia EV-onboard battery charger Market Forecast by Vehicle type, 2022-2032 (US$ billion, AGR %)
Figure 157 Australia EV-onboard battery charger Market Share Forecast by Vehicle type, 2022 & 2032 (%)
Figure 158 Australia EV-onboard battery charger Market Forecast by Propulsion type, 2022-2032 (US$ billion, AGR %)
Figure 159 Australia EV-onboard battery charger Market Share Forecast by Propulsion type, 2022 & 2032 (%)
Figure 160 Australia EV-onboard battery charger Market Forecast by Power output, 2022-2032 (US$ billion, AGR %)
Figure 161 Australia EV-onboard battery charger Market Share Forecast by Power output, 2022 & 2032 (%)
Figure 162 India EV-onboard battery charger Market Forecast, 2022-2032 (US$ billion, AGR %)
Figure 163 India EV-onboard battery charger Market Forecast by Vehicle type, 2022-2032 (US$ billion, AGR %)
Figure 164 India EV-onboard battery charger Market Share Forecast by Vehicle type, 2022 & 2032 (%)
Figure 165 India EV-onboard battery charger Market Forecast by Propulsion type, 2022-2032 (US$ billion, AGR %)
Figure 166 India EV-onboard battery charger Market Share Forecast by Propulsion type, 2022 & 2032 (%)
Figure 167 India EV-onboard battery charger Market Forecast by Power output, 2022-2032 (US$ billion, AGR %)
Figure 168 India EV-onboard battery charger Market Share Forecast by Power output, 2022 & 2032 (%)
Figure 169 Japan EV-onboard battery charger Market Forecast, 2022-2032 (US$ billion, AGR %)
Figure 170 Japan EV-onboard battery charger Market Forecast by Vehicle type, 2022-2032 (US$ billion, AGR %)
Figure 171 Japan EV-onboard battery charger Market Share Forecast by Vehicle type, 2022 & 2032 (%)
Figure 172 Japan EV-onboard battery charger Market Forecast by Propulsion type, 2022-2032 (US$ billion, AGR %)
Figure 173 Japan EV-onboard battery charger Market Share Forecast by Propulsion type, 2022 & 2032 (%)
Figure 174 Japan EV-onboard battery charger Market Forecast by Power output, 2022-2032 (US$ billion, AGR %)
Figure 175 Japan EV-onboard battery charger Market Share Forecast by power output, 2022 & 2032 (%)
Figure 176 South Korea EV-onboard battery charger Market Forecast, 2022-2032 (US$ billion, AGR %)
Figure 177 South Korea EV-onboard battery charger Market Forecast by Vehicle type, 2022-2032 (US$ billion, AGR %)
Figure 178 South Korea EV-onboard battery charger Market Share Forecast by Vehicle type, 2022 & 2032 (%)
Figure 179 South Korea EV-onboard battery charger Market Forecast by Propulsion type, 2022-2032 (US$ billion, AGR %)
Figure 180 South Korea EV-onboard battery charger Market Share Forecast by Propulsion type, 2022 & 2032 (%)
Figure 181 South Korea EV-onboard battery charger Market Forecast by Power output, 2022-2032 (US$ billion, AGR %)
Figure 182 South Korea EV-onboard battery charger Market Share Forecast by power output, 2022 & 2032 (%)
Figure 183 Rest of Asia Pacific EV-onboard battery charger Market Forecast, 2022-2032 (US$ billion, AGR %)
Figure 184 Rest of Asia Pacific EV-onboard battery charger Market Forecast by Vehicle type, 2022-2032 (US$ billion, AGR %)
Figure 185 Rest of Asia Pacific EV-onboard battery charger Market Share Forecast by Vehicle type, 2022 & 2032 (%)
Figure 186 Rest of Asia Pacific EV-onboard battery charger Market Forecast by Propulsion type, 2022-2032 (US$ billion, AGR %)
Figure 187 Rest of Asia Pacific EV-onboard battery charger Market Share Forecast by Propulsion type, 2022 & 2032 (%)
Figure 188 Rest of Asia Pacific EV-onboard battery charger Market Forecast by Power output, 2022-2032 (US$ billion, AGR %)
Figure 189 Rest of Asia Pacific EV-onboard battery charger Market Share Forecast by power output, 2022 & 2032 (%)
Figure 190 LAMEA EV-onboard battery charger Market Attractiveness Index
Figure 191 LAMEA EV-onboard battery charger Market by Region, 2022, 2027 & 2032 (US$ billion)
Figure 192 LAMEA EV-onboard battery charger Market Forecast by Country, 2022-2032 (US$ billion, AGR %)
Figure 193 LAMEA EV-onboard battery charger Market Share Forecast by Country, 2022 & 2032 (%)
Figure 194 LAMEA EV-onboard battery charger Market Forecast by Vehicle type, 2022-2032 (US$ billion, AGR %)
Figure 195 LAMEA EV-onboard battery charger Market Share Forecast by Vehicle type, 2022 & 2032 (%)
Figure 196 Euorpe EV-onboard battery charger Market Forecast by Propulsion type, 2022-2032 (US$ billion, AGR %)
Figure 197 LAMEA EV-onboard battery charger Market Share Forecast by Propulsion type, 2022 & 2032 (%)
Figure 198 LAMEA EV-onboard battery charger Market Forecast by Power output, 2022-2032 (US$ billion, AGR %)
Figure 199 LAMEA EV-onboard battery charger Market Share Forecast by Power output, 2022 & 2032 (%)
Figure 200 Latin America EV-onboard battery charger Market Forecast, 2022-2032 (US$ billion, AGR %)
Figure 201 LATIN AMERICA EV-onboard battery charger Market Forecast by Vehicle type, 2022-2032 (US$ billion, AGR %)
Figure 202 LATIN AMERICA EV-onboard battery charger Market Share Forecast by Vehicle type, 2022 & 2032 (%)
Figure 203 Latin America EV-onboard battery charger Market Forecast by Propulsion type, 2022-2032 (US$ billion, AGR %)
Figure 204 Latin America EV-onboard battery charger Market Share Forecast by Propulsion type, 2022 & 2032 (%)
Figure 205 Latin America EV-onboard battery charger Market Forecast by Power output, 2022-2032 (US$ billion, AGR %)
Figure 206 Latin America EV-onboard battery charger Market Share Forecast by Power output, 2022 & 2032 (%)
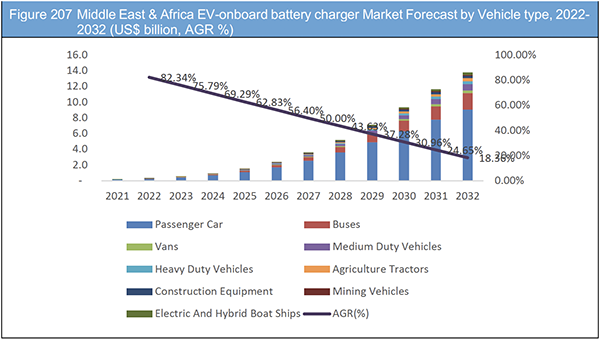
Figure 207 Middle East & Africa EV-onboard battery charger Market Forecast, 2022-2032 (US$ billion, AGR %)
Figure 208 Middle East & Africa EV-onboard battery charger Market Forecast by Vehicle type, 2022-2032 (US$ billion, AGR %)
Figure 209 Middle East & Africa EV-onboard battery charger Market Share Forecast by Vehicle type, 2022 & 2032 (%)
Figure 210 Middle East & Africa EV-onboard battery charger Market Forecast by Propulsion type, 2022-2032 (US$ billion, AGR %)
Figure 211 Middle East & Africa EV-onboard battery charger Market Share Forecast by Propulsion type, 2022 & 2032 (%)
Figure 212 Middle East & Africa EV-onboard battery charger Market Forecast by Power output, 2022-2032 (US$ billion, AGR %)
Figure 213 Middle East & Africa EV-onboard battery charger Market Share Forecast by Power output, 2022 & 2032 (%)
Figure 214 Toyota Industries Corporation: Net Revenue, 2017-2021 (US$ Million, AGR%)
Figure 215 Toyota Industries Corporation: Regional Market Shares, 2020
Figure 216 Toyota Industries Corporation: Gross Profit, 2017-2021 (US$ Million, AGR%)
Figure 217 Toyota Industries Corporation: R&D, 2017-2021 (US$ Million, AGR%)
Figure 218 Eaton: Net Revenue, 2017-2021 (US$ Million, AGR%)
Figure 219 Eaton: Regional Market Shares, 2021
Figure 220 Eaton: Gross Profit, 2017-2021 (US$ Million, AGR%)
Figure 221 Eaton: R&D, 2017-2021 (US$ Million, AGR%)
Figure 222 Borgwarner Inc: Net Revenue, 2017-2021 (US$ Million, AGR%)
Figure 223 Borgwarner Inc: Regional Market Shares, 2021
Figure 224 Borgwarner Inc: Gross Profit, 2017-2021 (US$ Million, AGR%)
Figure 225 Borgwarner Inc: R&D, 2017-2021 (US$ Million, AGR%)
Figure 226 Infineon Technologies: Net Revenue, 2017-2021 (US$ Million, AGR%)
Figure 227 Infineon Technologies: Regional Market Shares, 2021
Figure 228 Infineon Technologies: Gross Profit, 2017-2021 (US$ Million, AGR%)
Figure 229 Infineon Technologies: R&D, 2017-2021 (US$ Million, AGR%)
Figure 230 STMICROELECTRONICS: Net Revenue, 2017-2021 (US$ Million, AGR%)
Figure 231 STMICROELECTRONICS: Regional Market Shares, 2021
Figure 232 STMICROELECTRONICS: Gross Profit, 2017-2021 (US$ Million, AGR%)
Figure 233 STMICROELECTRONICS: R&D, 2017-2021 (US$ Million, AGR%)
ページTOPに戻る
Summary
この調査レポートは世界のEV用オンボードチャージャー市場を調査し、車両タイプ別、推進タイプ別、出力別、地域別に2022年から2032年までの予測結果を掲載しています。また関連企業情報を提供しています。
主な掲載内容(目次より抜粋)
-
レポート概要
-
エグゼクティブサマリー
-
プレミアムインサイト
-
市場概要
-
世界のEV用オンボードチャージャー市場分析:車両タイプ別
-
世界のEV用オンボードチャージャー市場分析:推進タイプ別
-
世界のEV用オンボードチャージャー市場分析:出力別
-
世界のEV用オンボードチャージャー市場分析:地域別
-
北米のEV用オンボードチャージャー市場分析
-
欧州のEV用オンボードチャージャー市場分析
-
アジア太平洋地域のEV用オンボードチャージャー市場分析
-
LAMEAのEV用オンボードチャージャー市場分析
-
競争状況
-
主要企業のプロフィール
Report Details
The EV On-Board Battery Charger Market Report 2022-2032: This report will prove invaluable to leading firms striving for new revenue pockets if they wish to better understand the industry and its underlying dynamics. It will be useful for companies that would like to expand into different industries or to expand their existing operations in a new region.
Factors Such As The tremendous growth in the sales of electric vehicles, The growing demand for fast chargers, and The high cost of charging an electric vehicle at public charging stations Are Driving The Market Growth
Some of the major forces propelling the global EV On-Board Battery Charger market include the tremendous growth in the sales of electric vehicles, the growing demand for fast chargers, and the high cost of charging an electric vehicle at public charging stations. Furthermore, rapid growth in the number of smart cities across the globe is expected to create an opportunity for the EV onboard battery charger manufacturers. Government initiatives are the need of the hour to grow the electric vehicle (EV) on-board battery charger market. As a part of government initiatives in this domain, they are investing in the development of electric vehicles (EV). This will lead to more investment and research to develop electric vehicles (EV) and onboard battery charger propulsion type.
On the other hand, growing adoption of fast DC chargers coupled with lack of standardization of onboard battery chargers is restraining the market growth of electric vehicles globally. Despite the increase in demand, there is a problem that is plaguing the electric vehicle industry. Many developing Asian and African countries have poor infrastructure when it comes to electric vehicle charging stations, which is hampering their growth.
Lack of Infrastructure Challenges
A lack of infrastructure networks in most developing countries is putting a brake on the market for Electric Vehicle onboard battery chargers. In some regions, for example, it takes more than an hour to fully charge an Electric Vehicle, which is a deterrent for most people. Charging station networks are essential if Electric Vehicle markets are to grow in these regions. Governments need to plan a strategy of subsidies and incentives to encourage the growth of Electric Vehicle charging infrastructure. In countries such as India, Brazil, South Africa and Argentina, critical urban infrastructure such as public charging stations are limited. This is expected to create a challenge for the EV onboard battery charger manufacturers.
What Are These Questions You Should Ask Before Buying A Market Research Report?
• How is the EV On-Board Battery Charger market evolving?
• What is driving and restraining the EV On-Board Battery Charger market?
• How will each EV On-Board Battery Charger submarket segment grow over the forecast period and how much revenue will these submarkets account for in 2032?
• How will the market shares for each EV On-Board Battery Charger submarket develop from 2022 to 2032?
• What will be the main driver for the overall market from 2022 to 2032?
• Will leading EV On-Board Battery Charger markets broadly follow the macroeconomic dynamics, or will individual national markets outperform others?
• How will the market shares of the national markets change by 2032 and which geographical region will lead the market in 2032?
• Who are the leading players and what are their prospects over the forecast period?
• What are the EV On-Board Battery Charger projects for these leading companies?
• How will the industry evolve during the period between 2022 and 2032? What are the implication of EV On-Board Battery Charger projects taking place now and over the next 10 years?
• Is there a greater need for product commercialisation to further scale the EV On-Board Battery Charger market?
• Where is the EV On-Board Battery Charger market heading? And how can you ensure you are at the forefront of the market?
• What can be the best investment options for new product and service lines?
• What are the key prospects for moving companies into a new growth path? C-suite?
You need to discover how this will impact the EV On-Board Battery Charger market today, and over the next 10 years:
• Our 337-page report provides 123 tables and 233 charts/graphs exclusively to you.
• The report highlights key lucrative areas in the industry so you can target them – NOW.
• Contains in-depth analyse of global, regional and national sales and growth
• Highlights for you the key successful trends, changes and revenue projections made by your competitors
This report tells you TODAY how the EV On-Board Battery Charger market will develop in the next 10 years, and in-line with the variations in COVID-19 economic recession and bounce. This market is more critical now than at any point over the last 10 years.
Delivers exclusive COVID-19 variations economic data specific to your market.
Forecasts to 2032 and other analyses reveal the commercial prospects
• In addition to revenue forecasting to 2032, our new study provides you with recent results, growth rates, and market shares.
• You find original analyses, with business outlooks and developments.
• Discover qualitative analyses (including market dynamics, drivers, opportunities, restraints and challenges), cost structure, impact of rising EV On-Board Battery Charger prices and recent developments.
This report includes data analysis and invaluable insight into how COVID-19 will affect the industry and your company. Four COVID-19 recovery patterns and their impact, namely, V, L, W and U are discussed in this report.
Segments Covered in the Report
Vehicle Type
• Passenger Cars
• Buses, Vans
• Medium Duty Vehicles
• Heavy Duty Vehicles
• Agriculture Tractors
• Construction Equipment
• Mining Vehicles
• Electric and Hybrid Boat ship
Propulsion Type
• BEV
• HEV
• PHEV
Power Output
• Less than 10kW
• 10kW to 20kW
• More than 20kW
In addition to the revenue predictions for the overall world market and segments, you will also find revenue forecasts for 4 regional and 20 leading national markets:
North America
• U.S.
• Canada
Europe
• Germany
• Nordic
• United Kingdom
• France
• Italy
• Rest of Europe
Asia Pacific
• China
• Japan
• India
• Australia
• South Korea
• Rest of Asia Pacific
Latin America Middle East & Africa
The report also includes profiles and for some of the leading companies in the EV On-Board Battery Charger Market, 2022 to 2032, with a focus on this segment of these companies’ operations.
Leading companies and the potential for market growth
• AVID Propulsion type Limited
• Bel Fuse Inc.
• BRUSA Elektronik
• Delphi Technologies
• Eaton
• EVolve Electrics
• Ficosa
• Infineon Technologies
• Innoelectric
• LG Electronics (LG Magna e-Powertrain Co Ltd.)
• Stercom Power Solutions
• STMICROELECTRONICS
• Tata Autocomp Systems Ltd
• Toyota Industries Corporation
• Xepics Group
Overall world revenue for EV On-Board Battery Charger Market, 2022 to 2032 in terms of value the market will surpass US$21.3 billion in 2022, our work calculates. We predict strong revenue growth through to 2032. Our work identifies which organizations hold the greatest potential. Discover their capabilities, progress, and commercial prospects, helping you stay ahead.
How the EV On-Board Battery Charger Market, 2022 to 2032 Market report helps you?
In summary, our 300+ page report provides you with the following knowledge:
• Revenue forecasts to 2032 for EV On-Board Battery Charger Market, 2022 to 2032 Market, with forecasts for Process, upstream, downstream, type company size each forecasted at a global and regional level– discover the industry’s prospects, finding the most lucrative places for investments and revenues
• Revenue forecasts to 2032 for 4 regional and 20 key national markets – See forecasts for the EV On-Board Battery Charger Market, 2022 to 2032 market in North America, Europe, Asia-Pacific and LAMEA. Also forecasted is the market in the US, Canada, Mexico, Brazil, Germany, France, UK, Italy, China, India, Japan, and Australia among other prominent economies.
• Prospects for established firms and those seeking to enter the market– including company profiles for 20 of the major companies involved in the EV On-Board Battery Charger Market, 2022 to 2032 Market.
Find quantitative and qualitative analyses with independent predictions. Receive information that only our report contains, staying informed with this invaluable business intelligence.
Information found nowhere else
With our newly report title, you are less likely to fall behind in knowledge or miss out on opportunities. See how our work could benefit your research, analyses, and decisions. Visiongain’s study is for everybody needing commercial analyses for the EV On-Board Battery Charger Market, 2022 to 2032 Market and leading companies. You will find data, trends and predictions.
ページTOPに戻る
Table of Contents
Table of Contents
1. Report Overview
1.1 Objectives of the Study
1.2 Introduction to On-Board Battery Charger Market
1.3 What This Report Delivers
1.4 Why You Should Read This Report
1.5 Key Questions Answered By This Analytical Report Include:
1.6 Who is This Report For?
1.7 Methodology
1.7.1 Market Definitions
1.7.2 Market Evaluation & Forecasting Methodology
1.7.3 Data Validation
1.8 Frequently Asked Questions (FAQs)
1.9 Associated Visiongain Reports
1.10 About Visiongain
2 Executive Summary
3 Premium Insights
3.1 Geographical Snapshot: Global EV-onboard battery charger Market
3.2 Vehicle type Segment: Market Attractiveness Index
3.3 Propulsion type Segment: Market Attractiveness Index
3.4 Power output Segment: Market Attractiveness Index
4 Market Overview
4.1 Key Findings
4.2 Market Dynamics
4.2.1 Market Driving Factors
4.2.2 Restrains
4.2.3 Opportunities
4.3 COVID-19 Impact Analysis
4.4 Porter’s Five Forces Analysis
4.4.1 Supplier Power
4.4.2 Buyer Power
4.4.3 Competitive Rivalry
4.4.4 Threat from Substitutes
4.4.5 Threat of New Entrants
4.5 PESTLE Analysis
5 Global EV-onboard battery charger Market Analysis by Vehicle type
5.1 Key Findings
5.2 Global EV-onboard battery charger Market Size Estimation and Forecast by Vehicle type
5.3 Vehicle type Segment Growth Prospects
5.4 Global EV-onboard battery charger Market Share by Vehicle type, 2022 & 2032
5.5 Passenger Car
5.5.1 Global EV On-Board Battery Charger Market for Passenger Car, By Region
5.5.2 Global EV On-Board Battery Charger Market Share for Passenger Car by Region, 2022-2032 (%)
5.6 Buses
5.6.1 Global EV On-Board Battery Charger Market for Buses, By Region
5.6.2 Global EV On-Board Battery Charger Market Share for Buses by Region, 2022-2032 (%)
5.7 Vans
5.7.1 Global EV On-Board Battery Charger Market for Vans, By Region
5.7.2 Global EV On-Board Battery Charger Market Share for Vans by Region, 2022-2032 (%)
5.8 Medium Duty Vehicles
5.8.1 Global EV On-Board Battery Charger Market for Medium Duty Vehicles, By Region
5.8.2 Global EV On-Board Battery Charger Market Share for Medium Duty Vehicles by Region, 2022-2032 (%)
5.9 Heavy Duty Vehicles
5.9.1 Global EV On-Board Battery Charger Market for Heavy Duty Vehicles, By Region
5.9.2 Global EV On-Board Battery Charger Market Share for Heavy Duty Vehicles by Region, 2022-2032 (%)
5.10 Agriculture Tractors
5.10.1 Global EV On-Board Battery Charger Market for Agriculture Tractors, By Region
5.10.2 Global EV On-Board Battery Charger Market Share for Agriculture Tractors by Region, 2022-2032 (%)
5.11 Construction Equipment
5.11.1 Global EV On-Board Battery Charger Market for Construction Equipment, By Region
5.11.2 Global EV On-Board Battery Charger Market Share for Construction Equipment by Region, 2022-2032 (%)
5.12 Mining Vehicles
5.12.1 Global EV On-Board Battery Charger Market for Mining Vehicles, By Region
5.12.2 Global EV On-Board Battery Charger Market Share for Mining Vehicles by Region, 2022-2032 (%)
5.13 Electric And Hybrid Boat Ships
5.13.1 Global EV On-Board Battery Charger Market for Electric And Hybrid Boat Ships, By Region
5.13.2 Global EV On-Board Battery Charger Market Share for Electric And Hybrid Boat Ships by Region, 2022-2032 (%)
6 Global EV-onboard battery charger Market Analysis by propulsion type
6.1 Key Findings
6.2 Global EV-onboard battery charger Market Size Estimation and Forecast by Propulsion type
6.3 Propulsion type Segment Growth Prospects
6.4 Global EV-onboard battery charger Market Share by Propulsion type, 2022 & 2032
6.5 BEV
6.5.1 Global EV On-Board Battery Charger Market for BEV, By Region
6.5.2 Global EV On-Board Battery Charger Market Share for BEV by Region, 2022-2032 (%)
6.6 HEV
6.6.1 Global EV On-Board Battery Charger Market for HEV, By Region
6.6.2 Global EV On-Board Battery Charger Market Share for HEV by Region, 2022-2032 (%)
6.7 PHEV
6.7.1 Global EV On-Board Battery Charger Market for PHEV, By Region
6.7.2 Global EV On-Board Battery Charger Market Share for PHEV by Region, 2022-2032 (%)
7 Global EV-onboard battery charger Market Analysis by power output
7.1 Key Findings
7.2 Global EV-onboard battery charger Market Size Estimation and Forecast by Power Output
7.3 Power Output Segment Growth Prospects
7.4 Global EV-onboard battery charger Market Share by Power Output, 2022 & 2032
7.5 Less than 10kW
7.5.1 Global Less than 10kW EV On-Board Battery Charger Market, By Region
7.5.2 Global Less than 10kW EV On-Board Battery Charger Market Share by Region, 2022-2032 (%)
7.6 10kW to 20kW
7.6.1 Global 10kW to 20kW EV On-Board Battery Charger Market, By Region
7.6.2 Global 10kW to 20kW EV On-Board Battery Charger Market Share by Region, 2022-2032 (%)
7.7 More than 20kW
7.7.1 Global More than 20kW EV On-Board Battery Charger Market, By Region
7.7.2 Global More than 20kW EV On-Board Battery Charger Market Share by Region, 2022-2032 (%)
8 Global EV-onboard battery charger Market Analysis by Region
8.1 Key Findings
8.2 Regional Market Size Estimation and Forecast
8.3 COVID-19 Impact Analysis: Recovery Scenarios (V, U, W, L)
9 North America EV-onboard battery charger Market Analysis
9.1 Key Findings
9.2 North America EV-onboard battery charger Market Attractiveness Index
9.3 North America EV-onboard battery charger Market by Country, 2022, 2027 & 2032 (US$ bn)
9.4 North America EV-onboard battery charger Market Size Estimation and Forecast by Country
9.5 North America EV-onboard battery charger Market Size Estimation and Forecast by Vehicle type
9.6 North America EV-onboard battery charger Market Size Estimation and Forecast by Propulsion type
9.7 North America EV-onboard battery charger Market Size Estimation and Forecast by Power output
9.8 U.S.
9.8.1 U.S. EV-onboard battery charger Market by Vehicle type
9.8.2 U.S. EV-onboard battery charger Market by Propulsion type
9.8.3 U.S. EV-onboard battery charger Market by Power output
9.9 Canada
9.9.1 Canada EV-onboard battery charger Market by Vehicle type
9.9.2 Canada EV-onboard battery charger Market by Propulsion type
9.9.3 Canada EV-onboard battery charger Market by Power output
10 Europe EV-onboard Battery Charger Market Analysis
10.1 Key Findings
10.2 Europe EV-onboard battery charger Market Attractiveness Index
10.3 Europe EV-onboard battery charger Market by Country, 2022, 2027 & 2032 (US$ bn)
10.4 Europe EV-onboard battery charger Market Size Estimation and Forecast by Country
10.5 Europe EV-onboard battery charger Market Size Estimation and Forecast by Vehicle type
10.6 Europe EV-onboard battery charger Market Size Estimation and Forecast by Propulsion type
10.7 Europe EV-onboard battery charger Market Size Estimation and Forecast by Power output
10.8 U.K.
10.8.1 U.K. EV-onboard battery charger Market by Vehicle type
10.8.2 U.K. EV-onboard battery charger Market by Propulsion type
10.8.3 U.K. EV-onboard battery charger Market by Power output
10.9 Germany
10.9.1 Germany EV-onboard battery charger Market by Vehicle type
10.9.2 Germany EV-onboard battery charger Market by Propulsion type
10.9.3 Germany EV-onboard battery charger Market by Power output
10.10 France
10.10.1 France EV-onboard battery charger Market by Vehicle type
10.10.2 France EV-onboard battery charger Market by Propulsion type
10.10.3 France EV-onboard battery charger Market by Power output
10.11 Italy
10.11.1 Italy EV-onboard battery charger Market by Vehicle type
10.11.2 Italy EV-onboard battery charger Market by Propulsion type
10.11.3 Italy EV-onboard battery charger Market by Power output
10.12 Nordic
10.12.1 Nordic EV-onboard battery charger Market by Vehicle type
10.12.2 Nordic EV-onboard battery charger Market by Propulsion type
10.12.3 Nordic EV-onboard battery charger Market by Power output
10.13 Rest of Europe
10.13.1 Rest of Europe EV-onboard battery charger Market by Vehicle type
10.13.2 Rest of Europe EV-onboard battery charger Market by Propulsion type
10.13.3 Rest of Europe EV-onboard battery charger Market by Power output
11 Asia Pacific EV-onboard Battery Charger Market Analysis
11.1 Key Findings
11.2 Asia Pacific EV-onboard battery charger Market Attractiveness Index
11.3 Asia Pacific EV-onboard battery charger Market by Country, 2022, 2027 & 2032 (US$ bn)
11.4 Asia Pacific EV-onboard battery charger Market Size Estimation and Forecast by Country
11.5 Asia Pacific EV-onboard battery charger Market Size Estimation and Forecast by Vehicle type
11.6 Asia Pacific EV-onboard battery charger Market Size Estimation and Forecast by Propulsion type
11.7 Asia Pacific EV-onboard battery charger Market Size Estimation and Forecast by Power output
11.8 China
11.8.1 China EV-onboard battery charger Market by Vehicle type
11.8.2 China EV-onboard battery charger Market by Propulsion type
11.8.3 China EV-onboard battery charger Market by Power output
11.9 Australia
11.9.1 Australia EV-onboard battery charger Market by Vehicle type
11.9.2 Australia EV-onboard battery charger Market by Propulsion type
11.9.3 Australia EV-onboard battery charger Market by Power output
11.10 India
11.10.1 India EV-onboard battery charger Market by Vehicle type
11.10.2 India EV-onboard battery charger Market by Propulsion type
11.10.3 India EV-onboard battery charger Market by Power output
11.11 Japan
11.11.1 Japan EV-onboard battery charger Market by Vehicle type
11.11.2 Japan EV-onboard battery charger Market by Propulsion type
11.11.3 Japan EV-onboard battery charger Market by Power output
11.12 South Korea
11.12.1 South Korea EV-onboard battery charger Market by Vehicle type
11.12.2 South Korea EV-onboard battery charger Market by Propulsion type
11.12.3 South Korea EV-onboard battery charger Market by Power output
11.13 Rest of Asia Pacific
11.13.1 Rest of Asia Pacific EV-onboard battery charger Market by Vehicle type
11.13.2 Rest of Asia Pacific EV-onboard battery charger Market by Propulsion type
11.13.3 Rest of Asia Pacific EV-onboard battery charger Market by Power output
12 LAMEA EV-onboard Battery Charger Market Analysis
12.1 Key Findings
12.2 LAMEA EV-onboard battery charger Market Attractiveness Index
12.3 LAMEA EV-onboard battery charger Market by Country, 2022, 2027 & 2032 (US$ bn)
12.4 LAMEA EV-onboard battery charger Market Size Estimation and Forecast by Country
12.5 LAMEA EV-onboard battery charger Market Size Estimation and Forecast by Vehicle type
12.6 LAMEA EV-onboard battery charger Market Size Estimation and Forecast by Propulsion type
12.7 LAMEA EV-onboard battery charger Market Size Estimation and Forecast by Power output
12.8 Latin America
12.8.1 Latin America EV-onboard battery charger Market by Vehicle type
12.8.2 Latin America EV-onboard battery charger Market by Propulsion type
12.8.3 Latin America EV-onboard battery charger Market by Power output
12.9 Middle East & Africa
12.9.1 Middle East & Africa EV-onboard battery charger Market by Vehicle type
12.9.2 Middle East & Africa EV-onboard battery charger Market by Propulsion type
12.9.3 Middle East & Africa EV-onboard battery charger Market by Power output
13 Competitive Landscape
13.1 Company Share Analysis
13.2 Key Business Strategy Analysis
14 Company Profiles
14.1 Innoelectric
14.1.1 Company Snapshot
14.1.2 Company Overview
14.1.3 Product Benchmarking
14.1.4 Strategic Outlook
14.2 Ficosa
14.2.1 Company Snapshot
14.2.2 Company Overview
14.2.3 Product Benchmarking
14.2.4 Strategic Outlook
14.3 AVID Propulsion type Limited
14.3.1 Company Snapshot
14.3.2 Company Overview
14.3.3 Product Benchmarking
14.4 BRUSA Elektronik
14.4.1 Company Snapshot
14.4.2 Company Overview
14.4.3 Product Benchmarking
14.4.4 Strategic Outlook
14.5 Toyota Industries Corporation
14.5.1 Company Snapshot
14.5.2 Company Overview
14.5.3 Financial Analysis
14.5.4 Product Benchmarking
14.5.5 Strategic Outlook
14.6 Stercom Power Solutions
14.6.1 Company Snapshot
14.6.2 Company Overview
14.6.3 Product Benchmarking
14.6.4 Strategic Outlook
14.7 Eaton
14.7.1 Company Snapshot
14.7.2 Company Overview
14.7.3 Financial Analysis
14.7.4 Product Benchmarking
14.7.5 Strategic Outlook
14.8 Delphi Technologies
14.8.1 Company Snapshot
14.8.2 Company Overview
14.8.3 Financial Analysis
14.8.4 Product Benchmarking
14.8.5 Strategic Outlook
14.9 Infineon Technologies
14.9.1 Company Snapshot
14.9.2 Company Overview
14.9.3 Financial Analysis
14.9.4 Product Benchmarking
14.9.5 Strategic Outlook
14.10 STMICROELECTRONICS
14.10.1 Company Snapshot
14.10.2 Company Overview
14.10.3 Financial Analysis
14.10.4 Product Benchmarking
14.10.5 Strategic Outlook
15 Concluding Remarks from Visiongain
16 Recommendations for Market Players
List of Tables
Table 1 Global EV-onboard battery charger Market Snapshot, 2022 & 2032 (US$ billion, CAGR %)
Table 2 Global EV-onboard battery charger Market by Region, 2022-2032 (USD Mn, AGR (%), CAGR(%)): “V” Shaped Recovery Scenario
Table 3 Global EV-onboard battery charger Market by Region, 2022-2032 (USD Mn, AGR (%), CAGR(%)): “U” Shaped Recovery Scenario
Table 4 Global EV-onboard battery charger Market by Region, 2022-2032 (USD Mn, AGR (%), CAGR(%)): “W” Shaped Recovery Scenario
Table 5 Global EV-onboard battery charger Market by Region, 2022-2032 (USD Mn, AGR (%), CAGR(%)): “L” Shaped Recovery Scenario
Table 6 Global EV On-Board Battery Charger Market, By Vehicle Type, 2022 - 2032 (US$ billion, AGR%, CAGR%)
Table 7 Global EV On-Board Battery Charger Market for Passenger Car, By Region, 2022 - 2032 (US$ billion, AGR%, CAGR%)
Table 8 Global EV On-Board Battery Charger Market for Buses, By Region, 2022 - 2032 (US$ billion, AGR%, CAGR%)
Table 9 Global EV On-Board Battery Charger Market for Vans, By Region, 2022 - 2032 (US$ million, AGR%, CAGR%)
Table 10 Global EV On-Board Battery Charger Market for Medium Duty Vehicles, By Region, 2022 - 2032 (US$ million, AGR%, CAGR%)
Table 11 Global EV On-Board Battery Charger Market for Heavy Duty Vehicles, By Region, 2022 - 2032 (US$ million, AGR%, CAGR%)
Table 12 Global EV On-Board Battery Charger Market for Agriculture Tractors, By Region, 2022 - 2032 (US$ million, AGR%, CAGR%)
Table 13 Global EV On-Board Battery Charger Market for Construction Equipment, By Region, 2022 - 2032 (US$ million, AGR%, CAGR%)
Table 14 Global EV On-Board Battery Charger Market for Mining Vehicles, By Region, 2022 - 2032 (US$ million, AGR%, CAGR%)
Table 15 Global EV On-Board Battery Charger Market for Electric and Hybrid Boat Ships, By Region, 2022 - 2032 (US$ million, AGR%, CAGR%)
Table 16 Global EV On-Board Battery Charger Market, By Propulsion Type, 2022 - 2032 (US$ billion, AGR%, CAGR%)
Table 17 Global BEV On-Board Battery Charger Market, By Region, 2022 - 2032 (US$ billion, AGR%, CAGR%)
Table 18 Global HEV On-Board Battery Charger Market, By Region, 2022 - 2032 (US$ billion, AGR%, CAGR%)
Table 19 Global PHEV On-Board Battery Charger Market, By Region, 2022 - 2032 (US$ billion, AGR%, CAGR%)
Table 20 Global EV On-Board Battery Charger Market, By Power Output, 2022 - 2032 (US$ billion, AGR%, CAGR%)
Table 21 Global Less than 10kW EV On-Board Battery Charger Market, By Region, 2022 - 2032 (US$ billion, AGR%, CAGR%)
Table 22 Global 10kW to 20kW EV On-Board Battery Charger Market, By Region, 2022 - 2032 (US$ billion, AGR%, CAGR%)
Table 23 Global More than 20kW EV On-Board Battery Charger Market, By Region, 2022 - 2032 (US$ billion, AGR%, CAGR%)
Table 24 Global EV On-Board Battery Charger Market, By Region, 2022 - 2032 (US$ billion, AGR%, CAGR%)
Table 25 Global EV-onboard battery charger Market by Region, 2022-2032 (USD Mn, AGR (%), CAGR(%)): “V” Shaped Recovery Scenario
Table 26 Global EV-onboard battery charger Market by Region, 2022-2032 (USD Mn, AGR (%), CAGR(%)): “U” Shaped Recovery Scenario
Table 27 Global EV-onboard battery charger Market by Region, 2022-2032 (USD Mn, AGR (%), CAGR(%)): “W” Shaped Recovery Scenario
Table 28 Global EV-onboard battery charger Market by Region, 2022-2032 (USD Mn, AGR (%), CAGR(%)): “L” Shaped Recovery Scenario
Table 29 North America EV On-Board Battery Charger Market, By Country, 2022 - 2032 (US$ billion, AGR%, CAGR%)
Table 30 North America EV On-Board Battery Charger Market, By Vehicle Type, 2022 - 2032 (US$ billion, AGR%, CAGR%)
Table 31 North America EV On-Board Battery Charger Market, By Propulsion Type, 2022 - 2032 (US$ billion, AGR%, CAGR%)
Table 32 North America EV On-Board Battery Charger Market, By Power Output, 2022 - 2032 (US$ billion, AGR%, CAGR%)
Table 33 U.S. EV On-Board Battery Charger Market, By Vehicle Type, 2022 - 2032 (US$ billion, AGR%, CAGR%)
Table 34 U.S. EV On-Board Battery Charger Market, By Propulsion Type, 2022 - 2032 (US$ billion, AGR%, CAGR%)
Table 35 U.S. EV On-Board Battery Charger Market, By Power Output, 2022 - 2032 (US$ billion, AGR%, CAGR%)
Table 36 Canada EV On-Board Battery Charger Market, By Vehicle Type, 2022 - 2032 (US$ billion, AGR%, CAGR%)
Table 37 Canada EV On-Board Battery Charger Market, By Propulsion Type, 2022 - 2032 (US$ billion, AGR%, CAGR%)
Table 38 Canada EV On-Board Battery Charger Market, By Power Output, 2022 - 2032 (US$ billion, AGR%, CAGR%)
Table 39 Europe EV On-Board Battery Charger Market, By Country, 2022 - 2032 (US$ billion, AGR%, CAGR%)
Table 40 Europe EV On-Board Battery Charger Market, By Vehicle Type, 2022 - 2032 (US$ billion, AGR%, CAGR%)
Table 41 Europe EV On-Board Battery Charger Market, By Propulsion Type, 2022 - 2032 (US$ billion, AGR%, CAGR%)
Table 42 Europe EV On-Board Battery Charger Market, By Power Output, 2022 - 2032 (US$ billion, AGR%, CAGR%)
Table 43 U.K. EV On-Board Battery Charger Market, By Vehicle Type, 2022 - 2032 (US$ billion, AGR%, CAGR%)
Table 44 U.K. EV On-Board Battery Charger Market, By Propulsion Type, 2022 - 2032 (US$ billion, AGR%, CAGR%)
Table 45 U.K. EV On-Board Battery Charger Market, By Power Output, 2022 - 2032 (US$ billion, AGR%, CAGR%)
Table 46 Germany EV On-Board Battery Charger Market, By Vehicle Type, 2022 - 2032 (US$ billion, AGR%, CAGR%)
Table 47 Germany EV On-Board Battery Charger Market, By Propulsion Type, 2022 - 2032 (US$ billion, AGR%, CAGR%)
Table 48 Germany EV On-Board Battery Charger Market, By Power Output, 2022 - 2032 (US$ billion, AGR%, CAGR%)
Table 49 France EV On-Board Battery Charger Market, By Vehicle Type, 2022 - 2032 (US$ billion, AGR%, CAGR%)
Table 50 France EV On-Board Battery Charger Market, By Propulsion Type, 2022 - 2032 (US$ billion, AGR%, CAGR%)
Table 51 France EV On-Board Battery Charger Market, By Power Output, 2022 - 2032 (US$ billion, AGR%, CAGR%)
Table 52 Italy EV On-Board Battery Charger Market, By Vehicle Type, 2022 - 2032 (US$ billion, AGR%, CAGR%)
Table 53 Italy EV On-Board Battery Charger Market, By Propulsion Type, 2022 - 2032 (US$ billion, AGR%, CAGR%)
Table 54 Italy EV On-Board Battery Charger Market, By Power Output, 2022 - 2032 (US$ billion, AGR%, CAGR%)
Table 55 Nordic EV On-Board Battery Charger Market, By Vehicle Type, 2022 - 2032 (US$ billion, AGR%, CAGR%)
Table 56 Nordic EV On-Board Battery Charger Market, By Propulsion Type, 2022 - 2032 (US$ billion, AGR%, CAGR%)
Table 57 Nordic EV On-Board Battery Charger Market, By Power Output, 2022 - 2032 (US$ billion, AGR%, CAGR%)
Table 58 Rest of Europe EV On-Board Battery Charger Market, By Vehicle Type, 2022 - 2032 (US$ billion, AGR%, CAGR%)
Table 59 Rest of Europe EV On-Board Battery Charger Market, By Propulsion Type, 2022 - 2032 (US$ billion, AGR%, CAGR%)
Table 60 Rest of Europe EV On-Board Battery Charger Market, By Power Output, 2022 - 2032 (US$ billion, AGR%, CAGR%)
Table 61 Asia Pacific EV On-Board Battery Charger Market, By Country, 2022 - 2032 (US$ billion, AGR%, CAGR%)
Table 62 Asia Pacific EV On-Board Battery Charger Market, By Vehicle Type, 2022 - 2032 (US$ billion, AGR%, CAGR%)
Table 63 Asia Pacific EV On-Board Battery Charger Market, By Propulsion Type, 2022 - 2032 (US$ billion, AGR%, CAGR%)
Table 64 Asia Pacific EV On-Board Battery Charger Market, By Power Output, 2022 - 2032 (US$ billion, AGR%, CAGR%)
Table 65 China EV On-Board Battery Charger Market, By Vehicle Type, 2022 - 2032 (US$ billion, AGR%, CAGR%)
Table 66 China EV On-Board Battery Charger Market, By Propulsion Type, 2022 - 2032 (US$ billion, AGR%, CAGR%)
Table 67 China EV On-Board Battery Charger Market, By Power Output, 2022 - 2032 (US$ billion, AGR%, CAGR%)
Table 68 Australia EV On-Board Battery Charger Market, By Vehicle Type, 2022 - 2032 (US$ billion, AGR%, CAGR%)
Table 69 Australia EV On-Board Battery Charger Market, By Propulsion Type, 2022 - 2032 (US$ billion, AGR%, CAGR%)
Table 70 Australia EV On-Board Battery Charger Market, By Power Output, 2022 - 2032 (US$ billion, AGR%, CAGR%)
Table 71 India EV On-Board Battery Charger Market, By Vehicle Type, 2022 - 2032 (US$ billion, AGR%, CAGR%)
Table 72 India EV On-Board Battery Charger Market, By Propulsion Type, 2022 - 2032 (US$ billion, AGR%, CAGR%)
Table 73 India EV On-Board Battery Charger Market, By Power Output, 2022 - 2032 (US$ billion, AGR%, CAGR%)
Table 74 India EV On-Board Battery Charger Market, By Vehicle Type, 2022 - 2032 (US$ billion, AGR%, CAGR%)
Table 75 India EV On-Board Battery Charger Market, By Propulsion Type, 2022 - 2032 (US$ billion, AGR%, CAGR%)
Table 76 India EV On-Board Battery Charger Market, By Power Output, 2022 - 2032 (US$ billion, AGR%, CAGR%)
Table 77 South Korea EV On-Board Battery Charger Market, By Vehicle Type, 2022 - 2032 (US$ billion, AGR%, CAGR%)
Table 78 South Korea EV On-Board Battery Charger Market, By Propulsion Type, 2022 - 2032 (US$ billion, AGR%, CAGR%)
Table 79 South Korea EV On-Board Battery Charger Market, By Power Output, 2022 - 2032 (US$ billion, AGR%, CAGR%)
Table 80 Rest of Asia Pacific EV On-Board Battery Charger Market, By Vehicle Type, 2022 - 2032 (US$ billion, AGR%, CAGR%)
Table 81 Rest of Asia Pacific EV On-Board Battery Charger Market, By Propulsion Type, 2022 - 2032 (US$ billion, AGR%, CAGR%)
Table 82 Rest of Asia Pacific EV On-Board Battery Charger Market, By Power Output, 2022 - 2032 (US$ billion, AGR%, CAGR%)
Table 83 LAMEA EV On-Board Battery Charger Market, By Country, 2022 - 2032 (US$ billion, AGR%, CAGR%)
Table 84 LAMEA EV On-Board Battery Charger Market, By Vehicle Type, 2022 - 2032 (US$ billion, AGR%, CAGR%)
Table 85 LAMEA EV On-Board Battery Charger Market, By Propulsion Type, 2022 - 2032 (US$ billion, AGR%, CAGR%)
Table 86 LAMEA EV On-Board Battery Charger Market, By Power Output, 2022 - 2032 (US$ billion, AGR%, CAGR%)
Table 87 Latin America EV On-Board Battery Charger Market, By Vehicle Type, 2022 - 2032 (US$ billion, AGR%, CAGR%)
Table 88 Latin America EV On-Board Battery Charger Market, By Propulsion Type, 2022 - 2032 (US$ billion, AGR%, CAGR%)
Table 89 Latin America EV On-Board Battery Charger Market, By Power Output, 2022 - 2032 (US$ billion, AGR%, CAGR%)
Table 90 Middle East & Africa EV On-Board Battery Charger Market, By Vehicle Type, 2022 - 2032 (US$ billion, AGR%, CAGR%)
Table 91 Middle East & Africa EV On-Board Battery Charger Market, By Propulsion Type, 2022 - 2032 (US$ billion, AGR%, CAGR%)
Table 92 Middle East & Africa EV On-Board Battery Charger Market, By Power Output, 2022 - 2032 (US$ billion, AGR%, CAGR%)
Table 93 EV-onboard battery charger Market Key Player Ranking, 2021
Table 94 Key Business Strategies Adopted by Key Players in Global EV-onboard battery charger Market
Table 95 Innoelectric: Key Details, (CEO, HQ, Revenue, Founded, No. of Employees, Company Type, Website, Business Segment)
Table 96 Innoelectric: Product Benchmarking
Table 97 Innoelectric: Strategic Outlook
Table 98 Ficosa: Key Details, (CEO, HQ, Revenue, Founded, No. of Employees, Company Type, Website, Business Segment)
Table 99 Ficosa: Product Benchmarking
Table 100 Ficosa: Strategic Outlook
Table 101 AVID Propulsion type Limited: Key Details, (CEO, HQ, Revenue, Founded, No. of Employees, Company Type, Website, Business Segment)
Table 102 AVID Propulsion type Limited: Product Benchmarking
Table 103 BRUSA Elektronik: Key Details, (CEO, HQ, Revenue, Founded, No. of Employees, Company Type, Website, Business Segment)
Table 104 BRUSA Elektronik: Product Benchmarking
Table 105 Abbott: Strategic Outlook
Table 106 Toyota Industries Corporation: Key Details, (CEO, HQ, Revenue, Founded, No. of Employees, Company Type, Website, Business Segment)
Table 107 Toyota Industries Corporation: Product Benchmarking
Table 108 Toyota Industries Corporation: Strategic Outlook
Table 109 Stercom Power Solutions: Key Details, (CEO, HQ, Revenue, Founded, No. of Employees, Company Type, Website, Business Segment)
Table 110 Stercom Power Solutions: Product Benchmarking
Table 111 Abbott: Strategic Outlook
Table 112 Eaton: Key Details, (CEO, HQ, Revenue, Founded, No. of Employees, Company Type, Website, Business Segment)
Table 113 Eaton: Product Benchmarking
Table 114 Eaton: Strategic Outlook
Table 115 Delphi Technologies: Key Details, (CEO, HQ, Revenue, Founded, No. of Employees, Company Type, Website, Business Segment)
Table 116 Delphi Technologies: Product Benchmarking
Table 117 Delphi Technologies: Strategic Outlook
Table 118 Infineon Technologies: Key Details, (CEO, HQ, Revenue, Founded, No. of Employees, Company Type, Website, Business Segment)
Table 119 Infineon Technologies: Product Benchmarking
Table 120 Infineon Technologies: Strategic Outlook
Table 121 STMICROELECTRONICS: Key Details, (CEO, HQ, Revenue, Founded, No. of Employees, Company Type, Website, Business Segment)
Table 122 STMICROELECTRONICS: Product Benchmarking
Table 123 STMICROELECTRONICS: Strategic Outlook
List of Figures
Figure 1 Global EV-onboard battery charger Market Segmentation
Figure 2 Breakdown of Primary Interviews: By Company Type, Designation, & Region
Figure 3 Global EV-onboard battery charger Market Forecast by Region: Market Attractiveness Index
Figure 4 Global EV-onboard battery charger Market by Vehicle type: Market Attractiveness Index
Figure 5 Global EV-onboard battery charger Market by Propulsion type: Market Attractiveness Index
Figure 6 Global EV-onboard battery charger Market by Power output: Market Attractiveness Index
Figure 7 Global EV-onboard battery charger Market: Market Dynamics
Figure 8 Global BEV and PHEV Sales (in '000 Units), Market Share (%)
Figure 9 Global COVID Impact Analysis: EV-onboard battery charger Market Recovery Scenarios
Figure 10 Global EV-onboard battery charger Market by Region, 2022-2032 (USD Mn, AGR (%), CAGR (%)): “V” Shaped Recovery
Figure 11 Global EV-onboard battery charger Market by Region, 2022-2032 (USD Mn, AGR (%), CAGR (%)): “U” Shaped Recovery
Figure 12 Global EV-onboard battery charger Market by Region, 2022-2032 (USD Mn, AGR (%), CAGR (%)): “W” Shaped Recovery
Figure 13 Global EV-onboard battery charger Market by Region, 2022-2032 (USD Mn, AGR (%), CAGR (%)): “L” Shaped Recovery
Figure 14 Global EV-onboard battery charger Market: Porter’s Five Forces Analysis
Figure 15 Global EV-onboard battery charger Market: PESTLE Analysis
Figure 16 Global EV-onboard battery charger Market Forecast by Vehicle type, 2022-2032 (US$ billion, AGR %)
Figure 17 Global EV-onboard battery charger Market attractiveness index (Revenue, CAGR%)
Figure 18 Global EV-onboard battery charger Market Share Forecast by Vehicle type, 2022, 2027, 2032 (%)
Figure 19 Global EV On-Board Battery Charger Market for Passenger Car, By Region, 2022 - 2032
Figure 20 Global EV On-Board Battery Charger Market Share for Passenger Car by Region, 2022-2032 (%)
Figure 21 Global EV On-Board Battery Charger Market for Buses, By Region, 2022 - 2032
Figure 22 Global EV On-Board Battery Charger Market Share for Buses by Region, 2022-2032 (%)
Figure 23 Global EV On-Board Battery Charger Market for Vans, By Region, 2022 - 2032
Figure 24 Global EV On-Board Battery Charger Market Share for Vans by Region, 2022-2032 (%)
Figure 25 Global EV On-Board Battery Charger Market for Medium Duty Vehicles, By Region, 2022 - 2032
Figure 26 Global EV On-Board Battery Charger Market Share for Medium Duty Vehicles by Region, 2022-2032 (%)
Figure 27 Global EV On-Board Battery Charger Market for Heavy Duty Vehicles, By Region, 2022 - 2032
Figure 28 Global EV On-Board Battery Charger Market Share for Heavy Duty Vehicles by Region, 2022-2032 (%)
Figure 29 Global EV On-Board Battery Charger Market for Agriculture Tractors, By Region, 2022 - 2032
Figure 30 Global EV On-Board Battery Charger Market Share for Agriculture Tractors by Region, 2022-2032 (%)
Figure 31 Global EV On-Board Battery Charger Market for Construction Equipment, By Region, 2022 - 2032
Figure 32 Global EV On-Board Battery Charger Market Share for Construction Equipment by Region, 2022-2032 (%)
Figure 33 Global EV On-Board Battery Charger Market for Mining Vehicles, By Region, 2022 - 2032
Figure 34 Global EV On-Board Battery Charger Market Share for Mining Vehicles by Region, 2022-2032 (%)
Figure 35 Global EV On-Board Battery Charger Market for Electric And Hybrid Boat Ships, By Region, 2022 - 2032
Figure 36 Global EV On-Board Battery Charger Market Share for Electric And Hybrid Boat Ships by Region, 2022-2032 (%)
Figure 37 Global EV-onboard battery charger Market Forecast by Propulsion type, 2022-2032 (US$ billion, AGR %)
Figure 38 Global EV-onboard battery charger market by Propulsion type attractiveness index (Revenue, CAGR%)
Figure 39 Global EV-onboard battery charger Market Share Forecast by Propulsion type, 2022, 2027, 2032 (%)
Figure 40 Global EV On-Board Battery Charger Market for BEV, By Region, 2022 - 2032
Figure 41 Global EV On-Board Battery Charger Market Share for BEV by Region, 2022-2032 (%)
Figure 42 Global EV On-Board Battery Charger Market for HEV, By Region, 2022 - 2032
Figure 43 Global EV On-Board Battery Charger Market Share for HEV by Region, 2022-2032 (%)
Figure 44 Global EV On-Board Battery Charger Market for PHEV, By Region, 2022 - 2032
Figure 45 Global EV On-Board Battery Charger Market Share for PHEV by Region, 2022-2032 (%)
Figure 46 Global EV-onboard battery charger Market Forecast by Power Output, 2022-2032 (US$ billion, AGR %)
Figure 47 Global EV-onboard battery charger market by propultion type attractiveness index (Revenue, CAGR%)
Figure 48 Global EV-onboard battery charger Market Share Forecast by Vehicle type, 2022, 2027, 2032 (%)
Figure 49 Global Less than 10kW EV On-Board Battery Charger Market, By Region, 2022 - 2032
Figure 50 Global Less than 10kW EV On-Board Battery Charger Market Share by Region, 2022-2032 (%)
Figure 51 Global 10kW to 20kW EV On-Board Battery Charger Market, By Region, 2022 - 2032
Figure 52 Global 10kW to 20kW EV On-Board Battery Charger Market Share by Region, 2022-2032 (%)
Figure 53 Global More than 20kW EV On-Board Battery Charger Market, By Region, 2022 - 2032
Figure 54 Global More than 20kW EV On-Board Battery Charger Market Share by Region, 2022-2032 (%)
Figure 55 Global EV-onboard battery charger Market Forecast by Region 2022, 2027, 2032 (Revenue, CAGR%)
Figure 56 Global EV-onboard battery charger Market Share Forecast by Region 2022, 2027, 2032(%)
Figure 57 Global EV-onboard battery charger Market by Region, 2022-2032 (USD Mn, AGR (%), CAGR (%))
Figure 58 Global EV-onboard battery charger Market by Region, 2022-2032 (USD Mn, AGR (%), CAGR (%)): “V” Shaped Recovery
Figure 59 Global EV-onboard battery charger Market by Region, 2022-2032 (USD Mn, AGR (%), CAGR (%)): “U” Shaped Recovery
Figure 60 Global EV-onboard battery charger Market by Region, 2022-2032 (USD Mn, AGR (%), CAGR (%)): “W” Shaped Recovery
Figure 61 Global EV-onboard battery charger Market by Region, 2022-2032 (USD Mn, AGR (%), CAGR (%)): “L” Shaped Recovery
Figure 62 North America EV-onboard battery charger Market Attractiveness Index
Figure 63 North America EV-onboard battery charger Market by Region, 2022, 2027 & 2032 (US$ billion)
Figure 64 North America EV-onboard battery charger Market Forecast by Country, 2022-2032 (US$ billion, AGR %)
Figure 65 North America EV-onboard battery charger Market Share Forecast by Country, 2022 & 2032 (%)
Figure 66 North America EV-onboard battery charger Market Forecast by Vehicle type, 2022-2032 (US$ billion, AGR %)
Figure 67 North America EV-onboard battery charger Market Share Forecast by Vehicle type, 2022 & 2032 (%)
Figure 68 North America EV-onboard battery charger Market Forecast by Propulsion type, 2022-2032 (US$ billion, AGR %)
Figure 69 North America EV-onboard battery charger Market Share Forecast by Propulsion type, 2022 & 2032 (%)
Figure 70 North America EV-onboard battery charger Market Forecast by Power output, 2022-2032 (US$ billion, AGR %)
Figure 71 North America EV-onboard battery charger Market Share Forecast by Power output, 2022 & 2032 (%)
Figure 72 U.S. EV-onboard battery charger Market Forecast, 2022-2032 (US$ billion, AGR %)
Figure 73 U.S. EV-onboard battery charger Market Forecast by Vehicle type, 2022-2032 (US$ billion, AGR %)
Figure 74 U.S. EV-onboard battery charger Market Share Forecast by Vehicle type, 2022 & 2032 (%)
Figure 75 U.S. EV-onboard battery charger Market Forecast by Propulsion type, 2022-2032 (US$ billion, AGR %)
Figure 76 U.S. EV-onboard battery charger Market Share Forecast by Propulsion type, 2022 & 2032 (%)
Figure 77 U.S. EV-onboard battery charger Market Forecast by Power output, 2022-2032 (US$ billion, AGR %)
Figure 78 U.S. EV-onboard battery charger Market Share Forecast by Power output, 2022 & 2032 (%)
Figure 79 Canada EV-onboard battery charger Market Forecast, 2022-2032 (US$ billion, AGR %)
Figure 80 Canada EV-onboard battery charger Market Forecast by Vehicle type, 2022-2032 (US$ billion, AGR %)
Figure 81 Canada EV-onboard battery charger Market Share Forecast by Vehicle type, 2022 & 2032 (%)
Figure 82 Canada EV-onboard battery charger Market Forecast by Propulsion type, 2022-2032 (US$ billion, AGR %)
Figure 83 Canada EV-onboard battery charger Market Share Forecast by Propulsion type, 2022 & 2032 (%)
Figure 84 Canada EV-onboard battery charger Market Forecast by Power output, 2022-2032 (US$ billion, AGR %)
Figure 85 Canada EV-onboard battery charger Market Share Forecast by Power output, 2022 & 2032 (%)
Figure 86 Europe EV-onboard battery charger Market Attractiveness Index
Figure 87 Europe EV-onboard battery charger Market by Region, 2022, 2027 & 2032 (US$ billion)
Figure 88 Europe EV-onboard battery charger Market Forecast by Country, 2022-2032 (US$ billion, AGR %)
Figure 89 Europe EV-onboard battery charger Market Share Forecast by Country, 2022 & 2032 (%)
Figure 90 Europe EV-onboard battery charger Market Forecast by Vehicle type, 2022-2032 (US$ billion, AGR %)
Figure 91 Europe EV-onboard battery charger Market Share Forecast by Vehicle type, 2022 & 2032 (%)
Figure 92 Euorpe EV-onboard battery charger Market Forecast by Propulsion type, 2022-2032 (US$ billion, AGR %)
Figure 93 Europe EV-onboard battery charger Market Share Forecast by Propulsion type, 2022 & 2032 (%)
Figure 94 Europe EV-onboard battery charger Market Forecast by Power output, 2022-2032 (US$ billion, AGR %)
Figure 95 Europe EV-onboard battery charger Market Share Forecast by Power output, 2022 & 2032 (%)
Figure 96 U.K EV-onboard battery charger Market Forecast, 2022-2032 (US$ billion, AGR %)
Figure 97 U.K. EV-onboard battery charger Market Forecast by Vehicle type, 2022-2032 (US$ billion, AGR %)
Figure 98 U.K. EV-onboard battery charger Market Share Forecast by Vehicle type, 2022 & 2032 (%)
Figure 99 U.K. EV-onboard battery charger Market Forecast by Propulsion type, 2022-2032 (US$ billion, AGR %)
Figure 100 U.K. EV-onboard battery charger Market Share Forecast by Propulsion type, 2022 & 2032 (%)
Figure 101 U.K. EV-onboard battery charger Market Forecast by Power output, 2022-2032 (US$ billion, AGR %)
Figure 102 U.K. EV-onboard battery charger Market Share Forecast by Power output, 2022 & 2032 (%)
Figure 103 Germany EV-onboard battery charger Market Forecast, 2022-2032 (US$ billion, AGR %)
Figure 104 Germany EV-onboard battery charger Market Forecast by Vehicle type, 2022-2032 (US$ billion, AGR %)
Figure 105 Germany EV-onboard battery charger Market Share Forecast by Vehicle type, 2022 & 2032 (%)
Figure 106 Germany EV-onboard battery charger Market Forecast by Propulsion type, 2022-2032 (US$ billion, AGR %)
Figure 107 Germany EV-onboard battery charger Market Share Forecast by Propulsion type, 2022 & 2032 (%)
Figure 108 Germany EV-onboard battery charger Market Forecast by Power output, 2022-2032 (US$ billion, AGR %)
Figure 109 Germany EV-onboard battery charger Market Share Forecast by Power output, 2022 & 2032 (%)
Figure 110 France EV-onboard battery charger Market Forecast, 2022-2032 (US$ billion, AGR %)
Figure 111 France EV-onboard battery charger Market Forecast by Vehicle type, 2022-2032 (US$ billion, AGR %)
Figure 112 France EV-onboard battery charger Market Share Forecast by Vehicle type, 2022 & 2032 (%)
Figure 113 France EV-onboard battery charger Market Forecast by Propulsion type, 2022-2032 (US$ billion, AGR %)
Figure 114 France EV-onboard battery charger Market Share Forecast by Propulsion type, 2022 & 2032 (%)
Figure 115 France EV-onboard battery charger Market Forecast by Power output, 2022-2032 (US$ billion, AGR %)
Figure 116 France EV-onboard battery charger Market Share Forecast by Power output, 2022 & 2032 (%)
Figure 117 Italy EV-onboard battery charger Market Forecast, 2022-2032 (US$ billion, AGR %)
Figure 118 Italy EV-onboard battery charger Market Forecast by Vehicle type, 2022-2032 (US$ billion, AGR %)
Figure 119 Italy EV-onboard battery charger Market Share Forecast by Vehicle type, 2022 & 2032 (%)
Figure 120 Italy EV-onboard battery charger Market Forecast by Propulsion type, 2022-2032 (US$ billion, AGR %)
Figure 121 Italy EV-onboard battery charger Market Share Forecast by Propulsion type, 2022 & 2032 (%)
Figure 122 Italy EV-onboard battery charger Market Forecast by Power output, 2022-2032 (US$ billion, AGR %)
Figure 123 Italy EV-onboard battery charger Market Share Forecast by power output, 2022 & 2032 (%)
Figure 124 Nordic EV-onboard battery charger Market Forecast, 2022-2032 (US$ billion, AGR %)
Figure 125 Nordic EV-onboard battery charger Market Forecast by Vehicle type, 2022-2032 (US$ billion, AGR %)
Figure 126 Nordic EV-onboard battery charger Market Share Forecast by Vehicle type, 2022 & 2032 (%)
Figure 127 Nordic EV-onboard battery charger Market Forecast by Propulsion type, 2022-2032 (US$ billion, AGR %)
Figure 128 Nordic EV-onboard battery charger Market Share Forecast by Propulsion type, 2022 & 2032 (%)
Figure 129 Nordic EV-onboard battery charger Market Forecast by Power output, 2022-2032 (US$ billion, AGR %)
Figure 130 Nordic EV-onboard battery charger Market Share Forecast by power output, 2022 & 2032 (%)
Figure 131 Rest of Europe EV-onboard battery charger Market Forecast, 2022-2032 (US$ billion, AGR %)
Figure 132 Rest of Europe EV-onboard battery charger Market Forecast by Vehicle type, 2022-2032 (US$ billion, AGR %)
Figure 133 Rest of Europe EV-onboard battery charger Market Share Forecast by Vehicle type, 2022 & 2032 (%)
Figure 134 Rest of Europe EV-onboard battery charger Market Forecast by Propulsion type, 2022-2032 (US$ billion, AGR %)
Figure 135 Rest of Europe EV-onboard battery charger Market Share Forecast by Propulsion type, 2022 & 2032 (%)
Figure 136 Rest of Europe EV-onboard battery charger Market Forecast by Power output, 2022-2032 (US$ billion, AGR %)
Figure 137 Rest of Europe EV-onboard battery charger Market Share Forecast by power output, 2022 & 2032 (%)
Figure 138 Asia Pacific EV-onboard battery charger Market Attractiveness Index
Figure 139 Asia Pacific EV-onboard battery charger Market by Region, 2022, 2027 & 2032 (US$ billion)
Figure 140 Asia Pacific EV-onboard battery charger Market Forecast by Country, 2022-2032 (US$ billion, AGR %)
Figure 141 Asia Pacific EV-onboard battery charger Market Share Forecast by Country, 2022 & 2032 (%)
Figure 142 Asia Pacific EV-onboard battery charger Market Forecast by Vehicle type, 2022-2032 (US$ billion, AGR %)
Figure 143 Asia Pacific EV-onboard battery charger Market Share Forecast by Vehicle type, 2022 & 2032 (%)
Figure 144 Asia Pacific EV-onboard battery charger Market Forecast by Propulsion type, 2022-2032 (US$ billion, AGR %)
Figure 145 Asia Pacific EV-onboard battery charger Market Share Forecast by Propulsion type, 2022 & 2032 (%)
Figure 146 Asia Pacific EV-onboard battery charger Market Forecast by Power output, 2022-2032 (US$ billion, AGR %)
Figure 147 Asia Pacific EV-onboard battery charger Market Share Forecast by Power output, 2022 & 2032 (%)
Figure 148 China EV-onboard battery charger Market Forecast, 2022-2032 (US$ billion, AGR %)
Figure 149 CHINA EV-onboard battery charger Market Forecast by Vehicle type, 2022-2032 (US$ billion, AGR %)
Figure 150 CHINA EV-onboard battery charger Market Share Forecast by Vehicle type, 2022 & 2032 (%)
Figure 151 China EV-onboard battery charger Market Forecast by Propulsion type, 2022-2032 (US$ billion, AGR %)
Figure 152 China EV-onboard battery charger Market Share Forecast by Propulsion type, 2022 & 2032 (%)
Figure 153 China EV-onboard battery charger Market Forecast by Power output, 2022-2032 (US$ billion, AGR %)
Figure 154 China EV-onboard battery charger Market Share Forecast by Power output, 2022 & 2032 (%)
Figure 155 Australia EV-onboard battery charger Market Forecast, 2022-2032 (US$ billion, AGR %)
Figure 156 Australia EV-onboard battery charger Market Forecast by Vehicle type, 2022-2032 (US$ billion, AGR %)
Figure 157 Australia EV-onboard battery charger Market Share Forecast by Vehicle type, 2022 & 2032 (%)
Figure 158 Australia EV-onboard battery charger Market Forecast by Propulsion type, 2022-2032 (US$ billion, AGR %)
Figure 159 Australia EV-onboard battery charger Market Share Forecast by Propulsion type, 2022 & 2032 (%)
Figure 160 Australia EV-onboard battery charger Market Forecast by Power output, 2022-2032 (US$ billion, AGR %)
Figure 161 Australia EV-onboard battery charger Market Share Forecast by Power output, 2022 & 2032 (%)
Figure 162 India EV-onboard battery charger Market Forecast, 2022-2032 (US$ billion, AGR %)
Figure 163 India EV-onboard battery charger Market Forecast by Vehicle type, 2022-2032 (US$ billion, AGR %)
Figure 164 India EV-onboard battery charger Market Share Forecast by Vehicle type, 2022 & 2032 (%)
Figure 165 India EV-onboard battery charger Market Forecast by Propulsion type, 2022-2032 (US$ billion, AGR %)
Figure 166 India EV-onboard battery charger Market Share Forecast by Propulsion type, 2022 & 2032 (%)
Figure 167 India EV-onboard battery charger Market Forecast by Power output, 2022-2032 (US$ billion, AGR %)
Figure 168 India EV-onboard battery charger Market Share Forecast by Power output, 2022 & 2032 (%)
Figure 169 Japan EV-onboard battery charger Market Forecast, 2022-2032 (US$ billion, AGR %)
Figure 170 Japan EV-onboard battery charger Market Forecast by Vehicle type, 2022-2032 (US$ billion, AGR %)
Figure 171 Japan EV-onboard battery charger Market Share Forecast by Vehicle type, 2022 & 2032 (%)
Figure 172 Japan EV-onboard battery charger Market Forecast by Propulsion type, 2022-2032 (US$ billion, AGR %)
Figure 173 Japan EV-onboard battery charger Market Share Forecast by Propulsion type, 2022 & 2032 (%)
Figure 174 Japan EV-onboard battery charger Market Forecast by Power output, 2022-2032 (US$ billion, AGR %)
Figure 175 Japan EV-onboard battery charger Market Share Forecast by power output, 2022 & 2032 (%)
Figure 176 South Korea EV-onboard battery charger Market Forecast, 2022-2032 (US$ billion, AGR %)
Figure 177 South Korea EV-onboard battery charger Market Forecast by Vehicle type, 2022-2032 (US$ billion, AGR %)
Figure 178 South Korea EV-onboard battery charger Market Share Forecast by Vehicle type, 2022 & 2032 (%)
Figure 179 South Korea EV-onboard battery charger Market Forecast by Propulsion type, 2022-2032 (US$ billion, AGR %)
Figure 180 South Korea EV-onboard battery charger Market Share Forecast by Propulsion type, 2022 & 2032 (%)
Figure 181 South Korea EV-onboard battery charger Market Forecast by Power output, 2022-2032 (US$ billion, AGR %)
Figure 182 South Korea EV-onboard battery charger Market Share Forecast by power output, 2022 & 2032 (%)
Figure 183 Rest of Asia Pacific EV-onboard battery charger Market Forecast, 2022-2032 (US$ billion, AGR %)
Figure 184 Rest of Asia Pacific EV-onboard battery charger Market Forecast by Vehicle type, 2022-2032 (US$ billion, AGR %)
Figure 185 Rest of Asia Pacific EV-onboard battery charger Market Share Forecast by Vehicle type, 2022 & 2032 (%)
Figure 186 Rest of Asia Pacific EV-onboard battery charger Market Forecast by Propulsion type, 2022-2032 (US$ billion, AGR %)
Figure 187 Rest of Asia Pacific EV-onboard battery charger Market Share Forecast by Propulsion type, 2022 & 2032 (%)
Figure 188 Rest of Asia Pacific EV-onboard battery charger Market Forecast by Power output, 2022-2032 (US$ billion, AGR %)
Figure 189 Rest of Asia Pacific EV-onboard battery charger Market Share Forecast by power output, 2022 & 2032 (%)
Figure 190 LAMEA EV-onboard battery charger Market Attractiveness Index
Figure 191 LAMEA EV-onboard battery charger Market by Region, 2022, 2027 & 2032 (US$ billion)
Figure 192 LAMEA EV-onboard battery charger Market Forecast by Country, 2022-2032 (US$ billion, AGR %)
Figure 193 LAMEA EV-onboard battery charger Market Share Forecast by Country, 2022 & 2032 (%)
Figure 194 LAMEA EV-onboard battery charger Market Forecast by Vehicle type, 2022-2032 (US$ billion, AGR %)
Figure 195 LAMEA EV-onboard battery charger Market Share Forecast by Vehicle type, 2022 & 2032 (%)
Figure 196 Euorpe EV-onboard battery charger Market Forecast by Propulsion type, 2022-2032 (US$ billion, AGR %)
Figure 197 LAMEA EV-onboard battery charger Market Share Forecast by Propulsion type, 2022 & 2032 (%)
Figure 198 LAMEA EV-onboard battery charger Market Forecast by Power output, 2022-2032 (US$ billion, AGR %)
Figure 199 LAMEA EV-onboard battery charger Market Share Forecast by Power output, 2022 & 2032 (%)
Figure 200 Latin America EV-onboard battery charger Market Forecast, 2022-2032 (US$ billion, AGR %)
Figure 201 LATIN AMERICA EV-onboard battery charger Market Forecast by Vehicle type, 2022-2032 (US$ billion, AGR %)
Figure 202 LATIN AMERICA EV-onboard battery charger Market Share Forecast by Vehicle type, 2022 & 2032 (%)
Figure 203 Latin America EV-onboard battery charger Market Forecast by Propulsion type, 2022-2032 (US$ billion, AGR %)
Figure 204 Latin America EV-onboard battery charger Market Share Forecast by Propulsion type, 2022 & 2032 (%)
Figure 205 Latin America EV-onboard battery charger Market Forecast by Power output, 2022-2032 (US$ billion, AGR %)
Figure 206 Latin America EV-onboard battery charger Market Share Forecast by Power output, 2022 & 2032 (%)
Figure 207 Middle East & Africa EV-onboard battery charger Market Forecast, 2022-2032 (US$ billion, AGR %)
Figure 208 Middle East & Africa EV-onboard battery charger Market Forecast by Vehicle type, 2022-2032 (US$ billion, AGR %)
Figure 209 Middle East & Africa EV-onboard battery charger Market Share Forecast by Vehicle type, 2022 & 2032 (%)
Figure 210 Middle East & Africa EV-onboard battery charger Market Forecast by Propulsion type, 2022-2032 (US$ billion, AGR %)
Figure 211 Middle East & Africa EV-onboard battery charger Market Share Forecast by Propulsion type, 2022 & 2032 (%)
Figure 212 Middle East & Africa EV-onboard battery charger Market Forecast by Power output, 2022-2032 (US$ billion, AGR %)
Figure 213 Middle East & Africa EV-onboard battery charger Market Share Forecast by Power output, 2022 & 2032 (%)
Figure 214 Toyota Industries Corporation: Net Revenue, 2017-2021 (US$ Million, AGR%)
Figure 215 Toyota Industries Corporation: Regional Market Shares, 2020
Figure 216 Toyota Industries Corporation: Gross Profit, 2017-2021 (US$ Million, AGR%)
Figure 217 Toyota Industries Corporation: R&D, 2017-2021 (US$ Million, AGR%)
Figure 218 Eaton: Net Revenue, 2017-2021 (US$ Million, AGR%)
Figure 219 Eaton: Regional Market Shares, 2021
Figure 220 Eaton: Gross Profit, 2017-2021 (US$ Million, AGR%)
Figure 221 Eaton: R&D, 2017-2021 (US$ Million, AGR%)
Figure 222 Borgwarner Inc: Net Revenue, 2017-2021 (US$ Million, AGR%)
Figure 223 Borgwarner Inc: Regional Market Shares, 2021
Figure 224 Borgwarner Inc: Gross Profit, 2017-2021 (US$ Million, AGR%)
Figure 225 Borgwarner Inc: R&D, 2017-2021 (US$ Million, AGR%)
Figure 226 Infineon Technologies: Net Revenue, 2017-2021 (US$ Million, AGR%)
Figure 227 Infineon Technologies: Regional Market Shares, 2021
Figure 228 Infineon Technologies: Gross Profit, 2017-2021 (US$ Million, AGR%)
Figure 229 Infineon Technologies: R&D, 2017-2021 (US$ Million, AGR%)
Figure 230 STMICROELECTRONICS: Net Revenue, 2017-2021 (US$ Million, AGR%)
Figure 231 STMICROELECTRONICS: Regional Market Shares, 2021
Figure 232 STMICROELECTRONICS: Gross Profit, 2017-2021 (US$ Million, AGR%)
Figure 233 STMICROELECTRONICS: R&D, 2017-2021 (US$ Million, AGR%)
ページTOPに戻る
本レポートと同じKEY WORD(ev)の最新刊レポート
よくあるご質問
Visiongain社はどのような調査会社ですか?
英国の調査会社ヴィジョンゲイン社(Visiongain)は、通信とエネルギーのほか、自動車や化学・医薬品、金属など、広範な市場を対象に調査を行っています。自動車市場については、市場全般に関する調査のほ... もっと見る
調査レポートの納品までの日数はどの程度ですか?
在庫のあるものは速納となりますが、平均的には 3-4日と見て下さい。
但し、一部の調査レポートでは、発注を受けた段階で内容更新をして納品をする場合もあります。
発注をする前のお問合せをお願いします。
注文の手続きはどのようになっていますか?
1)お客様からの御問い合わせをいただきます。
2)見積書やサンプルの提示をいたします。
3)お客様指定、もしくは弊社の発注書をメール添付にて発送してください。
4)データリソース社からレポート発行元の調査会社へ納品手配します。
5) 調査会社からお客様へ納品されます。最近は、pdfにてのメール納品が大半です。
お支払方法の方法はどのようになっていますか?
納品と同時にデータリソース社よりお客様へ請求書(必要に応じて納品書も)を発送いたします。
お客様よりデータリソース社へ(通常は円払い)の御振り込みをお願いします。
請求書は、納品日の日付で発行しますので、翌月最終営業日までの当社指定口座への振込みをお願いします。振込み手数料は御社負担にてお願いします。
お客様の御支払い条件が60日以上の場合は御相談ください。
尚、初めてのお取引先や個人の場合、前払いをお願いすることもあります。ご了承のほど、お願いします。
データリソース社はどのような会社ですか?
当社は、世界各国の主要調査会社・レポート出版社と提携し、世界各国の市場調査レポートや技術動向レポートなどを日本国内の企業・公官庁及び教育研究機関に提供しております。
世界各国の「市場・技術・法規制などの」実情を調査・収集される時には、データリソース社にご相談ください。
お客様の御要望にあったデータや情報を抽出する為のレポート紹介や調査のアドバイスも致します。
|
|


