電気モーター市場レポート:2023-2033
Electric Motors Market Report 2023-2033
レポート詳細
電気モーター市場レポート 2023-2033 :本レポートは、新たな収益の柱を目指す大手企業にとって、業界とその根底にある力学をより深く理解する上で貴重なものとなろう。異業種への進出や... もっと見る
※上記価格は部署ライセンス(Departmental licence)価格です。
その他の価格についてはデータリソースまでお問合せください。
日本語のページは自動翻訳を利用し作成しています。
実際のレポートは英文のみでご納品いたします。
サマリー
レポート詳細
電気モーター市場レポート 2023-2033:本レポートは、新たな収益の柱を目指す大手企業にとって、業界とその根底にある力学をより深く理解する上で貴重なものとなろう。異業種への進出や、新たな地域での既存事業の拡大を希望する企業にとっても有用であろう。
電動モビリティへの移行加速が市場成長を牽引
電気モーター市場は、世界中の政府、消費者、産業界がよりクリーンで持続可能な交通手段を求める中、電気自動車(EV)の需要急増によって牽引されている。温室効果ガスの排出や化石燃料への依存に対する懸念が高まる中、EVは電気モーターを動力源とする説得力のある解決策を提供している。電気モーターは、電気エネルギーを機械的動力に変換して車両を駆動する、EV推進の中核をなすものである。各国政府がより厳しい排ガス規制を実施し、消費者が環境に優しい選択をする中、電気モーター市場は大幅な成長を遂げている。この傾向は、特に乗用車、商用車、公共交通機関において顕著であり、効率的で強力な推進ソリューションに対する需要の高まりに対応するため、電気モーター技術への革新と投資が促進されている。
消費者の自動車選択における持続可能性への評価は高まっている
消費者は持続可能性をますます重視するようになっており、消費者の自動車選択は、環境フットプリントの削減へのコミットメントを反映することが多い。電気モーターを動力源とする電気自動車は、責任ある消費と環境意識の象徴とみなされている。電気自動車を所有することで、より環境に優しい未来に貢献する環境意識の高い個人というイメージが高まる。このような肯定的なイメージは、メディア報道、有名人の支持、電動モビリティを推進する政府のキャンペーンによって強化される。消費者が自分のライフスタイルと価値観を一致させようとする中、電気モーター市場は、環境に優しい交通手段を求める消費者主導の需要から利益を得ている。
市場調査レポートを購入する前にすべき質問とは?
- 電気モーター市場はどのように進化しているのか?
- 電動モーター市場を牽引し、抑制しているものは何か?
- 各電動モーターサブマーケットセグメントは予測期間中にどのように成長し、2033年にどれくらいの売上を占めるのか?
- 2023年から2033年にかけて、各電動モーターサブマーケットの市場シェアはどのように推移するのか?
- 2023年から2033年にかけて市場全体を牽引する主な要因は何か?
- 主要な電動モーター市場はマクロ経済の動きに幅広く追随するのか、それとも個々の国内市場が他を凌駕するのか?
- 2033年までに各国市場のシェアはどう変化し、2033年に市場をリードするのはどの地域か?
- 主要プレーヤーは誰で、予測期間中の見通しは?
- これらの大手企業の電動機プロジェクトとは?
- 2023年から2033年の間に、業界はどのように進化するのか?現在および今後10年間に実施される電動モータープロジェクトにはどのような意味があるのか?
- 電気モーター市場をさらに拡大するために、製品の商業化の必要性は高まっているのか?
- 電気モーター市場はどこに向かっているのか、そしてどのようにすれば市場の最前線に立てるのか?
- 新製品やサービスラインへの最適な投資方法とは?
- 企業を新たな成長軌道に乗せ、C-suiteに移行させるための重要な展望とは?
このことが、現在、そして今後10年間の電気モーター市場にどのような影響を与えるかを見極める必要がある:
- 410ページにわたる本レポートでは、127の表と196の図表を掲載しています。
- 本レポートは、業界における主要な有利分野にハイライトを当てているため、今すぐターゲットを絞ることができます。
- 世界、地域、国の売上と成長に関する詳細な分析が含まれています。
- 競合他社が成功した主なトレンド、変化、収益予測をハイライトしています。
本レポートは、電気モーター市場が今後10年間にどのように発展するか、またCOVID-19の景気後退と好転の変動に合わせてTODAYをお伝えします。この市場は、過去10年間のどの時点よりも今が重要である。
2033年までの予測やその他の分析から、商業的な展望が明らかになる
- 2033年までの収益予測に加え、直近の業績、成長率、市場シェアもご覧いただけます。
- ビジネスの展望と展開に関する独自の分析をご覧いただけます。
- 定性的分析(市場力学、促進要因、機会、阻害要因、課題を含む)、コスト構造、電気モーター価格上昇の影響、最近の動向をご覧いただけます。
本レポートには、COVID-19が業界と貴社にどのような影響を与えるかについてのデータ分析と貴重な洞察が含まれている。本レポートでは、COVID-19の4つの回収パターンとその影響、すなわち「V」、「L」、「W」、「U」について論じている。
レポート対象セグメント
タイプ別市場セグメント
- ACモーター
- DCモーター
出力別市場セグメント
- 積分HP出力
- フラクショナルHP出力
電圧別市場セグメント
- 低電圧モーター
- 中電圧モーター
- 高電圧モーター
定格出力別市場セグメント
- <1 kWモーター
- 1-2.2 kWモーター
- 2.2-375 kWモーター
- 375 - 500 kWモーター
- 500 kW以上のモーター
用途別市場セグメント
- 自動車
- 産業機械
- HVAC機器
- 航空宇宙・輸送
- 家庭用電化製品
- その他の用途
世界市場全体とセグメント別の収益予測に加え、4つの地域と20の主要国市場の収益予測も掲載しています:
北米
- アメリカ
- カナダ
欧州
- ドイツ
- イタリア
- フランス
- ハンガリー
- スイス
- その他の欧州
アジア太平洋
- 中国
- 日本
- インド
- ベトナム
- 韓国
- その他のアジア太平洋地域
ラテンアメリカ
- ブラジル
- メキシコ
- その他のラテンアメリカ
中東・アフリカ
- GCC
- 南アフリカ
- その他の中東・アフリカ
このレポートには、2023年から2033年までの電気モーター市場の主要企業のプロファイルと、これらの企業の事業のこのセグメントに焦点を当てています。
主要企業と市場成長の可能性
・ ABB Ltd
・ AMETEK, Inc.
・ ARC Systems, Inc.
・ ASMO Co. Ltd.
・ DENSO Corporation
・ Emerson Electric Co.
・ General Electric Company
・ Hitachi, Ltd
・ Johnson Electric
・ Maxon Motor AG
・ Nidec Corporation
・ Robert Bosch GmbH
・ Rockwell Automation, Inc.
・ Siemens AG
・ Toshiba Corporation
2023年から2033年までの電気モーター市場全体の世界売上高(金額ベース)は、2023年に1,328億米ドルを超えると予測。2033年まで力強い収益成長を予測。当調査では、最も大きな可能性を秘めた企業を特定しています。彼らの能力、進歩、商業的展望を発見し、一歩先を行くお手伝いをします。
電動モーター市場、2023-2033年レポートはどのように役立つのか?
要約すると、410ページに及ぶこのレポートは、以下のような知識を提供する:
- 電動モーター市場の2023年から2033年までの収益予測 世界および地域レベルでのタイプ、出力、電圧、定格電力、用途の各予測による、電動モーター市場の2033年までの収益予測 - 業界の将来性を発見し、投資と収益に最も有利な場所を見つけることができます。
- 4つの地域と20の主要国市場の2033年までの収益予測 - 北米、欧州、アジア太平洋、中南米、中東・アフリカの2023年から2033年までの電気モーター市場予測をご覧ください。また、米国、カナダ、ブラジル、ドイツ、フランス、ハンガリー、スイス、イタリア、中国、インド、日本、オーストラリアなど著名な経済圏の市場も予測しています。
- 既存企業および市場参入を目指す企業の展望 - 2023年から2033年までの電気モーター市場に関わる主要企業20社の企業プロファイルを含む。
独自の予測による定量的・定性的分析をご覧ください。私たちのレポートだけに含まれる情報を入手し、貴重なビジネスインテリジェンスで情報を得ることができます。
他にはない情報
私たちの新しいレポートがあれば、知識に遅れをとったり、チャンスを逃したりする可能性が低くなります。弊社の調査レポートが貴社の調査、分析、意思決定にどのように役立つかをご覧ください。Visiongainの調査は、電気モーター市場、2023年から2033年、市場をリードする企業の商業分析を必要とするすべての人のためのものです。データ、トレンド、予測をご覧いただけます。
ページTOPに戻る
目次
目次
1 レポート概要
1.1 研究の目的
1.2 電動モーター市場の紹介
1.3 本レポートの内容
1.4 本レポートを読むべき理由
1.5 本分析レポートが回答する主な質問
1.6 本レポートは誰のためのものか?
1.7 方法論
1.7.1 市場の定義
1.7.2 市場評価・予測手法
1.7.3 データの検証
1.7.3.1 一次調査
1.7.3.2 セカンダリーリサーチ
1.8 よくある質問(FAQ)
1.9 Visiongainの関連レポート
1.10 Visiongainについて
2 エグゼクティブ・サマリー
3 市場概要
3.1 主要な調査結果
3.2 市場ダイナミクス
3.2.1 市場促進要因
3.2.1.1 産業用途におけるエネルギー効率の高いモーターへの需要の高まり
3.2.1.2 電気自動車(EV)とハイブリッド車の採用増加
3.2.1.3 効率向上のための家電製品への電気モーターの統合
3.2.2 市場抑制要因
3.2.2.1 電気モーターの高い初期コストとメンテナンス
3.2.2.2 電気モーターはレアアースなどの重要材料に依存しており、サプライチェーンの脆弱性につながる可能性がある。
3.2.2.3 過熱と潜在的な火災の危険性が高出力電気モーターの安全上の懸念であり、高度な安全対策が必要である。
3.2.3 市場機会
3.2.3.1 設計方法の改善による炭素排出量の削減
3.2.3.2 電気モーター技術の進歩
3.2.3.3 産業界における自動化・ロボット化の進展が精密電動モーターの需要を生み出す
3.3 ポーターのファイブフォース分析
3.3.1 サプライヤーの交渉力(中程度)
3.3.2 買い手の交渉力(中~高)
3.3.3 競争力(高い)
3.3.4 代替品による脅威(中程度)
3.3.5 新規参入の脅威(低い)
3.4 COVID-19の影響分析
3.4.1 "V字型回復"
3.4.2 "U字型回復"
3.4.3 "W字型回復"
3.4.4 "L字型回復"
3.5 PEST分析
4 電動モーター市場分析:タイプ別
4.1 主要な調査結果
4.2 タイプ別セグメント 市場魅力度指数
4.3 電動モーターのタイプ別市場規模推定と予測
4.4 ACモーター
4.4.1 2023~2033年の地域別市場規模(US$ Billion)
4.4.2 地域別市場シェア、2023年・2033年(%)
4.5 DCモーター
4.5.1 2023~2033年の地域別市場規模(US$ Billion)
4.5.2 地域別市場シェア、2023年・2033年(%)
5 電動モーター市場分析:出力別
5.1 主要調査結果
5.2 出力セグメント 市場魅力度指数
5.3 出力別電動モーター市場規模の推定と予測
5.4 積分HP出力
5.4.1 2023~2033年の地域別市場規模(US$ Billion)
5.4.2 地域別市場シェア、2023年・2033年 (%)
5.5 フラクショナルHP出力
5.5.1 2023~2033年の地域別市場規模(US$ Billion)
5.5.2 地域別市場シェア、2023年・2033年(%)
6 電動モーター市場分析:電圧別
6.1 主な調査結果
6.2 電圧セグメント 市場魅力度指数
6.3 電圧別電動モーター市場規模の推定と予測
6.4 低電圧モーター
6.4.1 2023~2033年の地域別市場規模(US$ Billion)
6.4.2 地域別市場シェア、2023年・2033年(%)
6.5 中電圧モーター
6.5.1 2023~2033年の地域別市場規模(US$ Billion)
6.5.2 地域別市場シェア、2023年・2033年(%)
6.6 高電圧モーター
6.6.1 2023~2033年の地域別市場規模(US$ Billion)
6.6.2 地域別市場シェア、2023年・2033年(%)
7 電動モーター市場分析:定格電力別
7.1 主要な調査結果
7.2 定格電力セグメント 市場魅力度指数
7.3 定格電力別電動モーター市場規模の推定と予測
7.4 500kWモーター
7.8.1 2023~2033年の地域別市場規模(US$ Billion)
7.8.2 地域別市場シェア、2023年・2033年(%)
8 電動モーター市場分析:用途別
8.1 主要な調査結果
8.2 用途別セグメント 市場魅力度指数
8.3 用途別電動モーター市場規模の推定と予測
8.4 産業機械
8.4.1 2023〜2033年の地域別市場規模(US$ Billion)
8.4.2 地域別市場シェア、2023年・2033年(%)
8.5 自動車
8.5.1 2023〜2033年の地域別市場規模(US$ Billion)
8.5.2 地域別市場シェア、2023年・2033年(%)
8.6 空調機器
8.6.1 2023〜2033年の地域別市場規模(US$ Billion)
8.6.2 地域別市場シェア、2023年・2033年(%)
8.7 航空宇宙
8.7.1 2023〜2033年の地域別市場規模(US$ Billion)
8.7.2 地域別市場シェア、2023年・2033年(%)
8.8 家庭用電化製品
8.8.1 2023〜2033年の地域別市場規模(US$ Billion)
8.8.2 地域別市場シェア、2023年・2033年(%)
8.9 その他
8.9.1 2023〜2033年の地域別市場規模(US$ Billion)
8.9.2 地域別市場シェア、2023年・2033年(%)
9 電動モーター市場分析:地域別
9.1 主要な調査結果
9.2 地域別市場規模の推定と予測
10 北米の電気モーター市場分析
10.1 主要な調査結果
10.2 北米の電動モーター市場魅力度指数
10.3 北米の電動モーター国別市場:2023年、2028年、2033年(US$ Billion)
10.4 北米の電動モーター市場規模推定と予測
10.5 北米の電動モーター市場規模推定と予測:国別
10.6 北米の電動モーター市場規模推定と予測:タイプ別
10.7 北米の電動モーター市場規模推定と予測:出力別
10.8 北米の電動モーター市場規模推定と予測:電圧別
10.9 北米の電動モーター市場規模推定と予測:定格電力別
10.10 北米の電動モーター市場規模推定と予測:用途別
10.11 アメリカの電動モーター市場分析
10.12 カナダの電動モーター市場分析
11 欧州の電動モーター市場分析
11.1 主要な調査結果
11.2 欧州の電動モーター市場魅力度指数
11.3 欧州の電動モーター国別市場、2023年、2028年、2033年(US$ Billion)
11.4 欧州の電動モーター市場規模推定と予測
11.5 欧州の電動モーター市場規模推定と予測:国別
11.6 欧州の電動モーター市場規模推定と予測:タイプ別
11.7 欧州の電動モーター市場規模推定と予測:出力別
11.8 欧州の電動モーター市場規模推定と予測:電圧別
11.9 欧州の電動モーター市場規模推定と予測:定格電力別
11.10 欧州電動モーター市場規模推定と予測:用途別
11.11 ドイツの電動モーター市場分析
11.12 イタリアの電動モーター市場分析
11.13 フランスの電動モーター市場分析
11.14 ハンガリーの電動モーター市場分析
11.15 スイスの電動モーター市場分析
11.16 その他の欧州電動モーター市場分析
12 アジア太平洋地域の電動モーター市場分析
12.1 主要な調査結果
12.2 アジア太平洋地域の電動モーター市場魅力度指数
12.3 アジア太平洋地域の電動モーター国別市場、2023年、2028年、2033年(US$ Billion)
12.4 アジア太平洋地域の電動モーター市場規模推定と予測
12.5 アジア太平洋地域の電動モーター市場規模推定と予測:国別
12.6 アジア太平洋地域の電動モーター市場規模推定と予測:タイプ別
12.7 アジア太平洋地域の電動モーター市場規模推定と予測:出力別
12.8 アジア太平洋地域の電動モーター市場規模推定と予測:電圧別
12.9 アジア太平洋地域の電動モーター市場規模推定と予測:定格電力別
12.10 アジア太平洋地域の電動モーター市場規模推定と予測:用途別
12.11 中国の電動モーター市場分析
12.12 インドの電動モーター市場分析
12.13 日本の電動モーター市場分析
12.14 韓国の電動モーター市場分析
12.15 ベトナムの電動モーター市場分析
12.16 その他のアジア太平洋地域の電動モーター市場分析
13 中東・アフリカの電動モーター市場分析
13.1 主要な調査結果
13.2 中東・アフリカの電動モーター市場魅力度指数
13.3 中東・アフリカの電動モーター国別市場:2023年、2028年、2033年(US$ Billion)
13.4 中東・アフリカの電動モーター市場規模推定と予測
13.5 中東・アフリカの電動モーター市場規模推定と予測:国別
13.6 中東・アフリカの電動モーター市場規模推定と予測:タイプ別
13.7 中東・アフリカの電動モーター市場規模推定と予測:出力別
13.8 中東・アフリカの電動モーター市場規模推定と予測:電圧別
13.9 中東・アフリカの電動モーター市場規模推定と予測:定格電力別
13.10 中東・アフリカの電動モーター市場規模推定と予測:用途別
13.11 GCCの電動モーター市場分析
13.12 南アフリカの電動モーター市場分析
13.13 その他の中東・アフリカの電動モーター市場分析
14 ラテンアメリカの電気モーター市場分析
14.1 主要な調査結果
14.2 ラテンアメリカの電動モーター市場魅力度指数
14.3 ラテンアメリカの電動モーター国別市場、2023年、2028年、2033年(US$ Billion)
14.4 ラテンアメリカの電動モーター市場規模推定と予測
14.5 ラテンアメリカの電動モーター市場規模推定と予測:国別
14.6 ラテンアメリカの電動モーター市場規模推定と予測:タイプ別
14.7 ラテンアメリカの電動モーター市場規模推定と予測:出力別
14.8 ラテンアメリカの電動モーター市場規模推定と予測:電圧別
14.9 ラテンアメリカの電動モーター市場規模推定と予測:定格電力別
14.10 ラテンアメリカの電動モーター市場規模推定と予測:用途別
14.11 ブラジルの電動モーター市場分析
14.12 メキシコの電動モーター市場分析
14.13 その他のラテンアメリカの電動モーター市場分析
15 会社概要
15.1 競争環境、2022年
15.2 戦略的展望
15.3 ABB Ltd.
15.3.1 会社概要
15.3.2 会社概要
15.3.3 財務分析
15.3.3.1 純収入、2018-2022年
15.3.3.2 R&D、2018年~2022年
15.3.3.3 事業セグメント収益シェア、2022年(%)
15.3.4 製品ベンチマーク
15.3.5 戦略的展望
15.4 General Electric Company
15.4.1 会社概要
15.4.2 会社概要
15.4.3 財務分析
15.4.3.1 純収入、2018-2022年
15.4.3.2 R&D、2018-2022年
15.4.3.3 地域別収益シェア、2022年(%)
15.4.3.4 事業セグメント収益シェア、2022年(%)
15.4.4 製品ベンチマーク
15.4.5 戦略的展望
15.5 Toshiba Corporation
15.5.1 会社概要
15.5.2 会社概要
15.5.3 財務分析
15.5.3.1 純収入、2018-2022年
15.5.3.2 R&D、2018年~2022年
15.5.3.3 地域別収益シェア、2022年(%)
15.5.3.4 事業セグメント収益シェア、2022年(%)
15.5.4 製品ベンチマーク
15.5.5 戦略的展望
15.6 Hitachi, Ltd
15.6.1 会社概要
15.6.2 会社概要
15.6.3 財務分析
15.6.3.1 純収入、2018-2022年
15.6.3.2 地域別収益シェア、2022年(%)
15.6.3.3 事業セグメント別売上シェア、2022年(%)
15.6.4 製品ベンチマーク
15.6.5 戦略的展望
15.7 Robert Bosch GmbH
15.7.1 会社概要
15.7.2 会社概要
15.7.3 製品ベンチマーク
15.7.4 戦略的展望
15.8 Rockwell Automation, Inc.
15.8.1 会社概要
15.8.2 会社概要
15.8.3 財務分析
15.8.3.1 純収入、2018-2022年
15.8.3.2 R&D、2018年~2022年
15.8.3.3 地域別収益シェア、2022年(%)
15.8.3.4 事業セグメント収益シェア、2022年(%)
15.8.4 製品ベンチマーク
15.9 Siemens AG
15.9.1 会社概要
15.9.2 会社概要
15.9.3 財務分析
15.9.3.1 純収入、2018-2022年
15.9.3.2 R&D、2018年~2022年
15.9.3.3 地域別収益シェア、2022年(%)
15.9.3.4 事業セグメント収益シェア、2022年(%)
15.9.4 製品ベンチマーク
15.10 ARC Systems, Inc.
15.10.1 会社概要
15.10.2 会社概要
15.10.3 製品ベンチマーク
15.11 ASMO Co. Ltd.
15.11.1 会社概要
15.11.2 会社概要
15.11.3 製品ベンチマーク
15.12 Nidec Corporation
15.12.1 会社概要
15.12.2 会社概要
15.12.3 財務分析
15.12.3.1 純収入、2018-2022年
15.12.3.2 R&D、2018-2022年
15.12.3.3 地域別収入シェア、2022年(%)
15.12.3.4 事業セグメント収益シェア、2022年(%)
15.12.4 製品ベンチマーク
15.12.5 戦略的展望
15.13 DENSO Corporation
15.13.1 会社概要
15.13.2 会社概要
15.13.3 財務分析
15.13.3.1 純収入、2018-2022年
15.13.4 製品ベンチマーク
15.13.5 戦略的展望
15.14 Emerson Electric Co.
15.14.1 会社概要
15.14.2 会社概要
15.14.3 財務分析
15.14.3.1 純収入、2018-2022年
15.14.3.2 R&D、2018-2022年
15.14.3.3 地域別収益シェア、2022年(%)
15.14.3.4 事業セグメント収益シェア、2022年(%)
15.14.4 製品ベンチマーク
15.15 Maxon Motor AG
15.15.1 会社概要
15.15.2 会社概要
15.15.3 製品ベンチマーク
15.16 AMETEK, Inc.
15.16.1 会社概要
15.16.2 会社概要
15.16.3 財務分析
15.16.3.1 純収入、2018-2022年
15.16.3.2 R&D、2018-2022年
15.16.3.3 地域別収入シェア、2022年(%)
15.16.3.4 事業セグメント収益シェア、2022年(%)
15.16.4 製品ベンチマーク
15.16.5 戦略的展望
15.17 Johnson Electric
15.17.1 会社概要
15.17.2 会社概要
15.17.3 財務分析
15.17.3.1 純収入、2018年~2022年
15.17.3.2 地域別売上高シェア、2022年(%)
15.17.3.3 事業セグメント別売上シェア、2022年(%)
15.17.4 製品ベンチマーク
15.17.5 戦略的展望
16 結論と提言
16.1 Visiongainからの結びの言葉
16.2 市場プレイヤーへの提言
ページTOPに戻る
図表リスト
表の一覧
Table 1 Electric Motors Market Snapshot, 2023 & 2033 (US$ Billion, CAGR %)
Table 2 Production of Crude Oil, Natural Gas Production & Petroleum Products
Table 3 Appliances for Improved Efficiency and their watts
Table 4 Global Electric Motors Market by Region, 2023-2033 (US$ Bn, AGR (%), CAGR (%)) (V-Shaped Recovery Scenario)
Table 5 Global Electric Motors Market by Region, 2023-2033 (US$ Bn, AGR (%), CAGR (%)) (U-Shaped Recovery Scenario)
Table 6 Global Electric Motors Market by Region, 2023-2033 (US$ Bn, AGR (%), CAGR (%)) (W-Shaped Recovery Scenario)
Table 7 Global Electric Motors Market by Region, 2023-2033 (US$ Bn, AGR (%), CAGR (%)) (L-Shaped Recovery Scenario)
Table 8 Global Electric Motors Market by Type, 2023-2033 (US$ Bn, AGR (%), CAGR (%))
Table 9 AC motors Market by Region, 2023-2033 (US$ Bn, AGR (%), CAGR (%))
Table 10 DC motors Market by Region, 2023-2033 (US$ Bn, AGR (%), CAGR (%))
Table 11 Global Electric Motors Market by Power Output, 2023-2033 (US$ Bn, AGR (%), CAGR (%))
Table 12 Integral HP Output Market by Region, 2023-2033 (US$ Bn, AGR (%), CAGR (%))
Table 13 Fractional HP Output Market by Region, 2023-2033 (US$ Bn, AGR (%), CAGR (%))
Table 14 Global Electric Motors Market by Voltage, 2023-2033 (US$ Bn, AGR (%), CAGR (%))
Table 15 Low Voltage Motors Market by Region, 2023-2033 (US$ Bn, AGR (%), CAGR (%))
Table 16 Medium Voltage Motors Market by Region, 2023-2033 (US$ Bn, AGR (%), CAGR (%))
Table 17 High Voltage Motors Market by Region, 2023-2033 (US$ Bn, AGR (%), CAGR (%))
Table 18 Global Electric Motors Market by Power Rating, 2023-2033 (US$ Bn, AGR (%), CAGR (%))
Table 19 List of "<1 kW Motors Manufacturer in India
Table 20 500 kW Motors Market by Region, 2023-2033 (US$ Bn, AGR (%), CAGR (%))
Table 25 Global Electric Motors Market by Application, 2023-2033 (US$ Bn, AGR (%), CAGR (%))
Table 26 Industrial Machinery Market by Region, 2023-2033 (US$ Bn, AGR (%), CAGR (%))
Table 27 Motor Vehicles Market by Region, 2023-2033 (US$ Bn, AGR (%), CAGR (%))
Table 28 HVAC Equipment Market by Region, 2023-2033 (US$ Bn, AGR (%), CAGR (%))
Table 29 Aerospace & Transportation Market by Region, 2023-2033 (US$ Bn, AGR (%), CAGR (%))
Table 30 Household Appliances Market by Region, 2023-2033 (US$ Bn, AGR (%), CAGR (%))
Table 31 Other Application Market by Region, 2023-2033 (US$ Bn, AGR (%), CAGR (%))
Table 32 Electric Motors Market Forecast by Region, 2023-2033 (US$ Billion, AGR%, CAGR%)
Table 33 North America Electric Motors Market by Value, 2023-2033 (US$ Bn, AGR (%), CAGR (%))
Table 34 North America Electric Motors Market by Country, 2023-2033 (US$ Bn, AGR (%), CAGR (%))
Table 35 North America Electric Motors Market by Type, 2023-2033 (US$ Bn, AGR (%), CAGR (%))
Table 36 North America Electric Motors Market by Power Output, 2023-2033 (US$ Bn, AGR (%), CAGR (%))
Table 37 North America Electric Motors Market by Voltage, 2023-2033 (US$ Bn, AGR (%), CAGR (%))
Table 38 North America Electric Motors Market by Power Rating, 2023-2033 (US$ Bn, AGR (%), CAGR (%))
Table 39 North America Electric Motors Market by Application, 2023-2033 (US$ Bn, AGR (%), CAGR (%))
Table 40 US Electric Motors Market by Value, 2023-2033 (US$ Bn, AGR (%), CAGR (%))
Table 41 Canada Electric Motors Market by Value, 2023-2033 (US$ Bn, AGR (%), CAGR (%))
Table 42 Europe Electric Motors Market by Value, 2023-2033 (US$ Bn, AGR (%), CAGR (%))
Table 43 Europe Electric Motors Market by Country, 2023-2033 (US$ Bn, AGR (%), CAGR (%))
Table 44 Europe Electric Motors Market by Type, 2023-2033 (US$ Bn, AGR (%), CAGR (%))
Table 45 Europe Electric Motors Market by Power Output, 2023-2033 (US$ Bn, AGR (%), CAGR (%))
Table 46 Europe Electric Motors Market by Voltage, 2023-2033 (US$ Bn, AGR (%), CAGR (%))
Table 47 Europe Electric Motors Market by Power Rating, 2023-2033 (US$ Bn, AGR (%), CAGR (%))
Table 48 Europe Electric Motors Market by Application, 2023-2033 (US$ Bn, AGR (%), CAGR (%))
Table 49 Germany Electric Motors Market by Value, 2023-2033 (US$ Bn, AGR (%), CAGR (%))
Table 50 Italy Electric Motors Market by Value, 2023-2033 (US$ Bn, AGR (%), CAGR (%))
Table 51 France Electric Motors Market by Value, 2023-2033 (US$ Bn, AGR (%), CAGR (%))
Table 52 Hungary Electric Motors Market by Value, 2023-2033 (US$ Bn, AGR (%), CAGR (%))
Table 53 Switzerland Electric Motors Market by Value, 2023-2033 (US$ Bn, AGR (%), CAGR (%))
Table 54 Rest of Europe Electric Motors Market by Value, 2023-2033 (US$ Bn, AGR (%), CAGR (%))
Table 55 Asia-Pacific Electric Motors Market by Value, 2023-2033 (US$ Bn, AGR (%), CAGR (%))
Table 56 Asia-Pacific Electric Motors Market by Country, 2023-2033 (US$ Bn, AGR (%), CAGR (%))
Table 57 Asia-Pacific Electric Motors Market by Type, 2023-2033 (US$ Bn, AGR (%), CAGR (%))
Table 58 Asia-Pacific Electric Motors Market by Power Output, 2023-2033 (US$ Bn, AGR (%), CAGR (%))
Table 59 Asia-Pacific Electric Motors Market by Voltage, 2023-2033 (US$ Bn, AGR (%), CAGR (%))
Table 60 Asia-Pacific Electric Motors Market by Power Rating, 2023-2033 (US$ Bn, AGR (%), CAGR (%))
Table 61 Asia-Pacific Electric Motors Market by Application, 2023-2033 (US$ Bn, AGR (%), CAGR (%))
Table 62 China Electric Motors Market by Value, 2023-2033 (US$ Bn, AGR (%), CAGR (%))
Table 63 India Electric Motors Market by Value, 2023-2033 (US$ Bn, AGR (%), CAGR (%))
Table 64 Japan Electric Motors Market by Value, 2023-2033 (US$ Bn, AGR (%), CAGR (%))
Table 65 South Korea Electric Motors Market by Value, 2023-2033 (US$ Bn, AGR (%), CAGR (%))
Table 66 Vietnam Electric Motors Market by Value, 2023-2033 (US$ Bn, AGR (%), CAGR (%))
Table 67 Rest of Asia-Pacific Electric Motors Market by Value, 2023-2033 (US$ Bn, AGR (%), CAGR (%))
Table 68 Middle East & Africa Electric Motors Market by Value, 2023-2033 (US$ Bn, AGR (%), CAGR (%))
Table 69 Middle East & Africa Electric Motors Market by Country, 2023-2033 (US$ Bn, AGR (%), CAGR (%))
Table 70 Middle East & Africa Electric Motors Market by Type, 2023-2033 (US$ Bn, AGR (%), CAGR (%))
Table 71 Middle East & Africa Electric Motors Market by Power Output, 2023-2033 (US$ Bn, AGR (%), CAGR (%))
Table 72 Middle East & Africa Electric Motors Market by Voltage, 2023-2033 (US$ Bn, AGR (%), CAGR (%))
Table 73 Middle East & Africa Electric Motors Market by Power Rating, 2023-2033 (US$ Bn, AGR (%), CAGR (%))
Table 74 Middle East & Africa Electric Motors Market by Application, 2023-2033 (US$ Bn, AGR (%), CAGR (%))
Table 75 GCC Electric Motors Market by Value, 2023-2033 (US$ Bn, AGR (%), CAGR (%))
Table 76 South Africa Electric Motors Market by Value, 2023-2033 (US$ Bn, AGR (%), CAGR (%))
Table 77 Rest of Middle East & Africa Electric Motors Market by Value, 2023-2033 (US$ Bn, AGR (%), CAGR (%))
Table 78 Latin America Electric Motors Market by Value, 2023-2033 (US$ Bn, AGR (%), CAGR (%))
Table 79 Latin America Electric Motors Market by Country, 2023-2033 (US$ Bn, AGR (%), CAGR (%))
Table 80 Latin America Electric Motors Market by Type, 2023-2033 (US$ Bn, AGR (%), CAGR (%))
Table 81 Latin America Electric Motors Market by Power Output, 2023-2033 (US$ Bn, AGR (%), CAGR (%))
Table 82 Latin America Electric Motors Market by Voltage, 2023-2033 (US$ Bn, AGR (%), CAGR (%))
Table 83 Latin America Electric Motors Market by Power Rating, 2023-2033 (US$ Bn, AGR (%), CAGR (%))
Table 84 Latin America Electric Motors Market by Application, 2023-2033 (US$ Bn, AGR (%), CAGR (%))
Table 85 Brazil Electric Motors Market by Value, 2023-2033 (US$ Bn, AGR (%), CAGR (%))
Table 86 Mexico Electric Motors Market by Value, 2023-2033 (US$ Bn, AGR (%), CAGR (%))
Table 87 Rest of Latin America Electric Motors Market by Value, 2023-2033 (US$ Bn, AGR (%), CAGR (%))
Table 88 Strategic Outlook - Contract
Table 89 ABB Ltd: Key Details, (CEO, HQ, Revenue, Founded, No. of Employees, Company Type, Website, Business Segment)
Table 90 ABB Ltd: Product Benchmarking
Table 91 ABB Ltd: Strategic Outlook
Table 92 General Electric Company:Key Details, (CEO, HQ, Revenue, Founded, No. of Employees, Company Type, Website, Business Segment)
Table 93 General Electric Company: Product Benchmarking
Table 94 General Electric Company: Strategic Outlook
Table 95 Toshiba Corporation: Key Details, (CEO, HQ, Revenue, Founded, No. of Employees, Company Type, Website, Business Segment)
Table 96 Toshiba Corporation: Product Benchmarking
Table 97 Toshiba Corporation: Strategic Outlook
Table 98 Hitachi, Ltd:Key Details, (CEO, HQ, Revenue, Founded, No. of Employees, Company Type, Website, Business Segment)
Table 99 Hitachi, Ltd: Product Benchmarking
Table 100 Hitachi, Ltd: Strategic Outlook
Table 101 Robert Bosch GmbH:Key Details, (CEO, HQ, Revenue, Founded, No. of Employees, Company Type, Website, Business Segment)
Table 102 Robert Bosch GmbH: Product Benchmarking
Table 103 Robert Bosch GmbH: Strategic Outlook
Table 104 Rockwell Automation, Inc. :Key Details, (CEO, HQ, Revenue, Founded, No. of Employees, Company Type, Website, Business Segment)
Table 105 Rockwell Automation, Inc: Product Benchmarking
Table 106 Siemens AG :Key Details, (CEO, HQ, Revenue, Founded, No. of Employees, Company Type, Website, Business Segment)
Table 107 Siemens AG: Product Benchmarking
Table 108 ARC Systems, Inc.:Key Details, (CEO, HQ, Revenue, Founded, No. of Employees, Company Type, Website, Business Segment)
Table 109 ARC Systems, Inc.: Product Benchmarking
Table 110 ASMO Co. Ltd.:Key Details, (CEO, HQ, Revenue, Founded, No. of Employees, Company Type, Website, Business Segment)
Table 111 ASMO Co. Ltd.: Product Benchmarking
Table 112 Nidec Corporation: Key Details, (CEO, HQ, Revenue, Founded, No. of Employees, Company Type, Website, Business Segment)
Table 113 Nidec Corporation: Product Benchmarking
Table 114 Nidec Corporation: Strategic Outlook
Table 115 DENSO Corporation :Key Details, (CEO, HQ, Revenue, Founded, No. of Employees, Company Type, Website, Business Segment)
Table 116 DENSO Corporation: Product Benchmarking
Table 117 DENSO Corporation: Strategic Outlook
Table 118 Emerson Electric Co.:Key Details, (CEO, HQ, Revenue, Founded, No. of Employees, Company Type, Website, Business Segment)
Table 119 Emerson Electric Co: Product Benchmarking
Table 120 Maxon Motor AG:Key Details, (CEO, HQ, Revenue, Founded, No. of Employees, Company Type, Website, Business Segment)
Table 121 Maxon Motor AG: Product Benchmarking
Table 122 AMETEK, Inc.:Key Details, (CEO, HQ, Revenue, Founded, No. of Employees, Company Type, Website, Business Segment)
Table 123 AMETEK, Inc: Product Benchmarking
Table 124 AMETEK, Inc: Strategic Outlook
Table 125 Johnson Electric: Key Details, (CEO, HQ, Revenue, Founded, No. of Employees, Company Type, Website, Business Segment)
Table 126 Johnson Electric: Product Benchmarking
Table 127 Johnson Electric: Strategic Outlook
図の一覧
Figure 1 Electric Motors Market Segmentation
Figure 2 Electric Motors Market by Type: Market Attractiveness Index
Figure 3 Electric Motors Market by Power Output: Market Attractiveness Index
Figure 4 Electric Motors Market by Voltage: Market Attractiveness Index
Figure 5 Electric Motors Market by Power Rating: Market Attractiveness Index
Figure 6 Electric Motors Market by Application: Market Attractiveness Index
Figure 7 Electric Motors Market Attractiveness Index by Region
Figure 8 Electric Motors Market: Market Dynamics
Figure 1 Production of Crude Oil, Natural Gas Production & Petroleum Products
Figure 2 EV sales, cars, World, 2018-2022
Figure 1 Major Domestic Appliances Sales(in million US$)
Figure 2 Electric Motors Market: Porter’s Five Forces Analysis
Figure 3 Global Electric Motors Market Share Forecast by COVID, 2023-2033 (%)
Figure 4 Global Electric Motors Market by Region, 2023-2033 (US$ Bn, AGR (%)) (V-Shaped Recovery Scenario)
Figure 5 Global Electric Motors Market by Region, 2023-2033 (US$ Bn, AGR (%)) (U-Shaped Recovery Scenario)
Figure 6 Global Electric Motors Market by Region, 2023-2033 (US$ Bn, AGR (%)) (W-Shaped Recovery Scenario)
Figure 7 Global Electric Motors Market by Region, 2023-2033 (US$ Bn, AGR (%)) (L-Shaped Recovery Scenario)
Figure 8 Electric Motors Market: PEST Analysis
Figure 9 Electric Motors Market by Type: Market Attractiveness Index
Figure 10 Global Electric Motors Market by Type, 2023-2033 (US$ Bn, AGR (%))
Figure 11 Electric Motors Market Share Forecast by Type, 2023, 2028, 2033 (%)
Figure 12 AC motors Market by Region, 2023-2033 (US$ Bn, AGR (%))
Figure 13 AC motors Market Share Forecast by Region, 2023 & 2033 (%)
Figure 14 DC motors Market by Region, 2023-2033 (US$ Bn, AGR (%))
Figure 15 DC Motors Market Share Forecast by Region, 2023 & 2033 (%)
Figure 16 Electric Motors Market by Power Output: Market Attractiveness Index
Figure 17 Global Electric Motors Market by Power Output, 2023-2033 (US$ Bn, AGR (%))
Figure 18 Electric Motors Market Share Forecast by Power Output, 2023, 2028, 2033 (%)
Figure 19 Integral HP Output Market by Region, 2023-2033 (US$ Bn, AGR (%))
Figure 20 Integral HP Output Market Share Forecast by Region, 2023 & 2033 (%)
Figure 21 Fractional HP Output Market by Region, 2023-2033 (US$ Bn, AGR (%))
Figure 22 Fractional HP Output Market Share Forecast by Region, 2023 & 2033 (%)
Figure 23 Electric Motors Market by Voltage: Market Attractiveness Index
Figure 24 Global Electric Motors Market by Voltage, 2023-2033 (US$ Bn, AGR (%))
Figure 25 Electric Motors Market Share Forecast by Voltage, 2023, 2028, 2033 (%)
Figure 26 Low Voltage Motors Market by Region, 2023-2033 (US$ Bn, AGR (%))
Figure 27 Low Voltage Motors Market Share Forecast by Region, 2023 & 2033 (%)
Figure 28 Medium Voltage Motors Market by Region, 2023-2033 (US$ Bn, AGR (%))
Figure 29 Medium Voltage Motors Market Share Forecast by Region, 2023 & 2033 (%)
Figure 30 High Voltage Motors Market by Region, 2023-2033 (US$ Bn, AGR (%))
Figure 31 High Voltage Motors Market Share Forecast by Region, 2023 & 2033 (%)
Figure 32 Electric Motors Market by Power Rating: Market Attractiveness Index
Figure 33 Global Electric Motors Market by Power Rating, 2023-2033 (US$ Bn, AGR (%))
Figure 34 Electric Motors Market Share Forecast by Power Rating, 2023, 2028, 2033 (%)
Figure 35 <1 kW Motors Market by Region, 2023-2033 (US$ Bn, AGR (%))
Figure 36 500 kW Motors Market by Region, 2023-2033 (US$ Bn, AGR (%))
Figure 44 >500 kW Motors Market Share Forecast by Region, 2023 & 2033 (%)
Figure 45 Electric Motors Market by Application: Market Attractiveness Index
Figure 46 Global Electric Motors Market by Application, 2023-2033 (US$ Bn, AGR (%))
Figure 47 Electric Motors Market Share Forecast by Application, 2023, 2028, 2033 (%)
Figure 48 Industrial Machinery Market by Region, 2023-2033 (US$ Bn, AGR (%))
Figure 49 Industrial Machinery Market Share Forecast by Region, 2023 & 2033 (%)
Figure 50 Motor Vehicles Market by Region, 2023-2033 (US$ Bn, AGR (%))
Figure 51 Motor Vehicles Market Share Forecast by Region, 2023 & 2033 (%)
Figure 52 HVAC Equipment Market by Region, 2023-2033 (US$ Bn, AGR (%))
Figure 53 HVAC Equipment Market Share Forecast by Region, 2023 & 2033 (%)
Figure 54 Aerospace & Transportation Market by Region, 2023-2033 (US$ Bn, AGR (%))
Figure 55 Aerospace & Household Appliances Market Share Forecast by Region, 2023 & 2033 (%)
Figure 56 Household Appliances Market by Region, 2023-2033 (US$ Bn, AGR (%))
Figure 57 Household Appliances Market Share Forecast by Region, 2023 & 2033 (%)
Figure 58 Other Application Market by Region, 2023-2033 (US$ Bn, AGR (%))
Figure 59 Others Market Share Forecast by Region, 2023 & 2033 (%)
Figure 60 Electric Motors Market Forecast by Region 2023 and 2033 (Revenue, CAGR%)
Figure 61 Electric Motors Market Share Forecast by Region 2023, 2028, 2033 (%)
Figure 62 Electric Motors Market by Region, 2023-2033 (US$ Billion, AGR %)
Figure 63 North America Electric Motors Market Attractiveness Index
Figure 64 North America Electric Motors Market by Region, 2023, 2028 & 2033 (US$ Billion)
Figure 65 North America Electric Motors Market by Value, 2023-2033 (US$ Bn, AGR (%))
Figure 66 North America Electric Motors Market by Country, 2023-2033 (US$ Bn, AGR (%))
Figure 67 North America Electric Motors Market Share Forecast by Country, 2023 & 2033 (%)
Figure 68 North America Electric Motors Market by Type, 2023-2033 (US$ Bn, AGR (%))
Figure 69 North America Electric Motors Market Share Forecast Type, 2023 & 2033 (%)
Figure 70 North America Electric Motors Market by Power Output, 2023-2033 (US$ Bn, AGR (%))
Figure 71 North America Electric Motors Market Share Forecast by Power Output, 2023 & 2033 (%)
Figure 72 North America Electric Motors Market by Voltage, 2023-2033 (US$ Bn, AGR (%))
Figure 73 North America Electric Motors Market Share Forecast by Voltage, 2023 & 2033 (%)
Figure 74 North America Electric Motors Market by Power Rating, 2023-2033 (US$ Bn, AGR (%))
Figure 75 North America Electric Motors Market Share Forecast by Power Rating, 2023 & 2033 (%)
Figure 76 North America Electric Motors Market by Application, 2023-2033 (US$ Bn, AGR (%))
Figure 77 North America Electric Motors Market Share Forecast by Application, 2023 & 2033 (%)
Figure 78 US Electric Motors Market by Value, 2023-2033 (US$ Bn, AGR (%))
Figure 79 Canada Electric Motors Market by Value, 2023-2033 (US$ Bn, AGR (%))
Figure 80 Europe Electric Motors Market Attractiveness Index
Figure 81 Europe Electric Motors Market by Region, 2023, 2028 & 2033 (US$ Billion)
Figure 82 Europe Electric Motors Market by Value, 2023-2033 (US$ Bn, AGR (%))
Figure 83 Europe Electric Motors Market by Country, 2023-2033 (US$ Bn, AGR (%))
Figure 84 Europe Electric Motors Market Share Forecast by Country, 2023 & 2033 (%)
Figure 85 Europe Electric Motors Market by Type, 2023-2033 (US$ Bn, AGR (%))
Figure 86 Europe Electric Motors Market Share Forecast Type, 2023 & 2033 (%)
Figure 87 Europe Electric Motors Market by Power Output, 2023-2033 (US$ Bn, AGR (%))
Figure 88 Europe Electric Motors Market Share Forecast by Power Output, 2023 & 2033 (%)
Figure 89 Europe Electric Motors Market by Voltage, 2023-2033 (US$ Bn, AGR (%))
Figure 90 Europe Electric Motors Market Share Forecast by Voltage, 2023 & 2033 (%)
Figure 91 Europe Electric Motors Market by Power Rating, 2023-2033 (US$ Bn, AGR (%))
Figure 92 Europe Electric Motors Market Share Forecast by Power Rating, 2023 & 2033 (%)
Figure 93 Europe Electric Motors Market by Application, 2023-2033 (US$ Bn, AGR (%))
Figure 94 Europe Electric Motors Market Share Forecast by Application, 2023 & 2033 (%)
Figure 95 Germany Electric Motors Market by Value, 2023-2033 (US$ Bn, AGR (%))
Figure 96 Italy Electric Motors Market by Value, 2023-2033 (US$ Bn, AGR (%))
Figure 97 France Electric Motors Market by Value, 2023-2033 (US$ Bn, AGR (%))
Figure 98 Hungary Electric Motors Market by Value, 2023-2033 (US$ Bn, AGR (%))
Figure 99 Switzerland Electric Motors Market by Value, 2023-2033 (US$ Bn, AGR (%))
Figure 100 Rest of Europe Electric Motors Market by Value, 2023-2033 (US$ Bn, AGR (%))
Figure 101 Asia-Pacific Electric Motors Market Attractiveness Index
Figure 102 Asia-Pacific Electric Motors Market by Region, 2023, 2028 & 2033 (US$ Billion)
Figure 103 Asia-Pacific Electric Motors Market by Value, 2023-2033 (US$ Bn, AGR (%))
Figure 104 Asia-Pacific Electric Motors Market by Country, 2023-2033 (US$ Bn, AGR (%))
Figure 105 Asia-Pacific Electric Motors Market Share Forecast by Country, 2023 & 2033 (%)
Figure 106 Asia-Pacific Electric Motors Market by Type, 2023-2033 (US$ Bn, AGR (%))
Figure 107 Asia-Pacific Electric Motors Market Share Forecast Type, 2023 & 2033 (%)
Figure 108 Asia-Pacific Electric Motors Market by Power Output, 2023-2033 (US$ Bn, AGR (%))
Figure 109 Asia-Pacific Electric Motors Market Share Forecast by Power Output, 2023 & 2033 (%)
Figure 110 Asia-Pacific Electric Motors Market by Voltage, 2023-2033 (US$ Bn, AGR (%))
Figure 111 Asia-Pacific Electric Motors Market Share Forecast by Voltage, 2023 & 2033 (%)
Figure 112 Asia-Pacific Electric Motors Market by Power Rating, 2023-2033 (US$ Bn, AGR (%))
Figure 113 Asia-Pacific Electric Motors Market Share Forecast by Power Rating, 2023 & 2033 (%)
Figure 114 Asia-Pacific Electric Motors Market by Application, 2023-2033 (US$ Bn, AGR (%))
Figure 115 Asia-Pacific Electric Motors Market Share Forecast by Application, 2023 & 2033 (%)
Figure 116 China Electric Motors Market by Value, 2023-2033 (US$ Bn, AGR (%))
Figure 117 India Electric Motors Market by Value, 2023-2033 (US$ Bn, AGR (%))
Figure 118 Japan Electric Motors Market by Value, 2023-2033 (US$ Bn, AGR (%))
Figure 119 South Korea Electric Motors Market by Value, 2023-2033 (US$ Bn, AGR (%))
Figure 120 Vietnam Electric Motors Market by Value, 2023-2033 (US$ Bn, AGR (%))
Figure 121 Rest of Asia-Pacific Electric Motors Market by Value, 2023-2033 (US$ Bn, AGR (%))
Figure 122 Middle East and Africa Electric Motors Market Attractiveness Index
Figure 123 Middle East and Africa Electric Motors Market by Region, 2023, 2028 & 2033 (US$ Billion)
Figure 124 Middle East & Africa Electric Motors Market by Value, 2023-2033 (US$ Bn, AGR (%))
Figure 125 Middle East & Africa Electric Motors Market by Country, 2023-2033 (US$ Bn, AGR (%))
Figure 126 Middle East and Africa Electric Motors Market Share Forecast by Country, 2023 & 2033 (%)
Figure 127 Middle East & Africa Electric Motors Market by Type, 2023-2033 (US$ Bn, AGR (%))
Figure 128 Middle East and Africa Electric Motors Market Share Forecast Type, 2023 & 2033 (%)
Figure 129 Middle East & Africa Electric Motors Market by Power Output, 2023-2033 (US$ Bn, AGR (%))
Figure 130 Middle East and Africa Electric Motors Market Share Forecast by Power Output, 2023 & 2033 (%)
Figure 131 Middle East & Africa Electric Motors Market by Voltage, 2023-2033 (US$ Bn, AGR (%))
Figure 132 Middle East and Africa Electric Motors Market Share Forecast by Voltage, 2023 & 2033 (%)
Figure 133 Middle East & Africa Electric Motors Market by Power Rating, 2023-2033 (US$ Bn, AGR (%))
Figure 134 Middle East and Africa Electric Motors Market Share Forecast by Power Rating, 2023 & 2033 (%)
Figure 135 Middle East & Africa Electric Motors Market by Application, 2023-2033 (US$ Bn, AGR (%))
Figure 136 Middle East and Africa Electric Motors Market Share Forecast by Application, 2023 & 2033 (%)
Figure 137 GCC Electric Motors Market by Value, 2023-2033 (US$ Bn, AGR (%))
Figure 138 South Africa Electric Motors Market by Value, 2023-2033 (US$ Bn, AGR (%))
Figure 139 Rest of Middle East & Africa Electric Motors Market by Value, 2023-2033 (US$ Bn, AGR (%))
Figure 140 Latin America Electric Motors Market Attractiveness Index
Figure 141 Latin America Electric Motors Market by Region, 2023, 2028 & 2033 (US$ Billion)
Figure 142 Latin America Electric Motors Market by Value, 2023-2033 (US$ Bn, AGR (%))
Figure 143 Latin America Electric Motors Market by Country, 2023-2033 (US$ Bn, AGR (%))
Figure 144 Latin America Electric Motors Market Share Forecast by Country, 2023 & 2033 (%)
Figure 145 Latin America Electric Motors Market by Type, 2023-2033 (US$ Bn, AGR (%))
Figure 146 Latin America Electric Motors Market Share Forecast Type, 2023 & 2033 (%)
Figure 147 Latin America Electric Motors Market by Power Output, 2023-2033 (US$ Bn, AGR (%))
Figure 148 Latin America Electric Motors Market Share Forecast by Power Output, 2023 & 2033 (%)
Figure 149 Latin America Electric Motors Market by Voltage, 2023-2033 (US$ Bn, AGR (%))
Figure 150 Latin America Electric Motors Market Share Forecast by Voltage, 2023 & 2033 (%)
Figure 151 Latin America Electric Motors Market by Power Rating, 2023-2033 (US$ Bn, AGR (%))
Figure 152 Latin America Electric Motors Market Share Forecast by Power Rating, 2023 & 2033 (%)
Figure 153 Latin America Electric Motors Market by Application, 2023-2033 (US$ Bn, AGR (%))
Figure 154 Latin America Electric Motors Market Share Forecast by Application, 2023 & 2033 (%)
Figure 155 Brazil Electric Motors Market by Value, 2023-2033 (US$ Bn, AGR (%))
Figure 156 Mexico Electric Motors Market by Value, 2023-2033 (US$ Bn, AGR (%))
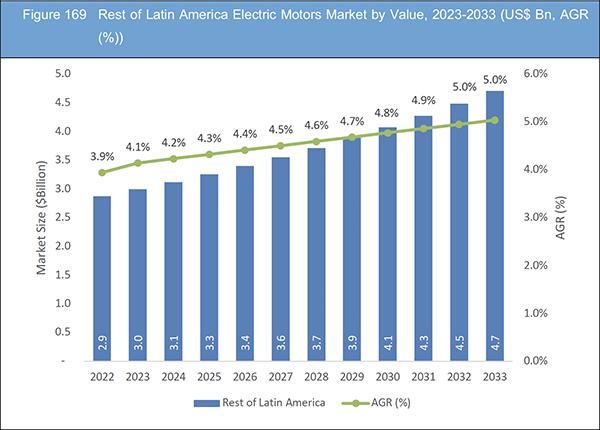
Figure 157 Rest of Latin America Electric Motors Market by Value, 2023-2033 (US$ Bn, AGR (%))
Figure 158 Electric Motors Market: Company Share, 2022
Figure 159 ABB Ltd.: Net Revenue, 2018-2022 (US$ Billion, AGR%)
Figure 160 ABB Ltd.: R&D, 2018-2022 (US$ Billion, AGR%)
Figure 161 ABB Ltd.: Business Segment Revenue Share, 2022 (%)
Figure 162 General Electric Company.: Net Revenue, 2018-2022 (US$ Billion, AGR%)
Figure 163 General Electric Company.: R&D, 2018-2022 (US$ Billion, AGR%)
Figure 164 General Electric Company.: Regional Revenue Share, 2022 (%)
Figure 165 General Electric Company.: Business Segment Revenue Share, 2022 (%)
Figure 166 Toshiba Corporation.: Net Revenue, 2018-2022 (US$ Billion, AGR%)
Figure 167 Toshiba Corporation.: R&D, 2018-2022 (US$ Billion, AGR%)
Figure 168 Toshiba Corporation.: Regional Revenue Share, 2022 (%)
Figure 169 Toshiba Corporation.: Business Segment Revenue Share, 2022 (%)
Figure 170 Hitachi, Ltd.: Net Revenue, 2018-2022 (US$ Billion, AGR%)
Figure 171 Hitachi, Ltd.: Regional Revenue Share, 2022 (%)
Figure 172 Hitachi, Ltd.: Business Segment Revenue Share, 2022 (%)
Figure 173 Rockwell Automation, Inc.: Net Revenue, 2018-2022 (US$ Billion, AGR%)
Figure 174 Rockwell Automation, Inc.: R&D, 2018-2022 (US$ Billion, AGR%)
Figure 175 Rockwell Automation, Inc.: Regional Revenue Share, 2022 (%)
Figure 176 Rockwell Automation, Inc.: Business Segment Revenue Share, 2022 (%)
Figure 177 Siemens AG.: Net Revenue, 2018-2022 (US$ Billion, AGR%)
Figure 178 Siemens AG.: R&D, 2018-2022 (US$ Billion, AGR%)
Figure 179 Siemens AG.: Regional Revenue Share, 2022 (%)
Figure 180 Siemens AG.: Business Segment Revenue Share, 2022 (%)
Figure 181 Nidec Corporation.: Net Revenue, 2018-2022 (US$ Billion, AGR%)
Figure 182 Nidec Corporation.: R&D, 2018-2022 (US$ Billion, AGR%)
Figure 183 Nidec Corporation.: Regional Revenue Share, 2022 (%)
Figure 184 Nidec Corporation.: Business Segment Revenue Share, 2022 (%)
Figure 185 DENSO Corporation.: Net Revenue, 2018-2022 (US$ Billion, AGR%)
Figure 186 Emerson Electric Co.: Net Revenue, 2018-2022 (US$ Billion, AGR%)
Figure 187 Emerson Electric Co.: R&D, 2018-2022 (US$ Billion, AGR%)
Figure 188 Emerson Electric Co.: Regional Revenue Share, 2022 (%)
Figure 189 Emerson Electric Co.: Business Segment Revenue Share, 2022 (%)
Figure 190 AMETEK, Inc..: Net Revenue, 2018-2022 (US$ Billion, AGR%)
Figure 191 AMETEK, Inc.: R&D, 2018-2022 (US$ Billion, AGR%)
Figure 192 AMETEK, Inc.: Regional Revenue Share, 2022 (%)
Figure 193 AMETEK, Inc.: Business Segment Revenue Share, 2022 (%)
Figure 194 Johnson Electric.: Net Revenue, 2018-2022 (US$ Billion, AGR%)
Figure 195 Johnson Electric.: Regional Revenue Share, 2022 (%)
Figure 196 Johnson Electric.: Business Segment Revenue Share, 2022 (%)
ページTOPに戻る
Summary
Report Details
The Electric Motors Market Report 2023-2033: This report will prove invaluable to leading firms striving for new revenue pockets if they wish to better understand the industry and its underlying dynamics. It will be useful for companies that would like to expand into different industries or to expand their existing operations in a new region.
Accelerated Transition to Electric Mobility is Driving the Market Growth
The electric motor market is being driven by the soaring demand for electric vehicles (EVs) as governments, consumers, and industries worldwide seek cleaner and more sustainable transportation options. With growing concerns over greenhouse gas emissions and fossil fuel dependence, EVs offer a compelling solution, powered by electric motors. These motors are at the heart of EV propulsion, converting electrical energy into mechanical power to drive the vehicle. As governments implement stricter emission regulations and consumers embrace eco-friendly choices, the electric motor market is witnessing substantial growth. The trend is particularly evident in passenger cars, commercial vehicles, and public transport systems, fostering innovation and investment in electric motor technologies to meet the rising demand for efficient and powerful propulsion solutions.
Consumers Are Increasingly Valuing Sustainability with Their Vehicle Choices
Consumers are increasingly valuing sustainability, and their vehicle choices often reflect their commitment to reducing their environmental footprint. Electric vehicles powered by electric motors are seen as symbols of responsible consumption and environmental consciousness. Owning an electric vehicle enhances the owner’s image as an eco-conscious individual contributing to a greener future. This positive perception is reinforced by media coverage, celebrity endorsements, and government campaigns promoting electric mobility. As consumers seek to align their lifestyles with their values, the electric motor market benefits from this consumer-driven demand for environmentally friendly transportation options.
What Questions Should You Ask before Buying a Market Research Report?
• How is the electric motors market evolving?
• What is driving and restraining the electric motors market?
• How will each electric motors submarket segment grow over the forecast period and how much revenue will these submarkets account for in 2033?
• How will the market shares for each electric motor submarket develop from 2023 to 2033?
• What will be the main driver for the overall market from 2023 to 2033?
• Will leading electric motors markets broadly follow the macroeconomic dynamics, or will individual national markets outperform others?
• How will the market shares of the national markets change by 2033 and which geographical region will lead the market in 2033?
• Who are the leading players and what are their prospects over the forecast period?
• What are the electric motors projects for these leading companies?
• How will the industry evolve during the period between 2023 and 2033? What are the implications of electric motors projects taking place now and over the next 10 years?
• Is there a greater need for product commercialisation to further scale the electric motors market?
• Where is the electric motors market heading and how can you ensure you are at the forefront of the market?
• What are the best investment options for new product and service lines?
• What are the key prospects for moving companies into a new growth path and C-suite?
You need to discover how this will impact the electric motors market today, and over the next 10 years:
• Our 410-page report provides 127 tables and 196 charts/graphs exclusively to you.
• The report highlights key lucrative areas in the industry so you can target them – NOW.
• It contains in-depth analysis of global, regional and national sales and growth.
• It highlights for you the key successful trends, changes and revenue projections made by your competitors.
This report tells you TODAY how the electric motors market will develop in the next 10 years, and in line with the variations in COVID-19 economic recession and bounce. This market is more critical now than at any point over the last 10 years.
Forecasts to 2033 and other analyses reveal commercial prospects
• In addition to revenue forecasting to 2033, our new study provides you with recent results, growth rates, and market shares.
• You will find original analyses, with business outlooks and developments.
• Discover qualitative analyses (including market dynamics, drivers, opportunities, restraints and challenges), cost structure, impact of rising electric motors prices and recent developments.
This report includes data analysis and invaluable insight into how COVID-19 will affect the industry and your company. Four COVID-19 recovery patterns and their impact, namely, “V”, “L”, “W” and “U” are discussed in this report.
Segments Covered in the Report
Market Segment by Type
• AC Motors
• DC Motors
Market Segment by Power Output
• Integral HP Output
• Fractional HP Output
Market Segment by Voltage
• Low Voltage Motors
• Medium Voltage Motors
• High Voltage Motors
Market Segment by Power Rating
• <1 kW Motors
• 1–2.2 kW Motors
• 2.2–375 kW Motors
• 375 -500 kW Motors
• >500 kW Motors
Market Segment by Application
• Motor Vehicles
• Industrial Machinery
• HVAC Equipment
• Aerospace & Transportation
• Household Appliances
• Other Application
In addition to the revenue predictions for the overall world market and segments, you will also find revenue forecasts for four regional and 20 leading national markets:
North America
• U.S.
• Canada
Europe
• Germany
• Italy
• France
• Hungary
• Switzerland
• Rest of Europe
Asia Pacific
• China
• Japan
• India
• Vietnam
• South Korea
• Rest of Asia Pacific
Latin America
• Brazil
• Mexico
• Rest of Latin America
Middle East & Africa
• GCC
• South Africa
• Rest of Middle East & Africa
The report also includes profiles and for some of the leading companies in the Electric Motors Market, 2023 to 2033, with a focus on this segment of these companies’ operations.
Leading companies and the potential for market growth
• ABB Ltd
• AMETEK, Inc.
• ARC Systems, Inc.
• ASMO Co. Ltd.
• DENSO Corporation
• Emerson Electric Co.
• General Electric Company
• Hitachi, Ltd
• Johnson Electric
• Maxon Motor AG
• Nidec Corporation
• Robert Bosch GmbH
• Rockwell Automation, Inc.
• Siemens AG
• Toshiba Corporation
Overall world revenue for Electric Motors Market, 2023 to 2033 in terms of value the market will surpass US$132.8 billion in 2023, our work calculates. We predict strong revenue growth through to 2033. Our work identifies which organizations hold the greatest potential. Discover their capabilities, progress, and commercial prospects, helping you stay ahead.
How will the Electric Motors Market, 2023 to 2033 report help you?
In summary, our 410-page report provides you with the following knowledge:
• Revenue forecasts to 2033 for Electric Motors Market, 2023 to 2033 Market, with forecasts for type, power output, voltage, power rating, application, each forecast at a global and regional level – discover the industry’s prospects, finding the most lucrative places for investments and revenues.
• Revenue forecasts to 2033 for four regional and 20 key national markets – See forecasts for the Electric Motors Market, 2023 to 2033 market in North America, Europe, Asia-Pacific, Latin America and Middle East & Africa. Also forecasted is the market in the US, Canada, Brazil, Germany, France, Hungary, Switzerland, Italy, China, India, Japan, and Australia among other prominent economies.
• Prospects for established firms and those seeking to enter the market – including company profiles for 20 of the major companies involved in the Electric Motors Market, 2023 to 2033.
Find quantitative and qualitative analyses with independent predictions. Receive information that only our report contains, staying informed with invaluable business intelligence.
Information found nowhere else
With our new report, you are less likely to fall behind in knowledge or miss out on opportunities. See how our work could benefit your research, analyses, and decisions. Visiongain’s study is for everybody needing commercial analyses for the Electric Motors Market, 2023 to 2033, market-leading companies. You will find data, trends and predictions.
ページTOPに戻る
Table of Contents
Table of Contents
1 Report Overview
1.1 Objectives of the Study
1.2 Introduction to Electric Motors Market
1.3 What This Report Delivers
1.4 Why You Should Read This Report
1.5 Key Questions Answered by This Analytical Report
1.6 Who Is This Report for?
1.7 Methodology
1.7.1 Market Definitions
1.7.2 Market Evaluation & Forecasting Methodology
1.7.3 Data Validation
1.7.3.1 Primary Research
1.7.3.2 Secondary Research
1.8 Frequently Asked Questions (FAQs)
1.9 Associated Visiongain Reports
1.10 About Visiongain
2 Executive Summary
3 Market Overview
3.1 Key Findings
3.2 Market Dynamics
3.2.1 Market Driving Factors
3.2.1.1 Rising Demand for Energy-Efficient Motors in Industrial Applications
3.2.1.2 Increasing Adoption of Electric Vehicles (Evs) and Hybrid Vehicles
3.2.1.3 Integration of Electric Motors in Consumer Electronics and Appliances for Improved Efficiency
3.2.2 Market Restraining Factors
3.2.2.1 High Initial Cost and Maintenance of Electric Motors
3.2.2.2 Electric Motors Rely on Critical Materials Such as Rare Earth Elements, Which Can Lead to Supply Chain Vulnerabilities
3.2.2.3 Overheating and Potential Fire Hazards are Safety Concerns With High-Power Electric Motors, Necessitating Advanced Safety Measures
3.2.3 Market Opportunities
3.2.3.1 Improvement in Design Methods to Reduce Carbon Emissions
3.2.3.2 Technological Advancements in Electric Motor Technology
3.2.3.3 The Increasing Adoption of Automation and Robotics in Industries Creates a Demand for Precision Electric Motors
3.3 Porter’s Five Forces Analysis
3.3.1 Bargaining Power of Suppliers (Moderate)
3.3.2 Bargaining Power of Buyers (Moderate to High)
3.3.3 Competitive Rivalry (High)
3.3.4 Threat from Substitutes (Moderate)
3.3.5 Threat of New Entrants (Low)
3.4 COVID-19 Impact Analysis
3.4.1 “V-Shaped Recovery”
3.4.2 “U-Shaped Recovery”
3.4.3 “W-Shaped Recovery”
3.4.4 “L-Shaped Recovery”
3.5 PEST Analysis
4 Electric Motors Market Analysis by Type
4.1 Key Findings
4.2 Type Segment: Market Attractiveness Index
4.3 Electric Motors Market Size Estimation and Forecast by Type
4.4 AC Motors
4.4.1 Market Size by Region, 2023-2033 (US$ Billion)
4.4.2 Market Share by Region, 2023 & 2033 (%)
4.5 DC Motors
4.5.1 Market Size by Region, 2023-2033 (US$ Billion)
4.5.2 Market Share by Region, 2023 & 2033 (%)
5 Electric Motors Market Analysis by Power Output
5.1 Key Findings
5.2 Power Output Segment: Market Attractiveness Index
5.3 Electric Motors Market Size Estimation and Forecast by Power Output
5.4 Integral HP Output
5.4.1 Market Size by Region, 2023-2033 (US$ Billion)
5.4.2 Market Share by Region, 2023 & 2033 (%)
5.5 Fractional HP Output
5.5.1 Market Size by Region, 2023-2033 (US$ Billion)
5.5.2 Market Share by Region, 2023 & 2033 (%)
6 Electric Motors Market Analysis by Voltage
6.1 Key Findings
6.2 Voltage Segment: Market Attractiveness Index
6.3 Electric Motors Market Size Estimation and Forecast by Voltage
6.4 Low Voltage Motors
6.4.1 Market Size by Region, 2023-2033 (US$ Billion)
6.4.2 Market Share by Region, 2023 & 2033 (%)
6.5 Medium Voltage Motors
6.5.1 Market Size by Region, 2023-2033 (US$ Billion)
6.5.2 Market Share by Region, 2023 & 2033 (%)
6.6 High Voltage Motors
6.6.1 Market Size by Region, 2023-2033 (US$ Billion)
6.6.2 Market Share by Region, 2023 & 2033 (%)
7 Electric Motors Market Analysis by Power Rating
7.1 Key Findings
7.2 Power Rating Segment: Market Attractiveness Index
7.3 Electric Motors Market Size Estimation and Forecast by Power Rating
7.4 500 kW Motors
7.8.1 Market Size by Region, 2023-2033 (US$ Billion)
7.8.2 Market Share by Region, 2023 & 2033 (%)
8 Electric Motors Market Analysis by Application
8.1 Key Findings
8.2 Application Segment: Market Attractiveness Index
8.3 Electric Motors Market Size Estimation and Forecast by Application
8.4 Industrial Machinery
8.4.1 Market Size by Region, 2023-2033 (US$ Billion)
8.4.2 Market Share by Region, 2023 & 2033 (%)
8.5 Motor Vehicles
8.5.1 Market Size by Region, 2023-2033 (US$ Billion)
8.5.2 Market Share by Region, 2023 & 2033 (%)
8.6 HVAC Equipment
8.6.1 Market Size by Region, 2023-2033 (US$ Billion)
8.6.2 Market Share by Region, 2023 & 2033 (%)
8.7 Aerospace
8.7.1 Market Size by Region, 2023-2033 (US$ Billion)
8.7.2 Market Share by Region, 2023 & 2033 (%)
8.8 Household Appliances
8.8.1 Market Size by Region, 2023-2033 (US$ Billion)
8.8.2 Market Share by Region, 2023 & 2033 (%)
8.9 Others
8.9.1 Market Size by Region, 2023-2033 (US$ Billion)
8.9.2 Market Share by Region, 2023 & 2033 (%)
9 Electric Motors Market Analysis by Region
9.1 Key Findings
9.2 Regional Market Size Estimation and Forecast
10 North America Electric Motors Market Analysis
10.1 Key Findings
10.2 North America Electric Motors Market Attractiveness Index
10.3 North America Electric Motors Market by Country, 2023, 2028 & 2033 (US$ Billion)
10.4 North America Electric Motors Market Size Estimation and Forecast
10.5 North America Electric Motors Market Size Estimation and Forecast by Country
10.6 North America Electric Motors Market Size Estimation and Forecast by Type
10.7 North America Electric Motors Market Size Estimation and Forecast by Power Output
10.8 North America Electric Motors Market Size Estimation and Forecast by Voltage
10.9 North America Electric Motors Market Size Estimation and Forecast by Power Rating
10.10 North America Electric Motors Market Size Estimation and Forecast by Application
10.11 U.S. Electric Motors Market Analysis
10.12 Canada Electric Motors Market Analysis
11 Europe Electric Motors Market Analysis
11.1 Key Findings
11.2 Europe Electric Motors Market Attractiveness Index
11.3 Europe Electric Motors Market by Country, 2023, 2028 & 2033 (US$ Billion)
11.4 Europe Electric Motors Market Size Estimation and Forecast
11.5 Europe Electric Motors Market Size Estimation and Forecast by Country
11.6 Europe Electric Motors Market Size Estimation and Forecast by Type
11.7 Europe Electric Motors Market Size Estimation and Forecast by Power Output
11.8 Europe Electric Motors Market Size Estimation and Forecast by Voltage
11.9 Europe Electric Motors Market Size Estimation and Forecast by Power Rating
11.10 Europe Electric Motors Market Size Estimation and Forecast by Application
11.11 Germany Electric Motors Market Analysis
11.12 Italy Electric Motors Market Analysis
11.13 France Electric Motors Market Analysis
11.14 Hungary Electric Motors Market Analysis
11.15 Switzerland Electric Motors Market Analysis
11.16 Rest of Europe Electric Motors Market Analysis
12 Asia-Pacific Electric Motors Market Analysis
12.1 Key Findings
12.2 Asia-Pacific Electric Motors Market Attractiveness Index
12.3 Asia-Pacific Electric Motors Market by Country, 2023, 2028 & 2033 (US$ Billion)
12.4 Asia-Pacific Electric Motors Market Size Estimation and Forecast
12.5 Asia-Pacific Electric Motors Market Size Estimation and Forecast by Country
12.6 Asia-Pacific Electric Motors Market Size Estimation and Forecast by Type
12.7 Asia-Pacific Electric Motors Market Size Estimation and Forecast by Power Output
12.8 Asia-Pacific Electric Motors Market Size Estimation and Forecast by Voltage
12.9 Asia-Pacific Electric Motors Market Size Estimation and Forecast by Power Rating
12.10 Asia-Pacific Electric Motors Market Size Estimation and Forecast by Application
12.11 China Electric Motors Market Analysis
12.12 India Electric Motors Market Analysis
12.13 Japan Electric Motors Market Analysis
12.14 South Korea Electric Motors Market Analysis
12.15 Vietnam Electric Motors Market Analysis
12.16 Rest of Asia-Pacific Electric Motors Market Analysis
13 Middle East and Africa Electric Motors Market Analysis
13.1 Key Findings
13.2 Middle East and Africa Electric Motors Market Attractiveness Index
13.3 Middle East and Africa Electric Motors Market by Country, 2023, 2028 & 2033 (US$ Billion)
13.4 Middle East and Africa Electric Motors Market Size Estimation and Forecast
13.5 Middle East and Africa Electric Motors Market Size Estimation and Forecast by Country
13.6 Middle East and Africa Electric Motors Market Size Estimation and Forecast by Type
13.7 Middle East and Africa Electric Motors Market Size Estimation and Forecast by Power Output
13.8 Middle East and Africa Electric Motors Market Size Estimation and Forecast by Voltage
13.9 Middle East and Africa Electric Motors Market Size Estimation and Forecast by Power Rating
13.10 Middle East and Africa Electric Motors Market Size Estimation and Forecast by Application
13.11 GCC Electric Motors Market Analysis
13.12 South Africa Electric Motors Market Analysis
13.13 Rest of Middle East & Africa Electric Motors Market Analysis
14 Latin America Electric Motors Market Analysis
14.1 Key Findings
14.2 Latin America Electric Motors Market Attractiveness Index
14.3 Latin America Electric Motors Market by Country, 2023, 2028 & 2033 (US$ Billion)
14.4 Latin America Electric Motors Market Size Estimation and Forecast
14.5 Latin America Electric Motors Market Size Estimation and Forecast by Country
14.6 Latin America Electric Motors Market Size Estimation and Forecast by Type
14.7 Latin America Electric Motors Market Size Estimation and Forecast by Power Output
14.8 Latin America Electric Motors Market Size Estimation and Forecast by Voltage
14.9 Latin America Electric Motors Market Size Estimation and Forecast by Power Rating
14.10 Latin America Electric Motors Market Size Estimation and Forecast by Application
14.11 Brazil Electric Motors Market Analysis
14.12 Mexico Electric Motors Market Analysis
14.13 Rest of Latin America Electric Motors Market Analysis
15 Company Profiles
15.1 Competitive Landscape, 2022
15.2 Strategic Outlook
15.3 ABB Ltd
15.3.1 Company Snapshot
15.3.2 Company Overview
15.3.3 Financial Analysis
15.3.3.1 Net Revenue, 2018-2022
15.3.3.2 R&D, 2018-2022
15.3.3.3 Business Segment Revenue Share, 2022 (%)
15.3.4 Product Benchmarking
15.3.5 Strategic Outlook
15.4 General Electric Company
15.4.1 Company Snapshot
15.4.2 Company Overview
15.4.3 Financial Analysis
15.4.3.1 Net Revenue, 2018-2022
15.4.3.2 R&D, 2018-2022
15.4.3.3 Regional Revenue Share, 2022 (%)
15.4.3.4 Business Segment Revenue Share, 2022 (%)
15.4.4 Product Benchmarking
15.4.5 Strategic Outlook
15.5 Toshiba Corporation
15.5.1 Company Snapshot
15.5.2 Company Overview
15.5.3 Financial Analysis
15.5.3.1 Net Revenue, 2018-2022
15.5.3.2 R&D, 2018-2022
15.5.3.3 Regional Revenue Share, 2022 (%)
15.5.3.4 Business Segment Revenue Share, 2022 (%)
15.5.4 Product Benchmarking
15.5.5 Strategic Outlook
15.6 Hitachi, Ltd
15.6.1 Company Snapshot
15.6.2 Company Overview
15.6.3 Financial Analysis
15.6.3.1 Net Revenue, 2018-2022
15.6.3.2 Regional Revenue Share, 2022 (%)
15.6.3.3 Business Segment Revenue Share, 2022 (%)
15.6.4 Product Benchmarking
15.6.5 Strategic Outlook
15.7 Robert Bosch GmbH
15.7.1 Company Snapshot
15.7.2 Company Overview
15.7.3 Product Benchmarking
15.7.4 Strategic Outlook
15.8 Rockwell Automation, Inc.
15.8.1 Company Snapshot
15.8.2 Company Overview
15.8.3 Financial Analysis
15.8.3.1 Net Revenue, 2018-2022
15.8.3.2 R&D, 2018-2022
15.8.3.3 Regional Revenue Share, 2022 (%)
15.8.3.4 Business Segment Revenue Share, 2022 (%)
15.8.4 Product Benchmarking
15.9 Siemens AG
15.9.1 Company Snapshot
15.9.2 Company Overview
15.9.3 Financial Analysis
15.9.3.1 Net Revenue, 2018-2022
15.9.3.2 R&D, 2018-2022
15.9.3.3 Regional Revenue Share, 2022 (%)
15.9.3.4 Business Segment Revenue Share, 2022 (%)
15.9.4 Product Benchmarking
15.10 ARC Systems, Inc.
15.10.1 Company Snapshot
15.10.2 Company Overview
15.10.3 Product Benchmarking
15.11 ASMO Co. Ltd.
15.11.1 Company Snapshot
15.11.2 Company Overview
15.11.3 Product Benchmarking
15.12 Nidec Corporation
15.12.1 Company Snapshot
15.12.2 Company Overview
15.12.3 Financial Analysis
15.12.3.1 Net Revenue, 2018-2022
15.12.3.2 R&D, 2018-2022
15.12.3.3 Regional Revenue Share, 2022 (%)
15.12.3.4 Business Segment Revenue Share, 2022 (%)
15.12.4 Product Benchmarking
15.12.5 Strategic Outlook
15.13 DENSO Corporation
15.13.1 Company Snapshot
15.13.2 Company Overview
15.13.3 Financial Analysis
15.13.3.1 Net Revenue, 2018-2022
15.13.4 Product Benchmarking
15.13.5 Strategic Outlook
15.14 Emerson Electric Co.
15.14.1 Company Snapshot
15.14.2 Company Overview
15.14.3 Financial Analysis
15.14.3.1 Net Revenue, 2018-2022
15.14.3.2 R&D, 2018-2022
15.14.3.3 Regional Revenue Share, 2022 (%)
15.14.3.4 Business Segment Revenue Share, 2022 (%)
15.14.4 Product Benchmarking
15.15 Maxon Motor AG
15.15.1 Company Snapshot
15.15.2 Company Overview
15.15.3 Product Benchmarking
15.16 AMETEK, Inc.
15.16.1 Company Snapshot
15.16.2 Company Overview
15.16.3 Financial Analysis
15.16.3.1 Net Revenue, 2018-2022
15.16.3.2 R&D, 2018-2022
15.16.3.3 Regional Revenue Share, 2022 (%)
15.16.3.4 Business Segment Revenue Share, 2022 (%)
15.16.4 Product Benchmarking
15.16.5 Strategic Outlook
15.17 Johnson Electric
15.17.1 Company Snapshot
15.17.2 Company Overview
15.17.3 Financial Analysis
15.17.3.1 Net Revenue, 2018-2022
15.17.3.2 Regional Revenue Share, 2022 (%)
15.17.3.3 Business Segment Revenue Share, 2022 (%)
15.17.4 Product Benchmarking
15.17.5 Strategic Outlook
16 Conclusion and Recommendations
16.1 Concluding Remarks from Visiongain
16.2 Recommendations for Market Players
ページTOPに戻る
List of Tables/Graphs
List of Tables
Table 1 Electric Motors Market Snapshot, 2023 & 2033 (US$ Billion, CAGR %)
Table 2 Production of Crude Oil, Natural Gas Production & Petroleum Products
Table 3 Appliances for Improved Efficiency and their watts
Table 4 Global Electric Motors Market by Region, 2023-2033 (US$ Bn, AGR (%), CAGR (%)) (V-Shaped Recovery Scenario)
Table 5 Global Electric Motors Market by Region, 2023-2033 (US$ Bn, AGR (%), CAGR (%)) (U-Shaped Recovery Scenario)
Table 6 Global Electric Motors Market by Region, 2023-2033 (US$ Bn, AGR (%), CAGR (%)) (W-Shaped Recovery Scenario)
Table 7 Global Electric Motors Market by Region, 2023-2033 (US$ Bn, AGR (%), CAGR (%)) (L-Shaped Recovery Scenario)
Table 8 Global Electric Motors Market by Type, 2023-2033 (US$ Bn, AGR (%), CAGR (%))
Table 9 AC motors Market by Region, 2023-2033 (US$ Bn, AGR (%), CAGR (%))
Table 10 DC motors Market by Region, 2023-2033 (US$ Bn, AGR (%), CAGR (%))
Table 11 Global Electric Motors Market by Power Output, 2023-2033 (US$ Bn, AGR (%), CAGR (%))
Table 12 Integral HP Output Market by Region, 2023-2033 (US$ Bn, AGR (%), CAGR (%))
Table 13 Fractional HP Output Market by Region, 2023-2033 (US$ Bn, AGR (%), CAGR (%))
Table 14 Global Electric Motors Market by Voltage, 2023-2033 (US$ Bn, AGR (%), CAGR (%))
Table 15 Low Voltage Motors Market by Region, 2023-2033 (US$ Bn, AGR (%), CAGR (%))
Table 16 Medium Voltage Motors Market by Region, 2023-2033 (US$ Bn, AGR (%), CAGR (%))
Table 17 High Voltage Motors Market by Region, 2023-2033 (US$ Bn, AGR (%), CAGR (%))
Table 18 Global Electric Motors Market by Power Rating, 2023-2033 (US$ Bn, AGR (%), CAGR (%))
Table 19 List of "<1 kW Motors Manufacturer in India
Table 20 500 kW Motors Market by Region, 2023-2033 (US$ Bn, AGR (%), CAGR (%))
Table 25 Global Electric Motors Market by Application, 2023-2033 (US$ Bn, AGR (%), CAGR (%))
Table 26 Industrial Machinery Market by Region, 2023-2033 (US$ Bn, AGR (%), CAGR (%))
Table 27 Motor Vehicles Market by Region, 2023-2033 (US$ Bn, AGR (%), CAGR (%))
Table 28 HVAC Equipment Market by Region, 2023-2033 (US$ Bn, AGR (%), CAGR (%))
Table 29 Aerospace & Transportation Market by Region, 2023-2033 (US$ Bn, AGR (%), CAGR (%))
Table 30 Household Appliances Market by Region, 2023-2033 (US$ Bn, AGR (%), CAGR (%))
Table 31 Other Application Market by Region, 2023-2033 (US$ Bn, AGR (%), CAGR (%))
Table 32 Electric Motors Market Forecast by Region, 2023-2033 (US$ Billion, AGR%, CAGR%)
Table 33 North America Electric Motors Market by Value, 2023-2033 (US$ Bn, AGR (%), CAGR (%))
Table 34 North America Electric Motors Market by Country, 2023-2033 (US$ Bn, AGR (%), CAGR (%))
Table 35 North America Electric Motors Market by Type, 2023-2033 (US$ Bn, AGR (%), CAGR (%))
Table 36 North America Electric Motors Market by Power Output, 2023-2033 (US$ Bn, AGR (%), CAGR (%))
Table 37 North America Electric Motors Market by Voltage, 2023-2033 (US$ Bn, AGR (%), CAGR (%))
Table 38 North America Electric Motors Market by Power Rating, 2023-2033 (US$ Bn, AGR (%), CAGR (%))
Table 39 North America Electric Motors Market by Application, 2023-2033 (US$ Bn, AGR (%), CAGR (%))
Table 40 US Electric Motors Market by Value, 2023-2033 (US$ Bn, AGR (%), CAGR (%))
Table 41 Canada Electric Motors Market by Value, 2023-2033 (US$ Bn, AGR (%), CAGR (%))
Table 42 Europe Electric Motors Market by Value, 2023-2033 (US$ Bn, AGR (%), CAGR (%))
Table 43 Europe Electric Motors Market by Country, 2023-2033 (US$ Bn, AGR (%), CAGR (%))
Table 44 Europe Electric Motors Market by Type, 2023-2033 (US$ Bn, AGR (%), CAGR (%))
Table 45 Europe Electric Motors Market by Power Output, 2023-2033 (US$ Bn, AGR (%), CAGR (%))
Table 46 Europe Electric Motors Market by Voltage, 2023-2033 (US$ Bn, AGR (%), CAGR (%))
Table 47 Europe Electric Motors Market by Power Rating, 2023-2033 (US$ Bn, AGR (%), CAGR (%))
Table 48 Europe Electric Motors Market by Application, 2023-2033 (US$ Bn, AGR (%), CAGR (%))
Table 49 Germany Electric Motors Market by Value, 2023-2033 (US$ Bn, AGR (%), CAGR (%))
Table 50 Italy Electric Motors Market by Value, 2023-2033 (US$ Bn, AGR (%), CAGR (%))
Table 51 France Electric Motors Market by Value, 2023-2033 (US$ Bn, AGR (%), CAGR (%))
Table 52 Hungary Electric Motors Market by Value, 2023-2033 (US$ Bn, AGR (%), CAGR (%))
Table 53 Switzerland Electric Motors Market by Value, 2023-2033 (US$ Bn, AGR (%), CAGR (%))
Table 54 Rest of Europe Electric Motors Market by Value, 2023-2033 (US$ Bn, AGR (%), CAGR (%))
Table 55 Asia-Pacific Electric Motors Market by Value, 2023-2033 (US$ Bn, AGR (%), CAGR (%))
Table 56 Asia-Pacific Electric Motors Market by Country, 2023-2033 (US$ Bn, AGR (%), CAGR (%))
Table 57 Asia-Pacific Electric Motors Market by Type, 2023-2033 (US$ Bn, AGR (%), CAGR (%))
Table 58 Asia-Pacific Electric Motors Market by Power Output, 2023-2033 (US$ Bn, AGR (%), CAGR (%))
Table 59 Asia-Pacific Electric Motors Market by Voltage, 2023-2033 (US$ Bn, AGR (%), CAGR (%))
Table 60 Asia-Pacific Electric Motors Market by Power Rating, 2023-2033 (US$ Bn, AGR (%), CAGR (%))
Table 61 Asia-Pacific Electric Motors Market by Application, 2023-2033 (US$ Bn, AGR (%), CAGR (%))
Table 62 China Electric Motors Market by Value, 2023-2033 (US$ Bn, AGR (%), CAGR (%))
Table 63 India Electric Motors Market by Value, 2023-2033 (US$ Bn, AGR (%), CAGR (%))
Table 64 Japan Electric Motors Market by Value, 2023-2033 (US$ Bn, AGR (%), CAGR (%))
Table 65 South Korea Electric Motors Market by Value, 2023-2033 (US$ Bn, AGR (%), CAGR (%))
Table 66 Vietnam Electric Motors Market by Value, 2023-2033 (US$ Bn, AGR (%), CAGR (%))
Table 67 Rest of Asia-Pacific Electric Motors Market by Value, 2023-2033 (US$ Bn, AGR (%), CAGR (%))
Table 68 Middle East & Africa Electric Motors Market by Value, 2023-2033 (US$ Bn, AGR (%), CAGR (%))
Table 69 Middle East & Africa Electric Motors Market by Country, 2023-2033 (US$ Bn, AGR (%), CAGR (%))
Table 70 Middle East & Africa Electric Motors Market by Type, 2023-2033 (US$ Bn, AGR (%), CAGR (%))
Table 71 Middle East & Africa Electric Motors Market by Power Output, 2023-2033 (US$ Bn, AGR (%), CAGR (%))
Table 72 Middle East & Africa Electric Motors Market by Voltage, 2023-2033 (US$ Bn, AGR (%), CAGR (%))
Table 73 Middle East & Africa Electric Motors Market by Power Rating, 2023-2033 (US$ Bn, AGR (%), CAGR (%))
Table 74 Middle East & Africa Electric Motors Market by Application, 2023-2033 (US$ Bn, AGR (%), CAGR (%))
Table 75 GCC Electric Motors Market by Value, 2023-2033 (US$ Bn, AGR (%), CAGR (%))
Table 76 South Africa Electric Motors Market by Value, 2023-2033 (US$ Bn, AGR (%), CAGR (%))
Table 77 Rest of Middle East & Africa Electric Motors Market by Value, 2023-2033 (US$ Bn, AGR (%), CAGR (%))
Table 78 Latin America Electric Motors Market by Value, 2023-2033 (US$ Bn, AGR (%), CAGR (%))
Table 79 Latin America Electric Motors Market by Country, 2023-2033 (US$ Bn, AGR (%), CAGR (%))
Table 80 Latin America Electric Motors Market by Type, 2023-2033 (US$ Bn, AGR (%), CAGR (%))
Table 81 Latin America Electric Motors Market by Power Output, 2023-2033 (US$ Bn, AGR (%), CAGR (%))
Table 82 Latin America Electric Motors Market by Voltage, 2023-2033 (US$ Bn, AGR (%), CAGR (%))
Table 83 Latin America Electric Motors Market by Power Rating, 2023-2033 (US$ Bn, AGR (%), CAGR (%))
Table 84 Latin America Electric Motors Market by Application, 2023-2033 (US$ Bn, AGR (%), CAGR (%))
Table 85 Brazil Electric Motors Market by Value, 2023-2033 (US$ Bn, AGR (%), CAGR (%))
Table 86 Mexico Electric Motors Market by Value, 2023-2033 (US$ Bn, AGR (%), CAGR (%))
Table 87 Rest of Latin America Electric Motors Market by Value, 2023-2033 (US$ Bn, AGR (%), CAGR (%))
Table 88 Strategic Outlook - Contract
Table 89 ABB Ltd: Key Details, (CEO, HQ, Revenue, Founded, No. of Employees, Company Type, Website, Business Segment)
Table 90 ABB Ltd: Product Benchmarking
Table 91 ABB Ltd: Strategic Outlook
Table 92 General Electric Company:Key Details, (CEO, HQ, Revenue, Founded, No. of Employees, Company Type, Website, Business Segment)
Table 93 General Electric Company: Product Benchmarking
Table 94 General Electric Company: Strategic Outlook
Table 95 Toshiba Corporation: Key Details, (CEO, HQ, Revenue, Founded, No. of Employees, Company Type, Website, Business Segment)
Table 96 Toshiba Corporation: Product Benchmarking
Table 97 Toshiba Corporation: Strategic Outlook
Table 98 Hitachi, Ltd:Key Details, (CEO, HQ, Revenue, Founded, No. of Employees, Company Type, Website, Business Segment)
Table 99 Hitachi, Ltd: Product Benchmarking
Table 100 Hitachi, Ltd: Strategic Outlook
Table 101 Robert Bosch GmbH:Key Details, (CEO, HQ, Revenue, Founded, No. of Employees, Company Type, Website, Business Segment)
Table 102 Robert Bosch GmbH: Product Benchmarking
Table 103 Robert Bosch GmbH: Strategic Outlook
Table 104 Rockwell Automation, Inc. :Key Details, (CEO, HQ, Revenue, Founded, No. of Employees, Company Type, Website, Business Segment)
Table 105 Rockwell Automation, Inc: Product Benchmarking
Table 106 Siemens AG :Key Details, (CEO, HQ, Revenue, Founded, No. of Employees, Company Type, Website, Business Segment)
Table 107 Siemens AG: Product Benchmarking
Table 108 ARC Systems, Inc.:Key Details, (CEO, HQ, Revenue, Founded, No. of Employees, Company Type, Website, Business Segment)
Table 109 ARC Systems, Inc.: Product Benchmarking
Table 110 ASMO Co. Ltd.:Key Details, (CEO, HQ, Revenue, Founded, No. of Employees, Company Type, Website, Business Segment)
Table 111 ASMO Co. Ltd.: Product Benchmarking
Table 112 Nidec Corporation: Key Details, (CEO, HQ, Revenue, Founded, No. of Employees, Company Type, Website, Business Segment)
Table 113 Nidec Corporation: Product Benchmarking
Table 114 Nidec Corporation: Strategic Outlook
Table 115 DENSO Corporation :Key Details, (CEO, HQ, Revenue, Founded, No. of Employees, Company Type, Website, Business Segment)
Table 116 DENSO Corporation: Product Benchmarking
Table 117 DENSO Corporation: Strategic Outlook
Table 118 Emerson Electric Co.:Key Details, (CEO, HQ, Revenue, Founded, No. of Employees, Company Type, Website, Business Segment)
Table 119 Emerson Electric Co: Product Benchmarking
Table 120 Maxon Motor AG:Key Details, (CEO, HQ, Revenue, Founded, No. of Employees, Company Type, Website, Business Segment)
Table 121 Maxon Motor AG: Product Benchmarking
Table 122 AMETEK, Inc.:Key Details, (CEO, HQ, Revenue, Founded, No. of Employees, Company Type, Website, Business Segment)
Table 123 AMETEK, Inc: Product Benchmarking
Table 124 AMETEK, Inc: Strategic Outlook
Table 125 Johnson Electric: Key Details, (CEO, HQ, Revenue, Founded, No. of Employees, Company Type, Website, Business Segment)
Table 126 Johnson Electric: Product Benchmarking
Table 127 Johnson Electric: Strategic Outlook
List of Figures
Figure 1 Electric Motors Market Segmentation
Figure 2 Electric Motors Market by Type: Market Attractiveness Index
Figure 3 Electric Motors Market by Power Output: Market Attractiveness Index
Figure 4 Electric Motors Market by Voltage: Market Attractiveness Index
Figure 5 Electric Motors Market by Power Rating: Market Attractiveness Index
Figure 6 Electric Motors Market by Application: Market Attractiveness Index
Figure 7 Electric Motors Market Attractiveness Index by Region
Figure 8 Electric Motors Market: Market Dynamics
Figure 1 Production of Crude Oil, Natural Gas Production & Petroleum Products
Figure 2 EV sales, cars, World, 2018-2022
Figure 1 Major Domestic Appliances Sales(in million US$)
Figure 2 Electric Motors Market: Porter’s Five Forces Analysis
Figure 3 Global Electric Motors Market Share Forecast by COVID, 2023-2033 (%)
Figure 4 Global Electric Motors Market by Region, 2023-2033 (US$ Bn, AGR (%)) (V-Shaped Recovery Scenario)
Figure 5 Global Electric Motors Market by Region, 2023-2033 (US$ Bn, AGR (%)) (U-Shaped Recovery Scenario)
Figure 6 Global Electric Motors Market by Region, 2023-2033 (US$ Bn, AGR (%)) (W-Shaped Recovery Scenario)
Figure 7 Global Electric Motors Market by Region, 2023-2033 (US$ Bn, AGR (%)) (L-Shaped Recovery Scenario)
Figure 8 Electric Motors Market: PEST Analysis
Figure 9 Electric Motors Market by Type: Market Attractiveness Index
Figure 10 Global Electric Motors Market by Type, 2023-2033 (US$ Bn, AGR (%))
Figure 11 Electric Motors Market Share Forecast by Type, 2023, 2028, 2033 (%)
Figure 12 AC motors Market by Region, 2023-2033 (US$ Bn, AGR (%))
Figure 13 AC motors Market Share Forecast by Region, 2023 & 2033 (%)
Figure 14 DC motors Market by Region, 2023-2033 (US$ Bn, AGR (%))
Figure 15 DC Motors Market Share Forecast by Region, 2023 & 2033 (%)
Figure 16 Electric Motors Market by Power Output: Market Attractiveness Index
Figure 17 Global Electric Motors Market by Power Output, 2023-2033 (US$ Bn, AGR (%))
Figure 18 Electric Motors Market Share Forecast by Power Output, 2023, 2028, 2033 (%)
Figure 19 Integral HP Output Market by Region, 2023-2033 (US$ Bn, AGR (%))
Figure 20 Integral HP Output Market Share Forecast by Region, 2023 & 2033 (%)
Figure 21 Fractional HP Output Market by Region, 2023-2033 (US$ Bn, AGR (%))
Figure 22 Fractional HP Output Market Share Forecast by Region, 2023 & 2033 (%)
Figure 23 Electric Motors Market by Voltage: Market Attractiveness Index
Figure 24 Global Electric Motors Market by Voltage, 2023-2033 (US$ Bn, AGR (%))
Figure 25 Electric Motors Market Share Forecast by Voltage, 2023, 2028, 2033 (%)
Figure 26 Low Voltage Motors Market by Region, 2023-2033 (US$ Bn, AGR (%))
Figure 27 Low Voltage Motors Market Share Forecast by Region, 2023 & 2033 (%)
Figure 28 Medium Voltage Motors Market by Region, 2023-2033 (US$ Bn, AGR (%))
Figure 29 Medium Voltage Motors Market Share Forecast by Region, 2023 & 2033 (%)
Figure 30 High Voltage Motors Market by Region, 2023-2033 (US$ Bn, AGR (%))
Figure 31 High Voltage Motors Market Share Forecast by Region, 2023 & 2033 (%)
Figure 32 Electric Motors Market by Power Rating: Market Attractiveness Index
Figure 33 Global Electric Motors Market by Power Rating, 2023-2033 (US$ Bn, AGR (%))
Figure 34 Electric Motors Market Share Forecast by Power Rating, 2023, 2028, 2033 (%)
Figure 35 <1 kW Motors Market by Region, 2023-2033 (US$ Bn, AGR (%))
Figure 36 500 kW Motors Market by Region, 2023-2033 (US$ Bn, AGR (%))
Figure 44 >500 kW Motors Market Share Forecast by Region, 2023 & 2033 (%)
Figure 45 Electric Motors Market by Application: Market Attractiveness Index
Figure 46 Global Electric Motors Market by Application, 2023-2033 (US$ Bn, AGR (%))
Figure 47 Electric Motors Market Share Forecast by Application, 2023, 2028, 2033 (%)
Figure 48 Industrial Machinery Market by Region, 2023-2033 (US$ Bn, AGR (%))
Figure 49 Industrial Machinery Market Share Forecast by Region, 2023 & 2033 (%)
Figure 50 Motor Vehicles Market by Region, 2023-2033 (US$ Bn, AGR (%))
Figure 51 Motor Vehicles Market Share Forecast by Region, 2023 & 2033 (%)
Figure 52 HVAC Equipment Market by Region, 2023-2033 (US$ Bn, AGR (%))
Figure 53 HVAC Equipment Market Share Forecast by Region, 2023 & 2033 (%)
Figure 54 Aerospace & Transportation Market by Region, 2023-2033 (US$ Bn, AGR (%))
Figure 55 Aerospace & Household Appliances Market Share Forecast by Region, 2023 & 2033 (%)
Figure 56 Household Appliances Market by Region, 2023-2033 (US$ Bn, AGR (%))
Figure 57 Household Appliances Market Share Forecast by Region, 2023 & 2033 (%)
Figure 58 Other Application Market by Region, 2023-2033 (US$ Bn, AGR (%))
Figure 59 Others Market Share Forecast by Region, 2023 & 2033 (%)
Figure 60 Electric Motors Market Forecast by Region 2023 and 2033 (Revenue, CAGR%)
Figure 61 Electric Motors Market Share Forecast by Region 2023, 2028, 2033 (%)
Figure 62 Electric Motors Market by Region, 2023-2033 (US$ Billion, AGR %)
Figure 63 North America Electric Motors Market Attractiveness Index
Figure 64 North America Electric Motors Market by Region, 2023, 2028 & 2033 (US$ Billion)
Figure 65 North America Electric Motors Market by Value, 2023-2033 (US$ Bn, AGR (%))
Figure 66 North America Electric Motors Market by Country, 2023-2033 (US$ Bn, AGR (%))
Figure 67 North America Electric Motors Market Share Forecast by Country, 2023 & 2033 (%)
Figure 68 North America Electric Motors Market by Type, 2023-2033 (US$ Bn, AGR (%))
Figure 69 North America Electric Motors Market Share Forecast Type, 2023 & 2033 (%)
Figure 70 North America Electric Motors Market by Power Output, 2023-2033 (US$ Bn, AGR (%))
Figure 71 North America Electric Motors Market Share Forecast by Power Output, 2023 & 2033 (%)
Figure 72 North America Electric Motors Market by Voltage, 2023-2033 (US$ Bn, AGR (%))
Figure 73 North America Electric Motors Market Share Forecast by Voltage, 2023 & 2033 (%)
Figure 74 North America Electric Motors Market by Power Rating, 2023-2033 (US$ Bn, AGR (%))
Figure 75 North America Electric Motors Market Share Forecast by Power Rating, 2023 & 2033 (%)
Figure 76 North America Electric Motors Market by Application, 2023-2033 (US$ Bn, AGR (%))
Figure 77 North America Electric Motors Market Share Forecast by Application, 2023 & 2033 (%)
Figure 78 US Electric Motors Market by Value, 2023-2033 (US$ Bn, AGR (%))
Figure 79 Canada Electric Motors Market by Value, 2023-2033 (US$ Bn, AGR (%))
Figure 80 Europe Electric Motors Market Attractiveness Index
Figure 81 Europe Electric Motors Market by Region, 2023, 2028 & 2033 (US$ Billion)
Figure 82 Europe Electric Motors Market by Value, 2023-2033 (US$ Bn, AGR (%))
Figure 83 Europe Electric Motors Market by Country, 2023-2033 (US$ Bn, AGR (%))
Figure 84 Europe Electric Motors Market Share Forecast by Country, 2023 & 2033 (%)
Figure 85 Europe Electric Motors Market by Type, 2023-2033 (US$ Bn, AGR (%))
Figure 86 Europe Electric Motors Market Share Forecast Type, 2023 & 2033 (%)
Figure 87 Europe Electric Motors Market by Power Output, 2023-2033 (US$ Bn, AGR (%))
Figure 88 Europe Electric Motors Market Share Forecast by Power Output, 2023 & 2033 (%)
Figure 89 Europe Electric Motors Market by Voltage, 2023-2033 (US$ Bn, AGR (%))
Figure 90 Europe Electric Motors Market Share Forecast by Voltage, 2023 & 2033 (%)
Figure 91 Europe Electric Motors Market by Power Rating, 2023-2033 (US$ Bn, AGR (%))
Figure 92 Europe Electric Motors Market Share Forecast by Power Rating, 2023 & 2033 (%)
Figure 93 Europe Electric Motors Market by Application, 2023-2033 (US$ Bn, AGR (%))
Figure 94 Europe Electric Motors Market Share Forecast by Application, 2023 & 2033 (%)
Figure 95 Germany Electric Motors Market by Value, 2023-2033 (US$ Bn, AGR (%))
Figure 96 Italy Electric Motors Market by Value, 2023-2033 (US$ Bn, AGR (%))
Figure 97 France Electric Motors Market by Value, 2023-2033 (US$ Bn, AGR (%))
Figure 98 Hungary Electric Motors Market by Value, 2023-2033 (US$ Bn, AGR (%))
Figure 99 Switzerland Electric Motors Market by Value, 2023-2033 (US$ Bn, AGR (%))
Figure 100 Rest of Europe Electric Motors Market by Value, 2023-2033 (US$ Bn, AGR (%))
Figure 101 Asia-Pacific Electric Motors Market Attractiveness Index
Figure 102 Asia-Pacific Electric Motors Market by Region, 2023, 2028 & 2033 (US$ Billion)
Figure 103 Asia-Pacific Electric Motors Market by Value, 2023-2033 (US$ Bn, AGR (%))
Figure 104 Asia-Pacific Electric Motors Market by Country, 2023-2033 (US$ Bn, AGR (%))
Figure 105 Asia-Pacific Electric Motors Market Share Forecast by Country, 2023 & 2033 (%)
Figure 106 Asia-Pacific Electric Motors Market by Type, 2023-2033 (US$ Bn, AGR (%))
Figure 107 Asia-Pacific Electric Motors Market Share Forecast Type, 2023 & 2033 (%)
Figure 108 Asia-Pacific Electric Motors Market by Power Output, 2023-2033 (US$ Bn, AGR (%))
Figure 109 Asia-Pacific Electric Motors Market Share Forecast by Power Output, 2023 & 2033 (%)
Figure 110 Asia-Pacific Electric Motors Market by Voltage, 2023-2033 (US$ Bn, AGR (%))
Figure 111 Asia-Pacific Electric Motors Market Share Forecast by Voltage, 2023 & 2033 (%)
Figure 112 Asia-Pacific Electric Motors Market by Power Rating, 2023-2033 (US$ Bn, AGR (%))
Figure 113 Asia-Pacific Electric Motors Market Share Forecast by Power Rating, 2023 & 2033 (%)
Figure 114 Asia-Pacific Electric Motors Market by Application, 2023-2033 (US$ Bn, AGR (%))
Figure 115 Asia-Pacific Electric Motors Market Share Forecast by Application, 2023 & 2033 (%)
Figure 116 China Electric Motors Market by Value, 2023-2033 (US$ Bn, AGR (%))
Figure 117 India Electric Motors Market by Value, 2023-2033 (US$ Bn, AGR (%))
Figure 118 Japan Electric Motors Market by Value, 2023-2033 (US$ Bn, AGR (%))
Figure 119 South Korea Electric Motors Market by Value, 2023-2033 (US$ Bn, AGR (%))
Figure 120 Vietnam Electric Motors Market by Value, 2023-2033 (US$ Bn, AGR (%))
Figure 121 Rest of Asia-Pacific Electric Motors Market by Value, 2023-2033 (US$ Bn, AGR (%))
Figure 122 Middle East and Africa Electric Motors Market Attractiveness Index
Figure 123 Middle East and Africa Electric Motors Market by Region, 2023, 2028 & 2033 (US$ Billion)
Figure 124 Middle East & Africa Electric Motors Market by Value, 2023-2033 (US$ Bn, AGR (%))
Figure 125 Middle East & Africa Electric Motors Market by Country, 2023-2033 (US$ Bn, AGR (%))
Figure 126 Middle East and Africa Electric Motors Market Share Forecast by Country, 2023 & 2033 (%)
Figure 127 Middle East & Africa Electric Motors Market by Type, 2023-2033 (US$ Bn, AGR (%))
Figure 128 Middle East and Africa Electric Motors Market Share Forecast Type, 2023 & 2033 (%)
Figure 129 Middle East & Africa Electric Motors Market by Power Output, 2023-2033 (US$ Bn, AGR (%))
Figure 130 Middle East and Africa Electric Motors Market Share Forecast by Power Output, 2023 & 2033 (%)
Figure 131 Middle East & Africa Electric Motors Market by Voltage, 2023-2033 (US$ Bn, AGR (%))
Figure 132 Middle East and Africa Electric Motors Market Share Forecast by Voltage, 2023 & 2033 (%)
Figure 133 Middle East & Africa Electric Motors Market by Power Rating, 2023-2033 (US$ Bn, AGR (%))
Figure 134 Middle East and Africa Electric Motors Market Share Forecast by Power Rating, 2023 & 2033 (%)
Figure 135 Middle East & Africa Electric Motors Market by Application, 2023-2033 (US$ Bn, AGR (%))
Figure 136 Middle East and Africa Electric Motors Market Share Forecast by Application, 2023 & 2033 (%)
Figure 137 GCC Electric Motors Market by Value, 2023-2033 (US$ Bn, AGR (%))
Figure 138 South Africa Electric Motors Market by Value, 2023-2033 (US$ Bn, AGR (%))
Figure 139 Rest of Middle East & Africa Electric Motors Market by Value, 2023-2033 (US$ Bn, AGR (%))
Figure 140 Latin America Electric Motors Market Attractiveness Index
Figure 141 Latin America Electric Motors Market by Region, 2023, 2028 & 2033 (US$ Billion)
Figure 142 Latin America Electric Motors Market by Value, 2023-2033 (US$ Bn, AGR (%))
Figure 143 Latin America Electric Motors Market by Country, 2023-2033 (US$ Bn, AGR (%))
Figure 144 Latin America Electric Motors Market Share Forecast by Country, 2023 & 2033 (%)
Figure 145 Latin America Electric Motors Market by Type, 2023-2033 (US$ Bn, AGR (%))
Figure 146 Latin America Electric Motors Market Share Forecast Type, 2023 & 2033 (%)
Figure 147 Latin America Electric Motors Market by Power Output, 2023-2033 (US$ Bn, AGR (%))
Figure 148 Latin America Electric Motors Market Share Forecast by Power Output, 2023 & 2033 (%)
Figure 149 Latin America Electric Motors Market by Voltage, 2023-2033 (US$ Bn, AGR (%))
Figure 150 Latin America Electric Motors Market Share Forecast by Voltage, 2023 & 2033 (%)
Figure 151 Latin America Electric Motors Market by Power Rating, 2023-2033 (US$ Bn, AGR (%))
Figure 152 Latin America Electric Motors Market Share Forecast by Power Rating, 2023 & 2033 (%)
Figure 153 Latin America Electric Motors Market by Application, 2023-2033 (US$ Bn, AGR (%))
Figure 154 Latin America Electric Motors Market Share Forecast by Application, 2023 & 2033 (%)
Figure 155 Brazil Electric Motors Market by Value, 2023-2033 (US$ Bn, AGR (%))
Figure 156 Mexico Electric Motors Market by Value, 2023-2033 (US$ Bn, AGR (%))
Figure 157 Rest of Latin America Electric Motors Market by Value, 2023-2033 (US$ Bn, AGR (%))
Figure 158 Electric Motors Market: Company Share, 2022
Figure 159 ABB Ltd.: Net Revenue, 2018-2022 (US$ Billion, AGR%)
Figure 160 ABB Ltd.: R&D, 2018-2022 (US$ Billion, AGR%)
Figure 161 ABB Ltd.: Business Segment Revenue Share, 2022 (%)
Figure 162 General Electric Company.: Net Revenue, 2018-2022 (US$ Billion, AGR%)
Figure 163 General Electric Company.: R&D, 2018-2022 (US$ Billion, AGR%)
Figure 164 General Electric Company.: Regional Revenue Share, 2022 (%)
Figure 165 General Electric Company.: Business Segment Revenue Share, 2022 (%)
Figure 166 Toshiba Corporation.: Net Revenue, 2018-2022 (US$ Billion, AGR%)
Figure 167 Toshiba Corporation.: R&D, 2018-2022 (US$ Billion, AGR%)
Figure 168 Toshiba Corporation.: Regional Revenue Share, 2022 (%)
Figure 169 Toshiba Corporation.: Business Segment Revenue Share, 2022 (%)
Figure 170 Hitachi, Ltd.: Net Revenue, 2018-2022 (US$ Billion, AGR%)
Figure 171 Hitachi, Ltd.: Regional Revenue Share, 2022 (%)
Figure 172 Hitachi, Ltd.: Business Segment Revenue Share, 2022 (%)
Figure 173 Rockwell Automation, Inc.: Net Revenue, 2018-2022 (US$ Billion, AGR%)
Figure 174 Rockwell Automation, Inc.: R&D, 2018-2022 (US$ Billion, AGR%)
Figure 175 Rockwell Automation, Inc.: Regional Revenue Share, 2022 (%)
Figure 176 Rockwell Automation, Inc.: Business Segment Revenue Share, 2022 (%)
Figure 177 Siemens AG.: Net Revenue, 2018-2022 (US$ Billion, AGR%)
Figure 178 Siemens AG.: R&D, 2018-2022 (US$ Billion, AGR%)
Figure 179 Siemens AG.: Regional Revenue Share, 2022 (%)
Figure 180 Siemens AG.: Business Segment Revenue Share, 2022 (%)
Figure 181 Nidec Corporation.: Net Revenue, 2018-2022 (US$ Billion, AGR%)
Figure 182 Nidec Corporation.: R&D, 2018-2022 (US$ Billion, AGR%)
Figure 183 Nidec Corporation.: Regional Revenue Share, 2022 (%)
Figure 184 Nidec Corporation.: Business Segment Revenue Share, 2022 (%)
Figure 185 DENSO Corporation.: Net Revenue, 2018-2022 (US$ Billion, AGR%)
Figure 186 Emerson Electric Co.: Net Revenue, 2018-2022 (US$ Billion, AGR%)
Figure 187 Emerson Electric Co.: R&D, 2018-2022 (US$ Billion, AGR%)
Figure 188 Emerson Electric Co.: Regional Revenue Share, 2022 (%)
Figure 189 Emerson Electric Co.: Business Segment Revenue Share, 2022 (%)
Figure 190 AMETEK, Inc..: Net Revenue, 2018-2022 (US$ Billion, AGR%)
Figure 191 AMETEK, Inc.: R&D, 2018-2022 (US$ Billion, AGR%)
Figure 192 AMETEK, Inc.: Regional Revenue Share, 2022 (%)
Figure 193 AMETEK, Inc.: Business Segment Revenue Share, 2022 (%)
Figure 194 Johnson Electric.: Net Revenue, 2018-2022 (US$ Billion, AGR%)
Figure 195 Johnson Electric.: Regional Revenue Share, 2022 (%)
Figure 196 Johnson Electric.: Business Segment Revenue Share, 2022 (%)
ページTOPに戻る
本レポートと同分野(駆動・伝導・操縦装置部品)の最新刊レポート
Visiongain社の自動車・輸送分野での最新刊レポート
本レポートと同じKEY WORD(motor)の最新刊レポート
よくあるご質問
Visiongain社はどのような調査会社ですか?
英国の調査会社ヴィジョンゲイン社(Visiongain)は、通信とエネルギーのほか、自動車や化学・医薬品、金属など、広範な市場を対象に調査を行っています。自動車市場については、市場全般に関する調査のほ... もっと見る
調査レポートの納品までの日数はどの程度ですか?
在庫のあるものは速納となりますが、平均的には 3-4日と見て下さい。
但し、一部の調査レポートでは、発注を受けた段階で内容更新をして納品をする場合もあります。
発注をする前のお問合せをお願いします。
注文の手続きはどのようになっていますか?
1)お客様からの御問い合わせをいただきます。
2)見積書やサンプルの提示をいたします。
3)お客様指定、もしくは弊社の発注書をメール添付にて発送してください。
4)データリソース社からレポート発行元の調査会社へ納品手配します。
5) 調査会社からお客様へ納品されます。最近は、pdfにてのメール納品が大半です。
お支払方法の方法はどのようになっていますか?
納品と同時にデータリソース社よりお客様へ請求書(必要に応じて納品書も)を発送いたします。
お客様よりデータリソース社へ(通常は円払い)の御振り込みをお願いします。
請求書は、納品日の日付で発行しますので、翌月最終営業日までの当社指定口座への振込みをお願いします。振込み手数料は御社負担にてお願いします。
お客様の御支払い条件が60日以上の場合は御相談ください。
尚、初めてのお取引先や個人の場合、前払いをお願いすることもあります。ご了承のほど、お願いします。
データリソース社はどのような会社ですか?
当社は、世界各国の主要調査会社・レポート出版社と提携し、世界各国の市場調査レポートや技術動向レポートなどを日本国内の企業・公官庁及び教育研究機関に提供しております。
世界各国の「市場・技術・法規制などの」実情を調査・収集される時には、データリソース社にご相談ください。
お客様の御要望にあったデータや情報を抽出する為のレポート紹介や調査のアドバイスも致します。
|
|

