世界各国のリアルタイムなデータ・インテリジェンスで皆様をお手伝い

北米のPOS端末市場調査-2024年


North American POS Terminal Market Study - 2024

製品概要 この調査レポートは、2024年の北米POS端末市場を分析している。チップ生産の回復とサプライチェーン問題の緩和により、POS出荷台数は2022年には2桁の力強い伸びを示した。しかし、2023年には... もっと見る


出版社 出版年月 電子版価格 言語
IHL Group
IHLグループ
2024年3月31日 US$4,995
エンタープライズライセンス
ライセンス・価格情報
注文方法はこちら
英語

その他の価格についてはデータリソースまでお問合せください。
日本語のページは自動翻訳を利用し作成しています。
実際のレポートは英文のみでご納品いたします。


サマリー

製品概要

この調査レポートは、2024年の北米POS端末市場を分析している。チップ生産の回復とサプライチェーン問題の緩和により、POS出荷台数は2022年には2桁の力強い伸びを示した。しかし、2023年には大きな苦戦が見られた。2024年は厳しい状況だが、成長を示している。この調査レポートは、2022-2027年の北米POS端末市場に焦点を当てた65ページの調査報告書です。POS端末の出荷台数、設置台数、動向分析が含まれている。本レポートは、POSハードウェアプロバイダやPOSソフトウェアプロバイダ、メンテナンスプロバイダ、プリンタメーカー、EFTデバイスベンダー、小売業者など、北米のPOS端末市場に利害関係を持つ可能性のある企業向けに作成されています。さらに、2023年における米国の小売POSソフトウェアのトップおよびカナダの小売POSソフトウェアのトップに影響を与えた新たなトレンドや影響、今後の市場の意思決定に役立つものも取り上げています。また、出荷額とインストールベースの推定市場価値、2027年までの出荷額とインストールベースの予測も掲載しています。

市場セグメント:

13の小売市場セグメントにおける詳細な分析を提供しています:

  • 食品/スーパーマーケット
  • ドラッグストア
  • スーパーストア/ウェアハウス・クラブ(コストコ、サムズなど。)
  • 百貨店(伝統的なアンカー・ストアとディスカウント・デパートメント・チェーン)
  • カテゴリーキラー(ホームセンター、家電、ペットスーパー、書店、スポーツ用品、家具など)
  • その他専門店(モールやストリップモールを拠点とする専門店で、主にアパレル、靴、ギフトなど)
  • 量販店(ディスカウントストアを含む)
  • コンビニエンスストア/ガソリンスタンド
  • テーブルサービスレストラン(ホテルのバー/レストランを含む)
  • クイック・サービス・レストラン/ファーストフード宿泊施設
  • カジノ/クルーズ・エンターテイメント劇場、テーマパーク、スタジアム、博物館、公園

よくあるご質問

POSとは何ですか?

IHLでは、何をPOSデバイスとして分類するのか、その定義を明確に示すことが重要であると考えている。当社の分析では、POS を PC ベースのワークステーション、すなわち PC クラスのプロセッサーベース端末および LAN 利用可能端末と定義している。電子送金端末をPOSに含める人もいるかもしれないが、ここでは含めない。

今回のの調査では、PCオン・キャッシュ・ドロワー・デバイス(PCOCD)を含めているが、特定の市場が大きな影響を受けない限り、ベンダーを区別しようとはしていない。

電子レジスター(ECR)は本調査には含まれていない。POSとECRは、プロセッサーと接続性という点では境界が曖昧になっているが、機能性、拡張性、サービス性という点では明確に区別されると考えている。

調査の対象となるセグメントは?

本調査のフォーマットは、以下の10の小売市場セグメントに関する詳細な分析に基づいている:

食品/スーパーマーケットドラッグストア Superstores/Warehouse Clubs Department Storesカテゴリーキラー(ホームセンター、家電、ペットスーパー、書店、スポーツ用品、家具など)その他専門店(モールやストリップモールを拠点とする専門店で、主にアパレル、靴、ギフトなど)量販店(ディスカウントストアを含む)コンビニエンスストア/ガソリンスタンド Bar/Restaurants Quick Service/Fast Food Lodging Entertainment ? Casino/Cruise Entertainment ? Theme, Theaters, Sports

この報告書では、ラボにあるユニットはカウントしていない。

価格

エンタープライズ・ライセンス組織内および完全所有子会社内の誰もが研究にアクセスし、社内で共有できるライセンス。

IHLグループの一般に入手可能なリサーチはすべて電子ライセンスであり、購入時に選択されたライセンスタイプによって制限されます。 シングルユーザーライセンスの場合、これはリサーチを購入された方のみがリサーチを使用できることを意味します。

エンタープライズライセンスの場合、社内で自由に共有することができます。ただし、IHLグループの許可なく、購入企業以外のパートナーや他者と共有することはご遠慮ください。このライセンスは、ジョイントベンチャーやその他のパートナーシップには適用されません。完全子会社でない場合は、双方のライセンスが必要となります。

現実的には、これは次のことを意味する:

  1. 購買会社は、国際機関が購買会社の完全子会社である限り、世界中のデータや調査を社内で利用することができる。
  2. IHLグループの書面による明示的な承認なしに、データまたは調査の全部または一部をパートナーまたは顧客に配布することはできません。
  3. 購買会社は、特定のチャートなど、顧客へのプレゼンテーションにおいて、データの構成要素を引用することができる(限定的な使用)。この場合、個々のユニット情報ではなく、パーセンテージの構成要素に限定されます。IHLグループの書面による明示的な承認がない限り、単位データを外部と共有することはできません。プレゼンテーションの中でデータを引用する場合は、そのデータについてIHLグループのクレジットを明記する必要があります。
  4. 購買企業は、IHLグループの書面による承認があれば、印刷物において定性的な見積もりを参照することができます。
  5. 書面による承認が必要なすべてのリクエストは、ihl(at)ihlservices.comに提出する必要があります。

ディストリビューテッドライセンスの場合、該当する場合は、見込み顧客や潜在的な機関投資家と調査を共有することができます。 パートナーや他のベンダーと共有することはできません。


ページTOPに戻る


目次

概要

序論/背景と目的 小売セグメントの定義 使用POSの定義 使用ティアの定義

目次

トレンド、促進要因、障壁

北米POSの詳細-総市場

小売セグメントのPOS詳細

    食品/食料品
    ドラッグストア
    スーパーストア/倉庫クラブ
    百貨店
    カテゴリーキラー
    量販店
    コンビニエンスストア
    バー/レストラン
    クイックサービス/ファーストフード
    宿泊施設
    エンターテイメント カジノ&クルーズ
    エンターテイメント テーマパーク、劇場、スポーツアリーナなど

総括表

市場規模

予測

ページTOPに戻る


図表リスト

図表一覧

  • 総市場 - チェーン別店舗数 年収
  • 総市場 - POS出荷台数推移
  • 総市場 - POS設置ベース履歴
  • 食品/食料品 - チェーン別店舗数 年収
  • 食品/食料品 - POS出荷履歴
  • 食品/食料品 - POS設置ベース履歴
  • ドラッグストア - チェーン別店舗 年間売上高
  • ドラッグストア - POS出荷履歴
  • ドラッグストア - POS設置ベース履歴
  • スーパーストア/ウェアハウスクラブ - チェーン別年間売上高
  • スーパーストア/ウェアハウスクラブ - POS出荷履歴
  • スーパーストア/ウェアハウスクラブ - POS設置ベース履歴
  • 百貨店 - チェーン別店舗 年間売上高
  • 百貨店 - POS出荷履歴
  • 百貨店 - POS設置ベース履歴
  • カテゴリーキラー - チェーン別店舗 年間売上高
  • トータルマーケット - チェーン別店舗 年間売上高
  • 総市場 - POS出荷履歴
  • 総市場 - POS設置ベース履歴
  • 食品/食料品 - チェーン別店舗 年間売上高
  • 食品/食料品 - POS出荷履歴
  • 食品/食料品 - POS設置ベース履歴
  • ドラッグストア - チェーン別店舗 年間売上高
  • ドラッグストア-POS出荷台数推移
  • ドラッグストア - POS設置台数推移
  • スーパーストア/ウェアハウスクラブ - チェーン別店舗 年間売上高
  • スーパーストア/ウェアハウスクラブ - POS出荷履歴
  • スーパーストア/ウェアハウスクラブ - POS設置ベース履歴
  • 百貨店 - チェーン別店舗 年間売上高
  • 百貨店 - POS出荷履歴
  • 百貨店-POS設置ベース履歴
  • 専門ハードグッズ - チェーン別店舗 年間売上高
  • スペシャルティハードグッズ - POS出荷履歴
  • スペシャリティハードグッズ - POS設置ベース履歴
  • スペシャルティソフトグッズ - チェーン別店舗数 年収
  • スペシャルティソフトグッズ-POS出荷履歴
  • スペシャルティソフトグッズ-POS設置ベース履歴
  • 量販店-チェーン別年間売上高
  • 量販店 - POS出荷履歴
  • 量販店-POS設置ベース履歴
  • コンビニエンスストア - チェーン別店舗 年間売上高
  • コンビニエンスストア - POS出荷履歴
  • コンビニエンスストア - POS設置ベース履歴
  • バー / レストラン - チェーン別店舗 年収
  • バー/レストラン - POS出荷履歴
  • バー/レストラン - POSインストールベース履歴
  • クイックサービス/ファーストフード - チェーン別店舗 年収
  • クイックサービス/ファーストフード-POS出荷履歴
  • クイックサービス/ファーストフード-POS設置ベース履歴
  • 宿泊 - チェーン別店舗 年間売上高
  • 宿泊 - POS出荷履歴
  • 宿泊-POS設置ベース履歴
  • エンターテインメント カジノ&クルーズ - チェーン別店舗 年間売上高
  • エンターテイメント カジノ&クルーズライン - POS出荷台数推移
  • エンターテイメント カジノ&クルーズライン - POS設置ベース履歴
  • エンターテイメント テーマ、劇場、スポーツ - チェーン別店舗 年収推移
  • エンターテイメント テーマ館&スポーツ - POS出荷台数推移
  • エンターテイメント テーマ、シアター、スポーツ - POS設置ベース履歴
  • 北米全体のPOS出荷台数の歴史
  • 北米全体のPOS設置ベースの歴史
  • 北米のPOS市場規模推移 北米のPOS出荷台数:2022年~2027年予測
  • 北米のPOS設置ベースの2022年~2027年予測


ページTOPに戻る


Summary

Product Overview

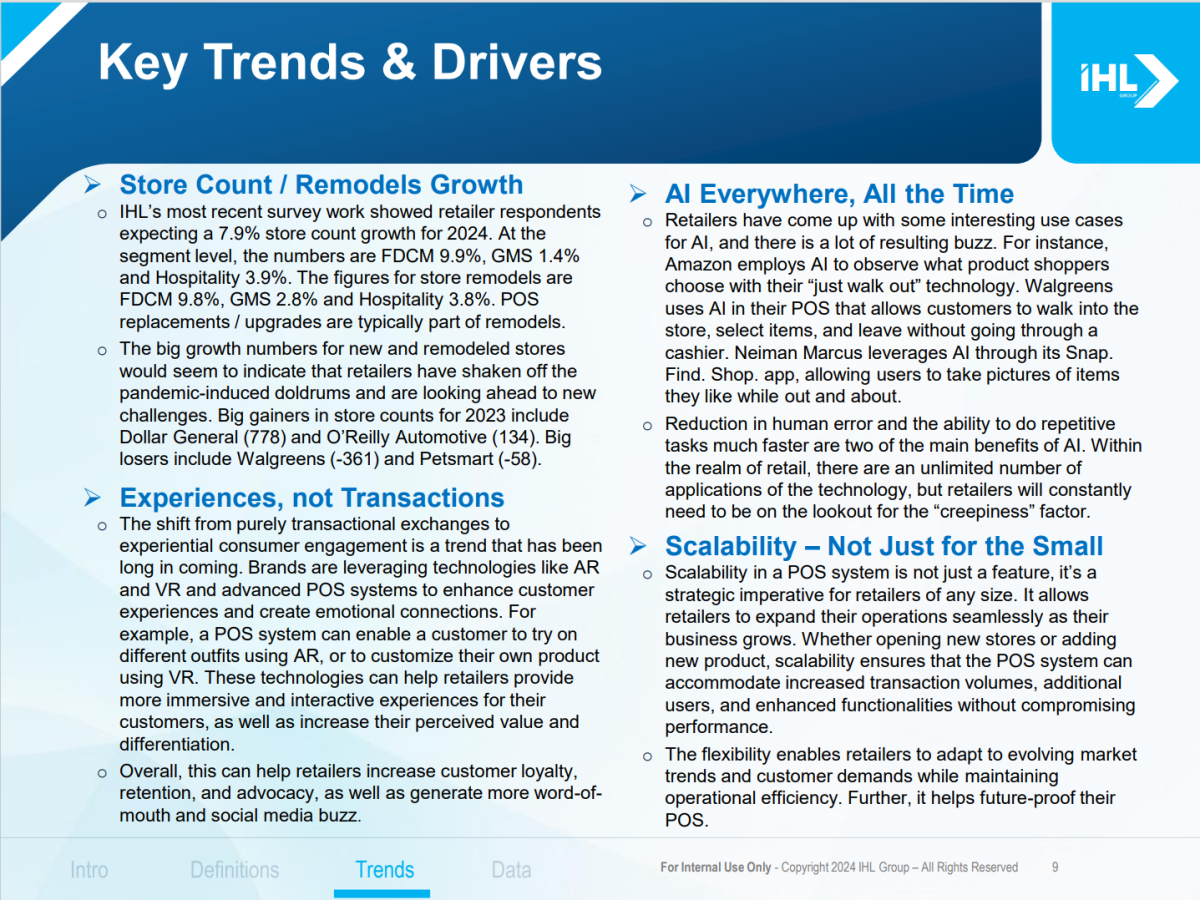
This study provides an analysis of the 2024 North America Point-of-Sale (POS) Terminal Market. With the rebound in chip production and easing of supply chain issues, POS Shipments saw strong double-digit growth in 2022. But in 2023 we saw significant struggles. 2024 is looking challenging but shows growth. This 65-page study focuses on the North America Point-of-Sale (POS) Terminal Market for 2022-2027. It includes shipment, installed base and trends analyses of POS devices. The report is designed for use by POS Hardware Providers and POS Software Providers, Maintenance Providers, Printer Manufacturers, EFT device vendors, Retailers and others who might have a vested interest in the North American Point-of-Sale Terminal Market. Additionally, the report covers emerging trends and influences that affected the top Retail POS Software in US as well as the top Retail POS Software in Canada in 2023 and those that will help form market decisions in the future. It also includes estimated market value for shipments and installed base and a forecast for shipments and installed base through 2027.

Market Segments:

We provide detailed analysis in 13 retail market segments:

  • Food/Supermarkets
  • Drug Stores
  • Superstores/Warehouse Clubs (Costco, Sam’s, etc. Includes Wal-Mart and Target Supercenters)
  • Department Stores (Traditional anchor stores and discount department chains)
  • Category Killers (Home Centers, Electronics, Pet Superstores, Bookstores, Sporting Goods, Furniture, etc.)
  • Specialty Other (mall and strip-mall based Specialty Stores, predominantly apparel, shoes and gifts)
  • Mass Merchandisers (includes Discount Stores)
  • Convenience Stores/Gas Stations
  • Table Service Restaurants (Including hotel bar/restaurant)
  • Quick Service Restaurants/Fast Food Lodging
  • Casino/Cruise Entertainment: Theaters, Theme Parks, Stadiums, Museums, Parks

FAQs

What do you define as POS?

At IHL we believe it is important that we state clearly the definitions of what we are classifying as a POS device. For the purposes of our analysis, we are defining POS as PC-based workstations, namely PC-class Processor-based and LAN-available terminals. Although others might include Electronic Funds Terminals as POS, we do not include them here.

In our research, we do include PC on Cash Drawer Devices (PCOCD), however, we do not attempt to distinguish between vendors unless a particular market is affected significantly.

We do not include Electronic Cash Registers (ECR’s) in our study. Although the lines have blurred as to POS and ECR in terms of processors and connectivity, we believe there is a clear distinction in functionality, expandability, and serviceability between the devices.

What segments are included in the study?

Our format for the study is based on detailed analysis of the following 10 retail market segments:

Food/Supermarkets Drug Stores Superstores/Warehouse Clubs Department Stores Category Killers (Home Centers, Electronics, Pet Superstores, Bookstores, Sporting Goods, Furniture, etc.) Specialty Other (mall and strip-mall based Specialty Stores, predominantly apparel, shoes and gifts) Mass Merchandisers (includes Discount Stores) Convenience Stores/Gas Stations Bar/Restaurants Quick Service/Fast Food Lodging Entertainment – Casino/Cruise Entertainment – Theme, Theaters, Sports

For the purposes of this report we do not count units that are in labs; we only count those in pilot or in rollout.

Pricing

Enterprise License – a license that allows for the research to be accessed and shared internally with anyone else within the organization and wholly owned subsidiaries.

All of IHL Group’s generally available research are electronic licenses and are limited by the license type chosen for purchase.  For Single User Licenses this means that the person buying the research is the only person to use the research.

For Enterprise Licenses, these can be shared freely within the company. We only ask that this information not be shared with partners or others outside the purchasing company without authorization from IHL Group. The license does not extend to joint ventures or other partnerships. If the relationship is not a wholly-owned subsidiary, then both parties would need a license.

Practically, this implies the following:

  1. The purchasing company can use the data and research worldwide internally as long as the international organizations are wholly owned subsidiaries of the purchasing company.
  2. The data or any research cannot be distributed in whole or in part to partners or customers without express written approval from IHL Group.
  3. The purchasing company may quote components of the data (limited use) in presentations to customers such as specific charts. This is limited to percentage components, not individual unit information. Unit data cannot be shared externally without express written approval from IHL Group. All references to the data in presentations should include credit to IHL Group for the data.
  4. The purchasing company can reference qualitative quotes in printed material with written approval from IHL Group.
  5. All requests requiring written approval should be submitted to ihl(at)ihlservices.com and will be reviewed within one business day.

For Distributed Licenses, if applicable, the research can be shared with prospective customers and potential institutional investors.  It cannot be shared with partners or other vendors who should be purchasing their own licenses.


ページTOPに戻る


Table of Contents

INTRODUCTION

Introduction / Background and Objectives Retail Segment Definitions Used POS Definitions Used Tier Definitions

TABLE OF CONTENTS

TRENDS, DRIVERS & BARRIERS

NORTH AMERICAN POS DETAILS – TOTAL MARKET

RETAIL SEGMENT POS DETAILS

  • Food / Grocery
  • Drug Stores
  • Superstores / Warehouse Clubs
  • Department Stores
  • Category Killers
  • Mass Merchandisers
  • Convenience Stores
  • Bar / Restaurant
  • Quick Service / Fast Food
  • Lodging
  • Entertainment: Casinos & Cruise Lines
  • Entertainment: Theme Parks, Theaters, Sports Arenas, etc

SUMMARY TABLES

MARKET SIZING

FORECASTS

ページTOPに戻る


List of Tables/Graphs

List of Figures

  • Total Market – Stores by Chain Annual Revenue
  • Total Market – POS Shipments History
  • Total Market – POS Installed Base History
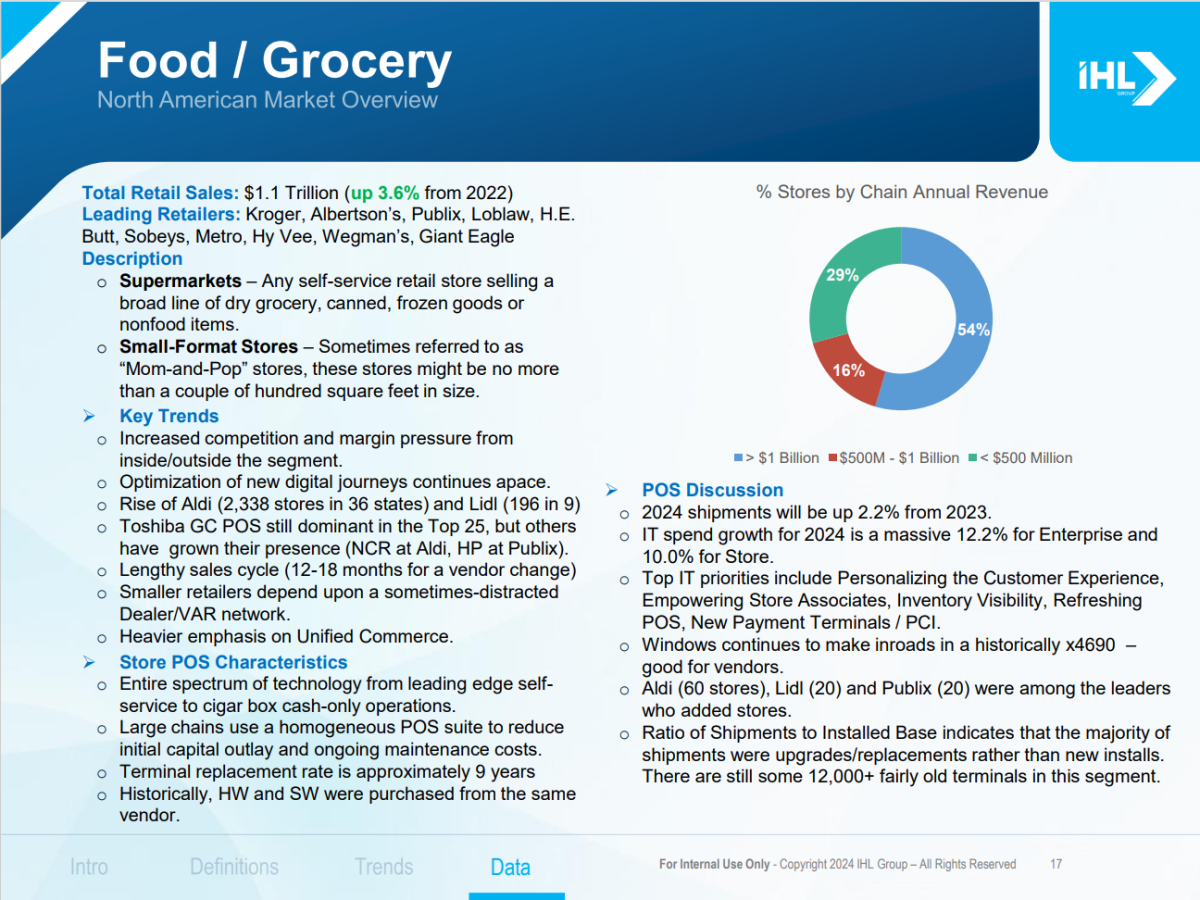
  • Food / Grocery – Stores by Chain Annual Revenue
  • Food / Grocery – POS Shipments History
  • Food / Grocery – POS Installed Base History
  • Drug Stores – Stores by Chain Annual Revenue
  • Drug Stores – POS Shipments History
  • Drug Stores – POS Installed Base History
  • Superstore / Warehouse Clubs – Stores by Chain Annual Revenue
  • Superstore / Warehouse Clubs – POS Shipments History
  • Superstore / Warehouse Clubs – POS Installed Base History
  • Department Stores – Stores by Chain Annual Revenue
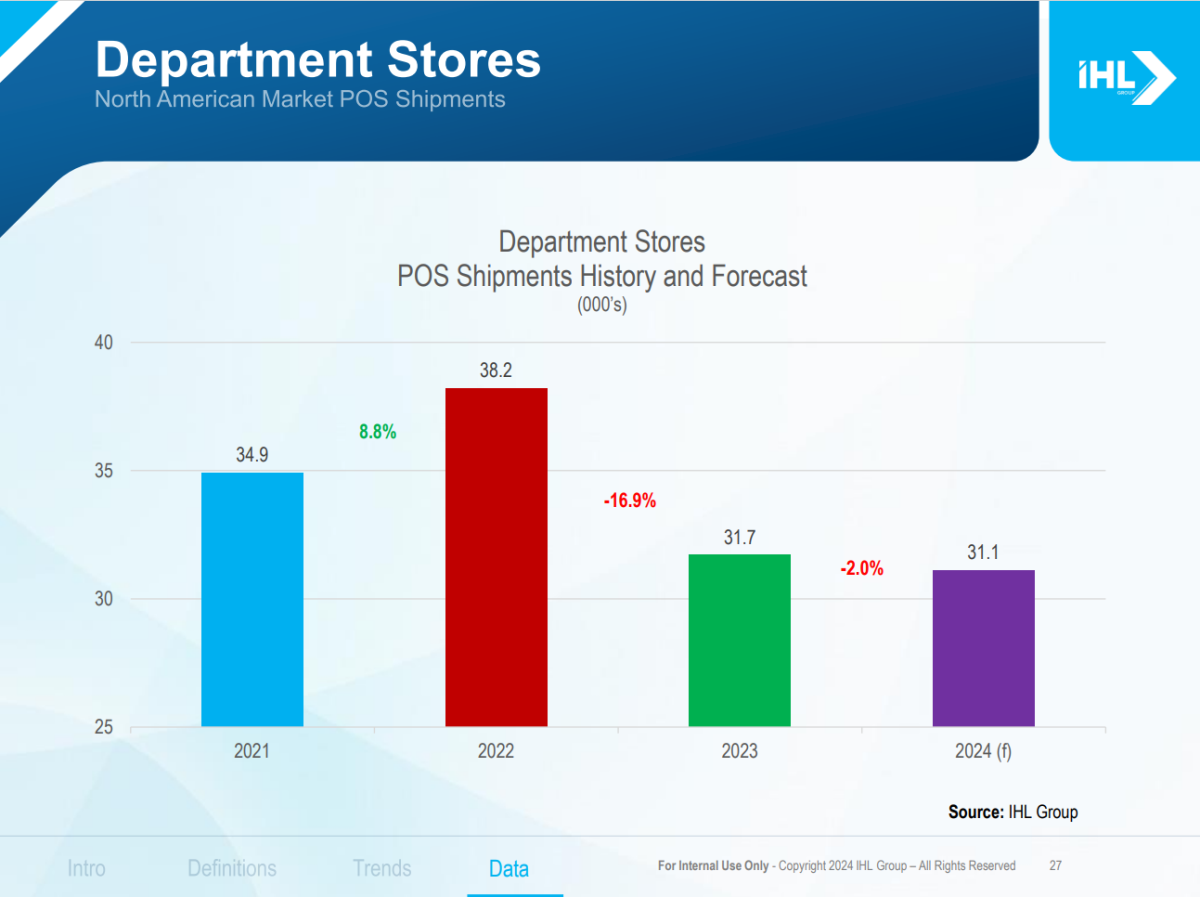
  • Department Stores – POS Shipments History
  • Department Stores – POS Installed Base History
  • Category Killers – Stores by Chain Annual Revenue
  • Total Market – Stores by Chain Annual Revenue
  • Total Market – POS Shipments History
  • Total Market – POS Installed Base History
  • Food / Grocery – Stores by Chain Annual Revenue
  • Food / Grocery – POS Shipments History
  • Food / Grocery – POS Installed Base History
  • Drug Stores – Stores by Chain Annual Revenue
  • Drug Stores – POS Shipments History
  • Drug Stores – POS Installed Base History
  • Superstore / Warehouse Clubs – Stores by Chain Annual Revenue
  • Superstore / Warehouse Clubs – POS Shipments History
  • Superstore / Warehouse Clubs – POS Installed Base History
  • Department Stores – Stores by Chain Annual Revenue
  • Department Stores – POS Shipments History
  • Department Stores – POS Installed Base History
  • Specialty Hard Goods – Stores by Chain Annual Revenue
  • Specialty Hard Goods – POS Shipments History
  • Specialty Hard Goods – POS Installed Base History
  • Specialty Softgoods – Stores by Chain Annual Revenue
  • Specialty Softgoods – POS Shipments History
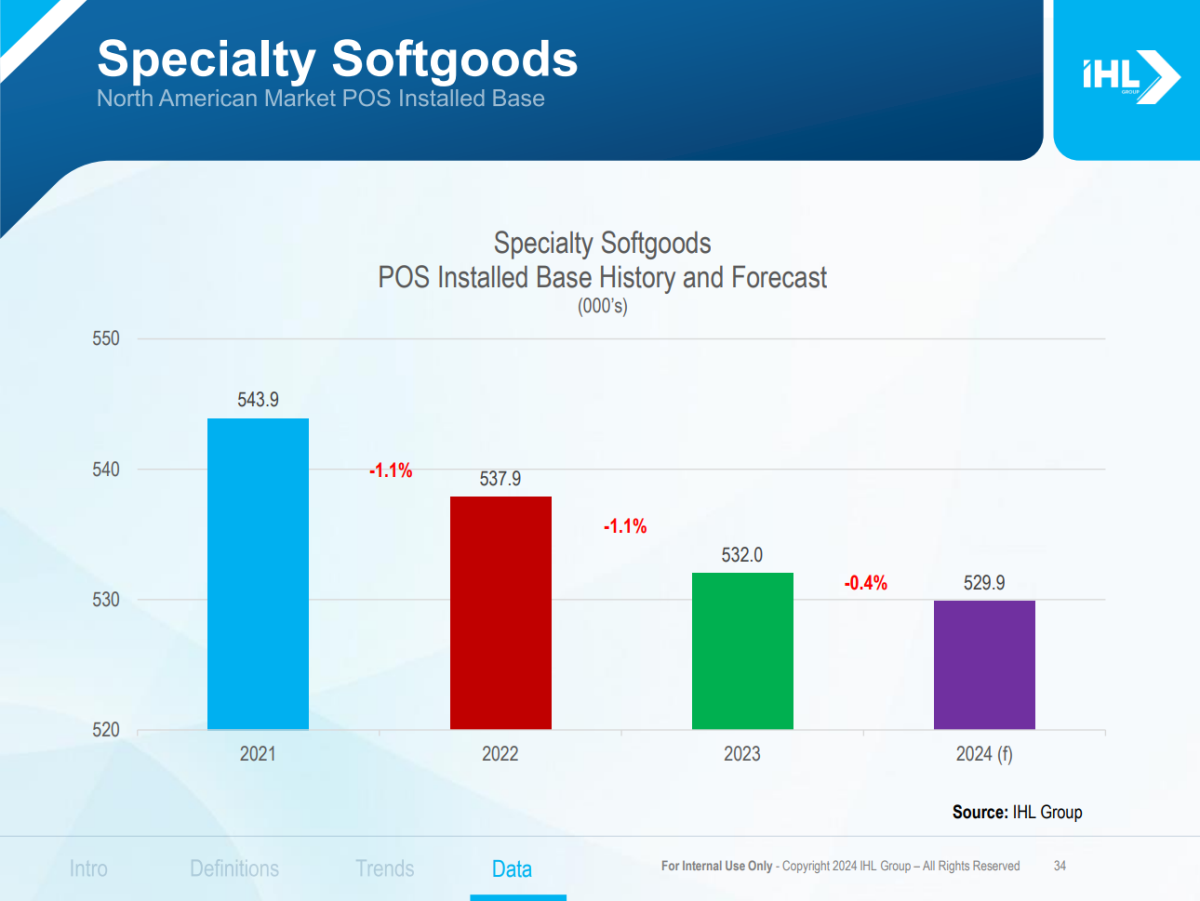
  • Specialty Softgoods – POS Installed Base History
  • Mass Merchandisers – Stores by Chain Annual Revenue
  • Mass Merchandisers – POS Shipments History
  • Mass Merchandisers – POS Installed Base History
  • Convenience Stores – Stores by Chain Annual Revenue
  • Convenience Stores – POS Shipments History
  • Convenience Stores – POS Installed Base History
  • Bar / Restaurants – Stores by Chain Annual Revenue
  • Bar / Restaurants – POS Shipments History
  • Bar / Restaurants – POS Installed Base History
  • Quick Service / Fast Food – Stores by Chain Annual Revenue
  • Quick Service / Fast Food – POS Shipments History
  • Quick Service / Fast Food – POS Installed Base History
  • Lodging – Stores by Chain Annual Revenue
  • Lodging – POS Shipments History
  • Lodging – POS Installed Base History
  • Entertainment: Casinos & Cruise Lines – Stores by Chain Annual Revenue
  • Entertainment: Casinos & Cruise Lines – POS Shipments History
  • Entertainment: Casinos & Cruise Lines – POS Installed Base History
  • Entertainment: Theme, Theaters & Sports – Stores by Chain Annual Revenue
  • Entertainment: Theme, Theaters & Sports – POS Shipments History
  • Entertainment: Theme, Theaters & Sports – POS Installed Base History
  • North American Overall POS Shipments History
  • North American Overall POS Installed Base History
  • North American POS Market Sizing North American POS Shipments Forecast for 2022 – 2027
  • North American POS Installed Base Forecast for 2022 – 2027


ページTOPに戻る

ご注文は、お電話またはWEBから承ります。お見積もりの作成もお気軽にご相談ください。

webからのご注文・お問合せはこちらのフォームから承ります

本レポートと同分野(店舗)の最新刊レポート


よくあるご質問


IHL Group社はどのような調査会社ですか?


IHLグループ (IHL Group) は、米国テネシー州に本社をおき、世界の小売業とサービス業向けのIT技術を専門に調査しています。 もっと見る


調査レポートの納品までの日数はどの程度ですか?


在庫のあるものは速納となりますが、平均的には 3-4日と見て下さい。
但し、一部の調査レポートでは、発注を受けた段階で内容更新をして納品をする場合もあります。
発注をする前のお問合せをお願いします。


注文の手続きはどのようになっていますか?


1)お客様からの御問い合わせをいただきます。
2)見積書やサンプルの提示をいたします。
3)お客様指定、もしくは弊社の発注書をメール添付にて発送してください。
4)データリソース社からレポート発行元の調査会社へ納品手配します。
5) 調査会社からお客様へ納品されます。最近は、pdfにてのメール納品が大半です。


お支払方法の方法はどのようになっていますか?


納品と同時にデータリソース社よりお客様へ請求書(必要に応じて納品書も)を発送いたします。
お客様よりデータリソース社へ(通常は円払い)の御振り込みをお願いします。
請求書は、納品日の日付で発行しますので、翌月最終営業日までの当社指定口座への振込みをお願いします。振込み手数料は御社負担にてお願いします。
お客様の御支払い条件が60日以上の場合は御相談ください。
尚、初めてのお取引先や個人の場合、前払いをお願いすることもあります。ご了承のほど、お願いします。


データリソース社はどのような会社ですか?


当社は、世界各国の主要調査会社・レポート出版社と提携し、世界各国の市場調査レポートや技術動向レポートなどを日本国内の企業・公官庁及び教育研究機関に提供しております。
世界各国の「市場・技術・法規制などの」実情を調査・収集される時には、データリソース社にご相談ください。
お客様の御要望にあったデータや情報を抽出する為のレポート紹介や調査のアドバイスも致します。


詳細検索

このレポートへのお問合せ

03-3582-2531

電話お問合せもお気軽に


2024/12/20 10:28

158.95 円

165.20 円

201.28 円

ページTOPに戻る