商業用温室市場レポート:2024-2034
Commercial Greenhouse Market Report 2024-2034
レポート詳細
商業用温室市場レポート 2024-2034年:この調査レポートは、業界とその基礎となる原動力をより良く理解することを望む、新たな収益ポケットを目指す大手企業にとって貴重なものとなるで... もっと見る
※上記価格は部署ライセンス(Departmental licence)価格です。
その他の価格についてはデータリソースまでお問合せください。
日本語のページは自動翻訳を利用し作成しています。
実際のレポートは英文のみでご納品いたします。

|

|
サマリー
レポート詳細
商業用温室市場レポート 2024-2034年:この調査レポートは、業界とその基礎となる原動力をより良く理解することを望む、新たな収益ポケットを目指す大手企業にとって貴重なものとなるでしょう。異業種への進出や新規地域での既存事業の拡大を目指す企業にも有用です。
持続可能な農業の実践と食料安全保障に対する懸念の高まり
商業用温室市場は、いくつかの重要な要因によって大きな成長を遂げている。持続可能な農業慣行に対する需要の高まりは、食糧安全保障と環境の持続可能性に対する懸念の高まりと相まって、世界的に温室技術の採用を促進している。さらに、温室設計、自動化、気候制御システムの進歩が生産性と効率を高め、市場拡大をさらに促進している。
商業用温室市場の成長を促す主な要因の一つは、地元産の新鮮な農産物に対する消費者の嗜好の高まりである。温室は幅広い作物の通年栽培を可能にし、伝統的農業の季節的制約を緩和し、高品質の果物、野菜、ハーブの安定供給を保証する。さらに、温室で栽培された農産物は、その新鮮さ、風味、環境への影響の軽減から、市場ではしばしばプレミアム価格がつけられる。
同市場は、バリューチェーン全体の関係者に数多くの機会を提供している。垂直農法、水耕栽培、アクアポニックスなどの温室技術の革新は、作物栽培と多様化のための新たな道を提供する。さらに、研究開発への投資の増加は、資源利用と作物収量を最適化できる高度な温室システムの開発を促進している。さらに、持続可能な農業の実践を促進することを目的とした政府の好意的な政策や補助金が、市場成長を促す環境を作り出している。
材料費の上昇が市場成長の妨げに
世界の温室建設は、地政学的緊張やパンデミックの余震によって資材コストが上昇する中、困難に直面している。市場の80~90%を占めるオランダの建設業者は、特に鉄鋼、アルミニウム、ガラス価格の高騰により、建設費が20~30%上昇すると予測している。ヒートポンプやソーラーパネルのような革新的技術が、持続可能なエネルギー管理のソリューションとして台頭し、業界の混乱を緩和するための協力と技術的進歩が求められる。
例えば、2022年6月6日、欧州全土の温室栽培食品生産部門は、エネルギー価格と肥料価格の高騰により大きな困難に直面している。英国では、キュウリとピーマンの生産量が半減すると予想されており、ガス価格の高騰と労働力不足の影響を受けて、まったく収穫しないことを選択する農家もある。
市場調査レポートを購入する前にすべき質問とは?
-
商業用温室市場はどのように進化しているのか?
-
何が商業用温室市場を牽引し、また抑制しているのか?
-
各商業用温室のサブマーケット分野は予測期間中にどのように成長し、2034年にはどれくらいの売上を占めるようになるのか?
-
2024年から2034年にかけて、商業用温室の各サブマーケットの市場シェアはどのように推移するのか?
-
2024年から2034年にかけて、市場全体を牽引する主な要因は何か?
-
主要な商業用温室市場は、マクロ経済の動きに幅広く追随するのか、それとも個々の国の市場が他を凌駕するのか。
-
2034年までに各国市場のシェアはどのように変化し、どの地域が2034年の市場をリードするのか。
-
主要プレーヤーと予測期間中の見通しは?
-
これらの大手企業の商業用温室プロジェクトとは?
-
2024年から2034年の間に、業界はどのように発展していくのか?現在、そして今後10年間に実施される商業用温室プロジェクトにはどのような影響があるのか?
-
商業用温室市場をさらに拡大するためには、製品の商品化がより必要なのでしょうか?
-
商業用温室市場はどこに向かっているのか、また、どのようにして市場の最前線に立つことができるのか。
-
新商品や新サービスに最適な投資方法とは?
-
企業を新たな成長軌道に乗せ、C-suiteに移行させるための重要な展望とは?
このことが、現在、そして今後10年間の商業用温室市場にどのような影響を与えるかを見極める必要がある:
-
136の表と187の図表で構成される421ページのレポート。
-
このレポートでは、業界の主要な収益分野に焦点を当てているため、今すぐそこにターゲットを絞ることができます。
-
世界、地域、国の売上高と成長に関する詳細な分析が含まれている。
-
競合他社が成功した主なトレンド、変化、収益予測をハイライトします。
本レポートは、商業用温室市場が今後10年間、COVID-19の景気後退と好転の変動に合わせてどのように発展するかを今に伝えるものである。この市場は、過去10年間のどの時点よりも今が重要である。
2034年までの予測やその他の分析から、商業的な展望が明らかになる
-
2034年までの収益予測に加え、最近の実績、成長率、市場シェアも提供している。
-
ビジネスの展望や展開など、独自の分析が掲載されている。
-
質的分析(市場力学、促進要因、機会、阻害要因、課題を含む)、コスト構造、商業用温室価格上昇の影響、最近の動向をご覧ください。
本レポートには、COVID-19が業界と貴社にどのような影響を与えるかについてのデータ分析と貴重な洞察が含まれている。本レポートでは、COVID-19の4つの回収パターンとその影響、すなわち「V」、「L」、「W」、「U」について論じている。
レポート対象セグメント
市場規模別セグメント
コンポーネント別市場セグメント
製品タイプ別市場セグメント
グレージング材タイプ別市場セグメント
-
ポリエチレンフィルム
-
ポリカーボネートシート
-
アクリル板
-
ガラス素材
-
その他のグレージング材
システム別市場セグメント
-
照明システム
-
灌漑システム
-
クライメートコントロールシステム
-
システム制御
-
コミュニケーションシステム
-
その他システム
世界市場全体とセグメント別の収益予測に加え、4つの地域と20の主要国市場の収益予測も掲載しています:
北米
欧州
-
ドイツ
-
オランダ
-
トルコ
-
イタリア
-
スペイン
-
その他の欧州
アジア太平洋
-
中国
-
日本
-
インド
-
オーストラリア
-
韓国
-
その他のアジア太平洋
ラテンアメリカ
中東・アフリカ
また、2024年から2034年までの商業用温室市場の主要企業のプロファイルも掲載している。
主要企業と市場成長の可能性
-
Agra-tech, Inc.
-
Argus Control Systems (Acquired by CEL Group of Companies)
-
Berry Global Group, Inc.
-
Certhon (Acquired by Denso)
-
Everlight Electronics Co Ltd
-
GreenTech Agro LLC
-
Harnois Greenhouses Inc.
-
Heliospectra AB
-
Hort Americas, LLC
-
Idaia Group
-
Logiqs BV
-
LumiGrow, Inc.
-
Nexus Greenhouse Systems (Acquired by Gibraltar Industries)
-
Plastika Kritis S.A.
-
Richel Group
-
Rough Brothers, Inc.
-
Signify Holding B.V
-
Stuppy Greenhouse, Inc.
2024年から2034年までの商業用温室市場の世界全体の売上高は、金額ベースで2024年に410億9000万米ドルを突破する。2034年まで力強い収益成長を予測。当調査では、最も大きな可能性を秘めた組織を特定しています。彼らの能力、進歩、商業的展望を発見し、あなたが一歩先を行くのを支援します。
商業用温室市場、2024-2034年レポートはどのように役立つのか?
要約すると、420ページを超えるこのレポートは、以下の知識を提供する:
-
商業用温室市場、2024年から2034年までの収益予測 世界および地域レベルで、サイズ、構成要素、製品タイプ、グレージング材タイプ、システムの各予測を掲載 - 業界の将来性を発見し、投資と収益に最も有利な場所を見つけることができます。
-
4つの地域と20の主要国市場の2034年までの収益予測 - 北米、ヨーロッパ、アジア太平洋、ラテンアメリカ、中東・アフリカの商業用温室市場の2024年から2034年までの予測をご覧ください。また、米国、カナダ、ブラジル、ドイツ、オランダ、トルコ、中国、インド、日本、オーストラリアなどの著名経済圏の市場も予測しています。
-
2024年から2034年までの商業用温室市場に関わる主要企業18社の企業プロファイルを含む。
独自の予測による定量的・定性的分析をご覧ください。私たちのレポートだけに含まれる情報を入手し、貴重なビジネスインテリジェンスで情報を得ることができます。
他にはない情報
私たちの新しいレポートがあれば、知識に遅れをとったり、チャンスを逃したりする可能性が低くなります。弊社のレポートが貴社の調査、分析、意思決定にどのように役立つかをご覧ください。Visiongainの調査は、2024年から2034年の商業用温室市場の商業分析を必要とするすべての人、市場をリードする企業のためのものです。データ、トレンド、予測をご覧いただけます。
ページTOPに戻る
目次
目次
1 レポート概要
1.1 研究の目的
1.2 業務用温室市場の紹介
1.3 本レポートの内容
1.4 本レポートを読むべき理由
1.5 本分析レポートが回答する主な質問
1.6 本レポートは誰のためのものか?
1.7 方法論
1.7.1 市場の定義
1.7.2 市場評価・予測手法
1.7.3 データの検証
1.7.3.1 一次調査
1.7.3.2 セカンダリーリサーチ
1.8 よくある質問(FAQ)
1.9 Visiongainの関連レポート
1.10 Visiongainについて
2 エグゼクティブ・サマリー
3 市場概要
3.1 主要な調査結果
3.2 市場ダイナミクス
3.2.1 市場牽引要因
3.2.1.1 温室栽培法改善のためのR&Dイニシアティブが市場成長を牽引
3.2.1.2 花卉園芸用途の需要増加
3.2.1.3 商業温室プロジェクトに向けた投資の増加が市場成長を促進する。
3.2.2 市場抑制要因
3.2.2.1 材料コストの上昇が市場成長を妨げる
3.2.2.2 温暖な地域での最適な作物生産条件を維持するための温度制御システムの欠如
3.2.2.3 生産者の学習曲線の遅れが市場成長を妨げる
3.2.3 市場機会
3.2.3.1 生産効率向上による市場拡大を促進する技術開発
3.2.3.2 国際的な拡大は市場プレーヤーに大きな機会をもたらす
3.2.3.3 市場プレイヤー間のコラボレーションとパートナーシップは市場成長のチャンス
3.3 ポーターのファイブフォース分析
3.3.1 サプライヤーの交渉力(低)
3.3.2 買い手の交渉力(中)
3.3.3 競争力(高)
3.3.4 代替品による脅威(中)
3.3.5 新規参入の脅威(中~高)
3.4 COVID-19の影響分析
3.4.1 "V字型回復"
3.4.2 "U字型回復"
3.4.3 "W字型回復"
3.4.4 "L字型回復"
3.5 PEST分析
4 商業用温室市場分析:規模別
4.1 主要な調査結果
4.2 規模セグメント 市場魅力度指数
4.3 商業用温室のサイズ別市場規模の推定と予測
4.4 小規模/中規模温室
4.4.1 2024〜2034年の地域別市場規模(US$ Billion)
4.4.2 地域別市場シェア、2024年・2034年(%)
4.5 大規模温室
4.5.1 2024〜2034年の地域別市場規模(US$ Billion)
4.5.2 地域別市場シェア、2024年・2034年(%)
5 商業用温室市場分析:コンポーネント別
5.1 主要調査結果
5.2 構成要素セグメント 市場魅力度指数
5.3 コンポーネント別商業用温室市場規模の推定と予測
5.4 ハードウェア
5.4.1 2024〜2034年の地域別市場規模(US$ Billion)
5.4.2 地域別市場シェア、2024年・2034年(%)
5.5 グレージング材料
5.5.1 2024〜2034年の地域別市場規模(US$ Billion)
5.5.2 地域別市場シェア、2024年・2034年(%)
5.6 システム
5.6.1 2024〜2034年の地域別市場規模(US$ Billion)
5.6.2 地域別市場シェア、2024年・2034年(%)
6 商業用温室市場分析:製品タイプ別
6.1 主要な調査結果
6.2 製品タイプ別セグメント 市場魅力度指数
6.3 製品タイプ別商業用温室市場規模の推定と予測
6.4 野菜
6.4.1 2024〜2034年の地域別市場規模(US$ Billion)
6.4.2 地域別市場シェア、2024年・2034年(%)
6.5 果物
6.5.1 2024〜2034年の地域別市場規模(US$ Billion)
6.5.2 地域別市場シェア、2024年・2034年(%)
6.6 花卉
6.6.1 2024〜2034年の地域別市場規模(US$ Billion)
6.6.2 地域別市場シェア、2024年・2034年(%)
6.7 保育作物
6.7.1 2024〜2034年の地域別市場規模(US$ Billion)
6.7.2 地域別市場シェア、2024年・2034年(%)
7 商業用温室市場分析:グレージング材タイプ別
7.1 主要な調査結果
7.2 グレージング材タイプ別セグメント 市場魅力度指数
7.3 グレージング素材タイプ別商業用温室市場規模の推定と予測
7.4 ポリエチレンフィルム
7.4.1 2024〜2034年の地域別市場規模(US$ Billion)
7.4.2 地域別市場シェア、2024年・2034年(%)
7.5 ポリカーボネートシート
7.5.1 2024〜2034年の地域別市場規模(US$ Billion)
7.5.2 地域別市場シェア、2024年・2034年(%)
7.6 アクリルシート
7.6.1 2024~2034年の地域別市場規模(US$ Billion)
7.6.2 地域別市場シェア、2024年・2034年(%)
7.7 ガラス
7.7.1 2024~2034年の地域別市場規模(US$ Billion)
7.7.2 地域別市場シェア、2024年・2034年(%)
7.8 その他
7.8.1 2024~2034年の地域別市場規模(US$ Billion)
7.8.2 地域別市場シェア、2024年・2034年(%)
8 商業用温室市場分析:システム別
8.1 主要な調査結果
8.2 システムセグメント 市場魅力度指数
8.3 商業用温室のシステム別市場規模の推定と予測
8.4 照明システム
8.4.1 2024〜2034年の地域別市場規模(US$ Million)
8.4.2 地域別市場シェア、2024年・2034年(%)
8.5 灌漑システム
8.5.1 2024〜2034年の地域別市場規模(US$ Million)
8.5.2 地域別市場シェア、2024年・2034年(%)
8.6 気候制御システム
8.6.1 2024〜2034年の地域別市場規模(US$ Million)
8.6.2 地域別市場シェア、2024年・2034年(%)
8.7 システム制御
8.7.1 2024~2034年の地域別市場規模(US$ Million)
8.7.2 地域別市場シェア、2024年・2034年(%)
8.8 通信システム
8.8.1 2024年~2034年の地域別市場規模(US$ Million)
8.8.2 地域別市場シェア、2024年・2034年(%)
8.9 その他システム
8.9.1 2024~2034年の地域別市場規模(US$ Million)
8.9.2 地域別市場シェア、2024年・2034年(%)
9 業務用温室の地域別市場分析
9.1 主要な調査結果
9.2 地域別市場規模の推定と予測
10 北米の商業用温室市場分析
10.1 主要な調査結果
10.2 北米の商業用温室市場魅力度指数
10.3 北米の商業用温室市場の国別市場規模、2024年、2029年、2034年(US$ Billion)
10.4 北米の商業用温室市場規模の推定と予測
10.5 北米の商業用温室市場規模推定と予測:国別
10.6 北米の商業用温室市場規模推定と予測:規模別
10.7 北米の商業用温室市場規模推定と予測:構成要素別
10.8 北米の商業用温室市場規模推定と予測:製品タイプ別
10.9 北米の商業用温室市場規模推定と予測:グレージング素材タイプ別
10.10 北米の商業用温室市場規模推定と予測:システム別
10.11 アメリカの商業用温室市場分析
10.12 カナダの商業用温室の市場分析
11 欧州の商業用温室市場分析
11.1 主要な調査結果
11.2 欧州の商業用温室市場魅力度指数
11.3 欧州の商業用温室市場の国別市場規模、2024年、2029年、2034年(US$ Billion)
11.4 欧州の商業用温室市場の推定と予測
11.5 欧州の商業用温室市場規模推定と予測:国別
11.6 欧州の商業用温室市場規模推定と予測:規模別
11.7 欧州の商業用温室市場規模推定と予測:構成要素別
11.8 欧州の商業用温室市場規模推定と予測:製品タイプ別
11.9 欧州の商業用温室市場規模推定と予測:グレージング素材タイプ別
11.10 欧州商業用温室市場規模推定と予測:システム別
11.11 ドイツの商業用温室市場分析
11.12 オランダの商業用温室市場分析
11.13 トルコの商業用温室市場分析
11.14 イタリアの商業用温室市場分析
11.15 スペインの商業用温室市場分析
11.16 フランスの商業用温室市場分析
11.17 イギリスの商業用温室市場分析
11.18 その他の欧州の商業用温室市場分析
12 アジア太平洋地域の商業用温室市場分析
12.1 主要な調査結果
12.2 アジア太平洋地域の商業用温室市場の魅力度指数
12.3 アジア太平洋地域の商業用温室市場の国別市場規模、2024年、2029年、2034年(US$ Billion)
12.4 アジア太平洋地域の商業用温室市場の推定と予測
12.5 アジア太平洋地域の商業用温室市場規模推定と予測:国別
12.6 アジア太平洋地域の商業用温室市場規模推定と予測:規模別
12.7 アジア太平洋地域の商業用温室市場規模推定と予測:構成要素別
12.8 アジア太平洋地域の商業用温室市場規模推定と予測:製品タイプ別
12.9 アジア太平洋地域の商業用温室市場規模推定と予測:ガラス材料タイプ別
12.10 アジア太平洋地域の商業用温室市場規模推定と予測:システム別
12.11 中国の商業用温室市場分析
12.12 インドの商業用温室市場分析
12.13 日本の商業用温室市場分析
12.14 韓国の商業用温室市場分析
12.15 オーストラリアの商業用温室市場分析
12.16 台湾の商業用温室市場分析
12.17 その他のアジア太平洋地域の商業用温室市場分析
13 中東・アフリカの商業用温室市場分析
13.1 主要な調査結果
13.2 中東・アフリカの商業用温室市場魅力度指数
13.3 中東・アフリカの商業用温室の国別市場規模、2024年、2029年、2034年(US$ Billion)
13.4 中東・アフリカの商業用温室市場の推定と予測
13.5 中東・アフリカの商業用温室市場規模推定と予測:国別
13.6 中東・アフリカの商業用温室市場規模推定と予測:規模別
13.7 中東・アフリカの商業用温室市場規模推定と予測:構成要素別
13.8 中東・アフリカの商業用温室市場規模推定と予測:製品タイプ別
13.9 中東・アフリカの商業用温室市場規模推定と予測:グレージング素材タイプ別
13.10 中東・アフリカの商業用温室市場規模推定と予測:システム別
13.11 GCCの商業用温室市場分析
13.12 南アフリカの商業用温室の市場分析
13.13 その他の中東・アフリカ地域の商業用温室の市場分析
14 ラテンアメリカの商業用温室市場分析
14.1 主要な調査結果
14.2 ラテンアメリカの商業用温室市場魅力度指数
14.3 ラテンアメリカの商業用温室市場国別市場規模、2024年、2029年、2034年(US$ Billion)
14.4 ラテンアメリカの商業用温室市場規模推定と予測
14.5 ラテンアメリカの商業用温室市場規模推定と予測:国別
14.6 ラテンアメリカの商業用温室市場規模推定と予測:規模別
14.7 ラテンアメリカの商業用温室市場規模推定と予測:構成要素別
14.8 ラテンアメリカの商業用温室市場規模推定と予測:製品タイプ別
14.9 ラテンアメリカの商業用温室市場規模推定と予測:グレージング素材タイプ別
14.10 ラテンアメリカの商業用温室市場規模推定と予測:システム別
14.11 ブラジルの商業用温室市場分析
14.12 メキシコの商業用温室市場分析
14.13 その他のラテンアメリカ商業用温室市場分析
15 会社概要
15.1 戦略的展望
15.2 Agra-tech, Inc.
15.2.1 会社概要
15.2.2 会社概要
15.2.3 製品ベンチマーク
15.3 Argus Control Systems (Acquired by CEL Group of Companies)
15.3.1 会社概要
15.3.2 会社概要
15.3.3 製品ベンチマーク
15.3.4 戦略的展望
15.4 Berry Global Group, Inc.
15.4.1 会社概要
15.4.2 会社概要
15.4.3 財務分析
15.4.3.1 純収入、2019-2023年
15.4.3.2 R&D、2019-2023年
15.4.3.3 地域別収益シェア、2023年(%)
15.4.3.4 事業セグメント収益シェア、2023年(%)
15.4.4 製品ベンチマーク
15.4.5 戦略的展望
15.5 Certhon (Acquired by Denso)
15.5.1 会社概要
15.5.2 会社概要
15.5.3 財務分析
15.5.3.1 純収入、2019-2023年
15.5.4 製品ベンチマーク
15.6 Idaia Group
15.6.1 会社概要
15.6.2 会社概要
15.6.3 製品ベンチマーク
15.7 Everlight Electronics Co Ltd
15.7.1 会社概要
15.7.2 会社概要
15.7.3 財務分析
15.7.3.1 純収入、2018-2022年
15.7.3.2 R&D、2018-2022年
15.7.3.3 地域別収益シェア、2022年(%)
15.7.3.4 事業セグメント収益シェア、2022年(%)
15.7.4 製品ベンチマーク
15.8 Heliospectra AB
15.8.1 会社概要
15.8.2 会社概要
15.8.3 財務分析
15.8.3.1 純収入、2019-2023年
15.8.4 製品ベンチマーク
15.8.5 戦略的展望
15.9 Hort Americas, LLC
15.9.1 会社概要
15.9.2 会社概要
15.9.3 製品ベンチマーク
15.9.4 戦略的展望
15.10 Logiqs BV
15.10.1 会社概要
15.10.2 会社概要
15.10.3 製品ベンチマーク
15.11 LumiGrow, Inc.
15.11.1 会社概要
15.11.2 会社概要
15.11.3 製品ベンチマーク
15.11.4 戦略的展望
15.12 Plastika Kritis S.A.
15.12.1 会社概要
15.12.2 会社概要
15.12.3 財務分析
15.12.3.1 純収入、2018-2022年
15.12.4 製品ベンチマーク
15.13 Richel Group
15.13.1 会社概要
15.13.2 会社概要
15.13.3 製品ベンチマーク
15.13.4 戦略的展望
15.14 Rough Brothers, Inc.
15.14.1 会社概要
15.14.2 会社概要
15.14.3 製品ベンチマーク
15.15 Signify Holding B.V
15.15.1 会社概要
15.15.2 会社概要
15.15.3 財務分析
15.15.3.1 純収入、2019-2023年
15.15.3.2 R&D、2019-2023年
15.15.3.3 地域別収益シェア、2023年(%)
15.15.3.4 事業セグメント収益シェア、2023年(%)
15.15.4 製品ベンチマーク
15.15.5 戦略的展望
15.16 Stuppy Greenhouse, Inc
15.16.1 会社概要
15.16.2 会社概要
15.16.3 製品ベンチマーク
15.17 GreenTech Agro LLC
15.17.1 会社概要
15.17.2 会社概要
15.17.3 製品ベンチマーク
15.18 Nexus Greenhouse Systems (Acquired by Gibraltar Industries)
15.18.1 会社概要
15.18.2 会社概要
15.18.3 財務分析
15.18.3.1 純収入、2019年〜2023年
15.18.4 製品ベンチマーク
15.19 Harnois Greenhouses Inc.
15.19.1 会社概要
15.19.2 会社概要
15.19.3 製品ベンチマーク
15.19.4 戦略的展望
16 結論と提言
16.1 Visiongainからの結びの言葉
16.2 市場プレイヤーへの提言
ページTOPに戻る
図表リスト
表の一覧
Table 1 Commercial Greenhouse Market Snapshot, 2024 & 2034 (US$ Billion, CAGR %)
Table 2 Cost of Greenhouse Materials
Table 3 Six Budding Technology Innovations Taking Greenhouses to New Heights
Table 4 Global Commercial Greenhouse Market by Region, 2024-2034 (US$ Bn, AGR (%), CAGR (%)) (V-Shaped Recovery Scenario)
Table 5 Global Commercial Greenhouse Market by Region, 2024-2034 (US$ Bn, AGR (%), CAGR (%)) (U-Shaped Recovery Scenario)
Table 6 Global Commercial Greenhouse Market by Region, 2024-2034 (US$ Bn, AGR (%), CAGR (%)) (W-Shaped Recovery Scenario)
Table 7 Global Commercial Greenhouse Market by Region, 2024-2034 (US$ Bn, AGR (%), CAGR (%)) (L-Shaped Recovery Scenario)
Table 8 Global Commercial Greenhouse Market by Size, 2024-2034 (US$ Bn, AGR (%), CAGR (%))
Table 9 Small/Mid-Scale Greenhouses Market by Region, 2024-2034 (US$ Bn, AGR (%), CAGR (%))
Table 10 Large-Scale Greenhouses Market by Region, 2024-2034 (US$ Bn, AGR (%), CAGR (%))
Table 11 Global Commercial Greenhouse Market by Component, 2024-2034 (US$ Bn, AGR (%), CAGR (%))
Table 12 Hardware Market by Region, 2024-2034 (US$ Bn, AGR (%), CAGR (%))
Table 13 Glazing Materials Market by Region, 2024-2034 (US$ Bn, AGR (%), CAGR (%))
Table 14 Systems Market by Region, 2024-2034 (US$ Bn, AGR (%), CAGR (%))
Table 15 Global Commercial Greenhouse Market by Product Type, 2024-2034 (US$ Bn, AGR (%), CAGR (%))
Table 16 Vegetables Market by Region, 2024-2034 (US$ Bn, AGR (%), CAGR (%))
Table 17 Fruits Market by Region, 2024-2034 (US$ Bn, AGR (%), CAGR (%))
Table 18 Flowers & Ornamentals Market by Region, 2024-2034 (US$ Bn, AGR (%), CAGR (%))
Table 19 Nursery Crops Market by Region, 2024-2034 (US$ Bn, AGR (%), CAGR (%))
Table 20 Global Commercial Greenhouse Market by Glazing Material Type, 2024-2034 (US$ Bn, AGR (%), CAGR (%))
Table 21 Polyethylene Film Market by Region, 2024-2034 (US$ Bn, AGR (%), CAGR (%))
Table 22 Polycarbonate Sheet Market by Region, 2024-2034 (US$ Bn, AGR (%), CAGR (%))
Table 23 Acrylic Sheet Market by Region, 2024-2034 (US$ Bn, AGR (%), CAGR (%))
Table 24 Glass Materials Market by Region, 2024-2034 (US$ Bn, AGR (%), CAGR (%))
Table 25 Other Glazing Material Market by Region, 2024-2034 (US$ Bn, AGR (%), CAGR (%))
Table 26 Global Commercial Greenhouse Market by System, 2024-2034 (US$ Bn, AGR (%), CAGR (%))
Table 27 Lighting Systems Market by Region, 2024-2034 (US$ Bn, AGR (%), CAGR (%))
Table 28 Irrigation Systems Market by Region, 2024-2034 (US$ Bn, AGR (%), CAGR (%))
Table 29 Climate Control Systems Market by Region, 2024-2034 (US$ Bn, AGR (%), CAGR (%))
Table 30 System Controls Market by Region, 2024-2034 (US$ Bn, AGR (%), CAGR (%))
Table 31 Communication Systems Market by Region, 2024-2034 (US$ Bn, AGR (%), CAGR (%))
Table 32 Other Systems Market by Region, 2024-2034 (US$ Bn, AGR (%), CAGR (%))
Table 33 Global Commercial Greenhouse Market by Region, 2024-2034 (US$ Bn, AGR (%), CAGR (%))
Table 34 North America Commercial Greenhouse Market by Value, 2024-2034 (US$ Bn, AGR (%), CAGR (%))
Table 35 North America Commercial Greenhouse Market by Country, 2024-2034 (US$ Bn, AGR (%), CAGR (%))
Table 36 North America Commercial Greenhouse Market by Size, 2024-2034 (US$ Bn, AGR (%), CAGR (%))
Table 37 North America Commercial Greenhouse Market by Component, 2024-2034 (US$ Bn, AGR (%), CAGR (%))
Table 38 North America Commercial Greenhouse Market by Product Type, 2024-2034 (US$ Bn, AGR (%), CAGR (%))
Table 39 North America Commercial Greenhouse Market by Glazing Material Type, 2024-2034 (US$ Bn, AGR (%), CAGR (%))
Table 40 North America Commercial Greenhouse Market by System, 2024-2034 (US$ Bn, AGR (%), CAGR (%))
Table 41 US Commercial Greenhouse Market by Value, 2024-2034 (US$ Bn, AGR (%), CAGR (%))
Table 42 Canada Commercial Greenhouse Market by Value, 2024-2034 (US$ Bn, AGR (%), CAGR (%))
Table 43 Europe Commercial Greenhouse Market by Value, 2024-2034 (US$ Bn, AGR (%), CAGR (%))
Table 44 Europe Commercial Greenhouse Market by Country, 2024-2034 (US$ Bn, AGR (%), CAGR (%))
Table 45 Europe Commercial Greenhouse Market by Size, 2024-2034 (US$ Bn, AGR (%), CAGR (%))
Table 46 Europe Commercial Greenhouse Market by Component, 2024-2034 (US$ Bn, AGR (%), CAGR (%))
Table 47 Europe Commercial Greenhouse Market by Product Type, 2024-2034 (US$ Bn, AGR (%), CAGR (%))
Table 48 Europe Commercial Greenhouse Market by Glazing Material Type, 2024-2034 (US$ Bn, AGR (%), CAGR (%))
Table 49 Europe Commercial Greenhouse Market by System, 2024-2034 (US$ Bn, AGR (%), CAGR (%))
Table 50 Germany Commercial Greenhouse Market by Value, 2024-2034 (US$ Bn, AGR (%), CAGR (%))
Table 51 Netherlands Commercial Greenhouse Market by Value, 2024-2034 (US$ Bn, AGR (%), CAGR (%))
Table 52 Turkey Commercial Greenhouse Market by Value, 2024-2034 (US$ Bn, AGR (%), CAGR (%))
Table 53 Italy Commercial Greenhouse Market by Value, 2024-2034 (US$ Bn, AGR (%), CAGR (%))
Table 54 Spain Commercial Greenhouse Market by Value, 2024-2034 (US$ Bn, AGR (%), CAGR (%))
Table 55 France Commercial Greenhouse Market by Value, 2024-2034 (US$ Bn, AGR (%), CAGR (%))
Table 56 UK Commercial Greenhouse Market by Value, 2024-2034 (US$ Bn, AGR (%), CAGR (%))
Table 57 Rest of Europe Commercial Greenhouse Market by Value, 2024-2034 (US$ Bn, AGR (%), CAGR (%))
Table 58 Asia-Pacific Commercial Greenhouse Market by Value, 2024-2034 (US$ Bn, AGR (%), CAGR (%))
Table 59 Asia-Pacific Commercial Greenhouse Market by Country, 2024-2034 (US$ Bn, AGR (%), CAGR (%))
Table 60 Asia-Pacific Commercial Greenhouse Market by Size, 2024-2034 (US$ Bn, AGR (%), CAGR (%))
Table 61 Asia-Pacific Commercial Greenhouse Market by Component, 2024-2034 (US$ Bn, AGR (%), CAGR (%))
Table 62 Asia-Pacific Commercial Greenhouse Market by Product Type, 2024-2034 (US$ Bn, AGR (%), CAGR (%))
Table 63 Asia-Pacific Commercial Greenhouse Market by Glazing Material Type, 2024-2034 (US$ Bn, AGR (%), CAGR (%))
Table 64 Asia-Pacific Commercial Greenhouse Market by System, 2024-2034 (US$ Bn, AGR (%), CAGR (%))
Table 65 China Commercial Greenhouse Market by Value, 2024-2034 (US$ Bn, AGR (%), CAGR (%))
Table 66 India Commercial Greenhouse Market by Value, 2024-2034 (US$ Bn, AGR (%), CAGR (%))
Table 67 Japan Commercial Greenhouse Market by Value, 2024-2034 (US$ Bn, AGR (%), CAGR (%))
Table 68 South Korea Commercial Greenhouse Market by Value, 2024-2034 (US$ Bn, AGR (%), CAGR (%))
Table 69 Australia Commercial Greenhouse Market by Value, 2024-2034 (US$ Bn, AGR (%), CAGR (%))
Table 70 Taiwan Commercial Greenhouse Market by Value, 2024-2034 (US$ Bn, AGR (%), CAGR (%))
Table 71 Rest of Asia-Pacific Commercial Greenhouse Market by Value, 2024-2034 (US$ Bn, AGR (%), CAGR (%))
Table 72 Middle East & Africa Commercial Greenhouse Market by Value, 2024-2034 (US$ Bn, AGR (%), CAGR (%))
Table 73 Middle East & Africa Commercial Greenhouse Market by Country, 2024-2034 (US$ Bn, AGR (%), CAGR (%))
Table 74 Middle East & Africa Commercial Greenhouse Market by Size, 2024-2034 (US$ Bn, AGR (%), CAGR (%))
Table 75 Middle East & Africa Commercial Greenhouse Market by Component, 2024-2034 (US$ Bn, AGR (%), CAGR (%))
Table 76 Middle East & Africa Commercial Greenhouse Market by Product Type, 2024-2034 (US$ Bn, AGR (%), CAGR (%))
Table 77 Middle East & Africa Commercial Greenhouse Market by Glazing Material Type, 2024-2034 (US$ Bn, AGR (%), CAGR (%))
Table 78 Middle East & Africa Commercial Greenhouse Market by System, 2024-2034 (US$ Bn, AGR (%), CAGR (%))
Table 79 GCC Commercial Greenhouse Market by Value, 2024-2034 (US$ Bn, AGR (%), CAGR (%))
Table 80 South Africa Commercial Greenhouse Market by Value, 2024-2034 (US$ Bn, AGR (%), CAGR (%))
Table 81 Rest of Middle East & Africa Commercial Greenhouse Market by Value, 2024-2034 (US$ Bn, AGR (%), CAGR (%))
Table 82 Latin America Commercial Greenhouse Market by Value, 2024-2034 (US$ Bn, AGR (%), CAGR (%))
Table 83 Latin America Commercial Greenhouse Market by Country, 2024-2034 (US$ Bn, AGR (%), CAGR (%))
Table 84 Latin America Commercial Greenhouse Market by Size, 2024-2034 (US$ Bn, AGR (%), CAGR (%))
Table 85 Latin America Commercial Greenhouse Market by Component, 2024-2034 (US$ Bn, AGR (%), CAGR (%))
Table 86 Latin America Commercial Greenhouse Market by Product Type, 2024-2034 (US$ Bn, AGR (%), CAGR (%))
Table 87 Latin America Commercial Greenhouse Market by Glazing Material Type, 2024-2034 (US$ Bn, AGR (%), CAGR (%))
Table 88 Latin America Commercial Greenhouse Market by System, 2024-2034 (US$ Bn, AGR (%), CAGR (%))
Table 89 Brazil Commercial Greenhouse Market by Value, 2024-2034 (US$ Bn, AGR (%), CAGR (%))
Table 90 Mexico Commercial Greenhouse Market by Value, 2024-2034 (US$ Bn, AGR (%), CAGR (%))
Table 91 Rest of Latin America Commercial Greenhouse Market by Value, 2024-2034 (US$ Bn, AGR (%), CAGR (%))
Table 92 Strategic Outlook - Contract
Table 93 Agra-tech, Inc: Key Details, (CEO, HQ, Revenue, Founded, No. of Employees, Company Type, Website, Business Segment)
Table 94 Agra-tech, Inc: Product Benchmarking
Table 95 Argus Control Systems: Key Details, (CEO, HQ, Revenue, Founded, No. of Employees, Company Type, Website, Business Segment)
Table 96 Argus Control Systems: Product Benchmarking
Table 97 Argus Control Systems: Strategic Outlook
Table 98 Berry Global Group, Inc.: Key Details, (CEO, HQ, Revenue, Founded, No. of Employees, Company Type, Website, Business Segment)
Table 99 Berry Global Group, Inc.: Product Benchmarking
Table 100 Berry Global Group, Inc.: Strategic Outlook
Table 101 Certhon: Key Details, (CEO, HQ, Revenue, Founded, No. of Employees, Company Type, Website, Business Segment)
Table 102 Certhon: Product Benchmarking
Table 103 Idaia Group: Key Details, (CEO, HQ, Revenue, Founded, No. of Employees, Company Type, Website, Business Segment)
Table 104 Idaia Group: Product Benchmarking
Table 105 Everlight Electronics Co Ltd: Key Details, (CEO, HQ, Revenue, Founded, No. of Employees, Company Type, Website, Business Segment)
Table 106 Everlight Electronics Co Ltd: Product Benchmarking
Table 107 Heliospectra AB: Key Details, (CEO, HQ, Revenue, Founded, No. of Employees, Company Type, Website, Business Segment)
Table 108 Heliospectra AB: Product Benchmarking
Table 109 Heliospectra AB: Strategic Outlook
Table 110 Hort Americas, LLC: Key Details, (CEO, HQ, Revenue, Founded, No. of Employees, Company Type, Website, Business Segment)
Table 111 Hort Americas, LLC: Product Benchmarking
Table 112 Hort Americas, LLC: Strategic Outlook
Table 113 Logiqs BV: Key Details, (CEO, HQ, Revenue, Founded, No. of Employees, Company Type, Website, Business Segment)
Table 114 Logiqs BV: Product Benchmarking
Table 115 LumiGrow, Inc.: Key Details, (CEO, HQ, Revenue, Founded, No. of Employees, Company Type, Website, Business Segment)
Table 116 LumiGrow, Inc.: Product Benchmarking
Table 117 LumiGrow, Inc.: Strategic Outlook
Table 118 Plastika Kritis S.A.: Key Details, (CEO, HQ, Revenue, Founded, No. of Employees, Company Type, Website, Business Segment)
Table 119 Plastika Kritis S.A.: Product Benchmarking
Table 120 Richel Group: Key Details, (CEO, HQ, Revenue, Founded, No. of Employees, Company Type, Website, Business Segment)
Table 121 Richel Group: Product Benchmarking
Table 122 Richel Group: Strategic Outlook
Table 123 Rough Brothers, Inc.: Key Details, (CEO, HQ, Revenue, Founded, No. of Employees, Company Type, Website, Business Segment)
Table 124 Rough Brothers, Inc.: Product Benchmarking
Table 125 Signify Holding B.V: Key Details, (CEO, HQ, Revenue, Founded, No. of Employees, Company Type, Website, Business Segment)
Table 126 Signify Holding B.V: Product Benchmarking
Table 127 Signify Holding B.V: Strategic Outlook
Table 128 Stuppy Greenhouse, Inc: Key Details, (CEO, HQ, Revenue, Founded, No. of Employees, Company Type, Website, Business Segment)
Table 129 Stuppy Greenhouse, Inc: Product Benchmarking
Table 130 GreenTech Agro LLC: Key Details, (CEO, HQ, Revenue, Founded, No. of Employees, Company Type, Website, Business Segment)
Table 131 GreenTech Agro LLC: Product Benchmarking
Table 132 Nexus Greenhouse Systems: Key Details, (CEO, HQ, Revenue, Founded, No. of Employees, Company Type, Website, Business Segment)
Table 133 Nexus Greenhouse Systems: Product Benchmarking
Table 134 Harnois Greenhouses Inc.: Key Details, (CEO, HQ, Revenue, Founded, No. of Employees, Company Type, Website, Business Segment)
Table 135 Harnois Greenhouses Inc.: Product Benchmarking
Table 136 Harnois Greenhouses Inc.: Strategic Outlook
図の一覧
Figure 1 Commercial Greenhouse Market Segmentation
Figure 2 Commercial Greenhouse Market by Size: Market Attractiveness Index
Figure 3 Commercial Greenhouse Market by Component: Market Attractiveness Index
Figure 4 Commercial Greenhouse Market by Product Type: Market Attractiveness Index
Figure 5 Commercial Greenhouse Market by Glazing Material Type: Market Attractiveness Index
Figure 6 Commercial Greenhouse Market by System: Market Attractiveness Index
Figure 7 Commercial Greenhouse Market Attractiveness Index by Region
Figure 8 Commercial Greenhouse Market: Market Dynamics
Figure 9 Commercial Greenhouse Market: Porter’s Five Forces Analysis
Figure 10 Global Commercial Greenhouse Market Share Forecast by COVID, 2024-2034 (%)
Figure 11 Global Commercial Greenhouse Market by Region, 2024-2034 (US$ Bn, AGR (%)) (V-Shaped Recovery Scenario)
Figure 12 Global Commercial Greenhouse Market by Region, 2024-2034 (US$ Bn, AGR (%)) (U-Shaped Recovery Scenario)
Figure 13 Global Commercial Greenhouse Market by Region, 2024-2034 (US$ Bn, AGR (%)) (W-Shaped Recovery Scenario)
Figure 14 Global Commercial Greenhouse Market by Region, 2024-2034 (US$ Bn, AGR (%)) (L-Shaped Recovery Scenario)
Figure 15 Commercial Greenhouse Market: PEST Analysis
Figure 16 Commercial Greenhouse Market by Size: Market Attractiveness Index
Figure 17 Global Commercial Greenhouse Market by Size, 2024-2034 (US$ Bn, AGR (%))
Figure 18 Commercial Greenhouse Market Share Forecast by Size, 2024, 2029, 2034 (%)
Figure 19 Small/Mid-Scale Greenhouses Market by Region, 2024-2034 (US$ Bn, AGR (%))
Figure 20 Small/Mid-Scale Greenhouses Market Share Forecast by Region, 2024 & 2034 (%)
Figure 21 Large-Scale Greenhouses Market by Region, 2024-2034 (US$ Bn, AGR (%))
Figure 22 Large-Scale Greenhouses Market Share Forecast by Region, 2024 & 2034 (%)
Figure 23 Commercial Greenhouse Market by Component: Market Attractiveness Index
Figure 24 Global Commercial Greenhouse Market by Component, 2024-2034 (US$ Bn, AGR (%))
Figure 25 Commercial Greenhouse Market Share Forecast by Component, 2024, 2029, 2034 (%)
Figure 26 Hardware Market by Region, 2024-2034 (US$ Bn, AGR (%))
Figure 27 Hardware Market Share Forecast by Region, 2024 & 2034 (%)
Figure 28 Glazing Materials Market by Region, 2024-2034 (US$ Bn, AGR (%))
Figure 29 Glazing Materials Market Share Forecast by Region, 2024 & 2034 (%)
Figure 30 Systems Market by Region, 2024-2034 (US$ Bn, AGR (%))
Figure 31 Systems Market Share Forecast by Region, 2024 & 2034 (%)
Figure 32 Commercial Greenhouse Market by Product Type: Market Attractiveness Index
Figure 33 Global Commercial Greenhouse Market by Product Type, 2024-2034 (US$ Bn, AGR (%))
Figure 34 Commercial Greenhouse Market Share Forecast by Product Type, 2024, 2029, 2034 (%)
Figure 35 Vegetables Market by Region, 2024-2034 (US$ Bn, AGR (%))
Figure 36 Vegetables Market Share Forecast by Region, 2024 & 2034 (%)
Figure 37 Fruits Market by Region, 2024-2034 (US$ Bn, AGR (%))
Figure 38 Fruits Market Share Forecast by Region, 2024 & 2034 (%)
Figure 39 Flowers & Ornamentals Market by Region, 2024-2034 (US$ Bn, AGR (%))
Figure 40 Flowers & Ornamentals Market Share Forecast by Region, 2024 & 2034 (%)
Figure 41 Nursery Crops Market by Region, 2024-2034 (US$ Bn, AGR (%))
Figure 42 Nursery Crops Market Share Forecast by Region, 2024 & 2034 (%)
Figure 43 Commercial Greenhouse Market by Glazing Material Type: Market Attractiveness Index
Figure 44 Global Commercial Greenhouse Market by Glazing Material Type, 2024-2034 (US$ Bn, AGR (%))
Figure 45 Commercial Greenhouse Market Share Forecast by Glazing Material Type, 2024, 2029, 2034 (%)
Figure 46 Polyethylene Film Market by Region, 2024-2034 (US$ Bn, AGR (%))
Figure 47 Polyethylene Film Market Share Forecast by Region, 2024 & 2034 (%)
Figure 48 Polycarbonate Sheet Market by Region, 2024-2034 (US$ Bn, AGR (%))
Figure 49 Polycarbonate Sheet Market Share Forecast by Region, 2024 & 2034 (%)
Figure 50 Acrylic Sheet Market by Region, 2024-2034 (US$ Bn, AGR (%))
Figure 51 Acrylic Sheet Market Share Forecast by Region, 2024 & 2034 (%)
Figure 52 Glass Materials Market by Region, 2024-2034 (US$ Bn, AGR (%))
Figure 53 Glass Market Share Forecast by Region, 2024 & 2034 (%)
Figure 54 Other Glazing Material Market by Region, 2024-2034 (US$ Bn, AGR (%))
Figure 55 Other Market Share Forecast by Region, 2024 & 2034 (%)
Figure 56 Commercial Greenhouse Market by System: Market Attractiveness Index
Figure 57 Global Commercial Greenhouse Market by System, 2024-2034 (US$ Bn, AGR (%))
Figure 58 Commercial Greenhouse Market Share Forecast by System, 2024, 2029, 2034 (%)
Figure 59 Lighting Systems Market by Region, 2024-2034 (US$ Bn, AGR (%))
Figure 60 Lighting Systems Market Share Forecast by Region, 2024 & 2034 (%)
Figure 61 Irrigation Systems Market by Region, 2024-2034 (US$ Bn, AGR (%))
Figure 62 Irrigation Systems Market Share Forecast by Region, 2024 & 2034 (%)
Figure 63 Climate Control Systems Market by Region, 2024-2034 (US$ Bn, AGR (%))
Figure 64 Climate Control Systems Market Share Forecast by Region, 2024 & 2034 (%)
Figure 65 System Controls Market by Region, 2024-2034 (US$ Bn, AGR (%))
Figure 66 System Controls Market Share Forecast by Region, 2024 & 2034 (%)
Figure 67 Communication Systems Market by Region, 2024-2034 (US$ Bn, AGR (%))
Figure 68 Communication Systems Market Share Forecast by Region, 2024 & 2034 (%)
Figure 69 Other Systems Market by Region, 2024-2034 (US$ Bn, AGR (%))
Figure 70 Other Systems Market Share Forecast by Region, 2024 & 2034 (%)
Figure 71 Commercial Greenhouse Market Forecast by Region 2024 and 2034 (Revenue, CAGR%)
Figure 72 Commercial Greenhouse Market Share Forecast by Region 2024, 2029, 2034 (%)
Figure 73 Global Commercial Greenhouse Market by Region, 2024-2034 (US$ Bn, AGR (%))
Figure 74 North America Commercial Greenhouse Market Attractiveness Index
Figure 75 North America Commercial Greenhouse Market by Region, 2024, 2029 & 2034 (US$ Billion)
Figure 76 North America Commercial Greenhouse Market by Value, 2024-2034 (US$ Bn, AGR (%))
Figure 77 North America Commercial Greenhouse Market by Country, 2024-2034 (US$ Bn, AGR (%))
Figure 78 North America Commercial Greenhouse Market Share Forecast by Country, 2024 & 2034 (%)
Figure 79 North America Commercial Greenhouse Market by Size, 2024-2034 (US$ Bn, AGR (%))
Figure 80 North America Commercial Greenhouse Market Share Forecast Size, 2024 & 2034 (%)
Figure 81 North America Commercial Greenhouse Market by Component, 2024-2034 (US$ Bn, AGR (%))
Figure 82 North America Commercial Greenhouse Market Share Forecast by Component, 2024 & 2034 (%)
Figure 83 North America Commercial Greenhouse Market by Product Type, 2024-2034 (US$ Bn, AGR (%))
Figure 84 North America Commercial Greenhouse Market Share Forecast by Product Type, 2024 & 2034 (%)
Figure 85 North America Commercial Greenhouse Market by Glazing Material Type, 2024-2034 (US$ Bn, AGR (%))
Figure 86 North America Commercial Greenhouse Market Share Forecast by Glazing Material Type, 2024 & 2034 (%)
Figure 87 North America Commercial Greenhouse Market by System, 2024-2034 (US$ Bn, AGR (%))
Figure 88 North America Commercial Greenhouse Market Share Forecast by System, 2024 & 2034 (%)
Figure 89 US Commercial Greenhouse Market by Value, 2024-2034 (US$ Bn, AGR (%))
Figure 90 Canada Commercial Greenhouse Market by Value, 2024-2034 (US$ Bn, AGR (%))
Figure 91 Europe Commercial Greenhouse Market Attractiveness Index
Figure 92 Europe Commercial Greenhouse Market by Region, 2024, 2029 & 2034 (US$ Billion)
Figure 93 Europe Commercial Greenhouse Market by Value, 2024-2034 (US$ Bn, AGR (%))
Figure 94 Europe Commercial Greenhouse Market by Country, 2024-2034 (US$ Bn, AGR (%))
Figure 95 Europe Commercial Greenhouse Market Share Forecast by Country, 2024 & 2034 (%)
Figure 96 Europe Commercial Greenhouse Market by Size, 2024-2034 (US$ Bn, AGR (%))
Figure 97 Europe Commercial Greenhouse Market Share Forecast Size, 2024 & 2034 (%)
Figure 98 Europe Commercial Greenhouse Market by Component, 2024-2034 (US$ Bn, AGR (%))
Figure 99 Europe Commercial Greenhouse Market Share Forecast by Component, 2024 & 2034 (%)
Figure 100 Europe Commercial Greenhouse Market by Product Type, 2024-2034 (US$ Bn, AGR (%))
Figure 101 Europe Commercial Greenhouse Market Share Forecast by Product Type, 2024 & 2034 (%)
Figure 102 Europe Commercial Greenhouse Market by Glazing Material Type, 2024-2034 (US$ Bn, AGR (%))
Figure 103 Europe Commercial Greenhouse Market Share Forecast by Glazing Material Type, 2024 & 2034 (%)
Figure 104 Europe Commercial Greenhouse Market by System, 2024-2034 (US$ Bn, AGR (%))
Figure 105 Europe Commercial Greenhouse Market Share Forecast by System, 2024 & 2034 (%)
Figure 106 Germany Commercial Greenhouse Market by Value, 2024-2034 (US$ Bn, AGR (%))
Figure 107 Netherlands Commercial Greenhouse Market by Value, 2024-2034 (US$ Bn, AGR (%))
Figure 108 Turkey Commercial Greenhouse Market by Value, 2024-2034 (US$ Bn, AGR (%))
Figure 109 Italy Commercial Greenhouse Market by Value, 2024-2034 (US$ Bn, AGR (%))
Figure 110 Spain Commercial Greenhouse Market by Value, 2024-2034 (US$ Bn, AGR (%))
Figure 111 France Commercial Greenhouse Market by Value, 2024-2034 (US$ Bn, AGR (%))
Figure 112 UK Commercial Greenhouse Market by Value, 2024-2034 (US$ Bn, AGR (%))
Figure 113 Rest of Europe Commercial Greenhouse Market by Value, 2024-2034 (US$ Bn, AGR (%))
Figure 114 Asia-Pacific Commercial Greenhouse Market Attractiveness Index
Figure 115 Asia-Pacific Commercial Greenhouse Market by Region, 2024, 2029 & 2034 (US$ Billion)
Figure 116 Asia-Pacific Commercial Greenhouse Market by Value, 2024-2034 (US$ Bn, AGR (%))
Figure 117 Asia-Pacific Commercial Greenhouse Market by Country, 2024-2034 (US$ Bn, AGR (%))
Figure 118 Asia-Pacific Commercial Greenhouse Market Share Forecast by Country, 2024 & 2034 (%)
Figure 119 Asia-Pacific Commercial Greenhouse Market by Size, 2024-2034 (US$ Bn, AGR (%))
Figure 120 Asia-Pacific Commercial Greenhouse Market Share Forecast Size, 2024 & 2034 (%)
Figure 121 Asia-Pacific Commercial Greenhouse Market by Component, 2024-2034 (US$ Bn, AGR (%))
Figure 122 Asia-Pacific Commercial Greenhouse Market Share Forecast by Component, 2024 & 2034 (%)
Figure 123 Asia-Pacific Commercial Greenhouse Market by Product Type, 2024-2034 (US$ Bn, AGR (%))
Figure 124 Asia-Pacific Commercial Greenhouse Market Share Forecast by Product Type, 2024 & 2034 (%)
Figure 125 Asia-Pacific Commercial Greenhouse Market by Glazing Material Type, 2024-2034 (US$ Bn, AGR (%))
Figure 126 Asia-Pacific Commercial Greenhouse Market Share Forecast by Glazing Material Type, 2024 & 2034 (%)
Figure 127 Asia-Pacific Commercial Greenhouse Market by System, 2024-2034 (US$ Bn, AGR (%))
Figure 128 Asia-Pacific Commercial Greenhouse Market Share Forecast by System, 2024 & 2034 (%)
Figure 129 China Commercial Greenhouse Market by Value, 2024-2034 (US$ Bn, AGR (%))
Figure 130 India Commercial Greenhouse Market by Value, 2024-2034 (US$ Bn, AGR (%))
Figure 131 Japan Commercial Greenhouse Market by Value, 2024-2034 (US$ Bn, AGR (%))
Figure 132 South Korea Commercial Greenhouse Market by Value, 2024-2034 (US$ Bn, AGR (%))
Figure 133 Australia Commercial Greenhouse Market by Value, 2024-2034 (US$ Bn, AGR (%))
Figure 134 Taiwan Commercial Greenhouse Market by Value, 2024-2034 (US$ Bn, AGR (%))
Figure 135 Rest of Asia-Pacific Commercial Greenhouse Market by Value, 2024-2034 (US$ Bn, AGR (%))
Figure 136 Middle East and Africa Commercial Greenhouse Market Attractiveness Index
Figure 137 Middle East and Africa Commercial Greenhouse Market by Region, 2024, 2029 & 2034 (US$ Billion)
Figure 138 Middle East & Africa Commercial Greenhouse Market by Value, 2024-2034 (US$ Bn, AGR (%))
Figure 139 Middle East & Africa Commercial Greenhouse Market by Country, 2024-2034 (US$ Bn, AGR (%))
Figure 140 Middle East and Africa Commercial Greenhouse Market Share Forecast by Country, 2024 & 2034 (%)
Figure 141 Middle East & Africa Commercial Greenhouse Market by Size, 2024-2034 (US$ Bn, AGR (%))
Figure 142 Middle East and Africa Commercial Greenhouse Market Share Forecast Size, 2024 & 2034 (%)
Figure 143 Middle East & Africa Commercial Greenhouse Market by Component, 2024-2034 (US$ Bn, AGR (%))
Figure 144 Middle East and Africa Commercial Greenhouse Market Share Forecast by Component, 2024 & 2034 (%)
Figure 145 Middle East & Africa Commercial Greenhouse Market by Product Type, 2024-2034 (US$ Bn, AGR (%))
Figure 146 Middle East and Africa Commercial Greenhouse Market Share Forecast by Product Type, 2024 & 2034 (%)
Figure 147 Middle East & Africa Commercial Greenhouse Market by Glazing Material Type, 2024-2034 (US$ Bn, AGR (%))
Figure 148 Middle East and Africa Commercial Greenhouse Market Share Forecast by Glazing Material Type, 2024 & 2034 (%)
Figure 149 Middle East & Africa Commercial Greenhouse Market by System, 2024-2034 (US$ Bn, AGR (%))
Figure 150 Middle East and Africa Commercial Greenhouse Market Share Forecast by System, 2024 & 2034 (%)
Figure 151 GCC Commercial Greenhouse Market by Value, 2024-2034 (US$ Bn, AGR (%))
Figure 152 South Africa Commercial Greenhouse Market by Value, 2024-2034 (US$ Bn, AGR (%))
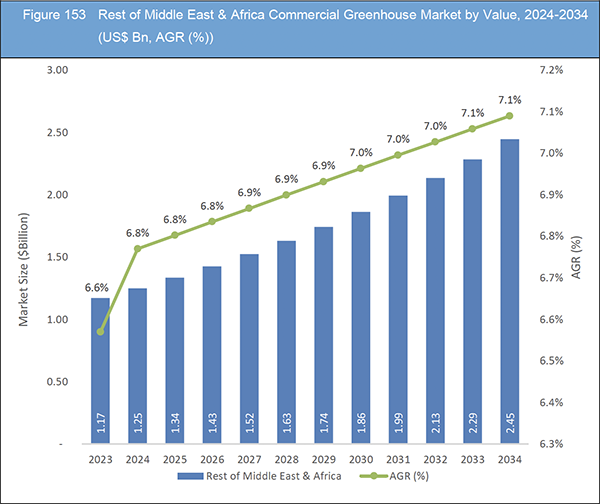
Figure 153 Rest of Middle East & Africa Commercial Greenhouse Market by Value, 2024-2034 (US$ Bn, AGR (%))
Figure 154 Latin America Commercial Greenhouse Market Attractiveness Index
Figure 155 Latin America Commercial Greenhouse Market by Region, 2024, 2029 & 2034 (US$ Billion)
Figure 156 Latin America Commercial Greenhouse Market by Value, 2024-2034 (US$ Bn, AGR (%))
Figure 157 Latin America Commercial Greenhouse Market by Country, 2024-2034 (US$ Bn, AGR (%))
Figure 158 Latin America Commercial Greenhouse Market Share Forecast by Country, 2024 & 2034 (%)
Figure 159 Latin America Commercial Greenhouse Market by Size, 2024-2034 (US$ Bn, AGR (%))
Figure 160 Latin America Commercial Greenhouse Market Share Forecast Size, 2024 & 2034 (%)
Figure 161 Latin America Commercial Greenhouse Market by Component, 2024-2034 (US$ Bn, AGR (%))
Figure 162 Latin America Commercial Greenhouse Market Share Forecast by Component, 2024 & 2034 (%)
Figure 163 Latin America Commercial Greenhouse Market by Product Type, 2024-2034 (US$ Bn, AGR (%))
Figure 164 Latin America Commercial Greenhouse Market Share Forecast by Product Type, 2024 & 2034 (%)
Figure 165 Latin America Commercial Greenhouse Market by Glazing Material Type, 2024-2034 (US$ Bn, AGR (%))
Figure 166 Latin America Commercial Greenhouse Market Share Forecast by Glazing Material Type, 2024 & 2034 (%)
Figure 167 Latin America Commercial Greenhouse Market by System, 2024-2034 (US$ Bn, AGR (%))
Figure 168 Latin America Commercial Greenhouse Market Share Forecast by System, 2024 & 2034 (%)
Figure 169 Brazil Commercial Greenhouse Market by Value, 2024-2034 (US$ Bn, AGR (%))
Figure 170 Mexico Commercial Greenhouse Market by Value, 2024-2034 (US$ Bn, AGR (%))
Figure 171 Rest of Latin America Commercial Greenhouse Market by Value, 2024-2034 (US$ Bn, AGR (%))
Figure 172 Berry Global Group, Inc..: Net Revenue, 2019-2023 (US$ Million, AGR%)
Figure 173 Berry Global Group, Inc..: R&D, 2019-2023 (US$ Million, AGR%)
Figure 174 Berry Global Group, Inc..: Regional Revenue Share, 2023 (%)
Figure 175 Berry Global Group, Inc..: Business Segment Revenue Share, 2023 (%)
Figure 176 Certhon..: Net Revenue, 2019-2023 (US$ Million, AGR%)
Figure 177 Everlight Electronics Co Ltd.: Net Revenue, 2018-2022 (US$ Million, AGR%)
Figure 178 Everlight Electronics Co Ltd.: R&D, 2018-2022 (US$ Million, AGR%)
Figure 179 Everlight Electronics Co Ltd.: Regional Revenue Share, 2022 (%)
Figure 180 Everlight Electronics Co Ltd.: Business Segment Revenue Share, 2022 (%)
Figure 181 Heliospectra AB.: Net Revenue, 2019-2023 (US$ Million, AGR%)
Figure 182 Plastika Kritis S.A..: Net Revenue, 2018-2022 (US$ Million, AGR%)
Figure 183 Signify Holding B.V.: Net Revenue, 2019-2023 (US$ Million, AGR%)
Figure 184 Signify Holding B.V.: R&D, 2019-2023 (US$ Million, AGR%)
Figure 185 Signify Holding B.V.: Regional Revenue Share, 2023 (%)
Figure 186 Signify Holding B.V.: Business Segment Revenue Share, 2023 (%)
Figure 187 Gibraltar Industries, Inc.: Net Revenue, 2019-2023 (US$ Million, AGR%)
ページTOPに戻る
Summary
Report Details
The Commercial Greenhouse Market Report 2024-2034: This report will prove invaluable to leading firms striving for new revenue pockets if they wish to better understand the industry and its underlying dynamics. It will be useful for companies that would like to expand into different industries or to expand their existing operations in a new region.
Sustainable Agriculture Practices Coupled with Increasing Concerns Over Food Security.
The commercial greenhouse market is experiencing significant growth driven by several key factors. Rising demand for sustainable agriculture practices, coupled with increasing concerns over food security and environmental sustainability, is fuelling the adoption of greenhouse technology worldwide. Additionally, advancements in greenhouse design, automation, and climate control systems are enhancing productivity and efficiency, further driving market expansion.
One of the primary drivers of growth in the commercial greenhouse market is the growing consumer preference for locally sourced, fresh produce. Greenhouses enable year-round cultivation of a wide range of crops, mitigating the seasonal limitations of traditional agriculture and ensuring a consistent supply of high-quality fruits, vegetables, and herbs. Furthermore, greenhouse-grown produce often commands premium prices in the market due to its freshness, Flavour, and reduced environmental impact.
The market presents numerous opportunities for stakeholders across the value chain. Innovations in greenhouse technology, such as vertical farming, hydroponics, and aquaponics, offer new avenues for crop cultivation and diversification. Additionally, increasing investments in research and development are driving the development of advanced greenhouse systems capable of optimizing resource utilization and crop yields. Moreover, favourable government policies and subsidies aimed at promoting sustainable agriculture practices are creating a conducive environment for market growth.
Rising Material Cost Hinder the Market Growth
Global greenhouse construction faces challenges amidst rising material costs exacerbated by geopolitical tensions and pandemic aftershocks. Dutch builders, dominating 80-90% of the market, navigate a 20-30% hike in construction expenses, particularly due to surging steel, aluminium, and glass prices. Innovations like heat pumps and solar panels emerge as solutions for sustainable energy management, amidst calls for collaboration and technological advancements to mitigate industry disruptions.
For instance, on 6 June 2022, The greenhouse food production sector across Europe is facing significant challenges due to soaring energy and fertilizer prices. In the UK, cucumber and pepper production is expected to be halved, with some farmers opting not to harvest at all due to the impact of high gas prices and labour shortages.
What Questions Should You Ask before Buying a Market Research Report?
-
How is the commercial greenhouse market evolving?
-
What is driving and restraining the commercial greenhouse market?
-
How will each commercial greenhouse submarket segment grow over the forecast period and how much revenue will these submarkets account for in 2034?
-
How will the market shares for each commercial greenhouse submarket develop from 2024 to 2034?
-
What will be the main driver for the overall market from 2024 to 2034?
-
Will leading commercial greenhouse markets broadly follow the macroeconomic dynamics, or will individual national markets outperform others?
-
How will the market shares of the national markets change by 2034 and which geographical region will lead the market in 2034?
-
Who are the leading players and what are their prospects over the forecast period?
-
What are the commercial greenhouse projects for these leading companies?
-
How will the industry evolve during the period between 2024 and 2034? What are the implications of commercial greenhouse projects taking place now and over the next 10 years?
-
Is there a greater need for product commercialisation to further scale the commercial greenhouse market?
-
Where is the commercial greenhouse market heading and how can you ensure you are at the forefront of the market?
-
What are the best investment options for new product and service lines?
-
What are the key prospects for moving companies into a new growth path and C-suite?
You need to discover how this will impact the commercial greenhouse market today, and over the next 10 years:
-
Our 421-page report provides 136 tables and 187 charts/graphs exclusively to you.
-
The report highlights key lucrative areas in the industry so you can target them – NOW.
-
It contains in-depth analysis of global, regional and national sales and growth.
-
It highlights for you the key successful trends, changes and revenue projections made by your competitors.
This report tells you TODAY how the commercial greenhouse market will develop in the next 10 years, and in line with the variations in COVID-19 economic recession and bounce. This market is more critical now than at any point over the last 10 years.
Forecasts to 2034 and other analyses reveal commercial prospects
-
In addition to revenue forecasting to 2034, our new study provides you with recent results, growth rates, and market shares.
-
You will find original analyses, with business outlooks and developments.
-
Discover qualitative analyses (including market dynamics, drivers, opportunities, restraints and challenges), cost structure, impact of rising commercial greenhouse prices and recent developments.
This report includes data analysis and invaluable insight into how COVID-19 will affect the industry and your company. Four COVID-19 recovery patterns and their impact, namely, “V”, “L”, “W” and “U” are discussed in this report.
Segments Covered in the Report
Market Segment by Size
-
Small/Mid-Scale Greenhouses
-
Large-Scale Greenhouses
Market Segment by Component
-
Hardware
-
Glazing Materials
-
Systems
Market Segment by Product Type
-
Vegetables
-
Fruits
-
Flowers & Ornamentals
-
Nursery Crops
Market Segment by Glazing Material Type
-
Polyethylene Film
-
Polycarbonate Sheet
-
Acrylic Sheet
-
Glass Materials
-
Other Glazing Material
Market Segment by System
-
Lighting Systems
-
Irrigation Systems
-
Climate Control Systems
-
System Controls
-
Communication Systems
-
Other Systems
In addition to the revenue predictions for the overall world market and segments, you will also find revenue forecasts for four regional and 20 leading national markets:
North America
Europe
-
Germany
-
Netherlands
-
Turkey
-
Italy
-
Spain
-
Rest of Europe
Asia Pacific
-
China
-
Japan
-
India
-
Australia
-
South Korea
-
Rest of Asia Pacific
Latin America
-
Brazil
-
Mexico
-
Rest of Latin America
Middle East & Africa
-
GCC
-
South Africa
-
Rest of Middle East & Africa
The report also includes profiles and for some of the leading companies in the Commercial Greenhouse Market, 2024 to 2034, with a focus on this segment of these companies’ operations.
Leading companies and the potential for market growth
-
Agra-tech, Inc.
-
Argus Control Systems (Acquired by CEL Group of Companies)
-
Berry Global Group, Inc.
-
Certhon (Acquired by Denso)
-
Everlight Electronics Co Ltd
-
GreenTech Agro LLC
-
Harnois Greenhouses Inc.
-
Heliospectra AB
-
Hort Americas, LLC
-
Idaia Group
-
Logiqs BV
-
LumiGrow, Inc.
-
Nexus Greenhouse Systems (Acquired by Gibraltar Industries)
-
Plastika Kritis S.A.
-
Richel Group
-
Rough Brothers, Inc.
-
Signify Holding B.V
-
Stuppy Greenhouse, Inc.
Overall world revenue for Commercial Greenhouse Market, 2024 to 2034 in terms of value the market will surpass US$41.09 billion in 2024, our work calculates. We predict strong revenue growth through to 2034. Our work identifies which organizations hold the greatest potential. Discover their capabilities, progress, and commercial prospects, helping you stay ahead.
How will the Commercial Greenhouse Market, 2024 to 2034 report help you?
In summary, our 420+ page report provides you with the following knowledge:
-
Revenue forecasts to 2034 for Commercial Greenhouse Market, 2024 to 2034 Market, with forecasts for size, component, product type, glazing material type, and system, each forecast at a global and regional level – discover the industry’s prospects, finding the most lucrative places for investments and revenues.
-
Revenue forecasts to 2034 for four regional and 20 key national markets – See forecasts for the Commercial Greenhouse Market, 2024 to 2034 market in North America, Europe, Asia-Pacific, Latin America and Middle East & Africa. Also forecasted is the market in the US, Canada, Brazil, Germany, Netherlands, Turkey, China, India, Japan, and Australia among other prominent economies.
-
Prospects for established firms and those seeking to enter the market – including company profiles for 18 of the major companies involved in the Commercial Greenhouse Market, 2024 to 2034.
Find quantitative and qualitative analyses with independent predictions. Receive information that only our report contains, staying informed with invaluable business intelligence.
Information found nowhere else
With our new report, you are less likely to fall behind in knowledge or miss out on opportunities. See how our work could benefit your research, analyses, and decisions. Visiongain’s study is for everybody needing commercial analyses for the Commercial Greenhouse Market, 2024 to 2034, market-leading companies. You will find data, trends and predictions.
ページTOPに戻る
Table of Contents
Table of Contents
1 Report Overview
1.1 Objectives of the Study
1.2 Introduction to Commercial Greenhouse Market
1.3 What This Report Delivers
1.4 Why You Should Read This Report
1.5 Key Questions Answered by This Analytical Report
1.6 Who Is This Report for?
1.7 Methodology
1.7.1 Market Definitions
1.7.2 Market Evaluation & Forecasting Methodology
1.7.3 Data Validation
1.7.3.1 Primary Research
1.7.3.2 Secondary Research
1.8 Frequently Asked Questions (FAQs)
1.9 Associated Visiongain Reports
1.10 About Visiongain
2 Executive Summary
3 Market Overview
3.1 Key Findings
3.2 Market Dynamics
3.2.1 Market Driving Factors
3.2.1.1 R&D Initiative to Improve Greenhouse Farming Methods Driving the Market Growth.
3.2.1.2 Rise in Demand for Floriculture and Ornamental Horticulture Applications
3.2.1.3 Rising Investment Towards the Commercial Greenhouse Projects Driving the Market Growth.
3.2.2 Market Restraining Factors
3.2.2.1 Rising Material Cost Hinder the Market Growth
3.2.2.2 Lack of Temperature Control Systems to Maintain Optimum Crop Production Condition in Warm Regions.
3.2.2.3 Delay in Learning Curve of Growers Hinder the Market Growth
3.2.3 Market Opportunities
3.2.3.1 Technological Development Propelling Market Expansion by Raising Production and Efficiency
3.2.3.2 Expanding Internationally Presents a Significant Opportunity for Market Players
3.2.3.3 Collaboration and Partnership Between Market Players Opportunities for the Market Growth
3.3 Porter’s Five Forces Analysis
3.3.1 Bargaining Power of Suppliers (Low)
3.3.2 Bargaining Power of Buyers (Medium)
3.3.3 Competitive Rivalry (High)
3.3.4 Threat from Substitutes (Medium)
3.3.5 Threat of New Entrants (Medium to High)
3.4 COVID-19 Impact Analysis
3.4.1 “V-Shaped Recovery”
3.4.2 “U-Shaped Recovery”
3.4.3 “W-Shaped Recovery”
3.4.4 “L-Shaped Recovery”
3.5 PEST Analysis
4 Commercial Greenhouse Market Analysis by Size
4.1 Key Findings
4.2 Size Segment: Market Attractiveness Index
4.3 Commercial Greenhouse Market Size Estimation and Forecast by Size
4.4 Small/Mid-Scale Greenhouses
4.4.1 Market Size by Region, 2024-2034 (US$ Billion)
4.4.2 Market Share by Region, 2024 & 2034 (%)
4.5 Large-Scale Greenhouses
4.5.1 Market Size by Region, 2024-2034 (US$ Billion)
4.5.2 Market Share by Region, 2024 & 2034 (%)
5 Commercial Greenhouse Market Analysis by Component
5.1 Key Findings
5.2 Component Segment: Market Attractiveness Index
5.3 Commercial Greenhouse Market Size Estimation and Forecast by Component
5.4 Hardware
5.4.1 Market Size by Region, 2024-2034 (US$ Billion)
5.4.2 Market Share by Region, 2024 & 2034 (%)
5.5 Glazing Materials
5.5.1 Market Size by Region, 2024-2034 (US$ Billion)
5.5.2 Market Share by Region, 2024 & 2034 (%)
5.6 Systems
5.6.1 Market Size by Region, 2024-2034 (US$ Billion)
5.6.2 Market Share by Region, 2024 & 2034 (%)
6 Commercial Greenhouse Market Analysis by Product Type
6.1 Key Findings
6.2 Product Type Segment: Market Attractiveness Index
6.3 Commercial Greenhouse Market Size Estimation and Forecast by Product Type
6.4 Vegetables
6.4.1 Market Size by Region, 2024-2034 (US$ Billion)
6.4.2 Market Share by Region, 2024 & 2034 (%)
6.5 Fruits
6.5.1 Market Size by Region, 2024-2034 (US$ Billion)
6.5.2 Market Share by Region, 2024 & 2034 (%)
6.6 Flowers & Ornamentals
6.6.1 Market Size by Region, 2024-2034 (US$ Billion)
6.6.2 Market Share by Region, 2024 & 2034 (%)
6.7 Nursery Crops
6.7.1 Market Size by Region, 2024-2034 (US$ Billion)
6.7.2 Market Share by Region, 2024 & 2034 (%)
7 Commercial Greenhouse Market Analysis by Glazing Material Type
7.1 Key Findings
7.2 Glazing Material Type Segment: Market Attractiveness Index
7.3 Commercial Greenhouse Market Size Estimation and Forecast by Glazing Material Type
7.4 Polyethylene Film
7.4.1 Market Size by Region, 2024-2034 (US$ Billion)
7.4.2 Market Share by Region, 2024 & 2034 (%)
7.5 Polycarbonate Sheet
7.5.1 Market Size by Region, 2024-2034 (US$ Billion)
7.5.2 Market Share by Region, 2024 & 2034 (%)
7.6 Acrylic Sheet
7.6.1 Market Size by Region, 2024-2034 (US$ Billion)
7.6.2 Market Share by Region, 2024 & 2034 (%)
7.7 Glass
7.7.1 Market Size by Region, 2024-2034 (US$ Billion)
7.7.2 Market Share by Region, 2024 & 2034 (%)
7.8 Other
7.8.1 Market Size by Region, 2024-2034 (US$ Billion)
7.8.2 Market Share by Region, 2024 & 2034 (%)
8 Commercial Greenhouse Market Analysis by System
8.1 Key Findings
8.2 System Segment: Market Attractiveness Index
8.3 Commercial Greenhouse Market Size Estimation and Forecast by System
8.4 Lighting Systems
8.4.1 Market Size by Region, 2024-2034 (US$ Million)
8.4.2 Market Share by Region, 2024 & 2034 (%)
8.5 Irrigation Systems
8.5.1 Market Size by Region, 2024-2034 (US$ Million)
8.5.2 Market Share by Region, 2024 & 2034 (%)
8.6 Climate Control Systems
8.6.1 Market Size by Region, 2024-2034 (US$ Million)
8.6.2 Market Share by Region, 2024 & 2034 (%)
8.7 System Controls
8.7.1 Market Size by Region, 2024-2034 (US$ Million)
8.7.2 Market Share by Region, 2024 & 2034 (%)
8.8 Communication Systems
8.8.1 Market Size by Region, 2024-2034 (US$ Million)
8.8.2 Market Share by Region, 2024 & 2034 (%)
8.9 Other Systems
8.9.1 Market Size by Region, 2024-2034 (US$ Million)
8.9.2 Market Share by Region, 2024 & 2034 (%)
9 Commercial Greenhouse Market Analysis by Region
9.1 Key Findings
9.2 Regional Market Size Estimation and Forecast
10 North America Commercial Greenhouse Market Analysis
10.1 Key Findings
10.2 North America Commercial Greenhouse Market Attractiveness Index
10.3 North America Commercial Greenhouse Market by Country, 2024, 2029 & 2034 (US$ Billion)
10.4 North America Commercial Greenhouse Market Size Estimation and Forecast
10.5 North America Commercial Greenhouse Market Size Estimation and Forecast by Country
10.6 North America Commercial Greenhouse Market Size Estimation and Forecast by Size
10.7 North America Commercial Greenhouse Market Size Estimation and Forecast by Component
10.8 North America Commercial Greenhouse Market Size Estimation and Forecast by Product Type
10.9 North America Commercial Greenhouse Market Size Estimation and Forecast by Glazing Material Type
10.10 North America Commercial Greenhouse Market Size Estimation and Forecast by System
10.11 U.S. Commercial Greenhouse Market Analysis
10.12 Canada Commercial Greenhouse Market Analysis
11 Europe Commercial Greenhouse Market Analysis
11.1 Key Findings
11.2 Europe Commercial Greenhouse Market Attractiveness Index
11.3 Europe Commercial Greenhouse Market by Country, 2024, 2029 & 2034 (US$ Billion)
11.4 Europe Commercial Greenhouse Market Size Estimation and Forecast
11.5 Europe Commercial Greenhouse Market Size Estimation and Forecast by Country
11.6 Europe Commercial Greenhouse Market Size Estimation and Forecast by Size
11.7 Europe Commercial Greenhouse Market Size Estimation and Forecast by Component
11.8 Europe Commercial Greenhouse Market Size Estimation and Forecast by Product Type
11.9 Europe Commercial Greenhouse Market Size Estimation and Forecast by Glazing Material Type
11.10 Europe Commercial Greenhouse Market Size Estimation and Forecast by System
11.11 Germany Commercial Greenhouse Market Analysis
11.12 Netherlands Commercial Greenhouse Market Analysis
11.13 Turkey Commercial Greenhouse Market Analysis
11.14 Italy Commercial Greenhouse Market Analysis
11.15 Spain Commercial Greenhouse Market Analysis
11.16 France Commercial Greenhouse Market Analysis
11.17 UK Commercial Greenhouse Market Analysis
11.18 Rest of Europe Commercial Greenhouse Market Analysis
12 Asia-Pacific Commercial Greenhouse Market Analysis
12.1 Key Findings
12.2 Asia-Pacific Commercial Greenhouse Market Attractiveness Index
12.3 Asia-Pacific Commercial Greenhouse Market by Country, 2024, 2029 & 2034 (US$ Billion)
12.4 Asia-Pacific Commercial Greenhouse Market Size Estimation and Forecast
12.5 Asia-Pacific Commercial Greenhouse Market Size Estimation and Forecast by Country
12.6 Asia-Pacific Commercial Greenhouse Market Size Estimation and Forecast by Size
12.7 Asia-Pacific Commercial Greenhouse Market Size Estimation and Forecast by Component
12.8 Asia-Pacific Commercial Greenhouse Market Size Estimation and Forecast by Product Type
12.9 Asia-Pacific Commercial Greenhouse Market Size Estimation and Forecast by Glazing Material Type
12.10 Asia-Pacific Commercial Greenhouse Market Size Estimation and Forecast by System
12.11 China Commercial Greenhouse Market Analysis
12.12 India Commercial Greenhouse Market Analysis
12.13 Japan Commercial Greenhouse Market Analysis
12.14 South Korea Commercial Greenhouse Market Analysis
12.15 Australia Commercial Greenhouse Market Analysis
12.16 Taiwan Commercial Greenhouse Market Analysis
12.17 Rest of Asia-Pacific Commercial Greenhouse Market Analysis
13 Middle East and Africa Commercial Greenhouse Market Analysis
13.1 Key Findings
13.2 Middle East and Africa Commercial Greenhouse Market Attractiveness Index
13.3 Middle East and Africa Commercial Greenhouse Market by Country, 2024, 2029 & 2034 (US$ Billion)
13.4 Middle East and Africa Commercial Greenhouse Market Size Estimation and Forecast
13.5 Middle East and Africa Commercial Greenhouse Market Size Estimation and Forecast by Country
13.6 Middle East and Africa Commercial Greenhouse Market Size Estimation and Forecast by Size
13.7 Middle East and Africa Commercial Greenhouse Market Size Estimation and Forecast by Component
13.8 Middle East and Africa Commercial Greenhouse Market Size Estimation and Forecast by Product Type
13.9 Middle East and Africa Commercial Greenhouse Market Size Estimation and Forecast by Glazing Material Type
13.10 Middle East and Africa Commercial Greenhouse Market Size Estimation and Forecast by System
13.11 GCC Commercial Greenhouse Market Analysis
13.12 South Africa Commercial Greenhouse Market Analysis
13.13 Rest of Middle East & Africa Commercial Greenhouse Market Analysis
14 Latin America Commercial Greenhouse Market Analysis
14.1 Key Findings
14.2 Latin America Commercial Greenhouse Market Attractiveness Index
14.3 Latin America Commercial Greenhouse Market by Country, 2024, 2029 & 2034 (US$ Billion)
14.4 Latin America Commercial Greenhouse Market Size Estimation and Forecast
14.5 Latin America Commercial Greenhouse Market Size Estimation and Forecast by Country
14.6 Latin America Commercial Greenhouse Market Size Estimation and Forecast by Size
14.7 Latin America Commercial Greenhouse Market Size Estimation and Forecast by Component
14.8 Latin America Commercial Greenhouse Market Size Estimation and Forecast by Product Type
14.9 Latin America Commercial Greenhouse Market Size Estimation and Forecast by Glazing Material Type
14.10 Latin America Commercial Greenhouse Market Size Estimation and Forecast by System
14.11 Brazil Commercial Greenhouse Market Analysis
14.12 Mexico Commercial Greenhouse Market Analysis
14.13 Rest of Latin America Commercial Greenhouse Market Analysis
15 Company Profiles
15.1 Strategic Outlook
15.2 Agra-tech, Inc.
15.2.1 Company Snapshot
15.2.2 Company Overview
15.2.3 Product Benchmarking
15.3 Argus Control Systems (Acquired by CEL Group of Companies)
15.3.1 Company Snapshot
15.3.2 Company Overview
15.3.3 Product Benchmarking
15.3.4 Strategic Outlook
15.4 Berry Global Group, Inc.
15.4.1 Company Snapshot
15.4.2 Company Overview
15.4.3 Financial Analysis
15.4.3.1 Net Revenue, 2019-2023
15.4.3.2 R&D, 2019-2023
15.4.3.3 Regional Revenue Share, 2023 (%)
15.4.3.4 Business Segment Revenue Share, 2023 (%)
15.4.4 Product Benchmarking
15.4.5 Strategic Outlook
15.5 Certhon (Acquired by Denso)
15.5.1 Company Snapshot
15.5.2 Company Overview
15.5.3 Financial Analysis
15.5.3.1 Net Revenue, 2019-2023
15.5.4 Product Benchmarking
15.6 Idaia Group
15.6.1 Company Snapshot
15.6.2 Company Overview
15.6.3 Product Benchmarking
15.7 Everlight Electronics Co Ltd
15.7.1 Company Snapshot
15.7.2 Company Overview
15.7.3 Financial Analysis
15.7.3.1 Net Revenue, 2018-2022
15.7.3.2 R&D, 2018-2022
15.7.3.3 Regional Revenue Share, 2022 (%)
15.7.3.4 Business Segment Revenue Share, 2022 (%)
15.7.4 Product Benchmarking
15.8 Heliospectra AB
15.8.1 Company Snapshot
15.8.2 Company Overview
15.8.3 Financial Analysis
15.8.3.1 Net Revenue, 2019-2023
15.8.4 Product Benchmarking
15.8.5 Strategic Outlook
15.9 Hort Americas, LLC
15.9.1 Company Snapshot
15.9.2 Company Overview
15.9.3 Product Benchmarking
15.9.4 Strategic Outlook
15.10 Logiqs BV
15.10.1 Company Snapshot
15.10.2 Company Overview
15.10.3 Product Benchmarking
15.11 LumiGrow, Inc.
15.11.1 Company Snapshot
15.11.2 Company Overview
15.11.3 Product Benchmarking
15.11.4 Strategic Outlook
15.12 Plastika Kritis S.A.
15.12.1 Company Snapshot
15.12.2 Company Overview
15.12.3 Financial Analysis
15.12.3.1 Net Revenue, 2018-2022
15.12.4 Product Benchmarking
15.13 Richel Group
15.13.1 Company Snapshot
15.13.2 Company Overview
15.13.3 Product Benchmarking
15.13.4 Strategic Outlook
15.14 Rough Brothers, Inc.
15.14.1 Company Snapshot
15.14.2 Company Overview
15.14.3 Product Benchmarking
15.15 Signify Holding B.V
15.15.1 Company Snapshot
15.15.2 Company Overview
15.15.3 Financial Analysis
15.15.3.1 Net Revenue, 2019-2023
15.15.3.2 R&D, 2019-2023
15.15.3.3 Regional Revenue Share, 2023 (%)
15.15.3.4 Business Segment Revenue Share, 2023 (%)
15.15.4 Product Benchmarking
15.15.5 Strategic Outlook
15.16 Stuppy Greenhouse, Inc
15.16.1 Company Snapshot
15.16.2 Company Overview
15.16.3 Product Benchmarking
15.17 GreenTech Agro LLC
15.17.1 Company Snapshot
15.17.2 Company Overview
15.17.3 Product Benchmarking
15.18 Nexus Greenhouse Systems (Acquired by Gibraltar Industries)
15.18.1 Company Snapshot
15.18.2 Company Overview
15.18.3 Financial Analysis
15.18.3.1 Net Revenue, 2019-2023
15.18.4 Product Benchmarking
15.19 Harnois Greenhouses Inc.
15.19.1 Company Snapshot
15.19.2 Company Overview
15.19.3 Product Benchmarking
15.19.4 Strategic Outlook
16 Conclusion and Recommendations
16.1 Concluding Remarks from Visiongain
16.2 Recommendations for Market Players
ページTOPに戻る
List of Tables/Graphs
List of Tables
Table 1 Commercial Greenhouse Market Snapshot, 2024 & 2034 (US$ Billion, CAGR %)
Table 2 Cost of Greenhouse Materials
Table 3 Six Budding Technology Innovations Taking Greenhouses to New Heights
Table 4 Global Commercial Greenhouse Market by Region, 2024-2034 (US$ Bn, AGR (%), CAGR (%)) (V-Shaped Recovery Scenario)
Table 5 Global Commercial Greenhouse Market by Region, 2024-2034 (US$ Bn, AGR (%), CAGR (%)) (U-Shaped Recovery Scenario)
Table 6 Global Commercial Greenhouse Market by Region, 2024-2034 (US$ Bn, AGR (%), CAGR (%)) (W-Shaped Recovery Scenario)
Table 7 Global Commercial Greenhouse Market by Region, 2024-2034 (US$ Bn, AGR (%), CAGR (%)) (L-Shaped Recovery Scenario)
Table 8 Global Commercial Greenhouse Market by Size, 2024-2034 (US$ Bn, AGR (%), CAGR (%))
Table 9 Small/Mid-Scale Greenhouses Market by Region, 2024-2034 (US$ Bn, AGR (%), CAGR (%))
Table 10 Large-Scale Greenhouses Market by Region, 2024-2034 (US$ Bn, AGR (%), CAGR (%))
Table 11 Global Commercial Greenhouse Market by Component, 2024-2034 (US$ Bn, AGR (%), CAGR (%))
Table 12 Hardware Market by Region, 2024-2034 (US$ Bn, AGR (%), CAGR (%))
Table 13 Glazing Materials Market by Region, 2024-2034 (US$ Bn, AGR (%), CAGR (%))
Table 14 Systems Market by Region, 2024-2034 (US$ Bn, AGR (%), CAGR (%))
Table 15 Global Commercial Greenhouse Market by Product Type, 2024-2034 (US$ Bn, AGR (%), CAGR (%))
Table 16 Vegetables Market by Region, 2024-2034 (US$ Bn, AGR (%), CAGR (%))
Table 17 Fruits Market by Region, 2024-2034 (US$ Bn, AGR (%), CAGR (%))
Table 18 Flowers & Ornamentals Market by Region, 2024-2034 (US$ Bn, AGR (%), CAGR (%))
Table 19 Nursery Crops Market by Region, 2024-2034 (US$ Bn, AGR (%), CAGR (%))
Table 20 Global Commercial Greenhouse Market by Glazing Material Type, 2024-2034 (US$ Bn, AGR (%), CAGR (%))
Table 21 Polyethylene Film Market by Region, 2024-2034 (US$ Bn, AGR (%), CAGR (%))
Table 22 Polycarbonate Sheet Market by Region, 2024-2034 (US$ Bn, AGR (%), CAGR (%))
Table 23 Acrylic Sheet Market by Region, 2024-2034 (US$ Bn, AGR (%), CAGR (%))
Table 24 Glass Materials Market by Region, 2024-2034 (US$ Bn, AGR (%), CAGR (%))
Table 25 Other Glazing Material Market by Region, 2024-2034 (US$ Bn, AGR (%), CAGR (%))
Table 26 Global Commercial Greenhouse Market by System, 2024-2034 (US$ Bn, AGR (%), CAGR (%))
Table 27 Lighting Systems Market by Region, 2024-2034 (US$ Bn, AGR (%), CAGR (%))
Table 28 Irrigation Systems Market by Region, 2024-2034 (US$ Bn, AGR (%), CAGR (%))
Table 29 Climate Control Systems Market by Region, 2024-2034 (US$ Bn, AGR (%), CAGR (%))
Table 30 System Controls Market by Region, 2024-2034 (US$ Bn, AGR (%), CAGR (%))
Table 31 Communication Systems Market by Region, 2024-2034 (US$ Bn, AGR (%), CAGR (%))
Table 32 Other Systems Market by Region, 2024-2034 (US$ Bn, AGR (%), CAGR (%))
Table 33 Global Commercial Greenhouse Market by Region, 2024-2034 (US$ Bn, AGR (%), CAGR (%))
Table 34 North America Commercial Greenhouse Market by Value, 2024-2034 (US$ Bn, AGR (%), CAGR (%))
Table 35 North America Commercial Greenhouse Market by Country, 2024-2034 (US$ Bn, AGR (%), CAGR (%))
Table 36 North America Commercial Greenhouse Market by Size, 2024-2034 (US$ Bn, AGR (%), CAGR (%))
Table 37 North America Commercial Greenhouse Market by Component, 2024-2034 (US$ Bn, AGR (%), CAGR (%))
Table 38 North America Commercial Greenhouse Market by Product Type, 2024-2034 (US$ Bn, AGR (%), CAGR (%))
Table 39 North America Commercial Greenhouse Market by Glazing Material Type, 2024-2034 (US$ Bn, AGR (%), CAGR (%))
Table 40 North America Commercial Greenhouse Market by System, 2024-2034 (US$ Bn, AGR (%), CAGR (%))
Table 41 US Commercial Greenhouse Market by Value, 2024-2034 (US$ Bn, AGR (%), CAGR (%))
Table 42 Canada Commercial Greenhouse Market by Value, 2024-2034 (US$ Bn, AGR (%), CAGR (%))
Table 43 Europe Commercial Greenhouse Market by Value, 2024-2034 (US$ Bn, AGR (%), CAGR (%))
Table 44 Europe Commercial Greenhouse Market by Country, 2024-2034 (US$ Bn, AGR (%), CAGR (%))
Table 45 Europe Commercial Greenhouse Market by Size, 2024-2034 (US$ Bn, AGR (%), CAGR (%))
Table 46 Europe Commercial Greenhouse Market by Component, 2024-2034 (US$ Bn, AGR (%), CAGR (%))
Table 47 Europe Commercial Greenhouse Market by Product Type, 2024-2034 (US$ Bn, AGR (%), CAGR (%))
Table 48 Europe Commercial Greenhouse Market by Glazing Material Type, 2024-2034 (US$ Bn, AGR (%), CAGR (%))
Table 49 Europe Commercial Greenhouse Market by System, 2024-2034 (US$ Bn, AGR (%), CAGR (%))
Table 50 Germany Commercial Greenhouse Market by Value, 2024-2034 (US$ Bn, AGR (%), CAGR (%))
Table 51 Netherlands Commercial Greenhouse Market by Value, 2024-2034 (US$ Bn, AGR (%), CAGR (%))
Table 52 Turkey Commercial Greenhouse Market by Value, 2024-2034 (US$ Bn, AGR (%), CAGR (%))
Table 53 Italy Commercial Greenhouse Market by Value, 2024-2034 (US$ Bn, AGR (%), CAGR (%))
Table 54 Spain Commercial Greenhouse Market by Value, 2024-2034 (US$ Bn, AGR (%), CAGR (%))
Table 55 France Commercial Greenhouse Market by Value, 2024-2034 (US$ Bn, AGR (%), CAGR (%))
Table 56 UK Commercial Greenhouse Market by Value, 2024-2034 (US$ Bn, AGR (%), CAGR (%))
Table 57 Rest of Europe Commercial Greenhouse Market by Value, 2024-2034 (US$ Bn, AGR (%), CAGR (%))
Table 58 Asia-Pacific Commercial Greenhouse Market by Value, 2024-2034 (US$ Bn, AGR (%), CAGR (%))
Table 59 Asia-Pacific Commercial Greenhouse Market by Country, 2024-2034 (US$ Bn, AGR (%), CAGR (%))
Table 60 Asia-Pacific Commercial Greenhouse Market by Size, 2024-2034 (US$ Bn, AGR (%), CAGR (%))
Table 61 Asia-Pacific Commercial Greenhouse Market by Component, 2024-2034 (US$ Bn, AGR (%), CAGR (%))
Table 62 Asia-Pacific Commercial Greenhouse Market by Product Type, 2024-2034 (US$ Bn, AGR (%), CAGR (%))
Table 63 Asia-Pacific Commercial Greenhouse Market by Glazing Material Type, 2024-2034 (US$ Bn, AGR (%), CAGR (%))
Table 64 Asia-Pacific Commercial Greenhouse Market by System, 2024-2034 (US$ Bn, AGR (%), CAGR (%))
Table 65 China Commercial Greenhouse Market by Value, 2024-2034 (US$ Bn, AGR (%), CAGR (%))
Table 66 India Commercial Greenhouse Market by Value, 2024-2034 (US$ Bn, AGR (%), CAGR (%))
Table 67 Japan Commercial Greenhouse Market by Value, 2024-2034 (US$ Bn, AGR (%), CAGR (%))
Table 68 South Korea Commercial Greenhouse Market by Value, 2024-2034 (US$ Bn, AGR (%), CAGR (%))
Table 69 Australia Commercial Greenhouse Market by Value, 2024-2034 (US$ Bn, AGR (%), CAGR (%))
Table 70 Taiwan Commercial Greenhouse Market by Value, 2024-2034 (US$ Bn, AGR (%), CAGR (%))
Table 71 Rest of Asia-Pacific Commercial Greenhouse Market by Value, 2024-2034 (US$ Bn, AGR (%), CAGR (%))
Table 72 Middle East & Africa Commercial Greenhouse Market by Value, 2024-2034 (US$ Bn, AGR (%), CAGR (%))
Table 73 Middle East & Africa Commercial Greenhouse Market by Country, 2024-2034 (US$ Bn, AGR (%), CAGR (%))
Table 74 Middle East & Africa Commercial Greenhouse Market by Size, 2024-2034 (US$ Bn, AGR (%), CAGR (%))
Table 75 Middle East & Africa Commercial Greenhouse Market by Component, 2024-2034 (US$ Bn, AGR (%), CAGR (%))
Table 76 Middle East & Africa Commercial Greenhouse Market by Product Type, 2024-2034 (US$ Bn, AGR (%), CAGR (%))
Table 77 Middle East & Africa Commercial Greenhouse Market by Glazing Material Type, 2024-2034 (US$ Bn, AGR (%), CAGR (%))
Table 78 Middle East & Africa Commercial Greenhouse Market by System, 2024-2034 (US$ Bn, AGR (%), CAGR (%))
Table 79 GCC Commercial Greenhouse Market by Value, 2024-2034 (US$ Bn, AGR (%), CAGR (%))
Table 80 South Africa Commercial Greenhouse Market by Value, 2024-2034 (US$ Bn, AGR (%), CAGR (%))
Table 81 Rest of Middle East & Africa Commercial Greenhouse Market by Value, 2024-2034 (US$ Bn, AGR (%), CAGR (%))
Table 82 Latin America Commercial Greenhouse Market by Value, 2024-2034 (US$ Bn, AGR (%), CAGR (%))
Table 83 Latin America Commercial Greenhouse Market by Country, 2024-2034 (US$ Bn, AGR (%), CAGR (%))
Table 84 Latin America Commercial Greenhouse Market by Size, 2024-2034 (US$ Bn, AGR (%), CAGR (%))
Table 85 Latin America Commercial Greenhouse Market by Component, 2024-2034 (US$ Bn, AGR (%), CAGR (%))
Table 86 Latin America Commercial Greenhouse Market by Product Type, 2024-2034 (US$ Bn, AGR (%), CAGR (%))
Table 87 Latin America Commercial Greenhouse Market by Glazing Material Type, 2024-2034 (US$ Bn, AGR (%), CAGR (%))
Table 88 Latin America Commercial Greenhouse Market by System, 2024-2034 (US$ Bn, AGR (%), CAGR (%))
Table 89 Brazil Commercial Greenhouse Market by Value, 2024-2034 (US$ Bn, AGR (%), CAGR (%))
Table 90 Mexico Commercial Greenhouse Market by Value, 2024-2034 (US$ Bn, AGR (%), CAGR (%))
Table 91 Rest of Latin America Commercial Greenhouse Market by Value, 2024-2034 (US$ Bn, AGR (%), CAGR (%))
Table 92 Strategic Outlook - Contract
Table 93 Agra-tech, Inc: Key Details, (CEO, HQ, Revenue, Founded, No. of Employees, Company Type, Website, Business Segment)
Table 94 Agra-tech, Inc: Product Benchmarking
Table 95 Argus Control Systems: Key Details, (CEO, HQ, Revenue, Founded, No. of Employees, Company Type, Website, Business Segment)
Table 96 Argus Control Systems: Product Benchmarking
Table 97 Argus Control Systems: Strategic Outlook
Table 98 Berry Global Group, Inc.: Key Details, (CEO, HQ, Revenue, Founded, No. of Employees, Company Type, Website, Business Segment)
Table 99 Berry Global Group, Inc.: Product Benchmarking
Table 100 Berry Global Group, Inc.: Strategic Outlook
Table 101 Certhon: Key Details, (CEO, HQ, Revenue, Founded, No. of Employees, Company Type, Website, Business Segment)
Table 102 Certhon: Product Benchmarking
Table 103 Idaia Group: Key Details, (CEO, HQ, Revenue, Founded, No. of Employees, Company Type, Website, Business Segment)
Table 104 Idaia Group: Product Benchmarking
Table 105 Everlight Electronics Co Ltd: Key Details, (CEO, HQ, Revenue, Founded, No. of Employees, Company Type, Website, Business Segment)
Table 106 Everlight Electronics Co Ltd: Product Benchmarking
Table 107 Heliospectra AB: Key Details, (CEO, HQ, Revenue, Founded, No. of Employees, Company Type, Website, Business Segment)
Table 108 Heliospectra AB: Product Benchmarking
Table 109 Heliospectra AB: Strategic Outlook
Table 110 Hort Americas, LLC: Key Details, (CEO, HQ, Revenue, Founded, No. of Employees, Company Type, Website, Business Segment)
Table 111 Hort Americas, LLC: Product Benchmarking
Table 112 Hort Americas, LLC: Strategic Outlook
Table 113 Logiqs BV: Key Details, (CEO, HQ, Revenue, Founded, No. of Employees, Company Type, Website, Business Segment)
Table 114 Logiqs BV: Product Benchmarking
Table 115 LumiGrow, Inc.: Key Details, (CEO, HQ, Revenue, Founded, No. of Employees, Company Type, Website, Business Segment)
Table 116 LumiGrow, Inc.: Product Benchmarking
Table 117 LumiGrow, Inc.: Strategic Outlook
Table 118 Plastika Kritis S.A.: Key Details, (CEO, HQ, Revenue, Founded, No. of Employees, Company Type, Website, Business Segment)
Table 119 Plastika Kritis S.A.: Product Benchmarking
Table 120 Richel Group: Key Details, (CEO, HQ, Revenue, Founded, No. of Employees, Company Type, Website, Business Segment)
Table 121 Richel Group: Product Benchmarking
Table 122 Richel Group: Strategic Outlook
Table 123 Rough Brothers, Inc.: Key Details, (CEO, HQ, Revenue, Founded, No. of Employees, Company Type, Website, Business Segment)
Table 124 Rough Brothers, Inc.: Product Benchmarking
Table 125 Signify Holding B.V: Key Details, (CEO, HQ, Revenue, Founded, No. of Employees, Company Type, Website, Business Segment)
Table 126 Signify Holding B.V: Product Benchmarking
Table 127 Signify Holding B.V: Strategic Outlook
Table 128 Stuppy Greenhouse, Inc: Key Details, (CEO, HQ, Revenue, Founded, No. of Employees, Company Type, Website, Business Segment)
Table 129 Stuppy Greenhouse, Inc: Product Benchmarking
Table 130 GreenTech Agro LLC: Key Details, (CEO, HQ, Revenue, Founded, No. of Employees, Company Type, Website, Business Segment)
Table 131 GreenTech Agro LLC: Product Benchmarking
Table 132 Nexus Greenhouse Systems: Key Details, (CEO, HQ, Revenue, Founded, No. of Employees, Company Type, Website, Business Segment)
Table 133 Nexus Greenhouse Systems: Product Benchmarking
Table 134 Harnois Greenhouses Inc.: Key Details, (CEO, HQ, Revenue, Founded, No. of Employees, Company Type, Website, Business Segment)
Table 135 Harnois Greenhouses Inc.: Product Benchmarking
Table 136 Harnois Greenhouses Inc.: Strategic Outlook
List of Figures
Figure 1 Commercial Greenhouse Market Segmentation
Figure 2 Commercial Greenhouse Market by Size: Market Attractiveness Index
Figure 3 Commercial Greenhouse Market by Component: Market Attractiveness Index
Figure 4 Commercial Greenhouse Market by Product Type: Market Attractiveness Index
Figure 5 Commercial Greenhouse Market by Glazing Material Type: Market Attractiveness Index
Figure 6 Commercial Greenhouse Market by System: Market Attractiveness Index
Figure 7 Commercial Greenhouse Market Attractiveness Index by Region
Figure 8 Commercial Greenhouse Market: Market Dynamics
Figure 9 Commercial Greenhouse Market: Porter’s Five Forces Analysis
Figure 10 Global Commercial Greenhouse Market Share Forecast by COVID, 2024-2034 (%)
Figure 11 Global Commercial Greenhouse Market by Region, 2024-2034 (US$ Bn, AGR (%)) (V-Shaped Recovery Scenario)
Figure 12 Global Commercial Greenhouse Market by Region, 2024-2034 (US$ Bn, AGR (%)) (U-Shaped Recovery Scenario)
Figure 13 Global Commercial Greenhouse Market by Region, 2024-2034 (US$ Bn, AGR (%)) (W-Shaped Recovery Scenario)
Figure 14 Global Commercial Greenhouse Market by Region, 2024-2034 (US$ Bn, AGR (%)) (L-Shaped Recovery Scenario)
Figure 15 Commercial Greenhouse Market: PEST Analysis
Figure 16 Commercial Greenhouse Market by Size: Market Attractiveness Index
Figure 17 Global Commercial Greenhouse Market by Size, 2024-2034 (US$ Bn, AGR (%))
Figure 18 Commercial Greenhouse Market Share Forecast by Size, 2024, 2029, 2034 (%)
Figure 19 Small/Mid-Scale Greenhouses Market by Region, 2024-2034 (US$ Bn, AGR (%))
Figure 20 Small/Mid-Scale Greenhouses Market Share Forecast by Region, 2024 & 2034 (%)
Figure 21 Large-Scale Greenhouses Market by Region, 2024-2034 (US$ Bn, AGR (%))
Figure 22 Large-Scale Greenhouses Market Share Forecast by Region, 2024 & 2034 (%)
Figure 23 Commercial Greenhouse Market by Component: Market Attractiveness Index
Figure 24 Global Commercial Greenhouse Market by Component, 2024-2034 (US$ Bn, AGR (%))
Figure 25 Commercial Greenhouse Market Share Forecast by Component, 2024, 2029, 2034 (%)
Figure 26 Hardware Market by Region, 2024-2034 (US$ Bn, AGR (%))
Figure 27 Hardware Market Share Forecast by Region, 2024 & 2034 (%)
Figure 28 Glazing Materials Market by Region, 2024-2034 (US$ Bn, AGR (%))
Figure 29 Glazing Materials Market Share Forecast by Region, 2024 & 2034 (%)
Figure 30 Systems Market by Region, 2024-2034 (US$ Bn, AGR (%))
Figure 31 Systems Market Share Forecast by Region, 2024 & 2034 (%)
Figure 32 Commercial Greenhouse Market by Product Type: Market Attractiveness Index
Figure 33 Global Commercial Greenhouse Market by Product Type, 2024-2034 (US$ Bn, AGR (%))
Figure 34 Commercial Greenhouse Market Share Forecast by Product Type, 2024, 2029, 2034 (%)
Figure 35 Vegetables Market by Region, 2024-2034 (US$ Bn, AGR (%))
Figure 36 Vegetables Market Share Forecast by Region, 2024 & 2034 (%)
Figure 37 Fruits Market by Region, 2024-2034 (US$ Bn, AGR (%))
Figure 38 Fruits Market Share Forecast by Region, 2024 & 2034 (%)
Figure 39 Flowers & Ornamentals Market by Region, 2024-2034 (US$ Bn, AGR (%))
Figure 40 Flowers & Ornamentals Market Share Forecast by Region, 2024 & 2034 (%)
Figure 41 Nursery Crops Market by Region, 2024-2034 (US$ Bn, AGR (%))
Figure 42 Nursery Crops Market Share Forecast by Region, 2024 & 2034 (%)
Figure 43 Commercial Greenhouse Market by Glazing Material Type: Market Attractiveness Index
Figure 44 Global Commercial Greenhouse Market by Glazing Material Type, 2024-2034 (US$ Bn, AGR (%))
Figure 45 Commercial Greenhouse Market Share Forecast by Glazing Material Type, 2024, 2029, 2034 (%)
Figure 46 Polyethylene Film Market by Region, 2024-2034 (US$ Bn, AGR (%))
Figure 47 Polyethylene Film Market Share Forecast by Region, 2024 & 2034 (%)
Figure 48 Polycarbonate Sheet Market by Region, 2024-2034 (US$ Bn, AGR (%))
Figure 49 Polycarbonate Sheet Market Share Forecast by Region, 2024 & 2034 (%)
Figure 50 Acrylic Sheet Market by Region, 2024-2034 (US$ Bn, AGR (%))
Figure 51 Acrylic Sheet Market Share Forecast by Region, 2024 & 2034 (%)
Figure 52 Glass Materials Market by Region, 2024-2034 (US$ Bn, AGR (%))
Figure 53 Glass Market Share Forecast by Region, 2024 & 2034 (%)
Figure 54 Other Glazing Material Market by Region, 2024-2034 (US$ Bn, AGR (%))
Figure 55 Other Market Share Forecast by Region, 2024 & 2034 (%)
Figure 56 Commercial Greenhouse Market by System: Market Attractiveness Index
Figure 57 Global Commercial Greenhouse Market by System, 2024-2034 (US$ Bn, AGR (%))
Figure 58 Commercial Greenhouse Market Share Forecast by System, 2024, 2029, 2034 (%)
Figure 59 Lighting Systems Market by Region, 2024-2034 (US$ Bn, AGR (%))
Figure 60 Lighting Systems Market Share Forecast by Region, 2024 & 2034 (%)
Figure 61 Irrigation Systems Market by Region, 2024-2034 (US$ Bn, AGR (%))
Figure 62 Irrigation Systems Market Share Forecast by Region, 2024 & 2034 (%)
Figure 63 Climate Control Systems Market by Region, 2024-2034 (US$ Bn, AGR (%))
Figure 64 Climate Control Systems Market Share Forecast by Region, 2024 & 2034 (%)
Figure 65 System Controls Market by Region, 2024-2034 (US$ Bn, AGR (%))
Figure 66 System Controls Market Share Forecast by Region, 2024 & 2034 (%)
Figure 67 Communication Systems Market by Region, 2024-2034 (US$ Bn, AGR (%))
Figure 68 Communication Systems Market Share Forecast by Region, 2024 & 2034 (%)
Figure 69 Other Systems Market by Region, 2024-2034 (US$ Bn, AGR (%))
Figure 70 Other Systems Market Share Forecast by Region, 2024 & 2034 (%)
Figure 71 Commercial Greenhouse Market Forecast by Region 2024 and 2034 (Revenue, CAGR%)
Figure 72 Commercial Greenhouse Market Share Forecast by Region 2024, 2029, 2034 (%)
Figure 73 Global Commercial Greenhouse Market by Region, 2024-2034 (US$ Bn, AGR (%))
Figure 74 North America Commercial Greenhouse Market Attractiveness Index
Figure 75 North America Commercial Greenhouse Market by Region, 2024, 2029 & 2034 (US$ Billion)
Figure 76 North America Commercial Greenhouse Market by Value, 2024-2034 (US$ Bn, AGR (%))
Figure 77 North America Commercial Greenhouse Market by Country, 2024-2034 (US$ Bn, AGR (%))
Figure 78 North America Commercial Greenhouse Market Share Forecast by Country, 2024 & 2034 (%)
Figure 79 North America Commercial Greenhouse Market by Size, 2024-2034 (US$ Bn, AGR (%))
Figure 80 North America Commercial Greenhouse Market Share Forecast Size, 2024 & 2034 (%)
Figure 81 North America Commercial Greenhouse Market by Component, 2024-2034 (US$ Bn, AGR (%))
Figure 82 North America Commercial Greenhouse Market Share Forecast by Component, 2024 & 2034 (%)
Figure 83 North America Commercial Greenhouse Market by Product Type, 2024-2034 (US$ Bn, AGR (%))
Figure 84 North America Commercial Greenhouse Market Share Forecast by Product Type, 2024 & 2034 (%)
Figure 85 North America Commercial Greenhouse Market by Glazing Material Type, 2024-2034 (US$ Bn, AGR (%))
Figure 86 North America Commercial Greenhouse Market Share Forecast by Glazing Material Type, 2024 & 2034 (%)
Figure 87 North America Commercial Greenhouse Market by System, 2024-2034 (US$ Bn, AGR (%))
Figure 88 North America Commercial Greenhouse Market Share Forecast by System, 2024 & 2034 (%)
Figure 89 US Commercial Greenhouse Market by Value, 2024-2034 (US$ Bn, AGR (%))
Figure 90 Canada Commercial Greenhouse Market by Value, 2024-2034 (US$ Bn, AGR (%))
Figure 91 Europe Commercial Greenhouse Market Attractiveness Index
Figure 92 Europe Commercial Greenhouse Market by Region, 2024, 2029 & 2034 (US$ Billion)
Figure 93 Europe Commercial Greenhouse Market by Value, 2024-2034 (US$ Bn, AGR (%))
Figure 94 Europe Commercial Greenhouse Market by Country, 2024-2034 (US$ Bn, AGR (%))
Figure 95 Europe Commercial Greenhouse Market Share Forecast by Country, 2024 & 2034 (%)
Figure 96 Europe Commercial Greenhouse Market by Size, 2024-2034 (US$ Bn, AGR (%))
Figure 97 Europe Commercial Greenhouse Market Share Forecast Size, 2024 & 2034 (%)
Figure 98 Europe Commercial Greenhouse Market by Component, 2024-2034 (US$ Bn, AGR (%))
Figure 99 Europe Commercial Greenhouse Market Share Forecast by Component, 2024 & 2034 (%)
Figure 100 Europe Commercial Greenhouse Market by Product Type, 2024-2034 (US$ Bn, AGR (%))
Figure 101 Europe Commercial Greenhouse Market Share Forecast by Product Type, 2024 & 2034 (%)
Figure 102 Europe Commercial Greenhouse Market by Glazing Material Type, 2024-2034 (US$ Bn, AGR (%))
Figure 103 Europe Commercial Greenhouse Market Share Forecast by Glazing Material Type, 2024 & 2034 (%)
Figure 104 Europe Commercial Greenhouse Market by System, 2024-2034 (US$ Bn, AGR (%))
Figure 105 Europe Commercial Greenhouse Market Share Forecast by System, 2024 & 2034 (%)
Figure 106 Germany Commercial Greenhouse Market by Value, 2024-2034 (US$ Bn, AGR (%))
Figure 107 Netherlands Commercial Greenhouse Market by Value, 2024-2034 (US$ Bn, AGR (%))
Figure 108 Turkey Commercial Greenhouse Market by Value, 2024-2034 (US$ Bn, AGR (%))
Figure 109 Italy Commercial Greenhouse Market by Value, 2024-2034 (US$ Bn, AGR (%))
Figure 110 Spain Commercial Greenhouse Market by Value, 2024-2034 (US$ Bn, AGR (%))
Figure 111 France Commercial Greenhouse Market by Value, 2024-2034 (US$ Bn, AGR (%))
Figure 112 UK Commercial Greenhouse Market by Value, 2024-2034 (US$ Bn, AGR (%))
Figure 113 Rest of Europe Commercial Greenhouse Market by Value, 2024-2034 (US$ Bn, AGR (%))
Figure 114 Asia-Pacific Commercial Greenhouse Market Attractiveness Index
Figure 115 Asia-Pacific Commercial Greenhouse Market by Region, 2024, 2029 & 2034 (US$ Billion)
Figure 116 Asia-Pacific Commercial Greenhouse Market by Value, 2024-2034 (US$ Bn, AGR (%))
Figure 117 Asia-Pacific Commercial Greenhouse Market by Country, 2024-2034 (US$ Bn, AGR (%))
Figure 118 Asia-Pacific Commercial Greenhouse Market Share Forecast by Country, 2024 & 2034 (%)
Figure 119 Asia-Pacific Commercial Greenhouse Market by Size, 2024-2034 (US$ Bn, AGR (%))
Figure 120 Asia-Pacific Commercial Greenhouse Market Share Forecast Size, 2024 & 2034 (%)
Figure 121 Asia-Pacific Commercial Greenhouse Market by Component, 2024-2034 (US$ Bn, AGR (%))
Figure 122 Asia-Pacific Commercial Greenhouse Market Share Forecast by Component, 2024 & 2034 (%)
Figure 123 Asia-Pacific Commercial Greenhouse Market by Product Type, 2024-2034 (US$ Bn, AGR (%))
Figure 124 Asia-Pacific Commercial Greenhouse Market Share Forecast by Product Type, 2024 & 2034 (%)
Figure 125 Asia-Pacific Commercial Greenhouse Market by Glazing Material Type, 2024-2034 (US$ Bn, AGR (%))
Figure 126 Asia-Pacific Commercial Greenhouse Market Share Forecast by Glazing Material Type, 2024 & 2034 (%)
Figure 127 Asia-Pacific Commercial Greenhouse Market by System, 2024-2034 (US$ Bn, AGR (%))
Figure 128 Asia-Pacific Commercial Greenhouse Market Share Forecast by System, 2024 & 2034 (%)
Figure 129 China Commercial Greenhouse Market by Value, 2024-2034 (US$ Bn, AGR (%))
Figure 130 India Commercial Greenhouse Market by Value, 2024-2034 (US$ Bn, AGR (%))
Figure 131 Japan Commercial Greenhouse Market by Value, 2024-2034 (US$ Bn, AGR (%))
Figure 132 South Korea Commercial Greenhouse Market by Value, 2024-2034 (US$ Bn, AGR (%))
Figure 133 Australia Commercial Greenhouse Market by Value, 2024-2034 (US$ Bn, AGR (%))
Figure 134 Taiwan Commercial Greenhouse Market by Value, 2024-2034 (US$ Bn, AGR (%))
Figure 135 Rest of Asia-Pacific Commercial Greenhouse Market by Value, 2024-2034 (US$ Bn, AGR (%))
Figure 136 Middle East and Africa Commercial Greenhouse Market Attractiveness Index
Figure 137 Middle East and Africa Commercial Greenhouse Market by Region, 2024, 2029 & 2034 (US$ Billion)
Figure 138 Middle East & Africa Commercial Greenhouse Market by Value, 2024-2034 (US$ Bn, AGR (%))
Figure 139 Middle East & Africa Commercial Greenhouse Market by Country, 2024-2034 (US$ Bn, AGR (%))
Figure 140 Middle East and Africa Commercial Greenhouse Market Share Forecast by Country, 2024 & 2034 (%)
Figure 141 Middle East & Africa Commercial Greenhouse Market by Size, 2024-2034 (US$ Bn, AGR (%))
Figure 142 Middle East and Africa Commercial Greenhouse Market Share Forecast Size, 2024 & 2034 (%)
Figure 143 Middle East & Africa Commercial Greenhouse Market by Component, 2024-2034 (US$ Bn, AGR (%))
Figure 144 Middle East and Africa Commercial Greenhouse Market Share Forecast by Component, 2024 & 2034 (%)
Figure 145 Middle East & Africa Commercial Greenhouse Market by Product Type, 2024-2034 (US$ Bn, AGR (%))
Figure 146 Middle East and Africa Commercial Greenhouse Market Share Forecast by Product Type, 2024 & 2034 (%)
Figure 147 Middle East & Africa Commercial Greenhouse Market by Glazing Material Type, 2024-2034 (US$ Bn, AGR (%))
Figure 148 Middle East and Africa Commercial Greenhouse Market Share Forecast by Glazing Material Type, 2024 & 2034 (%)
Figure 149 Middle East & Africa Commercial Greenhouse Market by System, 2024-2034 (US$ Bn, AGR (%))
Figure 150 Middle East and Africa Commercial Greenhouse Market Share Forecast by System, 2024 & 2034 (%)
Figure 151 GCC Commercial Greenhouse Market by Value, 2024-2034 (US$ Bn, AGR (%))
Figure 152 South Africa Commercial Greenhouse Market by Value, 2024-2034 (US$ Bn, AGR (%))
Figure 153 Rest of Middle East & Africa Commercial Greenhouse Market by Value, 2024-2034 (US$ Bn, AGR (%))
Figure 154 Latin America Commercial Greenhouse Market Attractiveness Index
Figure 155 Latin America Commercial Greenhouse Market by Region, 2024, 2029 & 2034 (US$ Billion)
Figure 156 Latin America Commercial Greenhouse Market by Value, 2024-2034 (US$ Bn, AGR (%))
Figure 157 Latin America Commercial Greenhouse Market by Country, 2024-2034 (US$ Bn, AGR (%))
Figure 158 Latin America Commercial Greenhouse Market Share Forecast by Country, 2024 & 2034 (%)
Figure 159 Latin America Commercial Greenhouse Market by Size, 2024-2034 (US$ Bn, AGR (%))
Figure 160 Latin America Commercial Greenhouse Market Share Forecast Size, 2024 & 2034 (%)
Figure 161 Latin America Commercial Greenhouse Market by Component, 2024-2034 (US$ Bn, AGR (%))
Figure 162 Latin America Commercial Greenhouse Market Share Forecast by Component, 2024 & 2034 (%)
Figure 163 Latin America Commercial Greenhouse Market by Product Type, 2024-2034 (US$ Bn, AGR (%))
Figure 164 Latin America Commercial Greenhouse Market Share Forecast by Product Type, 2024 & 2034 (%)
Figure 165 Latin America Commercial Greenhouse Market by Glazing Material Type, 2024-2034 (US$ Bn, AGR (%))
Figure 166 Latin America Commercial Greenhouse Market Share Forecast by Glazing Material Type, 2024 & 2034 (%)
Figure 167 Latin America Commercial Greenhouse Market by System, 2024-2034 (US$ Bn, AGR (%))
Figure 168 Latin America Commercial Greenhouse Market Share Forecast by System, 2024 & 2034 (%)
Figure 169 Brazil Commercial Greenhouse Market by Value, 2024-2034 (US$ Bn, AGR (%))
Figure 170 Mexico Commercial Greenhouse Market by Value, 2024-2034 (US$ Bn, AGR (%))
Figure 171 Rest of Latin America Commercial Greenhouse Market by Value, 2024-2034 (US$ Bn, AGR (%))
Figure 172 Berry Global Group, Inc..: Net Revenue, 2019-2023 (US$ Million, AGR%)
Figure 173 Berry Global Group, Inc..: R&D, 2019-2023 (US$ Million, AGR%)
Figure 174 Berry Global Group, Inc..: Regional Revenue Share, 2023 (%)
Figure 175 Berry Global Group, Inc..: Business Segment Revenue Share, 2023 (%)
Figure 176 Certhon..: Net Revenue, 2019-2023 (US$ Million, AGR%)
Figure 177 Everlight Electronics Co Ltd.: Net Revenue, 2018-2022 (US$ Million, AGR%)
Figure 178 Everlight Electronics Co Ltd.: R&D, 2018-2022 (US$ Million, AGR%)
Figure 179 Everlight Electronics Co Ltd.: Regional Revenue Share, 2022 (%)
Figure 180 Everlight Electronics Co Ltd.: Business Segment Revenue Share, 2022 (%)
Figure 181 Heliospectra AB.: Net Revenue, 2019-2023 (US$ Million, AGR%)
Figure 182 Plastika Kritis S.A..: Net Revenue, 2018-2022 (US$ Million, AGR%)
Figure 183 Signify Holding B.V.: Net Revenue, 2019-2023 (US$ Million, AGR%)
Figure 184 Signify Holding B.V.: R&D, 2019-2023 (US$ Million, AGR%)
Figure 185 Signify Holding B.V.: Regional Revenue Share, 2023 (%)
Figure 186 Signify Holding B.V.: Business Segment Revenue Share, 2023 (%)
Figure 187 Gibraltar Industries, Inc.: Net Revenue, 2019-2023 (US$ Million, AGR%)
ページTOPに戻る
よくあるご質問
Visiongain社はどのような調査会社ですか?
英国の調査会社ヴィジョンゲイン社(Visiongain)は、通信とエネルギーのほか、自動車や化学・医薬品、金属など、広範な市場を対象に調査を行っています。自動車市場については、市場全般に関する調査のほ... もっと見る
調査レポートの納品までの日数はどの程度ですか?
在庫のあるものは速納となりますが、平均的には 3-4日と見て下さい。
但し、一部の調査レポートでは、発注を受けた段階で内容更新をして納品をする場合もあります。
発注をする前のお問合せをお願いします。
注文の手続きはどのようになっていますか?
1)お客様からの御問い合わせをいただきます。
2)見積書やサンプルの提示をいたします。
3)お客様指定、もしくは弊社の発注書をメール添付にて発送してください。
4)データリソース社からレポート発行元の調査会社へ納品手配します。
5) 調査会社からお客様へ納品されます。最近は、pdfにてのメール納品が大半です。
お支払方法の方法はどのようになっていますか?
納品と同時にデータリソース社よりお客様へ請求書(必要に応じて納品書も)を発送いたします。
お客様よりデータリソース社へ(通常は円払い)の御振り込みをお願いします。
請求書は、納品日の日付で発行しますので、翌月最終営業日までの当社指定口座への振込みをお願いします。振込み手数料は御社負担にてお願いします。
お客様の御支払い条件が60日以上の場合は御相談ください。
尚、初めてのお取引先や個人の場合、前払いをお願いすることもあります。ご了承のほど、お願いします。
データリソース社はどのような会社ですか?
当社は、世界各国の主要調査会社・レポート出版社と提携し、世界各国の市場調査レポートや技術動向レポートなどを日本国内の企業・公官庁及び教育研究機関に提供しております。
世界各国の「市場・技術・法規制などの」実情を調査・収集される時には、データリソース社にご相談ください。
お客様の御要望にあったデータや情報を抽出する為のレポート紹介や調査のアドバイスも致します。
|
|


