農業用ロボット市場レポート:2023-2033
Agricultural Robots Market Report 2023-2033
レポート詳細
農業用ロボット市場レポート 2023-2033 : 本レポートは、業界とその基礎となる力学をよりよく理解したい場合、新たな収益ポケットを目指す大手企業にとって貴重なものとなるでしょう。... もっと見る
※上記価格は部署ライセンス(Departmental licence)価格です。
その他の価格についてはデータリソースまでお問合せください。
日本語のページは自動翻訳を利用し作成しています。
実際のレポートは英文のみでご納品いたします。
サマリー
レポート詳細
農業用ロボット市場レポート 2023-2033: 本レポートは、業界とその基礎となる力学をよりよく理解したい場合、新たな収益ポケットを目指す大手企業にとって貴重なものとなるでしょう。また、異業種への進出や新地域での既存事業の拡大を目指す企業にとっても有益なレポートです。
労働力不足と労働コストの上昇
農業の労働力不足と労働コストの上昇が、農業用ロボットの需要を押し上げています。熟練労働者の確保が難しくなり、賃金が上昇する中、農家は作業を最適化するために自動化に目を向けています。高齢化と労働力の減少が農業分野の課題となっている日本では、労働力不足に対処し生産性を向上させるために、自律型収穫ロボットのようなロボットソリューションが開発されています。
精密農業と農作業の増加
可変量施肥や部位別作物管理などの精密農業技術の導入が、農業用ロボットの需要を押し上げています。これらのロボットは、正確で的を絞った作業を可能にし、資源の活用と作物の収穫を最適化します。センサーや画像処理技術を搭載したロボットプラットフォームは、土壌分析、作物のモニタリング、肥料や農薬の重点的な散布に使用され、効率的で持続可能な農業の実践につながっています。
マーケットリサーチレポートを購入する前に、どのような質問をするべきか?
- 農業用ロボット市場はどのように進化しているのか?
- 農業用ロボット市場を牽引し、抑制しているものは何か?
- 農業用ロボットの各サブマーケットセグメントは予測期間中にどのように成長し、2033年にこれらのサブマーケットが占める売上はどの程度になるのか?
- 2023年から2033年にかけて、各農業用ロボットサブマーケットの市場シェアはどのように推移するのか?
- 2023年から2033年にかけて、市場全体の主な牽引役となるのは何か?
- 主要な農業用ロボット市場はマクロ経済ダイナミクスに広く追随するのか、それとも個々の国別市場が他を凌駕するのか?
- 2033年までに各国市場のシェアはどのように変化し、2033年に市場をリードするのはどの地域なのか?
- 主要プレイヤーは誰で、予測期間中の見通しはどうなっているのか?
- これらの主要企業の農業用ロボットプロジェクトはどのようなものか?
- 2023年から2033年の間に、業界はどのように進化していくのか?現在および今後10年間に行われる農業用ロボットのプロジェクトにはどのような意味があるのか?
- 農業用ロボット市場をさらに拡大するために、製品の商業化の必要性は高まっているのか?
- 農業用ロボット市場の方向性と、市場の最前線に立つためにはどうしたらよいか?
- 新製品やサービスラインに対する最適な投資オプションは何か?
- 企業を新たな成長軌道に乗せ、C-suiteに移行させるための重要な展望とは?
このことが、現在、そして今後10年間の農業用ロボット市場にどのような影響を与えるかを見極める必要があります:
- 294ページにわたる本レポートでは、111の表と146のチャート/グラフを独占的に提供します。
- 本レポートでは、業界における主要な収益性の高い分野を取り上げており、今すぐその分野をターゲットにすることができます。
- 世界、地域、国の売上と成長に関する詳細な分析が含まれています。
- 競合他社が成功した主要なトレンド、変化、収益予測をハイライトしています。
本レポートは、農業用ロボット市場が今後10年間でどのように発展するか、またCOVID-19の景気後退とバウンスの変動に合わせて、今日のあなたに伝えます。この市場は、過去10年間のどの時点よりも今が重要である。
2033年までの予測やその他の分析により、商業的な展望を明らかにする。
- 2033年までの収益予測に加え、直近の実績、成長率、市場シェアもご覧いただけます。
- ビジネスの展望や展開など、独自の分析がご覧いただけます。
- 定性的分析(市場力学、促進要因、機会、阻害要因、課題など)、コスト構造、農業用ロボット価格上昇の影響、最近の動向をご覧いただけます。
本レポートでは、COVID-19が業界や貴社にどのような影響を与えるかについて、データ分析および貴重な知見を提供しています。COVID-19の4つの回収パターン、すなわち「V」「L」「W」「U」の回収パターンとその影響について考察しています。
報告書の対象セグメント
農産物別市場セグメント
- 酪農・家畜
- 畑作物
- 果物・野菜
- その他農作物
用途別セグメント
- 酪農・家畜の管理
- 収穫管理
- 畑作
- 土壌・灌漑管理
- その他の用途
タイプ別市場セグメント
- 搾乳ロボット
- UAV/ドローン
- 自動収穫システム
- ドライバーレストラクター
- ロボット除草・種まき
- その他のタイプ
世界市場全体およびセグメントの収益予測に加え、4地域および主要20カ国市場の収益予測も掲載しています:
北米
- アメリカ
- カナダ
欧州
- ドイツ
- オランダ
- イギリス
- フランス
- イタリア
- その他の欧州地域
アジア太平洋地域
- 中国
- 日本
- インド
- オーストラリア
- 韓国
- その他のアジア太平洋地域
ラテンアメリカ
- ブラジル
- メキシコ
- その他ラテンアメリカ
中近東・アフリカ
- GCC
- 南アフリカ
- その他の中東・アフリカ地域
農業用ロボット市場の2023年から2033年にかけての主要企業のプロファイルと、これらの企業のこのセグメントに焦点を当てたいくつかの企業についても報告しています。
主要企業と市場成長の可能性
・ AGCO Corporation
・ AgEagle Aerial Systems Inc.
・ BouMatic Robotics B.V.
・ CNH Industrial N.V.
・ Deepfield Robotics
・ Deere & Company
・ DeLaval
・ ecoRobotix
・ Harvest Automation Inc.
・ Kubota Corporation
・ Lely Industries N.V.
・ Naïo Technologies
・ Robotics Plus Ltd
・ Trimble Inc.
・ Yanmar Co., Ltd.
農業用ロボット市場の世界全体の収益、2023年から2033年までの金額ベースで、市場は2023年に157億4000万米ドルを突破すると、当作品は計算しています。2033年まで収益が大きく伸びることが予測されます。当社の調査では、最も大きな可能性を秘めた企業を特定しています。彼らの能力、進歩、商業的展望を発見することで、常に先を行くことができます。
農業用ロボット市場、2023年から2033年までのレポートはどのように役立つのでしょうか?
まとめると、290ページを超えるレポートでは、以下のような知識を得ることができます:
- 農業用ロボット市場、2023年から2033年までの収益予測 農産物、タイプ、アプリケーションの各予測を世界および地域レベルで掲載 - 業界の展望を発見し、投資と収益のための最も有利な場所を見つけることができます。
- 4つの地域と20の主要国市場の2033年までの収益予測 - 農業用ロボット市場、2023年から2033年までの北米、欧州、アジア太平洋、ラテンアメリカ、中東&アフリカの市場予測をご覧いただけます。また、米国、カナダ、ブラジル、ドイツ、フランス、英国、イタリア、中国、インド、日本、オーストラリアなど、著名な経済圏の市場も予測しています。
- 既存企業および市場参入を目指す企業の展望 - 農業用ロボット市場に関わる主要企業15社の企業プロファイルを含む、2023年から2033年にかけての市場。
独自の予測による定量・定性分析をご覧いただけます。私たちのレポートだけが持つ情報を入手し、貴重なビジネスインテリジェンスとして情報を得ることができます。
他にはない情報
私たちの新しいレポートがあれば、知識に遅れをとったり、チャンスを逃したりする可能性は低くなります。私たちの仕事があなたの調査、分析、意思決定にどのように役立つかをご覧ください。Visiongainの調査は、農業用ロボット市場、2023年から2033年、市場をリードする企業の商業分析を必要とするすべての人のためのものです。データ、トレンド、予測を見つけることができます。
ページTOPに戻る
目次
目次
1 レポートの概要
1.1 調査の目的
1.2 農業用ロボット市場の紹介
1.3 本レポートが提供するもの
1.4 本レポートを読むべき理由
1.5 本分析レポートが回答する主な疑問点
1.6 本レポートは誰のためのものか?
1.7 調査方法
1.7.1 市場の定義
1.7.2 市場評価・予測手法
1.7.3 データの検証
1.7.3.1 プライマリーリサーチ
1.7.3.2 セカンダリーリサーチ
1.8 よくある質問(FAQs)
1.9 関連するVisiongainのレポート
1.10 Visiongainについて
2 エグゼクティブサマリー
3 市場の概要
3.1 主要な調査結果
3.2 マーケットダイナミクス
3.2.1 市場促進要因
3.2.1.1 世界人口の増加と食料需要の増加
3.2.1.2 農業生産性向上と収穫量増加の必要性
3.2.1.3 農業セクターの労働力不足
3.2.2 市場抑制要因
3.2.2.1 高い初期投資と導入コスト
3.2.2.2 農業従事者の農業用ロボットに対する認識と理解の低さ
3.2.2.3 既存の農業インフラにロボットシステムを統合する際の課題
3.2.3 市場機会
3.2.3.1 精密農業と場所別農業技術への需要の高まり
3.2.3.2 農業活動が盛んな新興国への農業用ロボットの進出
3.2.3.3 畜産業におけるロボットと自動化の採用の増加
3.2.4 COVID-19の影響度分析
3.2.5 V字回復シナリオ
3.2.6 W字型回復シナリオ
3.2.7 U字型回復シナリオ
3.2.8 L字型回復シナリオ
3.3 ポーターのファイブフォース分析
3.3.1 新規参入の脅威
3.3.2 買い手のバーゲニングパワー
3.3.3 供給者のバーゲニングパワー
3.3.4 代替製品または代替サービスの脅威
3.3.5 競争相手のライバルの激しさ
3.4 SWOT
3.4.1 強み
3.4.2 弱点
3.4.3 機会
3.4.4 脅威
3.5 PESTLE分析
3.5.1 政治的要因
3.5.2 経済的要因
3.5.3 社会的要因
3.5.4 技術的要因
3.5.5 環境要因
3.5.6 法的要因
3.5.7 倫理的要因
4 農業用ロボット市場分析:農産物別
4.1 主要な調査結果
4.2 農産物セグメントの 市場魅力度指数
4.2.1 農産物別の農業用ロボット市場
4.3 酪農・畜産分野
4.3.1 地域別市場、2023年~2033年(US$ Bn)
4.3.2 2023年・2033年地域別市場シェア(%)
4.4 畑作物
4.4.1 地域別市場、2023年~2033年(US$ Bn)
4.4.2 2023年・2033年地域別市場シェア(%)
4.5 果物・野菜
4.5.1 地域別市場、2023年~2033年(US$ Bn)
4.5.2 2023年・2033年地域別市場シェア(%)
4.6 その他の農産物
4.6.1 地域別市場、2023年~2033年(US$ Bn)
4.6.2 2023年・2033年地域別市場シェア(%)
4 農業用ロボットの農産物別市場分析
4.1 主要な調査結果
4.2 農作物セグメントの 市場魅力度指数
4.2.1 農産物別の農業用ロボット市場
4.3 酪農・畜産分野
4.3.1 地域別市場、2023年~2033年(US$ Bn)
4.3.2 2023年・2033年地域別市場シェア(%)
4.4 畑作物
4.4.1 地域別市場、2023年~2033年(US$ Bn)
4.4.2 2023年・2033年地域別市場シェア(%)
4.5 果物・野菜
4.5.1 地域別市場、2023年~2033年(US$ Bn)
4.5.2 2023年・2033年地域別市場シェア(%)
4.6 その他の農作物
4.6.1 地域別市場、2023年~2033年(US$ Bn)
4.6.2 2023年・2033年地域別市場シェア(%)
5 農業用ロボット市場分析:用途別
5.1 主要な調査結果
5.2 用途別セグメント別 市場魅力度指数
5.2.1 農業用ロボット市場用途別
5.3 酪農と家畜の管理
5.3.1 地域別市場、2023年~2033年(US$ Bn)
5.3.2 2023年・2033年地域別市場シェア(%)
5.4 収穫管理
5.4.1 地域別市場、2023年~2033年(US$ Bn)
5.4.2 2023年・2033年地域別市場シェア(%)
5.5 フィールドファーミング
5.5.1 地域別市場、2023年~2033年(US$ Bn)
5.5.2 2023年・2033年地域別市場シェア(%)
5.6 土壌と灌漑の管理
5.6.1 地域別市場、2023年~2033年(US$ Bn)
5.6.2 2023年・2033年地域別市場シェア(%)
5.7 その他の用途
5.7.1 地域別市場、2023年~2033年(US$ Bn)
5.7.2 2023年・2033年地域別市場シェア(%)
6 農業用ロボット市場分析:タイプ別
6.1 主要な調査結果
6.2 タイプセグメント別 市場魅力度指数
6.2.1 農業用ロボットのタイプ別市場
6.3 ミルキングロボット
6.3.1 地域別市場、2023年~2033年(US$ Bn)
6.3.2 2023年・2033年地域別市場シェア(%)
6.4 UAVs/Drones
6.4.1 地域別市場、2023年~2033年(US$ Bn)
6.4.2 2023年・2033年地域別市場シェア(%)
6.5 自動収穫システム
6.5.1 地域別市場、2023年~2033年(US$ Bn)
6.5.2 2023年・2033年地域別市場シェア(%)
6.6 ドライバーレス・トラクター
6.6.1 地域別市場、2023年~2033年(US$ Bn)
6.6.2 2023年・2033年地域別市場シェア(%)
6.7 ロボットによる除草・種まき
6.7.1 地域別市場、2023年~2033年(US$ Bn)
6.7.2 2023年・2033年地域別市場シェア(%)
6.8 その他のタイプ
6.8.1 地域別市場、2023年~2033年(US$ Bn)
6.8.2 2023年・2033年地域別市場シェア(%)
7 農業用ロボット市場分析:地域別
7.1 主要な調査結果
7.2 農業用ロボットの地域別市場
8 北米の農業用ロボット市場分析
8.1 主要な調査結果
8.2 北米の農業用ロボット市場魅力度指数
8.3 北米の農業用ロボット市場:国別、2023年、2028年、2033年(US$ Billion)
8.4 北米の農業用ロボット市場:金額ベース
8.5 北米の農業用ロボット市場:国別
8.6 北米の農業用ロボット市場:農産物別
8.7 北米の農業用ロボット市場:用途別
8.8 北米の農業用ロボット市場:タイプ別
8.9 アメリカ農業ロボット市場分析
8.10 カナダ農業ロボット市場分析
9 欧州の農業用ロボット市場分析
9.1 主要な調査結果
9.2 欧州の農業用ロボット市場魅力度指数
9.3 欧州の農業用ロボット市場:国別、2023年、2028年、2033年(US$ Billion)
9.4 欧州の農業用ロボット市場:金額ベース
9.5 欧州の農業用ロボット市場:国別
9.6 欧州の農業用ロボット市場:農産物別
9.7 欧州の農業用ロボット市場:用途別
9.8 欧州の農業用ロボット市場:タイプ別
9.9 ドイツ農業用ロボット市場分析
9.10 イギリス農業用ロボット市場分析
9.11 フランス農業用ロボット市場分析
9.12 イタリア農業用ロボット市場分析
9.13 オランダ農業用ロボット市場分析
9.14 その他の欧州農業用ロボット市場分析
10 アジア太平洋地域の農業用ロボット市場分析
10.1 主要な調査結果
10.2 アジア太平洋地域の農業用ロボット市場魅力度指数
10.3 アジア太平洋地域の農業用ロボット市場:国別、2023年、2028年、2033年(US$ Billion)
10.4 アジア太平洋地域の農業用ロボット市場:金額ベース
10.5 アジア太平洋地域の農業用ロボット市場:国別
10.6 アジア太平洋地域の農業用ロボット市場:農産物別
10.7 アジア太平洋地域の農業用ロボット市場:用途別
10.8 アジア太平洋地域の農業用ロボットの市場:タイプ別
10.9 中国農業ロボット市場分析
10.10 インド農業用ロボット市場分析
10.11 日本農業ロボット市場分析
10.12 韓国農業用ロボット市場分析
10.13 オーストラリア農業用ロボット市場分析
10.14 その他のアジア太平洋地域の農業用ロボット市場の分析
11 中東・アフリカの農業用ロボット市場分析
11.1 主要な調査結果
11.2 中東・アフリカ農業用ロボット市場魅力度指数
11.3 中東・アフリカ農業用ロボット市場:国別、2023年、2028年、2033年(US$ Billion)
11.4 中東・アフリカ農業用ロボット市場:金額ベース
11.5 中東・アフリカ農業用ロボット市場:国別
11.6 中東・アフリカ農業用ロボット市場:農産物別
11.7 中東・アフリカ農業用ロボット市場:用途別
11.8 中東・アフリカ農業用ロボット市場:タイプ別
11.9 GCC農業ロボットの市場分析
11.10 南アフリカの農業用ロボット市場分析
11.11 その他の中東・アフリカ農業ロボット市場の分析
12 ラテンアメリカの農業用ロボット市場分析
12.1 主要な調査結果
12.2 ラテンアメリカ農業用ロボット市場魅力度指数
12.3 ラテンアメリカの農業用ロボット市場:国別、2023年、2028年、2033年(US$ Billion)
12.4 ラテンアメリカの農業用ロボット市場:金額ベース
12.5 ラテンアメリカの農業用ロボット市場:国別
12.6 ラテンアメリカの農業用ロボット市場:農産物別
12.7 ラテンアメリカの農業用ロボット市場:用途別
12.8 ラテンアメリカの農業用ロボット市場:タイプ別
12.9 ブラジル農業用ロボット市場分析
12.10 メキシコ農業ロボット市場分析
12.11 その他のラテンアメリカ地域農業ロボット市場分析
13 会社概要
13.1 競争環境、2022年
13.2 戦略的な展望
13.2.1 事業戦略としての買収
13.2.2 事業戦略としての契約
13.2.3 事業戦略としての協業
13.2.4 事業戦略としての契約
13.2.5 事業戦略としての事業拡大
13.2.6 事業戦略としての投資
13.2.7 ビジネス戦略としてのジョイントベンチャー
13.2.8 ビジネス戦略としての新製品発表
13.2.9 事業戦略としてのパートナーシップ
13.3 Deere & Company
13.3.1 会社概要
13.3.2 会社概要
13.3.3 財務分析
13.3.3.1 純収益、2018年~2022年
13.3.3.2 R&D、2018年~2022年
13.3.3.3 地域別収入シェア、2022年(%)
13.3.3.4 事業セグメント別売上高シェア、2022年(%)
13.3.4 製品のベンチマーキング
13.3.5 戦略的な展望
13.4 CNH Industrial N.V.
13.4.1 企業スナップショット
13.4.2 会社概要
13.4.3 財務分析
13.4.3.1 純収益、2018年〜2022年
13.4.3.2 R&D、2018年〜2022年
13.4.3.3 地域別収入シェア、2022年(%)
13.4.3.4 事業セグメント別売上高シェア、2022年(%)
13.4.4 製品のベンチマーキング
13.4.5 戦略的な展望
13.5 AGCO Corporation
13.5.1 企業スナップショット
13.5.2 会社概要
13.5.3 財務分析
13.5.3.1 純収益、2018年〜2022年
13.5.3.2 R&D、2018年〜2022年
13.5.3.3 地域別売上高シェア、2022年(%)
13.5.4 製品のベンチマーキング
13.5.5 戦略的な展望
13.6 DeLaval
13.6.1 企業スナップショット
13.6.2 会社概要
13.6.3 製品ベンチマーク
13.6.4 戦略的な展望
13.7 Trimble Inc.
13.7.1 企業スナップショット
13.7.2 会社概要
13.7.3 財務分析
13.7.3.1 純収益、2018年〜2022年
13.7.3.2 R&D、2018年〜2022年
13.7.3.3 事業セグメントの売上高シェア、2022年(%)
13.7.4 製品のベンチマーキング
13.7.5 戦略的な展望
13.8 BouMatic Robotics B.V.
13.8.1 企業スナップショット
13.8.2 会社概要
13.8.3 製品ベンチマーク
13.8.4 戦略的な展望
13.9 Lely Industries N.V.
13.9.1 企業スナップショット
13.9.2 会社概要
13.9.3 製品ベンチマーク
13.9.4 戦略的な展望
13.10 AgEagle Aerial Systems Inc.
13.10.1 企業スナップショット
13.10.2 会社概要
13.10.3 財務分析
13.10.3.1 純収益、2018年〜2022年
13.10.3.2 R&D、2018年〜2022年
13.10.3.3 地域別収入シェア、2022年(%)
13.10.3.4 事業セグメント別売上高シェア、2022年(%)
13.10.4 製品のベンチマーキング
13.10.5 戦略的な展望
13.11 Yanmar Co., Ltd.
13.11.1 企業スナップショット
13.11.2 会社概要
13.11.3 製品ベンチマーク
13.11.4 戦略的な展望
13.12 Deepfield Robotics
13.12.1 企業スナップショット
13.12.2 会社概要
13.12.3 製品ベンチマーク
13.13 ecoRobotix
13.13.1 カンパニースナップショット
13.13.2 会社概要
13.13.3 ベンチマーキング
13.14 Harvest Automation Inc.
13.14.1 企業スナップショット
13.14.2 会社概要
13.14.3 ベンチマーキング
13.15 Naïo Technologies
13.15.1 カンパニースナップショット
13.15.2 会社概要
13.15.3 製品ベンチマーク
13.15.4 戦略的な展望
13.16 Robotics Plus Ltd
13.16.1 企業スナップショット
13.16.2 会社概要
13.16.3 製品ベンチマーキング
13.16.4 戦略的な展望
13.17 株式会社クボタ
13.17.1 Kubota Corporation
13.17.2 会社概要
13.17.3 財務分析
13.17.3.1 純収益、2018年〜2022年
13.17.3.2 地域別収入シェア、2022年(%)
13.17.3.3 事業セグメント別収益シェア、2022年(%)
13.17.4 製品のベンチマーキング
13.17.5 戦略的な展望
14 結論と提言
14.1 Visiongainからの結びの言葉
14.2 市場関係者への提言
ページTOPに戻る
図表リスト
表の一覧
Table 1 Agricultural Robots Market Snapshot, 2023 & 2033 (US$ Billion, CAGR %)
Table 2 Agricultural Robots Market by Region, 2023-2033 (US$ Bn, AGR (%), CAGR (%)) (V-Shaped Recovery Scenario)
Table 3 Agricultural Robots Market by Region, 2023-2033 (US$ Bn, AGR (%), CAGR (%)) (W-Shaped Recovery Scenario)
Table 4 Agricultural Robots Market by Region, 2023-2033 (US$ Bn, AGR (%), CAGR (%)) (U-Shaped Recovery Scenario)
Table 5 Agricultural Robots Market by Region, 2023-2033 (US$ Bn, AGR (%), CAGR (%)) (L-Shaped Recovery Scenario)
Table 6 Agricultural Robots Market by Farm Produce, 2023-2033 (US$ Bn, AGR (%), CAGR (%))
Table 7 Dairy & Livestock Market by Region, 2023-2033 (US$ Bn, AGR (%), CAGR (%))
Table 8 Field Crops Market by Region, 2023-2033 (US$ Bn, AGR (%), CAGR (%))
Table 9 Fruits & Vegetables Market by Region, 2023-2033 (US$ Bn, AGR (%), CAGR (%))
Table 10 Other Farm Produce Market by Region, 2023-2033 (US$ Bn, AGR (%), CAGR (%))
Table 11 Agricultural Robots Market by Application, 2023-2033 (US$ Bn, AGR (%), CAGR (%))
Table 12 Dairy & Livestock Management Market by Region, 2023-2033 (US$ Bn, AGR (%), CAGR (%))
Table 13 Harvest Management Market by Region, 2023-2033 (US$ Bn, AGR (%), CAGR (%))
Table 14 Field Farming Market by Region, 2023-2033 (US$ Bn, AGR (%), CAGR (%))
Table 15 Soil & Irrigation Management Market by Region, 2023-2033 (US$ Bn, AGR (%), CAGR (%))
Table 16 Other Applications Market by Region, 2023-2033 (US$ Bn, AGR (%), CAGR (%))
Table 17 Agricultural Robots Market by Type, 2023-2033 (US$ Bn, AGR (%), CAGR (%))
Table 18 Milking Robots Market by Region, 2023-2033 (US$ Bn, AGR (%), CAGR (%))
Table 19 UAVs/Drones Market by Region, 2023-2033 (US$ Bn, AGR (%), CAGR (%))
Table 20 Automated Harvesting Systems Market by Region, 2023-2033 (US$ Bn, AGR (%), CAGR (%))
Table 21 Driverless Tractors Market by Region, 2023-2033 (US$ Bn, AGR (%), CAGR (%))
Table 22 Robotic Weeding & Seeding Market by Region, 2023-2033 (US$ Bn, AGR (%), CAGR (%))
Table 23 Other Types Market by Region, 2023-2033 (US$ Bn, AGR (%), CAGR (%))
Table 24 Agricultural Robots Market by Region, 2023-2033 (US$ Bn, AGR (%), CAGR (%))
Table 25 North America Agricultural Robots Market by Value, 2023-2033 (US$ Bn, AGR (%), CAGR (%))
Table 26 North America Agricultural Robots Market by Country, 2023-2033 (US$ Bn, AGR (%), CAGR (%))
Table 27 North America Agricultural Robots Market by Farm Produce, 2023-2033 (US$ Bn, AGR (%), CAGR (%))
Table 28 North America Agricultural Robots Market by Application, 2023-2033 (US$ Bn, AGR (%), CAGR (%))
Table 29 North America Agricultural Robots Market by Type, 2023-2033 (US$ Bn, AGR (%), CAGR (%))
Table 30 US Agricultural Robots Market by Value, 2023-2033 (US$ Bn, AGR (%), CAGR (%))
Table 31 Canada Agricultural Robots Market by Value, 2023-2033 (US$ Bn, AGR (%), CAGR (%))
Table 32 Europe Agricultural Robots Market by Value, 2023-2033 (US$ Bn, AGR (%), CAGR (%))
Table 33 Europe Agricultural Robots Market by Country, 2023-2033 (US$ Bn, AGR (%), CAGR (%))
Table 34 Europe Agricultural Robots Market by Farm Produce, 2023-2033 (US$ Bn, AGR (%), CAGR (%))
Table 35 Europe Agricultural Robots Market by Application, 2023-2033 (US$ Bn, AGR (%), CAGR (%))
Table 36 Europe Agricultural Robots Market by Type, 2023-2033 (US$ Bn, AGR (%), CAGR (%))
Table 37 Germany Agricultural Robots Market by Value, 2023-2033 (US$ Bn, AGR (%), CAGR (%))
Table 38 UK Agricultural Robots Market by Value, 2023-2033 (US$ Bn, AGR (%), CAGR (%))
Table 39 France Agricultural Robots Market by Value, 2023-2033 (US$ Bn, AGR (%), CAGR (%))
Table 40 Italy Agricultural Robots Market by Value, 2023-2033 (US$ Bn, AGR (%), CAGR (%))
Table 41 Netherlands Agricultural Robots Market by Value, 2023-2033 (US$ Bn, AGR (%), CAGR (%))
Table 42 Rest of Europe Agricultural Robots Market by Value, 2023-2033 (US$ Bn, AGR (%), CAGR (%))
Table 43 Asia-Pacific Agricultural Robots Market by Value, 2023-2033 (US$ Bn, AGR (%), CAGR (%))
Table 44 Asia-Pacific Agricultural Robots Market by Country, 2023-2033 (US$ Bn, AGR (%), CAGR (%))
Table 45 Asia-Pacific Agricultural Robots Market by Farm Produce, 2023-2033 (US$ Bn, AGR (%), CAGR (%))
Table 46 Asia-Pacific Agricultural Robots Market by Application, 2023-2033 (US$ Bn, AGR (%), CAGR (%))
Table 47 Asia-Pacific Agricultural Robots Market by Type, 2023-2033 (US$ Bn, AGR (%), CAGR (%))
Table 48 China Agricultural Robots Market by Value, 2023-2033 (US$ Bn, AGR (%), CAGR (%))
Table 49 India Agricultural Robots Market by Value, 2023-2033 (US$ Bn, AGR (%), CAGR (%))
Table 50 Japan Agricultural Robots Market by Value, 2023-2033 (US$ Bn, AGR (%), CAGR (%))
Table 51 South Korea Agricultural Robots Market by Value, 2023-2033 (US$ Bn, AGR (%), CAGR (%))
Table 52 Australia Agricultural Robots Market by Value, 2023-2033 (US$ Bn, AGR (%), CAGR (%))
Table 53 Rest of Asia-Pacific Agricultural Robots Market by Value, 2023-2033 (US$ Bn, AGR (%), CAGR (%))
Table 54 Middle East & Africa Agricultural Robots Market by Value, 2023-2033 (US$ Bn, AGR (%), CAGR (%))
Table 55 Middle East & Africa Agricultural Robots Market by Country, 2023-2033 (US$ Bn, AGR (%), CAGR (%))
Table 56 Middle East & Africa Agricultural Robots Market by Farm Produce, 2023-2033 (US$ Bn, AGR (%), CAGR (%))
Table 57 Middle East & Africa Agricultural Robots Market by Application, 2023-2033 (US$ Bn, AGR (%), CAGR (%))
Table 58 Middle East & Africa Agricultural Robots Market by Type, 2023-2033 (US$ Bn, AGR (%), CAGR (%))
Table 59 GCC Agricultural Robots Market by Value, 2023-2033 (US$ Bn, AGR (%), CAGR (%))
Table 60 South Africa Agricultural Robots Market by Value, 2023-2033 (US$ Bn, AGR (%), CAGR (%))
Table 61 Rest of Middle East & Africa Agricultural Robots Market by Value, 2023-2033 (US$ Bn, AGR (%), CAGR (%))
Table 62 Latin America Agricultural Robots Market by Value, 2023-2033 (US$ Bn, AGR (%), CAGR (%))
Table 63 Latin America Agricultural Robots Market by Country, 2023-2033 (US$ Bn, AGR (%), CAGR (%))
Table 64 Latin America Agricultural Robots Market by Farm Produce, 2023-2033 (US$ Bn, AGR (%), CAGR (%))
Table 65 Latin America Agricultural Robots Market by Application, 2023-2033 (US$ Bn, AGR (%), CAGR (%))
Table 66 Latin America Agricultural Robots Market by Type, 2023-2033 (US$ Bn, AGR (%), CAGR (%))
Table 67 Brazil Agricultural Robots Market by Value, 2023-2033 (US$ Bn, AGR (%), CAGR (%))
Table 68 Mexico Agricultural Robots Market by Value, 2023-2033 (US$ Bn, AGR (%), CAGR (%))
Table 69 Rest of Latin America Agricultural Robots Market by Value, 2023-2033 (US$ Bn, AGR (%), CAGR (%))
Table 70 Deere & Company: Key Details, (CEO, HQ, Revenue, Founded, No. of Employees, Company Type, Website, Business Segment)
Table 71 Deere & Company: Product Benchmarking
Table 72 Deere & Company: Strategic Outlook
Table 73 CNH Industrial N.V..: Key Details, (CEO, HQ, Revenue, Founded, No. of Employees, Company Type, Website, Business Segment)
Table 74 CNH Industrial N.V..: Product Benchmarking
Table 75 CNH Industrial N.V..: Strategic Outlook
Table 76 AGCO Corporation: Key Details, (CEO, HQ, Revenue, Founded, No. of Employees, Company Type, Website, Business Segment)
Table 77 AGCO Corporation: Product Benchmarking
Table 78 AGCO Corporation: Strategic Outlook
Table 79 DeLaval: Key Details, (CEO, HQ, Revenue, Founded, No. of Employees, Company Type, Website, Business Segment)
Table 80 DeLaval: Product Benchmarking
Table 81 DeLaval: Strategic Outlook
Table 82 Trimble Inc.: Key Details, (CEO, HQ, Revenue, Founded, No. of Employees, Company Type, Website, Business Segment)
Table 83 Trimble Inc.: Product Benchmarking
Table 84 Trimble Inc.: Strategic Outlook
Table 85 BouMatic Robotics B.V.: Key Details, (CEO, HQ, Revenue, Founded, No. of Employees, Company Type, Website, Business Segment)
Table 86 BouMatic Robotics B.V.: Product Benchmarking
Table 87 BouMatic Robotics B.V.: Strategic Outlook
Table 88 Lely Industries N.V.: Key Details, (CEO, HQ, Revenue, Founded, No. of Employees, Company Type, Website, Business Segment)
Table 89 Lely Industries N.V.: Product Benchmarking
Table 90 Lely Industries N.V.: Strategic Outlook
Table 91 AgEagle Aerial Systems Inc.: Key Details, (CEO, HQ, Revenue, Founded, No. of Employees, Company Type, Website, Business Segment)
Table 92 AgEagle Aerial Systems Inc.: Product Benchmarking
Table 93 AgEagle Aerial Systems Inc.: Strategic Outlook
Table 94 Yanmar Co., Ltd.: Key Details, (CEO, HQ, Revenue, Founded, No. of Employees, Company Type, Website, Business Segment)
Table 95 Yanmar Co., Ltd.: Product Benchmarking
Table 96 Yanmar Co., Ltd.: Strategic Outlook
Table 97 DeepField Robotics: Key Details, (CEO, HQ, Revenue, Founded, No. of Employees, Company Type, Website, Business Segment)
Table 98 Deepfield Robotics: Product Benchmarking
Table 99 ecoRobotix: Key Details, (CEO, HQ, Revenue, Founded, No. of Employees, Company Type, Website, Business Segment)
Table 100 ecoRobotix: Product Benchmarking
Table 101 Harvest Automation Inc.: Key Details, (CEO, HQ, Revenue, Founded, No. of Employees, Company Type, Website, Business Segment)
Table 102 Harvest Automation Inc.: Product Benchmarking
Table 103 Naïo Technologies : Key Details, (CEO, HQ, Revenue, Founded, No. of Employees, Company Type, Website, Business Segment)
Table 104 Naïo Technologies: Product Benchmarking
Table 105 Naïo Technologies: Strategic Outlook
Table 106 Robotics Plus Ltd : Key Details, (CEO, HQ, Revenue, Founded, No. of Employees, Company Type, Website, Business Segment)
Table 107 Robotics Plus Ltd: Product Benchmarking
Table 108 Robotics Plus Ltd : Strategic Outlook
Table 109 Kubota Corporation: Key Details, (CEO, HQ, Revenue, Founded, No. of Employees, Company Type, Website, Business Segment)
Table 110 Kubota Corporation: Product Benchmarking
Table 111 Kubota Corporation: Strategic Outlook
図の一覧
Figure 1 Agricultural Robots Market Segmentation
Figure 2 Agricultural Robots Market by Farm Produce: Market Attractiveness Index
Figure 3 Agricultural Robots Market by Application: Market Attractiveness Index
Figure 4 Agricultural Robots Market by Type: Market Attractiveness Index
Figure 5 Agricultural Robots Market Attractiveness Index by Region
Figure 6 Agricultural Robots Market: Market Dynamics
Figure 7 Agricultural Robots Market by Region, 2023-2033 (US$ Bn, AGR (%)) (V-Shaped Recovery Scenario)
Figure 8 Agricultural Robots Market by Region, 2023-2033 (US$ Bn, AGR (%)) (W-Shaped Recovery Scenario)
Figure 9 Agricultural Robots Market by Region, 2023-2033 (US$ Bn, AGR (%)) (U-Shaped Recovery Scenario)
Figure 10 Agricultural Robots Market by Region, 2023-2033 (US$ Bn, AGR (%)) (L-Shaped Recovery Scenario)
Figure 11 Agricultural Robots Market: Porter’s Five Forces Analysis
Figure 12 Agricultural Robots Market by Farm Produce: Market Attractiveness Index
Figure 13 Agricultural Robots Market by Farm Produce, 2023-2033 (US$ Bn, AGR (%))
Figure 14 Dairy & Livestock Market by Region, 2023-2033 (US$ Bn, AGR (%))
Figure 15 Dairy & Livestock Segment Market Share Forecast by Region, 2023 & 2033 (%)
Figure 16 Field Crops Market by Region, 2023-2033 (US$ Bn, AGR (%))
Figure 17 Field Crops Segment Market Share Forecast by Region, 2023 & 2033 (%)
Figure 18 Fruits & Vegetables Market by Region, 2023-2033 (US$ Bn, AGR (%))
Figure 19 Fruits & Vegetables Segment Market Share Forecast by Region, 2023 & 2033 (%)
Figure 20 Other Farm Produce Market by Region, 2023-2033 (US$ Bn, AGR (%))
Figure 21 Other Farm Produce Segment Market Share Forecast by Region, 2023 & 2033 (%)
Figure 22 Agricultural Robots Market by Application: Market Attractiveness Index
Figure 23 Agricultural Robots Market by Application, 2023-2033 (US$ Bn, AGR (%))
Figure 24 Dairy & Livestock Management Market by Region, 2023-2033 (US$ Bn, AGR (%))
Figure 25 Dairy & Livestock Management Segment Market Share Forecast by Region, 2023 & 2033 (%)
Figure 26 Harvest Management Market by Region, 2023-2033 (US$ Bn, AGR (%))
Figure 27 Harvest Management Segment Market Share Forecast by Region, 2023 & 2033 (%)
Figure 28 Field Farming Market by Region, 2023-2033 (US$ Bn, AGR (%))
Figure 29 Field Farming Segment Market Share Forecast by Region, 2023 & 2033 (%)
Figure 30 Soil & Irrigation Management Market by Region, 2023-2033 (US$ Bn, AGR (%))
Figure 31 Soil & Irrigation Management Segment Market Share Forecast by Region, 2023 & 2033 (%)
Figure 32 Other Applications Market by Region, 2023-2033 (US$ Bn, AGR (%))
Figure 33 Other Applications Segment Market Share Forecast by Region, 2023 & 2033 (%)
Figure 34 Agricultural Robots Market by Type: Market Attractiveness Index
Figure 35 Agricultural Robots Market by Type, 2023-2033 (US$ Bn, AGR (%))
Figure 36 Milking Robots Market by Region, 2023-2033 (US$ Bn, AGR (%))
Figure 37 Milking Robots Segment Market Share Forecast by Region, 2023 & 2033 (%)
Figure 38 UAVs/Drones Market by Region, 2023-2033 (US$ Bn, AGR (%))
Figure 39 UAVs/Drones Segment Market Share Forecast by Region, 2023 & 2033 (%)
Figure 40 Automated Harvesting Systems Market by Region, 2023-2033 (US$ Bn, AGR (%))
Figure 41 Automated Harvesting Systems Segment Market Share Forecast by Region, 2023 & 2033 (%)
Figure 42 Driverless Tractors Market by Region, 2023-2033 (US$ Bn, AGR (%))
Figure 43 Driverless Tractors Segment Market Share Forecast by Region, 2023 & 2033 (%)
Figure 44 Robotic Weeding & Seeding Market by Region, 2023-2033 (US$ Bn, AGR (%))
Figure 45 Robotic Weeding & Seeding Segment Market Share Forecast by Region, 2023 & 2033 (%)
Figure 46 Other Types Market by Region, 2023-2033 (US$ Bn, AGR (%))
Figure 47 Other Types Segment Market Share Forecast by Region, 2023 & 2033 (%)
Figure 48 Agricultural Robots Market Forecast by Region 2023 and 2033 (Revenue, CAGR%)
Figure 49 Agricultural Robots Market by Region, 2023-2033 (US$ Bn, AGR (%))
Figure 50 North America Agricultural Robots Market Attractiveness Index
Figure 51 North America Agricultural Robots Market by Region, 2023, 2028 & 2033 (US$ Billion)
Figure 52 North America Agricultural Robots Market by Value, 2023-2033 (US$ Bn, AGR (%))
Figure 53 North America Agricultural Robots Market by Country, 2023-2033 (US$ Bn, AGR (%))
Figure 54 North America Agricultural Robots Market Share Forecast by Country, 2023 & 2033 (%)
Figure 55 North America Agricultural Robots Market by Farm Produce, 2023-2033 (US$ Bn, AGR (%))
Figure 56 North America Agricultural Robots Market Share Forecast by Farm Produce, 2023 & 2033 (%)
Figure 57 North America Agricultural Robots Market by Application, 2023-2033 (US$ Bn, AGR (%))
Figure 58 North America Agricultural Robots Market Share Forecast by Application, 2023 & 2033 (%)
Figure 59 North America Agricultural Robots Market by Type, 2023-2033 (US$ Bn, AGR (%))
Figure 60 North America Agricultural Robots Market Share Forecast by Type, 2023 & 2033 (%)
Figure 61 US Agricultural Robots Market by Value, 2023-2033 (US$ Bn, AGR (%))
Figure 62 Canada Agricultural Robots Market by Value, 2023-2033 (US$ Bn, AGR (%))
Figure 63 Europe Agricultural Robots Market Attractiveness Index
Figure 64 Europe Agricultural Robots Market by Region, 2023, 2028 & 2033 (US$ Billion)
Figure 65 Europe Agricultural Robots Market by Value, 2023-2033 (US$ Bn, AGR (%))
Figure 66 Europe Agricultural Robots Market by Country, 2023-2033 (US$ Bn, AGR (%))
Figure 67 Europe Agricultural Robots Market Share Forecast by Country, 2023 & 2033 (%)
Figure 68 Europe Agricultural Robots Market by Farm Produce, 2023-2033 (US$ Bn, AGR (%))
Figure 69 Europe Agricultural Robots Market Share Forecast by Farm Produce, 2023 & 2033 (%)
Figure 70 Europe Agricultural Robots Market by Application, 2023-2033 (US$ Bn, AGR (%))
Figure 71 Europe Agricultural Robots Market Share Forecast by Application, 2023 & 2033 (%)
Figure 72 Europe Agricultural Robots Market by Type, 2023-2033 (US$ Bn, AGR (%))
Figure 73 Europe Agricultural Robots Market Share Forecast by Type, 2023 & 2033 (%)
Figure 74 Germany Agricultural Robots Market by Value, 2023-2033 (US$ Bn, AGR (%))
Figure 75 UK Agricultural Robots Market by Value, 2023-2033 (US$ Bn, AGR (%))
Figure 76 France Agricultural Robots Market by Value, 2023-2033 (US$ Bn, AGR (%))
Figure 77 Italy Agricultural Robots Market by Value, 2023-2033 (US$ Bn, AGR (%))
Figure 78 Netherlands Agricultural Robots Market by Value, 2023-2033 (US$ Bn, AGR (%))
Figure 79 Rest of Europe Agricultural Robots Market by Value, 2023-2033 (US$ Bn, AGR (%))
Figure 80 Asia-Pacific Agricultural Robots Market Attractiveness Index
Figure 81 Asia-Pacific Agricultural Robots Market by Region, 2023, 2028 & 2033 (US$ Billion)
Figure 82 Asia-Pacific Agricultural Robots Market by Value, 2023-2033 (US$ Bn, AGR (%))
Figure 83 Asia-Pacific Agricultural Robots Market by Country, 2023-2033 (US$ Bn, AGR (%))
Figure 84 Asia-Pacific Agricultural Robots Market Share Forecast by Country, 2023 & 2033 (%)
Figure 85 Asia-Pacific Agricultural Robots Market by Farm Produce, 2023-2033 (US$ Bn, AGR (%))
Figure 86 Asia-Pacific Agricultural Robots Market Share Forecast by Farm Produce, 2023 & 2033 (%)
Figure 87 Asia-Pacific Agricultural Robots Market by Application, 2023-2033 (US$ Bn, AGR (%))
Figure 88 Asia-Pacific Agricultural Robots Market Share Forecast by Application, 2023 & 2033 (%)
Figure 89 Asia-Pacific Agricultural Robots Market by Type, 2023-2033 (US$ Bn, AGR (%))
Figure 90 Asia-Pacific Agricultural Robots Market Share Forecast by Type, 2023 & 2033 (%)
Figure 91 China Agricultural Robots Market by Value, 2023-2033 (US$ Bn, AGR (%))
Figure 92 India Agricultural Robots Market by Value, 2023-2033 (US$ Bn, AGR (%))
Figure 93 Japan Agricultural Robots Market by Value, 2023-2033 (US$ Bn, AGR (%))
Figure 94 South Korea Agricultural Robots Market by Value, 2023-2033 (US$ Bn, AGR (%))
Figure 95 Australia Agricultural Robots Market by Value, 2023-2033 (US$ Bn, AGR (%))
Figure 96 Rest of Asia-Pacific Agricultural Robots Market by Value, 2023-2033 (US$ Bn, AGR (%))
Figure 97 Middle East & Africa Agricultural Robots Market Attractiveness Index
Figure 98 Middle East & Africa Agricultural Robots Market by Region, 2023, 2028 & 2033 (US$ Billion)
Figure 99 Middle East & Africa Agricultural Robots Market by Value, 2023-2033 (US$ Bn, AGR (%))
Figure 100 Middle East & Africa Agricultural Robots Market by Country, 2023-2033 (US$ Bn, AGR (%))
Figure 101 Middle East & Africa Agricultural Robots Market Share Forecast by Country, 2023 & 2033 (%)
Figure 102 Middle East & Africa Agricultural Robots Market by Farm Produce, 2023-2033 (US$ Bn, AGR (%))
Figure 103 Middle East & Africa Agricultural Robots Market Share Forecast by Farm Produce, 2023 & 2033 (%)
Figure 104 Middle East & Africa Agricultural Robots Market by Application, 2023-2033 (US$ Bn, AGR (%))
Figure 105 Middle East & Africa Agricultural Robots Market Share Forecast by Application, 2023 & 2033 (%)
Figure 106 Middle East & Africa Agricultural Robots Market by Type, 2023-2033 (US$ Bn, AGR (%))
Figure 107 Middle East & Africa Agricultural Robots Market Share Forecast by Type, 2023 & 2033 (%)
Figure 108 GCC Agricultural Robots Market by Value, 2023-2033 (US$ Bn, AGR (%))
Figure 109 South Africa Agricultural Robots Market by Value, 2023-2033 (US$ Bn, AGR (%))
Figure 110 Rest of Middle East & Africa Agricultural Robots Market by Value, 2023-2033 (US$ Bn, AGR (%))
Figure 111 Latin America Agricultural Robots Market Attractiveness Index
Figure 112 Latin America Agricultural Robots Market by Region, 2023, 2028 & 2033 (US$ Billion)
Figure 113 Latin America Agricultural Robots Market by Value, 2023-2033 (US$ Bn, AGR (%))
Figure 114 Latin America Agricultural Robots Market by Country, 2023-2033 (US$ Bn, AGR (%))
Figure 115 Latin America Agricultural Robots Market Share Forecast by Country, 2023 & 2033 (%)
Figure 116 Latin America Agricultural Robots Market by Farm Produce, 2023-2033 (US$ Bn, AGR (%))
Figure 117 Latin America Agricultural Robots Market Share Forecast by Farm Produce, 2023 & 2033 (%)
Figure 118 Latin America Agricultural Robots Market by Application, 2023-2033 (US$ Bn, AGR (%))
Figure 119 Latin America Agricultural Robots Market Share Forecast by Application, 2023 & 2033 (%)
Figure 120 Latin America Agricultural Robots Market by Type, 2023-2033 (US$ Bn, AGR (%))
Figure 121 Latin America Agricultural Robots Market Share Forecast by Type, 2023 & 2033 (%)
Figure 122 Brazil Agricultural Robots Market by Value, 2023-2033 (US$ Bn, AGR (%))
Figure 123 Mexico Agricultural Robots Market by Value, 2023-2033 (US$ Bn, AGR (%))
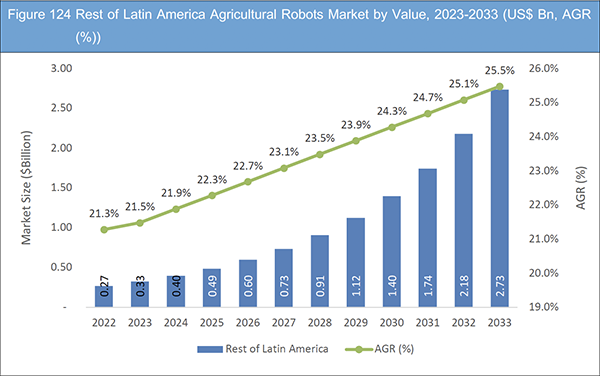
Figure 124 Rest of Latin America Agricultural Robots Market by Value, 2023-2033 (US$ Bn, AGR (%))
Figure 125 Agricultural Robots Market: Company Share, 2022
Figure 126 Deere & Company: Net Revenue, 2018-2022 (US$ million, AGR%)
Figure 127 Deere & Company: R&D, 2018-2022 (US$ million, AGR%)
Figure 128 Deere & Company: Regional Revenue Shares, 2022 (%)
Figure 129 Deere & Company: Business Segment Revenue Shares, 2022 (%)
Figure 130 CNH Industrial N.V: Net Revenue, 2018-2022 (US$ million, AGR%)
Figure 131 CNH Industrial N.V: R&D, 2018-2022 (US$ million, AGR%)
Figure 132 CNH Industrial N.V: Regional Revenue Shares, 2022 (%)
Figure 133 CNH Industrial N.V: Business Segment Revenue Shares, 2022 (%)
Figure 134 AGCO Corporation: Net Revenue, 2018-2022 (US$ million, AGR%)
Figure 135 AGCO Corporation: R&D, 2018-2022 (US$ million, AGR%)
Figure 136 AGCO Corporation: Regional Revenue Shares, 2022 (%)
Figure 137 Trimble Inc.: Net Revenue, 2018-2022 (US$ million, AGR%)
Figure 138 Trimble Inc.: R&D, 2018-2022 (US$ million, AGR%)
Figure 139 Trimble Inc.: Business Segment Revenue Shares, 2022 (%)
Figure 140 AgEagle Aerial Systems Inc.: Net Revenue, 2018-2022 (US$ million, AGR%)
Figure 141 AgEagle Aerial Systems Inc.: R&D, 2018-2022 (US$ million, AGR%)
Figure 142 AgEagle Aerial Systems Inc.: Regional Revenue Shares, 2022 (%)
Figure 143 AgEagle Aerial Systems Inc.: Business Segment Revenue Shares, 2022 (%)
Figure 144 Kubota Corporation: Net Revenue, 2018-2022 (US$ million, AGR%)
Figure 145 Kubota Corporation: Regional Revenue Shares, 2022 (%)
Figure 146 Kubota Corporation: Business Segment Revenue Shares, 2022 (%)
ページTOPに戻る
Summary
Report Details
The Agricultural Robots Market Report 2023-2033: This report will prove invaluable to leading firms striving for new revenue pockets if they wish to better understand the industry and its underlying dynamics. It will be useful for companies that would like to expand into different industries or to expand their existing operations in a new region.
Labour Shortages and Rising Labour Costs
Agricultural labour shortages and increasing labour costs are driving the demand for agricultural robots. As the availability of skilled labour decreases and wages rise, farmers are turning to automation to optimize their operations. In Japan, where the aging population and shrinking workforce pose challenges for the agriculture sector, robotic solutions like autonomous harvesting robots have been developed to address labour shortages and improve productivity.
Increase in Precision Agriculture and Farming Practices
The adoption of precision agriculture techniques, such as variable rate application and site-specific crop management, is driving the demand for agricultural robots. These robots enable precise and targeted operations, optimizing resource utilization and crop yield. Robotic platforms equipped with sensors and imaging technologies are used for soil analysis, crop monitoring, and targeted application of fertilizers or pesticides, leading to efficient and sustainable farming practices.
What Questions Should You Ask before Buying a Market Research Report?
• How is the agricultural robots market evolving?
• What is driving and restraining the agricultural robots market?
• How will each agricultural robots submarket segment grow over the forecast period and how much revenue will these submarkets account for in 2033?
• How will the market shares for each agricultural robots submarket develop from 2023 to 2033?
• What will be the main driver for the overall market from 2023 to 2033?
• Will leading agricultural robots markets broadly follow the macroeconomic dynamics, or will individual national markets outperform others?
• How will the market shares of the national markets change by 2033 and which geographical region will lead the market in 2033?
• Who are the leading players and what are their prospects over the forecast period?
• What are the agricultural robots projects for these leading companies?
• How will the industry evolve during the period between 2023 and 2033? What are the implications of agricultural robots projects taking place now and over the next 10 years?
• Is there a greater need for product commercialisation to further scale the agricultural robots market?
• Where is the agricultural robots market heading and how can you ensure you are at the forefront of the market?
• What are the best investment options for new product and service lines?
• What are the key prospects for moving companies into a new growth path and C-suite?
You need to discover how this will impact the agricultural robots market today, and over the next 10 years:
• Our 294-page report provides 111 tables and 146 charts/graphs exclusively to you.
• The report highlights key lucrative areas in the industry so you can target them – NOW.
• It contains in-depth analysis of global, regional and national sales and growth.
• It highlights for you the key successful trends, changes and revenue projections made by your competitors.
This report tells you TODAY how the agricultural robots market will develop in the next 10 years, and in line with the variations in COVID-19 economic recession and bounce. This market is more critical now than at any point over the last 10 years.
Forecasts to 2033 and other analyses reveal commercial prospects
• In addition to revenue forecasting to 2033, our new study provides you with recent results, growth rates, and market shares.
• You will find original analyses, with business outlooks and developments.
• Discover qualitative analyses (including market dynamics, drivers, opportunities, restraints and challenges), cost structure, impact of rising agricultural robots prices and recent developments.
This report includes data analysis and invaluable insight into how COVID-19 will affect the industry and your company. Four COVID-19 recovery patterns and their impact, namely, “V”, “L”, “W” and “U” are discussed in this report.
Segments Covered in the Report
Market Segment by Farm Produce
• Dairy & Livestock
• Field Crops
• Fruits & Vegetables
• Other Farm Produce
Market Segment by Application
• Dairy & Livestock Management
• Harvest Management
• Field Farming
• Soil & Irrigation Management
• Other Applications
Market Segment by Type
• Milking Robots
• UAVs/Drones
• Automated Harvesting Systems
• Driverless Tractors
• Robotic Weeding & Seeding
• Other Types
In addition to the revenue predictions for the overall world market and segments, you will also find revenue forecasts for four regional and 20 leading national markets:
North America
• U.S.
• Canada
Europe
• Germany
• Netherlands
• United Kingdom
• France
• Italy
• Rest of Europe
Asia Pacific
• China
• Japan
• India
• Australia
• South Korea
• Rest of Asia Pacific
Latin America
• Brazil
• Mexico
• Rest of Latin America
Middle East & Africa
• GCC
• South Africa
• Rest of Middle East & Africa
The report also includes profiles and for some of the leading companies in the Agricultural Robots Market, 2023 to 2033, with a focus on this segment of these companies’ operations.
Leading companies and the potential for market growth
• AGCO Corporation
• AgEagle Aerial Systems Inc.
• BouMatic Robotics B.V.
• CNH Industrial N.V.
• Deepfield Robotics
• Deere & Company
• DeLaval
• ecoRobotix
• Harvest Automation Inc.
• Kubota Corporation
• Lely Industries N.V.
• Naïo Technologies
• Robotics Plus Ltd
• Trimble Inc.
• Yanmar Co., Ltd.
Overall world revenue for agricultural robots market, 2023 to 2033 in terms of value the market will surpass US$15.74 billion in 2023, our work calculates. We predict strong revenue growth through to 2033. Our work identifies which organizations hold the greatest potential. Discover their capabilities, progress, and commercial prospects, helping you stay ahead.
How will the Agricultural Robots Market, 2023 to 2033 report help you?
In summary, our 290+ page report provides you with the following knowledge:
• Revenue forecasts to 2033 for Agricultural Robots Market, 2023 to 2033 Market, with forecasts for farm produce, type, and application, each forecast at a global and regional level – discover the industry’s prospects, finding the most lucrative places for investments and revenues.
• Revenue forecasts to 2033 for four regional and 20 key national markets – See forecasts for the Agricultural Robots Market, 2023 to 2033 market in North America, Europe, Asia-Pacific, Latin America and Middle East & Africa. Also forecasted is the market in the US, Canada, Brazil, Germany, France, UK, Italy, China, India, Japan, and Australia among other prominent economies.
• Prospects for established firms and those seeking to enter the market – including company profiles for 15 of the major companies involved in the Agricultural Robots Market, 2023 to 2033.
Find quantitative and qualitative analyses with independent predictions. Receive information that only our report contains, staying informed with invaluable business intelligence.
Information found nowhere else
With our new report, you are less likely to fall behind in knowledge or miss out on opportunities. See how our work could benefit your research, analyses, and decisions. Visiongain’s study is for everybody needing commercial analyses for the Agricultural Robots Market, 2023 to 2033, market-leading companies. You will find data, trends and predictions.
ページTOPに戻る
Table of Contents
Table of Contents
1 Report Overview
1.1 Objectives of the Study
1.2 Introduction to Agricultural Robots Market
1.3 What This Report Delivers
1.4 Why You Should Read This Report
1.5 Key Questions Answered by this Analytical Report
1.6 Who Is this Report for?
1.7 Research Methodology
1.7.1 Market Definitions
1.7.2 Market Evaluation & Forecasting Methodology
1.7.3 Data Validation
1.7.3.1 Primary Research
1.7.3.2 Secondary Research
1.8 Frequently Asked Questions (FAQs)
1.9 Associated Visiongain Reports
1.10 About Visiongain
2 Executive Summary
3 Market Overview
3.1 Key Findings
3.2 Market Dynamics
3.2.1 Market Driving Factors
3.2.1.1 Increasing Global Population and Rising Food Demand
3.2.1.2 Need for Enhanced Agricultural Productivity and Yield
3.2.1.3 Labour Shortage in the Agriculture Sector
3.2.2 Market Restraining Factors
3.2.2.1 High Initial Investment and Implementation Costs
3.2.2.2 Limited Awareness and Understanding of Agricultural Robots Among Farmers
3.2.2.3 Challenges in Integrating Robotic Systems with Existing Farming Infrastructure
3.2.3 Market Opportunities
3.2.3.1 Growing Demand for Precision Agriculture and Site-Specific Farming Techniques
3.2.3.2 Expansion of Agricultural Robots into Emerging Economies with Significant Agricultural Activities
3.2.3.3 Increasing Adoption of Robotics and Automation in Livestock Farming
3.2.4 COVID-19 Impact Analysis
3.2.5 V-Shaped Recovery Scenario
3.2.6 W-Shaped Recovery Scenario
3.2.7 U-Shaped Recovery Scenario
3.2.8 L-Shaped Recovery Scenario
3.3 Porter’s Five Forces Analysis
3.3.1 Threat of New Entrants:
3.3.2 Bargaining Power of Buyers:
3.3.3 Bargaining Power of Suppliers:
3.3.4 Threat of Substitute Products or Services:
3.3.5 Intensity of Competitive Rivalry:
3.4 SWOT
3.4.1 Strengths
3.4.2 Weaknesses
3.4.3 Opportunities
3.4.4 Threats
3.5 PESTLE Analysis
3.5.1 Political Factors
3.5.2 Economic Factors
3.5.3 Social Factors
3.5.4 Technological Factors
3.5.5 Environmental Factors
3.5.6 Legal Factors
3.5.7 Ethical Factors
4 Agricultural Robots Market Analysis by Farm Produce
4.1 Key Findings
4.2 Farm Produce Segment: Market Attractiveness Index
4.2.1 Agricultural Robots Market by Farm Produce
4.3 Dairy & Livestock
4.3.1 Market by Region, 2023-2033 (US$ Bn)
4.3.2 Market Share by Region, 2023 & 2033 (%)
4.4 Field Crops
4.4.1 Market by Region, 2023-2033 (US$ Bn)
4.4.2 Market Share by Region, 2023 & 2033 (%)
4.5 Fruits & Vegetables
4.5.1 Market by Region, 2023-2033 (US$ Bn)
4.5.2 Market Share by Region, 2023 & 2033 (%)
4.6 Other Farm Produce
4.6.1 Market by Region, 2023-2033 (US$ Bn)
4.6.2 Market Share by Region, 2023 & 2033 (%)
5 Agricultural Robots Market Analysis by Application
5.1 Key Findings
5.2 Application Segment: Market Attractiveness Index
5.2.1 Agricultural Robots Market by Application
5.3 Dairy & Livestock Management
5.3.1 Market by Region, 2023-2033 (US$ Bn)
5.3.2 Market Share by Region, 2023 & 2033 (%)
5.4 Harvest Management
5.4.1 Market by Region, 2023-2033 (US$ Bn)
5.4.2 Market Share by Region, 2023 & 2033 (%)
5.5 Field Farming
5.5.1 Market by Region, 2023-2033 (US$ Bn)
5.5.2 Market Share by Region, 2023 & 2033 (%)
5.6 Soil & Irrigation Management
5.6.1 Market by Region, 2023-2033 (US$ Bn)
5.6.2 Market Share by Region, 2023 & 2033 (%)
5.7 Other Applications
5.7.1 Market by Region, 2023-2033 (US$ Bn)
5.7.2 Market Share by Region, 2023 & 2033 (%)
6 Agricultural Robots Market Analysis by Type
6.1 Key Findings
6.2 Type Segment: Market Attractiveness Index
6.2.1 Agricultural Robots Market by Type
6.3 Milking Robots
6.3.1 Market by Region, 2023-2033 (US$ Bn)
6.3.2 Market Share by Region, 2023 & 2033 (%)
6.4 UAVs/Drones
6.4.1 Market by Region, 2023-2033 (US$ Bn)
6.4.2 Market Share by Region, 2023 & 2033 (%)
6.5 Automated Harvesting Systems
6.5.1 Market by Region, 2023-2033 (US$ Bn)
6.5.2 Market Share by Region, 2023 & 2033 (%)
6.6 Driverless Tractors
6.6.1 Market by Region, 2023-2033 (US$ Bn)
6.6.2 Market Share by Region, 2023 & 2033 (%)
6.7 Robotic Weeding & Seeding
6.7.1 Market by Region, 2023-2033 (US$ Bn)
6.7.2 Market Share by Region, 2023 & 2033 (%)
6.8 Other Types
6.8.1 Market by Region, 2023-2033 (US$ Bn)
6.8.2 Market Share by Region, 2023 & 2033 (%)
7 Agricultural Robots Market Analysis by Region
7.1 Key Findings
7.2 Agricultural Robots Market by Region
8 North America Agricultural Robots Market Analysis
8.1 Key Findings
8.2 North America Agricultural Robots Market Attractiveness Index
8.3 North America Agricultural Robots Market by Country, 2023, 2028 & 2033 (US$ Billion)
8.4 North America Agricultural Robots Market by Value
8.5 North America Agricultural Robots Market by Country
8.6 North America Agricultural Robots Market by Farm Produce
8.7 North America Agricultural Robots Market by Application
8.8 North America Agricultural Robots Market by Type
8.9 U.S. Agricultural Robots Market Analysis
8.10 Canada Agricultural Robots Market Analysis
9 Europe Agricultural Robots Market Analysis
9.1 Key Findings
9.2 Europe Agricultural Robots Market Attractiveness Index
9.3 Europe Agricultural Robots Market by Country, 2023, 2028 & 2033 (US$ Billion)
9.4 Europe Agricultural Robots Market by Value
9.5 Europe Agricultural Robots Market by Country
9.6 Europe Agricultural Robots Market by Farm Produce
9.7 Europe Agricultural Robots Market by Application
9.8 Europe Agricultural Robots Market by Type
9.9 Germany Agricultural Robots Market Analysis
9.10 UK Agricultural Robots Market Analysis
9.11 France Agricultural Robots Market Analysis
9.12 Italy Agricultural Robots Market Analysis
9.13 Netherlands Agricultural Robots Market Analysis
9.14 Rest of Europe Agricultural Robots Market Analysis
10 Asia-Pacific Agricultural Robots Market Analysis
10.1 Key Findings
10.2 Asia-Pacific Agricultural Robots Market Attractiveness Index
10.3 Asia-Pacific Agricultural Robots Market by Country, 2023, 2028 & 2033 (US$ Billion)
10.4 Asia-Pacific Agricultural Robots Market by Value
10.5 Asia-Pacific Agricultural Robots Market by Country
10.6 Asia-Pacific Agricultural Robots Market by Farm Produce
10.7 Asia-Pacific Agricultural Robots Market by Application
10.8 Asia-Pacific Agricultural Robots Market by Type
10.9 China Agricultural Robots Market Analysis
10.10 India Agricultural Robots Market Analysis
10.11 Japan Agricultural Robots Market Analysis
10.12 South Korea Agricultural Robots Market Analysis
10.13 Australia Agricultural Robots Market Analysis
10.14 Rest of Asia-Pacific Agricultural Robots Market Analysis
11 Middle East & Africa Agricultural Robots Market Analysis
11.1 Key Findings
11.2 Middle East & Africa Agricultural Robots Market Attractiveness Index
11.3 Middle East & Africa Agricultural Robots Market by Country, 2023, 2028 & 2033 (US$ Billion)
11.4 Middle East & Africa Agricultural Robots Market by Value
11.5 Middle East & Africa Agricultural Robots Market by Country
11.6 Middle East & Africa Agricultural Robots Market by Farm Produce
11.7 Middle East & Africa Agricultural Robots Market by Application
11.8 Middle East & Africa Agricultural Robots Market by Type
11.9 GCC Agricultural Robots Market Analysis
11.10 South Africa Agricultural Robots Market Analysis
11.11 Rest of Middle East & Africa Agricultural Robots Market Analysis
12 Latin America Agricultural Robots Market Analysis
12.1 Key Findings
12.2 Latin America Agricultural Robots Market Attractiveness Index
12.3 Latin America Agricultural Robots Market by Country, 2023, 2028 & 2033 (US$ Billion)
12.4 Latin America Agricultural Robots Market by Value
12.5 Latin America Agricultural Robots Market by Country
12.6 Latin America Agricultural Robots Market by Farm Produce
12.7 Latin America Agricultural Robots Market by Application
12.8 Latin America Agricultural Robots Market by Type
12.9 Brazil Agricultural Robots Market Analysis
12.10 Mexico Agricultural Robots Market Analysis
12.11 Rest of Latin America Agricultural Robots Market Analysis
13 Company Profiles
13.1 Competitive Landscape, 2022
13.2 Strategic Outlook
13.2.1 Acquisition as Business Strategy
13.2.2 Agreement as Business Strategy
13.2.3 Collaboration as Business Strategy
13.2.4 Contract as Business Strategy
13.2.5 Expansion as Business Strategy
13.2.6 Investment as Business Strategy
13.2.7 Joint Venture as Business Strategy
13.2.8 New Product Launch as Business Strategy
13.2.9 Partnership as Business Strategy
13.3 Deere & Company
13.3.1 Company Snapshot
13.3.2 Company Overview
13.3.3 Financial Analysis
13.3.3.1 Net Revenue, 2018-2022
13.3.3.2 R&D, 2018-2022
13.3.3.3 Regional Revenue Shares, 2022 (%)
13.3.3.4 Business Segment Revenue Shares, 2022 (%)
13.3.4 Product Benchmarking
13.3.5 Strategic Outlook
13.4 CNH Industrial N.V.
13.4.1 Company Snapshot
13.4.2 Company Overview
13.4.3 Financial Analysis
13.4.3.1 Net Revenue, 2018-2022
13.4.3.2 R&D, 2018-2022
13.4.3.3 Regional Revenue Shares, 2022 (%)
13.4.3.4 Business Segment Revenue Shares, 2022 (%)
13.4.4 Product Benchmarking
13.4.5 Strategic Outlook
13.5 AGCO Corporation
13.5.1 Company Snapshot
13.5.2 Company Overview
13.5.3 Financial Analysis
13.5.3.1 Net Revenue, 2018-2022
13.5.3.2 R&D, 2018-2022
13.5.3.3 Regional Revenue Shares, 2022 (%)
13.5.4 Product Benchmarking
13.5.5 Strategic Outlook
13.6 DeLaval
13.6.1 Company Snapshot
13.6.2 Company Overview
13.6.3 Product Benchmarking
13.6.4 Strategic Outlook
13.7 Trimble Inc.
13.7.1 Company Snapshot
13.7.2 Company Overview
13.7.3 Financial Analysis
13.7.3.1 Net Revenue, 2018-2022
13.7.3.2 R&D, 2018-2022
13.7.3.3 Business Segment Revenue Shares, 2022 (%)
13.7.4 Product Benchmarking
13.7.5 Strategic Outlook
13.8 BouMatic Robotics B.V.
13.8.1 Company Snapshot
13.8.2 Company Overview
13.8.3 Product Benchmarking
13.8.4 Strategic Outlook
13.9 Lely Industries N.V.
13.9.1 Company Snapshot
13.9.2 Company Overview
13.9.3 Product Benchmarking
13.9.4 Strategic Outlook
13.10 AgEagle Aerial Systems Inc.
13.10.1 Company Snapshot
13.10.2 Company Overview
13.10.3 Financial Analysis
13.10.3.1 Net Revenue, 2018-2022
13.10.3.2 R&D, 2018-2022
13.10.3.3 Regional Revenue Shares, 2022 (%)
13.10.3.4 Business Segment Revenue Shares, 2022 (%)
13.10.4 Product Benchmarking
13.10.5 Strategic Outlook
13.11 Yanmar Co., Ltd.
13.11.1 Company Snapshot
13.11.2 Company Overview
13.11.3 Product Benchmarking
13.11.4 Strategic Outlook
13.12 Deepfield Robotics
13.12.1 Company Snapshot
13.12.2 Company Overview
13.12.3 Product Benchmarking
13.13 ecoRobotix
13.13.1 Company Snapshot
13.13.2 Company Overview
13.13.3 Product Benchmarking
13.14 Harvest Automation Inc.
13.14.1 Company Snapshot
13.14.2 Company Overview
13.14.3 Product Benchmarking
13.15 Naïo Technologies
13.15.1 Company Snapshot
13.15.2 Company Overview
13.15.3 Product Benchmarking
13.15.4 Strategic Outlook
13.16 Robotics Plus Ltd
13.16.1 Company Snapshot
13.16.2 Company Overview
13.16.3 Product Benchmarking
13.16.4 Strategic Outlook
13.17 Kubota Corporation
13.17.1 Company Snapshot
13.17.2 Company Overview
13.17.3 Financial Analysis
13.17.3.1 Net Revenue, 2018-2022
13.17.3.2 Regional Revenue Shares, 2022 (%)
13.17.3.3 Business Segment Revenue Shares, 2022 (%)
13.17.4 Product Benchmarking
13.17.5 Strategic Outlook
14 Conclusion and Recommendations
14.1 Concluding Remarks from Visiongain
14.2 Recommendations for Market Players
ページTOPに戻る
List of Tables/Graphs
List of Tables
Table 1 Agricultural Robots Market Snapshot, 2023 & 2033 (US$ Billion, CAGR %)
Table 2 Agricultural Robots Market by Region, 2023-2033 (US$ Bn, AGR (%), CAGR (%)) (V-Shaped Recovery Scenario)
Table 3 Agricultural Robots Market by Region, 2023-2033 (US$ Bn, AGR (%), CAGR (%)) (W-Shaped Recovery Scenario)
Table 4 Agricultural Robots Market by Region, 2023-2033 (US$ Bn, AGR (%), CAGR (%)) (U-Shaped Recovery Scenario)
Table 5 Agricultural Robots Market by Region, 2023-2033 (US$ Bn, AGR (%), CAGR (%)) (L-Shaped Recovery Scenario)
Table 6 Agricultural Robots Market by Farm Produce, 2023-2033 (US$ Bn, AGR (%), CAGR (%))
Table 7 Dairy & Livestock Market by Region, 2023-2033 (US$ Bn, AGR (%), CAGR (%))
Table 8 Field Crops Market by Region, 2023-2033 (US$ Bn, AGR (%), CAGR (%))
Table 9 Fruits & Vegetables Market by Region, 2023-2033 (US$ Bn, AGR (%), CAGR (%))
Table 10 Other Farm Produce Market by Region, 2023-2033 (US$ Bn, AGR (%), CAGR (%))
Table 11 Agricultural Robots Market by Application, 2023-2033 (US$ Bn, AGR (%), CAGR (%))
Table 12 Dairy & Livestock Management Market by Region, 2023-2033 (US$ Bn, AGR (%), CAGR (%))
Table 13 Harvest Management Market by Region, 2023-2033 (US$ Bn, AGR (%), CAGR (%))
Table 14 Field Farming Market by Region, 2023-2033 (US$ Bn, AGR (%), CAGR (%))
Table 15 Soil & Irrigation Management Market by Region, 2023-2033 (US$ Bn, AGR (%), CAGR (%))
Table 16 Other Applications Market by Region, 2023-2033 (US$ Bn, AGR (%), CAGR (%))
Table 17 Agricultural Robots Market by Type, 2023-2033 (US$ Bn, AGR (%), CAGR (%))
Table 18 Milking Robots Market by Region, 2023-2033 (US$ Bn, AGR (%), CAGR (%))
Table 19 UAVs/Drones Market by Region, 2023-2033 (US$ Bn, AGR (%), CAGR (%))
Table 20 Automated Harvesting Systems Market by Region, 2023-2033 (US$ Bn, AGR (%), CAGR (%))
Table 21 Driverless Tractors Market by Region, 2023-2033 (US$ Bn, AGR (%), CAGR (%))
Table 22 Robotic Weeding & Seeding Market by Region, 2023-2033 (US$ Bn, AGR (%), CAGR (%))
Table 23 Other Types Market by Region, 2023-2033 (US$ Bn, AGR (%), CAGR (%))
Table 24 Agricultural Robots Market by Region, 2023-2033 (US$ Bn, AGR (%), CAGR (%))
Table 25 North America Agricultural Robots Market by Value, 2023-2033 (US$ Bn, AGR (%), CAGR (%))
Table 26 North America Agricultural Robots Market by Country, 2023-2033 (US$ Bn, AGR (%), CAGR (%))
Table 27 North America Agricultural Robots Market by Farm Produce, 2023-2033 (US$ Bn, AGR (%), CAGR (%))
Table 28 North America Agricultural Robots Market by Application, 2023-2033 (US$ Bn, AGR (%), CAGR (%))
Table 29 North America Agricultural Robots Market by Type, 2023-2033 (US$ Bn, AGR (%), CAGR (%))
Table 30 US Agricultural Robots Market by Value, 2023-2033 (US$ Bn, AGR (%), CAGR (%))
Table 31 Canada Agricultural Robots Market by Value, 2023-2033 (US$ Bn, AGR (%), CAGR (%))
Table 32 Europe Agricultural Robots Market by Value, 2023-2033 (US$ Bn, AGR (%), CAGR (%))
Table 33 Europe Agricultural Robots Market by Country, 2023-2033 (US$ Bn, AGR (%), CAGR (%))
Table 34 Europe Agricultural Robots Market by Farm Produce, 2023-2033 (US$ Bn, AGR (%), CAGR (%))
Table 35 Europe Agricultural Robots Market by Application, 2023-2033 (US$ Bn, AGR (%), CAGR (%))
Table 36 Europe Agricultural Robots Market by Type, 2023-2033 (US$ Bn, AGR (%), CAGR (%))
Table 37 Germany Agricultural Robots Market by Value, 2023-2033 (US$ Bn, AGR (%), CAGR (%))
Table 38 UK Agricultural Robots Market by Value, 2023-2033 (US$ Bn, AGR (%), CAGR (%))
Table 39 France Agricultural Robots Market by Value, 2023-2033 (US$ Bn, AGR (%), CAGR (%))
Table 40 Italy Agricultural Robots Market by Value, 2023-2033 (US$ Bn, AGR (%), CAGR (%))
Table 41 Netherlands Agricultural Robots Market by Value, 2023-2033 (US$ Bn, AGR (%), CAGR (%))
Table 42 Rest of Europe Agricultural Robots Market by Value, 2023-2033 (US$ Bn, AGR (%), CAGR (%))
Table 43 Asia-Pacific Agricultural Robots Market by Value, 2023-2033 (US$ Bn, AGR (%), CAGR (%))
Table 44 Asia-Pacific Agricultural Robots Market by Country, 2023-2033 (US$ Bn, AGR (%), CAGR (%))
Table 45 Asia-Pacific Agricultural Robots Market by Farm Produce, 2023-2033 (US$ Bn, AGR (%), CAGR (%))
Table 46 Asia-Pacific Agricultural Robots Market by Application, 2023-2033 (US$ Bn, AGR (%), CAGR (%))
Table 47 Asia-Pacific Agricultural Robots Market by Type, 2023-2033 (US$ Bn, AGR (%), CAGR (%))
Table 48 China Agricultural Robots Market by Value, 2023-2033 (US$ Bn, AGR (%), CAGR (%))
Table 49 India Agricultural Robots Market by Value, 2023-2033 (US$ Bn, AGR (%), CAGR (%))
Table 50 Japan Agricultural Robots Market by Value, 2023-2033 (US$ Bn, AGR (%), CAGR (%))
Table 51 South Korea Agricultural Robots Market by Value, 2023-2033 (US$ Bn, AGR (%), CAGR (%))
Table 52 Australia Agricultural Robots Market by Value, 2023-2033 (US$ Bn, AGR (%), CAGR (%))
Table 53 Rest of Asia-Pacific Agricultural Robots Market by Value, 2023-2033 (US$ Bn, AGR (%), CAGR (%))
Table 54 Middle East & Africa Agricultural Robots Market by Value, 2023-2033 (US$ Bn, AGR (%), CAGR (%))
Table 55 Middle East & Africa Agricultural Robots Market by Country, 2023-2033 (US$ Bn, AGR (%), CAGR (%))
Table 56 Middle East & Africa Agricultural Robots Market by Farm Produce, 2023-2033 (US$ Bn, AGR (%), CAGR (%))
Table 57 Middle East & Africa Agricultural Robots Market by Application, 2023-2033 (US$ Bn, AGR (%), CAGR (%))
Table 58 Middle East & Africa Agricultural Robots Market by Type, 2023-2033 (US$ Bn, AGR (%), CAGR (%))
Table 59 GCC Agricultural Robots Market by Value, 2023-2033 (US$ Bn, AGR (%), CAGR (%))
Table 60 South Africa Agricultural Robots Market by Value, 2023-2033 (US$ Bn, AGR (%), CAGR (%))
Table 61 Rest of Middle East & Africa Agricultural Robots Market by Value, 2023-2033 (US$ Bn, AGR (%), CAGR (%))
Table 62 Latin America Agricultural Robots Market by Value, 2023-2033 (US$ Bn, AGR (%), CAGR (%))
Table 63 Latin America Agricultural Robots Market by Country, 2023-2033 (US$ Bn, AGR (%), CAGR (%))
Table 64 Latin America Agricultural Robots Market by Farm Produce, 2023-2033 (US$ Bn, AGR (%), CAGR (%))
Table 65 Latin America Agricultural Robots Market by Application, 2023-2033 (US$ Bn, AGR (%), CAGR (%))
Table 66 Latin America Agricultural Robots Market by Type, 2023-2033 (US$ Bn, AGR (%), CAGR (%))
Table 67 Brazil Agricultural Robots Market by Value, 2023-2033 (US$ Bn, AGR (%), CAGR (%))
Table 68 Mexico Agricultural Robots Market by Value, 2023-2033 (US$ Bn, AGR (%), CAGR (%))
Table 69 Rest of Latin America Agricultural Robots Market by Value, 2023-2033 (US$ Bn, AGR (%), CAGR (%))
Table 70 Deere & Company: Key Details, (CEO, HQ, Revenue, Founded, No. of Employees, Company Type, Website, Business Segment)
Table 71 Deere & Company: Product Benchmarking
Table 72 Deere & Company: Strategic Outlook
Table 73 CNH Industrial N.V..: Key Details, (CEO, HQ, Revenue, Founded, No. of Employees, Company Type, Website, Business Segment)
Table 74 CNH Industrial N.V..: Product Benchmarking
Table 75 CNH Industrial N.V..: Strategic Outlook
Table 76 AGCO Corporation: Key Details, (CEO, HQ, Revenue, Founded, No. of Employees, Company Type, Website, Business Segment)
Table 77 AGCO Corporation: Product Benchmarking
Table 78 AGCO Corporation: Strategic Outlook
Table 79 DeLaval: Key Details, (CEO, HQ, Revenue, Founded, No. of Employees, Company Type, Website, Business Segment)
Table 80 DeLaval: Product Benchmarking
Table 81 DeLaval: Strategic Outlook
Table 82 Trimble Inc.: Key Details, (CEO, HQ, Revenue, Founded, No. of Employees, Company Type, Website, Business Segment)
Table 83 Trimble Inc.: Product Benchmarking
Table 84 Trimble Inc.: Strategic Outlook
Table 85 BouMatic Robotics B.V.: Key Details, (CEO, HQ, Revenue, Founded, No. of Employees, Company Type, Website, Business Segment)
Table 86 BouMatic Robotics B.V.: Product Benchmarking
Table 87 BouMatic Robotics B.V.: Strategic Outlook
Table 88 Lely Industries N.V.: Key Details, (CEO, HQ, Revenue, Founded, No. of Employees, Company Type, Website, Business Segment)
Table 89 Lely Industries N.V.: Product Benchmarking
Table 90 Lely Industries N.V.: Strategic Outlook
Table 91 AgEagle Aerial Systems Inc.: Key Details, (CEO, HQ, Revenue, Founded, No. of Employees, Company Type, Website, Business Segment)
Table 92 AgEagle Aerial Systems Inc.: Product Benchmarking
Table 93 AgEagle Aerial Systems Inc.: Strategic Outlook
Table 94 Yanmar Co., Ltd.: Key Details, (CEO, HQ, Revenue, Founded, No. of Employees, Company Type, Website, Business Segment)
Table 95 Yanmar Co., Ltd.: Product Benchmarking
Table 96 Yanmar Co., Ltd.: Strategic Outlook
Table 97 DeepField Robotics: Key Details, (CEO, HQ, Revenue, Founded, No. of Employees, Company Type, Website, Business Segment)
Table 98 Deepfield Robotics: Product Benchmarking
Table 99 ecoRobotix: Key Details, (CEO, HQ, Revenue, Founded, No. of Employees, Company Type, Website, Business Segment)
Table 100 ecoRobotix: Product Benchmarking
Table 101 Harvest Automation Inc.: Key Details, (CEO, HQ, Revenue, Founded, No. of Employees, Company Type, Website, Business Segment)
Table 102 Harvest Automation Inc.: Product Benchmarking
Table 103 Naïo Technologies : Key Details, (CEO, HQ, Revenue, Founded, No. of Employees, Company Type, Website, Business Segment)
Table 104 Naïo Technologies: Product Benchmarking
Table 105 Naïo Technologies: Strategic Outlook
Table 106 Robotics Plus Ltd : Key Details, (CEO, HQ, Revenue, Founded, No. of Employees, Company Type, Website, Business Segment)
Table 107 Robotics Plus Ltd: Product Benchmarking
Table 108 Robotics Plus Ltd : Strategic Outlook
Table 109 Kubota Corporation: Key Details, (CEO, HQ, Revenue, Founded, No. of Employees, Company Type, Website, Business Segment)
Table 110 Kubota Corporation: Product Benchmarking
Table 111 Kubota Corporation: Strategic Outlook
List of Figures
Figure 1 Agricultural Robots Market Segmentation
Figure 2 Agricultural Robots Market by Farm Produce: Market Attractiveness Index
Figure 3 Agricultural Robots Market by Application: Market Attractiveness Index
Figure 4 Agricultural Robots Market by Type: Market Attractiveness Index
Figure 5 Agricultural Robots Market Attractiveness Index by Region
Figure 6 Agricultural Robots Market: Market Dynamics
Figure 7 Agricultural Robots Market by Region, 2023-2033 (US$ Bn, AGR (%)) (V-Shaped Recovery Scenario)
Figure 8 Agricultural Robots Market by Region, 2023-2033 (US$ Bn, AGR (%)) (W-Shaped Recovery Scenario)
Figure 9 Agricultural Robots Market by Region, 2023-2033 (US$ Bn, AGR (%)) (U-Shaped Recovery Scenario)
Figure 10 Agricultural Robots Market by Region, 2023-2033 (US$ Bn, AGR (%)) (L-Shaped Recovery Scenario)
Figure 11 Agricultural Robots Market: Porter’s Five Forces Analysis
Figure 12 Agricultural Robots Market by Farm Produce: Market Attractiveness Index
Figure 13 Agricultural Robots Market by Farm Produce, 2023-2033 (US$ Bn, AGR (%))
Figure 14 Dairy & Livestock Market by Region, 2023-2033 (US$ Bn, AGR (%))
Figure 15 Dairy & Livestock Segment Market Share Forecast by Region, 2023 & 2033 (%)
Figure 16 Field Crops Market by Region, 2023-2033 (US$ Bn, AGR (%))
Figure 17 Field Crops Segment Market Share Forecast by Region, 2023 & 2033 (%)
Figure 18 Fruits & Vegetables Market by Region, 2023-2033 (US$ Bn, AGR (%))
Figure 19 Fruits & Vegetables Segment Market Share Forecast by Region, 2023 & 2033 (%)
Figure 20 Other Farm Produce Market by Region, 2023-2033 (US$ Bn, AGR (%))
Figure 21 Other Farm Produce Segment Market Share Forecast by Region, 2023 & 2033 (%)
Figure 22 Agricultural Robots Market by Application: Market Attractiveness Index
Figure 23 Agricultural Robots Market by Application, 2023-2033 (US$ Bn, AGR (%))
Figure 24 Dairy & Livestock Management Market by Region, 2023-2033 (US$ Bn, AGR (%))
Figure 25 Dairy & Livestock Management Segment Market Share Forecast by Region, 2023 & 2033 (%)
Figure 26 Harvest Management Market by Region, 2023-2033 (US$ Bn, AGR (%))
Figure 27 Harvest Management Segment Market Share Forecast by Region, 2023 & 2033 (%)
Figure 28 Field Farming Market by Region, 2023-2033 (US$ Bn, AGR (%))
Figure 29 Field Farming Segment Market Share Forecast by Region, 2023 & 2033 (%)
Figure 30 Soil & Irrigation Management Market by Region, 2023-2033 (US$ Bn, AGR (%))
Figure 31 Soil & Irrigation Management Segment Market Share Forecast by Region, 2023 & 2033 (%)
Figure 32 Other Applications Market by Region, 2023-2033 (US$ Bn, AGR (%))
Figure 33 Other Applications Segment Market Share Forecast by Region, 2023 & 2033 (%)
Figure 34 Agricultural Robots Market by Type: Market Attractiveness Index
Figure 35 Agricultural Robots Market by Type, 2023-2033 (US$ Bn, AGR (%))
Figure 36 Milking Robots Market by Region, 2023-2033 (US$ Bn, AGR (%))
Figure 37 Milking Robots Segment Market Share Forecast by Region, 2023 & 2033 (%)
Figure 38 UAVs/Drones Market by Region, 2023-2033 (US$ Bn, AGR (%))
Figure 39 UAVs/Drones Segment Market Share Forecast by Region, 2023 & 2033 (%)
Figure 40 Automated Harvesting Systems Market by Region, 2023-2033 (US$ Bn, AGR (%))
Figure 41 Automated Harvesting Systems Segment Market Share Forecast by Region, 2023 & 2033 (%)
Figure 42 Driverless Tractors Market by Region, 2023-2033 (US$ Bn, AGR (%))
Figure 43 Driverless Tractors Segment Market Share Forecast by Region, 2023 & 2033 (%)
Figure 44 Robotic Weeding & Seeding Market by Region, 2023-2033 (US$ Bn, AGR (%))
Figure 45 Robotic Weeding & Seeding Segment Market Share Forecast by Region, 2023 & 2033 (%)
Figure 46 Other Types Market by Region, 2023-2033 (US$ Bn, AGR (%))
Figure 47 Other Types Segment Market Share Forecast by Region, 2023 & 2033 (%)
Figure 48 Agricultural Robots Market Forecast by Region 2023 and 2033 (Revenue, CAGR%)
Figure 49 Agricultural Robots Market by Region, 2023-2033 (US$ Bn, AGR (%))
Figure 50 North America Agricultural Robots Market Attractiveness Index
Figure 51 North America Agricultural Robots Market by Region, 2023, 2028 & 2033 (US$ Billion)
Figure 52 North America Agricultural Robots Market by Value, 2023-2033 (US$ Bn, AGR (%))
Figure 53 North America Agricultural Robots Market by Country, 2023-2033 (US$ Bn, AGR (%))
Figure 54 North America Agricultural Robots Market Share Forecast by Country, 2023 & 2033 (%)
Figure 55 North America Agricultural Robots Market by Farm Produce, 2023-2033 (US$ Bn, AGR (%))
Figure 56 North America Agricultural Robots Market Share Forecast by Farm Produce, 2023 & 2033 (%)
Figure 57 North America Agricultural Robots Market by Application, 2023-2033 (US$ Bn, AGR (%))
Figure 58 North America Agricultural Robots Market Share Forecast by Application, 2023 & 2033 (%)
Figure 59 North America Agricultural Robots Market by Type, 2023-2033 (US$ Bn, AGR (%))
Figure 60 North America Agricultural Robots Market Share Forecast by Type, 2023 & 2033 (%)
Figure 61 US Agricultural Robots Market by Value, 2023-2033 (US$ Bn, AGR (%))
Figure 62 Canada Agricultural Robots Market by Value, 2023-2033 (US$ Bn, AGR (%))
Figure 63 Europe Agricultural Robots Market Attractiveness Index
Figure 64 Europe Agricultural Robots Market by Region, 2023, 2028 & 2033 (US$ Billion)
Figure 65 Europe Agricultural Robots Market by Value, 2023-2033 (US$ Bn, AGR (%))
Figure 66 Europe Agricultural Robots Market by Country, 2023-2033 (US$ Bn, AGR (%))
Figure 67 Europe Agricultural Robots Market Share Forecast by Country, 2023 & 2033 (%)
Figure 68 Europe Agricultural Robots Market by Farm Produce, 2023-2033 (US$ Bn, AGR (%))
Figure 69 Europe Agricultural Robots Market Share Forecast by Farm Produce, 2023 & 2033 (%)
Figure 70 Europe Agricultural Robots Market by Application, 2023-2033 (US$ Bn, AGR (%))
Figure 71 Europe Agricultural Robots Market Share Forecast by Application, 2023 & 2033 (%)
Figure 72 Europe Agricultural Robots Market by Type, 2023-2033 (US$ Bn, AGR (%))
Figure 73 Europe Agricultural Robots Market Share Forecast by Type, 2023 & 2033 (%)
Figure 74 Germany Agricultural Robots Market by Value, 2023-2033 (US$ Bn, AGR (%))
Figure 75 UK Agricultural Robots Market by Value, 2023-2033 (US$ Bn, AGR (%))
Figure 76 France Agricultural Robots Market by Value, 2023-2033 (US$ Bn, AGR (%))
Figure 77 Italy Agricultural Robots Market by Value, 2023-2033 (US$ Bn, AGR (%))
Figure 78 Netherlands Agricultural Robots Market by Value, 2023-2033 (US$ Bn, AGR (%))
Figure 79 Rest of Europe Agricultural Robots Market by Value, 2023-2033 (US$ Bn, AGR (%))
Figure 80 Asia-Pacific Agricultural Robots Market Attractiveness Index
Figure 81 Asia-Pacific Agricultural Robots Market by Region, 2023, 2028 & 2033 (US$ Billion)
Figure 82 Asia-Pacific Agricultural Robots Market by Value, 2023-2033 (US$ Bn, AGR (%))
Figure 83 Asia-Pacific Agricultural Robots Market by Country, 2023-2033 (US$ Bn, AGR (%))
Figure 84 Asia-Pacific Agricultural Robots Market Share Forecast by Country, 2023 & 2033 (%)
Figure 85 Asia-Pacific Agricultural Robots Market by Farm Produce, 2023-2033 (US$ Bn, AGR (%))
Figure 86 Asia-Pacific Agricultural Robots Market Share Forecast by Farm Produce, 2023 & 2033 (%)
Figure 87 Asia-Pacific Agricultural Robots Market by Application, 2023-2033 (US$ Bn, AGR (%))
Figure 88 Asia-Pacific Agricultural Robots Market Share Forecast by Application, 2023 & 2033 (%)
Figure 89 Asia-Pacific Agricultural Robots Market by Type, 2023-2033 (US$ Bn, AGR (%))
Figure 90 Asia-Pacific Agricultural Robots Market Share Forecast by Type, 2023 & 2033 (%)
Figure 91 China Agricultural Robots Market by Value, 2023-2033 (US$ Bn, AGR (%))
Figure 92 India Agricultural Robots Market by Value, 2023-2033 (US$ Bn, AGR (%))
Figure 93 Japan Agricultural Robots Market by Value, 2023-2033 (US$ Bn, AGR (%))
Figure 94 South Korea Agricultural Robots Market by Value, 2023-2033 (US$ Bn, AGR (%))
Figure 95 Australia Agricultural Robots Market by Value, 2023-2033 (US$ Bn, AGR (%))
Figure 96 Rest of Asia-Pacific Agricultural Robots Market by Value, 2023-2033 (US$ Bn, AGR (%))
Figure 97 Middle East & Africa Agricultural Robots Market Attractiveness Index
Figure 98 Middle East & Africa Agricultural Robots Market by Region, 2023, 2028 & 2033 (US$ Billion)
Figure 99 Middle East & Africa Agricultural Robots Market by Value, 2023-2033 (US$ Bn, AGR (%))
Figure 100 Middle East & Africa Agricultural Robots Market by Country, 2023-2033 (US$ Bn, AGR (%))
Figure 101 Middle East & Africa Agricultural Robots Market Share Forecast by Country, 2023 & 2033 (%)
Figure 102 Middle East & Africa Agricultural Robots Market by Farm Produce, 2023-2033 (US$ Bn, AGR (%))
Figure 103 Middle East & Africa Agricultural Robots Market Share Forecast by Farm Produce, 2023 & 2033 (%)
Figure 104 Middle East & Africa Agricultural Robots Market by Application, 2023-2033 (US$ Bn, AGR (%))
Figure 105 Middle East & Africa Agricultural Robots Market Share Forecast by Application, 2023 & 2033 (%)
Figure 106 Middle East & Africa Agricultural Robots Market by Type, 2023-2033 (US$ Bn, AGR (%))
Figure 107 Middle East & Africa Agricultural Robots Market Share Forecast by Type, 2023 & 2033 (%)
Figure 108 GCC Agricultural Robots Market by Value, 2023-2033 (US$ Bn, AGR (%))
Figure 109 South Africa Agricultural Robots Market by Value, 2023-2033 (US$ Bn, AGR (%))
Figure 110 Rest of Middle East & Africa Agricultural Robots Market by Value, 2023-2033 (US$ Bn, AGR (%))
Figure 111 Latin America Agricultural Robots Market Attractiveness Index
Figure 112 Latin America Agricultural Robots Market by Region, 2023, 2028 & 2033 (US$ Billion)
Figure 113 Latin America Agricultural Robots Market by Value, 2023-2033 (US$ Bn, AGR (%))
Figure 114 Latin America Agricultural Robots Market by Country, 2023-2033 (US$ Bn, AGR (%))
Figure 115 Latin America Agricultural Robots Market Share Forecast by Country, 2023 & 2033 (%)
Figure 116 Latin America Agricultural Robots Market by Farm Produce, 2023-2033 (US$ Bn, AGR (%))
Figure 117 Latin America Agricultural Robots Market Share Forecast by Farm Produce, 2023 & 2033 (%)
Figure 118 Latin America Agricultural Robots Market by Application, 2023-2033 (US$ Bn, AGR (%))
Figure 119 Latin America Agricultural Robots Market Share Forecast by Application, 2023 & 2033 (%)
Figure 120 Latin America Agricultural Robots Market by Type, 2023-2033 (US$ Bn, AGR (%))
Figure 121 Latin America Agricultural Robots Market Share Forecast by Type, 2023 & 2033 (%)
Figure 122 Brazil Agricultural Robots Market by Value, 2023-2033 (US$ Bn, AGR (%))
Figure 123 Mexico Agricultural Robots Market by Value, 2023-2033 (US$ Bn, AGR (%))
Figure 124 Rest of Latin America Agricultural Robots Market by Value, 2023-2033 (US$ Bn, AGR (%))
Figure 125 Agricultural Robots Market: Company Share, 2022
Figure 126 Deere & Company: Net Revenue, 2018-2022 (US$ million, AGR%)
Figure 127 Deere & Company: R&D, 2018-2022 (US$ million, AGR%)
Figure 128 Deere & Company: Regional Revenue Shares, 2022 (%)
Figure 129 Deere & Company: Business Segment Revenue Shares, 2022 (%)
Figure 130 CNH Industrial N.V: Net Revenue, 2018-2022 (US$ million, AGR%)
Figure 131 CNH Industrial N.V: R&D, 2018-2022 (US$ million, AGR%)
Figure 132 CNH Industrial N.V: Regional Revenue Shares, 2022 (%)
Figure 133 CNH Industrial N.V: Business Segment Revenue Shares, 2022 (%)
Figure 134 AGCO Corporation: Net Revenue, 2018-2022 (US$ million, AGR%)
Figure 135 AGCO Corporation: R&D, 2018-2022 (US$ million, AGR%)
Figure 136 AGCO Corporation: Regional Revenue Shares, 2022 (%)
Figure 137 Trimble Inc.: Net Revenue, 2018-2022 (US$ million, AGR%)
Figure 138 Trimble Inc.: R&D, 2018-2022 (US$ million, AGR%)
Figure 139 Trimble Inc.: Business Segment Revenue Shares, 2022 (%)
Figure 140 AgEagle Aerial Systems Inc.: Net Revenue, 2018-2022 (US$ million, AGR%)
Figure 141 AgEagle Aerial Systems Inc.: R&D, 2018-2022 (US$ million, AGR%)
Figure 142 AgEagle Aerial Systems Inc.: Regional Revenue Shares, 2022 (%)
Figure 143 AgEagle Aerial Systems Inc.: Business Segment Revenue Shares, 2022 (%)
Figure 144 Kubota Corporation: Net Revenue, 2018-2022 (US$ million, AGR%)
Figure 145 Kubota Corporation: Regional Revenue Shares, 2022 (%)
Figure 146 Kubota Corporation: Business Segment Revenue Shares, 2022 (%)
ページTOPに戻る
本レポートと同分野(産業用ロボット)の最新刊レポート
Visiongain社の食品と農業分野での最新刊レポート
本レポートと同じKEY WORD(agricultural)の最新刊レポート
よくあるご質問
Visiongain社はどのような調査会社ですか?
英国の調査会社ヴィジョンゲイン社(Visiongain)は、通信とエネルギーのほか、自動車や化学・医薬品、金属など、広範な市場を対象に調査を行っています。自動車市場については、市場全般に関する調査のほ... もっと見る
調査レポートの納品までの日数はどの程度ですか?
在庫のあるものは速納となりますが、平均的には 3-4日と見て下さい。
但し、一部の調査レポートでは、発注を受けた段階で内容更新をして納品をする場合もあります。
発注をする前のお問合せをお願いします。
注文の手続きはどのようになっていますか?
1)お客様からの御問い合わせをいただきます。
2)見積書やサンプルの提示をいたします。
3)お客様指定、もしくは弊社の発注書をメール添付にて発送してください。
4)データリソース社からレポート発行元の調査会社へ納品手配します。
5) 調査会社からお客様へ納品されます。最近は、pdfにてのメール納品が大半です。
お支払方法の方法はどのようになっていますか?
納品と同時にデータリソース社よりお客様へ請求書(必要に応じて納品書も)を発送いたします。
お客様よりデータリソース社へ(通常は円払い)の御振り込みをお願いします。
請求書は、納品日の日付で発行しますので、翌月最終営業日までの当社指定口座への振込みをお願いします。振込み手数料は御社負担にてお願いします。
お客様の御支払い条件が60日以上の場合は御相談ください。
尚、初めてのお取引先や個人の場合、前払いをお願いすることもあります。ご了承のほど、お願いします。
データリソース社はどのような会社ですか?
当社は、世界各国の主要調査会社・レポート出版社と提携し、世界各国の市場調査レポートや技術動向レポートなどを日本国内の企業・公官庁及び教育研究機関に提供しております。
世界各国の「市場・技術・法規制などの」実情を調査・収集される時には、データリソース社にご相談ください。
お客様の御要望にあったデータや情報を抽出する為のレポート紹介や調査のアドバイスも致します。
|
|

