植物油市場レポート:2023-2033
Vegetable Oil Market Report 2023-2033
レポート詳細
植物油市場レポート 2023-2033 :本レポートは、新たな収益源の開拓を目指すリーディングカンパニーにとって、業界とその基礎となる力学をより深く理解する上で、非常に貴重なものとなる... もっと見る
※上記価格は部署ライセンス(Departmental licence)価格です。
その他の価格についてはデータリソースまでお問合せください。
日本語のページは自動翻訳を利用し作成しています。
実際のレポートは英文のみでご納品いたします。

|

|
サマリー
レポート詳細
植物油市場レポート 2023-2033:本レポートは、新たな収益源の開拓を目指すリーディングカンパニーにとって、業界とその基礎となる力学をより深く理解する上で、非常に貴重なものとなるでしょう。また、異業種への進出や新地域での既存事業の拡大を目指す企業にとっても有益なレポートです。
世界人口の増加と都市化、簡便性とパッケージ食品への需要が市場成長を促進する
消費者の食生活の変化や植物由来の製品に対する需要の高まりなどの要因に後押しされ、植物油市場は拡大し、イノベーションを目撃しています。健康への関心の高まりから、消費者はバターやラードなどの動物由来製品に代わる、より健康的で持続可能な代替品を求めるようになり、その結果、植物油の需要が大幅に増加しています。同時に、世界人口の増加と都市化により、便利でパッケージ化された食品への需要が高まり、食品加工産業における植物油の利用が大幅に増加しました。
マーケットリサーチレポートを購入する前に、どのような質問をするべきか?
- 植物油市場はどのように進化しているのか?
- 植物油市場を牽引し、抑制しているものは何か?
- 各植物油のサブマーケットセグメントは予測期間中にどのように成長し、2033年にこれらのサブマーケットが占める収益はどの程度になるのか?
- 2023年から2033年にかけて、各植物油のサブマーケットの市場シェアはどのように推移するのか?
- 2023年から2033年にかけて、市場全体の主な牽引役となるのは何か?
- 主要な植物油市場はマクロ経済ダイナミクスに広く追随するのか、それとも個々の国別市場が他を凌駕するのか?
- 2033年までに各国市場のシェアはどのように変化し、2033年に市場をリードするのはどの地域か?
- 主要プレイヤーは誰で、予測期間中の見通しはどうなっているのか?
- これらの主要企業の植物油プロジェクトは何か?
- 2023年から2033年の間に、業界はどのように進化していくのか?現在および今後10年間に行われる植物油のプロジェクトにはどのような意味があるのか?
- 植物油市場をさらに拡大するために、製品の商業化の必要性は高まっているのか?
- 植物油市場はどこへ向かっているのか、そして市場の最前線に立つためにはどうすればよいのか?
- 新製品やサービスラインに対する最適な投資オプションは何か?
- 企業を新たな成長軌道に乗せ、C-suiteに移行させるための重要な展望とは?
このことが、現在、そして今後10年間の植物油市場にどのような影響を与えるかを見極める必要があります:
- 329ページにわたる本レポートでは、156の表と220のチャート/グラフを独占的に提供します。
- 本レポートでは、業界における主要な収益性の高い分野を取り上げており、今すぐその分野をターゲットにすることができます。
- 世界、地域、国の売上と成長を詳細に分析しています。
- 競合他社が成功した主要なトレンド、変化、収益予測をハイライトしています。
本レポートは、植物油市場が今後10年間にどのように発展するか、またCOVID-19の景気後退とバウンスの変動に合わせて、今日あなたに伝えます。この市場は、過去10年間のどの時点よりも今が重要です。
2033年までの予測やその他の分析により、商業的な展望を明らかにする。
- 2033年までの売上予測に加え、直近の実績、成長率、市場シェアも掲載しています。
- ビジネスの展望や展開など、独自の分析がご覧いただけます。
- 定性的な分析(市場力学、促進要因、機会、阻害要因、課題など)、コスト構造、植物油価格上昇の影響、最近の動向などをご覧いただけます。
本レポートでは、COVID-19が業界や貴社にどのような影響を与えるかについて、データ分析および貴重な知見を提供しています。COVID-19の4つの回収パターン、すなわち「V」「L」「W」「U」の回収パターンとその影響について考察しています。
報告書の対象セグメント
推定別市場セグメント
- 市場価値(US$ Billion)
- 市場数量(Million Metric Ton)
エンドユーズ別市場セグメント
- 食品産業
- 産業用
- バイオディーゼル原料
産業別市場セグメント
- 医薬品
- 化粧品
- 潤滑油
- 塗料
食品産業別市場セグメント
- 焼成・フライ工程
- サラダ・食用油
- マーガリン・スプレッド
- 加工食品・冷凍食品
- 油脂原料、その他
タイプ別市場セグメント
- パーム油
- ソイビーンオイル
- 菜種油
- ヒマワリ種子油
- パームカーネルオイル
- その他の種類
世界市場全体およびセグメントの収益予測に加え、4地域および主要20カ国市場の収益予測も掲載しています:
北米
- アメリカ
- カナダ
欧州
- ドイツ
- ロシア
- イギリス
- フランス
- イタリア
- その他の欧州地域
アジア太平洋地域
- 中国
- インドネシア
- インド
- オーストラリア
- マレーシア
- その他のアジア太平洋地域
ラテンアメリカ
- ブラジル
- アルゼンチン
- その他のラテンアメリカ地域
中近東・アフリカ
- GCC
- 南アフリカ
- その他の中近東・アフリカ
また、2023年から2033年にかけての植物油市場の主要企業のプロファイルと、これらの企業のこのセグメントに焦点を当てたいくつかの企業についても報告しています。
主要企業と市場成長の可能性
・ Abu Dhabi Vegetable oils Co
・ Adani Wilmar Ltd
・ Archer Daniels Midland Company
・ Areej Vegetable Oils & Derivatives S.A.O.C
・ Associated British Foods Plc
・ Borges Agricultural & Industrial Nuts S.A.
・ Bunge Limited
・ CannOils LLC
・ Cargill, Incorporated
・ Golden Agri-Resources Ltd
・ Louis Dreyfus Company B.V.
・ Mewah International, Inc.
・ Momin Oil Industry
・ Omani Vegetable Oils & Derivatives Co. LLC
・ Ruchi Soya Industries Limited
・ Wilmar International Ltd
植物油市場の世界全体の収益、金額ベースで2023年から2033年まで、市場は2023年に3371億8000万米ドルを突破すると、私たちの仕事は計算されます。2033年まで収益が大きく伸びることが予測されます。当社の調査では、最も大きな可能性を秘めた組織を特定します。彼らの能力、進歩、商業的展望を発見することで、常に先を行くことができるようになります。
植物油の市場、2023年から2033年までのレポートはどのように役立つのでしょうか?
要約すると、320ページ以上のレポートでは、以下のような知識を得ることができます:
- 植物油市場、2023年から2033年までの収益予測 市場:種類、最終用途、産業、食品産業、それぞれ世界と地域レベルで予測 - 業界の展望を発見し、投資と収益のための最も有利な場所を見つけることができます。
- 4つの地域と20の主要国市場の2033年までの収益予測 - 北米、欧州、アジア太平洋、ラテンアメリカ、中東&アフリカの植物油市場、2023年から2033年の市場予測をご覧いただけます。また、米国、カナダ、ブラジル、ドイツ、フランス、英国、イタリア、中国、インド、日本、オーストラリアなど、著名な経済圏の市場も予測しています。
- 既存企業および市場参入を目指す企業の展望 - 植物油市場に関わる主要企業15社の企業プロファイルを含む、2023年から2033年の市場。
独自の予測による定量・定性分析をご覧いただけます。私たちのレポートだけが持つ情報を入手し、貴重なビジネスインテリジェンスとして情報を得ることができます。
他にはない情報
私たちの新しいレポートがあれば、知識に遅れをとったり、チャンスを逃したりする可能性は低くなります。私たちの仕事があなたの調査、分析、意思決定にどのように役立つかをご覧ください。Visiongainの研究は、植物油市場、2023年から2033年、市場をリードする企業のための商業分析を必要とするすべての人のためのものです。データ、トレンド、予測を見つけることができます。
ページTOPに戻る
目次
目次
1 レポートの概要
1.1 調査の目的
1.2 植物油の世界市場に関する紹介
1.3 本レポートが提供するもの
1.4 本レポートを読むべき理由
1.5 本分析レポートが回答する主な質問事項
1.6 本レポートは誰のためのものか?
1.7 調査方法
1.7.1 市場の定義
1.7.2 市場評価・予測手法
1.7.3 データ検証
1.7.3.1 プライマリーリサーチ
1.7.3.2 セカンダリーリサーチ
1.8 よくある質問(FAQ)
1.9 関連するVisiongainのレポート
1.10 Visiongainについて
2 エグゼクティブサマリー
3 市場の概要
3.1 主要な調査結果
3.2 マーケットダイナミクス
3.2.1 市場促進要因
3.2.1.1 人口増加と食料需要の増加
3.2.1.2 バイオ燃料に対する世界的な需要の高まり
3.2.1.3 より健康的な食品オプションへの需要の増加
3.2.2 市場抑制要因
3.2.2.1 植物油の生産による環境負荷
3.2.2.2 食用油の代替供給源との競争
3.2.2.3 食用油のコスト高騰
3.2.3 市場機会
3.2.3.1 植物油業界は持続可能性を優先して行動している
3.2.3.2 製薬業界における植物油の利用が拡大している
3.2.3.3 プレミアム品質の製品への需要の高まり
3.3 COVID-19影響度分析
3.4 ポーターのファイブフォース分析
3.4.1 サプライヤーのバーゲニングパワー - 低~中程度
3.4.2 バイヤーのバーゲニングパワー - 中~高程度
3.4.3 競争上のライバル関係-高い
3.4.4 代替品による脅威 - 高
3.4.5 新規参入の脅威 -中
3.5 PEST分析
4 世界の植物油市場分析:産業別
4.1 主要な調査結果
4.2 産業別セグメント 市場魅力度指数
4.3 産業別植物油の世界市場規模推定と予測
4.4 医薬品
4.4.1 2023-2033年の地域別市場規模(US$ Billion)
4.4.2 2023年および2033年の地域別市場シェア(%)
4.5 化粧品
4.5.1 2023-2033年地域別市場規模(US$ Billion)
4.5.2 2023年および2033年の地域別市場シェア(%)
4.6 潤滑油
4.6.1 2023-2033年地域別市場規模(US$ Billion)
4.6.2 2023年および2033年の地域別市場シェア(%)
4.7 塗料
4.7.1 2023-2033年地域別市場規模(US$ Billion)
4.7.2 2023年および2033年の地域別市場シェア(%)
5 世界の植物油市場分析:食品産業別
5.1 主要な調査結果
5.2 食品産業別セグメント 市場魅力度指数
5.3 食品産業別の植物油の世界市場規模の推定と予測
5.4 焼成・フライ工程
5.4.1 2023-2033年の地域別市場規模(US$ Billion)
5.4.2 2023年および2033年の地域別市場シェア(%)
5.5 サラダ・調理用油脂
5.5.1 2023-2033年地域別市場規模(US$ Billion)
5.5.2 2023年および2033年の地域別市場シェア(%)
5.6 マーガリンとその他のスプレッド
5.6.1 2023年-2033年、地域別市場規模(US$ Billion)
5.6.2 2023年および2033年の地域別市場シェア(%)
5.7 加工食品および冷凍食品
5.7.1 2023年-2033年、地域別市場規模(US$ Billion)
5.7.2 2023年および2033年の地域別市場シェア(%)
5.8 脂肪成分およびその他
5.8.1 2023-2033年地域別市場規模(US$ Billion)
5.8.2 2023年および2033年の地域別市場シェア(%)
6 世界の植物油市場分析:タイプ別
6.1 主要な調査結果
6.2 タイプ別セグメント 市場魅力度指数
6.3 植物油の世界市場規模推移のタイプ別推定と予測
6.4 パーム油
6.4.1 2023-2033年の地域別市場規模(US$ Billion)
6.4.2 2023年および2033年の地域別市場シェア(%)
6.5 ソイビーンオイル
6.5.1 2023年-2033年、地域別市場規模(US$ Billion)
6.5.2 2023年および2033年の地域別市場シェア(%)
6.6 菜種油
6.6.1 2023年-2033年の地域別市場規模(US$ Billion)
6.6.2 2023年および2033年の地域別市場シェア(%)
6.7 ヒマワリ種子油
6.7.1 2023年-2033年、地域別市場規模(US$ Billion)
6.7.2 2023年および2033年の地域別市場シェア(%)
6.8 パームカーネルオイル
6.8.1 2023年-2033年、地域別市場規模(US$ Billion)
6.8.2 2023年および2033年の地域別市場シェア(%)
6.9 その他のタイプ
6.9.1 2023年-2033年の地域別市場規模(US$ Billion)
6.9.2 2023年および2033年の地域別市場シェア(%)
7 植物油の世界市場分析:エンドユーズ別
7.1 主要な調査結果
7.2 エンドユーズセグメント 市場魅力度指数
7.3 世界の植物油のエンドユーザー別市場規模の推定と予測
7.4 食品産業
7.4.1 2023-2033年の地域別市場規模(US$ Billion)
7.4.2 2023年および2033年の地域別市場シェア(%)
7.5 産業用
7.5.1 2023年-2033年の地域別市場規模(US$ Billion)
7.5.2 2023年および2033年の地域別市場シェア(%)
7.6 バイオディーゼル原料
7.6.1 2023-2033年地域別市場規模(US$ Billion)
7.6.2 2023年および2033年の地域別市場シェア(%)
8 世界の植物油市場分析:地域別
8.1 主要な調査結果
8.2 地域別市場規模の推計と予測
9 北米の世界植物油市場分析
9.1 主要な調査結果
9.2 北米の世界植物油市場魅力度指数
9.3 北米の世界植物油の国別市場規模、2023年、2028年、2033年 (US$ Billion)
9.4 北米の世界植物油の国別市場規模推定と予測
9.5 北米の植物油の世界市場のエンドユーズ別規模推定と予測
9.6 北米の植物油の世界市場の産業別規模推定と予測
9.7 北米の植物油の世界市場の食品産業別規模推定と予測
9.8 北米の植物油の世界市場の種類別規模推定と予測
9.9 米国の世界植物油市場分析
9.10 カナダの世界植物油市場分析
10 欧州の世界植物油市場分析
10.1 主要な調査結果
10.2 欧州の世界的な植物油の市場魅力度指数
10.3 欧州の世界植物油の国別市場、2023年、2028年、2033年(US$ Billion)
10.4 欧州の世界植物油市場の国別規模推定と予測
10.5 欧州の世界植物油市場のエンドユーズ別規模推定と予測
10.6 欧州の世界植物油市場の産業別規模推定と予測
10.7 欧州の世界植物油市場の食品産業別規模推定と予測
10.8 欧州の世界植物油市場のタイプ別規模推定と予測
10.9 ドイツの世界植物油の市場分析
10.10 イギリスの世界植物油の市場分析
10.11 フランスの世界植物油の市場分析
10.12 イタリアの世界植物油の市場分析
10.13 ロシアの世界植物油の市場分析
10.14 その他の欧州の世界植物油の市場分析
11 アジア太平洋地域の世界植物油市場分析
11.1 主要な調査結果
11.2 アジア太平洋地域の世界植物油市場魅力度指数
11.3 アジア太平洋地域の世界植物油の国別市場規模、2023年、2028年、2033年(US$ Billion)
11.4 アジア太平洋地域の世界植物油市場の国別市場規模推定と予測
11.5 アジア太平洋地域の世界植物油市場のエンドユーズ別規模推定と予測
11.6 アジア太平洋地域の世界植物油市場の産業別規模推定と予測
11.7 アジア太平洋地域の世界植物油市場の食品産業別規模推定と予測
11.8 アジア太平洋地域の世界植物油市場のタイプ別規模推定と予測
11.9 中国の世界植物油の市場分析
11.10 インドの世界植物油の市場分析
11.11 インドネシアの世界植物油の市場分析
11.12 マレーシアの世界植物油の市場分析
11.13 オーストラリアの世界植物油の市場分析
11.14 その他のアジア太平洋地域の世界植物油市場分析
12 中東・アフリカの世界植物油市場分析
12.1 主要な調査結果
12.2 中東・アフリカの世界植物油市場魅力度指数
12.3 中東・アフリカの国別植物油世界市場、2023年、2028年、2033年(US$ Billion)
12.4 中東・アフリカの世界植物油市場の国別規模推定と予測
12.5 中東・アフリカの世界植物油市場のエンドユーズ別規模推定と予測
12.6 中東・アフリカの世界植物油市場の産業別規模推定と予測
12.7 中東・アフリカの世界植物油市場の食品産業別規模推定と予測
12.8 中東・アフリカの世界植物油市場のタイプ別規模推定と予測
12.9 GCCの世界植物油市場分析
12.10 南アフリカの世界植物油市場分析
12.11 その他のMEA地域の世界植物油市場分析
13 ラテンアメリカの世界植物油市場分析
13.1 主要な調査結果
13.2 ラテンアメリカの世界植物油の市場魅力度指数
13.3 ラテンアメリカの世界植物油の国別市場、2023年、2028年、2033年(US$ Billion)
13.4 ラテンアメリカの世界植物油市場の国別規模推定と予測
13.5 ラテンアメリカの世界植物油市場のエンドユーズ別規模推定と予測
13.6 ラテンアメリカの世界植物油市場の産業別規模推定と予測
13.7 ラテンアメリカの世界植物油市場の食品産業別規模推定と予測
13.8 ラテンアメリカの世界植物油市場のタイプ別規模推定と予測
13.9 ブラジルの世界植物油市場分析
13.10 アルゼンチンの世界植物油市場分析
13.11 その他のラテンアメリカ地域の世界植物油市場分析
14 会社概要
14.1 競争環境、2022年
14.2 戦略的な展望
14.3 Associated British Foods Plc
14.3.1 企業スナップショット
14.3.2 会社概要
14.3.3 財務分析
14.3.3.1 純収益、2017年〜2022年
14.3.3.2 地域別市場シェア、2022年
14.3.3.3 セグメントの市場シェア、2022年
14.3.4 製品のベンチマーキング
14.4 Bunge Limited
14.4.1 企業スナップショット
14.4.2 会社概要
14.4.3 財務分析
14.4.3.1 純収益、2017年〜2022年
14.4.3.2 地域別市場シェア、2022年
14.4.3.3 セグメントの市場シェア、2022年
14.4.4 製品ベンチマーキング
14.4.5 戦略的な展望
14.5 Cargill, Incorporated
14.5.1 企業スナップショット
14.5.2 会社概要
14.5.3 製品ベンチマーク
14.5.4 戦略的な展望
14.6 Mewah Group
14.6.1 企業スナップショット
14.6.2 会社概要
14.6.3 財務分析
14.6.3.1 純収益、2017年〜2022年
14.6.3.2 地域別市場シェア、2022年
14.6.3.3 セグメントの市場シェア、2022年
14.6.4 製品のベンチマーキング
14.7 Golden Agri-Resources Ltd
14.7.1 企業スナップショット
14.7.2 会社概要
14.7.3 財務分析
14.7.3.1 純収益、2017年〜2022年
14.7.3.2 地域別市場シェア、2022年
14.7.3.3 セグメントの市場シェア、2022年
14.7.4 製品ベンチマーキング
14.7.5 戦略的な展望
14.8 Ruchi Soya Industries Limited.
14.8.1 企業スナップショット
14.8.2 会社概要
14.8.3 財務分析
14.8.3.1 純収益、2017年〜2022年
14.8.3.2 地域別市場シェア、2022年
14.8.3.3 セグメントの市場シェア、2022年
14.8.4 製品ベンチマーキング
14.9 Momin Oil Industry
14.9.1 企業スナップショット
14.9.2 会社概要
14.9.3 ベンチマーキング
14.10 Omani Vegetable Oils & Derivatives Co.LLC
14.10.1 企業スナップショット
14.10.2 会社概要
14.10.3 ベンチマーキング
14.11 Borges Agricultural & Industrial Nuts S.A.
14.11.1 企業スナップショット
14.11.2 会社概要
14.11.3 財務分析
14.11.3.1 純収益、2017年〜2022年
14.11.3.2 地域別市場シェア、2022年
14.11.3.3 セグメントの市場シェア、2022年
14.11.4 製品ベンチマーキング
14.11.5 戦略的な展望
14.12 CannOils LLC
14.12.1 企業スナップショット
14.12.2 会社概要
14.12.3 製品ベンチマーク
14.13 Abu Dhabi Vegetable oils Co
14.13.1 カンパニースナップショット
14.13.2 会社概要
14.13.3 製品ベンチマーク
14.14 Archer Daniels Midland Company
14.14.1 カンパニースナップショット
14.14.2 会社概要
14.14.3 財務分析
14.14.3.1 純収益、2017年〜2022年
14.14.3.2 R&D、2017年〜2022年
14.14.3.3 地域別市場シェア、2022年
14.14.3.4 セグメント別市場シェア、2022年
14.14.4 製品のベンチマーキング
14.14.5 戦略的な展望
14.15 Wilmar International Ltd
14.15.1 企業スナップショット
14.15.2 会社概要
14.15.3 財務分析
14.15.3.1 純収益、2017年〜2022年
14.15.3.2 地域別市場シェア、2022年
14.15.3.3 セグメントの市場シェア、2022年
14.15.4 製品のベンチマーキング
14.15.5 戦略的な展望
14.16 Louis Dreyfus Company B.V.
14.16.1 企業スナップショット
14.16.2 会社概要
14.16.3 財務分析
14.16.3.1 純収益、2017年〜2022年
14.16.3.2 地域別市場シェア、2022年
14.16.3.3 セグメントの市場シェア、2022年
14.16.4 製品のベンチマーキング
14.16.5 戦略的な展望
14.17 Areej Vegetable Oils & Derivatives S.A.O.C.
14.17.1 会社概要
14.17.2 会社概要
14.17.3 製品のベンチマーキング
14.18 Adani Wilmar Ltd
14.18.1 企業スナップショット
14.18.2 会社概要
14.18.3 財務分析
14.18.3.1 純収益、2017年〜2022年
14.18.3.2 地域別市場シェア、2022年
14.18.3.3 セグメントの市場シェア、2022年
14.18.4 製品のベンチマーキング
14.18.5 戦略的な展望
15 結論と提言
15.1 Visiongainからの結びの言葉
15.2 市場関係者への提言
ページTOPに戻る
図表リスト
表の一覧
Table 1 Global Vegetable Oil Market Snapshot, 2023 & 2033 (US$ Billion, CAGR %)
Table 2 Global Vegetable Oil Market Forecast, 2023-2033 (US$ Bn, AGR (%), CAGR (%)) (V-Shaped Recovery Scenario)
Table 3 Global Vegetable Oil Market by Region, 2023-2033 (US$ Bn, AGR (%), CAGR (%)) (V-Shaped Recovery Scenario)
Table 4 Global Vegetable Oil Market Forecast, 2023-2033 (US$ Bn, AGR (%), CAGR (%)) (W-Shaped Recovery Scenario)
Table 5 Global Vegetable Oil Market by Region, 2023-2033 (US$ Bn, AGR (%), CAGR (%)) (W-Shaped Recovery Scenario)
Table 6 Global Vegetable Oil Market Forecast, 2023-2033 (US$ Bn, AGR (%), CAGR (%)) (U-Shaped Recovery Scenario)
Table 7 Global Vegetable Oil Market by Region, 2023-2033 (US$ Bn, AGR (%), CAGR (%)) (U-Shaped Recovery Scenario)
Table 8 Global Vegetable Oil Market Forecast, 2023-2033 (US$ Bn, AGR (%), CAGR (%)) (L-Shaped Recovery Scenario)
Table 9 Global Vegetable Oil Market by Region, 2023-2033 (US$ Bn, AGR (%), CAGR (%)) (L-Shaped Recovery Scenario)
Table 10 Global Vegetable Oil Market by Industrial, 2023-2033 (US$ Bn, AGR (%), CAGR (%))
Table 11 Pharmaceuticals Market by Region, 2023-2033 (US$ Bn, AGR (%), CAGR (%))
Table 12 Cosmetics Market by Region, 2023-2033 (US$ Bn, AGR (%), CAGR (%))
Table 13 Lubricants Market by Region, 2023-2033 (US$ Bn, AGR (%), CAGR (%))
Table 14 Paints Market by Region, 2023-2033 (US$ Bn, AGR (%), CAGR (%))
Table 15 Global Vegetable Oil Market by Food Industry, 2023-2033 (US$ Bn, AGR (%), CAGR (%))
Table 16 Baking and Frying Processes Market by Region, 2023-2033 (US$ Bn, AGR (%), CAGR (%))
Table 17 Salads and Cooking Oils Market by Region, 2023-2033 (US$ Bn, AGR (%), CAGR (%))
Table 18 Margarine and Other Spreads Market by Region, 2023-2033 (US$ Bn, AGR (%), CAGR (%))
Table 19 Processed and Frozen Foods Market by Region, 2023-2033 (US$ Bn, AGR (%), CAGR (%))
Table 20 Fatty Ingredients and Others Market by Region, 2023-2033 (US$ Bn, AGR (%), CAGR (%))
Table 21 Global Vegetable Oil Market by Type, 2023-2033 (US$ Bn, AGR (%), CAGR (%))
Table 22 Palm Oil Market by Region, 2023-2033 (US$ Bn, AGR (%), CAGR (%))
Table 23 Soybean Oil Market by Region, 2023-2033 (US$ Bn, AGR (%), CAGR (%))
Table 24 The World's Top Rapeseed Producing Countries, 2022(Values in Metric Tons)
Table 25 Rapeseed Oil Market by Region, 2023-2033 (US$ Bn, AGR (%), CAGR (%))
Table 26 Sunflower seed Oil Market by Region, 2023-2033 (US$ Bn, AGR (%), CAGR (%))
Table 27 Palm Kernel Oil Market by Region, 2023-2033 (US$ Bn, AGR (%), CAGR (%))
Table 28 Other Types Market by Region, 2023-2033 (US$ Bn, AGR (%), CAGR (%))
Table 29 Global Vegetable Oil Market by End-Use, 2023-2033 (US$ Bn, AGR (%), CAGR (%))
Table 30 Food Industry Market by Region, 2023-2033 (US$ Bn, AGR (%), CAGR (%))
Table 31 Industrial Market by Region, 2023-2033 (US$ Bn, AGR (%), CAGR (%))
Table 32 Biodiesel Feedstock Market by Region, 2023-2033 (US$ Bn, AGR (%), CAGR (%))
Table 33 Global Vegetable Oil Market by Region, 2023-2033 (US$ Bn, AGR (%), CAGR (%))
Table 34 Global Vegetable Oil Market Volume, by Region, 2023-2033 (Million Metric Ton, AGR (%), CAGR (%))
Table 35 North America Vegetable Oil Market by Value, 2023-2033 (US$ Bn, AGR (%), CAGR (%))
Table 36 North America Vegetable Oil Market by Volume, 2023-2033 (Billion Metric Ton, AGR (%), CAGR (%))
Table 37 North America Vegetable Oil Market by Country, 2023-2033 (US$ Bn, AGR (%), CAGR (%))
Table 38 North America Vegetable Oil Market by Volume, 2023-2033 (Billion Metric Ton, AGR (%), CAGR (%))
Table 39 North America Vegetable Oil Market by End-Use, 2023-2033 (US$ Bn, AGR (%), CAGR (%))
Table 40 North America Vegetable Oil Market by Industrial, 2023-2033 (US$ Bn, AGR (%), CAGR (%))
Table 41 North America Vegetable Oil Market by Food Industry, 2023-2033 (US$ Bn, AGR (%), CAGR (%))
Table 42 North America Vegetable Oil Market by Type, 2023-2033 (US$ Bn, AGR (%), CAGR (%))
Table 43 US Vegetable Oil Market by Value, 2023-2033 (US$ Bn, AGR (%), CAGR (%))
Table 44 US Vegetable Oil Market by Volume, 2023-2033 (Billion Metric Ton, AGR (%), CAGR (%))
Table 45 Canada Vegetable Oil Market by Value, 2023-2033 (US$ Bn, AGR (%), CAGR (%))
Table 46 Canada Vegetable Oil Market by Volume, 2023-2033 (Billion Metric Ton, AGR (%), CAGR (%))
Table 47 Europe Vegetable Oil Market by Value, 2023-2033 (US$ Bn, AGR (%), CAGR (%))
Table 48 Europe Vegetable Oil Market by Volume, 2023-2033 (Billion Metric Ton, AGR (%), CAGR (%))
Table 49 Europe Vegetable Oil Market by Country, 2023-2033 (US$ Bn, AGR (%), CAGR (%))
Table 50 Europe Vegetable Oil Market by Country, 2023-2033 (US$ Bn, AGR (%), CAGR (%))
Table 51 Europe Vegetable Oil Market by End-Use, 2023-2033 (US$ Bn, AGR (%), CAGR (%))
Table 52 Europe Vegetable Oil Market by Industrial, 2023-2033 (US$ Bn, AGR (%), CAGR (%))
Table 53 Europe Vegetable Oil Market by Food Industry, 2023-2033 (US$ Bn, AGR (%), CAGR (%))
Table 54 Europe Vegetable Oil Market by Type, 2023-2033 (US$ Bn, AGR (%), CAGR (%))
Table 55 Germany Vegetable Oil Market by Value, 2023-2033 (US$ Bn, AGR (%), CAGR (%))
Table 56 Germany Vegetable Oil Market by Volume, 2023-2033 (Billion Metric Ton, AGR (%), CAGR (%))
Table 57 UK Vegetable Oil Market by Value, 2023-2033 (US$ Bn, AGR (%), CAGR (%))
Table 58 UK Vegetable Oil Market by Volume, 2023-2033 (Billion Metric Ton, AGR (%), CAGR (%))
Table 59 France Vegetable Oil Market by Value, 2023-2033 (US$ Bn, AGR (%), CAGR (%))
Table 60 France Vegetable Oil Market by Volume, 2023-2033 (Billion Metric Ton, AGR (%), CAGR (%))
Table 61 Italy Vegetable Oil Market by Value, 2023-2033 (US$ Bn, AGR (%), CAGR (%))
Table 62 Italy Vegetable Oil Market by Volume, 2023-2033 (Billion Metric Ton, AGR (%), CAGR (%))
Table 63 Russia Vegetable Oil Market by Value, 2023-2033 (US$ Bn, AGR (%), CAGR (%))
Table 64 Russia Vegetable Oil Market by Volume, 2023-2033 (Billion Metric Ton, AGR (%), CAGR (%))
Table 65 Rest of Europe Vegetable Oil Market by Value, 2023-2033 (US$ Bn, AGR (%), CAGR (%))
Table 66 Rest of Europe Vegetable Oil Market by Volume, 2023-2033 (Billion Metric Ton, AGR (%), CAGR (%))
Table 67 Asia-Pacific Vegetable Oil Market by Value, 2023-2033 (US$ Bn, AGR (%), CAGR (%))
Table 68 Asia-Pacific Vegetable Oil Market by Volume, 2023-2033 (Billion Metric Ton, AGR (%), CAGR (%))
Table 69 Asia-Pacific Vegetable Oil Market by Country, 2023-2033 (US$ Bn, AGR (%), CAGR (%))
Table 70 Asia-Pacific Vegetable Oil Market Volume, by Country, 2023-2033 (Billion Metric Ton, AGR (%), CAGR (%))
Table 71 Asia-Pacific Vegetable Oil Market by End-Use, 2023-2033 (US$ Bn, AGR (%), CAGR (%))
Table 72 Asia-Pacific Vegetable Oil Market by Industrial, 2023-2033 (US$ Bn, AGR (%), CAGR (%))
Table 73 Asia-Pacific Vegetable Oil Market by Food Industry, 2023-2033 (US$ Bn, AGR (%), CAGR (%))
Table 74 Asia-Pacific Vegetable Oil Market by Type, 2023-2033 (US$ Bn, AGR (%), CAGR (%))
Table 75 China Vegetable Oil Market by Value, 2023-2033 (US$ Bn, AGR (%), CAGR (%))
Table 76 China Vegetable Oil Market by Volume, 2023-2033 (Billion Metric Ton, AGR (%), CAGR (%))
Table 77 India Vegetable Oil Market by Value, 2023-2033 (US$ Bn, AGR (%), CAGR (%))
Table 78 India Vegetable Oil Market by Volume, 2023-2033 (Billion Metric Ton, AGR (%), CAGR (%))
Table 79 Indonesia Vegetable Oil Market by Value, 2023-2033 (US$ Bn, AGR (%), CAGR (%))
Table 80 Indonesia Vegetable Oil Market by Volume, 2023-2033 (Billion Metric Ton, AGR (%), CAGR (%))
Table 81 Malaysia Vegetable Oil Market by Value, 2023-2033 (US$ Bn, AGR (%), CAGR (%))
Table 82 Malaysia Vegetable Oil Market by Volume, 2023-2033 (Billion Metric Ton, AGR (%), CAGR (%))
Table 83 Australia Vegetable Oil Market by Value, 2023-2033 (US$ Bn, AGR (%), CAGR (%))
Table 84 Australia Vegetable Oil Market by Volume, 2023-2033 (Billion Metric Ton, AGR (%), CAGR (%))
Table 85 Rest of Asia-Pacific Vegetable Oil Market by Value, 2023-2033 (US$ Bn, AGR (%), CAGR (%))
Table 86 Rest of Asia-Pacific Vegetable Oil Market by Volume, 2023-2033 (Billion Metric Ton, AGR (%), CAGR (%))
Table 87 Middle East & Africa Vegetable Oil Market by Value, 2023-2033 (US$ Bn, AGR (%), CAGR (%))
Table 88 Middle East & Africa Vegetable Oil Market by Volume, 2023-2033 (Billion Metric Ton, AGR (%), CAGR (%))
Table 89 Middle East & Africa Vegetable Oil Market by Country, 2023-2033 (US$ Bn, AGR (%), CAGR (%))
Table 90 Middle East & Africa Vegetable Oil Market by Volume by Country, 2023-2033 (Billion Metric Ton, AGR (%), CAGR (%))
Table 91 Middle East & Africa Vegetable Oil Market by End-Use, 2023-2033 (US$ Bn, AGR (%), CAGR (%))
Table 92 Middle East & Africa Vegetable Oil Market by Food Industry, 2023-2033 (US$ Bn, AGR (%), CAGR (%))
Table 93 Middle East & Africa Vegetable Oil Market by Type, 2023-2033 (US$ Bn, AGR (%), CAGR (%))
Table 94 GCC Vegetable Oil Market by Value, 2023-2033 (US$ Bn, AGR (%), CAGR (%))
Table 95 GCC Vegetable Oil Market by Volume, 2023-2033 (Billion Metric Ton, AGR (%), CAGR (%))
Table 96 South Africa Vegetable Oil Market by Value, 2023-2033 (US$ Bn, AGR (%), CAGR (%))
Table 97 South Africa Vegetable Oil Market by Volume, 2023-2033 (Billion Metric Ton, AGR (%), CAGR (%))
Table 98 Rest of Middle East & Africa Vegetable Oil Market by Value, 2023-2033 (US$ Bn, AGR (%), CAGR (%))
Table 99 Rest of Middle East & Africa Vegetable Oil Market by Volume, 2023-2033 (Billion Metric Ton, AGR (%), CAGR (%))
Table 100 Latin America Vegetable Oil Market by Value, 2023-2033 (US$ Bn, AGR (%), CAGR (%))
Table 101 Latin America Vegetable Oil Market by Volume, 2023-2033 (Billion Metric Ton, AGR (%), CAGR (%))
Table 102 Latin America Vegetable Oil Market by Country, 2023-2033 (US$ Bn, AGR (%), CAGR (%))
Table 103 Latin America Vegetable Oil Market Volume, by Country, 2023-2033 (Billion Metric Ton, AGR (%), CAGR (%))
Table 104 Latin America Vegetable Oil Market by End-Use, 2023-2033 (US$ Bn, AGR (%), CAGR (%))
Table 105 Latin America Vegetable Oil Market by Industrial, 2023-2033 (US$ Bn, AGR (%), CAGR (%))
Table 106 Latin America Vegetable Oil Market by Food Industry, 2023-2033 (US$ Bn, AGR (%), CAGR (%))
Table 107 Latin America Vegetable Oil Market by Type, 2023-2033 (US$ Bn, AGR (%), CAGR (%))
Table 108 Brazil Vegetable Oil Market by Value, 2023-2033 (US$ Bn, AGR (%), CAGR (%))
Table 109 Brazil Vegetable Oil Market by Volume, 2023-2033 (Billion Metric Ton, AGR (%), CAGR (%))
Table 110 Argentina Vegetable Oil Market by Value, 2023-2033 (US$ Bn, AGR (%), CAGR (%))
Table 111 Argentina Vegetable Oil Market by Volume, 2023-2033 (Billion Metric Ton, AGR (%), CAGR (%))
Table 112 Rest of Latin America Vegetable Oil Market by Value, 2023-2033 (US$ Bn, AGR (%), CAGR (%))
Table 113 Rest of Latin America Vegetable Oil Market by Volume, 2023-2033 (Billion Metric Ton, AGR (%), CAGR (%))
Table 114 Strategic Outlook
Table 115 Associated British Foods plc: Key Details, (CEO, HQ, Revenue, Founded, No. of Employees, Company Type, Website, Business Segment)
Table 116 Associated British Foods plc: Product Benchmarking
Table 117 Bunge Ltd: Key Details, (CEO, HQ, Revenue, Founded, No. of Employees, Company Type, Website, Business Segment)
Table 118 Bunge Ltd: Product Benchmarking
Table 119 Bunge Ltd Strategic Outlook
Table 120 Cargill, Incorporated: Key Details, (CEO, HQ, Revenue, Founded, No. of Employees, Company Type, Website, Business Segment)
Table 121 Cargill, Incorporated: Product Benchmarking
Table 122 Cargill, Incorporated Strategic Outlook
Table 123 Mewah Group: Key Details, (CEO, HQ, Revenue, Founded, No. of Employees, Company Type, Website, Business Segment)
Table 124 Mewah Group: Product Benchmarking
Table 125 Golden Agri-Resources Ltd : Key Details, (CEO, HQ, Revenue, Founded, No. of Employees, Company Type, Website, Business Segment)
Table 126 Golden Agri-Resources Ltd : Product Benchmarking
Table 127 Golden Agri-Resources Ltd Strategic Outlook
Table 128 Ruchi Soya Industries Limited: Key Details, (CEO, HQ, Revenue, Founded, No. of Employees, Company Type, Website, Business Segment)
Table 129 Ruchi Soya Industries Limited: Product Benchmarking
Table 130 Momin Oil Industry: Key Details, (CEO, HQ, Revenue, Founded, No. of Employees, Company Type, Website, Business Segment)
Table 131 Momin Oil Industry: Product Benchmarking
Table 132 Omani Vegetable Oils & Derivatives Co. LLC : Key Details, (CEO, HQ, Revenue, Founded, No. of Employees, Company Type, Website, Business Segment)
Table 133 Omani Vegetable Oils & Derivatives Co. LLC : Product Benchmarking
Table 134 Borges Agricultural & Industrial Nuts S.A.: Key Details, (CEO, HQ, Revenue, Founded, No. of Employees, Company Type, Website, Business Segment)
Table 135 Borges Agricultural & Industrial Nuts S.A.: Product Benchmarking
Table 136 Borges Agricultural & Industrial Nuts S.A. Strategic Outlook
Table 137 ConnOils LLC: Key Details, (CEO, HQ, Revenue, Founded, No. of Employees, Company Type, Website, Business Segment)
Table 138 ConnOils LLC: Product Benchmarking
Table 139 Abu Dhabi Vegetable Oil Co.: Key Details, (CEO, HQ, Revenue, Founded, No. of Employees, Company Type, Website, Business Segment)
Table 140 Abu Dhabi Vegetable Oil Co.: Product Benchmarking
Table 141 Archer- Daniels Midland Company: Key Details, (CEO, HQ, Revenue, Founded, No. of Employees, Company Type, Website, Business Segment)
Table 142 Archer- Daniels Midland Company: Product Benchmarking
Table 143 Archer- Daniels Midland Company Strategic Outlook
Table 144 Wilmar International Ltd: Key Details, (CEO, HQ, Revenue, Founded, No. of Employees, Company Type, Website, Business Segment)
Table 145 Wilmar International Ltd: Product Benchmarking
Table 146 Wilmar International Ltd Strategic Outlook
Table 147 Louis Dreyfus Company: Key Details, (CEO, HQ, Revenue, Founded, No. of Employees, Company Type, Website, Business Segment)
Table 148 Louis Dreyfus Company: Product Benchmarking
Table 149 Louis Dreyfus Company Strategic Outlook
Table 150 Areej Vegetable Oils & Derivatives S.A.O.C. : Key Details, (CEO, HQ, Revenue, Founded, No. of Employees, Company Type, Website, Business Segment)
Table 151 Areej Vegetable Oils & Derivatives S.A.O.C. : Product Benchmarking
Table 152 Adani Wilmar Limited: Key Details, (CEO, HQ, Revenue, Founded, No. of Employees, Company Type, Website, Business Segment)
Table 153 Adani Wilmar Limited: Product Benchmarking
Table 154 Adani Wilmar Limited Strategic Outlook
図の一覧
Figure 1 Global Vegetable Oil Market Segmentation
Figure 2 Global Vegetable Oil Market by End- Use: Market Attractiveness Index
Figure 3 Global Vegetable Oil Market by Industrial: Market Attractiveness Index
Figure 4 Global Vegetable Oil Market by Food Industry: Market Attractiveness Index
Figure 5 Global Vegetable Oil Market by Type: Market Attractiveness Index
Figure 6 Global Vegetable Oil Market Attractiveness Index by Region
Figure 7 Global Vegetable Oil Market: Market Dynamics
Figure 8 World Population Growth Rate 10 Years Data (2013-2021)
Figure 9 Biofuel Demand Growth by Fuel and Region, 2021-2022 (Million Liters/Year)
Figure 10 Butter Consumption (Kt) 2022
Figure 11 Price trend 2014--2022
Figure 12 Global Vegetable Oil Market Share Forecast by COVID, 2023-2033 (%)
Figure 13 Global Vegetable Oil Market Forecast, 2023-2033 (US$ Bn, AGR (%)) (V-Shaped Recovery Scenario)
Figure 14 Global Vegetable Oil Market by Region, 2023-2033 (US$ Bn, AGR (%)) (V-Shaped Recovery Scenario)
Figure 15 Global Vegetable Oil Market Forecast, 2023-2033 (US$ Bn, AGR (%)) (W-Shaped Recovery Scenario)
Figure 16 Global Vegetable Oil Market by Region, 2023-2033 (US$ Bn, AGR (%)) (W-Shaped Recovery Scenario)
Figure 17 Global Vegetable Oil Market Forecast, 2023-2033 (US$ Bn, AGR (%)) (U-Shaped Recovery Scenario)
Figure 18 Global Vegetable Oil Market by Region, 2023-2033 (US$ Bn, AGR (%)) (U-Shaped Recovery Scenario)
Figure 19 Global Vegetable Oil Market Forecast, 2023-2033 (US$ Bn, AGR (%)) (L-Shaped Recovery Scenario)
Figure 20 Global Vegetable Oil Market by Region, 2023-2033 (US$ Bn, AGR (%)) (L-Shaped Recovery Scenario)
Figure 21 Global Vegetable Oil Market: Porter’s Five Forces Analysis
Figure 22 Global Vegetable Oil Market: PEST Analysis
Figure 23 Global Vegetable Oil Market by Industrial: Market Attractiveness Index
Figure 24 Global Vegetable Oil Market by Industrial, 2023-2033 (US$ Bn, AGR (%))
Figure 25 Global Vegetable Oil Market Share Forecast by Industrial, 2023, 2028, 2033 (%)
Figure 26 Pharmaceuticals Market by Region, 2023-2033 (US$ Bn, AGR (%))
Figure 27 Pharmaceuticals Segment Market Share Forecast by Region, 2023 & 2033 (%)
Figure 28 Cosmetics Market by Region, 2023-2033 (US$ Bn, AGR (%))
Figure 29 Cosmetics Segment Market Share Forecast by Region, 2023 & 2033 (%)
Figure 30 Lubricants Market by Region, 2023-2033 (US$ Bn, AGR (%))
Figure 31 Lubricants Segment Market Share Forecast by Region, 2023 & 2033 (%)
Figure 32 Paints Market by Region, 2023-2033 (US$ Bn, AGR (%))
Figure 33 Paints Segment Market Share Forecast by Region, 2023 & 2033 (%)
Figure 34 Global Vegetable Oil Market by Food Industry: Market Attractiveness Index
Figure 35 Global Vegetable Oil Market by Food Industry, 2023-2033 (US$ Bn, AGR (%))
Figure 36 Global Vegetable Oil Market Share Forecast by Food Industry, 2023, 2028, 2033 (%)
Figure 37 Baking and Frying Processes Market by Region, 2023-2033 (US$ Bn, AGR (%))
Figure 38 Baking and Frying Processes Segment Market Share Forecast by Region, 2023 & 2033 (%)
Figure 39 Salads and Cooking Oils Market by Region, 2023-2033 (US$ Bn, AGR (%))
Figure 40 Salads and Cooking Oils Segment Market Share Forecast by Region, 2023 & 2033 (%)
Figure 41 Margarine and Other Spreads Market by Region, 2023-2033 (US$ Bn, AGR (%))
Figure 42 Margarine and Other Spreads Segment Market Share Forecast by Region, 2023 & 2033 (%)
Figure 43 Processed and Frozen Foods Market by Region, 2023-2033 (US$ Bn, AGR (%))
Figure 44 Processed and Frozen Foods Segment Market Share Forecast by Region, 2023 & 2033 (%)
Figure 45 Fatty Ingredients and Others Market by Region, 2023-2033 (US$ Bn, AGR (%))
Figure 46 Fatty Ingredients and Others Segment Market Share Forecast by Region, 2023 & 2033 (%)
Figure 47 Global Vegetable Oil Market by Type: Market Attractiveness Index
Figure 48 Global Vegetable Oil Market by Type, 2023-2033 (US$ Bn, AGR (%))
Figure 49 Global Vegetable Oil Market Share Forecast by Type, 2023, 2028, 2033 (%)
Figure 50 Palm Oil Market by Region, 2023-2033 (US$ Bn, AGR (%))
Figure 51 Palm Oil Segment Market Share Forecast by Region, 2023 & 2033 (%)
Figure 52 Soybean Oil Market by Region, 2023-2033 (US$ Bn, AGR (%))
Figure 53 Soybean Oil Segment Market Share Forecast by Region, 2023 & 2033 (%)
Figure 54 Rapeseed Oil Market by Region, 2023-2033 (US$ Bn, AGR (%))
Figure 55 Rapeseed Oil Segment Market Share Forecast by Region, 2023 & 2033 (%)
Figure 56 Sunflower Seed Oil Market by Region, 2023-2033 (US$ Bn, AGR (%))
Figure 57 Sunflower Seed Oil Segment Market Share Forecast by Region, 2023 & 2033 (%)
Figure 58 Palm Kernel Oil Market by Region, 2023-2033 (US$ Bn, AGR (%))
Figure 59 Palm Kernel Oil Segment Market Share Forecast by Region, 2023 & 2033 (%)
Figure 60 Other Types Market by Region, 2023-2033 (US$ Bn, AGR (%))
Figure 61 Oncology Segment Market Share Forecast by Region, 2023 & 2033 (%)
Figure 62 Global Vegetable Oil Market by End-Use: Market Attractiveness Index
Figure 63 Global Vegetable Oil Market by End-Use, 2023-2033 (US$ Bn, AGR (%))
Figure 64 Global Vegetable Oil Market Share Forecast by End-Use, 2023, 2028, 2033 (%)
Figure 65 Food Industry Market by Region, 2023-2033 (US$ Bn, AGR (%))
Figure 66 Food Industry Segment Market Share Forecast by Region, 2023 & 2033 (%)
Figure 67 Industrial Market by Region, 2023-2033 (US$ Bn, AGR (%))
Figure 68 Biodiesel Feedstock Segment Market Share Forecast by Region, 2023 & 2033 (%)
Figure 69 Biodiesel Feedstock Market by Region, 2023-2033 (US$ Bn, AGR (%))
Figure 70 Oncology Segment Market Share Forecast by Region, 2023 & 2033 (%)
Figure 71 Global Vegetable Oil Market Forecast by Region 2023 and 2033 (Revenue, CAGR%)
Figure 72 Global Vegetable Oil Market Share Forecast by Region 2023, 2028, 2033 (%)
Figure 73 Global Vegetable Oil Market by Region, 2023-2033 (US$ Bn, AGR (%))
Figure 74 Global Vegetable Oil Market Volume, by Region, 2023-2033 (Million Metric Ton, AGR (%))
Figure 75 North America Global Vegetable Oil Market Attractiveness Index
Figure 76 North America Global Vegetable Oil Market by Region, 2023, 2028 & 2033 (US$ Billion)
Figure 77 North America Vegetable Oil Market by Value, 2023-2033 (US$ Bn, AGR (%))
Figure 78 North America Vegetable Oil Market by Volume, 2023-2033 (Billion Metric Ton, AGR (%))
Figure 79 North America Vegetable Oil Market by Country, 2023-2033 (US$ Bn, AGR (%))
Figure 80 North America Vegetable Oil Market by Volume, 2023-2033 (Billion Metric Ton, AGR (%))
Figure 81 North America Global Vegetable Oil Market Share Forecast by Country, 2023 & 2033 (%)
Figure 82 North America Vegetable Oil Market by End-Use, 2023-2033 (US$ Bn, AGR (%))
Figure 83 North America Global Vegetable Oil Market Share Forecast by End-Use, 2023 & 2033 (%)
Figure 84 North America Vegetable Oil Market by Industrial, 2023-2033 (US$ Bn, AGR (%))
Figure 85 North America Global Vegetable Oil Market Share Forecast by Industrial, 2023 & 2033 (%)
Figure 86 North America Vegetable Oil Market by Food Industry, 2023-2033 (US$ Bn, AGR (%))
Figure 87 North America Global Vegetable Oil Market Share Forecast by Food Industry, 2023 & 2033 (%)
Figure 88 North America Vegetable Oil Market by Type, 2023-2033 (US$ Bn, AGR (%))
Figure 89 North America Global Vegetable Oil Market Share Forecast by Type, 2023 & 2033 (%)
Figure 90 US Vegetable Oil Market by Value, 2023-2033 (US$ Bn, AGR (%))
Figure 91 US Vegetable Oil Market by Volume, 2023-2033 (Billion Metric Ton, AGR (%))
Figure 92 Canada Vegetable Oil Market by Value, 2023-2033 (US$ Bn, AGR (%))
Figure 93 Canada Vegetable Oil Market by Volume, 2023-2033 (Billion Metric Ton, AGR (%))
Figure 94 Europe Global Vegetable Oil Market Attractiveness Index
Figure 95 Europe Global Vegetable Oil Market by Region, 2023, 2028 & 2033 (US$ Billion)
Figure 96 Europe Vegetable Oil Market by Value, 2023-2033 (US$ Bn, AGR (%))
Figure 97 Europe Vegetable Oil Market by Volume, 2023-2033 (Billion Metric Ton, AGR (%))
Figure 98 Europe Vegetable Oil Market by Country, 2023-2033 (US$ Bn, AGR (%))
Figure 99 Europe Vegetable Oil Market by Country, 2023-2033 (US$ Bn, AGR (%))
Figure 100 Europe Global Vegetable Oil Market Share Forecast by Country, 2023 & 2033 (%)
Figure 101 Europe Vegetable Oil Market by End-Use, 2023-2033 (US$ Bn, AGR (%))
Figure 102 Europe Global Vegetable Oil Market Share Forecast by End-Use, 2023 & 2033 (%)
Figure 103 Europe Vegetable Oil Market by Industrial, 2023-2033 (US$ Bn, AGR (%))
Figure 104 Europe Global Vegetable Oil Market Share Forecast by Industrial, 2023 & 2033 (%)
Figure 105 Europe Vegetable Oil Market by Food Industry, 2023-2033 (US$ Bn, AGR (%))
Figure 106 Europe Global Vegetable Oil Market Share Forecast by Food Industry, 2023 & 2033 (%)
Figure 107 Europe Vegetable Oil Market by Type, 2023-2033 (US$ Bn, AGR (%))
Figure 108 Europe Global Vegetable Oil Market Share Forecast by Type, 2023 & 2033 (%)
Figure 109 Germany Vegetable Oil Market by Value, 2023-2033 (US$ Bn, AGR (%))
Figure 110 Germany Vegetable Oil Market by Volume, 2023-2033 (Billion Metric Ton, AGR (%))
Figure 111 UK Vegetable Oil Market by Value, 2023-2033 (US$ Bn, AGR (%))
Figure 112 UK Vegetable Oil Market by Volume, 2023-2033 (Billion Metric Ton, AGR (%))
Figure 113 France Vegetable Oil Market by Value, 2023-2033 (US$ Bn, AGR (%))
Figure 114 France Vegetable Oil Market by Volume, 2023-2033 (Billion Metric Ton, AGR (%))
Figure 115 Italy Vegetable Oil Market by Value, 2023-2033 (US$ Bn, AGR (%),)
Figure 116 Italy Vegetable Oil Market by Volume, 2023-2033 (Billion Metric Ton, AGR (%))
Figure 117 Russia Vegetable Oil Market by Value, 2023-2033 (US$ Bn, AGR (%))
Figure 118 Russia Vegetable Oil Market by Volume, 2023-2033 (Billion Metric Ton, AGR (%))
Figure 119 Rest of Europe Vegetable Oil Market by Value, 2023-2033 (US$ Bn, AGR (%))
Figure 120 Rest of Europe Vegetable Oil Market by Volume, 2023-2033 (Billion Metric Ton, AGR (%))
Figure 121 Asia-Pacific Global Vegetable Oil Market Attractiveness Index
Figure 122 Asia-Pacific Global Vegetable Oil Market by Region, 2023, 2028 & 2033 (US$ Billion)
Figure 123 Asia-Pacific Vegetable Oil Market by Value, 2023-2033 (US$ Bn, AGR (%))
Figure 124 Asia-Pacific Vegetable Oil Market by Volume, 2023-2033 (Billion Metric Ton, AGR (%))
Figure 125 Asia-Pacific Vegetable Oil Market by Country, 2023-2033 (US$ Bn, AGR (%))
Figure 126 Asia-Pacific Vegetable Oil Market Volume, by Country, 2023-2033 (Billion Metric Ton, AGR (%))
Figure 127 Asia-Pacific Global Vegetable Oil Market Share Forecast by Country, 2023 & 2033 (%)
Figure 128 Asia-Pacific Vegetable Oil Market by End-Use, 2023-2033 (US$ Bn, AGR (%))
Figure 129 Asia-Pacific Global Vegetable Oil Market Share Forecast by End-Use, 2023 & 2033 (%)
Figure 130 Asia-Pacific Vegetable Oil Market by Industrial, 2023-2033 (US$ Bn, AGR (%))
Figure 131 Asia-Pacific Global Vegetable Oil Market Share Forecast by Industrial, 2023 & 2033 (%)
Figure 132 Asia-Pacific Vegetable Oil Market by Food Industry, 2023-2033 (US$ Bn, AGR (%))
Figure 133 Asia-Pacific Global Vegetable Oil Market Share Forecast by Food Industry, 2023 & 2033 (%)
Figure 134 Asia-Pacific Vegetable Oil Market by Type, 2023-2033 (US$ Bn, AGR (%))
Figure 135 Asia-Pacific Global Vegetable Oil Market Share Forecast by Type, 2023 & 2033 (%)
Figure 136 China Vegetable Oil Market by Value, 2023-2033 (US$ Bn, AGR (%))
Figure 137 China Vegetable Oil Market by Volume, 2023-2033 (Billion Metric Ton, AGR (%))
Figure 138 India Vegetable Oil Market by Value, 2023-2033 (US$ Bn, AGR (%))
Figure 139 India Vegetable Oil Market by Volume, 2023-2033 (Billion Metric Ton, AGR (%))
Figure 140 Indonesia Vegetable Oil Market by Value, 2023-2033 (US$ Bn, AGR (%))
Figure 141 Indonesia Vegetable Oil Market by Volume, 2023-2033 (Billion Metric Ton, AGR (%))
Figure 142 Malaysia Vegetable Oil Market by Value, 2023-2033 (US$ Bn, AGR (%))
Figure 143 Malaysia Vegetable Oil Market by Volume, 2023-2033 (Billion Metric Ton, AGR (%))
Figure 144 Australia Vegetable Oil Market by Value, 2023-2033 (US$ Bn, AGR (%))
Figure 145 Australia Vegetable Oil Market by Volume, 2023-2033 (Billion Metric Ton, AGR (%))
Figure 146 Rest of Asia-Pacific Vegetable Oil Market by Value, 2023-2033 (US$ Bn, AGR (%))
Figure 147 Rest of Asia-Pacific Vegetable Oil Market by Volume, 2023-2033 (Billion Metric Ton, AGR (%))
Figure 148 Middle East & Africa Global Vegetable Oil Market Attractiveness Index
Figure 149 Middle East & Africa Global Vegetable Oil Market by Region, 2023, 2028 & 2033 (US$ Billion)
Figure 150 Middle East & Africa Vegetable Oil Market by Value, 2023-2033 (US$ Bn, AGR (%))
Figure 151 Middle East & Africa Vegetable Oil Market by Volume, 2023-2033 (Billion Metric Ton, AGR (%))
Figure 152 Middle East & Africa Vegetable Oil Market by Country, 2023-2033 (US$ Bn, AGR (%))
Figure 153 Middle East & Africa Vegetable Oil Market by Volume by Country, 2023-2033 (Billion Metric Ton, AGR (%))
Figure 154 Middle East & Africa Global Vegetable Oil Market Share Forecast by Country, 2023 & 2033 (%)
Figure 155 Middle East & Africa Vegetable Oil Market by End-Use, 2023-2033 (US$ Bn, AGR (%))
Figure 156 Middle East & Africa Global Vegetable Oil Market Share Forecast by End-Use, 2023 & 2033 (%)
Figure 157 Middle East & Africa Global Vegetable Oil Market Share Forecast by Industrial, 2023 & 2033 (%)
Figure 158 Middle East & Africa Vegetable Oil Market by Food Industry, 2023-2033 (US$ Bn, AGR (%))
Figure 159 Middle East & Africa Global Vegetable Oil Market Share Forecast by Food Industry, 2023 & 2033 (%)
Figure 160 Middle East & Africa Vegetable Oil Market by Type, 2023-2033 (US$ Bn, AGR (%))
Figure 161 Middle East & Africa Global Vegetable Oil Market Share Forecast by Type, 2023 & 2033 (%)
Figure 162 GCC Vegetable Oil Market by Value, 2023-2033 (US$ Bn, AGR (%))
Figure 163 GCC Vegetable Oil Market by Volume, 2023-2033 (Billion Metric Ton, AGR (%))
Figure 164 South Africa Vegetable Oil Market by Value, 2023-2033 (US$ Bn, AGR (%))
Figure 165 South Africa Vegetable Oil Market by Volume, 2023-2033 (Billion Metric Ton, AGR (%))
Figure 166 Rest of Middle East & Africa Vegetable Oil Market by Value, 2023-2033 (US$ Bn, AGR (%))
Figure 167 Rest of Middle East & Africa Vegetable Oil Market by Volume, 2023-2033 (Billion Metric Ton, AGR (%))
Figure 168 Latin America Global Vegetable Oil Market Attractiveness Index
Figure 169 Latin America Global Vegetable Oil Market by Region, 2023, 2028 & 2033 (US$ Billion)
Figure 170 Latin America Vegetable Oil Market by Value, 2023-2033 (US$ Bn, AGR (%))
Figure 171 Latin America Vegetable Oil Market by Volume, 2023-2033 (Billion Metric Ton, AGR (%))
Figure 172 Latin America Vegetable Oil Market by Country, 2023-2033 (US$ Bn, AGR (%))
Figure 173 Latin America Vegetable Oil Market Volume, by Country, 2023-2033 (Billion Metric Ton, AGR (%))
Figure 174 Latin America Global Vegetable Oil Market Share Forecast by Country, 2023 & 2033 (%)
Figure 175 Latin America Vegetable Oil Market by End-Use, 2023-2033 (US$ Bn, AGR (%))
Figure 176 Latin America Global Vegetable Oil Market Share Forecast by End-Use, 2023 & 2033 (%)
Figure 177 Latin America Vegetable Oil Market by Industrial, 2023-2033 (US$ Bn, AGR (%))
Figure 178 Latin America Global Vegetable Oil Market Share Forecast by Industrial, 2023 & 2033 (%)
Figure 179 Latin America Vegetable Oil Market by Food Industry, 2023-2033 (US$ Bn, AGR (%))
Figure 180 Latin America Global Vegetable Oil Market Share Forecast by Food Industry, 2023 & 2033 (%)
Figure 181 Latin America Vegetable Oil Market by Type, 2023-2033 (US$ Bn, AGR (%))
Figure 182 Latin America Global Vegetable Oil Market Share Forecast by Type, 2023 & 2033 (%)
Figure 183 Brazil Vegetable Oil Market by Value, 2023-2033 (US$ Bn, AGR (%))
Figure 184 Brazil Vegetable Oil Market by Volume, 2023-2033 (Billion Metric Ton, AGR (%))
Figure 185 Argentina Vegetable Oil Market by Value, 2023-2033 (US$ Bn, AGR (%))
Figure 186 Argentina Vegetable Oil Market by Volume, 2023-2033 (Billion Metric Ton, AGR (%))
Figure 187 Rest of Latin America Vegetable Oil Market by Value, 2023-2033 (US$ Bn, AGR (%))
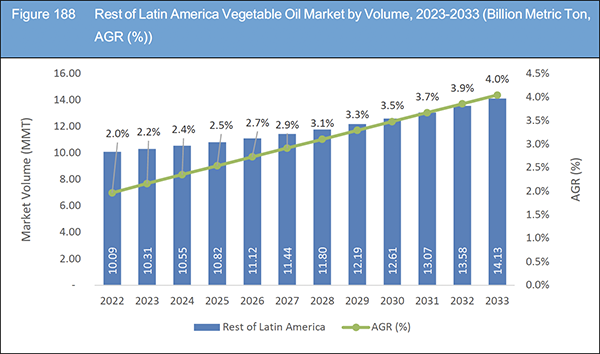
Figure 188 Rest of Latin America Vegetable Oil Market by Volume, 2023-2033 (Billion Metric Ton, AGR (%))
Figure 189 Global Vegetable Oil Market: Company Share, 2022
Figure 190 Associated British Foods plc: Net Revenue, 2017-2022 (US$ Million, AGR%)
Figure 191 Associated British Foods plc: Regional Market Shares, 2022
Figure 192 Associated British Foods plc: Business Segment Market Shares, 2022
Figure 193 Bunge Ltd: Net Revenue, 2017-2022 (US$ Million, AGR%)
Figure 194 Bunge Ltd: Regional Market Shares, 2022
Figure 195 Bunge Ltd: Business Segment Market Shares, 2022
Figure 196 Mewah Group: Net Revenue, 2017-2022 (US$ Million, AGR%)
Figure 197 Mewah Group: Regional Market Shares, 2022
Figure 198 Mewah Group: Business Segment Market Shares, 2022
Figure 199 Golden Agri-Resources Ltd : Net Revenue, 2017-2022 (US$ Million, AGR%)
Figure 200 Golden Agri-Resources Ltd : Regional Market Shares, 2022
Figure 201 Golden Agri-Resources Ltd : Business Segment Market Shares, 2022
Figure 202 Ruchi Soya Industries Limited: Net Revenue, 2017-2022 (US$ Million, AGR%)
Figure 203 Ruchi Soya Industries Limited: Regional Market Shares, 2022
Figure 204 Ruchi Soya Industries Limited: Business Segment Market Shares, 2022
Figure 205 Borges Agricultural & Industrial Nuts S.A.: Net Revenue, 2017-2022 (US$ Million, AGR%)
Figure 206 Borges Agricultural & Industrial Nuts S.A.: Regional Market Shares, 2022
Figure 207 Borges Agricultural & Industrial Nuts S.A.: Business Segment Market Shares, 2022
Figure 208 Archer- Daniels Midland Company: Net Revenue, 2017-2022 (US$ Million, AGR%)
Figure 209 Archer- Daniels Midland Company: R&D, 2017-2022 (US$ Million, AGR%)
Figure 210 Archer- Daniels Midland Company: Regional Market Shares, 2022
Figure 211 Archer- Daniels Midland Company: Business Segment Market Shares, 2022
Figure 212 Wilmar International Ltd: Net Revenue, 2017-2022 (US$ Million, AGR%)
Figure 213 Wilmar International Ltd: Regional Market Shares, 2022
Figure 214 Wilmar International Ltd: Business Segment Market Shares, 2022
Figure 215 Louis Dreyfus Company: Net Revenue, 2017-2022 (US$ Million, AGR%)
Figure 216 Louis Dreyfus Company: Regional Market Shares, 2022
Figure 217 Louis Dreyfus Company: Business Segment Market Shares, 2022
Figure 218 Adani Wilmar Ltd: Net Revenue, 2017-2022 (US$ Million, AGR%)
Figure 219 Adani Wilmar Ltd: Regional Market Shares, 2022
Figure 220 Adani Wilmar Ltd: Business Segment Market Shares, 2022
ページTOPに戻る
Summary
Report Details
The Vegetable Oil Market Report 2023-2033: This report will prove invaluable to leading firms striving for new revenue pockets if they wish to better understand the industry and its underlying dynamics. It will be useful for companies that would like to expand into different industries or to expand their existing operations in a new region.
The Increasing Global Population and Urbanization, the Demand for Convenience and Packaged Foods Are Driving the Market Growth
Driven by factors such as changing consumer dietary preferences and the increasing demand for plant-based products, the vegetable oil market is expanding and witnessing innovation. The surge in health concerns has led consumers to seek healthier and more sustainable alternatives to animal-derived products like butter and lard, resulting in a significant increase in the demand for vegetable oils. Simultaneously, the growing global population and urbanization have fuelled the demand for convenient and packaged foods, leading to substantial growth in the utilization of vegetable oils in the food processing industry.
What Questions Should You Ask before Buying a Market Research Report?
• How is the vegetable oil market evolving?
• What is driving and restraining the vegetable oil market?
• How will each vegetable oil submarket segment grow over the forecast period and how much revenue will these submarkets account for in 2033?
• How will the market shares for each vegetable oil submarket develop from 2023 to 2033?
• What will be the main driver for the overall market from 2023 to 2033?
• Will leading vegetable oil markets broadly follow the macroeconomic dynamics, or will individual national markets outperform others?
• How will the market shares of the national markets change by 2033 and which geographical region will lead the market in 2033?
• Who are the leading players and what are their prospects over the forecast period?
• What are the vegetable oil projects for these leading companies?
• How will the industry evolve during the period between 2023 and 2033? What are the implications of vegetable oil projects taking place now and over the next 10 years?
• Is there a greater need for product commercialisation to further scale the vegetable oil market?
• Where is the vegetable oil market heading and how can you ensure you are at the forefront of the market?
• What are the best investment options for new product and service lines?
• What are the key prospects for moving companies into a new growth path and C-suite?
You need to discover how this will impact the vegetable oil market today, and over the next 10 years:
• Our 329-page report provides 156 tables and 220 charts/graphs exclusively to you.
• The report highlights key lucrative areas in the industry so you can target them – NOW.
• It contains in-depth analysis of global, regional and national sales and growth.
• It highlights for you the key successful trends, changes and revenue projections made by your competitors.
This report tells you TODAY how the vegetable oil market will develop in the next 10 years, and in line with the variations in COVID-19 economic recession and bounce. This market is more critical now than at any point over the last 10 years.
Forecasts to 2033 and other analyses reveal commercial prospects
• In addition to revenue forecasting to 2033, our new study provides you with recent results, growth rates, and market shares.
• You will find original analyses, with business outlooks and developments.
• Discover qualitative analyses (including market dynamics, drivers, opportunities, restraints and challenges), cost structure, impact of rising vegetable oil prices and recent developments.
This report includes data analysis and invaluable insight into how COVID-19 will affect the industry and your company. Four COVID-19 recovery patterns and their impact, namely, “V”, “L”, “W” and “U” are discussed in this report.
Segments Covered in the Report
Market Segment by Estimation
• Market Value (US$ Billion)
• Market Volume (Million Metric Ton)
Market Segment by End-Use
• Food Industry
• Industrial
• Biodiesel Feedstock
Market Segment by Industrial
• Pharmaceuticals
• Cosmetics
• Lubricants
• Paints
Market Segment by Food Industry
• Baking and Frying Processes
• Salads and Cooking Oils
• Margarine and Other Spreads
• Processed and Frozen Foods
• Fatty Ingredients and Others
Market Segment by Type
• Palm Oil
• Soybean Oil
• Rapeseed Oil
• Sunflower-seed Oil
• Palm Kernel Oil
• Other Types
In addition to the revenue predictions for the overall world market and segments, you will also find revenue forecasts for four regional and 20 leading national markets:
North America
• U.S.
• Canada
Europe
• Germany
• Russia
• United Kingdom
• France
• Italy
• Rest of Europe
Asia Pacific
• China
• Indonesia
• India
• Australia
• Malaysia
• Rest of Asia Pacific
Latin America
• Brazil
• Argentina
• Rest of Latin America
Middle East & Africa
• GCC
• South Africa
• Rest of Middle East & Africa
The report also includes profiles and for some of the leading companies in the Vegetable Oil Market, 2023 to 2033, with a focus on this segment of these companies’ operations.
Leading companies and the potential for market growth
• Abu Dhabi Vegetable oils Co
• Adani Wilmar Ltd
• Archer Daniels Midland Company
• Areej Vegetable Oils & Derivatives S.A.O.C
• Associated British Foods Plc
• Borges Agricultural & Industrial Nuts S.A.
• Bunge Limited
• CannOils LLC
• Cargill, Incorporated
• Golden Agri-Resources Ltd
• Louis Dreyfus Company B.V.
• Mewah International, Inc.
• Momin Oil Industry
• Omani Vegetable Oils & Derivatives Co. LLC
• Ruchi Soya Industries Limited
• Wilmar International Ltd
Overall world revenue for Vegetable Oil Market, 2023 to 2033 in terms of value the market will surpass US$337.18 billion in 2023, our work calculates. We predict strong revenue growth through to 2033. Our work identifies which organizations hold the greatest potential. Discover their capabilities, progress, and commercial prospects, helping you stay ahead.
How will the Vegetable Oil Market, 2023 to 2033 report help you?
In summary, our 320+ page report provides you with the following knowledge:
• Revenue forecasts to 2033 for Vegetable Oil Market, 2023 to 2033 Market, with forecasts for type, end-use, industrial, and food industry, each forecast at a global and regional level – discover the industry’s prospects, finding the most lucrative places for investments and revenues.
• Revenue forecasts to 2033 for four regional and 20 key national markets – See forecasts for the Vegetable Oil Market, 2023 to 2033 market in North America, Europe, Asia-Pacific, Latin America and Middle East & Africa. Also forecasted is the market in the US, Canada, Brazil, Germany, France, UK, Italy, China, India, Japan, and Australia among other prominent economies.
• Prospects for established firms and those seeking to enter the market – including company profiles for 15 of the major companies involved in the Vegetable Oil Market, 2023 to 2033.
Find quantitative and qualitative analyses with independent predictions. Receive information that only our report contains, staying informed with invaluable business intelligence.
Information found nowhere else
With our new report, you are less likely to fall behind in knowledge or miss out on opportunities. See how our work could benefit your research, analyses, and decisions. Visiongain’s study is for everybody needing commercial analyses for the Vegetable Oil Market, 2023 to 2033, market-leading companies. You will find data, trends and predictions.
ページTOPに戻る
Table of Contents
Table of Contents
1 Report Overview
1.1 Objectives of the Study
1.2 Introduction to Global Vegetable Oil Market
1.3 What This Report Delivers
1.4 Why You Should Read This Report
1.5 Key Questions Answered by This Analytical Report
1.6 Who Is This Report for?
1.7 Research Methodology
1.7.1 Market Definitions
1.7.2 Market Evaluation & Forecasting Methodology
1.7.3 Data Validation
1.7.3.1 Primary Research
1.7.3.2 Secondary Research
1.8 Frequently Asked Questions (FAQs)
1.9 Associated Visiongain Reports
1.10 About Visiongain
2 Executive Summary
3 Market Overview
3.1 Key Findings
3.2 Market Dynamics
3.2.1 Market Driving Factors
3.2.1.1 Rising Population and Increasing Demand for Food
3.2.1.2 Global Demand for Biofuels Rises
3.2.1.3 Demand for Healthier Food Options Has Increased
3.2.2 Market Restraining Factors
3.2.2.1 Environmental Impact of Vegetable Oil Production
3.2.2.2 Competition from Alternative Sources of Cooking Oil
3.2.2.3 Cost of Edible Oils Has Been Marching Higher
3.2.3 Market Opportunities
3.2.3.1 The Vegetable Oil Industry to Prioritize Sustainability in its Practices
3.2.3.2 Use of Vegetable Oils in the Pharmaceutical Industry Is Growing
3.2.3.3 Rising Demand for Premium Quality Products
3.3 COVID-19 Impact Analysis
3.4 Porter’s Five Forces Analysis
3.4.1 Bargaining Power of Suppliers- Low to Moderate
3.4.2 Bargaining Power of Buyers - Moderate to High
3.4.3 Competitive Rivalry - High
3.4.4 Threat from Substitutes - High
3.4.5 Threat of New Entrants- -Moderate
3.5 PEST Analysis
4 Global Vegetable Oil Market Analysis by Industrial
4.1 Key Findings
4.2 Industrial Segment: Market Attractiveness Index
4.3 Global Vegetable Oil Market Size Estimation and Forecast by Industrial
4.4 Pharmaceuticals
4.4.1 Market Size by Region, 2023-2033 (US$ Billion)
4.4.2 Market Share by Region, 2023 & 2033 (%)
4.5 Cosmetics
4.5.1 Market Size by Region, 2023-2033 (US$ Billion)
4.5.2 Market Share by Region, 2023 & 2033 (%)
4.6 Lubricants
4.6.1 Market Size by Region, 2023-2033 (US$ Billion)
4.6.2 Market Share by Region, 2023 & 2033 (%)
4.7 Paints
4.7.1 Market Size by Region, 2023-2033 (US$ Billion)
4.7.2 Market Share by Region, 2023 & 2033 (%)
5 Global Vegetable Oil Market Analysis by Food Industry
5.1 Key Findings
5.2 Food Industry Segment: Market Attractiveness Index
5.3 Global Vegetable Oil Market Size Estimation and Forecast by Food Industry
5.4 Baking and Frying Processes
5.4.1 Market Size by Region, 2023-2033 (US$ Billion)
5.4.2 Market Share by Region, 2023 & 2033 (%)
5.5 Salads and Cooking Oils
5.5.1 Market Size by Region, 2023-2033 (US$ Billion)
5.5.2 Market Share by Region, 2023 & 2033 (%)
5.6 Margarine and Other Spreads
5.6.1 Market Size by Region, 2023-2033 (US$ Billion)
5.6.2 Market Share by Region, 2023 & 2033 (%)
5.7 Processed and Frozen Foods
5.7.1 Market Size by Region, 2023-2033 (US$ Billion)
5.7.2 Market Share by Region, 2023 & 2033 (%)
5.8 Fatty Ingredients and Others
5.8.1 Market Size by Region, 2023-2033 (US$ Billion)
5.8.2 Market Share by Region, 2023 & 2033 (%)
6 Global Vegetable Oil Market Analysis by Type
6.1 Key Findings
6.2 Type Segment: Market Attractiveness Index
6.3 Global Vegetable Oil Market Size Estimation and Forecast by Type
6.4 Palm Oil
6.4.1 Market Size by Region, 2023-2033 (US$ Billion)
6.4.2 Market Share by Region, 2023 & 2033 (%)
6.5 Soybean Oil
6.5.1 Market Size by Region, 2023-2033 (US$ Billion)
6.5.2 Market Share by Region, 2023 & 2033 (%)
6.6 Rapeseed Oil
6.6.1 Market Size by Region, 2023-2033 (US$ Billion)
6.6.2 Market Share by Region, 2023 & 2033 (%)
6.7 Sunflower Seed Oil
6.7.1 Market Size by Region, 2023-2033 (US$ Billion)
6.7.2 Market Share by Region, 2023 & 2033 (%)
6.8 Palm Kernel Oil
6.8.1 Market Size by Region, 2023-2033 (US$ Billion)
6.8.2 Market Share by Region, 2023 & 2033 (%)
6.9 Other Types
6.9.1 Market Size by Region, 2023-2033 (US$ Billion)
6.9.2 Market Share by Region, 2023 & 2033 (%)
7 Global Vegetable Oil Market Analysis by End-Use
7.1 Key Findings
7.2 End-Use Segment: Market Attractiveness Index
7.3 Global Vegetable Oil Market Size Estimation and Forecast by End-Use
7.4 Food Industry
7.4.1 Market Size by Region, 2023-2033 (US$ Billion)
7.4.2 Market Share by Region, 2023 & 2033 (%)
7.5 Industrial
7.5.1 Market Size by Region, 2023-2033 (US$ Billion)
7.5.2 Market Share by Region, 2023 & 2033 (%)
7.6 Biodiesel Feedstock
7.6.1 Market Size by Region, 2023-2033 (US$ Billion)
7.6.2 Market Share by Region, 2023 & 2033 (%)
8 Global Vegetable Oil Market Analysis by Region
8.1 Key Findings
8.2 Regional Market Size Estimation and Forecast
9 North America Global Vegetable Oil Market Analysis
9.1 Key Findings
9.2 North America Global Vegetable Oil Market Attractiveness Index
9.3 North America Global Vegetable Oil Market by Country, 2023, 2028 & 2033 (US$ Billion)
9.4 North America Global Vegetable Oil Market Size Estimation and Forecast by Country
9.5 North America Global Vegetable Oil Market Size Estimation and Forecast by End-Use
9.6 North America Global Vegetable Oil Market Size Estimation and Forecast by Industrial
9.7 North America Global Vegetable Oil Market Size Estimation and Forecast by Food Industry
9.8 North America Global Vegetable Oil Market Size Estimation and Forecast by Type
9.9 U.S. Global Vegetable Oil Market Analysis
9.10 Canada Global Vegetable Oil Market Analysis
10 Europe Global Vegetable Oil Market Analysis
10.1 Key Findings
10.2 Europe Global Vegetable Oil Market Attractiveness Index
10.3 Europe Global Vegetable Oil Market by Country, 2023, 2028 & 2033 (US$ Billion)
10.4 Europe Global Vegetable Oil Market Size Estimation and Forecast by Country
10.5 Europe Global Vegetable Oil Market Size Estimation and Forecast by End-Use
10.6 Europe Global Vegetable Oil Market Size Estimation and Forecast by Industrial
10.7 Europe Global Vegetable Oil Market Size Estimation and Forecast by Food Industry
10.8 Europe Global Vegetable Oil Market Size Estimation and Forecast by Type
10.9 Germany Global Vegetable Oil Market Analysis
10.10 UK Global Vegetable Oil Market Analysis
10.11 France Global Vegetable Oil Market Analysis
10.12 Italy Global Vegetable Oil Market Analysis
10.13 Russia Global Vegetable Oil Market Analysis
10.14 Rest of Europe Global Vegetable Oil Market Analysis
11 Asia-Pacific Global Vegetable Oil Market Analysis
11.1 Key Findings
11.2 Asia-Pacific Global Vegetable Oil Market Attractiveness Index
11.3 Asia-Pacific Global Vegetable Oil Market by Country, 2023, 2028 & 2033 (US$ Billion)
11.4 Asia-Pacific Global Vegetable Oil Market Size Estimation and Forecast by Country
11.5 Asia-Pacific Global Vegetable Oil Market Size Estimation and Forecast by End-Use
11.6 Asia-Pacific Global Vegetable Oil Market Size Estimation and Forecast by Industrial
11.7 Asia-Pacific Global Vegetable Oil Market Size Estimation and Forecast by Food Industry
11.8 Asia-Pacific Global Vegetable Oil Market Size Estimation and Forecast by Type
11.9 China Global Vegetable Oil Market Analysis
11.10 India Global Vegetable Oil Market Analysis
11.11 Indonesia Global Vegetable Oil Market Analysis
11.12 Malaysia Global Vegetable Oil Market Analysis
11.13 Australia Global Vegetable Oil Market Analysis
11.14 Rest of Asia-Pacific Global Vegetable Oil Market Analysis
12 Middle East & Africa Global Vegetable Oil Market Analysis
12.1 Key Findings
12.2 Middle East & Africa Global Vegetable Oil Market Attractiveness Index
12.3 Middle East & Africa Global Vegetable Oil Market by Country, 2023, 2028 & 2033 (US$ Billion)
12.4 Middle East & Africa Global Vegetable Oil Market Size Estimation and Forecast by Country
12.5 Middle East & Africa Global Vegetable Oil Market Size Estimation and Forecast by End-Use
12.6 Middle East & Africa Global Vegetable Oil Market Size Estimation and Forecast by Industrial
12.7 Middle East & Africa Global Vegetable Oil Market Size Estimation and Forecast by Food Industry
12.8 Middle East & Africa Global Vegetable Oil Market Size Estimation and Forecast by Type
12.9 GCC Global Vegetable Oil Market Analysis
12.10 South Africa Global Vegetable Oil Market Analysis
12.11 Rest of MEA Global Vegetable Oil Market Analysis
13 Latin America Global Vegetable Oil Market Analysis
13.1 Key Findings
13.2 Latin America Global Vegetable Oil Market Attractiveness Index
13.3 Latin America Global Vegetable Oil Market by Country, 2023, 2028 & 2033 (US$ Billion)
13.4 Latin America Global Vegetable Oil Market Size Estimation and Forecast by Country
13.5 Latin America Global Vegetable Oil Market Size Estimation and Forecast by End-Use
13.6 Latin America Global Vegetable Oil Market Size Estimation and Forecast by Industrial
13.7 Latin America Global Vegetable Oil Market Size Estimation and Forecast by Food Industry
13.8 Latin America Global Vegetable Oil Market Size Estimation and Forecast by Type
13.9 Brazil Global Vegetable Oil Market Analysis
13.10 Argentina Global Vegetable Oil Market Analysis
13.11 Rest of Latin America Global Vegetable Oil Market Analysis
14 Company Profiles
14.1 Competitive Landscape, 2022
14.2 Strategic Outlook
14.3 Associated British Foods Plc
14.3.1 Company Snapshot
14.3.2 Company Overview
14.3.3 Financial Analysis
14.3.3.1 Net Revenue, 2017-2022
14.3.3.2 Regional Market Shares, 2022
14.3.3.3 Segment Market Shares, 2022
14.3.4 Product Benchmarking
14.4 Bunge Limited
14.4.1 Company Snapshot
14.4.2 Company Overview
14.4.3 Financial Analysis
14.4.3.1 Net Revenue, 2017-2022
14.4.3.2 Regional Market Shares, 2022
14.4.3.3 Segment Market Shares, 2022
14.4.4 Product Benchmarking
14.4.5 Strategic Outlook
14.5 Cargill, Incorporated
14.5.1 Company Snapshot
14.5.2 Company Overview
14.5.3 Product Benchmarking
14.5.4 Strategic Outlook
14.6 Mewah Group
14.6.1 Company Snapshot
14.6.2 Company Overview
14.6.3 Financial Analysis
14.6.3.1 Net Revenue, 2017-2022
14.6.3.2 Regional Market Shares, 2022
14.6.3.3 Segment Market Shares, 2022
14.6.4 Product Benchmarking
14.7 Golden Agri-Resources Ltd
14.7.1 Company Snapshot
14.7.2 Company Overview
14.7.3 Financial Analysis
14.7.3.1 Net Revenue, 2017-2022
14.7.3.2 Regional Market Shares, 2022
14.7.3.3 Segment Market Shares, 2022
14.7.4 Product Benchmarking
14.7.5 Strategic Outlook
14.8 Ruchi Soya Industries Limited.
14.8.1 Company Snapshot
14.8.2 Company Overview
14.8.3 Financial Analysis
14.8.3.1 Net Revenue, 2017-2022
14.8.3.2 Regional Market Shares, 2022
14.8.3.3 Segment Market Shares, 2022
14.8.4 Product Benchmarking
14.9 Momin Oil Industry
14.9.1 Company Snapshot
14.9.2 Company Overview
14.9.3 Product Benchmarking
14.10 Omani Vegetable Oils & Derivatives Co. LLC
14.10.1 Company Snapshot
14.10.2 Company Overview
14.10.3 Product Benchmarking
14.11 Borges Agricultural & Industrial Nuts S.A.
14.11.1 Company Snapshot
14.11.2 Company Overview
14.11.3 Financial Analysis
14.11.3.1 Net Revenue, 2017-2022
14.11.3.2 Regional Market Shares, 2022
14.11.3.3 Segment Market Shares, 2022
14.11.4 Product Benchmarking
14.11.5 Strategic Outlook
14.12 CannOils LLC
14.12.1 Company Snapshot
14.12.2 Company Overview
14.12.3 Product Benchmarking
14.13 Abu Dhabi Vegetable oils Co
14.13.1 Company Snapshot
14.13.2 Company Overview
14.13.3 Product Benchmarking
14.14 Archer Daniels Midland Company
14.14.1 Company Snapshot
14.14.2 Company Overview
14.14.3 Financial Analysis
14.14.3.1 Net Revenue, 2017-2022
14.14.3.2 R&D, 2017-2022
14.14.3.3 Regional Market Shares, 2022
14.14.3.4 Segment Market Shares, 2022
14.14.4 Product Benchmarking
14.14.5 Strategic Outlook
14.15 Wilmar International Ltd
14.15.1 Company Snapshot
14.15.2 Company Overview
14.15.3 Financial Analysis
14.15.3.1 Net Revenue, 2017-2022
14.15.3.2 Regional Market Shares, 2022
14.15.3.3 Segment Market Shares, 2022
14.15.4 Product Benchmarking
14.15.5 Strategic Outlook
14.16 Louis Dreyfus Company B.V.
14.16.1 Company Snapshot
14.16.2 Company Overview
14.16.3 Financial Analysis
14.16.3.1 Net Revenue, 2017-2022
14.16.3.2 Regional Market Shares, 2022
14.16.3.3 Segment Market Shares, 2022
14.16.4 Product Benchmarking
14.16.5 Strategic Outlook
14.17 Areej Vegetable Oils & Derivatives S.A.O.C
14.17.1 Company Snapshot
14.17.2 Company Overview
14.17.3 Product Benchmarking
14.18 Adani Wilmar Ltd
14.18.1 Company Snapshot
14.18.2 Company Overview
14.18.3 Financial Analysis
14.18.3.1 Net Revenue, 2017-2022
14.18.3.2 Regional Market Shares, 2022
14.18.3.3 Segment Market Shares, 2022
14.18.4 Product Benchmarking
14.18.5 Strategic Outlook
15 Conclusion and Recommendations
15.1 Concluding Remarks from Visiongain
15.2 Recommendations for Market Players
ページTOPに戻る
List of Tables/Graphs
List of Tables
Table 1 Global Vegetable Oil Market Snapshot, 2023 & 2033 (US$ Billion, CAGR %)
Table 2 Global Vegetable Oil Market Forecast, 2023-2033 (US$ Bn, AGR (%), CAGR (%)) (V-Shaped Recovery Scenario)
Table 3 Global Vegetable Oil Market by Region, 2023-2033 (US$ Bn, AGR (%), CAGR (%)) (V-Shaped Recovery Scenario)
Table 4 Global Vegetable Oil Market Forecast, 2023-2033 (US$ Bn, AGR (%), CAGR (%)) (W-Shaped Recovery Scenario)
Table 5 Global Vegetable Oil Market by Region, 2023-2033 (US$ Bn, AGR (%), CAGR (%)) (W-Shaped Recovery Scenario)
Table 6 Global Vegetable Oil Market Forecast, 2023-2033 (US$ Bn, AGR (%), CAGR (%)) (U-Shaped Recovery Scenario)
Table 7 Global Vegetable Oil Market by Region, 2023-2033 (US$ Bn, AGR (%), CAGR (%)) (U-Shaped Recovery Scenario)
Table 8 Global Vegetable Oil Market Forecast, 2023-2033 (US$ Bn, AGR (%), CAGR (%)) (L-Shaped Recovery Scenario)
Table 9 Global Vegetable Oil Market by Region, 2023-2033 (US$ Bn, AGR (%), CAGR (%)) (L-Shaped Recovery Scenario)
Table 10 Global Vegetable Oil Market by Industrial, 2023-2033 (US$ Bn, AGR (%), CAGR (%))
Table 11 Pharmaceuticals Market by Region, 2023-2033 (US$ Bn, AGR (%), CAGR (%))
Table 12 Cosmetics Market by Region, 2023-2033 (US$ Bn, AGR (%), CAGR (%))
Table 13 Lubricants Market by Region, 2023-2033 (US$ Bn, AGR (%), CAGR (%))
Table 14 Paints Market by Region, 2023-2033 (US$ Bn, AGR (%), CAGR (%))
Table 15 Global Vegetable Oil Market by Food Industry, 2023-2033 (US$ Bn, AGR (%), CAGR (%))
Table 16 Baking and Frying Processes Market by Region, 2023-2033 (US$ Bn, AGR (%), CAGR (%))
Table 17 Salads and Cooking Oils Market by Region, 2023-2033 (US$ Bn, AGR (%), CAGR (%))
Table 18 Margarine and Other Spreads Market by Region, 2023-2033 (US$ Bn, AGR (%), CAGR (%))
Table 19 Processed and Frozen Foods Market by Region, 2023-2033 (US$ Bn, AGR (%), CAGR (%))
Table 20 Fatty Ingredients and Others Market by Region, 2023-2033 (US$ Bn, AGR (%), CAGR (%))
Table 21 Global Vegetable Oil Market by Type, 2023-2033 (US$ Bn, AGR (%), CAGR (%))
Table 22 Palm Oil Market by Region, 2023-2033 (US$ Bn, AGR (%), CAGR (%))
Table 23 Soybean Oil Market by Region, 2023-2033 (US$ Bn, AGR (%), CAGR (%))
Table 24 The World's Top Rapeseed Producing Countries, 2022(Values in Metric Tons)
Table 25 Rapeseed Oil Market by Region, 2023-2033 (US$ Bn, AGR (%), CAGR (%))
Table 26 Sunflower seed Oil Market by Region, 2023-2033 (US$ Bn, AGR (%), CAGR (%))
Table 27 Palm Kernel Oil Market by Region, 2023-2033 (US$ Bn, AGR (%), CAGR (%))
Table 28 Other Types Market by Region, 2023-2033 (US$ Bn, AGR (%), CAGR (%))
Table 29 Global Vegetable Oil Market by End-Use, 2023-2033 (US$ Bn, AGR (%), CAGR (%))
Table 30 Food Industry Market by Region, 2023-2033 (US$ Bn, AGR (%), CAGR (%))
Table 31 Industrial Market by Region, 2023-2033 (US$ Bn, AGR (%), CAGR (%))
Table 32 Biodiesel Feedstock Market by Region, 2023-2033 (US$ Bn, AGR (%), CAGR (%))
Table 33 Global Vegetable Oil Market by Region, 2023-2033 (US$ Bn, AGR (%), CAGR (%))
Table 34 Global Vegetable Oil Market Volume, by Region, 2023-2033 (Million Metric Ton, AGR (%), CAGR (%))
Table 35 North America Vegetable Oil Market by Value, 2023-2033 (US$ Bn, AGR (%), CAGR (%))
Table 36 North America Vegetable Oil Market by Volume, 2023-2033 (Billion Metric Ton, AGR (%), CAGR (%))
Table 37 North America Vegetable Oil Market by Country, 2023-2033 (US$ Bn, AGR (%), CAGR (%))
Table 38 North America Vegetable Oil Market by Volume, 2023-2033 (Billion Metric Ton, AGR (%), CAGR (%))
Table 39 North America Vegetable Oil Market by End-Use, 2023-2033 (US$ Bn, AGR (%), CAGR (%))
Table 40 North America Vegetable Oil Market by Industrial, 2023-2033 (US$ Bn, AGR (%), CAGR (%))
Table 41 North America Vegetable Oil Market by Food Industry, 2023-2033 (US$ Bn, AGR (%), CAGR (%))
Table 42 North America Vegetable Oil Market by Type, 2023-2033 (US$ Bn, AGR (%), CAGR (%))
Table 43 US Vegetable Oil Market by Value, 2023-2033 (US$ Bn, AGR (%), CAGR (%))
Table 44 US Vegetable Oil Market by Volume, 2023-2033 (Billion Metric Ton, AGR (%), CAGR (%))
Table 45 Canada Vegetable Oil Market by Value, 2023-2033 (US$ Bn, AGR (%), CAGR (%))
Table 46 Canada Vegetable Oil Market by Volume, 2023-2033 (Billion Metric Ton, AGR (%), CAGR (%))
Table 47 Europe Vegetable Oil Market by Value, 2023-2033 (US$ Bn, AGR (%), CAGR (%))
Table 48 Europe Vegetable Oil Market by Volume, 2023-2033 (Billion Metric Ton, AGR (%), CAGR (%))
Table 49 Europe Vegetable Oil Market by Country, 2023-2033 (US$ Bn, AGR (%), CAGR (%))
Table 50 Europe Vegetable Oil Market by Country, 2023-2033 (US$ Bn, AGR (%), CAGR (%))
Table 51 Europe Vegetable Oil Market by End-Use, 2023-2033 (US$ Bn, AGR (%), CAGR (%))
Table 52 Europe Vegetable Oil Market by Industrial, 2023-2033 (US$ Bn, AGR (%), CAGR (%))
Table 53 Europe Vegetable Oil Market by Food Industry, 2023-2033 (US$ Bn, AGR (%), CAGR (%))
Table 54 Europe Vegetable Oil Market by Type, 2023-2033 (US$ Bn, AGR (%), CAGR (%))
Table 55 Germany Vegetable Oil Market by Value, 2023-2033 (US$ Bn, AGR (%), CAGR (%))
Table 56 Germany Vegetable Oil Market by Volume, 2023-2033 (Billion Metric Ton, AGR (%), CAGR (%))
Table 57 UK Vegetable Oil Market by Value, 2023-2033 (US$ Bn, AGR (%), CAGR (%))
Table 58 UK Vegetable Oil Market by Volume, 2023-2033 (Billion Metric Ton, AGR (%), CAGR (%))
Table 59 France Vegetable Oil Market by Value, 2023-2033 (US$ Bn, AGR (%), CAGR (%))
Table 60 France Vegetable Oil Market by Volume, 2023-2033 (Billion Metric Ton, AGR (%), CAGR (%))
Table 61 Italy Vegetable Oil Market by Value, 2023-2033 (US$ Bn, AGR (%), CAGR (%))
Table 62 Italy Vegetable Oil Market by Volume, 2023-2033 (Billion Metric Ton, AGR (%), CAGR (%))
Table 63 Russia Vegetable Oil Market by Value, 2023-2033 (US$ Bn, AGR (%), CAGR (%))
Table 64 Russia Vegetable Oil Market by Volume, 2023-2033 (Billion Metric Ton, AGR (%), CAGR (%))
Table 65 Rest of Europe Vegetable Oil Market by Value, 2023-2033 (US$ Bn, AGR (%), CAGR (%))
Table 66 Rest of Europe Vegetable Oil Market by Volume, 2023-2033 (Billion Metric Ton, AGR (%), CAGR (%))
Table 67 Asia-Pacific Vegetable Oil Market by Value, 2023-2033 (US$ Bn, AGR (%), CAGR (%))
Table 68 Asia-Pacific Vegetable Oil Market by Volume, 2023-2033 (Billion Metric Ton, AGR (%), CAGR (%))
Table 69 Asia-Pacific Vegetable Oil Market by Country, 2023-2033 (US$ Bn, AGR (%), CAGR (%))
Table 70 Asia-Pacific Vegetable Oil Market Volume, by Country, 2023-2033 (Billion Metric Ton, AGR (%), CAGR (%))
Table 71 Asia-Pacific Vegetable Oil Market by End-Use, 2023-2033 (US$ Bn, AGR (%), CAGR (%))
Table 72 Asia-Pacific Vegetable Oil Market by Industrial, 2023-2033 (US$ Bn, AGR (%), CAGR (%))
Table 73 Asia-Pacific Vegetable Oil Market by Food Industry, 2023-2033 (US$ Bn, AGR (%), CAGR (%))
Table 74 Asia-Pacific Vegetable Oil Market by Type, 2023-2033 (US$ Bn, AGR (%), CAGR (%))
Table 75 China Vegetable Oil Market by Value, 2023-2033 (US$ Bn, AGR (%), CAGR (%))
Table 76 China Vegetable Oil Market by Volume, 2023-2033 (Billion Metric Ton, AGR (%), CAGR (%))
Table 77 India Vegetable Oil Market by Value, 2023-2033 (US$ Bn, AGR (%), CAGR (%))
Table 78 India Vegetable Oil Market by Volume, 2023-2033 (Billion Metric Ton, AGR (%), CAGR (%))
Table 79 Indonesia Vegetable Oil Market by Value, 2023-2033 (US$ Bn, AGR (%), CAGR (%))
Table 80 Indonesia Vegetable Oil Market by Volume, 2023-2033 (Billion Metric Ton, AGR (%), CAGR (%))
Table 81 Malaysia Vegetable Oil Market by Value, 2023-2033 (US$ Bn, AGR (%), CAGR (%))
Table 82 Malaysia Vegetable Oil Market by Volume, 2023-2033 (Billion Metric Ton, AGR (%), CAGR (%))
Table 83 Australia Vegetable Oil Market by Value, 2023-2033 (US$ Bn, AGR (%), CAGR (%))
Table 84 Australia Vegetable Oil Market by Volume, 2023-2033 (Billion Metric Ton, AGR (%), CAGR (%))
Table 85 Rest of Asia-Pacific Vegetable Oil Market by Value, 2023-2033 (US$ Bn, AGR (%), CAGR (%))
Table 86 Rest of Asia-Pacific Vegetable Oil Market by Volume, 2023-2033 (Billion Metric Ton, AGR (%), CAGR (%))
Table 87 Middle East & Africa Vegetable Oil Market by Value, 2023-2033 (US$ Bn, AGR (%), CAGR (%))
Table 88 Middle East & Africa Vegetable Oil Market by Volume, 2023-2033 (Billion Metric Ton, AGR (%), CAGR (%))
Table 89 Middle East & Africa Vegetable Oil Market by Country, 2023-2033 (US$ Bn, AGR (%), CAGR (%))
Table 90 Middle East & Africa Vegetable Oil Market by Volume by Country, 2023-2033 (Billion Metric Ton, AGR (%), CAGR (%))
Table 91 Middle East & Africa Vegetable Oil Market by End-Use, 2023-2033 (US$ Bn, AGR (%), CAGR (%))
Table 92 Middle East & Africa Vegetable Oil Market by Food Industry, 2023-2033 (US$ Bn, AGR (%), CAGR (%))
Table 93 Middle East & Africa Vegetable Oil Market by Type, 2023-2033 (US$ Bn, AGR (%), CAGR (%))
Table 94 GCC Vegetable Oil Market by Value, 2023-2033 (US$ Bn, AGR (%), CAGR (%))
Table 95 GCC Vegetable Oil Market by Volume, 2023-2033 (Billion Metric Ton, AGR (%), CAGR (%))
Table 96 South Africa Vegetable Oil Market by Value, 2023-2033 (US$ Bn, AGR (%), CAGR (%))
Table 97 South Africa Vegetable Oil Market by Volume, 2023-2033 (Billion Metric Ton, AGR (%), CAGR (%))
Table 98 Rest of Middle East & Africa Vegetable Oil Market by Value, 2023-2033 (US$ Bn, AGR (%), CAGR (%))
Table 99 Rest of Middle East & Africa Vegetable Oil Market by Volume, 2023-2033 (Billion Metric Ton, AGR (%), CAGR (%))
Table 100 Latin America Vegetable Oil Market by Value, 2023-2033 (US$ Bn, AGR (%), CAGR (%))
Table 101 Latin America Vegetable Oil Market by Volume, 2023-2033 (Billion Metric Ton, AGR (%), CAGR (%))
Table 102 Latin America Vegetable Oil Market by Country, 2023-2033 (US$ Bn, AGR (%), CAGR (%))
Table 103 Latin America Vegetable Oil Market Volume, by Country, 2023-2033 (Billion Metric Ton, AGR (%), CAGR (%))
Table 104 Latin America Vegetable Oil Market by End-Use, 2023-2033 (US$ Bn, AGR (%), CAGR (%))
Table 105 Latin America Vegetable Oil Market by Industrial, 2023-2033 (US$ Bn, AGR (%), CAGR (%))
Table 106 Latin America Vegetable Oil Market by Food Industry, 2023-2033 (US$ Bn, AGR (%), CAGR (%))
Table 107 Latin America Vegetable Oil Market by Type, 2023-2033 (US$ Bn, AGR (%), CAGR (%))
Table 108 Brazil Vegetable Oil Market by Value, 2023-2033 (US$ Bn, AGR (%), CAGR (%))
Table 109 Brazil Vegetable Oil Market by Volume, 2023-2033 (Billion Metric Ton, AGR (%), CAGR (%))
Table 110 Argentina Vegetable Oil Market by Value, 2023-2033 (US$ Bn, AGR (%), CAGR (%))
Table 111 Argentina Vegetable Oil Market by Volume, 2023-2033 (Billion Metric Ton, AGR (%), CAGR (%))
Table 112 Rest of Latin America Vegetable Oil Market by Value, 2023-2033 (US$ Bn, AGR (%), CAGR (%))
Table 113 Rest of Latin America Vegetable Oil Market by Volume, 2023-2033 (Billion Metric Ton, AGR (%), CAGR (%))
Table 114 Strategic Outlook
Table 115 Associated British Foods plc: Key Details, (CEO, HQ, Revenue, Founded, No. of Employees, Company Type, Website, Business Segment)
Table 116 Associated British Foods plc: Product Benchmarking
Table 117 Bunge Ltd: Key Details, (CEO, HQ, Revenue, Founded, No. of Employees, Company Type, Website, Business Segment)
Table 118 Bunge Ltd: Product Benchmarking
Table 119 Bunge Ltd Strategic Outlook
Table 120 Cargill, Incorporated: Key Details, (CEO, HQ, Revenue, Founded, No. of Employees, Company Type, Website, Business Segment)
Table 121 Cargill, Incorporated: Product Benchmarking
Table 122 Cargill, Incorporated Strategic Outlook
Table 123 Mewah Group: Key Details, (CEO, HQ, Revenue, Founded, No. of Employees, Company Type, Website, Business Segment)
Table 124 Mewah Group: Product Benchmarking
Table 125 Golden Agri-Resources Ltd : Key Details, (CEO, HQ, Revenue, Founded, No. of Employees, Company Type, Website, Business Segment)
Table 126 Golden Agri-Resources Ltd : Product Benchmarking
Table 127 Golden Agri-Resources Ltd Strategic Outlook
Table 128 Ruchi Soya Industries Limited: Key Details, (CEO, HQ, Revenue, Founded, No. of Employees, Company Type, Website, Business Segment)
Table 129 Ruchi Soya Industries Limited: Product Benchmarking
Table 130 Momin Oil Industry: Key Details, (CEO, HQ, Revenue, Founded, No. of Employees, Company Type, Website, Business Segment)
Table 131 Momin Oil Industry: Product Benchmarking
Table 132 Omani Vegetable Oils & Derivatives Co. LLC : Key Details, (CEO, HQ, Revenue, Founded, No. of Employees, Company Type, Website, Business Segment)
Table 133 Omani Vegetable Oils & Derivatives Co. LLC : Product Benchmarking
Table 134 Borges Agricultural & Industrial Nuts S.A.: Key Details, (CEO, HQ, Revenue, Founded, No. of Employees, Company Type, Website, Business Segment)
Table 135 Borges Agricultural & Industrial Nuts S.A.: Product Benchmarking
Table 136 Borges Agricultural & Industrial Nuts S.A. Strategic Outlook
Table 137 ConnOils LLC: Key Details, (CEO, HQ, Revenue, Founded, No. of Employees, Company Type, Website, Business Segment)
Table 138 ConnOils LLC: Product Benchmarking
Table 139 Abu Dhabi Vegetable Oil Co.: Key Details, (CEO, HQ, Revenue, Founded, No. of Employees, Company Type, Website, Business Segment)
Table 140 Abu Dhabi Vegetable Oil Co.: Product Benchmarking
Table 141 Archer- Daniels Midland Company: Key Details, (CEO, HQ, Revenue, Founded, No. of Employees, Company Type, Website, Business Segment)
Table 142 Archer- Daniels Midland Company: Product Benchmarking
Table 143 Archer- Daniels Midland Company Strategic Outlook
Table 144 Wilmar International Ltd: Key Details, (CEO, HQ, Revenue, Founded, No. of Employees, Company Type, Website, Business Segment)
Table 145 Wilmar International Ltd: Product Benchmarking
Table 146 Wilmar International Ltd Strategic Outlook
Table 147 Louis Dreyfus Company: Key Details, (CEO, HQ, Revenue, Founded, No. of Employees, Company Type, Website, Business Segment)
Table 148 Louis Dreyfus Company: Product Benchmarking
Table 149 Louis Dreyfus Company Strategic Outlook
Table 150 Areej Vegetable Oils & Derivatives S.A.O.C. : Key Details, (CEO, HQ, Revenue, Founded, No. of Employees, Company Type, Website, Business Segment)
Table 151 Areej Vegetable Oils & Derivatives S.A.O.C. : Product Benchmarking
Table 152 Adani Wilmar Limited: Key Details, (CEO, HQ, Revenue, Founded, No. of Employees, Company Type, Website, Business Segment)
Table 153 Adani Wilmar Limited: Product Benchmarking
Table 154 Adani Wilmar Limited Strategic Outlook
List of Figures
Figure 1 Global Vegetable Oil Market Segmentation
Figure 2 Global Vegetable Oil Market by End- Use: Market Attractiveness Index
Figure 3 Global Vegetable Oil Market by Industrial: Market Attractiveness Index
Figure 4 Global Vegetable Oil Market by Food Industry: Market Attractiveness Index
Figure 5 Global Vegetable Oil Market by Type: Market Attractiveness Index
Figure 6 Global Vegetable Oil Market Attractiveness Index by Region
Figure 7 Global Vegetable Oil Market: Market Dynamics
Figure 8 World Population Growth Rate 10 Years Data (2013-2021)
Figure 9 Biofuel Demand Growth by Fuel and Region, 2021-2022 (Million Liters/Year)
Figure 10 Butter Consumption (Kt) 2022
Figure 11 Price trend 2014--2022
Figure 12 Global Vegetable Oil Market Share Forecast by COVID, 2023-2033 (%)
Figure 13 Global Vegetable Oil Market Forecast, 2023-2033 (US$ Bn, AGR (%)) (V-Shaped Recovery Scenario)
Figure 14 Global Vegetable Oil Market by Region, 2023-2033 (US$ Bn, AGR (%)) (V-Shaped Recovery Scenario)
Figure 15 Global Vegetable Oil Market Forecast, 2023-2033 (US$ Bn, AGR (%)) (W-Shaped Recovery Scenario)
Figure 16 Global Vegetable Oil Market by Region, 2023-2033 (US$ Bn, AGR (%)) (W-Shaped Recovery Scenario)
Figure 17 Global Vegetable Oil Market Forecast, 2023-2033 (US$ Bn, AGR (%)) (U-Shaped Recovery Scenario)
Figure 18 Global Vegetable Oil Market by Region, 2023-2033 (US$ Bn, AGR (%)) (U-Shaped Recovery Scenario)
Figure 19 Global Vegetable Oil Market Forecast, 2023-2033 (US$ Bn, AGR (%)) (L-Shaped Recovery Scenario)
Figure 20 Global Vegetable Oil Market by Region, 2023-2033 (US$ Bn, AGR (%)) (L-Shaped Recovery Scenario)
Figure 21 Global Vegetable Oil Market: Porter’s Five Forces Analysis
Figure 22 Global Vegetable Oil Market: PEST Analysis
Figure 23 Global Vegetable Oil Market by Industrial: Market Attractiveness Index
Figure 24 Global Vegetable Oil Market by Industrial, 2023-2033 (US$ Bn, AGR (%))
Figure 25 Global Vegetable Oil Market Share Forecast by Industrial, 2023, 2028, 2033 (%)
Figure 26 Pharmaceuticals Market by Region, 2023-2033 (US$ Bn, AGR (%))
Figure 27 Pharmaceuticals Segment Market Share Forecast by Region, 2023 & 2033 (%)
Figure 28 Cosmetics Market by Region, 2023-2033 (US$ Bn, AGR (%))
Figure 29 Cosmetics Segment Market Share Forecast by Region, 2023 & 2033 (%)
Figure 30 Lubricants Market by Region, 2023-2033 (US$ Bn, AGR (%))
Figure 31 Lubricants Segment Market Share Forecast by Region, 2023 & 2033 (%)
Figure 32 Paints Market by Region, 2023-2033 (US$ Bn, AGR (%))
Figure 33 Paints Segment Market Share Forecast by Region, 2023 & 2033 (%)
Figure 34 Global Vegetable Oil Market by Food Industry: Market Attractiveness Index
Figure 35 Global Vegetable Oil Market by Food Industry, 2023-2033 (US$ Bn, AGR (%))
Figure 36 Global Vegetable Oil Market Share Forecast by Food Industry, 2023, 2028, 2033 (%)
Figure 37 Baking and Frying Processes Market by Region, 2023-2033 (US$ Bn, AGR (%))
Figure 38 Baking and Frying Processes Segment Market Share Forecast by Region, 2023 & 2033 (%)
Figure 39 Salads and Cooking Oils Market by Region, 2023-2033 (US$ Bn, AGR (%))
Figure 40 Salads and Cooking Oils Segment Market Share Forecast by Region, 2023 & 2033 (%)
Figure 41 Margarine and Other Spreads Market by Region, 2023-2033 (US$ Bn, AGR (%))
Figure 42 Margarine and Other Spreads Segment Market Share Forecast by Region, 2023 & 2033 (%)
Figure 43 Processed and Frozen Foods Market by Region, 2023-2033 (US$ Bn, AGR (%))
Figure 44 Processed and Frozen Foods Segment Market Share Forecast by Region, 2023 & 2033 (%)
Figure 45 Fatty Ingredients and Others Market by Region, 2023-2033 (US$ Bn, AGR (%))
Figure 46 Fatty Ingredients and Others Segment Market Share Forecast by Region, 2023 & 2033 (%)
Figure 47 Global Vegetable Oil Market by Type: Market Attractiveness Index
Figure 48 Global Vegetable Oil Market by Type, 2023-2033 (US$ Bn, AGR (%))
Figure 49 Global Vegetable Oil Market Share Forecast by Type, 2023, 2028, 2033 (%)
Figure 50 Palm Oil Market by Region, 2023-2033 (US$ Bn, AGR (%))
Figure 51 Palm Oil Segment Market Share Forecast by Region, 2023 & 2033 (%)
Figure 52 Soybean Oil Market by Region, 2023-2033 (US$ Bn, AGR (%))
Figure 53 Soybean Oil Segment Market Share Forecast by Region, 2023 & 2033 (%)
Figure 54 Rapeseed Oil Market by Region, 2023-2033 (US$ Bn, AGR (%))
Figure 55 Rapeseed Oil Segment Market Share Forecast by Region, 2023 & 2033 (%)
Figure 56 Sunflower Seed Oil Market by Region, 2023-2033 (US$ Bn, AGR (%))
Figure 57 Sunflower Seed Oil Segment Market Share Forecast by Region, 2023 & 2033 (%)
Figure 58 Palm Kernel Oil Market by Region, 2023-2033 (US$ Bn, AGR (%))
Figure 59 Palm Kernel Oil Segment Market Share Forecast by Region, 2023 & 2033 (%)
Figure 60 Other Types Market by Region, 2023-2033 (US$ Bn, AGR (%))
Figure 61 Oncology Segment Market Share Forecast by Region, 2023 & 2033 (%)
Figure 62 Global Vegetable Oil Market by End-Use: Market Attractiveness Index
Figure 63 Global Vegetable Oil Market by End-Use, 2023-2033 (US$ Bn, AGR (%))
Figure 64 Global Vegetable Oil Market Share Forecast by End-Use, 2023, 2028, 2033 (%)
Figure 65 Food Industry Market by Region, 2023-2033 (US$ Bn, AGR (%))
Figure 66 Food Industry Segment Market Share Forecast by Region, 2023 & 2033 (%)
Figure 67 Industrial Market by Region, 2023-2033 (US$ Bn, AGR (%))
Figure 68 Biodiesel Feedstock Segment Market Share Forecast by Region, 2023 & 2033 (%)
Figure 69 Biodiesel Feedstock Market by Region, 2023-2033 (US$ Bn, AGR (%))
Figure 70 Oncology Segment Market Share Forecast by Region, 2023 & 2033 (%)
Figure 71 Global Vegetable Oil Market Forecast by Region 2023 and 2033 (Revenue, CAGR%)
Figure 72 Global Vegetable Oil Market Share Forecast by Region 2023, 2028, 2033 (%)
Figure 73 Global Vegetable Oil Market by Region, 2023-2033 (US$ Bn, AGR (%))
Figure 74 Global Vegetable Oil Market Volume, by Region, 2023-2033 (Million Metric Ton, AGR (%))
Figure 75 North America Global Vegetable Oil Market Attractiveness Index
Figure 76 North America Global Vegetable Oil Market by Region, 2023, 2028 & 2033 (US$ Billion)
Figure 77 North America Vegetable Oil Market by Value, 2023-2033 (US$ Bn, AGR (%))
Figure 78 North America Vegetable Oil Market by Volume, 2023-2033 (Billion Metric Ton, AGR (%))
Figure 79 North America Vegetable Oil Market by Country, 2023-2033 (US$ Bn, AGR (%))
Figure 80 North America Vegetable Oil Market by Volume, 2023-2033 (Billion Metric Ton, AGR (%))
Figure 81 North America Global Vegetable Oil Market Share Forecast by Country, 2023 & 2033 (%)
Figure 82 North America Vegetable Oil Market by End-Use, 2023-2033 (US$ Bn, AGR (%))
Figure 83 North America Global Vegetable Oil Market Share Forecast by End-Use, 2023 & 2033 (%)
Figure 84 North America Vegetable Oil Market by Industrial, 2023-2033 (US$ Bn, AGR (%))
Figure 85 North America Global Vegetable Oil Market Share Forecast by Industrial, 2023 & 2033 (%)
Figure 86 North America Vegetable Oil Market by Food Industry, 2023-2033 (US$ Bn, AGR (%))
Figure 87 North America Global Vegetable Oil Market Share Forecast by Food Industry, 2023 & 2033 (%)
Figure 88 North America Vegetable Oil Market by Type, 2023-2033 (US$ Bn, AGR (%))
Figure 89 North America Global Vegetable Oil Market Share Forecast by Type, 2023 & 2033 (%)
Figure 90 US Vegetable Oil Market by Value, 2023-2033 (US$ Bn, AGR (%))
Figure 91 US Vegetable Oil Market by Volume, 2023-2033 (Billion Metric Ton, AGR (%))
Figure 92 Canada Vegetable Oil Market by Value, 2023-2033 (US$ Bn, AGR (%))
Figure 93 Canada Vegetable Oil Market by Volume, 2023-2033 (Billion Metric Ton, AGR (%))
Figure 94 Europe Global Vegetable Oil Market Attractiveness Index
Figure 95 Europe Global Vegetable Oil Market by Region, 2023, 2028 & 2033 (US$ Billion)
Figure 96 Europe Vegetable Oil Market by Value, 2023-2033 (US$ Bn, AGR (%))
Figure 97 Europe Vegetable Oil Market by Volume, 2023-2033 (Billion Metric Ton, AGR (%))
Figure 98 Europe Vegetable Oil Market by Country, 2023-2033 (US$ Bn, AGR (%))
Figure 99 Europe Vegetable Oil Market by Country, 2023-2033 (US$ Bn, AGR (%))
Figure 100 Europe Global Vegetable Oil Market Share Forecast by Country, 2023 & 2033 (%)
Figure 101 Europe Vegetable Oil Market by End-Use, 2023-2033 (US$ Bn, AGR (%))
Figure 102 Europe Global Vegetable Oil Market Share Forecast by End-Use, 2023 & 2033 (%)
Figure 103 Europe Vegetable Oil Market by Industrial, 2023-2033 (US$ Bn, AGR (%))
Figure 104 Europe Global Vegetable Oil Market Share Forecast by Industrial, 2023 & 2033 (%)
Figure 105 Europe Vegetable Oil Market by Food Industry, 2023-2033 (US$ Bn, AGR (%))
Figure 106 Europe Global Vegetable Oil Market Share Forecast by Food Industry, 2023 & 2033 (%)
Figure 107 Europe Vegetable Oil Market by Type, 2023-2033 (US$ Bn, AGR (%))
Figure 108 Europe Global Vegetable Oil Market Share Forecast by Type, 2023 & 2033 (%)
Figure 109 Germany Vegetable Oil Market by Value, 2023-2033 (US$ Bn, AGR (%))
Figure 110 Germany Vegetable Oil Market by Volume, 2023-2033 (Billion Metric Ton, AGR (%))
Figure 111 UK Vegetable Oil Market by Value, 2023-2033 (US$ Bn, AGR (%))
Figure 112 UK Vegetable Oil Market by Volume, 2023-2033 (Billion Metric Ton, AGR (%))
Figure 113 France Vegetable Oil Market by Value, 2023-2033 (US$ Bn, AGR (%))
Figure 114 France Vegetable Oil Market by Volume, 2023-2033 (Billion Metric Ton, AGR (%))
Figure 115 Italy Vegetable Oil Market by Value, 2023-2033 (US$ Bn, AGR (%),)
Figure 116 Italy Vegetable Oil Market by Volume, 2023-2033 (Billion Metric Ton, AGR (%))
Figure 117 Russia Vegetable Oil Market by Value, 2023-2033 (US$ Bn, AGR (%))
Figure 118 Russia Vegetable Oil Market by Volume, 2023-2033 (Billion Metric Ton, AGR (%))
Figure 119 Rest of Europe Vegetable Oil Market by Value, 2023-2033 (US$ Bn, AGR (%))
Figure 120 Rest of Europe Vegetable Oil Market by Volume, 2023-2033 (Billion Metric Ton, AGR (%))
Figure 121 Asia-Pacific Global Vegetable Oil Market Attractiveness Index
Figure 122 Asia-Pacific Global Vegetable Oil Market by Region, 2023, 2028 & 2033 (US$ Billion)
Figure 123 Asia-Pacific Vegetable Oil Market by Value, 2023-2033 (US$ Bn, AGR (%))
Figure 124 Asia-Pacific Vegetable Oil Market by Volume, 2023-2033 (Billion Metric Ton, AGR (%))
Figure 125 Asia-Pacific Vegetable Oil Market by Country, 2023-2033 (US$ Bn, AGR (%))
Figure 126 Asia-Pacific Vegetable Oil Market Volume, by Country, 2023-2033 (Billion Metric Ton, AGR (%))
Figure 127 Asia-Pacific Global Vegetable Oil Market Share Forecast by Country, 2023 & 2033 (%)
Figure 128 Asia-Pacific Vegetable Oil Market by End-Use, 2023-2033 (US$ Bn, AGR (%))
Figure 129 Asia-Pacific Global Vegetable Oil Market Share Forecast by End-Use, 2023 & 2033 (%)
Figure 130 Asia-Pacific Vegetable Oil Market by Industrial, 2023-2033 (US$ Bn, AGR (%))
Figure 131 Asia-Pacific Global Vegetable Oil Market Share Forecast by Industrial, 2023 & 2033 (%)
Figure 132 Asia-Pacific Vegetable Oil Market by Food Industry, 2023-2033 (US$ Bn, AGR (%))
Figure 133 Asia-Pacific Global Vegetable Oil Market Share Forecast by Food Industry, 2023 & 2033 (%)
Figure 134 Asia-Pacific Vegetable Oil Market by Type, 2023-2033 (US$ Bn, AGR (%))
Figure 135 Asia-Pacific Global Vegetable Oil Market Share Forecast by Type, 2023 & 2033 (%)
Figure 136 China Vegetable Oil Market by Value, 2023-2033 (US$ Bn, AGR (%))
Figure 137 China Vegetable Oil Market by Volume, 2023-2033 (Billion Metric Ton, AGR (%))
Figure 138 India Vegetable Oil Market by Value, 2023-2033 (US$ Bn, AGR (%))
Figure 139 India Vegetable Oil Market by Volume, 2023-2033 (Billion Metric Ton, AGR (%))
Figure 140 Indonesia Vegetable Oil Market by Value, 2023-2033 (US$ Bn, AGR (%))
Figure 141 Indonesia Vegetable Oil Market by Volume, 2023-2033 (Billion Metric Ton, AGR (%))
Figure 142 Malaysia Vegetable Oil Market by Value, 2023-2033 (US$ Bn, AGR (%))
Figure 143 Malaysia Vegetable Oil Market by Volume, 2023-2033 (Billion Metric Ton, AGR (%))
Figure 144 Australia Vegetable Oil Market by Value, 2023-2033 (US$ Bn, AGR (%))
Figure 145 Australia Vegetable Oil Market by Volume, 2023-2033 (Billion Metric Ton, AGR (%))
Figure 146 Rest of Asia-Pacific Vegetable Oil Market by Value, 2023-2033 (US$ Bn, AGR (%))
Figure 147 Rest of Asia-Pacific Vegetable Oil Market by Volume, 2023-2033 (Billion Metric Ton, AGR (%))
Figure 148 Middle East & Africa Global Vegetable Oil Market Attractiveness Index
Figure 149 Middle East & Africa Global Vegetable Oil Market by Region, 2023, 2028 & 2033 (US$ Billion)
Figure 150 Middle East & Africa Vegetable Oil Market by Value, 2023-2033 (US$ Bn, AGR (%))
Figure 151 Middle East & Africa Vegetable Oil Market by Volume, 2023-2033 (Billion Metric Ton, AGR (%))
Figure 152 Middle East & Africa Vegetable Oil Market by Country, 2023-2033 (US$ Bn, AGR (%))
Figure 153 Middle East & Africa Vegetable Oil Market by Volume by Country, 2023-2033 (Billion Metric Ton, AGR (%))
Figure 154 Middle East & Africa Global Vegetable Oil Market Share Forecast by Country, 2023 & 2033 (%)
Figure 155 Middle East & Africa Vegetable Oil Market by End-Use, 2023-2033 (US$ Bn, AGR (%))
Figure 156 Middle East & Africa Global Vegetable Oil Market Share Forecast by End-Use, 2023 & 2033 (%)
Figure 157 Middle East & Africa Global Vegetable Oil Market Share Forecast by Industrial, 2023 & 2033 (%)
Figure 158 Middle East & Africa Vegetable Oil Market by Food Industry, 2023-2033 (US$ Bn, AGR (%))
Figure 159 Middle East & Africa Global Vegetable Oil Market Share Forecast by Food Industry, 2023 & 2033 (%)
Figure 160 Middle East & Africa Vegetable Oil Market by Type, 2023-2033 (US$ Bn, AGR (%))
Figure 161 Middle East & Africa Global Vegetable Oil Market Share Forecast by Type, 2023 & 2033 (%)
Figure 162 GCC Vegetable Oil Market by Value, 2023-2033 (US$ Bn, AGR (%))
Figure 163 GCC Vegetable Oil Market by Volume, 2023-2033 (Billion Metric Ton, AGR (%))
Figure 164 South Africa Vegetable Oil Market by Value, 2023-2033 (US$ Bn, AGR (%))
Figure 165 South Africa Vegetable Oil Market by Volume, 2023-2033 (Billion Metric Ton, AGR (%))
Figure 166 Rest of Middle East & Africa Vegetable Oil Market by Value, 2023-2033 (US$ Bn, AGR (%))
Figure 167 Rest of Middle East & Africa Vegetable Oil Market by Volume, 2023-2033 (Billion Metric Ton, AGR (%))
Figure 168 Latin America Global Vegetable Oil Market Attractiveness Index
Figure 169 Latin America Global Vegetable Oil Market by Region, 2023, 2028 & 2033 (US$ Billion)
Figure 170 Latin America Vegetable Oil Market by Value, 2023-2033 (US$ Bn, AGR (%))
Figure 171 Latin America Vegetable Oil Market by Volume, 2023-2033 (Billion Metric Ton, AGR (%))
Figure 172 Latin America Vegetable Oil Market by Country, 2023-2033 (US$ Bn, AGR (%))
Figure 173 Latin America Vegetable Oil Market Volume, by Country, 2023-2033 (Billion Metric Ton, AGR (%))
Figure 174 Latin America Global Vegetable Oil Market Share Forecast by Country, 2023 & 2033 (%)
Figure 175 Latin America Vegetable Oil Market by End-Use, 2023-2033 (US$ Bn, AGR (%))
Figure 176 Latin America Global Vegetable Oil Market Share Forecast by End-Use, 2023 & 2033 (%)
Figure 177 Latin America Vegetable Oil Market by Industrial, 2023-2033 (US$ Bn, AGR (%))
Figure 178 Latin America Global Vegetable Oil Market Share Forecast by Industrial, 2023 & 2033 (%)
Figure 179 Latin America Vegetable Oil Market by Food Industry, 2023-2033 (US$ Bn, AGR (%))
Figure 180 Latin America Global Vegetable Oil Market Share Forecast by Food Industry, 2023 & 2033 (%)
Figure 181 Latin America Vegetable Oil Market by Type, 2023-2033 (US$ Bn, AGR (%))
Figure 182 Latin America Global Vegetable Oil Market Share Forecast by Type, 2023 & 2033 (%)
Figure 183 Brazil Vegetable Oil Market by Value, 2023-2033 (US$ Bn, AGR (%))
Figure 184 Brazil Vegetable Oil Market by Volume, 2023-2033 (Billion Metric Ton, AGR (%))
Figure 185 Argentina Vegetable Oil Market by Value, 2023-2033 (US$ Bn, AGR (%))
Figure 186 Argentina Vegetable Oil Market by Volume, 2023-2033 (Billion Metric Ton, AGR (%))
Figure 187 Rest of Latin America Vegetable Oil Market by Value, 2023-2033 (US$ Bn, AGR (%))
Figure 188 Rest of Latin America Vegetable Oil Market by Volume, 2023-2033 (Billion Metric Ton, AGR (%))
Figure 189 Global Vegetable Oil Market: Company Share, 2022
Figure 190 Associated British Foods plc: Net Revenue, 2017-2022 (US$ Million, AGR%)
Figure 191 Associated British Foods plc: Regional Market Shares, 2022
Figure 192 Associated British Foods plc: Business Segment Market Shares, 2022
Figure 193 Bunge Ltd: Net Revenue, 2017-2022 (US$ Million, AGR%)
Figure 194 Bunge Ltd: Regional Market Shares, 2022
Figure 195 Bunge Ltd: Business Segment Market Shares, 2022
Figure 196 Mewah Group: Net Revenue, 2017-2022 (US$ Million, AGR%)
Figure 197 Mewah Group: Regional Market Shares, 2022
Figure 198 Mewah Group: Business Segment Market Shares, 2022
Figure 199 Golden Agri-Resources Ltd : Net Revenue, 2017-2022 (US$ Million, AGR%)
Figure 200 Golden Agri-Resources Ltd : Regional Market Shares, 2022
Figure 201 Golden Agri-Resources Ltd : Business Segment Market Shares, 2022
Figure 202 Ruchi Soya Industries Limited: Net Revenue, 2017-2022 (US$ Million, AGR%)
Figure 203 Ruchi Soya Industries Limited: Regional Market Shares, 2022
Figure 204 Ruchi Soya Industries Limited: Business Segment Market Shares, 2022
Figure 205 Borges Agricultural & Industrial Nuts S.A.: Net Revenue, 2017-2022 (US$ Million, AGR%)
Figure 206 Borges Agricultural & Industrial Nuts S.A.: Regional Market Shares, 2022
Figure 207 Borges Agricultural & Industrial Nuts S.A.: Business Segment Market Shares, 2022
Figure 208 Archer- Daniels Midland Company: Net Revenue, 2017-2022 (US$ Million, AGR%)
Figure 209 Archer- Daniels Midland Company: R&D, 2017-2022 (US$ Million, AGR%)
Figure 210 Archer- Daniels Midland Company: Regional Market Shares, 2022
Figure 211 Archer- Daniels Midland Company: Business Segment Market Shares, 2022
Figure 212 Wilmar International Ltd: Net Revenue, 2017-2022 (US$ Million, AGR%)
Figure 213 Wilmar International Ltd: Regional Market Shares, 2022
Figure 214 Wilmar International Ltd: Business Segment Market Shares, 2022
Figure 215 Louis Dreyfus Company: Net Revenue, 2017-2022 (US$ Million, AGR%)
Figure 216 Louis Dreyfus Company: Regional Market Shares, 2022
Figure 217 Louis Dreyfus Company: Business Segment Market Shares, 2022
Figure 218 Adani Wilmar Ltd: Net Revenue, 2017-2022 (US$ Million, AGR%)
Figure 219 Adani Wilmar Ltd: Regional Market Shares, 2022
Figure 220 Adani Wilmar Ltd: Business Segment Market Shares, 2022
ページTOPに戻る
よくあるご質問
Visiongain社はどのような調査会社ですか?
英国の調査会社ヴィジョンゲイン社(Visiongain)は、通信とエネルギーのほか、自動車や化学・医薬品、金属など、広範な市場を対象に調査を行っています。自動車市場については、市場全般に関する調査のほ... もっと見る
調査レポートの納品までの日数はどの程度ですか?
在庫のあるものは速納となりますが、平均的には 3-4日と見て下さい。
但し、一部の調査レポートでは、発注を受けた段階で内容更新をして納品をする場合もあります。
発注をする前のお問合せをお願いします。
注文の手続きはどのようになっていますか?
1)お客様からの御問い合わせをいただきます。
2)見積書やサンプルの提示をいたします。
3)お客様指定、もしくは弊社の発注書をメール添付にて発送してください。
4)データリソース社からレポート発行元の調査会社へ納品手配します。
5) 調査会社からお客様へ納品されます。最近は、pdfにてのメール納品が大半です。
お支払方法の方法はどのようになっていますか?
納品と同時にデータリソース社よりお客様へ請求書(必要に応じて納品書も)を発送いたします。
お客様よりデータリソース社へ(通常は円払い)の御振り込みをお願いします。
請求書は、納品日の日付で発行しますので、翌月最終営業日までの当社指定口座への振込みをお願いします。振込み手数料は御社負担にてお願いします。
お客様の御支払い条件が60日以上の場合は御相談ください。
尚、初めてのお取引先や個人の場合、前払いをお願いすることもあります。ご了承のほど、お願いします。
データリソース社はどのような会社ですか?
当社は、世界各国の主要調査会社・レポート出版社と提携し、世界各国の市場調査レポートや技術動向レポートなどを日本国内の企業・公官庁及び教育研究機関に提供しております。
世界各国の「市場・技術・法規制などの」実情を調査・収集される時には、データリソース社にご相談ください。
お客様の御要望にあったデータや情報を抽出する為のレポート紹介や調査のアドバイスも致します。
|
|


