垂直農法市場レポート:2023-2033
Vertical Farming Market Report 2023-2033
レポート詳細
垂直農法市場レポート 2023-2033年 :本レポートは、業界とその基礎となる原動力をよりよく理解することを望むなら、新たな収益ポケットを目指す大手企業にとって非常に貴重なものとな... もっと見る
※上記価格は部署ライセンス(Departmental licence)価格です。
その他の価格についてはデータリソースまでお問合せください。
日本語のページは自動翻訳を利用し作成しています。
実際のレポートは英文のみでご納品いたします。
サマリー
レポート詳細
垂直農法市場レポート 2023-2033年:本レポートは、業界とその基礎となる原動力をよりよく理解することを望むなら、新たな収益ポケットを目指す大手企業にとって非常に貴重なものとなるでしょう。異業種への進出や新規地域での既存事業の拡大を目指す企業にも有用です。
地元産の新鮮な農産物への需要の高まり
地元産の新鮮な農産物に対する消費者の嗜好の高まりが、垂直農法市場の重要な推進力となっている。食品の長距離輸送に伴う環境と健康への懸念に対する認識が高まるにつれ、消費者は持続可能な代替手段を求めるようになっている。都市部や消費拠点の近くで作物を栽培できる垂直農法は、より新鮮で栄養価の高い農産物の供給を可能にし、輸入品への依存を減らして「農場から食卓へ」というコンセプトを支える。
食糧安全保障に対する懸念の高まりが市場成長を牽引
世界人口の増加が続く中、食糧安全保障の確保は緊急の課題となっている。垂直農法は、天候や気候変動のような外的要因に影響されない、作物栽培のための制御された環境を提供することで、実行可能な解決策を提供する。限られたスペースで高収量を生み出すその能力は、特に食糧不足に陥りやすい地域において、従来の農業を補い食糧生産を強化する魅力的な選択肢となっている。
市場調査レポートを購入する前にすべき質問とは?
- 垂直農法市場はどのように進化しているのか?
- 何が垂直農法市場を促進し、抑制しているのか?
- 垂直農法サブマーケットの各セグメントは予測期間中にどのように成長し、2033年にどれくらいの収益を占めるのか?
- 2023年から2033年にかけて、各縦型農業サブマーケットの市場シェアはどのように推移するのか?
- 2023年から2033年にかけて市場全体の主な牽引役は何か?
- 主要な垂直農法市場はマクロ経済力学に概ね追随するのか、それとも個々の国内市場が他を凌駕するのか。
- 2033年までに各国市場のシェアはどう変化し、2033年に市場をリードするのはどの地域か?
- 主要プレーヤーは誰で、予測期間中の見通しは?
- これらの大手企業の垂直農法プロジェクトとは?
- 2023年から2033年の間に、産業はどのように発展するのか?現在および今後10年間に行われる垂直農法プロジェクトにはどのような意味があるのか?
- 垂直農法市場をさらに拡大するために、製品の商業化の必要性は高まっているのか?
- 垂直農法市場はどこへ向かい、どのようにすれば市場の最前線に立てるのか?
- 新製品やサービスラインに対する最良の投資オプションは何か?
- 企業を新たな成長軌道に乗せ、C-suiteに移行させるための重要な展望とは?
このことが垂直農法市場に現在、そして今後10年間でどのような影響を与えるかを見極める必要がある:
- 343ページにわたる本レポートでは、129の表と160の図表を掲載しています。
- 本レポートは、業界における主要な有利分野にハイライトを当てているため、今すぐターゲットを絞ることができます。
- 本レポートには、世界、地域、国の売上と成長に関する詳細な分析が含まれています。
- 競合他社が成功した主なトレンド、変化、収益予測をハイライトしています。
本レポートは、垂直農法市場が今後10年間にどのように発展するか、またCOVID-19の景気後退と好転の変動に合わせてどのように発展するかをお伝えします。この市場は、過去10年間のどの時点よりも今が重要です。
2033年までの予測やその他の分析から、商業的な展望が明らかになる
- 2033年までの収益予測に加え、直近の業績、成長率、市場シェアもご覧いただけます。
- ビジネスの展望と展開に関する独自の分析をご覧いただけます。
- 定性的分析(市場力学、促進要因、機会、阻害要因、課題を含む)、コスト構造、垂直農法価格上昇の影響、最近の動向をご覧いただけます。
本レポートには、COVID-19が業界と貴社にどのような影響を与えるかについてのデータ分析と貴重な洞察が含まれている。本レポートでは、COVID-19の4つの回収パターンとその影響、すなわち「V」、「L」、「W」、「U」について論じている。
レポート対象セグメント
コンポーネント別市場セグメント
- ハードウェア
- ソフトウェア
- サービス
タイプ別市場セグメント
- 超高層ビル
- 複合用途高層ビル
- 積み重ね可能な輸送用コンテナ
- その他のタイプ
サービス別市場セグメント
- システム設置・統合
- コンサルティング・サービス
- マネージドサービス
- プロフェッショナルサービス
- その他サービス
ハードウェア別市場セグメント
- 照明
- 水耕栽培コンポーネント
- 気候制御
- センサー
- 灌漑システム
- その他ハードウェア
世界市場全体とセグメント別の収益予測に加え、4つの地域と20の主要国市場の収益予測も掲載しています:
北米
- アメリカ
- カナダ
欧州
- ドイツ
- ロシア
- イギリス
- フランス
- イタリア
- その他の欧州
アジア太平洋
- 中国
- 日本
- インド
- オーストラリア
- 韓国
- その他のアジア太平洋地域
ラテンアメリカ
- ブラジル
- メキシコ
- その他のラテンアメリカ
中東・アフリカ
- GCC
- 南アフリカ
- その他の中東・アフリカ
このレポートには、2023 年から 2033 年の垂直農業市場におけるいくつかの主要企業のプロフィールも含まれており、これらの企業の事業分野に焦点を当てています。
報告書に掲載されている主要企業
・ AeroFarms
・ Bowery Farming
・ BrightFarms
・ Farm.One
・ Freight Farms
・ Gotham Greens
・ Infarm
・ OSRAM Licht AG
・ Plenty
・ Signify Holding B.V
・ Sky Greens
・ SPREAD Co Ltd
・ Urban Crop Solutions
・ Valoya
・ Vertical Harvest
2023年から2033年までの世界の垂直農法市場全体の売上高(金額ベース)は、2023年に61億米ドルを突破する。2033年まで力強い収益成長を予測。当社の調査では、最大の可能性を秘めた組織を特定している。彼らの能力、進歩、商業的展望を発見し、一歩先を行くお手伝いをします。
垂直農法市場、2023年から2033年までのレポートはどのように役立ちますか?
要約すると、340ページを超えるこのレポートは、以下のような知識を提供する:
- 垂直農法市場の2023年から2033年までの収益予測 コンポーネント、タイプ、サービス、ハードウェアの各予測を世界および地域レベルで掲載 - 業界の将来性を発見し、投資と収益に最も有利な場所を見つけます。
- 4つの地域と20の主要国市場の2033年までの収益予測 - 垂直農法市場の2023年から2033年までの北米、ヨーロッパ、アジア太平洋、ラテンアメリカ、中東・アフリカの市場予測をご覧ください。また、米国、カナダ、ブラジル、ドイツ、フランス、英国、イタリア、中国、インド、日本、オーストラリアなどの著名経済圏の市場も予測しています。
- 既存企業および市場参入を目指す企業の展望-垂直農法市場に関わる主要企業15社の会社概要を含む、2023年から2033年までの展望。
独自の予測による定量的・定性的分析をご覧ください。私たちのレポートだけに含まれる情報を入手し、貴重なビジネスインテリジェンスで情報を得ることができます。
他にはない情報
私たちの新しいレポートがあれば、知識に遅れをとったり、チャンスを逃したりする可能性が低くなります。弊社の調査レポートが貴社の調査、分析、意思決定にどのように役立つかをご覧ください。Visiongainの調査は、垂直農法市場、2023年から2033年、市場をリードする企業の商業分析を必要とするすべての人のためのものです。データ、トレンド、予測をご覧いただけます。
ページTOPに戻る
目次
目次
1 レポート概要
1.1 研究の目的
1.2 垂直農法市場の紹介
1.3 本レポートの内容
1.4 本レポートを読むべき理由
1.5 本分析レポートが回答する主な質問
1.6 本レポートは誰のためのものか?
1.7 調査方法
1.7.1 市場の定義
1.7.1.1 コンポーネント
1.7.1.2 タイプ
1.7.1.3 サービス
1.7.1.4 ハードウェア
1.7.2 市場評価・予測手法
1.7.3 データ検証
1.7.3.1 一次調査
1.7.3.2 セカンダリーリサーチ
1.8 よくある質問(FAQ)
1.9 Visiongainの関連レポート
1.10 Visiongainについて
2 エグゼクティブ・サマリー
2.1 セグメント分析
2.1.1 コンポーネントセグメント市場魅力度指数
2.1.2 タイプ別セグメント市場魅力度指数
2.1.3 サービスセグメント市場魅力度指数
2.1.4 ハードウェアセグメント市場魅力度指数
2.2 地域別分析
3 市場概要
3.1 主要な調査結果
3.2 市場ダイナミクス
3.2.1 市場促進要因
3.2.1.1 人口増加と都市化
3.2.1.2 持続可能で効率的な食品生産へのニーズ
3.2.1.3 地元産食品に対する消費者需要の高まり
3.2.2 市場抑制要因
3.2.2.1 初期投資コストの高さ
3.2.2.2 エネルギー消費と操業コスト
3.2.2.3 限られた作物の種類と拡張性
3.2.3 市場機会
3.2.3.1 技術の進歩と自動化
3.2.3.2 商業ビルや住宅での垂直農法
3.2.3.3 小売業者や食品サービス業者とのコラボレーション
3.3 COVID-19の影響分析
3.3.1 V字型回復
3.3.2 W字型回復
3.3.3 U字型回復
3.3.4 L字型回復
3.4 ポーターのファイブフォース分析
3.4.1 サプライヤーの交渉力(低)
3.4.2 買い手の交渉力(中)
3.4.3 競争力(高)
3.4.4 代替品による脅威(低)
3.4.5 新規参入企業の脅威(中)
3.5 PEST分析
3.5.1 政治的要因
3.5.2 経済的要因
3.5.3 社会的要因
3.5.4 技術的要因
4 垂直農業市場分析:コンポーネント別
4.1 主要な調査結果
4.2 構成要素セグメント 市場魅力度指数
4.3 コンポーネント別垂直農法市場規模の推定と予測
4.4 ハードウェア市場
4.4.1 2023~2033年の地域別市場規模(US$ Billion)
4.4.2 地域別市場シェア、2023年・2033年
4.5 ソフトウェア市場
4.5.1 2023〜2033年の地域別市場規模(US$ Billion)
4.5.2 地域別市場シェア、2023年および2033年(%)
4.6 サービス市場
4.6.1 2023〜2033年の地域別市場規模(US$ Billion)
4.6.2 地域別市場シェア、2023年・2033年(%)
5 垂直農法市場分析:タイプ別
5.1 主要調査結果
5.2 タイプ別セグメント 市場魅力度指数
5.3 タイプ別垂直農法市場規模の推定と予測
5.4 超高層ビル市場
5.4.1 2023~2033年の地域別市場規模(US$ Billion)
5.4.2 地域別市場シェア、2023年・2033年
5.5 複合用途超高層ビル市場
5.5.1 2023~2033年の地域別市場規模(US$ Billion)
5.5.2 地域別市場シェア、2023年・2033年(%)
5.6 積み重ね可能な輸送用コンテナ市場
5.6.1 2023~2033年の地域別市場規模(US$ Billion)
5.6.2 地域別市場シェア、2023年・2033年(%)
5.7 その他タイプ市場
5.7.1 2023~2033年の地域別市場規模(US$ Billion)
5.7.2 地域別市場シェア、2023年・2033年(%)
6 垂直農業市場分析:サービス別
6.1 主要調査結果
6.2 サービスセグメント 市場魅力度指数
6.3 サービス別垂直農法市場規模の推定と予測
6.4 システム設置・統合市場
6.4.1 2023〜2033年の地域別市場規模(US$ Billion)
6.4.2 地域別市場シェア(2023年・2033年)
6.5 コンサルティングサービス市場
6.5.1 2023〜2033年の地域別市場規模(US$ Billion)
6.5.2 2023年および2033年の地域別市場シェア(%)
6.6 マネージドサービス市場
6.6.1 2023〜2033年の地域別市場規模(US$ Billion)
6.6.2 2023年および2033年の地域別市場シェア(%)
6.7 アシスト型プロフェッショナルサービス市場
6.7.1 2023~2033年の地域別市場規模(US$ Billion)
6.7.2 2023年および2033年の地域別市場シェア(%)
6.8 その他サービス市場
6.8.1 2023〜2033年の地域別市場規模(US$ Billion)
6.8.2 地域別市場シェア、2023年・2033年(%)
7 垂直農業市場分析:ハードウェア別
7.1 主要な調査結果
7.2 ハードウェア・セグメント 市場魅力度指数
7.3 垂直農法のハードウェア別市場規模推定と予測
7.4 照明市場
7.4.1 2023〜2033年の地域別市場規模(US$ Billion)
7.4.2 地域別市場シェア(2023年・2033年)
7.5 水耕栽培用部品市場
7.5.1 2023〜2033年の地域別市場規模(US$ Billion)
7.5.2 地域別市場シェア、2023年・2033年(%)
7.6 気候制御市場
7.6.1 2023〜2033年の地域別市場規模(US$ Billion)
7.6.2 2023年および2033年の地域別市場シェア(%)
7.7 センサー市場
7.7.1 2023〜2033年の地域別市場規模(US$ Billion)
7.7.2 2023年および2033年の地域別市場シェア(%)
7.8 灌漑システム市場
7.8.1 2023〜2033年の地域別市場規模(US$ Billion)
7.8.2 地域別市場シェア、2023年・2033年(%)
7.9 その他のハードウェア市場
7.9.1 2023〜2033年の地域別市場規模(US$ Billion)
7.9.2 地域別市場シェア、2023年・2033年(%)
8 垂直農法市場分析:地域別
8.1 主要な調査結果
8.2 地域別市場規模の推定と予測
9 北米の垂直農法市場分析
9.1 主要な調査結果
9.2 北米の垂直農法市場魅力度指数
9.3 北米の垂直農法市場の国別市場規模、2023年、2028年、2033年(US$ Billion)
9.4 北米の垂直農法市場規模推定と予測:金額ベース
9.5 北米の垂直農法市場規模推定と予測:国別
9.6 北米の垂直農法市場規模推定と予測:コンポーネント別
9.7 北米の垂直農法市場規模推定と予測:タイプ別
9.8 北米の垂直農法市場規模推定と予測:サービス別
9.9 北米垂直農法の市場規模推定と予測:ハードウェア別
9.10 アメリカの垂直農法市場分析
9.11 カナダの垂直農法の市場分析
10 欧州の垂直農法市場分析
10.1 主要な調査結果
10.2 欧州垂直農法市場魅力度指数
10.3 欧州の垂直農法市場の国別市場規模、2023年、2028年、2033年(US$ Billion)
10.4 欧州の垂直農法市場規模推定と予測:金額ベース
10.5 欧州の垂直農法市場規模推定と予測:国別
10.6 欧州の垂直農法市場規模推定と予測:コンポーネント別
10.7 欧州の垂直農法市場規模推定と予測:タイプ別
10.8 欧州の垂直農法市場規模推定と予測:サービス別
10.9 欧州の垂直農法市場規模推定と予測:ハードウェア別
10.10 ドイツの垂直農法市場分析
10.11 イギリスの垂直農法市場分析
10.12 フランスの垂直農法の市場分析
10.13 イタリアの垂直農法の市場分析
10.14 ロシアの垂直農法の市場分析
10.15 その他の欧州の垂直農法の市場分析
11 アジア太平洋の垂直農法市場分析
11.1 主要な調査結果
11.2 アジア太平洋地域の垂直農法市場魅力度指数
11.3 アジア太平洋地域の垂直農法市場の国別市場規模、2023年、2028年、2033年(US$ Billion)
11.4 アジア太平洋地域の垂直農法市場規模推定と予測:金額ベース
11.5 アジア太平洋地域の垂直農法市場規模推定と予測:国別
11.6 アジア太平洋地域の垂直農法市場規模推定と予測:コンポーネント別
11.7 アジア太平洋地域の垂直農法市場規模推定と予測:タイプ別
11.8 アジア太平洋地域の垂直農法市場規模推定と予測:サービス別
11.9 アジア太平洋地域の垂直農法市場規模推定と予測:ハードウェア別
11.10 中国の垂直農法市場分析
11.11 インド垂直農法の市場分析
11.12 日本の垂直農法の市場分析
11.13 韓国の垂直農法の市場分析
11.14 オーストラリアの垂直農法市場の分析
11.15 その他のアジア太平洋地域の垂直農法市場分析
12 中東・アフリカ垂直農法市場分析
12.1 主要な調査結果
12.2 中東・アフリカ垂直農法市場魅力度指数
12.3 中東・アフリカ垂直農法市場の国別市場規模、2023年、2028年、2033年(US$ Billion)
12.4 中東・アフリカ垂直農法市場規模推定と予測:金額ベース
12.5 中東・アフリカ垂直農法市場規模推定と予測:国別
12.6 中東・アフリカ垂直農法市場規模推定と予測:コンポーネント別
12.7 中東・アフリカ垂直農法市場規模推定と予測:タイプ別
12.8 中東・アフリカ垂直農法市場規模推定と予測:サービス別
12.9 中東・アフリカ垂直農法市場規模推定と予測:ハードウェア別
12.10 GCCの垂直農法市場分析
12.11 南アフリカの垂直農法の市場分析
12.12 その他の中東・アフリカ垂直農法の市場分析
13 ラテンアメリカ垂直農法市場分析
13.1 主要な調査結果
13.2 ラテンアメリカ垂直農法市場魅力度指数
13.3 ラテンアメリカの垂直農法市場の国別市場規模、2023年、2028年、2033年(US$ Billion)
13.4 ラテンアメリカの垂直農法市場規模推定と予測:金額ベース
13.5 ラテンアメリカの垂直農法市場規模推定と予測:国別
13.6 ラテンアメリカの垂直農法市場規模推定と予測:コンポーネント別
13.7 ラテンアメリカの垂直農法市場規模推定と予測:タイプ別
13.8 ラテンアメリカの垂直農法市場規模推定と予測:サービス別
13.9 ラテンアメリカの垂直農法市場規模推定と予測:ハードウェア別
13.10 ブラジルの垂直農法市場分析
13.11 メキシコの垂直農法市場分析
13.12 その他のラテンアメリカの垂直農法市場分析
14 主要企業のプロファイル
14.1 競争環境、2022年
14.2 戦略的展望
14.3 Signify Holding B.V
14.3.1 会社概要
14.3.2 会社概要
14.3.3 財務分析
14.3.3.1 純収入、2018-2022年
14.3.3.2 R&D、2018-2022年
14.3.3.3 地域別収益シェア、2022年(%)
14.3.3.4 事業セグメント収益シェア、2022年(%)
14.3.4 製品ベンチマーク
14.3.5 戦略的展望
14.4 Freight Farms
14.4.1 会社概要
14.4.2 会社概要
14.4.3 製品ベンチマーク
14.4.4 戦略的展望
14.5 AeroFarms
14.5.1 会社概要
14.5.2 会社概要
14.5.3 製品ベンチマーク
14.6 Sky Greens
14.6.1 会社概要
14.6.2 会社概要
14.6.3 製品ベンチマーク
14.7 Plenty
14.7.1 会社概要
14.7.2 会社概要
14.7.3 製品ベンチマーク
14.7.4 戦略的展望
14.8 SPREAD Co Ltd
14.8.1 会社概要
14.8.2 会社概要
14.8.3 製品ベンチマーク
14.8.4 戦略的展望
14.9 Valoya
14.9.1 会社概要
14.9.2 会社概要
14.9.3 製品ベンチマーク
14.9.4 戦略的展望
14.10 OSRAM Licht AG
14.10.1 会社概要
14.10.2 会社概要
14.10.3 製品ベンチマーク
14.10.4 戦略的展望
14.11 Bowery Farming
14.11.1 会社概要
14.11.2 会社概要
14.11.3 製品ベンチマーク
14.11.4 戦略的展望
14.12 BrightFarms
14.12.1 会社概要
14.12.2 会社概要
14.12.3 製品ベンチマーク
14.13 Infarm
14.13.1 会社概要
14.13.2 会社概要
14.13.3 製品ベンチマーク
14.13.4 戦略的展望
14.14 Gotham Greens
14.14.1 会社概要
14.14.2 会社概要
14.14.3 製品ベンチマーク
14.15 Vertical Harvest
14.15.1 会社概要
14.15.2 会社概要
14.15.3 製品ベンチマーク
14.15.4 戦略的展望
14.16 Urban Crop Solutions
14.16.1 会社概要
14.16.2 会社概要
14.16.3 製品ベンチマーク
14.16.4 戦略的展望
14.17 Farm.One
14.17.1 会社概要
14.17.2 会社概要
14.17.3 製品ベンチマーク
14.17.4 戦略的展望
15 結論と提言
15.1 Visiongainからの結びの言葉
15.2 市場プレイヤーへの提言
ページTOPに戻る
図表リスト
表の一覧
Table 1 Vertical Farming Market Snapshot, 2023 & 2033 (US$ Billion, CAGR %)
Table 2 Global Vertical Farming Market Forecast, 2023-2033 (US$ Bn, AGR (%), CAGR (%)) (V-Shaped Recovery Scenario)
Table 3 Global Vertical Farming Market by Region, 2023-2033 (US$ Bn, AGR (%), CAGR (%)) (V-Shaped Recovery Scenario)
Table 4 Global Vertical Farming Market Forecast, 2023-2033 (US$ Bn, AGR (%), CAGR (%)) (W-Shaped Recovery Scenario)
Table 5 Global Vertical Farming Market by Region, 2023-2033 (US$ Bn, AGR (%), CAGR (%)) (W-Shaped Recovery Scenario)
Table 6 Global Vertical Farming Market Forecast, 2023-2033 (US$ Bn, AGR (%), CAGR (%)) (U-Shaped Recovery Scenario)
Table 7 Global Vertical Farming Market by Region, 2023-2033 (US$ Bn, AGR (%), CAGR (%)) (U-Shaped Recovery Scenario)
Table 8 Global Vertical Farming Market Forecast, 2023-2033 (US$ Bn, AGR (%), CAGR (%)) (L-Shaped Recovery Scenario)
Table 9 Global Vertical Farming Market by Region, 2023-2033 (US$ Bn, AGR (%), CAGR (%)) (L-Shaped Recovery Scenario)
Table 10 Global Vertical Farming Market by Component, 2023-2033 (US$ Bn, AGR (%), CAGR (%))
Table 11 Hardware Market by Region, 2023-2033 (US$ Bn, AGR (%), CAGR (%))
Table 12 Software Market by Region, 2023-2033 (US$ Bn, AGR (%), CAGR (%))
Table 13 Services Market by Region, 2023-2033 (US$ Bn, AGR (%), CAGR (%))
Table 14 Global Vertical Farming Market by Type, 2023-2033 (US$ Bn, AGR (%), CAGR (%))
Table 15 Despommier Skyscrapers Market by Region, 2023-2033 (US$ Bn, AGR (%), CAGR (%))
Table 16 Mixed Use Skyscrapers Market by Region, 2023-2033 (US$ Bn, AGR (%), CAGR (%))
Table 17 Stackable Shipping Containers Market by Region, 2023-2033 (US$ Bn, AGR (%), CAGR (%))
Table 18 Other Type Market by Region, 2023-2033 (US$ Bn, AGR (%), CAGR (%))
Table 19 Global Vertical Farming Market by Services, 2023-2033 (US$ Bn, AGR (%), CAGR (%))
Table 20 System Installation & Integration Market by Region, 2023-2033 (US$ Bn, AGR (%), CAGR (%))
Table 21 Consulting Services Market by Region, 2023-2033 (US$ Bn, AGR (%), CAGR (%))
Table 22 Managed Services Market by Region, 2023-2033 (US$ Bn, AGR (%), CAGR (%))
Table 23 Assisted Professional Services Market by Region, 2023-2033 (US$ Bn, AGR (%), CAGR (%))
Table 24 Other Services Market by Region, 2023-2033 (US$ Bn, AGR (%), CAGR (%))
Table 25 Global Vertical Farming Market by Hardware, 2023-2033 (US$ Bn, AGR (%), CAGR (%))
Table 26 Lighting Market by Region, 2023-2033 (US$ Bn, AGR (%), CAGR (%))
Table 27 Hydroponic Components Market by Region, 2023-2033 (US$ Bn, AGR (%), CAGR (%))
Table 28 Climate Control Market by Region, 2023-2033 (US$ Bn, AGR (%), CAGR (%))
Table 29 Sensors Market by Region, 2023-2033 (US$ Bn, AGR (%), CAGR (%))
Table 30 Irrigation Systems Market by Region, 2023-2033 (US$ Bn, AGR (%), CAGR (%))
Table 31 Other Hardware Market by Region, 2023-2033 (US$ Bn, AGR (%), CAGR (%))
Table 32 Global Vertical Farming Market Forecast, 2023-2033 (US$ Bn, AGR (%), CAGR (%))
Table 33 Global Vertical Farming Market by Region, 2023-2033 (US$ Bn, AGR (%), CAGR (%))
Table 34 Global Vertical Farming Market by Component, 2023-2033 (US$ Bn, AGR (%), CAGR (%))
Table 35 Global Vertical Farming Market by Type, 2023-2033 (US$ Bn, AGR (%), CAGR (%))
Table 36 Global Vertical Farming Market by Services, 2023-2033 (US$ Bn, AGR (%), CAGR (%))
Table 37 Global Vertical Farming Market by Hardware, 2023-2033 (US$ Bn, AGR (%), CAGR (%))
Table 38 North America Vertical Farming Market by Value, 2023-2033 (US$ Bn, AGR (%), CAGR (%))
Table 39 North America Vertical Farming Market by Country, 2023-2033 (US$ Bn, AGR (%), CAGR (%))
Table 40 North America Vertical Farming Market by Component, 2023-2033 (US$ Bn, AGR (%), CAGR (%))
Table 41 North America Vertical Farming Market by Type, 2023-2033 (US$ Bn, AGR (%), CAGR (%))
Table 42 North America Vertical Farming Market by Services, 2023-2033 (US$ Bn, AGR (%), CAGR (%))
Table 43 North America Vertical Farming Market by Hardware, 2023-2033 (US$ Bn, AGR (%), CAGR (%))
Table 44 US Vertical Farming Market by Value, 2023-2033 (US$ Bn, AGR (%), CAGR (%))
Table 45 Canada Vertical Farming Market by Value, 2023-2033 (US$ Bn, AGR (%), CAGR (%))
Table 46 Europe Vertical Farming Market by Value, 2023-2033 (US$ Bn, AGR (%), CAGR (%))
Table 47 Europe Vertical Farming Market by Country, 2023-2033 (US$ Bn, AGR (%), CAGR (%))
Table 48 Europe Vertical Farming Market by Component, 2023-2033 (US$ Bn, AGR (%), CAGR (%))
Table 49 Europe Vertical Farming Market by Type, 2023-2033 (US$ Bn, AGR (%), CAGR (%))
Table 50 Europe Vertical Farming Market by Services, 2023-2033 (US$ Bn, AGR (%), CAGR (%))
Table 51 Europe Vertical Farming Market by Hardware, 2023-2033 (US$ Bn, AGR (%), CAGR (%))
Table 52 Germany Vertical Farming Market by Value, 2023-2033 (US$ Bn, AGR (%), CAGR (%))
Table 53 UK Vertical Farming Market by Value, 2023-2033 (US$ Bn, AGR (%), CAGR (%))
Table 54 France Vertical Farming Market by Value, 2023-2033 (US$ Bn, AGR (%), CAGR (%))
Table 55 Italy Vertical Farming Market by Value, 2023-2033 (US$ Bn, AGR (%), CAGR (%))
Table 56 Russia Vertical Farming Market by Value, 2023-2033 (US$ Bn, AGR (%), CAGR (%))
Table 57 Rest of Europe Vertical Farming Market by Value, 2023-2033 (US$ Bn, AGR (%), CAGR (%))
Table 58 Asia-Pacific Vertical Farming Market by Value, 2023-2033 (US$ Bn, AGR (%), CAGR (%))
Table 59 Asia-Pacific Vertical Farming Market by Country, 2023-2033 (US$ Bn, AGR (%), CAGR (%))
Table 60 Asia-Pacific Vertical Farming Market by Component, 2023-2033 (US$ Bn, AGR (%), CAGR (%))
Table 61 Asia-Pacific Vertical Farming Market by Type, 2023-2033 (US$ Bn, AGR (%), CAGR (%))
Table 62 Asia-Pacific Vertical Farming Market by Services, 2023-2033 (US$ Bn, AGR (%), CAGR (%))
Table 63 Asia-Pacific Vertical Farming Market by Hardware, 2023-2033 (US$ Bn, AGR (%), CAGR (%))
Table 64 China Vertical Farming Market by Value, 2023-2033 (US$ Bn, AGR (%), CAGR (%))
Table 65 India Vertical Farming Market by Value, 2023-2033 (US$ Bn, AGR (%), CAGR (%))
Table 66 Japan Vertical Farming Market by Value, 2023-2033 (US$ Bn, AGR (%), CAGR (%))
Table 67 South Korea Vertical Farming Market by Value, 2023-2033 (US$ Bn, AGR (%), CAGR (%))
Table 68 Australia Vertical Farming Market by Value, 2023-2033 (US$ Bn, AGR (%), CAGR (%))
Table 69 Rest of Asia-Pacific Vertical Farming Market by Value, 2023-2033 (US$ Bn, AGR (%), CAGR (%))
Table 70 Middle East & Africa Vertical Farming Market by Value, 2023-2033 (US$ Bn, AGR (%), CAGR (%))
Table 71 Middle East & Africa Vertical Farming Market by Country, 2023-2033 (US$ Bn, AGR (%), CAGR (%))
Table 72 Middle East & Africa Vertical Farming Market by Component, 2023-2033 (US$ Bn, AGR (%), CAGR (%))
Table 73 Middle East & Africa Vertical Farming Market by Type, 2023-2033 (US$ Bn, AGR (%), CAGR (%))
Table 74 Middle East & Africa Vertical Farming Market by Services, 2023-2033 (US$ Bn, AGR (%), CAGR (%))
Table 75 Middle East & Africa Vertical Farming Market by Hardware, 2023-2033 (US$ Bn, AGR (%), CAGR (%))
Table 76 GCC Vertical Farming Market by Value, 2023-2033 (US$ Bn, AGR (%), CAGR (%))
Table 77 South Africa Vertical Farming Market by Value, 2023-2033 (US$ Bn, AGR (%), CAGR (%))
Table 78 Rest of Middle East & Africa Vertical Farming Market by Value, 2023-2033 (US$ Bn, AGR (%), CAGR (%))
Table 79 Latin America Vertical Farming Market by Value, 2023-2033 (US$ Bn, AGR (%), CAGR (%))
Table 80 Latin America Vertical Farming Market by Country, 2023-2033 (US$ Bn, AGR (%), CAGR (%))
Table 81 Latin America Vertical Farming Market by Component, 2023-2033 (US$ Bn, AGR (%), CAGR (%))
Table 82 Latin America Vertical Farming Market by Type, 2023-2033 (US$ Bn, AGR (%), CAGR (%))
Table 83 Latin America Vertical Farming Market by Services, 2023-2033 (US$ Bn, AGR (%), CAGR (%))
Table 84 Latin America Vertical Farming Market by Hardware, 2023-2033 (US$ Bn, AGR (%), CAGR (%))
Table 85 Brazil Vertical Farming Market by Value, 2023-2033 (US$ Bn, AGR (%), CAGR (%))
Table 86 Mexico Vertical Farming Market by Value, 2023-2033 (US$ Bn, AGR (%), CAGR (%))
Table 87 Rest of Latin America Vertical Farming Market by Value, 2023-2033 (US$ Bn, AGR (%), CAGR (%))
Table 88 Strategic Outlook
Table 89 Signify Holding B.V Key Details, (CEO, HQ, Revenue, Founded, No. of Employees, Company Type, Website, Business Segment)
Table 90 Signify Holding B.V: Product Benchmarking
Table 91 Signify Holding B.V: Strategic Outlook
Table 92 Freight Farms Key Details, (CEO, HQ, Revenue, Founded, No. of Employees, Company Type, Website, Business Segment)
Table 93 Freight Farms: Product Benchmarking
Table 94 Freight Farms: Strategic Outlook
Table 95 AeroFarms Key Details, (CEO, HQ, Revenue, Founded, No. of Employees, Company Type, Website, Business Segment)
Table 96 AeroFarms: Product Benchmarking
Table 97 Sky GreensKey Details, (CEO, HQ, Revenue, Founded, No. of Employees, Company Type, Website, Business Segment)
Table 98 Sky Greens: Product Benchmarking
Table 99 Plenty Key Details, (CEO, HQ, Revenue, Founded, No. of Employees, Company Type, Website, Business Segment)
Table 100 Plenty: Product Benchmarking
Table 101 Plenty: Strategic Outlook
Table 102 SPREAD Co Ltd Key Details, (CEO, HQ, Revenue, Founded, No. of Employees, Company Type, Website, Business Segment)
Table 103 SPREAD Co Ltd: Product Benchmarking
Table 104 SPREAD Co Ltd: Strategic Outlook
Table 105 Valoya Key Details, (CEO, HQ, Revenue, Founded, No. of Employees, Company Type, Website, Business Segment)
Table 106 Valoya: Product Benchmarking
Table 107 Valoya: Strategic Outlook
Table 108 OSRAM Licht AG Key Details, (CEO, HQ, Revenue, Founded, No. of Employees, Company Type, Website, Business Segment)
Table 109 OSRAM Licht AG: Product Benchmarking
Table 110 OSRAM Licht AG: Strategic Outlook
Table 111 Bowery FarmingKey Details, (CEO, HQ, Revenue, Founded, No. of Employees, Company Type, Website, Business Segment)
Table 112 Bowery Farming: Product Benchmarking
Table 113 Bowery Farming: Strategic Outlook
Table 114 BrightFarms Key Details, (CEO, HQ, Revenue, Founded, No. of Employees, Company Type, Website, Business Segment)
Table 115 Bright farms: Product Benchmarking
Table 116 Infarm Key Details, (CEO, HQ, Revenue, Founded, No. of Employees, Company Type, Website, Business Segment)
Table 117 Infarm: Product Benchmarking
Table 118 Infarm: Strategic Outlook
Table 119 Gotham Greens Key Details, (CEO, HQ, Revenue, Founded, No. of Employees, Company Type, Website, Business Segment)
Table 120 Gotham Greens: Product Benchmarking
Table 121 Vertical Harvest Key Details, (CEO, HQ, Revenue, Founded, No. of Employees, Company Type, Website, Business Segment)
Table 122 Vertical Harvest: Product Benchmarking
Table 123 Vertical Harvest: Strategic Outlook
Table 124 Urban Crop Solutions Key Details, (CEO, HQ, Revenue, Founded, No. of Employees, Company Type, Website, Business Segment)
Table 125 Urban Crop Solutions: Product Benchmarking
Table 126 Urban Crop Solutions: Strategic Outlook
Table 127 Farm.One Key Details, (CEO, HQ, Revenue, Founded, No. of Employees, Company Type, Website, Business Segment)
Table 128 Farm.One: Product Benchmarking
Table 129 Farm One: Strategic Outlook
図の一覧
Figure 1 Vertical Farming Market Segmentation
Figure 2 Vertical Farming Market by Component: Market Attractiveness Index
Figure 3 Vertical Farming Market by Type: Market Attractiveness Index
Figure 4 Vertical Farming Market by Services: Market Attractiveness Index
Figure 5 Vertical Farming Market by Hardware: Market Attractiveness Index
Figure 6 Vertical Farming Market Attractiveness Index by Region
Figure 7 Vertical Farming Market: Market Dynamics
Figure 8 Global Vertical Farming Market Share Forecast by COVID, 2023-2033 (%)
Figure 9 Global Vertical Farming Market Forecast, 2023-2033 (US$ Bn, AGR (%)) (V-Shaped Recovery Scenario)
Figure 10 Global Vertical Farming Market by Region, 2023-2033 (US$ Bn, AGR (%)) (V-Shaped Recovery Scenario)
Figure 11 Global Vertical Farming Market Forecast, 2023-2033 (US$ Bn, AGR (%)) (W-Shaped Recovery Scenario)
Figure 12 Global Vertical Farming Market by Region, 2023-2033 (US$ Bn, AGR (%)) (W-Shaped Recovery Scenario)
Figure 13 Global Vertical Farming Market Forecast, 2023-2033 (US$ Bn, AGR (%)) (U-Shaped Recovery Scenario)
Figure 14 Global Vertical Farming Market by Region, 2023-2033 (US$ Bn, AGR (%)) (U-Shaped Recovery Scenario)
Figure 15 Global Vertical Farming Market Forecast, 2023-2033 (US$ Bn, AGR (%)) (L-Shaped Recovery Scenario)
Figure 16 Global Vertical Farming Market by Region, 2023-2033 (US$ Bn, AGR (%)) (L-Shaped Recovery Scenario)
Figure 17 Vertical Farming Market: Porter’s Five Forces Analysis
Figure 18 Vertical Farming Market: PEST Analysis
Figure 19 Vertical Farming Market by Component: Market Attractiveness Index
Figure 20 Global Vertical Farming Market by Component, 2023-2033 (US$ Bn, AGR (%))
Figure 21 Global Vertical Farming Market Share Forecast by Component, 2023-2033 (%)
Figure 22 Hardware Market by Region, 2023-2033 (US$ Bn, AGR (%))
Figure 23 Component Segment Market Share Forecast by Region, 2023 & 2033 (%)
Figure 24 Software Market by Region, 2023-2033 (US$ Bn, AGR (%))
Figure 25 Component Segment Market Share Forecast by Region, 2023 & 2033 (%)
Figure 26 Services Market by Region, 2023-2033 (US$ Bn, AGR (%))
Figure 27 Component Segment Market Share Forecast by Region, 2023 & 2033 (%)
Figure 28 Vertical Farming Market by Type: Market Attractiveness Index
Figure 29 Global Vertical Farming Market by Type, 2023-2033 (US$ Bn, AGR (%))
Figure 30 Global Vertical Farming Market Share Forecast by Type, 2023-2033 (%)
Figure 31 Despommier Skyscrapers Market by Region, 2023-2033 (US$ Bn, AGR (%))
Figure 32 Type Segment Market Share Forecast by Region, 2023 & 2033 (%)
Figure 33 Mixed Use Skyscrapers Market by Region, 2023-2033 (US$ Bn, AGR (%))
Figure 34 Type Segment Market Share Forecast by Region, 2023 & 2033 (%)
Figure 35 Stackable Shipping Containers Market by Region, 2023-2033 (US$ Bn, AGR (%))
Figure 36 Type Segment Market Share Forecast by Region, 2023 & 2033 (%)
Figure 37 Other Type Market by Region, 2023-2033 (US$ Bn, AGR (%))
Figure 38 Type Segment Market Share Forecast by Region, 2023 & 2033 (%)
Figure 39 Vertical Farming Market by Services: Market Attractiveness Index
Figure 40 Global Vertical Farming Market by Services, 2023-2033 (US$ Bn, AGR (%))
Figure 41 Global Vertical Farming Market Share Forecast by Services, 2023-2033 (%)
Figure 42 System Installation & Integration Market by Region, 2023-2033 (US$ Bn, AGR (%))
Figure 43 Services Segment Market Share Forecast by Region, 2023 & 2033 (%)
Figure 44 Consulting Services Market by Region, 2023-2033 (US$ Bn, AGR (%))
Figure 45 Services Segment Market Share Forecast by Region, 2023 & 2033 (%)
Figure 46 Managed Services Market by Region, 2023-2033 (US$ Bn, AGR (%))
Figure 47 Services Segment Market Share Forecast by Region, 2023 & 2033 (%)
Figure 48 Assisted Professional Services Market by Region, 2023-2033 (US$ Bn, AGR (%))
Figure 49 Services Segment Market Share Forecast by Region, 2023 & 2033 (%)
Figure 50 Other Services Market by Region, 2023-2033 (US$ Bn, AGR (%))
Figure 51 Services Segment Market Share Forecast by Region, 2023 & 2033 (%)
Figure 52 Vertical Farming Market by Hardware: Market Attractiveness Index
Figure 53 Global Vertical Farming Market by Hardware, 2023-2033 (US$ Bn, AGR (%))
Figure 54 Global Vertical Farming Market Share Forecast by Hardware, 2023-2033 (%)
Figure 55 Lighting Market by Region, 2023-2033 (US$ Bn, AGR (%))
Figure 56 Hardware Segment Market Share Forecast by Region, 2023 & 2033 (%)
Figure 57 Hydroponic Components Market by Region, 2023-2033 (US$ Bn, AGR (%))
Figure 58 Hardware Segment Market Share Forecast by Region, 2023 & 2033 (%)
Figure 59 Climate Control Market by Region, 2023-2033 (US$ Bn, AGR (%))
Figure 60 Hardware Segment Market Share Forecast by Region, 2023 & 2033 (%)
Figure 61 Sensors Market by Region, 2023-2033 (US$ Bn, AGR (%))
Figure 62 Hardware Segment Market Share Forecast by Region, 2023 & 2033 (%)
Figure 63 Irrigation Systems Market by Region, 2023-2033 (US$ Bn, AGR (%))
Figure 64 Hardware Segment Market Share Forecast by Region, 2023 & 2033 (%)
Figure 65 Other Hardware Market by Region, 2023-2033 (US$ Bn, AGR (%))
Figure 66 Hardware Segment Market Share Forecast by Region, 2023 & 2033 (%)
Figure 67 Vertical Farming Market Forecast by Region 2023 and 2033 (Revenue, CAGR%)
Figure 68 Global Vertical Farming Market Forecast, 2023-2033 (US$ Bn, AGR (%))
Figure 69 Global Vertical Farming Market Share Forecast by Region, 2023-2033 (%)
Figure 70 Global Vertical Farming Market by Region, 2023-2033 (US$ Bn, AGR (%))
Figure 71 Global Vertical Farming Market by Component, 2023-2033 (US$ Bn, AGR (%))
Figure 72 Global Vertical Farming Market by Type, 2023-2033 (US$ Bn, AGR (%))
Figure 73 Global Vertical Farming Market by Services, 2023-2033 (US$ Bn, AGR (%))
Figure 74 Global Vertical Farming Market by Hardware, 2023-2033 (US$ Bn, AGR (%))
Figure 75 North America Vertical Farming Market Attractiveness Index
Figure 76 North America Vertical Farming Market by Region, 2023, 2028 & 2033 (US$ Billion)
Figure 77 North America Vertical Farming Market by Value, 2023-2033 (US$ Bn, AGR (%))
Figure 78 North America Vertical Farming Market by Country, 2023-2033 (US$ Bn, AGR (%))
Figure 79 North America Vertical Farming Market Share Forecast by Country, 2023-2033 (%)
Figure 80 North America Vertical Farming Market by Component, 2023-2033 (US$ Bn, AGR (%))
Figure 81 North America Vertical Farming Market Share Forecast by Component, 2023-2033 (%)
Figure 82 North America Vertical Farming Market by Type, 2023-2033 (US$ Bn, AGR (%))
Figure 83 North America Vertical Farming Market Share Forecast by Type, 2023-2033 (%)
Figure 84 North America Vertical Farming Market by Services, 2023-2033 (US$ Bn, AGR (%))
Figure 85 North America Vertical Farming Market Share Forecast by Services, 2023-2033 (%)
Figure 86 North America Vertical Farming Market by Hardware, 2023-2033 (US$ Bn, AGR (%))
Figure 87 North America Vertical Farming Market Share Forecast by Hardware, 2023-2033 (%)
Figure 88 US Vertical Farming Market by Value, 2023-2033 (US$ Bn, AGR (%))
Figure 89 Canada Vertical Farming Market by Value, 2023-2033 (US$ Bn, AGR (%))
Figure 90 Europe Vertical Farming Market Attractiveness Index
Figure 91 Europe Vertical Farming Market by Region, 2023, 2028 & 2033 (US$ Billion)
Figure 92 Europe Vertical Farming Market by Value, 2023-2033 (US$ Bn, AGR (%))
Figure 93 Europe Vertical Farming Market by Country, 2023-2033 (US$ Bn, AGR (%))
Figure 94 Europe Vertical Farming Market Share Forecast by Country, 2023-2033 (%)
Figure 95 Europe Vertical Farming Market by Component, 2023-2033 (US$ Bn, AGR (%))
Figure 96 Europe Vertical Farming Market Share Forecast by Component, 2023-2033 (%)
Figure 97 Europe Vertical Farming Market by Type, 2023-2033 (US$ Bn, AGR (%))
Figure 98 Europe Vertical Farming Market Share Forecast by Type, 2023-2033 (%)
Figure 99 Europe Vertical Farming Market by Services, 2023-2033 (US$ Bn, AGR (%))
Figure 100 Europe Vertical Farming Market Share Forecast by Services, 2023-2033 (%)
Figure 101 Europe Vertical Farming Market by Hardware, 2023-2033 (US$ Bn, AGR (%))
Figure 102 Germany Vertical Farming Market by Value, 2023-2033 (US$ Bn, AGR (%))
Figure 103 UK Vertical Farming Market by Value, 2023-2033 (US$ Bn, AGR (%))
Figure 104 France Vertical Farming Market by Value, 2023-2033 (US$ Bn, AGR (%))
Figure 105 Italy Vertical Farming Market by Value, 2023-2033 (US$ Bn, AGR (%))
Figure 106 Russia Vertical Farming Market by Value, 2023-2033 (US$ Bn, AGR (%))
Figure 107 Rest of Europe Vertical Farming Market by Value, 2023-2033 (US$ Bn, AGR (%))
Figure 108 Asia-Pacific Vertical Farming Market Attractiveness Index
Figure 109 Asia-Pacific Vertical Farming Market by Region, 2023, 2028 & 2033 (US$ Billion)
Figure 110 Asia-Pacific Vertical Farming Market by Value, 2023-2033 (US$ Bn, AGR (%))
Figure 111 Asia-Pacific Vertical Farming Market by Country, 2023-2033 (US$ Bn, AGR (%))
Figure 112 Asia-Pacific Vertical Farming Market by Component, 2023-2033 (US$ Bn, AGR (%))
Figure 113 Asia-Pacific Vertical Farming Market Share Forecast by Component, 2023-2033 (%)
Figure 114 Asia-Pacific Vertical Farming Market by Type, 2023-2033 (US$ Bn, AGR (%))
Figure 115 Asia-Pacific Vertical Farming Market Share Forecast by Type, 2023-2033 (%)
Figure 116 Asia-Pacific Vertical Farming Market by Services, 2023-2033 (US$ Bn, AGR (%))
Figure 117 Asia-Pacific Vertical Farming Market Share Forecast by Services, 2023-2033 (%)
Figure 118 Asia-Pacific Vertical Farming Market by Hardware, 2023-2033 (US$ Bn, AGR (%))
Figure 119 Asia-Pacific Vertical Farming Market Share Forecast by Hardware, 2023-2033 (%)
Figure 120 China Vertical Farming Market by Value, 2023-2033 (US$ Bn, AGR (%))
Figure 121 India Vertical Farming Market by Value, 2023-2033 (US$ Bn, AGR (%))
Figure 122 Japan Vertical Farming Market by Value, 2023-2033 (US$ Bn, AGR (%))
Figure 123 South Korea Vertical Farming Market by Value, 2023-2033 (US$ Bn, AGR (%))
Figure 124 Australia Vertical Farming Market by Value, 2023-2033 (US$ Bn, AGR (%))
Figure 125 Rest of Asia-Pacific Vertical Farming Market by Value, 2023-2033 (US$ Bn, AGR (%))
Figure 126 Middle East & Africa Vertical Farming Market Attractiveness Index
Figure 127 Middle East & Africa Vertical Farming Market by Region, 2023, 2028 & 2033 (US$ Billion)
Figure 128 Middle East & Africa Vertical Farming Market by Value, 2023-2033 (US$ Bn, AGR (%))
Figure 129 Middle East & Africa Vertical Farming Market by Country, 2023-2033 (US$ Bn, AGR (%))
Figure 130 Middle East & Africa Vertical Farming Market by Component, 2023-2033 (US$ Bn, AGR (%))
Figure 131 Middle East & Africa Vertical Farming Market Share Forecast by Component, 2023-2033 (%)
Figure 132 Middle East & Africa Vertical Farming Market by Type, 2023-2033 (US$ Bn, AGR (%))
Figure 133 Middle East & Africa Vertical Farming Market Share Forecast by Type, 2023-2033 (%)
Figure 134 Middle East & Africa Vertical Farming Market by Services, 2023-2033 (US$ Bn, AGR (%))
Figure 135 Middle East & Africa Vertical Farming Market Share Forecast by Services, 2023-2033 (%)
Figure 136 Middle East & Africa Vertical Farming Market by Hardware, 2023-2033 (US$ Bn, AGR (%))
Figure 137 Middle East & Africa Vertical Farming Market Share Forecast by Hardware, 2023-2033 (%)
Figure 138 GCC Vertical Farming Market by Value, 2023-2033 (US$ Bn, AGR (%))
Figure 139 South Africa Vertical Farming Market by Value, 2023-2033 (US$ Bn, AGR (%))
Figure 140 Rest of Middle East & Africa Vertical Farming Market by Value, 2023-2033 (US$ Bn, AGR (%))
Figure 141 Latin America Vertical Farming Market Attractiveness Index
Figure 142 Latin America Vertical Farming Market by Region, 2023, 2028 & 2033 (US$ Billion)
Figure 143 Latin America Vertical Farming Market by Value, 2023-2033 (US$ Bn, AGR (%))
Figure 144 Latin America Vertical Farming Market by Country, 2023-2033 (US$ Bn, AGR (%))
Figure 145 Latin America Vertical Farming Market by Component, 2023-2033 (US$ Bn, AGR (%))
Figure 146 Latin America Vertical Farming Market Share Forecast by Component, 2023-2033 (%)
Figure 147 Latin America Vertical Farming Market by Type, 2023-2033 (US$ Bn, AGR (%))
Figure 148 Latin America Vertical Farming Market Share Forecast by Type, 2023-2033 (%)
Figure 149 Latin America Vertical Farming Market by Services, 2023-2033 (US$ Bn, AGR (%))
Figure 150 Latin America Vertical Farming Market Share Forecast by Services, 2023-2033 (%)
Figure 151 Latin America Vertical Farming Market by Hardware, 2023-2033 (US$ Bn, AGR (%))
Figure 152 Latin America Vertical Farming Market Share Forecast by Hardware, 2023-2033 (%)
Figure 153 Brazil Vertical Farming Market by Value, 2023-2033 (US$ Bn, AGR (%))
Figure 154 Mexico Vertical Farming Market by Value, 2023-2033 (US$ Bn, AGR (%))
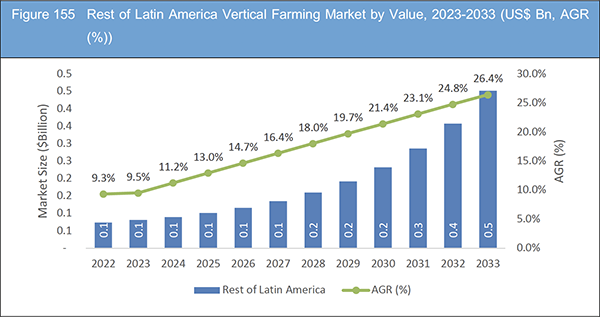
Figure 155 Rest of Latin America Vertical Farming Market by Value, 2023-2033 (US$ Bn, AGR (%))
Figure 156 Vertical Farming Market: Company Share, 2022
Figure 157 Signify Holding B.V: Net Revenue, 2018-2022 (US$ Million, AGR%)
Figure 158 Signify Holding B.V: R&D, 2018-2022 (US$ Million, AGR%)
Figure 159 Signify Holding B.V: Regional Revenue Share, 2022 (%)
Figure 160 Signify Holding B.V: Business Segment Revenue Share, 2022 (%)
ページTOPに戻る
Summary
Report Details
The Vertical Farming Market Report 2023-2033: This report will prove invaluable to leading firms striving for new revenue pockets if they wish to better understand the industry and its underlying dynamics. It will be useful for companies that would like to expand into different industries or to expand their existing operations in a new region.
Growing Demand for Local and Fresh Produce
The increasing consumer preference for locally grown and fresh produce has become a significant driver in the vertical farming market. With growing awareness of environmental and health concerns associated with long-distance food transportation, consumers are seeking sustainable alternatives. Vertical farming’s ability to grow crops in urban areas and near consumer hubs enables the supply of fresher and more nutritious produce, reducing the reliance on imported goods and supporting the “farm-to-table” concept.
Rising Concerns About Food Security Is Driving the Market Growth
As the global population continues to grow, ensuring food security has become a pressing issue. Vertical farming offers a viable solution by providing a controlled environment for crop cultivation, unaffected by external factors like weather and climate change. Its ability to produce high yields in limited space makes it an attractive option to supplement traditional agriculture and enhance food production, especially in areas vulnerable to food shortages.
What Questions Should You Ask before Buying a Market Research Report?
• How is the vertical farming market evolving?
• What is driving and restraining the vertical farming market?
• How will each vertical farming submarket segment grow over the forecast period and how much revenue will these submarkets account for in 2033?
• How will the market shares for each vertical farming submarket develop from 2023 to 2033?
• What will be the main driver for the overall market from 2023 to 2033?
• Will leading vertical farming markets broadly follow the macroeconomic dynamics, or will individual national markets outperform others?
• How will the market shares of the national markets change by 2033 and which geographical region will lead the market in 2033?
• Who are the leading players and what are their prospects over the forecast period?
• What are the vertical farming projects for these leading companies?
• How will the industry evolve during the period between 2023 and 2033? What are the implications of vertical farming projects taking place now and over the next 10 years?
• Is there a greater need for product commercialisation to further scale the vertical farming market?
• Where is the vertical farming market heading and how can you ensure you are at the forefront of the market?
• What are the best investment options for new product and service lines?
• What are the key prospects for moving companies into a new growth path and C-suite?
You need to discover how this will impact the vertical farming market today, and over the next 10 years:
• Our 343-page report provides 129 tables and 160 charts/graphs exclusively to you.
• The report highlights key lucrative areas in the industry so you can target them – NOW.
• It contains in-depth analysis of global, regional and national sales and growth.
• It highlights for you the key successful trends, changes and revenue projections made by your competitors.
This report tells you TODAY how the vertical farming market will develop in the next 10 years, and in line with the variations in COVID-19 economic recession and bounce. This market is more critical now than at any point over the last 10 years.
Forecasts to 2033 and other analyses reveal commercial prospects
• In addition to revenue forecasting to 2033, our new study provides you with recent results, growth rates, and market shares.
• You will find original analyses, with business outlooks and developments.
• Discover qualitative analyses (including market dynamics, drivers, opportunities, restraints and challenges), cost structure, impact of rising vertical farming prices and recent developments.
This report includes data analysis and invaluable insight into how COVID-19 will affect the industry and your company. Four COVID-19 recovery patterns and their impact, namely, “V”, “L”, “W” and “U” are discussed in this report.
Segments Covered in the Report
Market Segment by Component
• Hardware
• Software
• Services
Market Segment by Type
• Despommier Skyscrapers
• Mixed Use Skyscrapers
• Stackable Shipping Containers
• Other Type
Market Segment by Services
• System Installation & Integration
• Consulting Services
• Managed Services
• Assisted Professional Services
• Other Services
Market Segment by Hardware
• Lighting
• Hydroponic Components
• Climate Control
• Sensors
• Irrigation Systems
• Other Hardware
In addition to the revenue predictions for the overall world market and segments, you will also find revenue forecasts for four regional and 20 leading national markets:
North America
• U.S.
• Canada
Europe
• Germany
• Russia
• United Kingdom
• France
• Italy
• Rest of Europe
Asia Pacific
• China
• Japan
• India
• Australia
• South Korea
• Rest of Asia Pacific
Latin America
• Brazil
• Mexico
• Rest of Latin America
Middle East & Africa
• GCC
• South Africa
• Rest of Middle East & Africa
The report also includes profiles and for some of the leading companies in the Vertical Farming Market, 2023 to 2033, with a focus on this segment of these companies’ operations.
Leading companies profiled in the report
• AeroFarms
• Bowery Farming
• BrightFarms
• Farm.One
• Freight Farms
• Gotham Greens
• Infarm
• OSRAM Licht AG
• Plenty
• Signify Holding B.V
• Sky Greens
• SPREAD Co Ltd
• Urban Crop Solutions
• Valoya
• Vertical Harvest
Overall world revenue for vertical farming market, 2023 to 2033 in terms of value the market will surpass US$6.1 billion in 2023, our work calculates. We predict strong revenue growth through to 2033. Our work identifies which organizations hold the greatest potential. Discover their capabilities, progress, and commercial prospects, helping you stay ahead.
How will the Vertical Farming Market, 2023 to 2033 report help you?
In summary, our 340+ page report provides you with the following knowledge:
• Revenue forecasts to 2033 for Vertical Farming Market, 2023 to 2033 Market, with forecasts for component, type, services, and hardware, each forecast at a global and regional level – discover the industry’s prospects, finding the most lucrative places for investments and revenues.
• Revenue forecasts to 2033 for four regional and 20 key national markets – See forecasts for the Vertical Farming Market, 2023 to 2033 market in North America, Europe, Asia-Pacific, Latin America and Middle East & Africa. Also forecasted is the market in the US, Canada, Brazil, Germany, France, UK, Italy, China, India, Japan, and Australia among other prominent economies.
• Prospects for established firms and those seeking to enter the market – including company profiles for 15 of the major companies involved in the vertical farming market, 2023 to 2033.
Find quantitative and qualitative analyses with independent predictions. Receive information that only our report contains, staying informed with invaluable business intelligence.
Information found nowhere else
With our new report, you are less likely to fall behind in knowledge or miss out on opportunities. See how our work could benefit your research, analyses, and decisions. Visiongain’s study is for everybody needing commercial analyses for the Vertical Farming Market, 2023 to 2033, market-leading companies. You will find data, trends and predictions.
ページTOPに戻る
Table of Contents
Table of Contents
1 Report Overview
1.1 Objectives of the Study
1.2 Introduction to Vertical Farming Market
1.3 What This Report Delivers
1.4 Why You Should Read This Report
1.5 Key Questions Answered by This Analytical Report
1.6 Who Is This Report for?
1.7 Research Methodology
1.7.1 Market Definitions
1.7.1.1 Component
1.7.1.2 Type
1.7.1.3 Services
1.7.1.4 Hardware
1.7.2 Market Evaluation & Forecasting Methodology
1.7.3 Data Validation
1.7.3.1 Primary Research
1.7.3.2 Secondary Research
1.8 Frequently Asked Questions (FAQs)
1.9 Associated Visiongain Reports
1.10 About Visiongain
2 Executive Summary
2.1 Segment Analysis
2.1.1 Component Segment: Market Attractiveness Index
2.1.2 Type Segment: Market Attractiveness Index
2.1.3 Services Segment: Market Attractiveness Index
2.1.4 Hardware Segment: Market Attractiveness Index
2.2 Regional Analysis
3 Market Overview
3.1 Key Findings
3.2 Market Dynamics
3.2.1 Market Driving Factors
3.2.1.1 Increasing Population and Urbanization
3.2.1.2 Need for Sustainable and Efficient Food Production
3.2.1.3 Rising Consumer Demand for Locally Sourced Food
3.2.2 Market Restraining Factors
3.2.2.1 High Initial Investment Costs
3.2.2.2 Energy Consumption and Operational Costs
3.2.2.3 Limited Crop Variety and Scalability
3.2.3 Market Opportunities
3.2.3.1 Technological Advancements and Automation
3.2.3.2 Vertical Farming in Commercial and Residential Buildings
3.2.3.3 Collaboration with Retailers and Food Service Providers
3.3 COVID-19 Impact Analysis
3.3.1 V-Shaped Recovery
3.3.2 W-Shaped Recovery
3.3.3 U-Shaped Recovery
3.3.4 L-Shaped Recovery
3.4 Porter’s Five Forces Analysis
3.4.1 Bargaining Power of Suppliers (Low)
3.4.2 Bargaining Power of Buyers (Moderate)
3.4.3 Competitive Rivalry (High)
3.4.4 Threat from Substitutes (Low)
3.4.5 Threat of New Entrants (Moderate)
3.5 PEST Analysis
3.5.1 Political Factors:
3.5.2 Economic Factors:
3.5.3 Social Factors:
3.5.4 Technological Factors:
4 Vertical Farming Market Analysis by Component
4.1 Key Findings
4.2 Component Segment: Market Attractiveness Index
4.3 Vertical Farming Market Size Estimation and Forecast by Component
4.4 Hardware Market
4.4.1 Market Size by Region, 2023-2033 (US$ Billion)
4.4.2 Market Share by Region, 2023 & 2033 (%)
4.5 Software Market
4.5.1 Market Size by Region, 2023-2033 (US$ Billion)
4.5.2 Market Share by Region, 2023 & 2033 (%)
4.6 Services Market
4.6.1 Market Size by Region, 2023-2033 (US$ Billion)
4.6.2 Market Share by Region, 2023 & 2033 (%)
5 Vertical Farming Market Analysis by Type
5.1 Key Findings
5.2 Type Segment: Market Attractiveness Index
5.3 Vertical Farming Market Size Estimation and Forecast by Type
5.4 Despommier Skyscrapers Market
5.4.1 Market Size by Region, 2023-2033 (US$ Billion)
5.4.2 Market Share by Region, 2023 & 2033 (%)
5.5 Mixed Use Skyscrapers Market
5.5.1 Market Size by Region, 2023-2033 (US$ Billion)
5.5.2 Market Share by Region, 2023 & 2033 (%)
5.6 Stackable Shipping Containers Market
5.6.1 Market Size by Region, 2023-2033 (US$ Billion)
5.6.2 Market Share by Region, 2023 & 2033 (%)
5.7 Other Type Market
5.7.1 Market Size by Region, 2023-2033 (US$ Billion)
5.7.2 Market Share by Region, 2023 & 2033 (%)
6 Vertical Farming Market Analysis by Services
6.1 Key Findings
6.2 Services Segment: Market Attractiveness Index
6.3 Vertical Farming Market Size Estimation and Forecast by Services
6.4 System Installation & Integration Market
6.4.1 Market Size by Region, 2023-2033 (US$ Billion)
6.4.2 Market Share by Region, 2023 & 2033 (%)
6.5 Consulting Services Market
6.5.1 Market Size by Region, 2023-2033 (US$ Billion)
6.5.2 Market Share by Region, 2023 & 2033 (%)
6.6 Managed Services Market
6.6.1 Market Size by Region, 2023-2033 (US$ Billion)
6.6.2 Market Share by Region, 2023 & 2033 (%)
6.7 Assisted Professional Services Market
6.7.1 Market Size by Region, 2023-2033 (US$ Billion)
6.7.2 Market Share by Region, 2023 & 2033 (%)
6.8 Other Services Market
6.8.1 Market Size by Region, 2023-2033 (US$ Billion)
6.8.2 Market Share by Region, 2023 & 2033 (%)
7 Vertical Farming Market Analysis by Hardware
7.1 Key Findings
7.2 Hardware Segment: Market Attractiveness Index
7.3 Vertical Farming Market Size Estimation and Forecast by Hardware
7.4 Lighting Market
7.4.1 Market Size by Region, 2023-2033 (US$ Billion)
7.4.2 Market Share by Region, 2023 & 2033 (%)
7.5 Hydroponic Components Market
7.5.1 Market Size by Region, 2023-2033 (US$ Billion)
7.5.2 Market Share by Region, 2023 & 2033 (%)
7.6 Climate Control Market
7.6.1 Market Size by Region, 2023-2033 (US$ Billion)
7.6.2 Market Share by Region, 2023 & 2033 (%)
7.7 Sensors Market
7.7.1 Market Size by Region, 2023-2033 (US$ Billion)
7.7.2 Market Share by Region, 2023 & 2033 (%)
7.8 Irrigation Systems Market
7.8.1 Market Size by Region, 2023-2033 (US$ Billion)
7.8.2 Market Share by Region, 2023 & 2033 (%)
7.9 Other Hardware Market
7.9.1 Market Size by Region, 2023-2033 (US$ Billion)
7.9.2 Market Share by Region, 2023 & 2033 (%)
8 Vertical Farming Market Analysis by Region
8.1 Key Findings
8.2 Regional Market Size Estimation and Forecast
9 North America Vertical Farming Market Analysis
9.1 Key Findings
9.2 North America Vertical Farming Market Attractiveness Index
9.3 North America Vertical Farming Market by Country, 2023, 2028 & 2033 (US$ Billion)
9.4 North America Vertical Farming Market Size Estimation and Forecast by Value
9.5 North America Vertical Farming Market Size Estimation and Forecast by Country
9.6 North America Vertical Farming Market Size Estimation and Forecast by Component
9.7 North America Vertical Farming Market Size Estimation and Forecast by Type
9.8 North America Vertical Farming Market Size Estimation and Forecast by Services
9.9 North America Vertical Farming Market Size Estimation and Forecast by Hardware
9.10 US Vertical Farming Market Analysis
9.11 Canada Vertical Farming Market Analysis
10 Europe Vertical Farming Market Analysis
10.1 Key Findings
10.2 Europe Vertical Farming Market Attractiveness Index
10.3 Europe Vertical Farming Market by Country, 2023, 2028 & 2033 (US$ Billion)
10.4 Europe Vertical Farming Market Size Estimation and Forecast by Value
10.5 Europe Vertical Farming Market Size Estimation and Forecast by Country
10.6 Europe Vertical Farming Market Size Estimation and Forecast by Component
10.7 Europe Vertical Farming Market Size Estimation and Forecast by Type
10.8 Europe Vertical Farming Market Size Estimation and Forecast by Services
10.9 Europe Vertical Farming Market Size Estimation and Forecast by Hardware
10.10 Germany Vertical Farming Market Analysis
10.11 UK Vertical Farming Market Analysis
10.12 France Vertical Farming Market Analysis
10.13 Italy Vertical Farming Market Analysis
10.14 Russia Vertical Farming Market Analysis
10.15 Rest of Europe Vertical Farming Market Analysis
11 Asia-Pacific Vertical Farming Market Analysis
11.1 Key Findings
11.2 Asia-Pacific Vertical Farming Market Attractiveness Index
11.3 Asia-Pacific Vertical Farming Market by Country, 2023, 2028 & 2033 (US$ Billion)
11.4 Asia-Pacific Vertical Farming Market Size Estimation and Forecast by Value
11.5 Asia-Pacific Vertical Farming Market Size Estimation and Forecast by Country
11.6 Asia-Pacific Vertical Farming Market Size Estimation and Forecast by Component
11.7 Asia-Pacific Vertical Farming Market Size Estimation and Forecast by Type
11.8 Asia-Pacific Vertical Farming Market Size Estimation and Forecast by Services
11.9 Asia-Pacific Vertical Farming Market Size Estimation and Forecast by Hardware
11.10 China Vertical Farming Market Analysis
11.11 India Vertical Farming Market Analysis
11.12 Japan Vertical Farming Market Analysis
11.13 South Korea Vertical Farming Market Analysis
11.14 Australia Vertical Farming Market Analysis
11.15 Rest of Asia-Pacific Vertical Farming Market Analysis
12 Middle East & Africa Vertical Farming Market Analysis
12.1 Key Findings
12.2 Middle East & Africa Vertical Farming Market Attractiveness Index
12.3 Middle East & Africa Vertical Farming Market by Country, 2023, 2028 & 2033 (US$ Billion)
12.4 Middle East & Africa Vertical Farming Market Size Estimation and Forecast by Value
12.5 Middle East & Africa Vertical Farming Market Size Estimation and Forecast by Country
12.6 Middle East & Africa Vertical Farming Market Size Estimation and Forecast by Component
12.7 Middle East & Africa Vertical Farming Market Size Estimation and Forecast by Type
12.8 Middle East & Africa Vertical Farming Market Size Estimation and Forecast by Services
12.9 Middle East & Africa Vertical Farming Market Size Estimation and Forecast by Hardware
12.10 GCC Vertical Farming Market Analysis
12.11 South Africa Vertical Farming Market Analysis
12.12 Rest of Middle East & Africa Vertical Farming Market Analysis
13 Latin America Vertical Farming Market Analysis
13.1 Key Findings
13.2 Latin America Vertical Farming Market Attractiveness Index
13.3 Latin America Vertical Farming Market by Country, 2023, 2028 & 2033 (US$ Billion)
13.4 Latin America Vertical Farming Market Size Estimation and Forecast by Value
13.5 Latin America Vertical Farming Market Size Estimation and Forecast by Country
13.6 Latin America Vertical Farming Market Size Estimation and Forecast by Component
13.7 Latin America Vertical Farming Market Size Estimation and Forecast by Type
13.8 Latin America Vertical Farming Market Size Estimation and Forecast by Services
13.9 Latin America Vertical Farming Market Size Estimation and Forecast by Hardware
13.10 Brazil Vertical Farming Market Analysis
13.11 Mexico Vertical Farming Market Analysis
13.12 Rest of Latin America Vertical Farming Market Analysis
14 Company Profiles
14.1 Competitive Landscape, 2022
14.2 Strategic Outlook
14.3 Signify Holding B.V
14.3.1 Company Snapshot
14.3.2 Company Overview
14.3.3 Financial Analysis
14.3.3.1 Net Revenue, 2018-2022
14.3.3.2 R&D, 2018-2022
14.3.3.3 Regional Revenue Share, 2022 (%)
14.3.3.4 Business Segment Revenue Share, 2022 (%)
14.3.4 Product Benchmarking
14.3.5 Strategic Outlook
14.4 Freight Farms
14.4.1 Company Snapshot
14.4.2 Company Overview
14.4.3 Product Benchmarking
14.4.4 Strategic Outlook
14.5 AeroFarms
14.5.1 Company Snapshot
14.5.2 Company Overview
14.5.3 Product Benchmarking
14.6 Sky Greens
14.6.1 Company Snapshot
14.6.2 Company Overview
14.6.3 Product Benchmarking
14.7 Plenty
14.7.1 Company Snapshot
14.7.2 Company Overview
14.7.3 Product Benchmarking
14.7.4 Strategic Outlook
14.8 SPREAD Co Ltd
14.8.1 Company Snapshot
14.8.2 Company Overview
14.8.3 Product Benchmarking
14.8.4 Strategic Outlook
14.9 Valoya
14.9.1 Company Snapshot
14.9.2 Company Overview
14.9.3 Product Benchmarking
14.9.4 Strategic Outlook
14.10 OSRAM Licht AG
14.10.1 Company Snapshot
14.10.2 Company Overview
14.10.3 Product Benchmarking
14.10.4 Strategic Outlook
14.11 Bowery Farming
14.11.1 Company Snapshot
14.11.2 Company Overview
14.11.3 Product Benchmarking
14.11.4 Strategic Outlook
14.12 BrightFarms
14.12.1 Company Snapshot
14.12.2 Company Overview
14.12.3 Product Benchmarking
14.13 Infarm
14.13.1 Company Snapshot
14.13.2 Company Overview
14.13.3 Product Benchmarking
14.13.4 Strategic Outlook
14.14 Gotham Greens
14.14.1 Company Snapshot
14.14.2 Company Overview
14.14.3 Product Benchmarking
14.15 Vertical Harvest
14.15.1 Company Snapshot
14.15.2 Company Overview
14.15.3 Product Benchmarking
14.15.4 Strategic Outlook
14.16 Urban Crop Solutions
14.16.1 Company Snapshot
14.16.2 Company Overview
14.16.3 Product Benchmarking
14.16.4 Strategic Outlook
14.17 Farm.One
14.17.1 Company Snapshot
14.17.2 Company Overview
14.17.3 Product Benchmarking
14.17.4 Strategic Outlook
15 Conclusion and Recommendations
15.1 Concluding Remarks from Visiongain
15.2 Recommendations for Market Players
ページTOPに戻る
List of Tables/Graphs
List of Tables
Table 1 Vertical Farming Market Snapshot, 2023 & 2033 (US$ Billion, CAGR %)
Table 2 Global Vertical Farming Market Forecast, 2023-2033 (US$ Bn, AGR (%), CAGR (%)) (V-Shaped Recovery Scenario)
Table 3 Global Vertical Farming Market by Region, 2023-2033 (US$ Bn, AGR (%), CAGR (%)) (V-Shaped Recovery Scenario)
Table 4 Global Vertical Farming Market Forecast, 2023-2033 (US$ Bn, AGR (%), CAGR (%)) (W-Shaped Recovery Scenario)
Table 5 Global Vertical Farming Market by Region, 2023-2033 (US$ Bn, AGR (%), CAGR (%)) (W-Shaped Recovery Scenario)
Table 6 Global Vertical Farming Market Forecast, 2023-2033 (US$ Bn, AGR (%), CAGR (%)) (U-Shaped Recovery Scenario)
Table 7 Global Vertical Farming Market by Region, 2023-2033 (US$ Bn, AGR (%), CAGR (%)) (U-Shaped Recovery Scenario)
Table 8 Global Vertical Farming Market Forecast, 2023-2033 (US$ Bn, AGR (%), CAGR (%)) (L-Shaped Recovery Scenario)
Table 9 Global Vertical Farming Market by Region, 2023-2033 (US$ Bn, AGR (%), CAGR (%)) (L-Shaped Recovery Scenario)
Table 10 Global Vertical Farming Market by Component, 2023-2033 (US$ Bn, AGR (%), CAGR (%))
Table 11 Hardware Market by Region, 2023-2033 (US$ Bn, AGR (%), CAGR (%))
Table 12 Software Market by Region, 2023-2033 (US$ Bn, AGR (%), CAGR (%))
Table 13 Services Market by Region, 2023-2033 (US$ Bn, AGR (%), CAGR (%))
Table 14 Global Vertical Farming Market by Type, 2023-2033 (US$ Bn, AGR (%), CAGR (%))
Table 15 Despommier Skyscrapers Market by Region, 2023-2033 (US$ Bn, AGR (%), CAGR (%))
Table 16 Mixed Use Skyscrapers Market by Region, 2023-2033 (US$ Bn, AGR (%), CAGR (%))
Table 17 Stackable Shipping Containers Market by Region, 2023-2033 (US$ Bn, AGR (%), CAGR (%))
Table 18 Other Type Market by Region, 2023-2033 (US$ Bn, AGR (%), CAGR (%))
Table 19 Global Vertical Farming Market by Services, 2023-2033 (US$ Bn, AGR (%), CAGR (%))
Table 20 System Installation & Integration Market by Region, 2023-2033 (US$ Bn, AGR (%), CAGR (%))
Table 21 Consulting Services Market by Region, 2023-2033 (US$ Bn, AGR (%), CAGR (%))
Table 22 Managed Services Market by Region, 2023-2033 (US$ Bn, AGR (%), CAGR (%))
Table 23 Assisted Professional Services Market by Region, 2023-2033 (US$ Bn, AGR (%), CAGR (%))
Table 24 Other Services Market by Region, 2023-2033 (US$ Bn, AGR (%), CAGR (%))
Table 25 Global Vertical Farming Market by Hardware, 2023-2033 (US$ Bn, AGR (%), CAGR (%))
Table 26 Lighting Market by Region, 2023-2033 (US$ Bn, AGR (%), CAGR (%))
Table 27 Hydroponic Components Market by Region, 2023-2033 (US$ Bn, AGR (%), CAGR (%))
Table 28 Climate Control Market by Region, 2023-2033 (US$ Bn, AGR (%), CAGR (%))
Table 29 Sensors Market by Region, 2023-2033 (US$ Bn, AGR (%), CAGR (%))
Table 30 Irrigation Systems Market by Region, 2023-2033 (US$ Bn, AGR (%), CAGR (%))
Table 31 Other Hardware Market by Region, 2023-2033 (US$ Bn, AGR (%), CAGR (%))
Table 32 Global Vertical Farming Market Forecast, 2023-2033 (US$ Bn, AGR (%), CAGR (%))
Table 33 Global Vertical Farming Market by Region, 2023-2033 (US$ Bn, AGR (%), CAGR (%))
Table 34 Global Vertical Farming Market by Component, 2023-2033 (US$ Bn, AGR (%), CAGR (%))
Table 35 Global Vertical Farming Market by Type, 2023-2033 (US$ Bn, AGR (%), CAGR (%))
Table 36 Global Vertical Farming Market by Services, 2023-2033 (US$ Bn, AGR (%), CAGR (%))
Table 37 Global Vertical Farming Market by Hardware, 2023-2033 (US$ Bn, AGR (%), CAGR (%))
Table 38 North America Vertical Farming Market by Value, 2023-2033 (US$ Bn, AGR (%), CAGR (%))
Table 39 North America Vertical Farming Market by Country, 2023-2033 (US$ Bn, AGR (%), CAGR (%))
Table 40 North America Vertical Farming Market by Component, 2023-2033 (US$ Bn, AGR (%), CAGR (%))
Table 41 North America Vertical Farming Market by Type, 2023-2033 (US$ Bn, AGR (%), CAGR (%))
Table 42 North America Vertical Farming Market by Services, 2023-2033 (US$ Bn, AGR (%), CAGR (%))
Table 43 North America Vertical Farming Market by Hardware, 2023-2033 (US$ Bn, AGR (%), CAGR (%))
Table 44 US Vertical Farming Market by Value, 2023-2033 (US$ Bn, AGR (%), CAGR (%))
Table 45 Canada Vertical Farming Market by Value, 2023-2033 (US$ Bn, AGR (%), CAGR (%))
Table 46 Europe Vertical Farming Market by Value, 2023-2033 (US$ Bn, AGR (%), CAGR (%))
Table 47 Europe Vertical Farming Market by Country, 2023-2033 (US$ Bn, AGR (%), CAGR (%))
Table 48 Europe Vertical Farming Market by Component, 2023-2033 (US$ Bn, AGR (%), CAGR (%))
Table 49 Europe Vertical Farming Market by Type, 2023-2033 (US$ Bn, AGR (%), CAGR (%))
Table 50 Europe Vertical Farming Market by Services, 2023-2033 (US$ Bn, AGR (%), CAGR (%))
Table 51 Europe Vertical Farming Market by Hardware, 2023-2033 (US$ Bn, AGR (%), CAGR (%))
Table 52 Germany Vertical Farming Market by Value, 2023-2033 (US$ Bn, AGR (%), CAGR (%))
Table 53 UK Vertical Farming Market by Value, 2023-2033 (US$ Bn, AGR (%), CAGR (%))
Table 54 France Vertical Farming Market by Value, 2023-2033 (US$ Bn, AGR (%), CAGR (%))
Table 55 Italy Vertical Farming Market by Value, 2023-2033 (US$ Bn, AGR (%), CAGR (%))
Table 56 Russia Vertical Farming Market by Value, 2023-2033 (US$ Bn, AGR (%), CAGR (%))
Table 57 Rest of Europe Vertical Farming Market by Value, 2023-2033 (US$ Bn, AGR (%), CAGR (%))
Table 58 Asia-Pacific Vertical Farming Market by Value, 2023-2033 (US$ Bn, AGR (%), CAGR (%))
Table 59 Asia-Pacific Vertical Farming Market by Country, 2023-2033 (US$ Bn, AGR (%), CAGR (%))
Table 60 Asia-Pacific Vertical Farming Market by Component, 2023-2033 (US$ Bn, AGR (%), CAGR (%))
Table 61 Asia-Pacific Vertical Farming Market by Type, 2023-2033 (US$ Bn, AGR (%), CAGR (%))
Table 62 Asia-Pacific Vertical Farming Market by Services, 2023-2033 (US$ Bn, AGR (%), CAGR (%))
Table 63 Asia-Pacific Vertical Farming Market by Hardware, 2023-2033 (US$ Bn, AGR (%), CAGR (%))
Table 64 China Vertical Farming Market by Value, 2023-2033 (US$ Bn, AGR (%), CAGR (%))
Table 65 India Vertical Farming Market by Value, 2023-2033 (US$ Bn, AGR (%), CAGR (%))
Table 66 Japan Vertical Farming Market by Value, 2023-2033 (US$ Bn, AGR (%), CAGR (%))
Table 67 South Korea Vertical Farming Market by Value, 2023-2033 (US$ Bn, AGR (%), CAGR (%))
Table 68 Australia Vertical Farming Market by Value, 2023-2033 (US$ Bn, AGR (%), CAGR (%))
Table 69 Rest of Asia-Pacific Vertical Farming Market by Value, 2023-2033 (US$ Bn, AGR (%), CAGR (%))
Table 70 Middle East & Africa Vertical Farming Market by Value, 2023-2033 (US$ Bn, AGR (%), CAGR (%))
Table 71 Middle East & Africa Vertical Farming Market by Country, 2023-2033 (US$ Bn, AGR (%), CAGR (%))
Table 72 Middle East & Africa Vertical Farming Market by Component, 2023-2033 (US$ Bn, AGR (%), CAGR (%))
Table 73 Middle East & Africa Vertical Farming Market by Type, 2023-2033 (US$ Bn, AGR (%), CAGR (%))
Table 74 Middle East & Africa Vertical Farming Market by Services, 2023-2033 (US$ Bn, AGR (%), CAGR (%))
Table 75 Middle East & Africa Vertical Farming Market by Hardware, 2023-2033 (US$ Bn, AGR (%), CAGR (%))
Table 76 GCC Vertical Farming Market by Value, 2023-2033 (US$ Bn, AGR (%), CAGR (%))
Table 77 South Africa Vertical Farming Market by Value, 2023-2033 (US$ Bn, AGR (%), CAGR (%))
Table 78 Rest of Middle East & Africa Vertical Farming Market by Value, 2023-2033 (US$ Bn, AGR (%), CAGR (%))
Table 79 Latin America Vertical Farming Market by Value, 2023-2033 (US$ Bn, AGR (%), CAGR (%))
Table 80 Latin America Vertical Farming Market by Country, 2023-2033 (US$ Bn, AGR (%), CAGR (%))
Table 81 Latin America Vertical Farming Market by Component, 2023-2033 (US$ Bn, AGR (%), CAGR (%))
Table 82 Latin America Vertical Farming Market by Type, 2023-2033 (US$ Bn, AGR (%), CAGR (%))
Table 83 Latin America Vertical Farming Market by Services, 2023-2033 (US$ Bn, AGR (%), CAGR (%))
Table 84 Latin America Vertical Farming Market by Hardware, 2023-2033 (US$ Bn, AGR (%), CAGR (%))
Table 85 Brazil Vertical Farming Market by Value, 2023-2033 (US$ Bn, AGR (%), CAGR (%))
Table 86 Mexico Vertical Farming Market by Value, 2023-2033 (US$ Bn, AGR (%), CAGR (%))
Table 87 Rest of Latin America Vertical Farming Market by Value, 2023-2033 (US$ Bn, AGR (%), CAGR (%))
Table 88 Strategic Outlook
Table 89 Signify Holding B.V Key Details, (CEO, HQ, Revenue, Founded, No. of Employees, Company Type, Website, Business Segment)
Table 90 Signify Holding B.V: Product Benchmarking
Table 91 Signify Holding B.V: Strategic Outlook
Table 92 Freight Farms Key Details, (CEO, HQ, Revenue, Founded, No. of Employees, Company Type, Website, Business Segment)
Table 93 Freight Farms: Product Benchmarking
Table 94 Freight Farms: Strategic Outlook
Table 95 AeroFarms Key Details, (CEO, HQ, Revenue, Founded, No. of Employees, Company Type, Website, Business Segment)
Table 96 AeroFarms: Product Benchmarking
Table 97 Sky GreensKey Details, (CEO, HQ, Revenue, Founded, No. of Employees, Company Type, Website, Business Segment)
Table 98 Sky Greens: Product Benchmarking
Table 99 Plenty Key Details, (CEO, HQ, Revenue, Founded, No. of Employees, Company Type, Website, Business Segment)
Table 100 Plenty: Product Benchmarking
Table 101 Plenty: Strategic Outlook
Table 102 SPREAD Co Ltd Key Details, (CEO, HQ, Revenue, Founded, No. of Employees, Company Type, Website, Business Segment)
Table 103 SPREAD Co Ltd: Product Benchmarking
Table 104 SPREAD Co Ltd: Strategic Outlook
Table 105 Valoya Key Details, (CEO, HQ, Revenue, Founded, No. of Employees, Company Type, Website, Business Segment)
Table 106 Valoya: Product Benchmarking
Table 107 Valoya: Strategic Outlook
Table 108 OSRAM Licht AG Key Details, (CEO, HQ, Revenue, Founded, No. of Employees, Company Type, Website, Business Segment)
Table 109 OSRAM Licht AG: Product Benchmarking
Table 110 OSRAM Licht AG: Strategic Outlook
Table 111 Bowery FarmingKey Details, (CEO, HQ, Revenue, Founded, No. of Employees, Company Type, Website, Business Segment)
Table 112 Bowery Farming: Product Benchmarking
Table 113 Bowery Farming: Strategic Outlook
Table 114 BrightFarms Key Details, (CEO, HQ, Revenue, Founded, No. of Employees, Company Type, Website, Business Segment)
Table 115 Bright farms: Product Benchmarking
Table 116 Infarm Key Details, (CEO, HQ, Revenue, Founded, No. of Employees, Company Type, Website, Business Segment)
Table 117 Infarm: Product Benchmarking
Table 118 Infarm: Strategic Outlook
Table 119 Gotham Greens Key Details, (CEO, HQ, Revenue, Founded, No. of Employees, Company Type, Website, Business Segment)
Table 120 Gotham Greens: Product Benchmarking
Table 121 Vertical Harvest Key Details, (CEO, HQ, Revenue, Founded, No. of Employees, Company Type, Website, Business Segment)
Table 122 Vertical Harvest: Product Benchmarking
Table 123 Vertical Harvest: Strategic Outlook
Table 124 Urban Crop Solutions Key Details, (CEO, HQ, Revenue, Founded, No. of Employees, Company Type, Website, Business Segment)
Table 125 Urban Crop Solutions: Product Benchmarking
Table 126 Urban Crop Solutions: Strategic Outlook
Table 127 Farm.One Key Details, (CEO, HQ, Revenue, Founded, No. of Employees, Company Type, Website, Business Segment)
Table 128 Farm.One: Product Benchmarking
Table 129 Farm One: Strategic Outlook
List of Figures
Figure 1 Vertical Farming Market Segmentation
Figure 2 Vertical Farming Market by Component: Market Attractiveness Index
Figure 3 Vertical Farming Market by Type: Market Attractiveness Index
Figure 4 Vertical Farming Market by Services: Market Attractiveness Index
Figure 5 Vertical Farming Market by Hardware: Market Attractiveness Index
Figure 6 Vertical Farming Market Attractiveness Index by Region
Figure 7 Vertical Farming Market: Market Dynamics
Figure 8 Global Vertical Farming Market Share Forecast by COVID, 2023-2033 (%)
Figure 9 Global Vertical Farming Market Forecast, 2023-2033 (US$ Bn, AGR (%)) (V-Shaped Recovery Scenario)
Figure 10 Global Vertical Farming Market by Region, 2023-2033 (US$ Bn, AGR (%)) (V-Shaped Recovery Scenario)
Figure 11 Global Vertical Farming Market Forecast, 2023-2033 (US$ Bn, AGR (%)) (W-Shaped Recovery Scenario)
Figure 12 Global Vertical Farming Market by Region, 2023-2033 (US$ Bn, AGR (%)) (W-Shaped Recovery Scenario)
Figure 13 Global Vertical Farming Market Forecast, 2023-2033 (US$ Bn, AGR (%)) (U-Shaped Recovery Scenario)
Figure 14 Global Vertical Farming Market by Region, 2023-2033 (US$ Bn, AGR (%)) (U-Shaped Recovery Scenario)
Figure 15 Global Vertical Farming Market Forecast, 2023-2033 (US$ Bn, AGR (%)) (L-Shaped Recovery Scenario)
Figure 16 Global Vertical Farming Market by Region, 2023-2033 (US$ Bn, AGR (%)) (L-Shaped Recovery Scenario)
Figure 17 Vertical Farming Market: Porter’s Five Forces Analysis
Figure 18 Vertical Farming Market: PEST Analysis
Figure 19 Vertical Farming Market by Component: Market Attractiveness Index
Figure 20 Global Vertical Farming Market by Component, 2023-2033 (US$ Bn, AGR (%))
Figure 21 Global Vertical Farming Market Share Forecast by Component, 2023-2033 (%)
Figure 22 Hardware Market by Region, 2023-2033 (US$ Bn, AGR (%))
Figure 23 Component Segment Market Share Forecast by Region, 2023 & 2033 (%)
Figure 24 Software Market by Region, 2023-2033 (US$ Bn, AGR (%))
Figure 25 Component Segment Market Share Forecast by Region, 2023 & 2033 (%)
Figure 26 Services Market by Region, 2023-2033 (US$ Bn, AGR (%))
Figure 27 Component Segment Market Share Forecast by Region, 2023 & 2033 (%)
Figure 28 Vertical Farming Market by Type: Market Attractiveness Index
Figure 29 Global Vertical Farming Market by Type, 2023-2033 (US$ Bn, AGR (%))
Figure 30 Global Vertical Farming Market Share Forecast by Type, 2023-2033 (%)
Figure 31 Despommier Skyscrapers Market by Region, 2023-2033 (US$ Bn, AGR (%))
Figure 32 Type Segment Market Share Forecast by Region, 2023 & 2033 (%)
Figure 33 Mixed Use Skyscrapers Market by Region, 2023-2033 (US$ Bn, AGR (%))
Figure 34 Type Segment Market Share Forecast by Region, 2023 & 2033 (%)
Figure 35 Stackable Shipping Containers Market by Region, 2023-2033 (US$ Bn, AGR (%))
Figure 36 Type Segment Market Share Forecast by Region, 2023 & 2033 (%)
Figure 37 Other Type Market by Region, 2023-2033 (US$ Bn, AGR (%))
Figure 38 Type Segment Market Share Forecast by Region, 2023 & 2033 (%)
Figure 39 Vertical Farming Market by Services: Market Attractiveness Index
Figure 40 Global Vertical Farming Market by Services, 2023-2033 (US$ Bn, AGR (%))
Figure 41 Global Vertical Farming Market Share Forecast by Services, 2023-2033 (%)
Figure 42 System Installation & Integration Market by Region, 2023-2033 (US$ Bn, AGR (%))
Figure 43 Services Segment Market Share Forecast by Region, 2023 & 2033 (%)
Figure 44 Consulting Services Market by Region, 2023-2033 (US$ Bn, AGR (%))
Figure 45 Services Segment Market Share Forecast by Region, 2023 & 2033 (%)
Figure 46 Managed Services Market by Region, 2023-2033 (US$ Bn, AGR (%))
Figure 47 Services Segment Market Share Forecast by Region, 2023 & 2033 (%)
Figure 48 Assisted Professional Services Market by Region, 2023-2033 (US$ Bn, AGR (%))
Figure 49 Services Segment Market Share Forecast by Region, 2023 & 2033 (%)
Figure 50 Other Services Market by Region, 2023-2033 (US$ Bn, AGR (%))
Figure 51 Services Segment Market Share Forecast by Region, 2023 & 2033 (%)
Figure 52 Vertical Farming Market by Hardware: Market Attractiveness Index
Figure 53 Global Vertical Farming Market by Hardware, 2023-2033 (US$ Bn, AGR (%))
Figure 54 Global Vertical Farming Market Share Forecast by Hardware, 2023-2033 (%)
Figure 55 Lighting Market by Region, 2023-2033 (US$ Bn, AGR (%))
Figure 56 Hardware Segment Market Share Forecast by Region, 2023 & 2033 (%)
Figure 57 Hydroponic Components Market by Region, 2023-2033 (US$ Bn, AGR (%))
Figure 58 Hardware Segment Market Share Forecast by Region, 2023 & 2033 (%)
Figure 59 Climate Control Market by Region, 2023-2033 (US$ Bn, AGR (%))
Figure 60 Hardware Segment Market Share Forecast by Region, 2023 & 2033 (%)
Figure 61 Sensors Market by Region, 2023-2033 (US$ Bn, AGR (%))
Figure 62 Hardware Segment Market Share Forecast by Region, 2023 & 2033 (%)
Figure 63 Irrigation Systems Market by Region, 2023-2033 (US$ Bn, AGR (%))
Figure 64 Hardware Segment Market Share Forecast by Region, 2023 & 2033 (%)
Figure 65 Other Hardware Market by Region, 2023-2033 (US$ Bn, AGR (%))
Figure 66 Hardware Segment Market Share Forecast by Region, 2023 & 2033 (%)
Figure 67 Vertical Farming Market Forecast by Region 2023 and 2033 (Revenue, CAGR%)
Figure 68 Global Vertical Farming Market Forecast, 2023-2033 (US$ Bn, AGR (%))
Figure 69 Global Vertical Farming Market Share Forecast by Region, 2023-2033 (%)
Figure 70 Global Vertical Farming Market by Region, 2023-2033 (US$ Bn, AGR (%))
Figure 71 Global Vertical Farming Market by Component, 2023-2033 (US$ Bn, AGR (%))
Figure 72 Global Vertical Farming Market by Type, 2023-2033 (US$ Bn, AGR (%))
Figure 73 Global Vertical Farming Market by Services, 2023-2033 (US$ Bn, AGR (%))
Figure 74 Global Vertical Farming Market by Hardware, 2023-2033 (US$ Bn, AGR (%))
Figure 75 North America Vertical Farming Market Attractiveness Index
Figure 76 North America Vertical Farming Market by Region, 2023, 2028 & 2033 (US$ Billion)
Figure 77 North America Vertical Farming Market by Value, 2023-2033 (US$ Bn, AGR (%))
Figure 78 North America Vertical Farming Market by Country, 2023-2033 (US$ Bn, AGR (%))
Figure 79 North America Vertical Farming Market Share Forecast by Country, 2023-2033 (%)
Figure 80 North America Vertical Farming Market by Component, 2023-2033 (US$ Bn, AGR (%))
Figure 81 North America Vertical Farming Market Share Forecast by Component, 2023-2033 (%)
Figure 82 North America Vertical Farming Market by Type, 2023-2033 (US$ Bn, AGR (%))
Figure 83 North America Vertical Farming Market Share Forecast by Type, 2023-2033 (%)
Figure 84 North America Vertical Farming Market by Services, 2023-2033 (US$ Bn, AGR (%))
Figure 85 North America Vertical Farming Market Share Forecast by Services, 2023-2033 (%)
Figure 86 North America Vertical Farming Market by Hardware, 2023-2033 (US$ Bn, AGR (%))
Figure 87 North America Vertical Farming Market Share Forecast by Hardware, 2023-2033 (%)
Figure 88 US Vertical Farming Market by Value, 2023-2033 (US$ Bn, AGR (%))
Figure 89 Canada Vertical Farming Market by Value, 2023-2033 (US$ Bn, AGR (%))
Figure 90 Europe Vertical Farming Market Attractiveness Index
Figure 91 Europe Vertical Farming Market by Region, 2023, 2028 & 2033 (US$ Billion)
Figure 92 Europe Vertical Farming Market by Value, 2023-2033 (US$ Bn, AGR (%))
Figure 93 Europe Vertical Farming Market by Country, 2023-2033 (US$ Bn, AGR (%))
Figure 94 Europe Vertical Farming Market Share Forecast by Country, 2023-2033 (%)
Figure 95 Europe Vertical Farming Market by Component, 2023-2033 (US$ Bn, AGR (%))
Figure 96 Europe Vertical Farming Market Share Forecast by Component, 2023-2033 (%)
Figure 97 Europe Vertical Farming Market by Type, 2023-2033 (US$ Bn, AGR (%))
Figure 98 Europe Vertical Farming Market Share Forecast by Type, 2023-2033 (%)
Figure 99 Europe Vertical Farming Market by Services, 2023-2033 (US$ Bn, AGR (%))
Figure 100 Europe Vertical Farming Market Share Forecast by Services, 2023-2033 (%)
Figure 101 Europe Vertical Farming Market by Hardware, 2023-2033 (US$ Bn, AGR (%))
Figure 102 Germany Vertical Farming Market by Value, 2023-2033 (US$ Bn, AGR (%))
Figure 103 UK Vertical Farming Market by Value, 2023-2033 (US$ Bn, AGR (%))
Figure 104 France Vertical Farming Market by Value, 2023-2033 (US$ Bn, AGR (%))
Figure 105 Italy Vertical Farming Market by Value, 2023-2033 (US$ Bn, AGR (%))
Figure 106 Russia Vertical Farming Market by Value, 2023-2033 (US$ Bn, AGR (%))
Figure 107 Rest of Europe Vertical Farming Market by Value, 2023-2033 (US$ Bn, AGR (%))
Figure 108 Asia-Pacific Vertical Farming Market Attractiveness Index
Figure 109 Asia-Pacific Vertical Farming Market by Region, 2023, 2028 & 2033 (US$ Billion)
Figure 110 Asia-Pacific Vertical Farming Market by Value, 2023-2033 (US$ Bn, AGR (%))
Figure 111 Asia-Pacific Vertical Farming Market by Country, 2023-2033 (US$ Bn, AGR (%))
Figure 112 Asia-Pacific Vertical Farming Market by Component, 2023-2033 (US$ Bn, AGR (%))
Figure 113 Asia-Pacific Vertical Farming Market Share Forecast by Component, 2023-2033 (%)
Figure 114 Asia-Pacific Vertical Farming Market by Type, 2023-2033 (US$ Bn, AGR (%))
Figure 115 Asia-Pacific Vertical Farming Market Share Forecast by Type, 2023-2033 (%)
Figure 116 Asia-Pacific Vertical Farming Market by Services, 2023-2033 (US$ Bn, AGR (%))
Figure 117 Asia-Pacific Vertical Farming Market Share Forecast by Services, 2023-2033 (%)
Figure 118 Asia-Pacific Vertical Farming Market by Hardware, 2023-2033 (US$ Bn, AGR (%))
Figure 119 Asia-Pacific Vertical Farming Market Share Forecast by Hardware, 2023-2033 (%)
Figure 120 China Vertical Farming Market by Value, 2023-2033 (US$ Bn, AGR (%))
Figure 121 India Vertical Farming Market by Value, 2023-2033 (US$ Bn, AGR (%))
Figure 122 Japan Vertical Farming Market by Value, 2023-2033 (US$ Bn, AGR (%))
Figure 123 South Korea Vertical Farming Market by Value, 2023-2033 (US$ Bn, AGR (%))
Figure 124 Australia Vertical Farming Market by Value, 2023-2033 (US$ Bn, AGR (%))
Figure 125 Rest of Asia-Pacific Vertical Farming Market by Value, 2023-2033 (US$ Bn, AGR (%))
Figure 126 Middle East & Africa Vertical Farming Market Attractiveness Index
Figure 127 Middle East & Africa Vertical Farming Market by Region, 2023, 2028 & 2033 (US$ Billion)
Figure 128 Middle East & Africa Vertical Farming Market by Value, 2023-2033 (US$ Bn, AGR (%))
Figure 129 Middle East & Africa Vertical Farming Market by Country, 2023-2033 (US$ Bn, AGR (%))
Figure 130 Middle East & Africa Vertical Farming Market by Component, 2023-2033 (US$ Bn, AGR (%))
Figure 131 Middle East & Africa Vertical Farming Market Share Forecast by Component, 2023-2033 (%)
Figure 132 Middle East & Africa Vertical Farming Market by Type, 2023-2033 (US$ Bn, AGR (%))
Figure 133 Middle East & Africa Vertical Farming Market Share Forecast by Type, 2023-2033 (%)
Figure 134 Middle East & Africa Vertical Farming Market by Services, 2023-2033 (US$ Bn, AGR (%))
Figure 135 Middle East & Africa Vertical Farming Market Share Forecast by Services, 2023-2033 (%)
Figure 136 Middle East & Africa Vertical Farming Market by Hardware, 2023-2033 (US$ Bn, AGR (%))
Figure 137 Middle East & Africa Vertical Farming Market Share Forecast by Hardware, 2023-2033 (%)
Figure 138 GCC Vertical Farming Market by Value, 2023-2033 (US$ Bn, AGR (%))
Figure 139 South Africa Vertical Farming Market by Value, 2023-2033 (US$ Bn, AGR (%))
Figure 140 Rest of Middle East & Africa Vertical Farming Market by Value, 2023-2033 (US$ Bn, AGR (%))
Figure 141 Latin America Vertical Farming Market Attractiveness Index
Figure 142 Latin America Vertical Farming Market by Region, 2023, 2028 & 2033 (US$ Billion)
Figure 143 Latin America Vertical Farming Market by Value, 2023-2033 (US$ Bn, AGR (%))
Figure 144 Latin America Vertical Farming Market by Country, 2023-2033 (US$ Bn, AGR (%))
Figure 145 Latin America Vertical Farming Market by Component, 2023-2033 (US$ Bn, AGR (%))
Figure 146 Latin America Vertical Farming Market Share Forecast by Component, 2023-2033 (%)
Figure 147 Latin America Vertical Farming Market by Type, 2023-2033 (US$ Bn, AGR (%))
Figure 148 Latin America Vertical Farming Market Share Forecast by Type, 2023-2033 (%)
Figure 149 Latin America Vertical Farming Market by Services, 2023-2033 (US$ Bn, AGR (%))
Figure 150 Latin America Vertical Farming Market Share Forecast by Services, 2023-2033 (%)
Figure 151 Latin America Vertical Farming Market by Hardware, 2023-2033 (US$ Bn, AGR (%))
Figure 152 Latin America Vertical Farming Market Share Forecast by Hardware, 2023-2033 (%)
Figure 153 Brazil Vertical Farming Market by Value, 2023-2033 (US$ Bn, AGR (%))
Figure 154 Mexico Vertical Farming Market by Value, 2023-2033 (US$ Bn, AGR (%))
Figure 155 Rest of Latin America Vertical Farming Market by Value, 2023-2033 (US$ Bn, AGR (%))
Figure 156 Vertical Farming Market: Company Share, 2022
Figure 157 Signify Holding B.V: Net Revenue, 2018-2022 (US$ Million, AGR%)
Figure 158 Signify Holding B.V: R&D, 2018-2022 (US$ Million, AGR%)
Figure 159 Signify Holding B.V: Regional Revenue Share, 2022 (%)
Figure 160 Signify Holding B.V: Business Segment Revenue Share, 2022 (%)
ページTOPに戻る
Visiongain社の食品と農業分野での最新刊レポート
本レポートと同じKEY WORD(farming)の最新刊レポート
よくあるご質問
Visiongain社はどのような調査会社ですか?
英国の調査会社ヴィジョンゲイン社(Visiongain)は、通信とエネルギーのほか、自動車や化学・医薬品、金属など、広範な市場を対象に調査を行っています。自動車市場については、市場全般に関する調査のほ... もっと見る
調査レポートの納品までの日数はどの程度ですか?
在庫のあるものは速納となりますが、平均的には 3-4日と見て下さい。
但し、一部の調査レポートでは、発注を受けた段階で内容更新をして納品をする場合もあります。
発注をする前のお問合せをお願いします。
注文の手続きはどのようになっていますか?
1)お客様からの御問い合わせをいただきます。
2)見積書やサンプルの提示をいたします。
3)お客様指定、もしくは弊社の発注書をメール添付にて発送してください。
4)データリソース社からレポート発行元の調査会社へ納品手配します。
5) 調査会社からお客様へ納品されます。最近は、pdfにてのメール納品が大半です。
お支払方法の方法はどのようになっていますか?
納品と同時にデータリソース社よりお客様へ請求書(必要に応じて納品書も)を発送いたします。
お客様よりデータリソース社へ(通常は円払い)の御振り込みをお願いします。
請求書は、納品日の日付で発行しますので、翌月最終営業日までの当社指定口座への振込みをお願いします。振込み手数料は御社負担にてお願いします。
お客様の御支払い条件が60日以上の場合は御相談ください。
尚、初めてのお取引先や個人の場合、前払いをお願いすることもあります。ご了承のほど、お願いします。
データリソース社はどのような会社ですか?
当社は、世界各国の主要調査会社・レポート出版社と提携し、世界各国の市場調査レポートや技術動向レポートなどを日本国内の企業・公官庁及び教育研究機関に提供しております。
世界各国の「市場・技術・法規制などの」実情を調査・収集される時には、データリソース社にご相談ください。
お客様の御要望にあったデータや情報を抽出する為のレポート紹介や調査のアドバイスも致します。
|
|

