水素生成市場レポート 2024-2034
Hydrogen Generation Market Report 2024-2034
レポート詳細
水素生成市場レポート 2024-2034 :この調査レポートは、業界とその基礎となる原動力をより良く理解することを望むなら、新たな収益ポケットを目指す大手企業にとって貴重なものとなる... もっと見る
※上記価格は部署ライセンス(Departmental licence)価格です。
その他の価格についてはデータリソースまでお問合せください。
日本語のページは自動翻訳を利用し作成しています。
実際のレポートは英文のみでご納品いたします。
サマリー
レポート詳細
水素生成市場レポート 2024-2034:この調査レポートは、業界とその基礎となる原動力をより良く理解することを望むなら、新たな収益ポケットを目指す大手企業にとって貴重なものとなるでしょう。異業種への進出や新規地域での既存事業の拡大を目指す企業にも有用です。
グリーン水素経済における技術の進歩
現在のグリーン水素製造革命を加速させる技術開発は、グリーン水素分野の商機と密接に関係している。斬新で独創的な技術の出現は、市場を大きく拡大させる見込みがある。より経済的で効率的な電解技術の創出は、グリーン水素の生成に直接影響する重要な道筋である。プロトン交換膜(PEM)やアルカリシステム電解技術は、拡張性が高くエネルギー効率が高いため、ますます普及している。
さらに、太陽エネルギー・システムや風力エネルギー・システム、その他の再生可能エネルギー技術の向上により、水素合成のための、よりクリーンで持続可能なエネルギー源が利用可能になっている。グリーン水素製造の費用対効果と全体的な効率は、デジタル技術と人工知能の統合による電解操作の最適化によってさらに向上する。
遅れている低公害水素投資への政策支援
新たな水素プロジェクトに対する関心は依然として高いが、投資を呼び込むためには、厳しい経済環境を踏まえ、迅速な法整備が必要である。金融優遇措置の実施が遅れていることや、プロジェクト遅延の脅威となるコスト制約があるにもかかわらず、低排出ガス水素への関心は高まっている。しかし、計画されているプロジェクトがすべて実現し、さらに普及促進策が講じられれば、2030年までに生産量を大幅に増加させることは可能である。
市場調査レポートを購入する前にすべき質問とは?
-
水素生成市場はどのように進化しているのか?
-
水素生成市場の推進要因と阻害要因は何か?
-
各水素生成サブマーケットセグメントは予測期間中にどのように成長し、2034年にどれくらいの売上を占めるのか?
-
2023年から2034年にかけて、各水素生成サブマーケットの市場シェアはどのように推移するのか?
-
2024年から2034年までの市場全体の主な牽引役は何か?
-
主要な水素生成市場はマクロ経済の動きに概ね追随するのか、それとも個々の国市場が他を凌駕するのか?
-
2034年までに各国市場のシェアはどう変化し、2034年に市場をリードするのはどの地域か?
-
主要プレーヤーは誰で、予測期間中の見通しは?
-
これらの大手企業の水素生成プロジェクトとは?
-
2024年から2034年の間に、業界はどのように進化するのか?現在および今後10年間に実施される水素生成プロジェクトにはどのような意味があるのか?
-
水素生成市場をさらに拡大するために、製品の商業化の必要性は高まっているのか?
-
水素生成市場はどこへ向かい、どのようにすれば市場の最前線に立つことができるのか?
このことが、現在、そして今後10年間の水素生成市場にどのような影響を与えるかを見極める必要がある:
-
296ページにわたるレポートには、116の表と171の図表が掲載されている。
-
このレポートでは、業界の主要な収益分野に焦点を当てているため、今すぐそこにターゲットを絞ることができます。
-
世界、地域、国の売上高と成長に関する詳細な分析が含まれている。
-
競合他社が成功した主なトレンド、変化、収益予測をハイライトします。
本レポートは、今後10年間、COVID-19の景気後退と好転の変動に合わせて、水素生成市場がどのように発展するかをTODAYでお伝えする。この市場は、過去10年間のどの時 点よりも今が重要である。
2034年までの予測やその他の分析から、商業的な展望が明らかになる
-
2034年までの収益予測に加え、最近の実績、成長率、市場シェアも提供している。
-
ビジネスの展望や展開など、独自の分析が掲載されている。
-
質的分析(市場ダイナミクス、促進要因、機会、阻害要因、課題を含む)、ポーターズファイブフォース分析、PEST分析、最近の動向をご覧いただけます。
レポート対象セグメント
供給モードの展望
ソースの展望
技術の展望
-
水蒸気改質
-
部分酸化
-
オートサーマルリフォーミング
-
石炭ガス化
-
電解
用途の展望
-
石油精製
-
交通
-
アンモニア生産
-
メタノール生産
-
発電
-
その他の産業
世界市場全体と各分野の売上予測に加え、5つの地域と16の主要国市場の売上予測も掲載しています:
北米
欧州
アジア太平洋
ラテンアメリカ
中東・アフリカ
また、2024年から2034年までの水素生成市場における主要企業のプロファイルも掲載している。
報告書に掲載されている主要企業
-
Shell plc
-
Mitsubishi Heavy Industries
-
Air Liquide
-
Siemens Energy AG
-
Engie SA
-
Linde Plc
-
Aramco
-
Air Products
-
Chevron Corporation
-
Ørsted
-
Messer Group
-
Equinor
-
ExxonMobil
-
BP
-
Iwatani Corporation
2024年から2034年までの水素生成市場全体の売上高は、金額ベースで2023年に1,600億米ドルを突破した。2033年まで力強い収益成長が予測される。当研究所では、最も大きな可能性を秘めた企業を特定しています。彼らの能力、進歩、商業的展望を発見し、あなたが一歩先を行くのを支援します。
2024年から2034年までの水素生成市場」市場レポートはどのようにお役に立ちますか?
要約すると、290ページを超えるこのレポートは、以下の知識を提供する:
-
水素生成市場の2024年から2034年までの収益と数量予測 用途、供給源、技術、供給モード、世界および地域レベルの各予測 - 業界の展望を発見し、投資と収益に最も有利な場所を見つけます。
-
5つの地域と16の主要国市場の2034年までの収益と数量予測 - 北米、欧州、アジア太平洋、中南米、中東・アフリカの水素生成市場2024年から2034年までの予測をご覧ください。
-
既存企業および市場参入を目指す企業の展望 - 水素生成市場に関わる主要企業15社の企業プロファイルを掲載。
独自の予測による定量的・定性的分析をご覧ください。私たちのレポートだけに含まれる情報を入手し、貴重なビジネスインテリジェンスで情報を得ることができます。
他にはない情報
私たちの新しいレポートがあれば、知識に遅れをとったり、チャンスを逃したりする可能性が低くなります。弊社の調査レポートが貴社の調査、分析、意思決定にどのように役立つかをご覧ください。Visiongainの調査は、水素生成市場、2024年から2034年、市場をリードする企業の商業分析を必要とするすべての人のためのものです。データ、トレンド、予測をご覧いただけます。
ページTOPに戻る
目次
目次
1 レポート概要
1.1 研究の目的
1.2 水素生成市場の紹介
1.3 本レポートの内容
1.4 本レポートを読むべき理由
1.5 本分析レポートが回答する主な質問
1.6 本レポートは誰のためのものか?
1.7 方法論
1.7.1 市場の定義
1.7.2 市場評価・予測手法
1.7.3 データの検証
1.7.3.1 一次調査
1.7.3.2 セカンダリーリサーチ
1.8 よくある質問(FAQ)
1.9 Visiongainの関連レポート
1.10 Visiongainについて
2 エグゼクティブ・サマリー
3 市場概要
3.1 主要な調査結果
3.2 市場ダイナミクス
3.2.1 市場促進要因
3.2.1.1 温室効果ガス排出規制の強化
3.2.1.2 低排出ガス燃料への需要の高まり
3.2.1.3 様々なエンドユーザー産業におけるグリーン水素需要の拡大
3.2.2 市場抑制要因
3.2.2.1 従来のエネルギーオプションよりも高いコスト
3.2.2.2 低排出水素投資に対する政策支援の遅れ
3.2.2.3 グリーン水素の将来の需要は保証されていない
3.2.3 市場機会
3.2.3.1 再生可能エネルギーの台頭促進
3.2.3.2 季節的な長期エネルギー貯蔵オプションとしての水素
3.2.3.3 グリーン水素経済における技術進歩
3.3 COVID-19影響分析
3.4 ポーターのファイブフォース分析
3.4.1 サプライヤーの交渉力(中)
3.4.2 買い手の交渉力(中)
3.4.3 競争上のライバル(高)
3.4.4 代替品による脅威(低~中)
3.4.5 新規参入企業の脅威(低 - 中)
4 水素生成市場分析:ソース別
4.1 主な調査結果
4.2 水源セグメント 市場魅力度指数
4.3 水素生成の発生源別市場規模推定と予測
4.4 ブルー水素
4.4.1 BPはティーサイドのBlue HydrogenプロジェクトにBASFの炭素回収技術を採用
4.4.2 Air Products社が欧州最大のBlue Hydrogenプラントを建設へ
4.4.3 2024-2034年の地域別市場規模(US$ Billion)
4.4.4 地域別市場シェア、2024年・2034年(%)
4.5 灰色水素
4.5.1 2024〜2034年の地域別市場規模(US$ Billion)
4.5.2 地域別市場シェア、2024年・2034年(%)
4.6 グリーン水素
4.6.1 世界最大のグリーン水素プロジェクトが中国で生産を開始
4.6.2 2024~2034年の地域別市場規模(US$ Billion)
4.6.3 地域別市場シェア、2024年・2034年(%)
5 水素生成市場分析:供給モード別
5.1 主要な調査結果
5.2 配送モードセグメント市場魅力度指数
5.3 水素生成の供給モード別市場規模の推定と予測
5.4 キャプティブ
5.4.1 地域別市場規模、2024~2034年(10億米ドル)
5.4.2 地域別市場シェア、2024年・2034年(%)
5.5 マーチャント
5.5.1 地域別市場規模、2024年~2034年(10億米ドル)
5.5.2 地域別市場シェア、2024年・2034年(%)
6 水素生成市場分析:技術別
6.1 主要な調査結果
6.2 技術セグメント 市場魅力度指数
6.3 技術別の水素生成市場規模の推定と予測
6.4 水蒸気改質
6.4.1 ロールス・ロイスSMRを用いた水素製造を研究するパートナー
6.4.2 2024〜2034年の地域別市場規模(US$ Billion)
6.4.3 地域別市場シェア、2024年・2034年(%)
6.5 部分酸化
6.5.1 2024〜2034年の地域別市場規模(US$ Billion)
6.5.2 地域別市場シェア、2024年・2034年(%)
6.6 オートサーマルリフォーミング
6.6.1 2024〜2034年の地域別市場規模(US$ Billion)
6.6.2 地域別市場シェア、2024年・2034年(%)
6.7 石炭ガス化
6.7.1 2024~2034年の地域別市場規模(US$ Billion)
6.7.2 地域別市場シェア、2024年・2034年(%)
6.8 電解
6.8.1 旭化成、アルカリイオン水電解パイロットプラントの建設を開始
6.8.2 グルジアで電解液体水素プラントが生産開始
6.8.3 2024〜2034年の地域別市場規模(US$ Billion)
6.8.4 地域別市場シェア、2024年・2034年(%)
7 水素生成市場分析:用途別
7.1 主要な調査結果
7.2 用途別セグメント市場魅力度指数
7.3 用途別水素生成市場規模の推定と予測
7.4 石油精製
7.4.1 TotalEnergies、石油精製所でのグリーン水素利用で合意
7.4.2 2024〜2034年の地域別市場規模(US$ Billion)
7.4.3 地域別市場シェア、2024年・2034年(%)
7.5 輸送
7.5.1 EUは水素輸送に12億ユーロを投じた
7.5.2 2024~2034年の地域別市場規模(US$ Billion)
7.5.3 地域別市場シェア、2024年・2034年(%)
7.6 アンモニア生産
7.6.1 日本と韓国は水素とアンモニアのサプライチェーンを構築する
7.6.2 伊藤忠商事がグリーンアンモニアプロジェクトで協業を発表
7.6.3 2024~2034年の地域別市場規模(US$ Billion)
7.6.4 地域別市場シェア、2024年・2034年(%)
7.7 メタノール生産
7.7.1 謎のデベロッパーがブルー水素からメタノール製造プラントに30億ドル以上を投じる計画を発表
7.7.2 2024~2034年の地域別市場規模(US$ Billion)
7.7.3 地域別市場シェア、2024年・2034年(%)
7.8 発電
7.8.1 発電所で水素を混焼する日本
7.8.2 ドイツ、水素対応ガス火力発電所に160億ユーロを投資
7.8.3 地域別市場規模、2024年~2034年(US$ Billion)
7.8.4 地域別市場シェア、2024年・2034年(%)
7.9 その他の用途
7.9.1 地域別市場規模、2024~2034年(US$ Billion)
7.9.2 地域別市場シェア、2024年・2034年(%)
8 水素生成市場分析:地域別
8.1 主要な調査結果
8.2 地域別市場規模の推定と予測
9 北米の水素生成市場分析
9.1 主要な調査結果
9.2 北米の水素生成市場魅力度指数
9.3 北米の水素生成市場の国別推移(2024年、2029年、2034年)(US$ Billion
9.4 北米の水素生成市場規模推定と予測:国別
9.5 北米の水素生成市場規模推定と予測:ソース別
9.6 北米の水素生成市場規模推定と予測:供給モード別
9.7 北米の水素生成市場規模推定と予測:技術別
9.8 北米の水素生成市場規模推定と予測:用途別
9.9 米国の水素生成市場分析
9.9.1 北米最大のグリーン水素プラントがカリフォルニア州で稼働開始
9.9.2 デュークエナジー社がフロリダ州で燃焼タービン式グリーン水素の建設・運営計画を発表
9.10 カナダの水素生成市場分析
9.10.1 カナダ、北米初のグリーン水素製造プラントを承認
9.10.2 アトランティック・カナダ、2025年に2つのグリーン水素プロジェクトの開始を目標
10 欧州の水素生成市場分析
10.1 主要な調査結果
10.2 欧州水素生成市場魅力度指数
10.3 欧州の水素生成国別市場、2024年、2029年、2034年(US$ Billion)
10.4 欧州の水素生成市場規模推定と予測:国別
10.5 欧州の水素生成市場規模推定と予測:ソース別
10.6 欧州の水素生成市場規模推定と予測:供給モード別
10.7 欧州の水素生成市場規模推定と予測:技術別
10.8 欧州の水素生成市場規模推定と予測:用途別
10.9 ドイツの水素生成市場分析
10.9.1 Lhyfe社がドイツで10MWの水素発電所を起工
10.10 オランダの水素生成市場分析
10.10.1 オランダに世界最大のグリーン水素プラントが建設される
10.11 ポーランドの水素生成市場分析
10.11.1 ポーランドに世界初の双方向水素製造施設がオープン
10.11.2 ハイドロジェンユートピア、ポーランドで廃棄物から水素製造プラントを稼働
10.12 イタリアの水素生成市場分析
10.12.1 Smartenergy社がイタリアのサルデーニャ島で200 Mweのグリーン水素プラントを開発
10.12.2 Axpo社がイタリアの主要グリーン水素プロジェクトに参画
10.13 フランスの水素生成市場分析
10.13.1 フランスで天然水素が発見される
10.13.2 フランス、2030年までに6.5GWの「低炭素電解水素」計画を発表
10.14 その他の欧州の水素生成市場分析
11 アジア太平洋地域の水素生成市場分析
11.1 主要な調査結果
11.2 アジア太平洋地域の水素生成市場魅力度指数
11.3 アジア太平洋地域の水素生成市場の国別市場規模、2024年、2029年、2034年(US$ Billion)
11.4 アジア太平洋地域の水素生成市場規模推定と予測:国別
11.5 アジア太平洋地域の水素生成市場規模推定と予測:ソース別
11.6 アジア太平洋地域の水素生成市場規模推定と予測:供給モード別
11.7 アジア太平洋地域の水素生成市場規模推定と予測:技術別
11.8 アジア太平洋地域の水素生成市場規模推定と予測:用途別
11.9 中国の水素生成市場分析
11.9.1 中国のグリーン水素新時代
11.9.2 中国シノペック、新疆で初のグリーン水素プラントを始動
11.10 インド水素生成市場分析
11.10.1 Scindia、Jindal Stainless初のグリーン水素プラントを発足へ
11.10.2 同国におけるグリーン水素の導入状況
11.11 日本の水素生成市場分析
11.11.1 日本最大の洋上風力水素プラントが稼働開始へ
11.11.2 日本はクリーン水素補助金を配分する
11.12 韓国の水素生成市場分析
11.12.1 SK E&Sとパートナー、韓国最大の低炭素水素プラント建設を目指す
11.12.2 韓国は6つの水素都市を創設する
11.13 オーストラリアの水素生成市場分析
11.13.1 日揮、オーストラリアで水素プロジェクトのEPCを受注
11.13.2 オーストラリアン・ガス・ネットワークス - HypSA
11.13.3 トラフィグラ・グループ - ポートピリー・グリーン水素プロジェクト
11.14 その他のアジア太平洋地域の水素生成市場分析
12 ラテンアメリカの水素生成市場分析
12.1 主要な調査結果
12.2 ラテンアメリカの水素生成市場魅力度指数
12.3 ラテンアメリカの水素生成市場の国別推定、2024年、2029年、2034年(US$ Billion)
12.4 ラテンアメリカの水素生成市場規模推定と予測:国別
12.5 ラテンアメリカの水素生成市場規模推定と予測:ソース別
12.6 ラテンアメリカの水素生成市場規模推定と予測:供給モード別
12.7 ラテンアメリカの水素生成市場規模推定と予測:技術別
12.8 ラテンアメリカの水素生成市場規模推定と予測:用途別
12.9 ブラジルの水素生成市場分析
12.9.1 EU、ブラジルで10GWのグリーン水素プロジェクトを支援
12.9.2 ブラジル、36億ドルの水素製造計画を発表
12.10 メキシコの水素生成市場分析
12.11 その他のラテンアメリカの水素生成市場分析
13 中東・アフリカの水素生成市場分析
13.1 主要な調査結果
13.2 中東・アフリカの水素生成市場魅力度指数
13.3 中東・アフリカの水素生成市場の国別推定、2024年、2029年、2034年(US$ Billion)
13.4 中東・アフリカの水素生成市場規模推定と予測:国別
13.5 中東・アフリカの水素生成市場規模推定と予測:ソース別
13.6 中東・アフリカの水素生成市場規模推定と予測:供給モード別
13.7 中東・アフリカの水素生成市場規模推定と予測:技術別
13.8 中東・アフリカの水素生成市場規模推定と予測:用途別
13.9 GCCの水素生成市場分析
13.9.1 NEOMグリーン水素プロジェクト
13.9.2 UAE、2050年までに1500万トンのグリーン水素生産を目標
13.9.3 カタール、世界最大のアンモニアプラントを建設へ
13.10 南アフリカの水素生成市場分析
13.10.1 南アフリカのグリーン水素ビジョンと戦略
13.11 その他の中東・アフリカ地域の水素生成市場分析
14 主要企業のプロファイル
14.1 Shell plc
14.1.1 会社概要
14.1.2 会社概要
14.1.3 財務分析
14.1.3.1 純売上高、2018年~2023年
14.1.3.2 セグメント市場シェア、2023年
14.1.4 製品ベンチマーク
14.1.5 戦略的展望
14.2 Mitsubishi Heavy Industries, Ltd
14.2.1 会社概要
14.2.2 会社概要
14.2.3 財務分析
14.2.3.1 純収入、2018年~2023年
14.2.3.2 地域別市場シェア、2022年
14.2.3.3 セグメント市場シェア、2022年
14.2.4 製品ベンチマーク
14.2.5 戦略的展望
14.3 Air Liquide
14.3.1 会社概要
14.3.2 会社概要
14.3.3 財務分析
14.3.3.1 純収入、2018-2022年
14.3.3.2 地域市場シェア、2022年
14.3.3.3 セグメント市場シェア、2022年
14.3.4 製品ベンチマーク
14.3.5 戦略的展望
14.4 Siemens Energy AG
14.4.1 会社概要
14.4.2 会社概要
14.4.3 財務分析
14.4.3.1 純収入、2018-2022年
14.4.3.2 地域別市場シェア、2022年
14.4.3.3 セグメント市場シェア、2022年
14.4.4 製品ベンチマーク
14.4.5 戦略的展望
14.5 Engie SA
14.5.1 会社概要
14.5.2 会社概要
14.5.3 財務分析
14.5.3.1 純収入、2018年~2022年
14.5.3.2 セグメント市場シェア、2022年
14.5.4 製品ベンチマーク
14.5.5 戦略的展望
14.6 Linde Plc
14.6.1 会社概要
14.6.2 会社概要
14.6.3 財務分析
14.6.3.1 純収入、2018年~2022年
14.6.3.2 地域市場シェア、2022年
14.6.3.3 セグメント市場シェア、2022年
14.6.4 製品ベンチマーク
14.6.5 戦略的展望
14.7 Aramco
14.7.1 会社概要
14.7.2 会社概要
14.7.3 財務分析
14.7.3.1 純収入、2018-2022年
14.7.4 製品ベンチマーク
14.7.5 戦略的展望
14.8 Air Products
14.8.1 会社概要
14.8.2 会社概要
14.8.3 財務分析
14.8.3.1 純収入、2018年~2022年
14.8.3.2 地域市場シェア、2023年
14.8.4 製品ベンチマーク
14.8.5 戦略的展望
14.9 Chevron Corporation
14.9.1 会社概要
14.9.2 会社概要
14.9.3 財務分析
14.9.3.1 純収入、2018年~2022年
14.9.3.2 地域市場シェア、2022年
14.9.3.3 セグメント市場シェア、2022年
14.9.4 製品ベンチマーク
14.9.5 戦略的展望
14.10 Ørsted
14.10.1 会社概要
14.10.2 会社概要
14.10.3 財務分析
14.10.3.1 純収入(2018年~2023年
14.10.3.2 セグメント市場シェア、2023年
14.10.4 製品ベンチマーク
14.10.5 戦略的展望
14.11 Messer Group
14.11.1 会社概要
14.11.2 会社概要
14.11.3 製品ベンチマーク
14.11.4 戦略的展望
14.12 Equinor
14.12.1 会社概要
14.12.2 会社概要
14.12.3 財務分析
14.12.3.1 純収入、2018年~2022年
14.12.3.2 地域市場シェア、2022年
14.12.3.3 セグメント市場シェア、2022年
14.12.4 製品ベンチマーク
14.12.5 戦略的展望
14.13 ExxonMobil
14.13.1 会社概要
14.13.2 会社概要
14.13.3 財務分析
14.13.3.1 純収入、2018年~2022年
14.13.3.2 地域市場シェア、2022年
14.13.3.3 セグメント市場シェア、2022年
14.13.4 製品ベンチマーク
14.13.5 戦略的展望
14.14 BP
14.14.1 会社概要
14.14.2 会社概要
14.14.3 財務分析
14.14.3.1 純収入、2018年~2022年
14.14.3.2 セグメント市場シェア、2022年
14.14.4 製品ベンチマーク
14.14.5 戦略的展望
14.15 Iwatani Corporation
14.15.1 会社概要
14.15.2 会社概要
14.15.3 製品ベンチマーク
14.15.4 戦略的展望
15 結論と提言
15.1 Visiongainからの結びの言葉
15.2 推奨事項
ページTOPに戻る
図表リスト
表の一覧
Table 1 Hydrogen Generation Market Snapshot, 2024 & 2034 (US$ Billion, CAGR %)
Table 2 Hydrogen Generation Market Forecast by Region, 2024-2034 (US$ Billion, AGR%, CAGR%): “V” Shaped Recovery
Table 3 Hydrogen Generation Market Forecast by Region, 2024-2034 (US$ Billion, AGR%, CAGR%): “U” Shaped Recovery
Table 4 Hydrogen Generation Market Forecast by Region, 2024-2034 (US$ Billion, AGR%, CAGR%): “W” Shaped Recovery
Table 5 Hydrogen Generation Market Forecast by Region, 2024-2034 (US$ Billion, AGR%, CAGR%): “L” Shaped Recovery
Table 6 Hydrogen Generation Market Forecast by Source, 2024-2034 (US$ Billion, AGR%, CAGR%)
Table 7 Blue Hydrogen Segment Market Forecast by Region, 2024-2034 (US$ Billion, AGR%, CAGR%)
Table 8 Gray Hydrogen Segment Market Forecast by Region, 2024-2034 (US$ Billion, AGR%, CAGR%)
Table 9 Green Hydrogen Segment Market Forecast by Region, 2024-2034 (US$ Billion, AGR%, CAGR%)
Table 10 Hydrogen Generation Market Forecast by Delivery Mode, 2024-2034 (US$ Billion, AGR%, CAGR%)
Table 11 Captive Segment Market Forecast by Region, 2024-2034 (US$ Billion, AGR%, CAGR%)
Table 12 Merchant Segment Market Forecast by Region, 2024-2034 (US$ Billion, AGR%, CAGR%)
Table 13 Hydrogen Generation Market Forecast by Technology, 2024-2034 (US$ Billion, AGR%, CAGR%)
Table 14 Steam Reforming Segment Market Forecast by Region, 2024-2034 (US$ Billion, AGR%, CAGR%)
Table 15 Partial Oxidation Segment Market Forecast by Region, 2024-2034 (US$ Billion, AGR%, CAGR%)
Table 16 Autothermal Reforming Segment Market Forecast by Region, 2024-2034 (US$ Billion, AGR%, CAGR%)
Table 17 Coal Gasification Segment Market Forecast by Region, 2024-2034 (US$ Billion, AGR%, CAGR%)
Table 18 Electrolysis Segment Market Forecast by Region, 2024-2034 (US$ Billion, AGR%, CAGR%)
Table 19 Hydrogen Generation Market Forecast by Application, 2024-2034 (US$ Billion, AGR%, CAGR%)
Table 20 Petroleum Refinery Segment Market Forecast by Region, 2024-2034 (US$ Billion, AGR%, CAGR%)
Table 21 Transportation Segment Market Forecast by Region, 2024-2034 (US$ Billion, AGR%, CAGR%)
Table 22 Ammonia Production Segment Market Forecast by Region, 2024-2034 (US$ Billion, AGR%, CAGR%)
Table 23 Methanol Production Segment Market Forecast by Region, 2024-2034 (US$ Billion, AGR%, CAGR%)
Table 24 Power Generation Segment Market Forecast by Region, 2024-2034 (US$ Billion, AGR%, CAGR%)
Table 25 Other Applications Segment Market Forecast by Region, 2024-2034 (US$ Billion, AGR%, CAGR%)
Table 26 Hydrogen Generation Market Forecast by Region, 2024-2034 (US$ Billion, AGR%, CAGR%)
Table 27 North America Hydrogen Generation Market Forecast by Country, 2024-2034 (US$ Billion, AGR%, CAGR%)
Table 28 North America Hydrogen Generation Market Forecast by Source, 2024-2034 (US$ Billion, AGR%, CAGR%)
Table 29 North America Hydrogen Generation Market Forecast by Delivery Mode, 2024-2034 (US$ Billion, AGR%, CAGR%)
Table 30 North America Hydrogen Generation Market Forecast by Technology, 2024-2034 (US$ Billion, AGR%, CAGR%)
Table 31 North America Hydrogen Generation Market Forecast by Application, 2024-2034 (US$ Billion, AGR%, CAGR%)
Table 32 U.S. Hydrogen Generation Market Forecast, 2024-2034 (US$ Billion, AGR%, CAGR%)
Table 33 Canada Hydrogen Generation Market Forecast, 2024-2034 (US$ Billion, AGR%, CAGR%)
Table 34 Europe Hydrogen Generation Market Forecast by Country, 2024-2034 (US$ Billion, AGR%, CAGR%)
Table 35 Europe Hydrogen Generation Market Forecast by Source, 2024-2034 (US$ Billion, AGR%, CAGR%)
Table 36 Europe Hydrogen Generation Market Forecast by Delivery Mode, 2024-2034 (US$ Billion, AGR%, CAGR%)
Table 37 Europe Hydrogen Generation Market Forecast by Technology, 2024-2034 (US$ Billion, AGR%, CAGR%)
Table 38 Europe Hydrogen Generation Market Forecast by Application, 2024-2034 (US$ Billion, AGR%, CAGR%)
Table 39 Germany Hydrogen Generation Market Forecast, 2024-2034 (US$ Billion, AGR%, CAGR%)
Table 40 Netherlands Hydrogen Generation Market Forecast, 2024-2034 (US$ Billion, AGR%, CAGR%)
Table 41 Poland Hydrogen Generation Market Forecast, 2024-2034 (US$ Billion, AGR%, CAGR%)
Table 42 Italy Hydrogen Generation Market Forecast, 2024-2034 (US$ Billion, AGR%, CAGR%)
Table 43 France Hydrogen Generation Market Forecast, 2024-2034 (US$ Billion, AGR%, CAGR%)
Table 44 Rest of the Europe Hydrogen Generation Market Forecast, 2024-2034 (US$ Billion, AGR%, CAGR%)
Table 45 Asia Pacific Hydrogen Generation Market Forecast by Country, 2024-2034 (US$ Billion, AGR%, CAGR%)
Table 46 Asia Pacific Hydrogen Generation Market Forecast by Source, 2024-2034 (US$ Billion, AGR%, CAGR%)
Table 47 Asia Pacific Hydrogen Generation Market Forecast by Delivery Mode, 2024-2034 (US$ Billion, AGR%, CAGR%)
Table 48 Asia Pacific Hydrogen Generation Market Forecast by Technology, 2024-2034 (US$ Billion, AGR%, CAGR%)
Table 49 Asia Pacific Hydrogen Generation Market Forecast by Application, 2024-2034 (US$ Billion, AGR%, CAGR%)
Table 50 China Hydrogen Generation Market Forecast, 2024-2034 (US$ Billion, AGR%, CAGR%)
Table 51 India Hydrogen Generation Market Forecast, 2024-2034 (US$ Billion, AGR%, CAGR%)
Table 52 Japan Hydrogen Generation Market Forecast, 2024-2034 (US$ Billion, AGR%, CAGR%)
Table 53 South Korea Hydrogen Generation Market Forecast, 2024-2034 (US$ Billion, AGR%, CAGR%)
Table 54 Australia Hydrogen Generation Market Forecast, 2024-2034 (US$ Billion, AGR%, CAGR%)
Table 55 Rest of Asia Pacific Hydrogen Generation Market Forecast, 2024-2034 (US$ Billion, AGR%, CAGR%)
Table 56 Latin America Hydrogen Generation Market Forecast by Country, 2024-2034 (US$ Billion, AGR%, CAGR%)
Table 57 Latin America Hydrogen Generation Market Forecast by Source, 2024-2034 (US$ Billion, AGR%, CAGR%)
Table 58 Latin America Hydrogen Generation Market Forecast by Delivery Mode, 2024-2034 (US$ Billion, AGR%, CAGR%)
Table 59 Latin America Hydrogen Generation Market Forecast by Technology, 2024-2034 (US$ Billion, AGR%, CAGR%)
Table 60 Latin America Hydrogen Generation Market Forecast by Application, 2024-2034 (US$ Billion, AGR%, CAGR%)
Table 61 Brazil Hydrogen Generation Market Forecast, 2024-2034 (US$ Billion, AGR%, CAGR%)
Table 62 Mexico Hydrogen Generation Market Forecast, 2024-2034 (US$ Billion, AGR%, CAGR%)
Table 63 Rest of Latin America Hydrogen Generation Market Forecast, 2024-2034 (US$ Billion, AGR%, CAGR%)
Table 64 Middle East & Africa Hydrogen Generation Market Forecast by Country, 2024-2034 (US$ Billion, AGR%, CAGR%)
Table 65 Middle East & Africa Hydrogen Generation Market Forecast by Source, 2024-2034 (US$ Billion, AGR%, CAGR%)
Table 66 Middle East & Africa Hydrogen Generation Market Forecast by Delivery Mode, 2024-2034 (US$ Billion, AGR%, CAGR%)
Table 67 Middle East & Africa Hydrogen Generation Market Forecast by Technology, 2024-2034 (US$ Billion, AGR%, CAGR%)
Table 68 Middle East & Africa Hydrogen Generation Market Forecast by Application, 2024-2034 (US$ Billion, AGR%, CAGR%)
Table 69 GCC Hydrogen Generation Market Forecast, 2024-2034 (US$ Billion, AGR%, CAGR%)
Table 70 South Africa Hydrogen Generation Market Forecast, 2024-2034 (US$ Billion, AGR%, CAGR%)
Table 71 Rest of Middle East & Africa Hydrogen Generation Market Forecast, 2024-2034 (US$ Billion, AGR%, CAGR%)
Table 72 Shell plc: Key Details, (CEO, HQ, Revenue, Founded, No. of Employees, Company Type, Website, Business Segment)
Table 73 Shell plc: Product Benchmarking
Table 74 Shell plc: Strategic Outlook
Table 75 Mitsubishi Heavy Industries, Ltd: Key Details, (CEO, HQ, Revenue, Founded, No. of Employees, Company Type, Website, Business Segment)
Table 76 Mitsubishi Heavy Industries, Ltd: Product Benchmarking
Table 77 Mitsubishi Heavy Industries, Ltd: Strategic Outlook
Table 78 Air Liquide: Key Details, (CEO, HQ, Revenue, Founded, No. of Employees, Company Type, Website, Business Segment)
Table 79 Air Liquide: Product Benchmarking
Table 80 Air Liquide: Strategic Outlook
Table 81 Siemens Energy AG: Key Details, (CEO, HQ, Revenue, Founded, No. of Employees, Company Type, Website, Business Segment)
Table 82 Siemens Energy AG: Product Benchmarking
Table 83 Siemens Energy AG: Strategic Outlook
Table 84 Engie SA: Key Details, (CEO, HQ, Revenue, Founded, No. of Employees, Company Type, Website, Business Segment)
Table 85 Engie SA: Product Benchmarking
Table 86 Engie SA: Strategic Outlook
Table 87 Linde Plc: Key Details, (CEO, HQ, Revenue, Founded, No. of Employees, Company Type, Website, Business Segment)
Table 88 Linde Plc: Product Benchmarking
Table 89 Linde Plc: Strategic Outlook
Table 90 Aramco: Key Details, (CEO, HQ, Revenue, Founded, No. of Employees, Company Type, Website, Business Segment)
Table 91 Aramco: Product Benchmarking
Table 92 Aramco: Strategic Outlook
Table 93 Air Products: Key Details, (CEO, HQ, Revenue, Founded, No. of Employees, Company Type, Website, Business Segment)
Table 94 Air Products: Product Benchmarking
Table 95 Air Products: Strategic Outlook
Table 96 Chevron Corporation: Key Details, (CEO, HQ, Revenue, Founded, No. of Employees, Company Type, Website, Business Segment)
Table 97 Chevron Corporation: Product Benchmarking
Table 98 Chevron Corporation: Strategic Outlook
Table 99 Ørsted: Key Details, (CEO, HQ, Revenue, Founded, No. of Employees, Company Type, Website, Business Segment)
Table 100 Ørsted: Product Benchmarking
Table 101 Ørsted: Strategic Outlook
Table 102 Messer Group: Key Details, (CEO, HQ, Revenue, Founded, No. of Employees, Company Type, Website, Business Segment)
Table 103 Messer Group: Product Benchmarking
Table 104 Messer Group: Strategic Outlook
Table 105 Equinor: Key Details, (CEO, HQ, Revenue, Founded, No. of Employees, Company Type, Website, Business Segment)
Table 106 Equinor: Product Benchmarking
Table 107 Equinor: Strategic Outlook
Table 108 ExxonMobil: Key Details, (CEO, HQ, Revenue, Founded, No. of Employees, Company Type, Website, Business Segment)
Table 109 ExxonMobil: Product Benchmarking
Table 110 ExxonMobil: Strategic Outlook
Table 111 BP: Key Details, (CEO, HQ, Revenue, Founded, No. of Employees, Company Type, Website, Business Segment)
Table 112 BP: Product Benchmarking
Table 113 BP: Strategic Outlook
Table 114 Iwatani Corporation: Key Details, (CEO, HQ, Revenue, Founded, No. of Employees, Company Type, Website, Business Segment)
Table 115 Iwatani Corporation: Product Benchmarking
Table 116 Iwatani Corporation: Strategic Outlook
図の一覧
Figure 1 Hydrogen Generation Market Segmentation
Figure 2 Hydrogen Generation Market by Source: Market Attractiveness Index
Figure 3 Hydrogen Generation Market by Source: Market Attractiveness Index
Figure 4 Hydrogen Generation Market by Technology: Market Attractiveness Index
Figure 5 Hydrogen Generation Market by Application: Market Attractiveness Index
Figure 6 Hydrogen Generation Market Attractiveness Index by Region
Figure 7 Hydrogen Generation Market: Market Dynamics
Figure 8 Hydrogen Generation Market by Region, 2024-2034 (US$ Billion, AGR %): “V” Shaped Recovery
Figure 9 Hydrogen Generation Market by Region, 2024-2034 (US$ Billion, AGR %): “U” Shaped Recovery
Figure 10 Hydrogen Generation Market by Region, 2024-2034 (US$ Billion, AGR %): “W” Shaped Recovery
Figure 11 Hydrogen Generation Market by Region, 2024-2034 (US$ Billion, AGR %): “L” Shaped Recovery
Figure 12 Hydrogen Generation Market: Porter’s Five Forces Analysis
Figure 13 Hydrogen Generation Market by Source: Market Attractiveness Index
Figure 14 Hydrogen Generation Market Forecast by Source, 2024-2034 (US$ Billion, AGR %)
Figure 15 Hydrogen Generation Market Share Forecast by Source, 2024, 2029, 2034 (%)
Figure 16 Blue Hydrogen Segment Market Forecast by Region, 2024-2034 (US$ Billion, AGR %)
Figure 17 Blue Hydrogen Segment Market Share Forecast by Region, 2024 & 2034 (%)
Figure 18 Gray Hydrogen Segment Market Forecast by Region, 2024-2034 (US$ Billion, AGR %)
Figure 19 Gray Hydrogen Segment Market Share Forecast by Region, 2024 & 2034 (%)
Figure 20 Green Hydrogen Segment Market Forecast by Region, 2024-2034 (US$ Billion, AGR %)
Figure 21 Green Hydrogen Segment Market Share Forecast by Region, 2024 & 2034 (%)
Figure 22 Hydrogen Generation Market by Delivery Mode: Market Attractiveness Index
Figure 23 Hydrogen Generation Market Forecast by Delivery Mode, 2024-2034 (US$ Billion, AGR %)
Figure 24 Hydrogen Generation Market Share Forecast by Delivery Mode, 2024, 2029, 2034 (%)
Figure 25 Captive Segment Market Forecast by Region, 2024-2034 (US$ Billion, AGR %)
Figure 26 Captive Segment Market Share Forecast by Region, 2024 & 2034 (%)
Figure 27 Merchant Segment Market Forecast by Region, 2024-2034 (US$ Billion, AGR %)
Figure 28 Merchant Segment Market Share Forecast by Region, 2024 & 2034 (%)
Figure 29 Hydrogen Generation Market by Technology: Market Attractiveness Index
Figure 30 Hydrogen Generation Market Forecast by Technology, 2024-2034 (US$ Billion, AGR %)
Figure 31 Hydrogen Generation Market Share Forecast by Technology, 2024, 2029, 2034 (%)
Figure 32 Steam Reforming Segment Market Forecast by Region, 2024-2034 (US$ Billion, AGR %)
Figure 33 Steam Reforming Segment Market Share Forecast by Region, 2024 & 2034 (%)
Figure 34 Partial Oxidation Segment Market Forecast by Region, 2024-2034 (US$ Billion, AGR %)
Figure 35 Partial Oxidation Segment Market Share Forecast by Region, 2024 & 2034 (%)
Figure 36 Autothermal Reforming Segment Market Forecast by Region, 2024-2034 (US$ Billion, AGR %)
Figure 37 Autothermal Reforming Segment Market Share Forecast by Region, 2024 & 2034 (%)
Figure 38 Coal Gasification Segment Market Forecast by Region, 2024-2034 (US$ Billion, AGR %)
Figure 39 Coal Gasification Segment Market Share Forecast by Region, 2024 & 2034 (%)
Figure 40 Electrolysis Segment Market Forecast by Region, 2024-2034 (US$ Billion, AGR %)
Figure 41 Electrolysis Segment Market Share Forecast by Region, 2024 & 2034 (%)
Figure 42 Hydrogen Generation Market by Application: Market Attractiveness Index
Figure 43 Hydrogen Generation Market Forecast by Application, 2024-2034 (US$ Billion, AGR %)
Figure 44 Hydrogen Generation Market Share Forecast by Application, 2024, 2029, 2034 (%)
Figure 45 Petroleum Refinery Segment Market Forecast by Region, 2024-2034 (US$ Billion, AGR %)
Figure 46 Petroleum Refinery Segment Market Share Forecast by Region, 2024 & 2034 (%)
Figure 47 Transportation Segment Market Forecast by Region, 2024-2034 (US$ Billion, AGR %)
Figure 48 Transportation Segment Market Share Forecast by Region, 2024 & 2034 (%)
Figure 49 Ammonia Production Segment Market Forecast by Region, 2024-2034 (US$ Billion, AGR %)
Figure 50 Ammonia Production Segment Market Share Forecast by Region, 2024 & 2034 (%)
Figure 51 Methanol Production Segment Market Forecast by Region, 2024-2034 (US$ Billion, AGR %)
Figure 52 Methanol Production Segment Market Share Forecast by Region, 2024 & 2034 (%)
Figure 53 Power Generation Segment Market Forecast by Region, 2024-2034 (US$ Billion, AGR %)
Figure 54 Power Generation Segment Market Share Forecast by Region, 2024 & 2034 (%)
Figure 55 Other Applications Segment Market Forecast by Region, 2024-2034 (US$ Billion, AGR %)
Figure 56 Other Applications Segment Market Share Forecast by Region, 2024 & 2034 (%)
Figure 57 Hydrogen Generation Market Forecast by Region 2024 and 2034 (US$ Billion, CAGR%)
Figure 58 Hydrogen Generation Market Share Forecast by Region 2024, 2029, 2034 (%)
Figure 59 Hydrogen Generation Market by Region, 2024-2034 (US$ Billion, AGR %)
Figure 60 North America Hydrogen Generation Market Attractiveness Index
Figure 61 North America Hydrogen Generation Market by Region, 2024, 2029 & 2034 (US$ Billion)
Figure 62 North America Hydrogen Generation Market Forecast by Country, 2024-2034 (US$ Billion, AGR %)
Figure 63 North America Hydrogen Generation Market Share Forecast by Country, 2024 & 2034 (%)
Figure 64 North America Hydrogen Generation Market Forecast by Source, 2024-2034 (US$ Billion, AGR %)
Figure 65 North America Hydrogen Generation Market Share Forecast by Source, 2024 & 2034 (%)
Figure 66 North America Hydrogen Generation Market Forecast by Delivery Mode, 2024-2034 (US$ Billion, AGR %)
Figure 67 North America Hydrogen Generation Market Share Forecast by Delivery Mode, 2024 & 2034 (%)
Figure 68 North America Hydrogen Generation Market Forecast by Technology, 2024-2034 (US$ Billion, AGR %)
Figure 69 North America Hydrogen Generation Market Share Forecast by Technology, 2024 & 2034 (%)
Figure 70 North America Hydrogen Generation Market Forecast by Application, 2024-2034 (US$ Billion, AGR %)
Figure 71 North America Hydrogen Generation Market Share Forecast by Application, 2024 & 2034 (%)
Figure 72 U.S. Hydrogen Generation Market Forecast, 2024-2034 (US$ Billion, AGR %)
Figure 73 Canada Hydrogen Generation Market Forecast, 2024-2034 (US$ Billion, AGR %)
Figure 74 Europe Hydrogen Generation Market Attractiveness Index
Figure 75 Europe Hydrogen Generation Market by Region, 2024, 2029 & 2034 (US$ Billion)
Figure 76 Europe Hydrogen Generation Market Forecast by Country, 2024-2034 (US$ Billion, AGR %)
Figure 77 Europe Hydrogen Generation Market Share Forecast by Country, 2024 & 2034 (%)
Figure 78 Europe Hydrogen Generation Market Forecast by Source, 2024-2034 (US$ Billion, AGR %)
Figure 79 Europe Hydrogen Generation Market Share Forecast by Source, 2024 & 2034 (%)
Figure 80 Europe Hydrogen Generation Market Forecast by Delivery Mode, 2024-2034 (US$ Billion, AGR %)
Figure 81 Europe Hydrogen Generation Market Share Forecast by Delivery Mode, 2024 & 2034 (%)
Figure 82 Europe Hydrogen Generation Market Forecast by Technology, 2024-2034 (US$ Billion, AGR %)
Figure 83 Europe Hydrogen Generation Market Share Forecast by Technology, 2024 & 2034 (%)
Figure 84 Europe Hydrogen Generation Market Forecast by Application, 2024-2034 (US$ Billion, AGR %)
Figure 85 Europe Hydrogen Generation Market Share Forecast by Application, 2024 & 2034 (%)
Figure 86 Germany Hydrogen Generation Market Forecast, 2024-2034 (US$ Billion, AGR %)
Figure 87 Netherlands Hydrogen Generation Market Forecast, 2024-2034 (US$ Billion, AGR %)
Figure 88 Poland Hydrogen Generation Market Forecast, 2024-2034 (US$ Billion, AGR %)
Figure 89 Italy Hydrogen Generation Market Forecast, 2024-2034 (US$ Billion, AGR %)
Figure 90 France Hydrogen Generation Market Forecast, 2024-2034 (US$ Billion, AGR %)
Figure 91 Rest of the Europe Hydrogen Generation Market Forecast, 2024-2034 (US$ Billion, AGR %)
Figure 92 Asia Pacific Hydrogen Generation Market Attractiveness Index
Figure 93 Asia Pacific Hydrogen Generation Market by Region, 2024, 2029 & 2034 (US$ Billion)
Figure 94 Asia Pacific Hydrogen Generation Market Forecast by Country, 2024-2034 (US$ Billion, AGR %)
Figure 95 Asia Pacific Hydrogen Generation Market Share Forecast by Country, 2024 & 2034 (%)
Figure 96 Asia Pacific Hydrogen Generation Market Forecast by Source, 2024-2034 (US$ Billion, AGR %)
Figure 97 Asia Pacific Hydrogen Generation Market Share Forecast by Source, 2024 & 2034 (%)
Figure 98 Asia Pacific Hydrogen Generation Market Forecast by Delivery Mode, 2024-2034 (US$ Billion, AGR %)
Figure 99 Asia Pacific Hydrogen Generation Market Share Forecast by Delivery Mode, 2024 & 2034 (%)
Figure 100 Asia Pacific Hydrogen Generation Market Forecast by Technology, 2024-2034 (US$ Billion, AGR %)
Figure 101 Asia Pacific Hydrogen Generation Market Share Forecast by Technology, 2024 & 2034 (%)
Figure 102 Asia Pacific Hydrogen Generation Market Forecast by Application, 2024-2034 (US$ Billion, AGR %)
Figure 103 Asia Pacific Hydrogen Generation Market Share Forecast by Application, 2024 & 2034 (%)
Figure 104 China Hydrogen Generation Market Forecast, 2024-2034 (US$ Billion, AGR %)
Figure 105 India Hydrogen Generation Market Forecast, 2024-2034 (US$ Billion, AGR %)
Figure 106 Japan Hydrogen Generation Market Forecast, 2024-2034 (US$ Billion, AGR %)
Figure 107 South Korea Hydrogen Generation Market Forecast, 2024-2034 (US$ Billion, AGR %)
Figure 108 Australia Hydrogen Generation Market Forecast, 2024-2034 (US$ Billion, AGR %)
Figure 109 Rest of Asia Pacific Hydrogen Generation Market Forecast, 2024-2034 (US$ Billion, AGR %)
Figure 110 Latin America Hydrogen Generation Market Attractiveness Index
Figure 111 Latin America Hydrogen Generation Market by Region, 2024, 2029 & 2034 (US$ Billion)
Figure 112 Latin America Hydrogen Generation Market Forecast by Country, 2024-2034 (US$ Billion, AGR %)
Figure 113 Latin America Hydrogen Generation Market Share Forecast by Country, 2024 & 2034 (%)
Figure 114 Latin America Hydrogen Generation Market Forecast by Source, 2024-2034 (US$ Billion, AGR %)
Figure 115 Latin America Hydrogen Generation Market Share Forecast by Source, 2024 & 2034 (%)
Figure 116 Latin America Hydrogen Generation Market Forecast by Delivery Mode, 2024-2034 (US$ Billion, AGR %)
Figure 117 Latin America Hydrogen Generation Market Share Forecast by Delivery Mode, 2024 & 2034 (%)
Figure 118 Latin America Hydrogen Generation Market Forecast by Technology, 2024-2034 (US$ Billion, AGR %)
Figure 119 Latin America Hydrogen Generation Market Share Forecast by Technology, 2024 & 2034 (%)
Figure 120 Latin America Hydrogen Generation Market Forecast by Application, 2024-2034 (US$ Billion, AGR %)
Figure 121 Latin America Hydrogen Generation Market Share Forecast by Application, 2024 & 2034 (%)
Figure 122 Brazil Hydrogen Generation Market Forecast, 2024-2034 (US$ Billion, AGR %)
Figure 123 Mexico Hydrogen Generation Market Forecast, 2024-2034 (US$ Billion, AGR %)
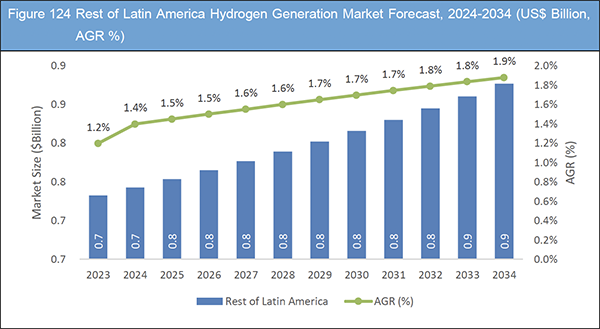
Figure 124 Rest of Latin America Hydrogen Generation Market Forecast, 2024-2034 (US$ Billion, AGR %)
Figure 125 Middle East & Africa Hydrogen Generation Market Attractiveness Index
Figure 126 Middle East & Africa Hydrogen Generation Market by Region, 2024, 2029 & 2034 (US$ Billion)
Figure 127 Middle East & Africa Hydrogen Generation Market Forecast by Country, 2024-2034 (US$ Billion, AGR %)
Figure 128 Middle East & Africa Hydrogen Generation Market Share Forecast by Country, 2024 & 2034 (%)
Figure 129 Middle East & Africa Hydrogen Generation Market Forecast by Source, 2024-2034 (US$ Billion, AGR %)
Figure 130 Middle East & Africa Hydrogen Generation Market Share Forecast by Source, 2024 & 2034 (%)
Figure 131 Middle East & Africa Hydrogen Generation Market Forecast by Delivery Mode, 2024-2034 (US$ Billion, AGR %)
Figure 132 Middle East & Africa Hydrogen Generation Market Share Forecast by Delivery Mode, 2024 & 2034 (%)
Figure 133 Middle East & Africa Hydrogen Generation Market Forecast by Technology, 2024-2034 (US$ Billion, AGR %)
Figure 134 Middle East & Africa Hydrogen Generation Market Share Forecast by Technology, 2024 & 2034 (%)
Figure 135 Middle East & Africa Hydrogen Generation Market Forecast by Application, 2024-2034 (US$ Billion, AGR %)
Figure 136 Middle East & Africa Hydrogen Generation Market Share Forecast by Application, 2024 & 2034 (%)
Figure 137 GCC Hydrogen Generation Market Forecast, 2024-2034 (US$ Billion, AGR %)
Figure 138 South Africa Hydrogen Generation Market Forecast, 2024-2034 (US$ Billion, AGR %)
Figure 139 Rest of Middle East & Africa Hydrogen Generation Market Forecast, 2024-2034 (US$ Billion, AGR %)
Figure 140 Shell plc: Net Revenue, 2018-2023 (US$ Billion, AGR%)
Figure 141 Shell plc: Segment Market Shares, 2023
Figure 142 Mitsubishi Heavy Industries, Ltd: Net Revenue, 2018-2023 (US$ Billion, AGR%)
Figure 143 Mitsubishi Heavy Industries, Ltd: Regional Market Shares, 2023
Figure 144 Mitsubishi Heavy Industries, Ltd: Segment Market Shares, 2023
Figure 145 Air Liquide: Net Revenue, 2018-2022 (US$ Billion, AGR%)
Figure 146 Air Liquide: Regional Market Shares, 2022
Figure 147 Air Liquide: Segment Market Shares, 2022
Figure 148 Siemens Energy AG: Net Revenue, 2018-2022 (US$ Billion, AGR%)
Figure 149 Siemens Energy AG: Regional Market Shares, 2022
Figure 150 Siemens Energy AG: Segment Market Shares, 2022
Figure 151 Engie SA: Net Revenue, 2018-2022 (US$ Billion, AGR%)
Figure 152 Engie SA: Segment Market Shares, 2022
Figure 153 Linde Plc: Net Revenue, 2018-2022 (US$ Billion, AGR%)
Figure 154 Linde Plc: Regional Market Shares, 2022
Figure 155 Linde Plc: Segment Market Shares, 2022
Figure 156 Aramco: Net Revenue, 2018-2022 (US$ Billion, AGR%)
Figure 157 Air Products: Net Revenue, 2018-2022 (US$ Billion, AGR%)
Figure 158 Air Products: Regional Market Shares, 2023
Figure 159 Chevron Corporation: Net Revenue, 2018-2022 (US$ Billion, AGR%)
Figure 160 Chevron Corporation: Regional Market Shares, 2022
Figure 161 Chevron Corporation: Segment Market Shares, 2022
Figure 162 Ørsted: Net Revenue, 2018-2023 (US$ Billion, AGR%)
Figure 163 Ørsted: Segment Market Shares, 2023
Figure 164 Equinor: Net Revenue, 2018-2022 (US$ Billion, AGR%)
Figure 165 Equinor: Regional Market Shares, 2022
Figure 166 Equinor: Segment Market Shares, 2022
Figure 167 ExxonMobil: Net Revenue, 2018-2022 (US$ Billion, AGR%)
Figure 168 ExxonMobil: Regional Market Shares, 2022
Figure 169 ExxonMobil: Segment Market Shares, 2022
Figure 170 BP: Net Revenue, 2018-2022 (US$ Billion, AGR%)
Figure 171 BP: Segment Market Shares, 2022
ページTOPに戻る
Summary
Report Details
The Hydrogen Generation Market Report 2024-2034: This report will prove invaluable to leading firms striving for new revenue pockets if they wish to better understand the industry and its underlying dynamics. It will be useful for companies that would like to expand into different industries or to expand their existing operations in a new region.
Technological Advancement in Green Hydrogen Economy
The development of technologies that quicken the current revolution in green hydrogen production is intimately related to the commercial opportunities in the field of green hydrogen. Emergence of novel and inventive technology presents prospects for significant market expansion. The creation of more economical and efficient electrolysis techniques is a crucial path that directly affects the generation of green hydrogen. Proton exchange membrane (PEM) and alkaline systems electrolysis technologies are becoming more and more popular since they are more scalable and have higher energy efficiency.
Furthermore, improvements in solar and wind energy systems and other renewable energy technologies make cleaner, more sustainable energy sources for hydrogen synthesis available. The cost-effectiveness and overall efficiency of producing green hydrogen are further increased by the optimisation of electrolysis operations through the integration of digital technologies and artificial intelligence.
Lagging Policy Support for Low-Emission Hydrogen Investment
There is still a lot of interest in new hydrogen projects, but in order to attract investments, prompt legislative support must be implemented given the difficult economic environment. Notwithstanding the sluggish implementation of financial incentives and resolute cost constraints that pose a threat to project delays, interest in low-emission hydrogen is nevertheless growing. However, production levels can still rise significantly by 2030 if all projects that have been planned come to fruition and more is done to promote uptake.
What Questions Should You Ask before Buying a Market Research Report?
-
How is the hydrogen generation market evolving?
-
What is driving and restraining the hydrogen generation market?
-
How will each hydrogen generation submarket segment grow over the forecast period and how much revenue will these submarkets account for in 2034?
-
How will the market shares for each hydrogen generation submarket develops from 2023 to 2034?
-
What will be the main driver for the overall market from 2024 to 2034?
-
Will leading hydrogen generation markets broadly follow the macroeconomic dynamics, or will individual national markets outperform others?
-
How will the market shares of the national markets change by 2034 and which geographical region will lead the market in 2034?
-
Who are the leading players and what are their prospects over the forecast period?
-
What are the hydrogen generation projects for these leading companies?
-
How will the industry evolve during the period between 2024 and 2034? What are the implications of hydrogen generation projects taking place now and over the next 10 years?
-
Is there a greater need for product commercialisation to further scale the hydrogen generation market?
-
Where is the hydrogen generation market heading and how can you ensure you are at the forefront of the market?
You need to discover how this will impact the hydrogen generation market today, and over the next 10 years:
-
Our 296-page report provides 116 tables and 171 charts/graphs exclusively to you.
-
The report highlights key lucrative areas in the industry so you can target them – NOW.
-
It contains in-depth analysis of global, regional and national sales and growth.
-
It highlights for you the key successful trends, changes and revenue projections made by your competitors.
This report tells you TODAY how the hydrogen generation market will develop in the next 10 years, and in line with the variations in COVID-19 economic recession and bounce. This market is more critical now than at any point over the last 10 years.
Forecasts to 2034 and other analyses reveal commercial prospects
-
In addition to revenue forecasting to 2034, our new study provides you with recent results, growth rates, and market shares.
-
You will find original analyses, with business outlooks and developments.
-
Discover qualitative analyses (including market dynamics, drivers, opportunities, restraints, and challenges), porters five forces analysis, PEST analysis, and recent developments.
Segments Covered in the Report
Delivery Mode Outlook
Source Outlook
-
Blue Hydrogen
-
Gray Hydrogen
-
Green Hydrogen
Technology Outlook
-
Steam Reforming
-
Partial Oxidation
-
Autothermal Reforming
-
Coal Gasification
-
Electrolysis
Application Outlook
-
Petroleum Refinery
-
Transportation
-
Ammonia Production
-
Methanol Production
-
Power Generation
-
Other Industries
In addition to the revenue predictions for the overall world market and segments, you will also find revenue forecasts for five regional and 16 leading national markets:
North America
Europe
-
Netherlands
-
Germany
-
Poland
-
Italy
-
France
Asia Pacific
-
China
-
India
-
Japan
-
South Korea
-
Australia
Latin America
Middle East & Africa
The report also includes profiles and for some of the leading companies in the Hydrogen Generation Market, 2024 to 2034, with a focus on this segment of these companies’ operations.
Leading companies profiled in the report
-
Shell plc
-
Mitsubishi Heavy Industries
-
Air Liquide
-
Siemens Energy AG
-
Engie SA
-
Linde Plc
-
Aramco
-
Air Products
-
Chevron Corporation
-
Ørsted
-
Messer Group
-
Equinor
-
ExxonMobil
-
BP
-
Iwatani Corporation
Overall revenue for Hydrogen Generation Market, 2024 to 2034 in terms of value the market surpassed US$160 billion in 2023, our work calculates. We predict strong revenue growth through to 2033. Our work identifies which organisations hold the greatest potential. Discover their capabilities, progress, and commercial prospects, helping you stay ahead.
How will the Hydrogen Generation Market, 2024 to 2034 Market report help you?
In summary, our 290+ page report provides you with the following knowledge:
-
Revenue and volume forecasts to 2034 for Hydrogen Generation Market, 2024 to 2034 Market, with forecasts for application, source, technology, delivery mode, and each forecast at a global, and regional level – discover the industry’s prospects, finding the most lucrative places for investments and revenues.
-
Revenue and volume forecasts to 2034 for five regional and 16 key national markets – See forecasts for the Hydrogen Generation Market, 2024 to 2034 market in North America, Europe, Asia-Pacific, Latin America, and Middle East & Africa.
-
Prospects for established firms and those seeking to enter the market – including company profiles for 15 of the major companies involved in the Hydrogen Generation Market.
Find quantitative and qualitative analyses with independent predictions. Receive information that only our report contains, staying informed with invaluable business intelligence.
Information found nowhere else
With our new report, you are less likely to fall behind in knowledge or miss out on opportunities. See how our work could benefit your research, analyses, and decisions. Visiongain’s study is for everybody needing commercial analyses for the Hydrogen Generation Market, 2024 to 2034, market-leading companies. You will find data, trends and predictions.
ページTOPに戻る
Table of Contents
Table of Contents
1 Report Overview
1.1 Objectives of the Study
1.2 Introduction to Hydrogen Generation Market
1.3 What This Report Delivers
1.4 Why You Should Read This Report
1.5 Key Questions Answered by This Analytical Report
1.6 Who is This Report for?
1.7 Methodology
1.7.1 Market Definitions
1.7.2 Market Evaluation & Forecasting Methodology
1.7.3 Data Validation
1.7.3.1 Primary Research
1.7.3.2 Secondary Research
1.8 Frequently Asked Questions (FAQs)
1.9 Associated Visiongain Reports
1.10 About Visiongain
2 Executive Summary
3 Market Overview
3.1 Key Findings
3.2 Market Dynamics
3.2.1 Market Driving Factors
3.2.1.1 Stringent Greenhouse Gas Emission Regulations
3.2.1.2 Growing Demand for Low-emission Fuels
3.2.1.3 Growing Green Hydrogen Demand for Various End-User Industries
3.2.2 Market Restraining Factors
3.2.2.1 Higher Cost Than Conventional Energy Options
3.2.2.2 Lagging Policy Support for Low-Emission Hydrogen Investment
3.2.2.3 The Future Demand for Green Hydrogen is Not Assured
3.2.3 Market Opportunities
3.2.3.1 Promote the Rise of Renewable Energy
3.2.3.2 Hydrogen as a Seasonal Long-term Energy Storage Option
3.2.3.3 Technological Advancement in Green Hydrogen Economy
3.3 COVID-19 Impact Analysis
3.4 Porter’s Five Forces Analysis
3.4.1 Bargaining Power of Suppliers (Moderate)
3.4.2 Bargaining Power of Buyers (Moderate)
3.4.3 Competitive Rivalry (High)
3.4.4 Threat from Substitutes (Low - Moderate)
3.4.5 Threat of New Entrants (Low - Moderate)
4 Hydrogen Generation Market Analysis by Source
4.1 Key Findings
4.2 Source Segment: Market Attractiveness Index
4.3 Hydrogen Generation Market Size Estimation and Forecast by Source
4.4 Blue Hydrogen
4.4.1 BP Selected BASF’s Carbon Capture Technology For Blue Hydrogen Project In Teesside
4.4.2 Air Products to Build Europe’s Largest Blue Hydrogen Plant
4.4.3 Market Size by Region, 2024-2034 (US$ Billion)
4.4.4 Market Share by Region, 2024 & 2034 (%)
4.5 Gray Hydrogen
4.5.1 Market Size by Region, 2024-2034 (US$ Billion)
4.5.2 Market Share by Region, 2024 & 2034 (%)
4.6 Green Hydrogen
4.6.1 World's Largest Green Hydrogen Project Begins Production In China
4.6.2 Market Size by Region, 2024-2034 (US$ Billion)
4.6.3 Market Share by Region, 2024 & 2034 (%)
5 Hydrogen Generation Market Analysis by Delivery Mode
5.1 Key Findings
5.2 Delivery Mode Segment: Market Attractiveness Index
5.3 Hydrogen Generation Market Size Estimation and Forecast by Delivery Mode
5.4 Captive
5.4.1 Market Size by Region, 2024-2034 (US$ Billion)
5.4.2 Market Share by Region, 2024 & 2034 (%)
5.5 Merchant
5.5.1 Market Size by Region, 2024-2034 (US$ Billion)
5.5.2 Market Share by Region, 2024 & 2034 (%)
6 Hydrogen Generation Market Analysis by Technology
6.1 Key Findings
6.2 Technology Segment: Market Attractiveness Index
6.3 Hydrogen Generation Market Size Estimation and Forecast by Technology
6.4 Steam Reforming
6.4.1 Partners to Study Hydrogen Production Using Rolls-Royce SMR
6.4.2 Market Size by Region, 2024-2034 (US$ Billion)
6.4.3 Market Share by Region, 2024 & 2034 (%)
6.5 Partial Oxidation
6.5.1 Market Size by Region, 2024-2034 (US$ Billion)
6.5.2 Market Share by Region, 2024 & 2034 (%)
6.6 Autothermal Reforming
6.6.1 Market Size by Region, 2024-2034 (US$ Billion)
6.6.2 Market Share by Region, 2024 & 2034 (%)
6.7 Coal Gasification
6.7.1 Market Size by Region, 2024-2034 (US$ Billion)
6.7.2 Market Share by Region, 2024 & 2034 (%)
6.8 Electrolysis
6.8.1 Asahi Kasei Started Construction of Alkaline Water Electrolysis Pilot Plant
6.8.2 Electrolytic Liquid Hydrogen Plant Starts Production In Georgia
6.8.3 Market Size by Region, 2024-2034 (US$ Billion)
6.8.4 Market Share by Region, 2024 & 2034 (%)
7 Hydrogen Generation Market Analysis by Application
7.1 Key Findings
7.2 Application Segment: Market Attractiveness Index
7.3 Hydrogen Generation Market Size Estimation and Forecast by Application
7.4 Petroleum Refinery
7.4.1 TotalEnergies Agrees Deal To Use Green Hydrogen In Oil Refinery
7.4.2 Market Size by Region, 2024-2034 (US$ Billion)
7.4.3 Market Share by Region, 2024 & 2034 (%)
7.5 Transportation
7.5.1 EU Spent €1.2 Billion On Hydrogen Transportation
7.5.2 Market Size by Region, 2024-2034 (US$ Billion)
7.5.3 Market Share by Region, 2024 & 2034 (%)
7.6 Ammonia Production
7.6.1 Japan, South Korea to Build Supply Chain For Hydrogen And Ammonia
7.6.2 ITOCHU Announced Collaboration in the Green Ammonia Project
7.6.3 Market Size by Region, 2024-2034 (US$ Billion)
7.6.4 Market Share by Region, 2024 & 2034 (%)
7.7 Methanol Production
7.7.1 Mystery Developer Announced Plan to Spend Over $3bn on Blue-Hydrogen-to-Methanol Plant
7.7.2 Market Size by Region, 2024-2034 (US$ Billion)
7.7.3 Market Share by Region, 2024 & 2034 (%)
7.8 Power Generation
7.8.1 Japan to co-fire Hydrogen at Power Plant
7.8.2 Germany to Invest €16bn In Hydrogen-Ready Gas-Fired Power Plants
7.8.3 Market Size by Region, 2024-2034 (US$ Billion)
7.8.4 Market Share by Region, 2024 & 2034 (%)
7.9 Other Applications
7.9.1 Market Size by Region, 2024-2034 (US$ Billion)
7.9.2 Market Share by Region, 2024 & 2034 (%)
8 Hydrogen Generation Market Analysis by Region
8.1 Key Findings
8.2 Regional Market Size Estimation and Forecast
9 North America Hydrogen Generation Market Analysis
9.1 Key Findings
9.2 North America Hydrogen Generation Market Attractiveness Index
9.3 North America Hydrogen Generation Market by Country, 2024, 2029, and 2034 (US$ Billion)
9.4 North America Hydrogen Generation Market Size Estimation and Forecast by Country
9.5 North America Hydrogen Generation Market Size Estimation and Forecast by Source
9.6 North America Hydrogen Generation Market Size Estimation and Forecast by Delivery Mode
9.7 North America Hydrogen Generation Market Size Estimation and Forecast by Technology
9.8 North America Hydrogen Generation Market Size Estimation and Forecast by Application
9.9 U.S. Hydrogen Generation Market Analysis
9.9.1 North America’s Largest Green-Hydrogen Plant Begins Operations in California
9.9.2 Duke Energy Announced Plans to Build and Operate Green Hydrogen in a Combustion Turbine in Florida
9.10 Canada Hydrogen Generation Market Analysis
9.10.1 Canada Approved North America’s First Green Hydrogen Production Plant
9.10.2 Atlantic Canada Targets Startups of Two Green Hydrogen Projects in 2025
10 Europe Hydrogen Generation Market Analysis
10.1 Key Findings
10.2 Europe Hydrogen Generation Market Attractiveness Index
10.3 Europe Hydrogen Generation Market by Country, 2024, 2029, and 2034 (US$ Billion)
10.4 Europe Hydrogen Generation Market Size Estimation and Forecast by Country
10.5 Europe Hydrogen Generation Market Size Estimation and Forecast by Source
10.6 Europe Hydrogen Generation Market Size Estimation and Forecast by Delivery Mode
10.7 Europe Hydrogen Generation Market Size Estimation and Forecast by Technology
10.8 Europe Hydrogen Generation Market Size Estimation and Forecast by Application
10.9 Germany Hydrogen Generation Market Analysis
10.9.1 Lhyfe Breaks Ground for New 10MW Hydrogen Plant in Germany
10.10 Netherlands Hydrogen Generation Market Analysis
10.10.1 Netherlands to Get World’s Largest Green Hydrogen Plant
10.11 Poland Hydrogen Generation Market Analysis
10.11.1 World’s First Two-way Hydrogen Production Facility Opened in Poland
10.11.2 Hydrogen Utopia to Launched Waste to Hydrogen Plant in Poland
10.12 Italy Hydrogen Generation Market Analysis
10.12.1 Smartenergy Develops A 200 Mwe Green Hydrogen Plant In Sardinia, Italy
10.12.2 Axpo Joined Major Green Hydrogen Project in Italy
10.13 France Hydrogen Generation Market Analysis
10.13.1 Natural Hydrogen Discovered In France
10.13.2 France Unveiled Plan for 6.5GW of 'Low-Carbon Electrolytic Hydrogen' by 2030
10.14 Rest of the Europe Hydrogen Generation Market Analysis
11 Asia Pacific Hydrogen Generation Market Analysis
11.1 Key Findings
11.2 Asia Pacific Hydrogen Generation Market Attractiveness Index
11.3 Asia Pacific Hydrogen Generation Market by Country, 2024, 2029, and 2034 (US$ Billion)
11.4 Asia Pacific Hydrogen Generation Market Size Estimation and Forecast by Country
11.5 Asia Pacific Hydrogen Generation Market Size Estimation and Forecast by Source
11.6 Asia Pacific Hydrogen Generation Market Size Estimation and Forecast by Delivery Mode
11.7 Asia Pacific Hydrogen Generation Market Size Estimation and Forecast by Technology
11.8 Asia Pacific Hydrogen Generation Market Size Estimation and Forecast by Application
11.9 China Hydrogen Generation Market Analysis
11.9.1 China’s Green Hydrogen New Era
11.9.2 China’s Sinopec Starts First Green Hydrogen Plant in Xinjiang
11.10 India Hydrogen Generation Market Analysis
11.10.1 Scindia To Inaugurate Jindal Stainless' 1st Green Hydrogen Plant
11.10.2 Status of Adoption of Green Hydrogen in the Country
11.11 Japan Hydrogen Generation Market Analysis
11.11.1 Japan’s Largest Offshore Wind-Powered Hydrogen Plant To Begin Operations
11.11.2 Japan to Allocate Clean Hydrogen Subsidies
11.12 South Korea Hydrogen Generation Market Analysis
11.12.1 SK E&S and Partners Aim to Build Korea’s Largest Low-Carbon Hydrogen Plant
11.12.2 South Korea to Create Six Hydrogen Cities
11.13 Australia Hydrogen Generation Market Analysis
11.13.1 JGC Awarded EPC Contract for Hydrogen Project in Australia
11.13.2 Australian Gas Networks - HypSA
11.13.3 Trafigura Group - Port Pirie Green Hydrogen Project
11.14 Rest of Asia Pacific Hydrogen Generation Market Analysis
12 Latin America Hydrogen Generation Market Analysis
12.1 Key Findings
12.2 Latin America Hydrogen Generation Market Attractiveness Index
12.3 Latin America Hydrogen Generation Market by Country, 2024, 2029, and 2034 (US$ Billion)
12.4 Latin America Hydrogen Generation Market Size Estimation and Forecast by Country
12.5 Latin America Hydrogen Generation Market Size Estimation and Forecast by Source
12.6 Latin America Hydrogen Generation Market Size Estimation and Forecast by Delivery Mode
12.7 Latin America Hydrogen Generation Market Size Estimation and Forecast by Technology
12.8 Latin America Hydrogen Generation Market Size Estimation and Forecast by Application
12.9 Brazil Hydrogen Generation Market Analysis
12.9.1 EU to Back 10-GW Green Hydrogen Project in Brazil
12.9.2 Brazil Revealed $3.6 Billion Hydrogen Production Plan
12.10 Mexico Hydrogen Generation Market Analysis
12.11 Rest of Latin America Hydrogen Generation Market Analysis
13 Middle East & Africa Hydrogen Generation Market Analysis
13.1 Key Findings
13.2 Middle East & Africa Hydrogen Generation Market Attractiveness Index
13.3 Middle East & Africa Hydrogen Generation Market by Country, 2024, 2029, and 2034 (US$ Billion)
13.4 Middle East & Africa Hydrogen Generation Market Size Estimation and Forecast by Country
13.5 Middle East & Africa Hydrogen Generation Market Size Estimation and Forecast by Source
13.6 Middle East & Africa Hydrogen Generation Market Size Estimation and Forecast by Delivery Mode
13.7 Middle East & Africa Hydrogen Generation Market Size Estimation and Forecast by Technology
13.8 Middle East & Africa Hydrogen Generation Market Size Estimation and Forecast by Application
13.9 GCC Hydrogen Generation Market Analysis
13.9.1 NEOM Green Hydrogen Project
13.9.2 UAE Targets 15 million Tonnes of Green Hydrogen Production by 2050
13.9.3 Qatar to Build World’s Largest Ammonia Plant
13.10 South Africa Hydrogen Generation Market Analysis
13.10.1 South Africa Green Hydrogen Vision and Strategy
13.11 Rest of Middle East & Africa Hydrogen Generation Market Analysis
14 Company Profiles
14.1 Shell plc
14.1.1 Company Snapshot
14.1.2 Company Overview
14.1.3 Financial Analysis
14.1.3.1 Net Revenue, 2018-2023
14.1.3.2 Segment Market Shares, 2023
14.1.4 Product Benchmarking
14.1.5 Strategic Outlook
14.2 Mitsubishi Heavy Industries, Ltd
14.2.1 Company Snapshot
14.2.2 Company Overview
14.2.3 Financial Analysis
14.2.3.1 Net Revenue, 2018-2023
14.2.3.2 Regional Market Shares, 2022
14.2.3.3 Segment Market Shares, 2022
14.2.4 Product Benchmarking
14.2.5 Strategic Outlook
14.3 Air Liquide
14.3.1 Company Snapshot
14.3.2 Company Overview
14.3.3 Financial Analysis
14.3.3.1 Net Revenue, 2018-2022
14.3.3.2 Regional Market Shares, 2022
14.3.3.3 Segment Market Shares, 2022
14.3.4 Product Benchmarking
14.3.5 Strategic Outlook
14.4 Siemens Energy AG
14.4.1 Company Snapshot
14.4.2 Company Overview
14.4.3 Financial Analysis
14.4.3.1 Net Revenue, 2018-2022
14.4.3.2 Regional Market Shares, 2022
14.4.3.3 Segment Market Shares, 2022
14.4.4 Product Benchmarking
14.4.5 Strategic Outlook
14.5 Engie SA
14.5.1 Company Snapshot
14.5.2 Company Overview
14.5.3 Financial Analysis
14.5.3.1 Net Revenue, 2018-2022
14.5.3.2 Segment Market Shares, 2022
14.5.4 Product Benchmarking
14.5.5 Strategic Outlook
14.6 Linde Plc
14.6.1 Company Snapshot
14.6.2 Company Overview
14.6.3 Financial Analysis
14.6.3.1 Net Revenue, 2018-2022
14.6.3.2 Regional Market Shares, 2022
14.6.3.3 Segment Market Shares, 2022
14.6.4 Product Benchmarking
14.6.5 Strategic Outlook
14.7 Aramco
14.7.1 Company Snapshot
14.7.2 Company Overview
14.7.3 Financial Analysis
14.7.3.1 Net Revenue, 2018-2022
14.7.4 Product Benchmarking
14.7.5 Strategic Outlook
14.8 Air Products
14.8.1 Company Snapshot
14.8.2 Company Overview
14.8.3 Financial Analysis
14.8.3.1 Net Revenue, 2018-2022
14.8.3.2 Regional Market Shares, 2023
14.8.4 Product Benchmarking
14.8.5 Strategic Outlook
14.9 Chevron Corporation
14.9.1 Company Snapshot
14.9.2 Company Overview
14.9.3 Financial Analysis
14.9.3.1 Net Revenue, 2018-2022
14.9.3.2 Regional Market Shares, 2022
14.9.3.3 Segment Market Shares, 2022
14.9.4 Product Benchmarking
14.9.5 Strategic Outlook
14.10 Ørsted
14.10.1 Company Snapshot
14.10.2 Company Overview
14.10.3 Financial Analysis
14.10.3.1 Net Revenue, 2018-2023
14.10.3.2 Segment Market Shares, 2023
14.10.4 Product Benchmarking
14.10.5 Strategic Outlook
14.11 Messer Group
14.11.1 Company Snapshot
14.11.2 Company Overview
14.11.3 Product Benchmarking
14.11.4 Strategic Outlook
14.12 Equinor
14.12.1 Company Snapshot
14.12.2 Company Overview
14.12.3 Financial Analysis
14.12.3.1 Net Revenue, 2018-2022
14.12.3.2 Regional Market Shares, 2022
14.12.3.3 Segment Market Shares, 2022
14.12.4 Product Benchmarking
14.12.5 Strategic Outlook
14.13 ExxonMobil
14.13.1 Company Snapshot
14.13.2 Company Overview
14.13.3 Financial Analysis
14.13.3.1 Net Revenue, 2018-2022
14.13.3.2 Regional Market Shares, 2022
14.13.3.3 Segment Market Shares, 2022
14.13.4 Product Benchmarking
14.13.5 Strategic Outlook
14.14 BP
14.14.1 Company Snapshot
14.14.2 Company Overview
14.14.3 Financial Analysis
14.14.3.1 Net Revenue, 2018-2022
14.14.3.2 Segment Market Shares, 2022
14.14.4 Product Benchmarking
14.14.5 Strategic Outlook
14.15 Iwatani Corporation
14.15.1 Company Snapshot
14.15.2 Company Overview
14.15.3 Product Benchmarking
14.15.4 Strategic Outlook
15 Conclusion and Recommendations
15.1 Concluding Remarks from Visiongain
15.2 Recommendations
ページTOPに戻る
List of Tables/Graphs
List of Tables
Table 1 Hydrogen Generation Market Snapshot, 2024 & 2034 (US$ Billion, CAGR %)
Table 2 Hydrogen Generation Market Forecast by Region, 2024-2034 (US$ Billion, AGR%, CAGR%): “V” Shaped Recovery
Table 3 Hydrogen Generation Market Forecast by Region, 2024-2034 (US$ Billion, AGR%, CAGR%): “U” Shaped Recovery
Table 4 Hydrogen Generation Market Forecast by Region, 2024-2034 (US$ Billion, AGR%, CAGR%): “W” Shaped Recovery
Table 5 Hydrogen Generation Market Forecast by Region, 2024-2034 (US$ Billion, AGR%, CAGR%): “L” Shaped Recovery
Table 6 Hydrogen Generation Market Forecast by Source, 2024-2034 (US$ Billion, AGR%, CAGR%)
Table 7 Blue Hydrogen Segment Market Forecast by Region, 2024-2034 (US$ Billion, AGR%, CAGR%)
Table 8 Gray Hydrogen Segment Market Forecast by Region, 2024-2034 (US$ Billion, AGR%, CAGR%)
Table 9 Green Hydrogen Segment Market Forecast by Region, 2024-2034 (US$ Billion, AGR%, CAGR%)
Table 10 Hydrogen Generation Market Forecast by Delivery Mode, 2024-2034 (US$ Billion, AGR%, CAGR%)
Table 11 Captive Segment Market Forecast by Region, 2024-2034 (US$ Billion, AGR%, CAGR%)
Table 12 Merchant Segment Market Forecast by Region, 2024-2034 (US$ Billion, AGR%, CAGR%)
Table 13 Hydrogen Generation Market Forecast by Technology, 2024-2034 (US$ Billion, AGR%, CAGR%)
Table 14 Steam Reforming Segment Market Forecast by Region, 2024-2034 (US$ Billion, AGR%, CAGR%)
Table 15 Partial Oxidation Segment Market Forecast by Region, 2024-2034 (US$ Billion, AGR%, CAGR%)
Table 16 Autothermal Reforming Segment Market Forecast by Region, 2024-2034 (US$ Billion, AGR%, CAGR%)
Table 17 Coal Gasification Segment Market Forecast by Region, 2024-2034 (US$ Billion, AGR%, CAGR%)
Table 18 Electrolysis Segment Market Forecast by Region, 2024-2034 (US$ Billion, AGR%, CAGR%)
Table 19 Hydrogen Generation Market Forecast by Application, 2024-2034 (US$ Billion, AGR%, CAGR%)
Table 20 Petroleum Refinery Segment Market Forecast by Region, 2024-2034 (US$ Billion, AGR%, CAGR%)
Table 21 Transportation Segment Market Forecast by Region, 2024-2034 (US$ Billion, AGR%, CAGR%)
Table 22 Ammonia Production Segment Market Forecast by Region, 2024-2034 (US$ Billion, AGR%, CAGR%)
Table 23 Methanol Production Segment Market Forecast by Region, 2024-2034 (US$ Billion, AGR%, CAGR%)
Table 24 Power Generation Segment Market Forecast by Region, 2024-2034 (US$ Billion, AGR%, CAGR%)
Table 25 Other Applications Segment Market Forecast by Region, 2024-2034 (US$ Billion, AGR%, CAGR%)
Table 26 Hydrogen Generation Market Forecast by Region, 2024-2034 (US$ Billion, AGR%, CAGR%)
Table 27 North America Hydrogen Generation Market Forecast by Country, 2024-2034 (US$ Billion, AGR%, CAGR%)
Table 28 North America Hydrogen Generation Market Forecast by Source, 2024-2034 (US$ Billion, AGR%, CAGR%)
Table 29 North America Hydrogen Generation Market Forecast by Delivery Mode, 2024-2034 (US$ Billion, AGR%, CAGR%)
Table 30 North America Hydrogen Generation Market Forecast by Technology, 2024-2034 (US$ Billion, AGR%, CAGR%)
Table 31 North America Hydrogen Generation Market Forecast by Application, 2024-2034 (US$ Billion, AGR%, CAGR%)
Table 32 U.S. Hydrogen Generation Market Forecast, 2024-2034 (US$ Billion, AGR%, CAGR%)
Table 33 Canada Hydrogen Generation Market Forecast, 2024-2034 (US$ Billion, AGR%, CAGR%)
Table 34 Europe Hydrogen Generation Market Forecast by Country, 2024-2034 (US$ Billion, AGR%, CAGR%)
Table 35 Europe Hydrogen Generation Market Forecast by Source, 2024-2034 (US$ Billion, AGR%, CAGR%)
Table 36 Europe Hydrogen Generation Market Forecast by Delivery Mode, 2024-2034 (US$ Billion, AGR%, CAGR%)
Table 37 Europe Hydrogen Generation Market Forecast by Technology, 2024-2034 (US$ Billion, AGR%, CAGR%)
Table 38 Europe Hydrogen Generation Market Forecast by Application, 2024-2034 (US$ Billion, AGR%, CAGR%)
Table 39 Germany Hydrogen Generation Market Forecast, 2024-2034 (US$ Billion, AGR%, CAGR%)
Table 40 Netherlands Hydrogen Generation Market Forecast, 2024-2034 (US$ Billion, AGR%, CAGR%)
Table 41 Poland Hydrogen Generation Market Forecast, 2024-2034 (US$ Billion, AGR%, CAGR%)
Table 42 Italy Hydrogen Generation Market Forecast, 2024-2034 (US$ Billion, AGR%, CAGR%)
Table 43 France Hydrogen Generation Market Forecast, 2024-2034 (US$ Billion, AGR%, CAGR%)
Table 44 Rest of the Europe Hydrogen Generation Market Forecast, 2024-2034 (US$ Billion, AGR%, CAGR%)
Table 45 Asia Pacific Hydrogen Generation Market Forecast by Country, 2024-2034 (US$ Billion, AGR%, CAGR%)
Table 46 Asia Pacific Hydrogen Generation Market Forecast by Source, 2024-2034 (US$ Billion, AGR%, CAGR%)
Table 47 Asia Pacific Hydrogen Generation Market Forecast by Delivery Mode, 2024-2034 (US$ Billion, AGR%, CAGR%)
Table 48 Asia Pacific Hydrogen Generation Market Forecast by Technology, 2024-2034 (US$ Billion, AGR%, CAGR%)
Table 49 Asia Pacific Hydrogen Generation Market Forecast by Application, 2024-2034 (US$ Billion, AGR%, CAGR%)
Table 50 China Hydrogen Generation Market Forecast, 2024-2034 (US$ Billion, AGR%, CAGR%)
Table 51 India Hydrogen Generation Market Forecast, 2024-2034 (US$ Billion, AGR%, CAGR%)
Table 52 Japan Hydrogen Generation Market Forecast, 2024-2034 (US$ Billion, AGR%, CAGR%)
Table 53 South Korea Hydrogen Generation Market Forecast, 2024-2034 (US$ Billion, AGR%, CAGR%)
Table 54 Australia Hydrogen Generation Market Forecast, 2024-2034 (US$ Billion, AGR%, CAGR%)
Table 55 Rest of Asia Pacific Hydrogen Generation Market Forecast, 2024-2034 (US$ Billion, AGR%, CAGR%)
Table 56 Latin America Hydrogen Generation Market Forecast by Country, 2024-2034 (US$ Billion, AGR%, CAGR%)
Table 57 Latin America Hydrogen Generation Market Forecast by Source, 2024-2034 (US$ Billion, AGR%, CAGR%)
Table 58 Latin America Hydrogen Generation Market Forecast by Delivery Mode, 2024-2034 (US$ Billion, AGR%, CAGR%)
Table 59 Latin America Hydrogen Generation Market Forecast by Technology, 2024-2034 (US$ Billion, AGR%, CAGR%)
Table 60 Latin America Hydrogen Generation Market Forecast by Application, 2024-2034 (US$ Billion, AGR%, CAGR%)
Table 61 Brazil Hydrogen Generation Market Forecast, 2024-2034 (US$ Billion, AGR%, CAGR%)
Table 62 Mexico Hydrogen Generation Market Forecast, 2024-2034 (US$ Billion, AGR%, CAGR%)
Table 63 Rest of Latin America Hydrogen Generation Market Forecast, 2024-2034 (US$ Billion, AGR%, CAGR%)
Table 64 Middle East & Africa Hydrogen Generation Market Forecast by Country, 2024-2034 (US$ Billion, AGR%, CAGR%)
Table 65 Middle East & Africa Hydrogen Generation Market Forecast by Source, 2024-2034 (US$ Billion, AGR%, CAGR%)
Table 66 Middle East & Africa Hydrogen Generation Market Forecast by Delivery Mode, 2024-2034 (US$ Billion, AGR%, CAGR%)
Table 67 Middle East & Africa Hydrogen Generation Market Forecast by Technology, 2024-2034 (US$ Billion, AGR%, CAGR%)
Table 68 Middle East & Africa Hydrogen Generation Market Forecast by Application, 2024-2034 (US$ Billion, AGR%, CAGR%)
Table 69 GCC Hydrogen Generation Market Forecast, 2024-2034 (US$ Billion, AGR%, CAGR%)
Table 70 South Africa Hydrogen Generation Market Forecast, 2024-2034 (US$ Billion, AGR%, CAGR%)
Table 71 Rest of Middle East & Africa Hydrogen Generation Market Forecast, 2024-2034 (US$ Billion, AGR%, CAGR%)
Table 72 Shell plc: Key Details, (CEO, HQ, Revenue, Founded, No. of Employees, Company Type, Website, Business Segment)
Table 73 Shell plc: Product Benchmarking
Table 74 Shell plc: Strategic Outlook
Table 75 Mitsubishi Heavy Industries, Ltd: Key Details, (CEO, HQ, Revenue, Founded, No. of Employees, Company Type, Website, Business Segment)
Table 76 Mitsubishi Heavy Industries, Ltd: Product Benchmarking
Table 77 Mitsubishi Heavy Industries, Ltd: Strategic Outlook
Table 78 Air Liquide: Key Details, (CEO, HQ, Revenue, Founded, No. of Employees, Company Type, Website, Business Segment)
Table 79 Air Liquide: Product Benchmarking
Table 80 Air Liquide: Strategic Outlook
Table 81 Siemens Energy AG: Key Details, (CEO, HQ, Revenue, Founded, No. of Employees, Company Type, Website, Business Segment)
Table 82 Siemens Energy AG: Product Benchmarking
Table 83 Siemens Energy AG: Strategic Outlook
Table 84 Engie SA: Key Details, (CEO, HQ, Revenue, Founded, No. of Employees, Company Type, Website, Business Segment)
Table 85 Engie SA: Product Benchmarking
Table 86 Engie SA: Strategic Outlook
Table 87 Linde Plc: Key Details, (CEO, HQ, Revenue, Founded, No. of Employees, Company Type, Website, Business Segment)
Table 88 Linde Plc: Product Benchmarking
Table 89 Linde Plc: Strategic Outlook
Table 90 Aramco: Key Details, (CEO, HQ, Revenue, Founded, No. of Employees, Company Type, Website, Business Segment)
Table 91 Aramco: Product Benchmarking
Table 92 Aramco: Strategic Outlook
Table 93 Air Products: Key Details, (CEO, HQ, Revenue, Founded, No. of Employees, Company Type, Website, Business Segment)
Table 94 Air Products: Product Benchmarking
Table 95 Air Products: Strategic Outlook
Table 96 Chevron Corporation: Key Details, (CEO, HQ, Revenue, Founded, No. of Employees, Company Type, Website, Business Segment)
Table 97 Chevron Corporation: Product Benchmarking
Table 98 Chevron Corporation: Strategic Outlook
Table 99 Ørsted: Key Details, (CEO, HQ, Revenue, Founded, No. of Employees, Company Type, Website, Business Segment)
Table 100 Ørsted: Product Benchmarking
Table 101 Ørsted: Strategic Outlook
Table 102 Messer Group: Key Details, (CEO, HQ, Revenue, Founded, No. of Employees, Company Type, Website, Business Segment)
Table 103 Messer Group: Product Benchmarking
Table 104 Messer Group: Strategic Outlook
Table 105 Equinor: Key Details, (CEO, HQ, Revenue, Founded, No. of Employees, Company Type, Website, Business Segment)
Table 106 Equinor: Product Benchmarking
Table 107 Equinor: Strategic Outlook
Table 108 ExxonMobil: Key Details, (CEO, HQ, Revenue, Founded, No. of Employees, Company Type, Website, Business Segment)
Table 109 ExxonMobil: Product Benchmarking
Table 110 ExxonMobil: Strategic Outlook
Table 111 BP: Key Details, (CEO, HQ, Revenue, Founded, No. of Employees, Company Type, Website, Business Segment)
Table 112 BP: Product Benchmarking
Table 113 BP: Strategic Outlook
Table 114 Iwatani Corporation: Key Details, (CEO, HQ, Revenue, Founded, No. of Employees, Company Type, Website, Business Segment)
Table 115 Iwatani Corporation: Product Benchmarking
Table 116 Iwatani Corporation: Strategic Outlook
List of Figures
Figure 1 Hydrogen Generation Market Segmentation
Figure 2 Hydrogen Generation Market by Source: Market Attractiveness Index
Figure 3 Hydrogen Generation Market by Source: Market Attractiveness Index
Figure 4 Hydrogen Generation Market by Technology: Market Attractiveness Index
Figure 5 Hydrogen Generation Market by Application: Market Attractiveness Index
Figure 6 Hydrogen Generation Market Attractiveness Index by Region
Figure 7 Hydrogen Generation Market: Market Dynamics
Figure 8 Hydrogen Generation Market by Region, 2024-2034 (US$ Billion, AGR %): “V” Shaped Recovery
Figure 9 Hydrogen Generation Market by Region, 2024-2034 (US$ Billion, AGR %): “U” Shaped Recovery
Figure 10 Hydrogen Generation Market by Region, 2024-2034 (US$ Billion, AGR %): “W” Shaped Recovery
Figure 11 Hydrogen Generation Market by Region, 2024-2034 (US$ Billion, AGR %): “L” Shaped Recovery
Figure 12 Hydrogen Generation Market: Porter’s Five Forces Analysis
Figure 13 Hydrogen Generation Market by Source: Market Attractiveness Index
Figure 14 Hydrogen Generation Market Forecast by Source, 2024-2034 (US$ Billion, AGR %)
Figure 15 Hydrogen Generation Market Share Forecast by Source, 2024, 2029, 2034 (%)
Figure 16 Blue Hydrogen Segment Market Forecast by Region, 2024-2034 (US$ Billion, AGR %)
Figure 17 Blue Hydrogen Segment Market Share Forecast by Region, 2024 & 2034 (%)
Figure 18 Gray Hydrogen Segment Market Forecast by Region, 2024-2034 (US$ Billion, AGR %)
Figure 19 Gray Hydrogen Segment Market Share Forecast by Region, 2024 & 2034 (%)
Figure 20 Green Hydrogen Segment Market Forecast by Region, 2024-2034 (US$ Billion, AGR %)
Figure 21 Green Hydrogen Segment Market Share Forecast by Region, 2024 & 2034 (%)
Figure 22 Hydrogen Generation Market by Delivery Mode: Market Attractiveness Index
Figure 23 Hydrogen Generation Market Forecast by Delivery Mode, 2024-2034 (US$ Billion, AGR %)
Figure 24 Hydrogen Generation Market Share Forecast by Delivery Mode, 2024, 2029, 2034 (%)
Figure 25 Captive Segment Market Forecast by Region, 2024-2034 (US$ Billion, AGR %)
Figure 26 Captive Segment Market Share Forecast by Region, 2024 & 2034 (%)
Figure 27 Merchant Segment Market Forecast by Region, 2024-2034 (US$ Billion, AGR %)
Figure 28 Merchant Segment Market Share Forecast by Region, 2024 & 2034 (%)
Figure 29 Hydrogen Generation Market by Technology: Market Attractiveness Index
Figure 30 Hydrogen Generation Market Forecast by Technology, 2024-2034 (US$ Billion, AGR %)
Figure 31 Hydrogen Generation Market Share Forecast by Technology, 2024, 2029, 2034 (%)
Figure 32 Steam Reforming Segment Market Forecast by Region, 2024-2034 (US$ Billion, AGR %)
Figure 33 Steam Reforming Segment Market Share Forecast by Region, 2024 & 2034 (%)
Figure 34 Partial Oxidation Segment Market Forecast by Region, 2024-2034 (US$ Billion, AGR %)
Figure 35 Partial Oxidation Segment Market Share Forecast by Region, 2024 & 2034 (%)
Figure 36 Autothermal Reforming Segment Market Forecast by Region, 2024-2034 (US$ Billion, AGR %)
Figure 37 Autothermal Reforming Segment Market Share Forecast by Region, 2024 & 2034 (%)
Figure 38 Coal Gasification Segment Market Forecast by Region, 2024-2034 (US$ Billion, AGR %)
Figure 39 Coal Gasification Segment Market Share Forecast by Region, 2024 & 2034 (%)
Figure 40 Electrolysis Segment Market Forecast by Region, 2024-2034 (US$ Billion, AGR %)
Figure 41 Electrolysis Segment Market Share Forecast by Region, 2024 & 2034 (%)
Figure 42 Hydrogen Generation Market by Application: Market Attractiveness Index
Figure 43 Hydrogen Generation Market Forecast by Application, 2024-2034 (US$ Billion, AGR %)
Figure 44 Hydrogen Generation Market Share Forecast by Application, 2024, 2029, 2034 (%)
Figure 45 Petroleum Refinery Segment Market Forecast by Region, 2024-2034 (US$ Billion, AGR %)
Figure 46 Petroleum Refinery Segment Market Share Forecast by Region, 2024 & 2034 (%)
Figure 47 Transportation Segment Market Forecast by Region, 2024-2034 (US$ Billion, AGR %)
Figure 48 Transportation Segment Market Share Forecast by Region, 2024 & 2034 (%)
Figure 49 Ammonia Production Segment Market Forecast by Region, 2024-2034 (US$ Billion, AGR %)
Figure 50 Ammonia Production Segment Market Share Forecast by Region, 2024 & 2034 (%)
Figure 51 Methanol Production Segment Market Forecast by Region, 2024-2034 (US$ Billion, AGR %)
Figure 52 Methanol Production Segment Market Share Forecast by Region, 2024 & 2034 (%)
Figure 53 Power Generation Segment Market Forecast by Region, 2024-2034 (US$ Billion, AGR %)
Figure 54 Power Generation Segment Market Share Forecast by Region, 2024 & 2034 (%)
Figure 55 Other Applications Segment Market Forecast by Region, 2024-2034 (US$ Billion, AGR %)
Figure 56 Other Applications Segment Market Share Forecast by Region, 2024 & 2034 (%)
Figure 57 Hydrogen Generation Market Forecast by Region 2024 and 2034 (US$ Billion, CAGR%)
Figure 58 Hydrogen Generation Market Share Forecast by Region 2024, 2029, 2034 (%)
Figure 59 Hydrogen Generation Market by Region, 2024-2034 (US$ Billion, AGR %)
Figure 60 North America Hydrogen Generation Market Attractiveness Index
Figure 61 North America Hydrogen Generation Market by Region, 2024, 2029 & 2034 (US$ Billion)
Figure 62 North America Hydrogen Generation Market Forecast by Country, 2024-2034 (US$ Billion, AGR %)
Figure 63 North America Hydrogen Generation Market Share Forecast by Country, 2024 & 2034 (%)
Figure 64 North America Hydrogen Generation Market Forecast by Source, 2024-2034 (US$ Billion, AGR %)
Figure 65 North America Hydrogen Generation Market Share Forecast by Source, 2024 & 2034 (%)
Figure 66 North America Hydrogen Generation Market Forecast by Delivery Mode, 2024-2034 (US$ Billion, AGR %)
Figure 67 North America Hydrogen Generation Market Share Forecast by Delivery Mode, 2024 & 2034 (%)
Figure 68 North America Hydrogen Generation Market Forecast by Technology, 2024-2034 (US$ Billion, AGR %)
Figure 69 North America Hydrogen Generation Market Share Forecast by Technology, 2024 & 2034 (%)
Figure 70 North America Hydrogen Generation Market Forecast by Application, 2024-2034 (US$ Billion, AGR %)
Figure 71 North America Hydrogen Generation Market Share Forecast by Application, 2024 & 2034 (%)
Figure 72 U.S. Hydrogen Generation Market Forecast, 2024-2034 (US$ Billion, AGR %)
Figure 73 Canada Hydrogen Generation Market Forecast, 2024-2034 (US$ Billion, AGR %)
Figure 74 Europe Hydrogen Generation Market Attractiveness Index
Figure 75 Europe Hydrogen Generation Market by Region, 2024, 2029 & 2034 (US$ Billion)
Figure 76 Europe Hydrogen Generation Market Forecast by Country, 2024-2034 (US$ Billion, AGR %)
Figure 77 Europe Hydrogen Generation Market Share Forecast by Country, 2024 & 2034 (%)
Figure 78 Europe Hydrogen Generation Market Forecast by Source, 2024-2034 (US$ Billion, AGR %)
Figure 79 Europe Hydrogen Generation Market Share Forecast by Source, 2024 & 2034 (%)
Figure 80 Europe Hydrogen Generation Market Forecast by Delivery Mode, 2024-2034 (US$ Billion, AGR %)
Figure 81 Europe Hydrogen Generation Market Share Forecast by Delivery Mode, 2024 & 2034 (%)
Figure 82 Europe Hydrogen Generation Market Forecast by Technology, 2024-2034 (US$ Billion, AGR %)
Figure 83 Europe Hydrogen Generation Market Share Forecast by Technology, 2024 & 2034 (%)
Figure 84 Europe Hydrogen Generation Market Forecast by Application, 2024-2034 (US$ Billion, AGR %)
Figure 85 Europe Hydrogen Generation Market Share Forecast by Application, 2024 & 2034 (%)
Figure 86 Germany Hydrogen Generation Market Forecast, 2024-2034 (US$ Billion, AGR %)
Figure 87 Netherlands Hydrogen Generation Market Forecast, 2024-2034 (US$ Billion, AGR %)
Figure 88 Poland Hydrogen Generation Market Forecast, 2024-2034 (US$ Billion, AGR %)
Figure 89 Italy Hydrogen Generation Market Forecast, 2024-2034 (US$ Billion, AGR %)
Figure 90 France Hydrogen Generation Market Forecast, 2024-2034 (US$ Billion, AGR %)
Figure 91 Rest of the Europe Hydrogen Generation Market Forecast, 2024-2034 (US$ Billion, AGR %)
Figure 92 Asia Pacific Hydrogen Generation Market Attractiveness Index
Figure 93 Asia Pacific Hydrogen Generation Market by Region, 2024, 2029 & 2034 (US$ Billion)
Figure 94 Asia Pacific Hydrogen Generation Market Forecast by Country, 2024-2034 (US$ Billion, AGR %)
Figure 95 Asia Pacific Hydrogen Generation Market Share Forecast by Country, 2024 & 2034 (%)
Figure 96 Asia Pacific Hydrogen Generation Market Forecast by Source, 2024-2034 (US$ Billion, AGR %)
Figure 97 Asia Pacific Hydrogen Generation Market Share Forecast by Source, 2024 & 2034 (%)
Figure 98 Asia Pacific Hydrogen Generation Market Forecast by Delivery Mode, 2024-2034 (US$ Billion, AGR %)
Figure 99 Asia Pacific Hydrogen Generation Market Share Forecast by Delivery Mode, 2024 & 2034 (%)
Figure 100 Asia Pacific Hydrogen Generation Market Forecast by Technology, 2024-2034 (US$ Billion, AGR %)
Figure 101 Asia Pacific Hydrogen Generation Market Share Forecast by Technology, 2024 & 2034 (%)
Figure 102 Asia Pacific Hydrogen Generation Market Forecast by Application, 2024-2034 (US$ Billion, AGR %)
Figure 103 Asia Pacific Hydrogen Generation Market Share Forecast by Application, 2024 & 2034 (%)
Figure 104 China Hydrogen Generation Market Forecast, 2024-2034 (US$ Billion, AGR %)
Figure 105 India Hydrogen Generation Market Forecast, 2024-2034 (US$ Billion, AGR %)
Figure 106 Japan Hydrogen Generation Market Forecast, 2024-2034 (US$ Billion, AGR %)
Figure 107 South Korea Hydrogen Generation Market Forecast, 2024-2034 (US$ Billion, AGR %)
Figure 108 Australia Hydrogen Generation Market Forecast, 2024-2034 (US$ Billion, AGR %)
Figure 109 Rest of Asia Pacific Hydrogen Generation Market Forecast, 2024-2034 (US$ Billion, AGR %)
Figure 110 Latin America Hydrogen Generation Market Attractiveness Index
Figure 111 Latin America Hydrogen Generation Market by Region, 2024, 2029 & 2034 (US$ Billion)
Figure 112 Latin America Hydrogen Generation Market Forecast by Country, 2024-2034 (US$ Billion, AGR %)
Figure 113 Latin America Hydrogen Generation Market Share Forecast by Country, 2024 & 2034 (%)
Figure 114 Latin America Hydrogen Generation Market Forecast by Source, 2024-2034 (US$ Billion, AGR %)
Figure 115 Latin America Hydrogen Generation Market Share Forecast by Source, 2024 & 2034 (%)
Figure 116 Latin America Hydrogen Generation Market Forecast by Delivery Mode, 2024-2034 (US$ Billion, AGR %)
Figure 117 Latin America Hydrogen Generation Market Share Forecast by Delivery Mode, 2024 & 2034 (%)
Figure 118 Latin America Hydrogen Generation Market Forecast by Technology, 2024-2034 (US$ Billion, AGR %)
Figure 119 Latin America Hydrogen Generation Market Share Forecast by Technology, 2024 & 2034 (%)
Figure 120 Latin America Hydrogen Generation Market Forecast by Application, 2024-2034 (US$ Billion, AGR %)
Figure 121 Latin America Hydrogen Generation Market Share Forecast by Application, 2024 & 2034 (%)
Figure 122 Brazil Hydrogen Generation Market Forecast, 2024-2034 (US$ Billion, AGR %)
Figure 123 Mexico Hydrogen Generation Market Forecast, 2024-2034 (US$ Billion, AGR %)
Figure 124 Rest of Latin America Hydrogen Generation Market Forecast, 2024-2034 (US$ Billion, AGR %)
Figure 125 Middle East & Africa Hydrogen Generation Market Attractiveness Index
Figure 126 Middle East & Africa Hydrogen Generation Market by Region, 2024, 2029 & 2034 (US$ Billion)
Figure 127 Middle East & Africa Hydrogen Generation Market Forecast by Country, 2024-2034 (US$ Billion, AGR %)
Figure 128 Middle East & Africa Hydrogen Generation Market Share Forecast by Country, 2024 & 2034 (%)
Figure 129 Middle East & Africa Hydrogen Generation Market Forecast by Source, 2024-2034 (US$ Billion, AGR %)
Figure 130 Middle East & Africa Hydrogen Generation Market Share Forecast by Source, 2024 & 2034 (%)
Figure 131 Middle East & Africa Hydrogen Generation Market Forecast by Delivery Mode, 2024-2034 (US$ Billion, AGR %)
Figure 132 Middle East & Africa Hydrogen Generation Market Share Forecast by Delivery Mode, 2024 & 2034 (%)
Figure 133 Middle East & Africa Hydrogen Generation Market Forecast by Technology, 2024-2034 (US$ Billion, AGR %)
Figure 134 Middle East & Africa Hydrogen Generation Market Share Forecast by Technology, 2024 & 2034 (%)
Figure 135 Middle East & Africa Hydrogen Generation Market Forecast by Application, 2024-2034 (US$ Billion, AGR %)
Figure 136 Middle East & Africa Hydrogen Generation Market Share Forecast by Application, 2024 & 2034 (%)
Figure 137 GCC Hydrogen Generation Market Forecast, 2024-2034 (US$ Billion, AGR %)
Figure 138 South Africa Hydrogen Generation Market Forecast, 2024-2034 (US$ Billion, AGR %)
Figure 139 Rest of Middle East & Africa Hydrogen Generation Market Forecast, 2024-2034 (US$ Billion, AGR %)
Figure 140 Shell plc: Net Revenue, 2018-2023 (US$ Billion, AGR%)
Figure 141 Shell plc: Segment Market Shares, 2023
Figure 142 Mitsubishi Heavy Industries, Ltd: Net Revenue, 2018-2023 (US$ Billion, AGR%)
Figure 143 Mitsubishi Heavy Industries, Ltd: Regional Market Shares, 2023
Figure 144 Mitsubishi Heavy Industries, Ltd: Segment Market Shares, 2023
Figure 145 Air Liquide: Net Revenue, 2018-2022 (US$ Billion, AGR%)
Figure 146 Air Liquide: Regional Market Shares, 2022
Figure 147 Air Liquide: Segment Market Shares, 2022
Figure 148 Siemens Energy AG: Net Revenue, 2018-2022 (US$ Billion, AGR%)
Figure 149 Siemens Energy AG: Regional Market Shares, 2022
Figure 150 Siemens Energy AG: Segment Market Shares, 2022
Figure 151 Engie SA: Net Revenue, 2018-2022 (US$ Billion, AGR%)
Figure 152 Engie SA: Segment Market Shares, 2022
Figure 153 Linde Plc: Net Revenue, 2018-2022 (US$ Billion, AGR%)
Figure 154 Linde Plc: Regional Market Shares, 2022
Figure 155 Linde Plc: Segment Market Shares, 2022
Figure 156 Aramco: Net Revenue, 2018-2022 (US$ Billion, AGR%)
Figure 157 Air Products: Net Revenue, 2018-2022 (US$ Billion, AGR%)
Figure 158 Air Products: Regional Market Shares, 2023
Figure 159 Chevron Corporation: Net Revenue, 2018-2022 (US$ Billion, AGR%)
Figure 160 Chevron Corporation: Regional Market Shares, 2022
Figure 161 Chevron Corporation: Segment Market Shares, 2022
Figure 162 Ørsted: Net Revenue, 2018-2023 (US$ Billion, AGR%)
Figure 163 Ørsted: Segment Market Shares, 2023
Figure 164 Equinor: Net Revenue, 2018-2022 (US$ Billion, AGR%)
Figure 165 Equinor: Regional Market Shares, 2022
Figure 166 Equinor: Segment Market Shares, 2022
Figure 167 ExxonMobil: Net Revenue, 2018-2022 (US$ Billion, AGR%)
Figure 168 ExxonMobil: Regional Market Shares, 2022
Figure 169 ExxonMobil: Segment Market Shares, 2022
Figure 170 BP: Net Revenue, 2018-2022 (US$ Billion, AGR%)
Figure 171 BP: Segment Market Shares, 2022
ページTOPに戻る
Visiongain社のエネルギーと資源分野での最新刊レポート
本レポートと同じKEY WORD(hydrogen)の最新刊レポート
よくあるご質問
Visiongain社はどのような調査会社ですか?
英国の調査会社ヴィジョンゲイン社(Visiongain)は、通信とエネルギーのほか、自動車や化学・医薬品、金属など、広範な市場を対象に調査を行っています。自動車市場については、市場全般に関する調査のほ... もっと見る
調査レポートの納品までの日数はどの程度ですか?
在庫のあるものは速納となりますが、平均的には 3-4日と見て下さい。
但し、一部の調査レポートでは、発注を受けた段階で内容更新をして納品をする場合もあります。
発注をする前のお問合せをお願いします。
注文の手続きはどのようになっていますか?
1)お客様からの御問い合わせをいただきます。
2)見積書やサンプルの提示をいたします。
3)お客様指定、もしくは弊社の発注書をメール添付にて発送してください。
4)データリソース社からレポート発行元の調査会社へ納品手配します。
5) 調査会社からお客様へ納品されます。最近は、pdfにてのメール納品が大半です。
お支払方法の方法はどのようになっていますか?
納品と同時にデータリソース社よりお客様へ請求書(必要に応じて納品書も)を発送いたします。
お客様よりデータリソース社へ(通常は円払い)の御振り込みをお願いします。
請求書は、納品日の日付で発行しますので、翌月最終営業日までの当社指定口座への振込みをお願いします。振込み手数料は御社負担にてお願いします。
お客様の御支払い条件が60日以上の場合は御相談ください。
尚、初めてのお取引先や個人の場合、前払いをお願いすることもあります。ご了承のほど、お願いします。
データリソース社はどのような会社ですか?
当社は、世界各国の主要調査会社・レポート出版社と提携し、世界各国の市場調査レポートや技術動向レポートなどを日本国内の企業・公官庁及び教育研究機関に提供しております。
世界各国の「市場・技術・法規制などの」実情を調査・収集される時には、データリソース社にご相談ください。
お客様の御要望にあったデータや情報を抽出する為のレポート紹介や調査のアドバイスも致します。
|
|

