廃棄物からエネルギー(WtE)市場レポート:2025-2035
Waste to Energy (WtE) Market Report 2025-2035
解説
廃棄物からエネルギー(WtE)市場レポート 2025-2035年 : 本レポートは、業界とその基礎となる原動力をよりよく理解することを望むなら、新たな収益ポケットを目指す大手企業にとって貴重なも... もっと見る
※上記価格は部署ライセンス(Departmental licence)価格です。
その他の価格についてはデータリソースまでお問合せください。
日本語のページは自動翻訳を利用し作成しています。
実際のレポートは英文のみでご納品いたします。
サマリー
解説
廃棄物からエネルギー(WtE)市場レポート 2025-2035年: 本レポートは、業界とその基礎となる原動力をよりよく理解することを望むなら、新たな収益ポケットを目指す大手企業にとって貴重なものとなるでしょう。異業種への進出や、新たな地域での既存事業の拡大を目指す企業にも有用です。
有利な政府政策とインセンティブと民間セクターの投資
世界各国の政府は、WTE技術の開発と採用を奨励する政策を実施している。これには、税制上の優遇措置、再生可能エネルギー・プロジェクトへの補助金、埋立地からの廃棄物転換を促進する規制枠組みなどが含まれる。地域によっては、WTEプラントが廃棄物管理契約の面で優遇措置を受け、エネルギー生成のための原料の安定供給を確保している。
WTE技術の環境的・経済的利点が明らかになるにつれ、この業界への民間投資は急増している。企業やベンチャーキャピタルは、革新的なWTEソリューションの開発に資金を提供し、技術の進歩と市場の拡大を促進している。例えば、インドの廃棄物からエネルギー・プログラム(The Waste to Energy Programme)は、廃棄物からエネルギー・プラントの開発を支援するため、資金援助とサービス料を提供している。
市場調査レポートを購入する前にすべき質問とは?
-
廃棄物からエネルギー市場はどのように進化しているのか?
-
廃棄物からエネルギー市場の推進要因と抑制要因は何か?
-
各廃棄物エネルギーサブマーケットセグメントは予測期間中にどのように成長し、2035年にはどれくらいの売上を占めるようになるのか?
-
2025年から2035年にかけて、廃棄物からエネルギーへの各サブマーケットの市場シェアはどのように推移するのか?
-
2025年から2035年までの市場全体の主な牽引役は何か?
-
主要な廃棄物からエネルギー市場は、マクロ経済の動きに大まかに追随するのか、それとも個々の国内市場が他を凌駕するのか。
-
2035年までに各国市場のシェアはどのように変化し、2035年にはどの地域が市場をリードするのか?
-
主要プレーヤーは誰で、予測期間中の見通しは?
-
これらの大手企業の廃棄物からエネルギーへのプロジェクトは何か?
-
2025年から2035年の間に、産業はどのように発展していくのか?現在および今後10年間に実施される廃棄物からエネルギーへのプロジェクトにはどのような意味があるのか?
-
廃棄物からエネルギー市場をさらに拡大するために、製品の商業化の必要性は高まっているか?
-
廃棄物からエネルギー市場はどこへ向かっているのか、そしてどのようにすれば市場の最前線に立てるのか?
-
新しい製品ラインに最適な投資方法とは?
-
企業を新たな成長軌道に乗せ、C-suiteに移行させるための重要な展望とは?
このことが、現在、そして今後10年間の廃棄物からエネルギー市場にどのような影響を与えるかを見極める必要がある:
-
全277ページにわたる本レポートは、98の表と112の図表で構成されています。
-
本レポートでは、業界における主要な有利分野を取り上げているため、今すぐターゲットを絞ることができます。
-
世界、地域、国の売上と成長に関する詳細な分析が含まれています。
-
競合他社が成功した主なトレンド、変化、収益予測をハイライトしています。
2035年までの予測やその他の分析から、商業的な展望が見えてきた
-
2035年までの収益予測に加え、最新の実績、成長率、市場シェアもご覧いただけます。
-
ビジネスの展望や展開など、独自の分析が掲載されている。
-
定性的分析(市場力学、促進要因、機会、阻害要因、課題を含む)、ポーターの5つの力モデル、最近の動向をご覧ください。
レポート対象セグメント
廃棄物のタイプ
技術
世界市場全体とセグメント別の収益予測に加え、18の主要国市場の収益予測も掲載しています:
北米
欧州
-
ドイツ
-
オランダ
-
デンマーク
-
ノルウェー
-
フランス
-
英国
-
スウェーデン
-
ベルギー
-
イタリア
-
スイス
-
その他の欧州地域
アジア太平洋
-
中国
-
インド
-
日本
-
韓国
-
シンガポール
-
タイ
-
その他のアジア太平洋地域
その他の地域
本レポートには、2025年から2035年までの廃棄物からエネルギー化市場の主要企業のプロファイルも掲載されている。
報告書に掲載されている主要企業
-
ABB
-
Abu Dhabi National Energy Company PJSC (TAQA)
-
Babcock & Wilcox Enterprises
-
Biffa
-
Enerkem
-
Hitachi, Ltd.
-
Kanadevia Corp
-
Keppel Seghers
-
Mitsubishi Heavy Industries Environmental & Chemical Engineering Co., Ltd. (MHIEC)
-
Ramboll Group
-
Reworld
-
SUEZ
-
Veolia Environmental Services
-
Viridor
-
Wheelabrator (Norican Group)
-
WM Intellectual Property Holdings
2025年から2035年までの廃棄物からエネルギー化市場の世界全体の売上高(金額ベース)は、2025年に380億米ドルを突破する。2035年まで売上は力強く成長すると予測している。当研究所では、最も大きな可能性を秘めた組織を特定しています。各組織の能力、進捗状況、商業的見通しを把握することで、常に一歩先を行くことができます。
2025年から2035年までの廃棄物からエネルギー化市場に関する報告書はどのように役立つのか?
要約すると、270ページを超えるこのレポートは、以下の知識を提供する:
-
廃棄物からエネルギー市場、2025年から2035年までの収益予測。廃棄物の種類と技術ごとに国レベルで予測 - 業界の将来性を発見し、投資と収益に最も有利な場所を見つける。
-
17の主要国市場の2035年までの収益予測 - 主要国の2025年から2035年までの廃棄物からエネルギー市場の予測をご覧ください。
-
既存企業および市場参入を目指す企業の展望 - 2025年から2035年の廃棄物からエネルギー市場に関わる主要企業16社の企業プロファイルを掲載。
独自の予測による定量的・定性的分析をご覧ください。私たちのレポートだけに含まれる情報を入手し、貴重なビジネスインテリジェンスで情報を得ることができます。
他にはない情報
私たちの新しいレポートがあれば、知識に遅れをとったり、チャンスを逃したりする可能性が低くなります。Visiongainのレポートが貴社の調査、分析、意思決定にどのように役立つかをご覧ください。Visiongainの調査は、廃棄物からエネルギーへの市場、2025年から2035年、市場をリードする企業の商業分析を必要とするすべての人のためのものです。データ、トレンド、予測をご覧いただけます。
ページTOPに戻る
目次
1 レポート概要
1.1 調査の目的
1.2 廃棄物からエネルギー化(WtE)市場の紹介
1.3 本レポートの内容
1.4 本レポートを読むべき理由
1.5 本分析レポートが回答する主な質問
1.6 本レポートの対象者
1.7 方法論
1.7.1 市場の定義
1.7.2 市場評価・予測手法
1.7.3 データの検証
1.7.3.1 一次調査
1.7.3.2 セカンダリーリサーチ
1.8 よくある質問(FAQ)
1.9 Visiongainの関連レポート
1.10 Visiongainについて
2 エグゼクティブ・サマリー
3 市場概要
3.1 主要な調査結果
3.2 市場ダイナミクス
3.3 影響分析
3.3.1 市場促進要因
3.3.1.1 市中固形廃棄物の入手可能性が市場を牽引する
3.3.1.2 埋立地削減傾向の高まりが市場成長を促進する
3.3.1.3 廃棄物からエネルギー化プロセスの環境的利点
3.3.2 市場抑制要因
3.3.2.1 環境上の反対によるプラントの減速
3.3.2.2 発展途上国では廃棄物焼却はまだ一般的ではない
3.3.2.3 コスト集約的な設備の性質
3.3.3 市場機会
3.3.3.1 エネルギー生成と安全保障が業界に新たな道を開く
3.3.3.2 技術の進歩が主要な機会をもたらす
3.3.3.3 民間部門の投資と相まって有利な政府政策と奨励金
3.4 ポーターのファイブフォース分析
3.4.1 サプライヤーの交渉力
3.4.2 買い手の交渉力
3.4.3 競争上のライバル関係
3.4.4 代替品の脅威
3.4.5 新規参入企業の脅威
3.5 PEST分析
4 廃棄物からエネルギー(WtE)市場分析:技術別
4.1 主要な調査結果
4.2 技術セグメント市場魅力度指数
4.3 技術別の廃棄物からエネルギー化(WtE)市場規模の推定と予測
4.4 生物学
4.4.1 地域別市場規模、2025~2035年(10億米ドル)
4.4.2 地域別市場シェア、2025年〜2035年(%)
4.5 焼却
4.5.1 地域別市場規模、2025~2035年(10億米ドル)
4.5.2 地域別市場シェア、2025年~2035年(%)
4.6 熱分解
4.6.1 地域別市場規模、2025~2035年(10億米ドル)
4.6.2 地域別市場シェア、2025年~2035年(%)
4.7 ガス化
4.7.1 地域別市場規模、2025~2035年(10億米ドル)
4.7.2 地域別市場シェア、2025年&2035年(%)
5 廃棄物からエネルギー化(WtE)市場分析:廃棄物タイプ別
5.1 主要な調査結果
5.2 廃棄物タイプセグメント市場魅力度指数
5.3 廃棄物からエネルギー化(WtE)の廃棄物タイプ別市場規模の推定と予測
5.4 都市固形廃棄物
5.4.1 地域別市場規模、2025〜2035年(10億米ドル)
5.4.2 地域別市場シェア、2025年〜2035年(%)
5.5 農業廃棄物
5.5.1 地域別市場規模、2025~2035年(10億米ドル)
5.5.2 地域別市場シェア、2025年〜2035年(%)
5.6 その他の廃棄物
5.6.1 地域別市場規模、2025~2035年(10億米ドル)
5.6.2 地域別市場シェア、2025年〜2035年(%)
6 廃棄物からエネルギー(WtE)市場分析:地域別
6.1 主要な調査結果
6.2 地域別市場規模の推定と予測
7 北米の廃棄物からエネルギー(WtE)市場分析
7.1 主要な調査結果
7.2 北米の廃棄物からエネルギー(WtE)市場魅力度指数
7.3 北米の廃棄物からエネルギー(WtE)国別市場、2025年、2030年、2035年(10億米ドル)
7.4 北米の廃棄物からエネルギー(WtE)国別市場規模推定と予測
7.5 北米の廃棄物からエネルギー(WtE)市場規模推定と予測:技術別
7.6 北米の廃棄物からエネルギー(WtE)市場規模推定と予測:廃棄物タイプ別
7.7 米国の廃棄物からエネルギー(WtE)市場分析
7.7.1 WM社が再生可能天然ガス施設を公開
7.8 カナダの廃棄物からエネルギー(WtE)市場分析
7.8.1 カナダ初のカーボンマイナス廃棄物からエネルギー施設発表
8 欧州の廃棄物からエネルギー(WtE)市場分析
8.1 主要な調査結果
8.2 欧州の廃棄物からエネルギー(WtE)市場魅力度指数
8.3 欧州の廃棄物からエネルギー(WtE)国別市場、2025年、2030年、2035年(10億米ドル)
8.4 欧州の廃棄物からエネルギー(WtE)国別市場規模推定と予測
8.5 欧州の廃棄物からエネルギー(WtE)技術別市場規模推定と予測
8.6 欧州の廃棄物からエネルギー(WtE)市場規模推定と予測:廃棄物タイプ別
8.7 イギリスの廃棄物からエネルギー(WtE)市場分析
8.7.1 英国政府が廃棄物からエネルギーへのプラントの新設基準を厳格化
8.7.2 英国でWTEプラントが稼動開始
8.8 ドイツの廃棄物からエネルギー(WtE)市場分析
8.9 フランスの廃棄物からエネルギー(WtE)市場分析
8.9.1 TotalEnergies社がフランス最大のバイオガスプラントを発表
8.10 オランダの廃棄物からエネルギー(WtE)市場分析
8.10.1 ラゴス州が廃棄物からエネルギープラントを建設するためにオランダ企業と提携
8.11 ノルウェーの廃棄物からエネルギー(WtE)市場分析
8.11.1 2026年に廃棄物焼却炉でのCO2回収・貯留が実現へ
8.12 スウェーデンの廃棄物からエネルギー(WtE)市場分析
8.13 デンマークの廃棄物からエネルギー(WtE)市場分析
8.13.1 コペンハーゲン発電所
8.14 ベルギーの廃棄物エネルギー(WtE)市場分析
8.15 イタリア 廃棄物エネルギー(WtE)市場分析
8.15.1 イタリアの電力会社A2Aが1億2000万ドルを投資して廃棄物からエネルギープラントを建設
8.15.2 Axpo社がイタリアでバイオメタン事業を拡大
8.16 スイスの廃棄物エネルギー(WtE)市場分析
8.16.1 Aker Carbon Capture社がスイスで廃棄物からエネルギープラントを建設予定
8.17 その他のヨーロッパの廃棄物エネルギー(WtE)市場分析
9 アジア太平洋地域の廃棄物からエネルギー(WtE)市場分析
9.1 主要な調査結果
9.2 アジア太平洋地域の廃棄物からエネルギー(WtE)市場魅力度指数
9.3 アジア太平洋地域の廃棄物からエネルギー(WtE)市場:国別、2025年、2030年、2035年(10億米ドル)
9.4 アジア太平洋地域の廃棄物からエネルギー(WtE)国別市場規模推定と予測
9.5 アジア太平洋地域の廃棄物からエネルギー(WtE)技術別市場規模推定と予測
9.6 アジア太平洋地域の廃棄物からエネルギー(WtE)市場規模推定と予測:廃棄物タイプ別
9.7 中国の廃棄物からエネルギー(WtE)市場分析
9.7.1 ADBが中国の廃棄物からエネルギープロジェクトを支援
9.8 インドの廃棄物からエネルギー(WtE)市場分析
9.8.1 グジャラート州最大の廃棄物からエネルギー発電所
9.9 日本の廃棄物からエネルギー(WtE)市場分析
9.9.1 MHIECが廃棄物からエネルギー発電所を新設
9.10 韓国の廃棄物からエネルギー(WtE)市場分析
9.10.1 アナエルジア社が韓国のバイオガス施設を受注
9.11 シンガポールの廃棄物からエネルギー(WtE)市場分析
9.12 タイの廃棄物からエネルギー(WtE)市場分析
9.12.1 AFRY社がタイの新しい廃棄物からエネルギープロジェクトの技術パートナーになる
9.12.2 タイの再生可能エネルギー企業が廃棄物からエネルギープロジェクトで戦略的提携を結ぶ
9.13 その他のアジア太平洋地域の廃棄物からエネルギー(WtE)市場分析
10 世界の廃棄物からエネルギー(WtE)市場分析
10.1 主要な調査結果
10.2 世界の廃棄物からエネルギー(WtE)技術別市場規模推定と予測
10.3 世界の廃棄物からエネルギー(WtE)市場規模:廃棄物タイプ推定と予測
11 企業プロフィール
11.1 WM Intellectual Property Holdings
11.1.1 会社概要
11.1.2 会社概要
11.1.3 財務分析
11.1.3.1 純収入、2019-2023年
11.1.3.2 地域別市場シェア、2023年
11.1.3.3 事業セグメント市場シェア(2023年
11.1.4 製品ベンチマーク
11.1.5 戦略的展望
11.2 Veolia Environmental Services
11.2.1 会社概要
11.2.2 会社概要
11.2.3 財務分析
11.2.3.1 純収入、2019年~2023年
11.2.3.2 地域別市場シェア(2023年
11.2.3.3 事業セグメント市場シェア(2023年
11.2.4 製品ベンチマーク
11.2.5 戦略的展望
11.3 Reworld
11.3.1 会社概要
11.3.2 会社概要
11.3.3 製品ベンチマーク
11.3.4 戦略的展望
11.4 SUEZ
11.4.1 会社概要
11.4.2 会社概要
11.4.3 財務分析
11.4.3.1 純収入、2019年~2023年
11.4.3.2 地域別市場シェア(2023年
11.4.3.3 事業セグメント市場シェア(2023年
11.4.4 製品ベンチマーク
11.4.5 戦略的展望
11.5 Babcock & Wilcox
11.5.1 会社概要
11.5.2 会社概要
11.5.3 財務分析
11.5.3.1 純収入、2019-2023年
11.5.3.2 地域別市場シェア(2023年
11.5.3.3 事業セグメント市場シェア(2023年
11.5.4 製品ベンチマーク
11.5.5 戦略的展望
11.6 Keppel Seghers
11.6.1 会社概要
11.6.2 会社概要
11.6.3 製品ベンチマーク
11.6.4 戦略的展望
11.7 Wheelabrator (Norican Group)
11.7.1 会社概要
11.7.2 会社概要
11.7.3 製品ベンチマーク
11.7.4 戦略的展望
11.8 Kanadevia Corporation
11.8.1 会社概要
11.8.2 会社概要
11.8.3 財務分析
11.8.3.1 純収入、2019-2023年
11.8.3.2 地域別市場シェア(2023年
11.8.3.3 事業セグメント市場シェア(2023年
11.8.4 製品ベンチマーク
11.8.5 戦略的展望
11.9 Viridor Limited
11.9.1 会社概要
11.9.2 会社概要
11.9.3 製品ベンチマーク
11.9.4 戦略的展望
11.10 Abu Dhabi National Energy Company PJSC (TAQA)
11.10.1 会社概要
11.10.2 会社概要
11.10.3 製品ベンチマーク
11.10.4 戦略的展望
11.11 Mitsubishi Heavy Industries Environmental & Chemical Engineering Co., Ltd. (MHIEC)
11.11.1 会社概要
11.11.2 会社概要
11.11.3 製品ベンチマーク
11.11.4 戦略的展望
11.12 Hitachi, Ltd.
11.12.1 会社概要
11.12.2 会社概要
11.12.3 財務分析
11.12.3.1 純収入、2019-2024年
11.12.3.2 地域別市場シェア(2024年
11.12.3.3 事業セグメント市場シェア、2024年
11.12.4 製品ベンチマーク
11.12.5 戦略的展望
11.13 Ramboll Group
11.13.1 会社概要
11.13.2 会社概要
11.13.3 財務分析
11.13.3.1 純収入、2019年~2024年
11.13.3.2 地域市場シェア、2024年
11.13.3.3 事業セグメント市場シェア(2024年
11.13.4 製品ベンチマーク
11.13.5 戦略的展望
11.14 ABB
11.14.1 会社概要
11.14.2 会社概要
11.14.3 財務分析
11.14.3.1 純収入、2019年~2023年
11.14.3.2 地域別市場シェア(2023年
11.14.3.3 事業セグメント市場シェア(2023年
11.14.4 製品ベンチマーク
11.14.5 戦略的展望
11.15 Biffa
11.15.1 会社概要
11.15.2 会社概要
11.15.3 製品ベンチマーク
11.15.4 戦略的展望
11.16 Enerkem
11.16.1 会社概要
11.16.2 会社概要
11.16.3 製品ベンチマーク
11.16.4 戦略的展望
12 結論と提言
12.1 Visiongainの結語
12.2 市場プレイヤーへの提言
ページTOPに戻る
図表リスト
List of Tables
Table 1 Waste to Energy (WtE) Market Snapshot, 2025 & 2035 (US$ Billion, CAGR %)
Table 2 Waste to Energy (WtE) Market Forecast by Technology, 2025-2035 (US$ Billion, AGR%, CAGR%)
Table 3 Biological Segment Market Forecast by Region, 2025-2035 (US$ Billion, AGR%, CAGR%)
Table 4 Incineration Segment Market Forecast by Region, 2025-2035 (US$ Billion, AGR%, CAGR%)
Table 5 Pyrolysis Segment Market Forecast by Region, 2025-2035 (US$ Billion, AGR%, CAGR%)
Table 6 Gasification Segment Market Forecast by Region, 2025-2035 (US$ Billion, AGR%, CAGR%)
Table 7 Waste to Energy (WtE) Market Forecast by Waste Type, 2025-2035 (US$ Billion, AGR%, CAGR%)
Table 8 Municipal Solid Waste Segment Market Forecast by Region, 2025-2035 (US$ Billion, AGR%, CAGR%)
Table 9 Agricultural Waste Segment Market Forecast by Region, 2025-2035 (US$ Billion, AGR%, CAGR%)
Table 10 Other Waste Segment Market Forecast by Region, 2025-2035 (US$ Billion, AGR%, CAGR%)
Table 11 Waste to Energy (WtE) Market Forecast by Region, 2025-2035 (US$ Billion, AGR%, CAGR%)
Table 12 North America Waste to Energy (WtE) Market Forecast by Country, 2025-2035 (US$ Billion, AGR%, CAGR%)
Table 13 North America Waste to Energy (WtE) Market Forecast by Technology, 2025-2035 (US$ Billion, AGR%, CAGR%)
Table 14 North America Waste to Energy (WtE) Market Forecast by Waste Type, 2025-2035 (US$ Billion, AGR%, CAGR%)
Table 15 U.S. Waste to Energy Plants
Table 16 U.S. Waste to Energy (WtE) Market Forecast, 2025-2035 (US$ Billion, AGR%, CAGR%)
Table 17 Canada Waste to Energy (WtE) Market Forecast, 2025-2035 (US$ Billion, AGR%, CAGR%)
Table 18 Europe Waste to Energy (WtE) Market Forecast by Country, 2025-2035 (US$ Billion, AGR%, CAGR%)
Table 19 Europe Waste to Energy (WtE) Market Forecast by Technology, 2025-2035 (US$ Billion, AGR%, CAGR%)
Table 20 Europe Waste to Energy (WtE) Market Forecast by Waste Type, 2025-2035 (US$ Billion, AGR%, CAGR%)
Table 21 UK Waste to Energy Plants
Table 22 UK Waste to Energy (WtE) Market Forecast, 2025-2035 (US$ Billion, AGR%, CAGR%)
Table 23 Germany Waste to Energy Plants
Table 24 Germany Waste to Energy (WtE) Market Forecast, 2025-2035 (US$ Billion, AGR%, CAGR%)
Table 25 France Waste to Energy Plants
Table 26 France Waste to Energy (WtE) Market Forecast, 2025-2035 (US$ Billion, AGR%, CAGR%)
Table 27 Netherlands Waste to Energy Plants
Table 28 Netherlands Waste to Energy (WtE) Market Forecast, 2025-2035 (US$ Billion, AGR%, CAGR%)
Table 29 Norway Waste to Energy (WtE) Market Forecast, 2025-2035 (US$ Billion, AGR%, CAGR%)
Table 30 Sweden Waste to Energy (WtE) Market Forecast, 2025-2035 (US$ Billion, AGR%, CAGR%)
Table 31 Denmark Waste to Energy (WtE) Market Forecast, 2025-2035 (US$ Billion, AGR%, CAGR%)
Table 32 Belgium Waste to Energy (WtE) Market Forecast, 2025-2035 (US$ Billion, AGR%, CAGR%)
Table 33 Italy Waste to Energy (WtE) Market Forecast, 2025-2035 (US$ Billion, AGR%, CAGR%)
Table 34 Switzerland Waste to Energy (WtE) Market Forecast, 2025-2035 (US$ Billion, AGR%, CAGR%)
Table 35 Rest of Europe Waste to Energy (WtE) Market Forecast, 2025-2035 (US$ Billion, AGR%, CAGR%)
Table 36 Asia Pacific Waste to Energy (WtE) Market Forecast by Country, 2025-2035 (US$ Billion, AGR%, CAGR%)
Table 37 Asia Pacific Waste to Energy (WtE) Market Forecast by Technology, 2025-2035 (US$ Billion, AGR%, CAGR%)
Table 38 Asia Pacific Waste to Energy (WtE) Market Forecast by Waste Type, 2025-2035 (US$ Billion, AGR%, CAGR%)
Table 39 China Waste to Energy Plants
Table 40 China Waste to Energy (WtE) Market Forecast, 2025-2035 (US$ Billion, AGR%, CAGR%)
Table 41 India Waste to Energy (WtE) Market Forecast, 2025-2035 (US$ Billion, AGR%, CAGR%)
Table 42 Japan Plants
Table 43 Japan Waste to Energy (WtE) Market Forecast, 2025-2035 (US$ Billion, AGR%, CAGR%)
Table 44 South Korea Waste to Energy (WtE) Market Forecast, 2025-2035 (US$ Billion, AGR%, CAGR%)
Table 45 Singapore Waste to Energy (WtE) Market Forecast, 2025-2035 (US$ Billion, AGR%, CAGR%)
Table 46 Thailand Waste to Energy (WtE) Market Forecast, 2025-2035 (US$ Billion, AGR%, CAGR%)
Table 47 Rest of Asia Pacific Waste to Energy (WtE) Market Forecast, 2025-2035 (US$ Billion, AGR%, CAGR%)
Table 48 Rest of the World Waste to Energy (WtE) Market Forecast by Technology, 2025-2035 (US$ Billion, AGR%, CAGR%)
Table 49 Rest of the World Waste to Energy (WtE) Market Forecast by Waste Type, 2025-2035 (US$ Billion, AGR%, CAGR%)
Table 50 Rest of the World Waste to Energy (WtE) Market Forecast, 2025-2035 (US$ Billion, AGR%, CAGR%)
Table 51 WM Intellectual Property Holdings: Key Details, (CEO, HQ, Revenue, Founded, No. of Employees, Company Type, Website, Business Segment)
Table 52 WM Intellectual Property Holdings: Product Benchmarking
Table 53 WM Intellectual Property Holdings: Strategic Outlook
Table 54 Veolia Environmental Services: Key Details, (CEO, HQ, Revenue, Founded, No. of Employees, Company Type, Website, Business Segment)
Table 55 Veolia Environmental Services: Product Benchmarking
Table 56 Veolia Environmental Services: Strategic Outlook
Table 57 Reworld: Key Details, (CEO, HQ, Revenue, Founded, No. of Employees, Company Type, Website, Business Segment)
Table 58 Reworld: Product Benchmarking
Table 59 Reworld: Strategic Outlook
Table 60 SUEZ: Key Details, (CEO, HQ, Revenue, Founded, No. of Employees, Company Type, Website, Business Segment)
Table 61 SUEZ: Product Benchmarking
Table 62 SUEZ: Strategic Outlook
Table 63 Babcock & Wilcox: Key Details, (CEO, HQ, Revenue, Founded, No. of Employees, Company Type, Website, Business Segment)
Table 64 Babcock & Wilcox: Product Benchmarking
Table 65 Babcock & Wilcox: Strategic Outlook
Table 66 Keppel Seghers: Key Details, (CEO, HQ, Revenue, Founded, No. of Employees, Company Type, Website, Business Segment)
Table 67 Keppel Seghers: Product Benchmarking
Table 68 Keppel Seghers: Strategic Outlook
Table 69 Wheelabrator (Norican Group): Key Details, (CEO, HQ, Revenue, Founded, No. of Employees, Company Type, Website, Business Segment)
Table 70 Wheelabrator (Norican Group): Product Benchmarking
Table 71 Wheelabrator (Norican Group): Strategic Outlook
Table 72 Kanadevia Corporation: Key Details, (CEO, HQ, Revenue, Founded, No. of Employees, Company Type, Website, Business Segment)
Table 73 Kanadevia Corporation: Product Benchmarking
Table 74 Kanadevia Corporation: Strategic Outlook
Table 75 Viridor Limited: Key Details, (CEO, HQ, Revenue, Founded, No. of Employees, Company Type, Website, Business Segment)
Table 76 Viridor Limited: Product Benchmarking
Table 77 Viridor Limited: Strategic Outlook
Table 78 Abu Dhabi National Energy Company PJSC (TAQA): Key Details, (CEO, HQ, Revenue, Founded, No. of Employees, Company Type, Website, Business Segment)
Table 79 Abu Dhabi National Energy Company PJSC (TAQA): Product Benchmarking
Table 80 Abu Dhabi National Energy Company PJSC (TAQA): Strategic Outlook
Table 81 Mitsubishi Heavy Industries Environmental & Chemical Engineering Co., Ltd. (MHIEC): Key Details, (CEO, HQ, Revenue, Founded, No. of Employees, Company Type, Website, Business Segment)
Table 82 Mitsubishi Heavy Industries Environmental & Chemical Engineering Co., Ltd. (MHIEC): Product Benchmarking
Table 83 Mitsubishi Heavy Industries Environmental & Chemical Engineering Co., Ltd. (MHIEC): Strategic Outlook
Table 84 Hitachi, Ltd.: Key Details, (CEO, HQ, Revenue, Founded, No. of Employees, Company Type, Website, Business Segment)
Table 85 Hitachi, Ltd.: Product Benchmarking
Table 86 Hitachi, Ltd.: Strategic Outlook
Table 87 Ramboll Group: Key Details, (CEO, HQ, Revenue, Founded, No. of Employees, Company Type, Website, Business Segment)
Table 88 Ramboll Group: Product Benchmarking
Table 89 Ramboll Group: Strategic Outlook
Table 90 ABB: Key Details, (CEO, HQ, Revenue, Founded, No. of Employees, Company Type, Website, Business Segment)
Table 91 ABB: Product Benchmarking
Table 92 ABB: Strategic Outlook
Table 93 Biffa: Key Details, (CEO, HQ, Revenue, Founded, No. of Employees, Company Type, Website, Business Segment)
Table 94 Biffa: Product Benchmarking
Table 95 Biffa: Strategic Outlook
Table 96 Enerkem: Key Details, (CEO, HQ, Revenue, Founded, No. of Employees, Company Type, Website, Business Segment)
Table 97 Enerkem: Product Benchmarking
Table 98 Enerkem: Strategic Outlook
List of Figures
Figure 1 Waste to Energy (WtE) Market Segmentation
Figure 2 Waste to Energy (WtE) Market by Technology: Market Attractiveness Index
Figure 3 Waste to Energy (WtE) Market by Waste Type: Market Attractiveness Index
Figure 4 Waste to Energy (WtE) Market Attractiveness Index by Region
Figure 5 Waste to Energy (WtE) Market: Market Dynamics
Figure 6 Waste to Energy (WtE) Market: Impact Analysis
Figure 7 Waste to Energy (WtE) Market: Porter’s Five Forces Analysis
Figure 8 Waste to Energy (WtE) Market: PEST Analysis
Figure 9 Waste to Energy (WtE) Market by Technology: Market Attractiveness Index
Figure 10 Waste to Energy (WtE) Market Forecast by Technology, 2025-2035 (US$ Billion, AGR %)
Figure 11 Waste to Energy (WtE) Market Share Forecast by Technology, 2025, 2030, 2035 (%)
Figure 12 Biological Segment Market Forecast by Region, 2025-2035 (US$ Billion, AGR %)
Figure 13 Biological Segment Market Share Forecast by Region, 2025 & 2035 (%)
Figure 14 Incineration Segment Market Forecast by Region, 2025-2035 (US$ Billion, AGR %)
Figure 15 Incineration Segment Market Share Forecast by Region, 2025 & 2035 (%)
Figure 16 Pyrolysis Segment Market Forecast by Region, 2025-2035 (US$ Billion, AGR %)
Figure 17 Pyrolysis Segment Market Share Forecast by Region, 2025 & 2035 (%)
Figure 18 Gasification Segment Market Forecast by Region, 2025-2035 (US$ Billion, AGR %)
Figure 19 Gasification Segment Market Share Forecast by Region, 2025 & 2035 (%)
Figure 20 Waste to Energy (WtE) Market by Waste Type: Market Attractiveness Index
Figure 21 Waste to Energy (WtE) Market Forecast by Waste Type, 2025-2035 (US$ Billion, AGR %)
Figure 22 Waste to Energy (WtE) Market Share Forecast by Waste Type, 2025, 2030, 2035 (%)
Figure 23 Municipal Solid Waste Segment Market Forecast by Region, 2025-2035 (US$ Billion, AGR %)
Figure 24 Municipal Solid Waste Segment Market Share Forecast by Region, 2025 & 2035 (%)
Figure 25 Agricultural Waste Segment Market Forecast by Region, 2025-2035 (US$ Billion, AGR %)
Figure 26 Agricultural Waste Segment Market Share Forecast by Region, 2025 & 2035 (%)
Figure 27 Other Waste Segment Market Forecast by Region, 2025-2035 (US$ Billion, AGR %)
Figure 28 Other Waste Segment Market Share Forecast by Region, 2025 & 2035 (%)
Figure 29 Waste to Energy (WtE) Market Forecast by Region 2025 and 2035 (Revenue, CAGR%)
Figure 30 Waste to Energy (WtE) Market Share Forecast by Region 2025, 2030, 2035 (%)
Figure 31 Waste to Energy (WtE) Market by Region, 2025-2035 (US$ Billion, AGR %)
Figure 32 North America Waste to Energy (WtE) Market Attractiveness Index
Figure 33 North America Waste to Energy (WtE) Market by Region, 2025, 2030 & 2035 (US$ Billion)
Figure 34 North America Waste to Energy (WtE) Market Forecast by Country, 2025-2035 (US$ Billion, AGR %)
Figure 35 North America Waste to Energy (WtE) Market Share Forecast by Country, 2025 & 2035 (%)
Figure 36 North America Waste to Energy (WtE) Market Forecast by Technology, 2025-2035 (US$ Billion, AGR %)
Figure 37 North America Waste to Energy (WtE) Market Share Forecast by Technology, 2025 & 2035 (%)
Figure 38 North America Waste to Energy (WtE) Market Forecast by Waste Type, 2025-2035 (US$ Billion, AGR %)
Figure 39 North America Waste to Energy (WtE) Market Share Forecast by Waste Type, 2025 & 2035 (%)
Figure 40 U.S. Waste to Energy (WtE) Market Forecast, 2025-2035 (US$ Billion, AGR %)
Figure 41 Canada Waste to Energy (WtE) Market Forecast, 2025-2035 (US$ Billion, AGR %)
Figure 42 Europe Waste to Energy (WtE) Market Attractiveness Index
Figure 43 Europe Waste to Energy (WtE) Market by Region, 2025, 2030 & 2035 (US$ Billion)
Figure 44 Europe Waste to Energy (WtE) Market Forecast by Country, 2025-2035 (US$ Billion, AGR %)
Figure 45 Europe Waste to Energy (WtE) Market Share Forecast by Country, 2025 & 2035 (%)
Figure 46 Europe Waste to Energy (WtE) Market Forecast by Technology, 2025-2035 (US$ Billion, AGR %)
Figure 47 Europe Waste to Energy (WtE) Market Share Forecast by Technology, 2025 & 2035 (%)
Figure 48 Europe Waste to Energy (WtE) Market Forecast by Waste Type, 2025-2035 (US$ Billion, AGR %)
Figure 49 Europe Waste to Energy (WtE) Market Share Forecast by Waste Type, 2025 & 2035 (%)
Figure 50 UK Waste to Energy (WtE) Market Forecast, 2025-2035 (US$ Billion, AGR %)
Figure 51 Germany Waste to Energy (WtE) Market Forecast, 2025-2035 (US$ Billion, AGR %)
Figure 52 France Waste to Energy (WtE) Market Forecast, 2025-2035 (US$ Billion, AGR %)
Figure 53 Netherlands Waste to Energy (WtE) Market Forecast, 2025-2035 (US$ Billion, AGR %)
Figure 54 Norway Waste to Energy (WtE) Market Forecast, 2025-2035 (US$ Billion, AGR %)
Figure 55 Sweden Waste to Energy (WtE) Market Forecast, 2025-2035 (US$ Billion, AGR %)
Figure 56 Denmark Waste to Energy (WtE) Market Forecast, 2025-2035 (US$ Billion, AGR %)
Figure 57 Belgium Waste to Energy (WtE) Market Forecast, 2025-2035 (US$ Billion, AGR %)
Figure 58 Italy Waste to Energy (WtE) Market Forecast, 2025-2035 (US$ Billion, AGR %)
Figure 59 Switzerland Waste to Energy (WtE) Market Forecast, 2025-2035 (US$ Billion, AGR %)
Figure 60 Rest of Europe Waste to Energy (WtE) Market Forecast, 2025-2035 (US$ Billion, AGR %)
Figure 61 Asia Pacific Waste to Energy (WtE) Market Attractiveness Index
Figure 62 Asia Pacific Waste to Energy (WtE) Market by Region, 2025, 2030 & 2035 (US$ Billion)
Figure 63 Asia Pacific Waste to Energy (WtE) Market Forecast by Country, 2025-2035 (US$ Billion, AGR %)
Figure 64 Asia Pacific Waste to Energy (WtE) Market Share Forecast by Country, 2025 & 2035 (%)
Figure 65 Asia Pacific Waste to Energy (WtE) Market Forecast by Technology, 2025-2035 (US$ Billion, AGR %)
Figure 66 Asia Pacific Waste to Energy (WtE) Market Share Forecast by Technology, 2025 & 2035 (%)
Figure 67 Asia Pacific Waste to Energy (WtE) Market Forecast by Waste Type, 2025-2035 (US$ Billion, AGR %)
Figure 68 Asia Pacific Waste to Energy (WtE) Market Share Forecast by Waste Type, 2025 & 2035 (%)
Figure 69 China Waste to Energy (WtE) Market Forecast, 2025-2035 (US$ Billion, AGR %)
Figure 70 India Waste to Energy (WtE) Market Forecast, 2025-2035 (US$ Billion, AGR %)
Figure 71 Japan Waste to Energy (WtE) Market Forecast, 2025-2035 (US$ Billion, AGR %)
Figure 72 South Korea Waste to Energy (WtE) Market Forecast, 2025-2035 (US$ Billion, AGR %)
Figure 73 Singapore Waste to Energy (WtE) Market Forecast, 2025-2035 (US$ Billion, AGR %)
Figure 74 Thailand Waste to Energy (WtE) Market Forecast, 2025-2035 (US$ Billion, AGR %)
Figure 75 Rest of Asia Pacific Waste to Energy (WtE) Market Forecast, 2025-2035 (US$ Billion, AGR %)
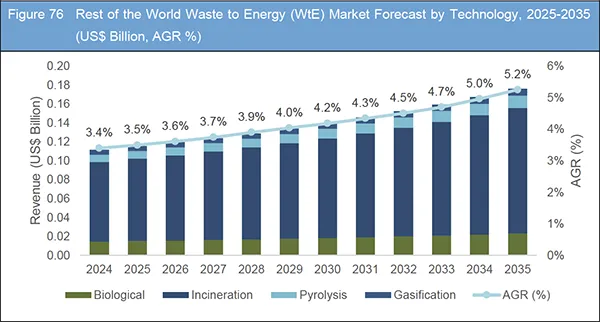
Figure 76 Rest of the World Waste to Energy (WtE) Market Forecast by Technology, 2025-2035 (US$ Billion, AGR %)
Figure 77 Rest of the World Waste to Energy (WtE) Market Share Forecast by Technology, 2025 & 2035 (%)
Figure 78 Rest of the World Waste to Energy (WtE) Market Forecast by Waste Type, 2025-2035 (US$ Billion, AGR %)
Figure 79 Rest of the World Waste to Energy (WtE) Market Share Forecast by Waste Type, 2025 & 2035 (%)
Figure 80 Rest of the World Waste to Energy (WtE) Market Forecast, 2025-2035 (US$ Billion, AGR %)
Figure 81 WM Intellectual Property Holdings: Net Revenue, 2019-2023 (US$ Million, AGR%)
Figure 82 WM Intellectual Property Holdings: Regional Market Shares, 2023
Figure 83 WM Intellectual Property Holdings: Business Segment Market Shares, 2023
Figure 84 Veolia Environmental Services: Net Revenue, 2019-2023 (US$ Million, AGR%)
Figure 85 Veolia Environmental Services: Regional Market Shares, 2023
Figure 86 Veolia Environmental Services: Business Segment Market Shares, 2023
Figure 87 SUEZ: Net Revenue, 2019-2023 (US$ Million, AGR%)
Figure 88 SUEZ: Regional Market Shares, 2023
Figure 89 SUEZ: Business Segment Market Shares, 2023
Figure 90 Babcock & Wilcox: Net Revenue, 2019-2023 (US$ Million, AGR%)
Figure 91 Babcock & Wilcox: Regional Market Shares, 2023
Figure 92 Babcock & Wilcox: Business Segment Market Shares, 2023
Figure 93 Kanadevia Corporation: Net Revenue, 2019-2023 (US$ Million, AGR%)
Figure 94 Kanadevia Corporation: Regional Market Shares, 2023
Figure 95 Kanadevia Corporation: Business Segment Market Shares, 2023
Figure 96 Hitachi, Ltd.: Net Revenue, 2019-2024 (US$ Million, AGR%)
Figure 97 Hitachi, Ltd.: Regional Market Shares, 2024
Figure 98 Hitachi, Ltd.: Business Segment Market Shares, 2024
Figure 99 Ramboll Group: Net Revenue, 2019-2024 (US$ Million, AGR%)
Figure 100 Ramboll Group: Regional Market Shares, 2024
Figure 101 Ramboll Group: Business Segment Market Shares, 2024
Figure 102 ABB: Net Revenue, 2019-2023 (US$ Million, AGR%)
Figure 103 ABB: Regional Market Shares, 2023
Figure 104 ABB: Business Segment Market Shares, 2023
ページTOPに戻る
Summary
Description
The Waste to Energy (WtE) Market Report 2025-2035: This report will prove invaluable to leading firms striving for new revenue pockets if they wish to better understand the industry and its underlying dynamics. It will be useful for companies that would like to expand into different industries or to expand their existing operations in a new region.
Favourable Government Policies and Incentives Coupled with Private Sector Investment
Governments around the world are implementing policies that encourage the development and adoption of WTE technology. These include tax incentives, subsidies for renewable energy projects, and regulatory frameworks that promote waste diversion from landfills. In some regions, WTE plants receive preferential treatment in terms of waste management contracts, ensuring a steady supply of feedstock for energy generation.
As the environmental and economic benefits of WTE technology become more apparent, private sector investment in the industry has surged. Corporations and venture capital firms are funding the development of innovative WTE solutions, driving technological advancements and the expansion of the market. For instance, The Waste to Energy Programme in India offers financial assistance and service charges to support the development of waste to energy plants.
What Questions Should You Ask before Buying a Market Research Report?
-
How is the waste to energy market evolving?
-
What is driving and restraining the waste to energy market?
-
How will each waste to energy submarket segment grow over the forecast period and how much revenue will these submarkets account for in 2035?
-
How will the market shares for each waste to energy submarket develop from 2025 to 2035?
-
What will be the main driver for the overall market from 2025 to 2035?
-
Will leading waste to energy markets broadly follow the macroeconomic dynamics, or will individual national markets outperform others?
-
How will the market shares of the national markets change by 2035 and which geographical region will lead the market in 2035?
-
Who are the leading players and what are their prospects over the forecast period?
-
What are the waste to energy projects for these leading companies?
-
How will the industry evolve during the period between 2025 and 2035? What are the implications of waste to energy projects taking place now and over the next 10 years?
-
Is there a greater need for product commercialisation to further scale the waste to energy market?
-
Where is the waste to energy market heading and how can you ensure you are at the forefront of the market?
-
What are the best investment options for new product lines?
-
What are the key prospects for moving companies into a new growth path and C-suite?
You need to discover how this will impact the waste to energy market today, and over the next 10 years:
-
Our 277-page report provides 98 tables and 112 charts/graphs exclusively to you.
-
The report highlights key lucrative areas in the industry so you can target them – NOW.
-
It contains in-depth analysis of global, regional and national sales and growth.
-
It highlights for you the key successful trends, changes and revenue projections made by your competitors.
Forecasts to 2035 and other analyses reveal commercial prospects
-
In addition to revenue forecasting to 2035, our new study provides you with recent results, growth rates, and market shares.
-
You will find original analyses, with business outlooks and developments.
-
Discover qualitative analyses (including market dynamics, drivers, opportunities, restraints and challenges), porter’s five forces model, and recent developments.
Segments Covered in the Report
Waste Type
-
Municipal
-
Agricultural
-
Others
Technology
-
Biological
-
Incineration
-
Pyrolysis
-
Gasification
In addition to the revenue predictions for the overall world market and segments, you will also find revenue forecasts for 18 leading national markets:
North America
Europe
-
Germany
-
Netherlands
-
Denmark
-
Norway
-
France
-
UK
-
Sweden
-
Belgium
-
Italy
-
Switzerland
-
Rest of Europe
Asia Pacific
-
China
-
India
-
Japan
-
South Korea
-
Singapore
-
Thailand
-
Rest of Asia Pacific
Rest of the World
The report also includes profiles and for some of the leading companies in the Waste to Energy Market, 2025 to 2035, with a focus on this segment of these companies’ operations.
Leading companies profiled in the report
-
ABB
-
Abu Dhabi National Energy Company PJSC (TAQA)
-
Babcock & Wilcox Enterprises
-
Biffa
-
Enerkem
-
Hitachi, Ltd.
-
Kanadevia Corp
-
Keppel Seghers
-
Mitsubishi Heavy Industries Environmental & Chemical Engineering Co., Ltd. (MHIEC)
-
Ramboll Group
-
Reworld
-
SUEZ
-
Veolia Environmental Services
-
Viridor
-
Wheelabrator (Norican Group)
-
WM Intellectual Property Holdings
Overall world revenue for Waste to Energy Market, 2025 to 2035 in terms of value the market will surpass US$38.0 billion in 2025, our work calculates. We predict strong revenue growth through to 2035. Our work identifies which organizations hold the greatest potential. Discover their capabilities, progress, and commercial prospects, helping you stay ahead.
How will the Waste to Energy Market, 2025 to 2035 report help you?
In summary, our 270+ page report provides you with the following knowledge:
-
Revenue forecasts to 2035 for Waste to Energy Market, 2025 to 2035, with forecasts for waste type and technology each forecast at a country level – discover the industry’s prospects, finding the most lucrative places for investments and revenues.
-
Revenue forecasts to 2035 for 17 key national markets – See forecasts for the Waste to Energy Market, 2025 to 2035 market in leading nations.
-
Prospects for established firms and those seeking to enter the market – including company profiles for 16 of the major companies involved in the Waste to Energy Market, 2025 to 2035.
Find quantitative and qualitative analyses with independent predictions. Receive information that only our report contains, staying informed with invaluable business intelligence.
Information found nowhere else
With our new report, you are less likely to fall behind in knowledge or miss out on opportunities. See how our work could benefit your research, analyses, and decisions. Visiongain’s study is for everybody needing commercial analyses for the Waste to Energy Market, 2025 to 2035, market-leading companies. You will find data, trends and predictions.
ページTOPに戻る
Table of Contents
1 Report Overview
1.1 Objectives of the Study
1.2 Introduction to Waste to Energy (WtE) Market
1.3 What This Report Delivers
1.4 Why You Should Read This Report
1.5 Key Questions Answered by This Analytical Report
1.6 Who is This Report for?
1.7 Methodology
1.7.1 Market Definitions
1.7.2 Market Evaluation & Forecasting Methodology
1.7.3 Data Validation
1.7.3.1 Primary Research
1.7.3.2 Secondary Research
1.8 Frequently Asked Questions (FAQs)
1.9 Associated Visiongain Reports
1.10 About Visiongain
2 Executive Summary
3 Market Overview
3.1 Key Findings
3.2 Market Dynamics
3.3 Impact Analysis
3.3.1 Market Driving Factors
3.3.1.1 Availability of Municipal Solid Waste to Drive the Market
3.3.1.2 Growing Trend of Landfill Reduction to Propel Market Growth
3.3.1.3 Environmental Benefits of Waste-to -Energy Process
3.3.2 Market Restraining Factors
3.3.2.1 Plant Slowdowns Due to Environmental Opposition
3.3.2.2 Waste Incineration Remains an Uncommon Practice in Developing Countries
3.3.2.3 Cost-Intensive Nature of Equipment
3.3.3 Market Opportunities
3.3.3.1 Energy Generation and Security to Open New Avenues for the Industry
3.3.3.2 Technological Advancements to Provide Key Opportunity
3.3.3.3 Favorable Government Policies and Incentives Coupled with Private Sector Investment
3.4 Porter’s Five Forces Analysis
3.4.1 Bargaining Power of Suppliers
3.4.2 Bargaining Power of Buyers
3.4.3 Competitive Rivalry
3.4.4 Threat of Substitutes
3.4.5 Threat of New Entrants
3.5 PEST Analysis
4 Waste to Energy (WtE) Market Analysis by Technology
4.1 Key Findings
4.2 Technology Segment: Market Attractiveness Index
4.3 Waste to Energy (WtE) Market Size Estimation and Forecast by Technology
4.4 Biological
4.4.1 Market Size by Region, 2025-2035 (US$ Billion)
4.4.2 Market Share by Region, 2025 & 2035 (%)
4.5 Incineration
4.5.1 Market Size by Region, 2025-2035 (US$ Billion)
4.5.2 Market Share by Region, 2025 & 2035 (%)
4.6 Pyrolysis
4.6.1 Market Size by Region, 2025-2035 (US$ Billion)
4.6.2 Market Share by Region, 2025 & 2035 (%)
4.7 Gasification
4.7.1 Market Size by Region, 2025-2035 (US$ Billion)
4.7.2 Market Share by Region, 2025 & 2035 (%)
5 Waste to Energy (WtE) Market Analysis by Waste Type
5.1 Key Findings
5.2 Waste Type Segment: Market Attractiveness Index
5.3 Waste to Energy (WtE) Market Size Estimation and Forecast by Waste Type
5.4 Municipal Solid Waste
5.4.1 Market Size by Region, 2025-2035 (US$ Billion)
5.4.2 Market Share by Region, 2025 & 2035 (%)
5.5 Agricultural Waste
5.5.1 Market Size by Region, 2025-2035 (US$ Billion)
5.5.2 Market Share by Region, 2025 & 2035 (%)
5.6 Other Waste
5.6.1 Market Size by Region, 2025-2035 (US$ Billion)
5.6.2 Market Share by Region, 2025 & 2035 (%)
6 Waste to Energy (WtE) Market Analysis by Region
6.1 Key Findings
6.2 Regional Market Size Estimation and Forecast
7 North America Waste to Energy (WtE) Market Analysis
7.1 Key Findings
7.2 North America Waste to Energy (WtE) Market Attractiveness Index
7.3 North America Waste to Energy (WtE) Market by Country, 2025, 2030 & 2035 (US$ Billion)
7.4 North America Waste to Energy (WtE) Market Size Estimation and Forecast by Country
7.5 North America Waste to Energy (WtE) Market Size Estimation and Forecast by Technology
7.6 North America Waste to Energy (WtE) Market Size Estimation and Forecast by Waste Type
7.7 U.S. Waste to Energy (WtE) Market Analysis
7.7.1 WM Unveiled Renewable Natural Gas Facility
7.8 Canada Waste to Energy (WtE) Market Analysis
7.8.1 Canada's First Carbon-Negative Waste-to-Energy Facility Announced
8 Europe Waste to Energy (WtE) Market Analysis
8.1 Key Findings
8.2 Europe Waste to Energy (WtE) Market Attractiveness Index
8.3 Europe Waste to Energy (WtE) Market by Country, 2025, 2030 & 2035 (US$ Billion)
8.4 Europe Waste to Energy (WtE) Market Size Estimation and Forecast by Country
8.5 Europe Waste to Energy (WtE) Market Size Estimation and Forecast by Technology
8.6 Europe Waste to Energy (WtE) Market Size Estimation and Forecast by Waste Type
8.7 UK Waste to Energy (WtE) Market Analysis
8.7.1 UK Government Tightens Criteria for New Waste-to-Energy Plants
8.7.2 WTE Plant Goes Online in UK
8.8 Germany Waste to Energy (WtE) Market Analysis
8.9 France Waste to Energy (WtE) Market Analysis
8.9.1 TotalEnergies Unveiled Largest Biogas Plant in France
8.10 Netherlands Waste to Energy (WtE) Market Analysis
8.10.1 Lagos State Collaborates with Dutch Firm to Create Waste-to-Energy Plant
8.11 Norway Waste to Energy (WtE) Market Analysis
8.11.1 CO2 Capture and Storage on Waste Incinerator to Become Reality in 2026
8.12 Sweden Waste to Energy (WtE) Market Analysis
8.13 Denmark Waste to Energy (WtE) Market Analysis
8.13.1 Copenhagen Power Plant
8.14 Belgium Waste to Energy (WtE) Market Analysis
8.15 Italy Waste to Energy (WtE) Market Analysis
8.15.1 Italian utility A2A Invests $120 Million to Make Waste-to-Energy Plant
8.15.2 Axpo Expands Biomethane Activities in Italy
8.16 Switzerland Waste to Energy (WtE) Market Analysis
8.16.1 Aker Carbon Capture will be Constructing a New Swiss Waste-to Energy Plant
8.17 Rest of Europe Waste to Energy (WtE) Market Analysis
9 Asia Pacific Waste to Energy (WtE) Market Analysis
9.1 Key Findings
9.2 Asia Pacific Waste to Energy (WtE) Market Attractiveness Index
9.3 Asia Pacific Waste to Energy (WtE) Market by Country, 2025, 2030 & 2035 (US$ Billion)
9.4 Asia Pacific Waste to Energy (WtE) Market Size Estimation and Forecast by Country
9.5 Asia Pacific Waste to Energy (WtE) Market Size Estimation and Forecast by Technology
9.6 Asia Pacific Waste to Energy (WtE) Market Size Estimation and Forecast by Waste Type
9.7 China Waste to Energy (WtE) Market Analysis
9.7.1 ADB Backs China Waste-to-Energy Project
9.8 India Waste to Energy (WtE) Market Analysis
9.8.1 Gujarat's Largest Waste-to-Energy Power Generation Plant
9.9 Japan Waste to Energy (WtE) Market Analysis
9.9.1 MHIEC Builds a New Waste-to-Energy Plant
9.10 South Korea Waste to Energy (WtE) Market Analysis
9.10.1 Anaergia Wins Contract for Korean Biogas Facility
9.11 Singapore Waste to Energy (WtE) Market Analysis
9.12 Thailand Waste to Energy (WtE) Market Analysis
9.12.1 AFRY is the Technical Partner in a New Waste-to-Energy Project in Thailand
9.12.2 Thai Renewable Energy Firms Form Strategic Alliance For Waste-To-Energy Projects
9.13 Rest of Asia Pacific Waste to Energy (WtE) Market Analysis
10 Rest of the World Waste to Energy (WtE) Market Analysis
10.1 Key Findings
10.2 Rest of the World Waste to Energy (WtE) Market Size Estimation and Forecast by Technology
10.3 Rest of the World Waste to Energy (WtE) Market Size Estimation and Forecast by Waste Type
11 Company Profiles
11.1 WM Intellectual Property Holdings
11.1.1 Company Snapshot
11.1.2 Company Overview
11.1.3 Financial Analysis
11.1.3.1 Net Revenue, 2019-2023
11.1.3.2 Regional Market Shares, 2023
11.1.3.3 Business Segment Market Shares, 2023
11.1.4 Product Benchmarking
11.1.5 Strategic Outlook
11.2 Veolia Environmental Services
11.2.1 Company Snapshot
11.2.2 Company Overview
11.2.3 Financial Analysis
11.2.3.1 Net Revenue, 2019-2023
11.2.3.2 Regional Market Shares, 2023
11.2.3.3 Business Segment Market Shares, 2023
11.2.4 Product Benchmarking
11.2.5 Strategic Outlook
11.3 Reworld
11.3.1 Company Snapshot
11.3.2 Company Overview
11.3.3 Product Benchmarking
11.3.4 Strategic Outlook
11.4 SUEZ
11.4.1 Company Snapshot
11.4.2 Company Overview
11.4.3 Financial Analysis
11.4.3.1 Net Revenue, 2019-2023
11.4.3.2 Regional Market Shares, 2023
11.4.3.3 Business Segment Market Shares, 2023
11.4.4 Product Benchmarking
11.4.5 Strategic Outlook
11.5 Babcock & Wilcox
11.5.1 Company Snapshot
11.5.2 Company Overview
11.5.3 Financial Analysis
11.5.3.1 Net Revenue, 2019-2023
11.5.3.2 Regional Market Shares, 2023
11.5.3.3 Business Segment Market Shares, 2023
11.5.4 Product Benchmarking
11.5.5 Strategic Outlook
11.6 Keppel Seghers
11.6.1 Company Snapshot
11.6.2 Company Overview
11.6.3 Product Benchmarking
11.6.4 Strategic Outlook
11.7 Wheelabrator (Norican Group)
11.7.1 Company Snapshot
11.7.2 Company Overview
11.7.3 Product Benchmarking
11.7.4 Strategic Outlook
11.8 Kanadevia Corporation
11.8.1 Company Snapshot
11.8.2 Company Overview
11.8.3 Financial Analysis
11.8.3.1 Net Revenue, 2019-2023
11.8.3.2 Regional Market Shares, 2023
11.8.3.3 Business Segment Market Shares, 2023
11.8.4 Product Benchmarking
11.8.5 Strategic Outlook
11.9 Viridor Limited
11.9.1 Company Snapshot
11.9.2 Company Overview
11.9.3 Product Benchmarking
11.9.4 Strategic Outlook
11.10 Abu Dhabi National Energy Company PJSC (TAQA)
11.10.1 Company Snapshot
11.10.2 Company Overview
11.10.3 Product Benchmarking
11.10.4 Strategic Outlook
11.11 Mitsubishi Heavy Industries Environmental & Chemical Engineering Co., Ltd. (MHIEC)
11.11.1 Company Snapshot
11.11.2 Company Overview
11.11.3 Product Benchmarking
11.11.4 Strategic Outlook
11.12 Hitachi, Ltd.
11.12.1 Company Snapshot
11.12.2 Company Overview
11.12.3 Financial Analysis
11.12.3.1 Net Revenue, 2019-2024
11.12.3.2 Regional Market Shares, 2024
11.12.3.3 Business Segment Market Shares, 2024
11.12.4 Product Benchmarking
11.12.5 Strategic Outlook
11.13 Ramboll Group
11.13.1 Company Snapshot
11.13.2 Company Overview
11.13.3 Financial Analysis
11.13.3.1 Net Revenue, 2019-2024
11.13.3.2 Regional Market Shares, 2024
11.13.3.3 Business Segment Market Shares, 2024
11.13.4 Product Benchmarking
11.13.5 Strategic Outlook
11.14 ABB
11.14.1 Company Snapshot
11.14.2 Company Overview
11.14.3 Financial Analysis
11.14.3.1 Net Revenue, 2019-2023
11.14.3.2 Regional Market Shares, 2023
11.14.3.3 Business Segment Market Shares, 2023
11.14.4 Product Benchmarking
11.14.5 Strategic Outlook
11.15 Biffa
11.15.1 Company Snapshot
11.15.2 Company Overview
11.15.3 Product Benchmarking
11.15.4 Strategic Outlook
11.16 Enerkem
11.16.1 Company Snapshot
11.16.2 Company Overview
11.16.3 Product Benchmarking
11.16.4 Strategic Outlook
12 Conclusion and Recommendations
12.1 Concluding Remarks from Visiongain
12.2 Recommendations for Market Players
ページTOPに戻る
List of Tables/Graphs
List of Tables
Table 1 Waste to Energy (WtE) Market Snapshot, 2025 & 2035 (US$ Billion, CAGR %)
Table 2 Waste to Energy (WtE) Market Forecast by Technology, 2025-2035 (US$ Billion, AGR%, CAGR%)
Table 3 Biological Segment Market Forecast by Region, 2025-2035 (US$ Billion, AGR%, CAGR%)
Table 4 Incineration Segment Market Forecast by Region, 2025-2035 (US$ Billion, AGR%, CAGR%)
Table 5 Pyrolysis Segment Market Forecast by Region, 2025-2035 (US$ Billion, AGR%, CAGR%)
Table 6 Gasification Segment Market Forecast by Region, 2025-2035 (US$ Billion, AGR%, CAGR%)
Table 7 Waste to Energy (WtE) Market Forecast by Waste Type, 2025-2035 (US$ Billion, AGR%, CAGR%)
Table 8 Municipal Solid Waste Segment Market Forecast by Region, 2025-2035 (US$ Billion, AGR%, CAGR%)
Table 9 Agricultural Waste Segment Market Forecast by Region, 2025-2035 (US$ Billion, AGR%, CAGR%)
Table 10 Other Waste Segment Market Forecast by Region, 2025-2035 (US$ Billion, AGR%, CAGR%)
Table 11 Waste to Energy (WtE) Market Forecast by Region, 2025-2035 (US$ Billion, AGR%, CAGR%)
Table 12 North America Waste to Energy (WtE) Market Forecast by Country, 2025-2035 (US$ Billion, AGR%, CAGR%)
Table 13 North America Waste to Energy (WtE) Market Forecast by Technology, 2025-2035 (US$ Billion, AGR%, CAGR%)
Table 14 North America Waste to Energy (WtE) Market Forecast by Waste Type, 2025-2035 (US$ Billion, AGR%, CAGR%)
Table 15 U.S. Waste to Energy Plants
Table 16 U.S. Waste to Energy (WtE) Market Forecast, 2025-2035 (US$ Billion, AGR%, CAGR%)
Table 17 Canada Waste to Energy (WtE) Market Forecast, 2025-2035 (US$ Billion, AGR%, CAGR%)
Table 18 Europe Waste to Energy (WtE) Market Forecast by Country, 2025-2035 (US$ Billion, AGR%, CAGR%)
Table 19 Europe Waste to Energy (WtE) Market Forecast by Technology, 2025-2035 (US$ Billion, AGR%, CAGR%)
Table 20 Europe Waste to Energy (WtE) Market Forecast by Waste Type, 2025-2035 (US$ Billion, AGR%, CAGR%)
Table 21 UK Waste to Energy Plants
Table 22 UK Waste to Energy (WtE) Market Forecast, 2025-2035 (US$ Billion, AGR%, CAGR%)
Table 23 Germany Waste to Energy Plants
Table 24 Germany Waste to Energy (WtE) Market Forecast, 2025-2035 (US$ Billion, AGR%, CAGR%)
Table 25 France Waste to Energy Plants
Table 26 France Waste to Energy (WtE) Market Forecast, 2025-2035 (US$ Billion, AGR%, CAGR%)
Table 27 Netherlands Waste to Energy Plants
Table 28 Netherlands Waste to Energy (WtE) Market Forecast, 2025-2035 (US$ Billion, AGR%, CAGR%)
Table 29 Norway Waste to Energy (WtE) Market Forecast, 2025-2035 (US$ Billion, AGR%, CAGR%)
Table 30 Sweden Waste to Energy (WtE) Market Forecast, 2025-2035 (US$ Billion, AGR%, CAGR%)
Table 31 Denmark Waste to Energy (WtE) Market Forecast, 2025-2035 (US$ Billion, AGR%, CAGR%)
Table 32 Belgium Waste to Energy (WtE) Market Forecast, 2025-2035 (US$ Billion, AGR%, CAGR%)
Table 33 Italy Waste to Energy (WtE) Market Forecast, 2025-2035 (US$ Billion, AGR%, CAGR%)
Table 34 Switzerland Waste to Energy (WtE) Market Forecast, 2025-2035 (US$ Billion, AGR%, CAGR%)
Table 35 Rest of Europe Waste to Energy (WtE) Market Forecast, 2025-2035 (US$ Billion, AGR%, CAGR%)
Table 36 Asia Pacific Waste to Energy (WtE) Market Forecast by Country, 2025-2035 (US$ Billion, AGR%, CAGR%)
Table 37 Asia Pacific Waste to Energy (WtE) Market Forecast by Technology, 2025-2035 (US$ Billion, AGR%, CAGR%)
Table 38 Asia Pacific Waste to Energy (WtE) Market Forecast by Waste Type, 2025-2035 (US$ Billion, AGR%, CAGR%)
Table 39 China Waste to Energy Plants
Table 40 China Waste to Energy (WtE) Market Forecast, 2025-2035 (US$ Billion, AGR%, CAGR%)
Table 41 India Waste to Energy (WtE) Market Forecast, 2025-2035 (US$ Billion, AGR%, CAGR%)
Table 42 Japan Plants
Table 43 Japan Waste to Energy (WtE) Market Forecast, 2025-2035 (US$ Billion, AGR%, CAGR%)
Table 44 South Korea Waste to Energy (WtE) Market Forecast, 2025-2035 (US$ Billion, AGR%, CAGR%)
Table 45 Singapore Waste to Energy (WtE) Market Forecast, 2025-2035 (US$ Billion, AGR%, CAGR%)
Table 46 Thailand Waste to Energy (WtE) Market Forecast, 2025-2035 (US$ Billion, AGR%, CAGR%)
Table 47 Rest of Asia Pacific Waste to Energy (WtE) Market Forecast, 2025-2035 (US$ Billion, AGR%, CAGR%)
Table 48 Rest of the World Waste to Energy (WtE) Market Forecast by Technology, 2025-2035 (US$ Billion, AGR%, CAGR%)
Table 49 Rest of the World Waste to Energy (WtE) Market Forecast by Waste Type, 2025-2035 (US$ Billion, AGR%, CAGR%)
Table 50 Rest of the World Waste to Energy (WtE) Market Forecast, 2025-2035 (US$ Billion, AGR%, CAGR%)
Table 51 WM Intellectual Property Holdings: Key Details, (CEO, HQ, Revenue, Founded, No. of Employees, Company Type, Website, Business Segment)
Table 52 WM Intellectual Property Holdings: Product Benchmarking
Table 53 WM Intellectual Property Holdings: Strategic Outlook
Table 54 Veolia Environmental Services: Key Details, (CEO, HQ, Revenue, Founded, No. of Employees, Company Type, Website, Business Segment)
Table 55 Veolia Environmental Services: Product Benchmarking
Table 56 Veolia Environmental Services: Strategic Outlook
Table 57 Reworld: Key Details, (CEO, HQ, Revenue, Founded, No. of Employees, Company Type, Website, Business Segment)
Table 58 Reworld: Product Benchmarking
Table 59 Reworld: Strategic Outlook
Table 60 SUEZ: Key Details, (CEO, HQ, Revenue, Founded, No. of Employees, Company Type, Website, Business Segment)
Table 61 SUEZ: Product Benchmarking
Table 62 SUEZ: Strategic Outlook
Table 63 Babcock & Wilcox: Key Details, (CEO, HQ, Revenue, Founded, No. of Employees, Company Type, Website, Business Segment)
Table 64 Babcock & Wilcox: Product Benchmarking
Table 65 Babcock & Wilcox: Strategic Outlook
Table 66 Keppel Seghers: Key Details, (CEO, HQ, Revenue, Founded, No. of Employees, Company Type, Website, Business Segment)
Table 67 Keppel Seghers: Product Benchmarking
Table 68 Keppel Seghers: Strategic Outlook
Table 69 Wheelabrator (Norican Group): Key Details, (CEO, HQ, Revenue, Founded, No. of Employees, Company Type, Website, Business Segment)
Table 70 Wheelabrator (Norican Group): Product Benchmarking
Table 71 Wheelabrator (Norican Group): Strategic Outlook
Table 72 Kanadevia Corporation: Key Details, (CEO, HQ, Revenue, Founded, No. of Employees, Company Type, Website, Business Segment)
Table 73 Kanadevia Corporation: Product Benchmarking
Table 74 Kanadevia Corporation: Strategic Outlook
Table 75 Viridor Limited: Key Details, (CEO, HQ, Revenue, Founded, No. of Employees, Company Type, Website, Business Segment)
Table 76 Viridor Limited: Product Benchmarking
Table 77 Viridor Limited: Strategic Outlook
Table 78 Abu Dhabi National Energy Company PJSC (TAQA): Key Details, (CEO, HQ, Revenue, Founded, No. of Employees, Company Type, Website, Business Segment)
Table 79 Abu Dhabi National Energy Company PJSC (TAQA): Product Benchmarking
Table 80 Abu Dhabi National Energy Company PJSC (TAQA): Strategic Outlook
Table 81 Mitsubishi Heavy Industries Environmental & Chemical Engineering Co., Ltd. (MHIEC): Key Details, (CEO, HQ, Revenue, Founded, No. of Employees, Company Type, Website, Business Segment)
Table 82 Mitsubishi Heavy Industries Environmental & Chemical Engineering Co., Ltd. (MHIEC): Product Benchmarking
Table 83 Mitsubishi Heavy Industries Environmental & Chemical Engineering Co., Ltd. (MHIEC): Strategic Outlook
Table 84 Hitachi, Ltd.: Key Details, (CEO, HQ, Revenue, Founded, No. of Employees, Company Type, Website, Business Segment)
Table 85 Hitachi, Ltd.: Product Benchmarking
Table 86 Hitachi, Ltd.: Strategic Outlook
Table 87 Ramboll Group: Key Details, (CEO, HQ, Revenue, Founded, No. of Employees, Company Type, Website, Business Segment)
Table 88 Ramboll Group: Product Benchmarking
Table 89 Ramboll Group: Strategic Outlook
Table 90 ABB: Key Details, (CEO, HQ, Revenue, Founded, No. of Employees, Company Type, Website, Business Segment)
Table 91 ABB: Product Benchmarking
Table 92 ABB: Strategic Outlook
Table 93 Biffa: Key Details, (CEO, HQ, Revenue, Founded, No. of Employees, Company Type, Website, Business Segment)
Table 94 Biffa: Product Benchmarking
Table 95 Biffa: Strategic Outlook
Table 96 Enerkem: Key Details, (CEO, HQ, Revenue, Founded, No. of Employees, Company Type, Website, Business Segment)
Table 97 Enerkem: Product Benchmarking
Table 98 Enerkem: Strategic Outlook
List of Figures
Figure 1 Waste to Energy (WtE) Market Segmentation
Figure 2 Waste to Energy (WtE) Market by Technology: Market Attractiveness Index
Figure 3 Waste to Energy (WtE) Market by Waste Type: Market Attractiveness Index
Figure 4 Waste to Energy (WtE) Market Attractiveness Index by Region
Figure 5 Waste to Energy (WtE) Market: Market Dynamics
Figure 6 Waste to Energy (WtE) Market: Impact Analysis
Figure 7 Waste to Energy (WtE) Market: Porter’s Five Forces Analysis
Figure 8 Waste to Energy (WtE) Market: PEST Analysis
Figure 9 Waste to Energy (WtE) Market by Technology: Market Attractiveness Index
Figure 10 Waste to Energy (WtE) Market Forecast by Technology, 2025-2035 (US$ Billion, AGR %)
Figure 11 Waste to Energy (WtE) Market Share Forecast by Technology, 2025, 2030, 2035 (%)
Figure 12 Biological Segment Market Forecast by Region, 2025-2035 (US$ Billion, AGR %)
Figure 13 Biological Segment Market Share Forecast by Region, 2025 & 2035 (%)
Figure 14 Incineration Segment Market Forecast by Region, 2025-2035 (US$ Billion, AGR %)
Figure 15 Incineration Segment Market Share Forecast by Region, 2025 & 2035 (%)
Figure 16 Pyrolysis Segment Market Forecast by Region, 2025-2035 (US$ Billion, AGR %)
Figure 17 Pyrolysis Segment Market Share Forecast by Region, 2025 & 2035 (%)
Figure 18 Gasification Segment Market Forecast by Region, 2025-2035 (US$ Billion, AGR %)
Figure 19 Gasification Segment Market Share Forecast by Region, 2025 & 2035 (%)
Figure 20 Waste to Energy (WtE) Market by Waste Type: Market Attractiveness Index
Figure 21 Waste to Energy (WtE) Market Forecast by Waste Type, 2025-2035 (US$ Billion, AGR %)
Figure 22 Waste to Energy (WtE) Market Share Forecast by Waste Type, 2025, 2030, 2035 (%)
Figure 23 Municipal Solid Waste Segment Market Forecast by Region, 2025-2035 (US$ Billion, AGR %)
Figure 24 Municipal Solid Waste Segment Market Share Forecast by Region, 2025 & 2035 (%)
Figure 25 Agricultural Waste Segment Market Forecast by Region, 2025-2035 (US$ Billion, AGR %)
Figure 26 Agricultural Waste Segment Market Share Forecast by Region, 2025 & 2035 (%)
Figure 27 Other Waste Segment Market Forecast by Region, 2025-2035 (US$ Billion, AGR %)
Figure 28 Other Waste Segment Market Share Forecast by Region, 2025 & 2035 (%)
Figure 29 Waste to Energy (WtE) Market Forecast by Region 2025 and 2035 (Revenue, CAGR%)
Figure 30 Waste to Energy (WtE) Market Share Forecast by Region 2025, 2030, 2035 (%)
Figure 31 Waste to Energy (WtE) Market by Region, 2025-2035 (US$ Billion, AGR %)
Figure 32 North America Waste to Energy (WtE) Market Attractiveness Index
Figure 33 North America Waste to Energy (WtE) Market by Region, 2025, 2030 & 2035 (US$ Billion)
Figure 34 North America Waste to Energy (WtE) Market Forecast by Country, 2025-2035 (US$ Billion, AGR %)
Figure 35 North America Waste to Energy (WtE) Market Share Forecast by Country, 2025 & 2035 (%)
Figure 36 North America Waste to Energy (WtE) Market Forecast by Technology, 2025-2035 (US$ Billion, AGR %)
Figure 37 North America Waste to Energy (WtE) Market Share Forecast by Technology, 2025 & 2035 (%)
Figure 38 North America Waste to Energy (WtE) Market Forecast by Waste Type, 2025-2035 (US$ Billion, AGR %)
Figure 39 North America Waste to Energy (WtE) Market Share Forecast by Waste Type, 2025 & 2035 (%)
Figure 40 U.S. Waste to Energy (WtE) Market Forecast, 2025-2035 (US$ Billion, AGR %)
Figure 41 Canada Waste to Energy (WtE) Market Forecast, 2025-2035 (US$ Billion, AGR %)
Figure 42 Europe Waste to Energy (WtE) Market Attractiveness Index
Figure 43 Europe Waste to Energy (WtE) Market by Region, 2025, 2030 & 2035 (US$ Billion)
Figure 44 Europe Waste to Energy (WtE) Market Forecast by Country, 2025-2035 (US$ Billion, AGR %)
Figure 45 Europe Waste to Energy (WtE) Market Share Forecast by Country, 2025 & 2035 (%)
Figure 46 Europe Waste to Energy (WtE) Market Forecast by Technology, 2025-2035 (US$ Billion, AGR %)
Figure 47 Europe Waste to Energy (WtE) Market Share Forecast by Technology, 2025 & 2035 (%)
Figure 48 Europe Waste to Energy (WtE) Market Forecast by Waste Type, 2025-2035 (US$ Billion, AGR %)
Figure 49 Europe Waste to Energy (WtE) Market Share Forecast by Waste Type, 2025 & 2035 (%)
Figure 50 UK Waste to Energy (WtE) Market Forecast, 2025-2035 (US$ Billion, AGR %)
Figure 51 Germany Waste to Energy (WtE) Market Forecast, 2025-2035 (US$ Billion, AGR %)
Figure 52 France Waste to Energy (WtE) Market Forecast, 2025-2035 (US$ Billion, AGR %)
Figure 53 Netherlands Waste to Energy (WtE) Market Forecast, 2025-2035 (US$ Billion, AGR %)
Figure 54 Norway Waste to Energy (WtE) Market Forecast, 2025-2035 (US$ Billion, AGR %)
Figure 55 Sweden Waste to Energy (WtE) Market Forecast, 2025-2035 (US$ Billion, AGR %)
Figure 56 Denmark Waste to Energy (WtE) Market Forecast, 2025-2035 (US$ Billion, AGR %)
Figure 57 Belgium Waste to Energy (WtE) Market Forecast, 2025-2035 (US$ Billion, AGR %)
Figure 58 Italy Waste to Energy (WtE) Market Forecast, 2025-2035 (US$ Billion, AGR %)
Figure 59 Switzerland Waste to Energy (WtE) Market Forecast, 2025-2035 (US$ Billion, AGR %)
Figure 60 Rest of Europe Waste to Energy (WtE) Market Forecast, 2025-2035 (US$ Billion, AGR %)
Figure 61 Asia Pacific Waste to Energy (WtE) Market Attractiveness Index
Figure 62 Asia Pacific Waste to Energy (WtE) Market by Region, 2025, 2030 & 2035 (US$ Billion)
Figure 63 Asia Pacific Waste to Energy (WtE) Market Forecast by Country, 2025-2035 (US$ Billion, AGR %)
Figure 64 Asia Pacific Waste to Energy (WtE) Market Share Forecast by Country, 2025 & 2035 (%)
Figure 65 Asia Pacific Waste to Energy (WtE) Market Forecast by Technology, 2025-2035 (US$ Billion, AGR %)
Figure 66 Asia Pacific Waste to Energy (WtE) Market Share Forecast by Technology, 2025 & 2035 (%)
Figure 67 Asia Pacific Waste to Energy (WtE) Market Forecast by Waste Type, 2025-2035 (US$ Billion, AGR %)
Figure 68 Asia Pacific Waste to Energy (WtE) Market Share Forecast by Waste Type, 2025 & 2035 (%)
Figure 69 China Waste to Energy (WtE) Market Forecast, 2025-2035 (US$ Billion, AGR %)
Figure 70 India Waste to Energy (WtE) Market Forecast, 2025-2035 (US$ Billion, AGR %)
Figure 71 Japan Waste to Energy (WtE) Market Forecast, 2025-2035 (US$ Billion, AGR %)
Figure 72 South Korea Waste to Energy (WtE) Market Forecast, 2025-2035 (US$ Billion, AGR %)
Figure 73 Singapore Waste to Energy (WtE) Market Forecast, 2025-2035 (US$ Billion, AGR %)
Figure 74 Thailand Waste to Energy (WtE) Market Forecast, 2025-2035 (US$ Billion, AGR %)
Figure 75 Rest of Asia Pacific Waste to Energy (WtE) Market Forecast, 2025-2035 (US$ Billion, AGR %)
Figure 76 Rest of the World Waste to Energy (WtE) Market Forecast by Technology, 2025-2035 (US$ Billion, AGR %)
Figure 77 Rest of the World Waste to Energy (WtE) Market Share Forecast by Technology, 2025 & 2035 (%)
Figure 78 Rest of the World Waste to Energy (WtE) Market Forecast by Waste Type, 2025-2035 (US$ Billion, AGR %)
Figure 79 Rest of the World Waste to Energy (WtE) Market Share Forecast by Waste Type, 2025 & 2035 (%)
Figure 80 Rest of the World Waste to Energy (WtE) Market Forecast, 2025-2035 (US$ Billion, AGR %)
Figure 81 WM Intellectual Property Holdings: Net Revenue, 2019-2023 (US$ Million, AGR%)
Figure 82 WM Intellectual Property Holdings: Regional Market Shares, 2023
Figure 83 WM Intellectual Property Holdings: Business Segment Market Shares, 2023
Figure 84 Veolia Environmental Services: Net Revenue, 2019-2023 (US$ Million, AGR%)
Figure 85 Veolia Environmental Services: Regional Market Shares, 2023
Figure 86 Veolia Environmental Services: Business Segment Market Shares, 2023
Figure 87 SUEZ: Net Revenue, 2019-2023 (US$ Million, AGR%)
Figure 88 SUEZ: Regional Market Shares, 2023
Figure 89 SUEZ: Business Segment Market Shares, 2023
Figure 90 Babcock & Wilcox: Net Revenue, 2019-2023 (US$ Million, AGR%)
Figure 91 Babcock & Wilcox: Regional Market Shares, 2023
Figure 92 Babcock & Wilcox: Business Segment Market Shares, 2023
Figure 93 Kanadevia Corporation: Net Revenue, 2019-2023 (US$ Million, AGR%)
Figure 94 Kanadevia Corporation: Regional Market Shares, 2023
Figure 95 Kanadevia Corporation: Business Segment Market Shares, 2023
Figure 96 Hitachi, Ltd.: Net Revenue, 2019-2024 (US$ Million, AGR%)
Figure 97 Hitachi, Ltd.: Regional Market Shares, 2024
Figure 98 Hitachi, Ltd.: Business Segment Market Shares, 2024
Figure 99 Ramboll Group: Net Revenue, 2019-2024 (US$ Million, AGR%)
Figure 100 Ramboll Group: Regional Market Shares, 2024
Figure 101 Ramboll Group: Business Segment Market Shares, 2024
Figure 102 ABB: Net Revenue, 2019-2023 (US$ Million, AGR%)
Figure 103 ABB: Regional Market Shares, 2023
Figure 104 ABB: Business Segment Market Shares, 2023
ページTOPに戻る
本レポートと同分野(再生可能エネルギー)の最新刊レポート
Visiongain社のエネルギーと資源分野での最新刊レポート
本レポートと同じKEY WORD(waste)の最新刊レポート
よくあるご質問
Visiongain社はどのような調査会社ですか?
英国の調査会社ヴィジョンゲイン社(Visiongain)は、通信とエネルギーのほか、自動車や化学・医薬品、金属など、広範な市場を対象に調査を行っています。自動車市場については、市場全般に関する調査のほ... もっと見る
調査レポートの納品までの日数はどの程度ですか?
在庫のあるものは速納となりますが、平均的には 3-4日と見て下さい。
但し、一部の調査レポートでは、発注を受けた段階で内容更新をして納品をする場合もあります。
発注をする前のお問合せをお願いします。
注文の手続きはどのようになっていますか?
1)お客様からの御問い合わせをいただきます。
2)見積書やサンプルの提示をいたします。
3)お客様指定、もしくは弊社の発注書をメール添付にて発送してください。
4)データリソース社からレポート発行元の調査会社へ納品手配します。
5) 調査会社からお客様へ納品されます。最近は、pdfにてのメール納品が大半です。
お支払方法の方法はどのようになっていますか?
納品と同時にデータリソース社よりお客様へ請求書(必要に応じて納品書も)を発送いたします。
お客様よりデータリソース社へ(通常は円払い)の御振り込みをお願いします。
請求書は、納品日の日付で発行しますので、翌月最終営業日までの当社指定口座への振込みをお願いします。振込み手数料は御社負担にてお願いします。
お客様の御支払い条件が60日以上の場合は御相談ください。
尚、初めてのお取引先や個人の場合、前払いをお願いすることもあります。ご了承のほど、お願いします。
データリソース社はどのような会社ですか?
当社は、世界各国の主要調査会社・レポート出版社と提携し、世界各国の市場調査レポートや技術動向レポートなどを日本国内の企業・公官庁及び教育研究機関に提供しております。
世界各国の「市場・技術・法規制などの」実情を調査・収集される時には、データリソース社にご相談ください。
お客様の御要望にあったデータや情報を抽出する為のレポート紹介や調査のアドバイスも致します。
|
|

