合成燃料市場レポート:2024-2034
Synthetic Fuels Market Report 2024-2034
レポート詳細
合成燃料市場レポート 2024-2034 :本レポートは、業界とその根底にあるダイナミクスをより良く理解したいと望むならば、新たな収益ポケットを目指す大手企業にとって貴重なものとなる... もっと見る
※上記価格は部署ライセンス(Departmental licence)価格です。
その他の価格についてはデータリソースまでお問合せください。
日本語のページは自動翻訳を利用し作成しています。
実際のレポートは英文のみでご納品いたします。

|

|
サマリー
レポート詳細
合成燃料市場レポート 2024-2034:本レポートは、業界とその根底にあるダイナミクスをより良く理解したいと望むならば、新たな収益ポケットを目指す大手企業にとって貴重なものとなるであろう。異業種への進出や新地域での既存事業の拡大を目指す企業にも有用です。
合成燃料市場を牽引する原料の入手可能性
代替燃料や再生可能燃料としても知られる合成燃料は、従来の化石燃料が環境に与える影響を緩和する有望な解決策として浮上してきた。これらの燃料は、バイオマスや廃棄物、さらには大気中から回収された二酸化炭素などの再生可能な資源から合成される。合成燃料の開発とスケーラビリティの中心は、原料の入手可能性と多様性である。原料とは、合成燃料の生産に使用される原材料のことである。原油、天然ガス、石炭などの有限資源に依存する従来の化石燃料とは異なり、合成燃料は再生可能で持続可能なさまざまな資源を活用する。
バイオマス:植物、農業残渣、林業副産物、藻類に由来する有機物。バイオマスは加工して糖分、油分、セルロースを抽出し、ガス化、発酵、熱化学変換などのプロセスを通じて合成燃料に変換される。2020年、バイオマスの国内供給量は世界全体で57.5EJであった。国内供給の86%は、木材チップ、木質ペレット、伝統的なバイオマス資源を含む固体バイオマス資源によるものである。液体バイオ燃料は7%、自治体および産業廃棄物セクターは2?3%、バイオガスが2%であった。
合成燃料産業の成長を阻害する要因
合成燃料、特にフィッシャー・トロプシュ合成やパワー・ツー・リキッド(PtL)のような方法による合成燃料の製造には、大量のエネルギーが必要である。このエネルギーのコストは、特に再生可能資源から供給される場合、現在のところ高い。合成燃料製造のための施設設置には、多額の資本支出が伴う。これには、プラントの建設、技術の取得、規制遵守の確保などのコストが含まれる。この業界は、まだコスト効率を上げられるような規模では操業していない。単価を下げるには、より大きな生産規模が必要だが、この規模を達成するには多額の初期投資が必要となる。
合成燃料を製造するための現在の技術は、従来の燃料製造ほど効率的ではない。合成燃料の競争力を高めるには、こうしたプロセスの効率を改善することが極めて重要である。燃料生産と流通のための既存のインフラは化石燃料向けである。合成燃料を扱うためには、大幅な改造や新たなインフラが必要であり、物流面でも財政面でも課題がある。
市場調査レポートを購入する前にすべき質問とは?
-
合成燃料市場はどのように進化しているのか?
-
合成燃料市場の推進要因と阻害要因は何か?
-
合成燃料の各サブマーケットは予測期間中にどのように成長し、2034年にはどれくらいの売上を占めるようになるのか?
-
2024年から2034年にかけて、各合成燃料サブマーケットの市場シェアはどのように推移するのか?
-
2024年から2034年にかけて、市場全体を牽引する主な要因は何か?
-
主要な合成燃料市場はマクロ経済の動きに幅広く追随するのか、それとも個々の国の市場が他を凌駕するのか。
-
2034年までに各国市場のシェアはどのように変化し、どの地域が2034年の市場をリードするのか。
-
主要プレーヤーと予測期間中の見通しは?
-
これらの大手企業にとっての合成燃料プロジェクトとは?
-
2024年から2034年の間に、業界はどのように進化するのか?現在、そして今後10年間に行われる合成燃料プロジェクトにはどのような意味があるのか?
-
合成燃料市場をさらに拡大するためには、製品の商業化がより必要なのでしょうか?
-
合成燃料市場はどこへ向かっているのか、そしてどのようにすれば市場の最前線に立てるのか。
-
新商品や新サービスに最適な投資方法とは?
-
企業を新たな成長軌道に乗せ、C-suiteに移行させるための重要な展望とは?
このことが、現在、そして今後10年間の合成燃料市場にどのような影響を与えるかを見極める必要がある:
-
311ページに及ぶ本レポートでは、109の表と175の図表を掲載している。
-
本レポートでは、業界における主要な有利分野を取り上げているため、今すぐターゲットを絞ることができる。
-
世界、地域、国の売上高と成長に関する詳細な分析が含まれている。
-
競合他社が成功した主なトレンド、変化、収益予測をハイライトします。
2034年までの予測やその他の分析から、商業的な展望が明らかになる
-
2034年までの収益予測に加え、最近の実績、成長率、市場シェアも提供している。
-
ビジネスの展望や展開など、独自の分析が掲載されている。
-
定性的分析(市場ダイナミクス、促進要因、機会、阻害要因、課題を含む)、コスト構造、燃料価格上昇の影響、最近の動向をご覧ください。
レポート対象セグメント
原料
用途
燃料タイプ
-
エクストラ・ヘビーオイル
-
ガスから液体オイルへ
-
シェールオイル
-
オイルサンド
-
石炭液体
-
その他
最終用途
世界市場全体と各分野の収益予測に加え、5つの地域と15の主要国市場の収益予測も掲載している:
北米
欧州
-
ドイツ
-
英国
-
フランス
-
スペイン
-
イタリア
-
その他の欧州地域
アジア太平洋
-
中国
-
日本
-
インド
-
オーストラリア
-
韓国
-
その他のアジア太平洋地域
ラテンアメリカ
MEA
また、2024年から2034年までの合成燃料市場における主要企業のプロファイルも掲載している。
報告書に掲載されている主要企業
-
Chevron Renewable Energy Group
-
CropEnergies AG
-
Dakota Gasification Company
-
ExxonMobil Corporation
-
Gevo, Inc.
-
Linde plc
-
Maire Tecnimont
-
Neste
-
PetroSA
-
RWE
-
Sasol Limited
-
Shell plc
-
Sunfire
-
TotalEnergies SE
-
Zero Petroleum
2024年から2034年までの合成燃料市場における世界全体の売上高(金額ベース)は、2024年に90億米ドルを突破する。2034年まで力強い収益成長を予測。当調査では、最も大きな可能性を秘めた企業を特定しています。彼らの能力、進歩、商業的展望を発見し、あなたが一歩先を行くのを支援します。
2024年から2034年までの合成燃料市場」レポートはどのように役立つのか?
要約すると、310ページを超えるこのレポートは、以下の知識を提供する:
-
合成燃料市場の2024年から2034年までの収益予測 原料、燃料タイプ、用途、最終用途の各予測を世界および地域レベルで掲載 - 業界の将来性を発見し、投資と収益に最も有利な場所を見つけることができます。
-
5つの地域と15の主要国市場の2034年までの収益予測 - 北米、欧州、アジア太平洋、中南米、MEAの2024年から2034年までの合成燃料市場予測をご覧ください。また、米国、カナダ、メキシコ、ブラジル、ドイツ、フランス、英国、イタリア、中国、インド、日本、オーストラリアなどの主要国の市場も予測しています。
-
2024年から2034年までの合成燃料市場に関わる主要企業15社の企業プロファイルを含む。
独自の予測による定量的・定性的分析をご覧ください。私たちのレポートだけに含まれる情報を入手し、貴重なビジネスインテリジェンスで情報を得ることができます。
他にはない情報
私たちの新しいレポートがあれば、知識に遅れをとったり、チャンスを逃したりする可能性が低くなります。弊社の調査レポートが貴社の調査、分析、意思決定にどのように役立つかをご覧ください。Visiongainの調査は、合成燃料市場、2024年から2034年、市場をリードする企業の商業分析を必要とするすべての人のためのものです。データ、トレンド、予測をご覧いただけます。
ページTOPに戻る
目次
1 レポート概要
1.1 研究の目的
1.2 合成燃料市場の紹介
1.3 本レポートの内容
1.4 本レポートを読むべき理由
1.5 本分析レポートが回答する主な質問
1.6 本レポートは誰のためのものか?
1.7 方法論
1.7.1 市場の定義
1.7.2 市場評価・予測手法
1.7.3 データの検証
1.7.3.1 一次調査
1.7.3.2 セカンダリーリサーチ
1.8 よくある質問(FAQ)
1.9 Visiongainの関連レポート
1.10 Visiongainについて
2 エグゼクティブ・サマリー
3 市場概要
3.1 主要な調査結果
3.2 市場ダイナミクス
3.3 影響分析
3.3.1 市場牽引要因
3.3.1.1 炭素回収利用貯蔵が市場を牽引する
3.3.1.2 合成燃料産業を牽引する環境規制と政策
3.3.1.3 合成燃料市場を牽引する原料の入手可能性
3.3.2 市場抑制要因
3.3.2.1 合成燃料の高コスト
3.3.2.2 電気自動車産業の成長が合成燃料市場の成長を抑制する
3.3.2.3 合成燃料産業の成長を抑制する要因
3.3.3 市場機会
3.3.3.1 再生可能エネルギーの統合が市場に新たな道を開く
3.3.3.2 戦略的パートナーシップと投資による市場の促進
3.4 規制の枠組み
3.5 新興市場とメガトレンド
3.6 ポーターのファイブフォース分析
3.6.1 サプライヤーの交渉力
3.6.2 買い手の交渉力
3.6.3 競争上のライバル関係
3.6.4 代替品の脅威
3.6.5 新規参入企業の脅威
3.7 PEST分析
3.7.1 政治的要因
3.7.2 経済的要因
3.7.3 社会的要因
3.7.4 技術的要因
4 合成燃料市場分析:原料別
4.1 主要調査結果
4.2 供給原料セグメント 市場魅力度指数
4.3 合成燃料の原料別市場規模の推定と予測
4.4 石炭
4.4.1 2024〜2034年の地域別市場規模(US$ Billion)
4.4.2 地域別市場シェア、2024年・2034年(%)
4.5 天然ガス
4.5.1 2024年~2034年の地域別市場規模(US$ Billion)
4.5.2 地域別市場シェア、2024年・2034年(%)
4.6 その他の原料
4.6.1 2024〜2034年の地域別市場規模(US$ Billion)
4.6.2 地域別市場シェア、2024年・2034年(%)
5 合成燃料市場分析:用途別
5.1 主な調査結果
5.2 用途別セグメント 市場魅力度指数
5.3 用途別合成燃料市場規模の推定と予測
5.4 ガソリン
5.4.1 2024〜2034年の地域別市場規模(US$ Billion)
5.4.2 地域別市場シェア、2024年・2034年(%)
5.5 ディーゼル
5.5.1 2024〜2034年の地域別市場規模(US$ Billion)
5.5.2 地域別市場シェア、2024年・2034年(%)
5.6 灯油
5.6.1 2024~2034年の地域別市場規模(US$ Billion)
5.6.2 地域別市場シェア、2024年・2034年(%)
6 合成燃料市場分析:燃料タイプ別
6.1 主要調査結果
6.2 燃料タイプ別セグメント 市場魅力度指数
6.3 燃料タイプ別合成燃料市場規模の推定と予測
6.4 超重質油
6.4.1 2024〜2034年の地域別市場規模(US$ Billion)
6.4.2 地域別市場シェア、2024年・2034年(%)
6.5 ガス・ツー・リキッドオイル
6.5.1 2024~2034年の地域別市場規模(US$ Billion)
6.5.2 地域別市場シェア、2024年・2034年(%)
6.6 シェールオイル
6.6.1 2024年~2034年の地域別市場規模(US$ Billion)
6.6.2 地域別市場シェア、2024年・2034年(%)
6.7 オイルサンド
6.7.1 2024年~2034年の地域別市場規模(US$ Billion)
6.7.2 地域別市場シェア、2024年・2034年(%)
6.8 石炭から液体への転換
6.8.1 2024~2034年の地域別市場規模(US$ Billion)
6.8.2 地域別市場シェア、2024年・2034年(%)
6.9 その他
6.9.1 2024〜2034年の地域別市場規模(US$ Billion)
6.9.2 地域別市場シェア、2024年・2034年(%)
7 合成燃料市場分析:用途別
7.1 主要調査結果
7.2 最終用途セグメント 市場魅力度指数
7.3 最終用途別合成燃料市場規模の推定と予測
7.4 輸送
7.4.1 チリのE燃料パイロットプラント
7.4.2 2024〜2034年の地域別市場規模(US$ Billion)
7.4.3 地域別市場シェア、2024年・2034年(%)
7.5 産業
7.5.1 合成燃料サプライチェーン開発で3者が協力
7.5.2 2024年~2034年の地域別市場規模(US$ Billion)
7.5.3 地域別市場シェア、2024年・2034年(%)
7.6 化学・その他
7.6.1 2024〜2034年の地域別市場規模(US$ Billion)
7.6.2 地域別市場シェア、2024年・2034年(%)
8 合成燃料市場分析:地域別
8.1 主要な調査結果
8.2 地域別市場規模の推定と予測
9 北米の合成燃料市場分析
9.1 主要な調査結果
9.2 北米の合成燃料市場魅力度指数
9.3 北米の国別合成燃料市場、2024年、2029年、2034年(US$ Billion)
9.4 北米の合成燃料市場規模推定と予測:国別
9.5 北米の合成燃料市場規模推定と予測:原料別
9.6 北米の合成燃料市場規模推定と予測:用途別
9.7 北米の合成燃料市場規模推定と予測:燃料タイプ別
9.8 北米の合成燃料市場規模推定と予測:最終用途別
9.9 アメリカの合成燃料市場分析
9.9.1 テキサスに大規模なE燃料生産施設が建設される予定
9.9.2 TotalEnergies社が米国で合成天然ガスプラントを計画中
9.10 カナダの合成燃料市場の分析
9.10.1 2024年連邦予算はクリーン燃料を支持
10 欧州の合成燃料市場分析
10.1 主要な調査結果
10.2 欧州の合成燃料市場魅力度指数
10.3 欧州の合成燃料国別市場、2024年、2029年、2034年(US$ Billion)
10.4 欧州の合成燃料市場規模推定と予測:国別
10.5 欧州の合成燃料市場規模推定と予測:原料別
10.6 欧州の合成燃料市場規模推定と予測:用途別
10.7 欧州の合成燃料市場規模推定と予測:燃料タイプ別
10.8 欧州の合成燃料市場規模推定と予測:最終用途別
10.9 ドイツの合成燃料市場分析
10.9.1 ドイツの初の大規模E燃料工場
10.9.2 ドイツの持続可能な航空燃料産業
10.10 イギリス合成燃料市場の分析
10.10.1 Zero Petroleumが世界初の完全合成燃料施設を開設へ
10.10.2 ジェット・ゼロ戦略
10.11 フランスの合成燃料市場の分析
10.11.1 「Take Kair」プロジェクトによるフランスのE燃料航空輸送産業
10.12 イタリアの合成燃料市場の分析
10.12.1 イタリアのグリーン合成燃料パイロットプラント
10.12.2 イタリアの持続可能な航空燃料産業の発展
10.13 スペインの合成燃料市場分析
10.13.1 スペイン初の合成燃料プラント
10.13.2 合成燃料を開発するGreenaliaとP2X-Europe
10.14 その他の欧州の合成燃料市場分析
10.14.1 ノルウェーにおける新しい電子燃料プラント
11 アジア太平洋地域の合成燃料市場分析
11.1 主要な調査結果
11.2 アジア太平洋地域の合成燃料市場魅力度指数
11.3 アジア太平洋地域の国別合成燃料市場、2024年、2029年、2034年(US$ Billion)
11.4 アジア太平洋地域の合成燃料市場規模推定と予測:国別
11.5 アジア太平洋地域の合成燃料市場規模推定と予測:原料別
11.6 アジア太平洋地域の合成燃料市場規模推定と予測:用途別
11.7 アジア太平洋地域の合成燃料市場規模推定と予測:燃料タイプ別
11.8 アジア太平洋地域の合成燃料市場規模推定と予測:最終用途別
11.9 中国の合成燃料市場分析
11.9.1 CO₂メタノール化プラントの発足
11.9.2 風力水素を利用したグリーン航空燃料プラント
11.10 インドの合成燃料市場の分析
11.10.1 E-Fuel社がインドのEVインフラを強化するために協力
11.11 日本の合成燃料市場分析
11.11.1 出光、eFuels開発のためにHIF Globalに出資
11.11.2 日本は低公害燃料の開発を支援する
11.12 韓国の合成燃料市場の分析
11.13 オーストラリアの合成燃料市場分析
11.13.1 南オーストラリアにおける投資機会
11.14 その他のアジア太平洋地域の合成燃料市場の分析
12 ラテンアメリカの合成燃料市場分析
12.1 主要な調査結果
12.2 ラテンアメリカ合成燃料市場魅力度指数
12.3 ラテンアメリカの国別合成燃料市場、2024年、2029年、2034年(US$ Billion)
12.4 ラテンアメリカの合成燃料市場規模推定と予測:国別
12.5 ラテンアメリカの合成燃料市場規模推定と予測:原料別
12.6 ラテンアメリカの合成燃料市場規模推定と予測:用途別
12.7 ラテンアメリカの合成燃料市場規模推定と予測:燃料タイプ別
12.8 ラテンアメリカの合成燃料市場規模推定と予測:最終用途別
12.9 ブラジルの合成燃料市場分析
12.9.1 エレトロブラスとスザノがグリーン水素と合成燃料の製造で提携
12.9.2 ブラジルとドイツのコンソーシアムがブラジルのSyncrude-SAFパイロットプロジェクトを開始
12.10 メキシコの合成燃料市場分析
12.11 その他のラテンアメリカの合成燃料市場分析
13 中東・アフリカの合成燃料市場分析
13.1 主要な調査結果
13.2 中東・アフリカ合成燃料市場魅力度指数
13.3 中東・アフリカ合成燃料国別市場2024年、2029年、2034年(US$ Billion)
13.4 中東・アフリカ合成燃料市場規模推定と予測:国別
13.5 中東・アフリカ合成燃料市場規模推定と予測:原料別
13.6 中東・アフリカ合成燃料市場規模推定と予測:用途別
13.7 中東・アフリカ合成燃料市場規模推定と予測:燃料タイプ別
13.8 中東・アフリカ合成燃料市場規模推定と予測:最終用途別
13.9 GCC合成燃料市場の分析
13.9.1 アラムコが合成E燃料施設の設立に合意
13.9.2 Zero Petroleum と ADNOC は UAE での合成燃料生産を検討中
13.10 南アフリカの合成燃料市場分析
13.10.1 ドイツのPNEが南アフリカでE燃料を生産
13.11 その他の中東・アフリカ地域の合成燃料市場の分析
14 社のプロファイル
14.1 Shell plc
14.1.1 会社概要
14.1.2 会社概要
14.1.3 財務分析
14.1.3.1 純収入、2019-2023年
14.1.3.2 事業セグメント市場シェア(2023年
14.1.4 製品ベンチマーク
14.1.5 戦略的展望
14.1.6 SWOT分析
14.2 Sasol
14.2.1 会社概要
14.2.2 会社概要
14.2.3 財務分析
14.2.3.1 純収入、2019年~2023年
14.2.3.2 地域別市場シェア(2023年
14.2.3.3 事業セグメント市場シェア(2023年
14.2.4 製品ベンチマーク
14.2.5 戦略的展望
14.2.6 SWOT分析
14.3 Chevron Renewable Energy Group
14.3.1 会社概要
14.3.2 会社概要
14.3.3 財務分析
14.3.3.1 純収入、2019-2023年
14.3.4 製品ベンチマーク
14.3.5 戦略的展望
14.4 エクソン モービル コーポレーション
14.4.1 会社概要
14.4.2 会社概要
14.4.3 財務分析
14.4.3.1 純収入(2019-2023年
14.4.3.2 売上高、2019-2023年
14.4.3.3 事業セグメント市場シェア、2023年
14.4.4 製品ベンチマーク
14.4.5 戦略的展望
14.5 TotalEnergies
14.5.1 会社概要
14.5.2 会社概要
14.5.3 財務分析
14.5.3.1 純収入、2019-2023年
14.5.3.2 R&D、2019-2023年
14.5.3.3 事業セグメント市場シェア、2023年
14.5.4 製品ベンチマーク
14.5.5 戦略的展望
14.6 Neste
14.6.1 会社概要
14.6.2 会社概要
14.6.3 財務分析
14.6.3.1 純収入、2019年~2023年
14.6.3.2 地域別市場シェア(2023年
14.6.3.3 事業セグメント市場シェア(2023年
14.6.4 製品ベンチマーク
14.6.5 戦略的展望
14.6.6 SWOT分析
14.7 PetroSA
14.7.1 会社概要
14.7.2 会社概要
14.7.3 製品ベンチマーク
14.8 Linde PLC
14.8.1 会社概要
14.8.2 会社概要
14.8.3 財務分析
14.8.3.1 純収入、2019-2023年
14.8.3.2 R&D、2019年〜2023年
14.8.3.3 地域市場シェア、2023年
14.8.3.4 事業セグメント市場シェア(2023年
14.8.4 製品ベンチマーク
14.8.5 戦略的展望
14.9 Dakota Gasification Company (Basin Electric Power Cooperative)
14.9.1 会社概要
14.9.2 会社概要
14.9.3 財務分析
14.9.3.1 純収入、2019-2023年
14.9.3.2 製品市場シェア、2023年
14.9.4 製品ベンチマーク
14.10 Sunfire GmbH
14.10.1 会社概要
14.10.2 会社概要
14.10.3 製品ベンチマーク
14.10.4 戦略的展望
14.11 Maire Tecnimont
14.11.1 会社概要
14.11.2 会社概要
14.11.3 財務分析
14.11.3.1 純収入、2019-2023年
14.11.3.2 地域別市場シェア(2023年
14.11.3.3 事業セグメントの市場シェア(2023年
14.11.4 製品ベンチマーク
14.11.5 戦略的展望
14.12 RWE
14.12.1 会社概要
14.12.2 会社概要
14.12.3 財務分析
14.12.3.1 純収入、2019-2023年
14.12.3.2 事業セグメントの市場シェア、2023年
14.12.4 製品ベンチマーク
14.12.5 戦略的展望
14.12.6 SWOT分析
14.13 Gevo
14.13.1 会社概要
14.13.2 会社概要
14.13.3 財務分析
14.13.3.1 純収入、2018年~2022年
14.13.3.2 事業セグメント市場シェア、2023年
14.13.4 製品ベンチマーク
14.13.5 戦略的展望
14.14 Crop Energies AG
14.14.1 会社概要
14.14.2 会社概要
14.14.3 財務分析
14.14.3.1 純収入、2018-2022年
14.14.3.2 事業セグメント市場シェア、2023年
14.14.4 製品ベンチマーク
14.14.5 戦略的展望
14.15 Zero Petroleum
14.15.1 会社概要
14.15.2 会社概要
14.15.3 製品ベンチマーク
14.15.4 戦略的展望
15 結論と提言
15.1 Visiongainからの結びの言葉
15.2 市場プレイヤーへの提言
ページTOPに戻る
図表リスト
表の一覧
表1 合成燃料市場のスナップショット、2024年~2034年(10億米ドル、CAGR)
表2 2024~2034年の合成燃料の原料別市場予測(10億米ドル、AGR%、CAGR)
表3 石炭セグメントの地域別市場予測、2024~2034年(10億米ドル、AGR%、CAGR)
表4 天然ガスセグメントの地域別市場予測、2024~2034年(10億米ドル、AGR%、CAGR)
表5 その他の原料セグメントの地域別市場予測、2024~2034年(10億米ドル、AGR%、CAGR)
表6 合成燃料の用途別市場予測、2024~2034年(10億米ドル、AGR%、CAGR)
表7 ガソリンセグメントの地域別市場予測、2024~2034年(10億米ドル、AGR%、CAGR)
表8 ディーゼルセグメント地域別市場予測、2024~2034年(10億米ドル、AGR%、CAGR)
表9 2024~2034年の地域別灯油セグメント市場予測(10億米ドル、AGR%、CAGR)
表10 合成燃料の燃料タイプ別市場予測、2024~2034年(10億米ドル、AGR%、CAGR)
表11 超重質油セグメントの地域別市場予測、2024~2034年(10億米ドル、AGR%、CAGR)
表12 ガス・ツー・リキッドオイルセグメント地域別市場予測、2024~2034年(10億米ドル、AGR%、CAGR)
表13 シェールオイルセグメントの地域別市場予測、2024~2034年(10億米ドル、AGR%、CAGR)
表14 オイルサンド・セグメントの地域別市場予測、2024~2034年(10億米ドル、AGR%、CAGR)
表15 石炭から液体への転換セグメントの地域別市場予測、2024~2034年(10億米ドル、AGR%、CAGR)
表16 その他セグメントの地域別市場予測、2024~2034年(10億米ドル、AGR%、CAGR)
表17 合成燃料の最終用途別市場予測、2024-2034年(10億米ドル、AGR%、CAGR)
表18 運輸セグメントの地域別市場予測、2024-2034年(10億米ドル、AGR%、CAGR)
表19 産業セグメントの地域別市場予測、2024-2034年(10億米ドル、AGR%、CAGR)
表20 化学・その他セグメントの地域別市場予測、2024-2034年(10億米ドル、AGR%、CAGR)
表21 合成燃料の地域別市場予測、2024~2034年(10億米ドル、AGR%、CAGR)
表22 北米の合成燃料市場の国別予測、2024-2034年(10億米ドル、AGR%、CAGR)
表23 北米の合成燃料市場の原料別予測、2024-2034年(10億米ドル、AGR%、CAGR)
表24 北米の合成燃料市場の用途別予測、2024~2034年(10億米ドル、AGR%、CAGR)
表25 北米の合成燃料市場の予測:燃料タイプ別、2024-2034年(10億米ドル、AGR%、CAGR)
表26 北米合成燃料市場の用途別予測:2024-2034年(10億米ドル、AGR%、CAGR)
表27 米国合成燃料市場の予測、2024~2034年(10億米ドル、AGR%、CAGR)
表28 カナダ合成燃料市場の予測、2024~2034年(10億米ドル、AGR%、CAGR)
表29 欧州合成燃料の国別市場予測、2024~2034年(10億米ドル、AGR%、CAGR)
表30 欧州合成燃料の原料別市場予測、2024~2034年(10億米ドル、AGR%、CAGR)
表31 欧州合成燃料市場の用途別予測、2024~2034年(10億米ドル、AGR%、CAGR)
表32 欧州合成燃料市場の予測:燃料タイプ別、2024-2034年(10億米ドル、AGR%、CAGR)
表33 欧州合成燃料市場の用途別予測:2024-2034年(10億米ドル、AGR%、CAGR)
表34 ドイツ合成燃料市場の予測、2024-2034年(10億米ドル、AGR%、CAGR)
表35 イギリス合成燃料市場の予測、2024-2034年(10億米ドル、AGR%、CAGR)
表 36 フランス合成燃料市場の予測、2024~2034年(10億米ドル、AGR%、CAGR)
表37 イタリア合成燃料市場の予測、2024~2034年(10億米ドル、AGR%、CAGR)
表 38 スペインの合成燃料市場の予測、2024~2034年(10億米ドル、AGR%、CAGR)
表39 その他のヨーロッパの合成燃料市場の予測、2024-2034年(10億米ドル、AGR%、CAGR)
表40 アジア太平洋地域の合成燃料の国別市場予測、2024~2034年(10億米ドル、AGR%、CAGR)
表41 アジア太平洋地域の合成燃料の原料別市場予測、2024~2034年(10億米ドル、AGR%、CAGR)
表42 アジア太平洋地域の合成燃料市場の用途別予測、2024~2034年(10億米ドル、AGR%、CAGR)
表43 アジア太平洋地域の合成燃料市場の予測:燃料タイプ別、2024~2034年(10億米ドル、AGR%、CAGR)
表44 アジア太平洋地域の合成燃料市場の用途別予測:2024-2034年(10億米ドル、AGR%、CAGR)
表45 中国合成燃料市場の予測、2024-2034年(10億米ドル、AGR%、CAGR)
表46 インド合成燃料市場の予測、2024-2034年(10億米ドル、AGR%、CAGR)
表47 日本の合成燃料市場の予測、2024-2034年(10億米ドル、AGR%、CAGR)
表 48 韓国の合成燃料市場の予測、2024~2034年(10億米ドル、AGR%、CAGR)
表49 オーストラリアの合成燃料市場の予測、2024~2034年(10億米ドル、AGR%、CAGR)
表50 その他のアジア太平洋地域の合成燃料市場の予測、2024-2034年(10億米ドル、AGR%、CAGR)
表51 ラテンアメリカの合成燃料の国別市場予測、2024-2034年(10億米ドル、AGR%、CAGR)
表52 ラテンアメリカの合成燃料市場の原料別予測、2024-2034年(10億米ドル、AGR%、CAGR)
表53 ラテンアメリカの合成燃料市場の用途別予測、2024-2034年 (10億米ドル、AGR%、CAGR%)
表54 ラテンアメリカの合成燃料市場予測:燃料タイプ別(2024-2034年、10億米ドル、AGR%、CAGR)
表55 ラテンアメリカの合成燃料市場予測:最終用途別(2024-2034年、10億米ドル、AGR%、CAGR)
表56 ブラジル合成燃料市場の予測、2024-2034年 (10億米ドル、AGR%、CAGR%)
表57 メキシコ合成燃料市場の予測、2024~2034年(10億米ドル、AGR%、CAGR)
表58 その他のラテンアメリカの合成燃料市場の予測、2024~2034年(10億米ドル、AGR%、CAGR)
表59 中東・アフリカ合成燃料の国別市場予測、2024~2034年(10億米ドル、AGR%、CAGR)
表60 中東・アフリカ合成燃料の原料別市場予測、2024~2034年(10億米ドル、AGR%、CAGR)
表61 中東・アフリカ合成燃料の用途別市場予測(2024~2034年、10億米ドル、AGR%、CAGR)
表62 中東・アフリカ合成燃料の燃料タイプ別市場予測:2024~2034年(10億米ドル、AGR%、CAGR)
表63 中東・アフリカ合成燃料市場の用途別予測:2024~2034年(10億米ドル、AGR%、CAGR)
表64 GCCの合成燃料市場予測、2024~2034年(10億米ドル、AGR%、CAGR)
表65 南アフリカの合成燃料市場の予測、2024~2034年(10億米ドル、AGR%、CAGR)
表66 その他の中東・アフリカ合成燃料市場の予測、2024~2034年(10億米ドル、AGR%、CAGR)
表67 Shell plc:主な詳細(CEO, 本社, 売上高, 設立, 従業員数, 企業タイプ, ウェブサイト, 事業セグメント)
表 68 シェル plc:製品ベンチマーク
表 69 シェル plc:戦略的展望
表70 サソル:主要業績(CEO, 本社, 売上高, 設立, 従業員数, 企業タイプ, ウェブサイト, 事業セグメント)
表 71 サソル:製品ベンチマーク
表72 サソル:戦略的展望
表73 シェブロン・リニューアブル・エナジー・グループ主な詳細(CEO, 本社, 売上高, 設立, 従業員数, 企業タイプ, ウェブサイト, 事業セグメント)
表 74 シェブロン・リニューアブル・エナジー・グループ製品ベンチマーク
表 75 シェブロン・リニューアブル・エナジー・グループ:戦略的展望
表76 エクソン モービル コーポレーション主な詳細(CEO、本社、売上高、設立、従業員数、会社タイプ、ウェブサイト、事業セグメント)
表 77 エクソン モービル コーポレーション製品ベンチマーク
表78 エクソン モービル コーポレーション:戦略的展望戦略的展望
表79 トータルエナジー主な詳細(CEO, 本社, 売上高, 設立, 従業員数, 企業タイプ, ウェブサイト, 事業セグメント)
表 80 トータルエナジー製品ベンチマーク
表 81 トータルエナジー:戦略的展望
表82 ネステ:主な詳細(CEO, 本社, 売上高, 設立, 従業員数, 企業タイプ, ウェブサイト, 事業セグメント)
表83 ネステ:製品ベンチマーク
表84 ネステ:戦略的展望
表85 ペトロサ:主要業績(CEO, 本社, 売上高, 設立, 従業員数, 企業タイプ, ウェブサイト, 事業セグメント)
表 86 ペトロサ製品ベンチマーク
表87 リンデPLC: 主要詳細(CEO, 本社, 売上高, 設立, 従業員数, 企業タイプ, ウェブサイト, 事業セグメント)
表88 リンデPLC:製品ベンチマーク
表89 リンデPLC:戦略的展望
表 90 ダコタ・ガス化会社主な詳細(CEO、本社、売上高、設立、従業員数、会社タイプ、ウェブサイト、事業セグメント)
表 91 ダコタ・ガス化社製品ベンチマーク
表92 サンファイアGmbH: 主要企業詳細(CEO, 本社, 売上高, 設立, 従業員数, 企業タイプ, ウェブサイト, 事業セグメント)
表 93 サンファイア社:製品ベンチマーク
表94 サンファイアGmbH:戦略的展望
表95 Maire Tecnimont:主な詳細(CEO, 本社, 売上高, 設立, 従業員数, 企業タイプ, ウェブサイト, 事業セグメント)
表 96 Maire Tecnimont:製品ベンチマーク
表 97 メール・テクニモン:戦略的展望
表98 RWE:主要詳細(CEO、本社、売上高、設立、従業員数、企業タイプ、ウェブサイト、事業セグメント)
表99 RWE:製品ベンチマーク
表100 RWE:戦略的展望
表101 Gevo:主な詳細(CEO, 本社, 売上高, 設立, 従業員数, 企業タイプ, ウェブサイト, 事業セグメント)
表102 Gevo:製品ベンチマーク
表103 Gevo社戦略的展望
表104 Crop Energies AG: 主要詳細(CEO, 本社, 売上高, 設立, 従業員数, 企業タイプ, ウェブサイト, 事業セグメント)
表105 Crop Energies AG:製品ベンチマーク
表106 クロップ・エナジーズAG:戦略的展望
表 107 ゼロ・ペトロリアム:主要詳細(CEO, 本社, 売上高, 設立, 従業員数, 企業タイプ, ウェブサイト, 事業セグメント)
表108 ゼロ・ペトロリアム:製品ベンチマーク
表109 ゼロ・ペトロリアム:戦略的展望
図の一覧
図 1 合成燃料市場のセグメンテーション
図2 原料別合成燃料市場:市場魅力度指数
図3 合成燃料市場:用途別:市場魅力度指数
図4 燃料タイプ別合成燃料市場:市場魅力度指数市場魅力度指数
図5 合成燃料の最終用途別市場:市場魅力度指数市場魅力度指数
図6 合成燃料市場:地域別魅力度指数
図7 合成燃料市場市場ダイナミクス
図8 合成燃料市場影響分析
図 9 バイオマスの国内供給
図 10 天然ガス生産量(2010 年~2023 年)(単位:億立方メートル
図 11 2023 年の地域別石炭生産量(Mt)
図 12 合成燃料のコスト分布
図 13 電気自動車販売台数、2020 ? 2024 (百万台)
図14 再生可能エネルギー電力容量の国・地域別増加量(2005年~2028年)(GW
図 15 合成燃料市場:ポーターのファイブフォース分析
図 16 合成燃料市場:PEST分析
図 17 合成燃料市場:原料別:市場魅力度指数
図 18 2024-2034 年の合成燃料の原料別市場予測(10 億米ドル、AGR %)
図19 2024年、2029年、2034年の合成燃料の原料別市場シェア予測(%)
図 20 石炭セグメントの地域別市場予測、2024~2034 年(10 億米ドル、AGR %)
図 21 石炭セグメントの地域別市場予測、2024 年~2034 年(%)
図22 天然ガスセグメントの地域別市場予測、2024~2034年(10億米ドル、AGR)
図 23 天然ガスセグメントの地域別市場シェア予測、2024 年~2034 年(%)
図24 その他の原料セグメントの地域別市場予測、2024~2034年 (10億米ドル、AGR %)
図 25 その他の原料セグメントの地域別市場シェア予測、2024 年~2034 年(%)
図 26 用途別合成燃料市場:市場魅力度指数
図 27 2024-2034 年の用途別合成燃料市場予測(10 億米ドル、AGR)
図 28 2024 年、2029 年、2034 年の用途別合成燃料市場シェア予測 (%)
図 29 ガソリンセグメントの地域別市場予測、2024~2034 年 (10 億米ドル、AGR %)
図 30 ガソリン・セグメント地域別市場シェア予測、2024 年~2034 年(%)
図31 ディーゼルセグメント地域別市場予測、2024~2034年 (10億米ドル, AGR %)
図 32 2024~2034 年におけるディーゼルセグメント地域別市場シェア予測 (%)
図33 2024~2034年の地域別灯油セグメント市場予測(10億米ドル、AGR)
図 34 2024-2034 年における灯油セグメントの地域別市場シェア予測 (%)
図 35 燃料タイプ別合成燃料市場:市場魅力度指数
図 36 2024-2034 年の燃料タイプ別合成燃料市場予測(10 億米ドル、AGR)
図 37 2024 年、2029 年、2034 年の燃料タイプ別合成燃料市場シェア予測 (%)
図 38 超重質油セグメントの地域別市場予測、2024~2034 年 (10 億米ドル、AGR %)
図 39 超重質油セグメントの地域別市場予測、2024 年~2034 年(%)
図 40 2024-2034 地域別ガス~液体油セグメント市場予測(10 億米ドル、AGR)
図 41 2024-2034 地域別ガス~液体油セグメント市場シェア予測 (%)
図 42 2024-2034 シェールオイルセグメントの地域別市場予測(10 億米ドル、AGR)
図 43 シェールオイルセグメントの地域別市場シェア予測、2024 年~2034 年(%)
図 44 2024-2034 年におけるオイルサンド・セグメントの地域別市場予測(10 億米ドル、AGR)
図 45 2024-2034 年オイルサンド・セグメントの地域別市場シェア予測 (%)
図 46 2024-2034 年における石炭から液体への変換セグメントの地域別市場予測 (10 億米ドル, AGR)
図 47 2024-2034 年の地域別石炭-液体燃料セグメント市場シェア予測 (%)
図 48 2024-2034 年地域別その他セグメント市場予測(10 億米ドル、AGR)
図 49 2024-2034 年地域別その他セグメント市場シェア予測 (%)
図 50 最終用途別合成燃料市場:市場魅力度指数
図 51 2024-2034 年の最終用途別合成燃料市場予測(億米ドル、AGR)
図52 最終用途別合成燃料市場予測:2024年、2029年、2034年(%)
図 53 輸送セグメントの地域別市場予測、2024~2034 年(10 億米ドル、AGR %)
図 54 輸送用燃料の地域別市場予測、2024 年~2034 年(%)
図55 2024~2034年の地域別産業セグメント市場予測(10億米ドル、AGR)
図56 2024年~2034年の地域別産業セグメント市場シェア予測(%)
図 57 2024-2034 年における化学・その他セグメントの地域別市場予測(10 億米ドル、AGR)
図 58 化学その他セグメントの地域別市場シェア予測、2024 年~2034 年(%)
図 59 2024 年および 2034 年の合成燃料の地域別市場展望(売上高、CAGR)
図 60 2024 年、2029 年、2034 年の地域別合成燃料市場シェア予測(%)
図 61 2024-2034 年の地域別合成燃料市場予測(億米ドル, AGR %)
図 62 北米の合成燃料市場魅力度指数
図 63 北米の地域別合成燃料市場(2024 年、2029 年、2034 年)(10 億米ドル
図 64 北米の国別合成燃料市場予測(2024~2034 年)(10 億米ドル、AGR %)
図 65 北米合成燃料の国別市場予測、2024 年~2034 年(%)
図66 2024~2034年の北米合成燃料市場の原料別予測(10億米ドル、AGR)
図 67 北米の合成燃料市場の原料別シェア予測、2024年~2034年(%)
図 68 北米の合成燃料市場の用途別予測、2024~2034 (億米ドル、AGR %)
図 69 2024-2034 年北米合成燃料市場用途別シェア予測 (%)
図 70 北米の合成燃料市場の燃料タイプ別予測、2024~2034 年 (10 億米ドル、AGR %)
図 71 北米の合成燃料市場 2024-2034 年燃料タイプ別シェア予測 (%)
図 72 北米の合成燃料市場の用途別予測、2024~2034 年 (10 億米ドル、AGR %)
図 73 2024-2034 年の北米合成燃料市場の用途別シェア予測 (%)
図 74 2024-2034 年の米国合成燃料市場予測(10 億米ドル、AGR)
図 75 カナダ合成燃料市場の予測、2024~2034 年(10 億米ドル、AGR %)
図 76 欧州合成燃料市場魅力度指数
図 77 欧州合成燃料市場の地域別予測(2024 年、2029 年、2034 年)(10 億米ドル
図 78 欧州合成燃料の国別市場予測(2024~2034 年)(10 億米ドル、AGR %)
図 79 欧州合成燃料の国別市場予測、2024 年~2034 年(%)
図 80 2024-2034 年の欧州合成燃料の原料別市場予測 (億米ドル、AGR %)
図 81 2024-2034 年における欧州合成燃料の原料別市場シェア予測 (%)
図 82 2024-2034 年の欧州合成燃料市場用途別予測(億米ドル、AGR)
図 83 2024-2034 年の欧州合成燃料市場用途別シェア予測 (%)
図 84 2024-2034 年燃料タイプ別欧州合成燃料市場予測(10 億米ドル、AGR)
図 85 2024-2034 燃料タイプ別欧州合成燃料市場シェア予測 (%)
図 86 2024-2034 年の欧州合成燃料市場の用途別予測(10 億米ドル、AGR)
図 87 2024-2034 年の欧州合成燃料市場の用途別シェア予測 (%)
図 88 ドイツ合成燃料市場の予測、2024~2034 年 (10 億米ドル、AGR %)
図 89 イギリス合成燃料市場の予測、2024~2034 年 (10 億米ドル、AGR %)
図 90 フランス合成燃料市場の予測、2024~2034 年 (10 億米ドル、AGR %)
図 91 イタリア合成燃料市場の予測、2024~2034 年 (10 億米ドル、AGR %)
図 92 スペインの合成燃料市場の予測、2024~2034 年 (10 億米ドル、AGR %)
図 93 その他のヨーロッパの合成燃料市場予測、2024~2034 (10億米ドル、AGR %)
図 94 アジア太平洋地域の合成燃料市場魅力度指数
図 95 アジア太平洋地域の合成燃料市場の地域別予測(2024 年、2029 年、2034 年)(10 億米ドル
図96 アジア太平洋地域の国別合成燃料市場予測(2024~2034年、10億米ドル、AGR)
図 97 アジア太平洋地域の国別合成燃料市場予測、2024 年~2034 年(%)
図98 アジア太平洋地域の合成燃料の原料別市場予測(2024~2034年、10億米ドル、AGR)
図99 アジア太平洋地域の合成燃料の原料別市場予測、2024年~2034年(%)
図100 アジア太平洋地域の合成燃料市場の用途別予測、2024~2034年 (10億米ドル、AGR %)
図101 アジア太平洋地域の合成燃料市場の用途別シェア予測、2024年~2034年(%)
図102 アジア太平洋地域の合成燃料市場の燃料タイプ別予測、2024~2034年 (10億米ドル、AGR %)
図103 アジア太平洋地域の合成燃料市場:燃料タイプ別シェア予測、2024年~2034年(%)
図104 アジア太平洋地域の合成燃料市場の用途別予測、2024~2034年 (10億米ドル、AGR %)
図 105 アジア太平洋地域の最終用途別合成燃料市場予測、2024 年~2034 年 (%)
図 106 中国の合成燃料市場予測、2024~2034 年 (10 億米ドル、AGR %)
図 107 インド合成燃料市場の予測、2024~2034年 (10億米ドル、AGR %)
図 108 日本の合成燃料市場の予測、2024-2034 (10億米ドル, AGR %)
図 109 韓国合成燃料市場の予測、2024-2034 (10億米ドル, AGR %)
図 110 オーストラリア合成燃料市場の予測、2024~2034 年 (10 億米ドル, AGR %)
図 111 その他のアジア太平洋地域の合成燃料市場予測、2024~2034 年 (10 億米ドル、AGR %)
図 112 中南米の合成燃料市場魅力度指数
図 113 中南米の地域別合成燃料市場(2024 年、2029 年、2034 年)(10 億米ドル
図114 中南米の合成燃料国別市場予測(2024~2034年、10億米ドル、AGR)
図 115 ラテンアメリカ合成燃料の国別市場予測、2024 年~2034 年 (%)
図116 中南米の合成燃料市場の原料別予測(2024~2034年、10億米ドル、AGR)
図 117 中南米の合成燃料の原料別市場予測、2024~2034 年 (%)
図118 中南米の合成燃料市場用途別予測、2024~2034年 (10億米ドル、AGR %)
図 119 2024-2034 年ラテンアメリカ合成燃料市場用途別シェア予測 (%)
図120 中南米の合成燃料市場予測(燃料タイプ別)、2024~2034年 (10億米ドル、AGR %)
図 121 2024-2034 年燃料タイプ別ラテンアメリカ合成燃料市場シェア予測 (%)
図 122 ラテンアメリカの合成燃料市場の用途別予測、2024~2034年 (10億米ドル、AGR %)
図 123 2024-2034 年のラテンアメリカ合成燃料市場の用途別シェア予測 (%)
図 124 ブラジル合成燃料市場の予測、2024~2034 年(10 億米ドル、AGR %)
図 125 メキシコ合成燃料市場予測、2024~2034 年(10 億米ドル、AGR %)
図 126 その他のラテンアメリカ合成燃料市場予測、2024~2034 年 (10 億米ドル、AGR %)
図 127 中東・アフリカ合成燃料市場魅力度指数
図 128 中東・アフリカの地域別合成燃料市場(2024 年、2029 年、2034 年)(10 億米ドル
図 129 中東・アフリカ合成燃料国別市場予測(2024~2034 年)(10 億米ドル、AGR
図 130 2024-2034 年の中東・アフリカ合成燃料国別市場シェア予測(%)
図 131 2024-2034 年中東・アフリカ合成燃料原料別市場予測(10 億米ドル、AGR)
図 132 2024-2034 年における中東・アフリカ合成燃料の原料別市場シェア予測 (%)
図 133 2024-2034 年中東・アフリカ合成燃料用途別市場予測(10 億米ドル、AGR)
図 134 2024-2034 年中東・アフリカ合成燃料市場用途別シェア予測 (%)
図 135 2024-2034 年の中東・アフリカ合成燃料市場予測(燃料タイプ別、10 億米ドル、AGR)
図 136 2024-2034 年燃料タイプ別中東・アフリカ合成燃料市場シェア予測(%)
図 137 2024-2034 年の中東・アフリカ合成燃料市場の用途別予測(10 億米ドル、AGR)
図 138 2024-2034 年における中東・アフリカ合成燃料市場の用途別シェア予測 (%)
図 139 GCC 合成燃料市場の予測、2024~2034 年 (10 億米ドル、AGR %)
図 140 南アフリカの合成燃料市場予測、2024~2034 年 (10 億米ドル、AGR %)
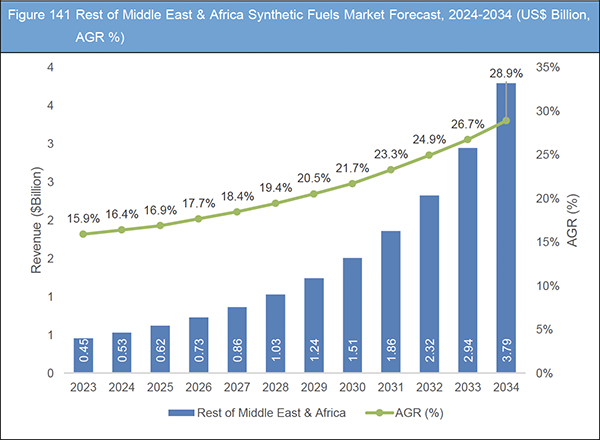
図 141 その他の中東・アフリカ合成燃料市場の予測、2024~2034 年 (10 億米ドル、AGR %)
図 142 Shell plc:純収入、2019年~2023年(百万米ドル、AGR)
図 143 Shell plc:事業セグメント別市場シェア(2023年
図 144 シェル plc:SWOT分析
図 145 サソル:純収入、2019 年~2023 年(百万米ドル、AGR)
図 146 サソル:地域別市場シェア、2023 年
図 147 サソル:事業セグメント別市場シェア(2023 年
図 148 サソル:SWOT 分析
図 149 シェブロン:純収入、2019 年~2023 年(百万米ドル、AGR)
図 150 エクソン モービル コーポレーション純収入、2019 年~2023 年(百万米ドル、AGR)
図 151 エクソン モービル コーポレーション:R&D, 2019-2023 (百万米ドル, AGR%)
図 152 エクソン モービル コーポレーション:事業セグメントの市場シェア(2023 年
図 153 トータルエナジー:純収入、2019~2023 年(百万米ドル、AGR)
図 154 トータルエナジーR&D, 2019-2023 (百万米ドル, AGR%)
図 155 トータルエナジー:事業セグメントの市場シェア(2023 年
図 156 ネステ:純収入、2019 年~2023 年(百万米ドル、AGR)
図 157 ネステ:地域別市場シェア(2023年
図 158 Neste:事業セグメント別市場シェア(2023年
図 159 ネステ:SWOT分析
図 160 リンデ PLC:純収入、2019 年~2023 年(百万米ドル、AGR)
図 161 リンデ PLC:R&D, 2019-2023 (百万米ドル, AGR%)
図 162 リンデ PLC:地域別市場シェア(2023
図 163 リンデ PLC:事業セグメント別市場シェア(2023 年
図 164 Basin Electric Power Cooperative:純収入、2019~2023 年(百万米ドル、AGR)
図 165 ダコタ・ガス化会社:製品市場シェア、2023 年
図 166 Maire Tecnimont:純収入、2019~2023 年(百万米ドル、AGR)
図 167 Maire Tecnimont:地域別市場シェア、2023 年
図 168 Maire Tecnimont:事業セグメント別市場シェア(2023 年
図 169 RWE:純収入、2019 年~2023 年(百万米ドル、AGR)
図170 RWE:事業セグメント別市場シェア、2023年
図 171 RWE:SWOT 分析
図 172 Gevo:純収入、2018年~2022年(百万米ドル、AGR)
図 173 Gevo:事業セグメント別市場シェア、2023年
図 174 Crop Energies AG:純収入、2018~2022 年(百万米ドル、AGR)
図 175 Crop Energies AG: 事業セグメント別市場シェア、2023 年
ページTOPに戻る
Summary
Report Details
The Synthetic Fuels Market Report 2024-2034: This report will prove invaluable to leading firms striving for new revenue pockets if they wish to better understand the industry and its underlying dynamics. It will be useful for companies that would like to expand into different industries or to expand their existing operations in a new region.
Availability of Feedstock to Drive Synthetic Fuel Market
Synthetic fuels, also known as alternative or renewable fuels, have emerged as a promising solution to mitigate the environmental impact of traditional fossil fuels. These fuels are synthesized from renewable sources such as biomass, waste materials, and even carbon dioxide captured from the atmosphere. Central to the development and scalability of synthetic fuels is the availability and diversity of feedstock. Feedstock refers to the raw materials used in the production of synthetic fuels. Unlike conventional fossil fuels that rely on finite resources like crude oil, natural gas, and coal, synthetic fuels leverage a variety of renewable and sustainable sources.
Biomass: Organic materials derived from plants, agricultural residues, forestry by-products, and algae. Biomass can be processed to extract sugars, oils, or cellulose, which are then converted into synthetic fuels through processes like gasification, fermentation, and thermochemical conversion. In 2020, domestic supply of biomass was 57.5 EJ globally. 86% of the domestic supply was from solid biomass sources including wood chips, wood pellets and traditional biomass sources. Liquid biofuels accounted for 7%, municipal and industrial waste sectors accounted for 2 – 3% followed by biogas at 2%.
Factors Restraining Synthetic Fuel Industry Growth
The production of synthetic fuels, particularly through methods like Fischer-Tropsch synthesis or Power-to-Liquids (PtL), requires significant amounts of energy. The cost of this energy, especially if sourced from renewable sources, is currently high. Setting up facilities for the production of synthetic fuels involves substantial capital expenditure. This includes the cost of building plants, acquiring technology, and ensuring regulatory compliance. The industry is not yet operating at a scale that allows for cost efficiencies. Larger production scales are necessary to bring down unit costs, but achieving this scale requires significant initial investments.
Current technologies for producing synthetic fuels are not as efficient as conventional fuel production. Improving the efficiency of these processes is crucial to making synthetic fuels competitive. The existing infrastructure for fuel production and distribution is geared towards fossil fuels. Significant modifications or new infrastructure are required to handle synthetic fuels, which presents logistical and financial challenges.
What Questions Should You Ask before Buying a Market Research Report?
-
How is the synthetic fuels market evolving?
-
What is driving and restraining the synthetic fuels market?
-
How will each synthetic fuels submarket segment grow over the forecast period and how much revenue will these submarkets account for in 2034?
-
How will the market shares for each synthetic fuels submarket develop from 2024 to 2034?
-
What will be the main driver for the overall market from 2024 to 2034?
-
Will leading synthetic fuels markets broadly follow the macroeconomic dynamics, or will individual national markets outperform others?
-
How will the market shares of the national markets change by 2034 and which geographical region will lead the market in 2034?
-
Who are the leading players and what are their prospects over the forecast period?
-
What are the synthetic fuels projects for these leading companies?
-
How will the industry evolve during the period between 2024 and 2034? What are the implications of synthetic fuels projects taking place now and over the next 10 years?
-
Is there a greater need for product commercialisation to further scale the synthetic fuels market?
-
Where is the synthetic fuels market heading and how can you ensure you are at the forefront of the market?
-
What are the best investment options for new product and service lines?
-
What are the key prospects for moving companies into a new growth path and C-suite?
You need to discover how this will impact the synthetic fuels market today, and over the next 10 years:
-
Our 311-page report provides 109 tables and 175 charts/graphs exclusively to you.
-
The report highlights key lucrative areas in the industry so you can target them – NOW.
-
It contains in-depth analysis of global, regional and national sales and growth.
-
It highlights for you the key successful trends, changes and revenue projections made by your competitors.
Forecasts to 2034 and other analyses reveal commercial prospects
-
In addition to revenue forecasting to 2034, our new study provides you with recent results, growth rates, and market shares.
-
You will find original analyses, with business outlooks and developments.
-
Discover qualitative analyses (including market dynamics, drivers, opportunities, restraints and challenges), cost structure, impact of rising fuel prices and recent developments.
Segments Covered in the Report
Feedstock
Application
Fuel Type
-
Extra Heavy Oils
-
Gas to Liquid Oils
-
Shale Oils
-
Oil Sands
-
Coal to Liquid
-
Others
End-use
-
Transportation
-
Industrial
-
Chemical & others
In addition to the revenue predictions for the overall world market and segments, you will also find revenue forecasts for five regional and 15 leading national markets:
North America
Europe
-
Germany
-
UK
-
France
-
Spain
-
Italy
-
Rest of Europe
Asia Pacific
-
China
-
Japan
-
India
-
Australia
-
South Korea
-
Rest of Asia Pacific
Latin America
-
Brazil
-
Mexico
-
Rest of Latin America
MEA
-
GCC
-
South Africa
-
Rest of MEA
The report also includes profiles and for some of the leading companies in the Synthetic Fuels Market, 2024 to 2034, with a focus on this segment of these companies’ operations.
Leading companies profiled in the report
-
Chevron Renewable Energy Group
-
CropEnergies AG
-
Dakota Gasification Company
-
ExxonMobil Corporation
-
Gevo, Inc.
-
Linde plc
-
Maire Tecnimont
-
Neste
-
PetroSA
-
RWE
-
Sasol Limited
-
Shell plc
-
Sunfire
-
TotalEnergies SE
-
Zero Petroleum
Overall world revenue for Synthetic Fuels Market, 2024 to 2034 in terms of value the market will surpass US$9.0 billion in 2024, our work calculates. We predict strong revenue growth through to 2034. Our work identifies which organizations hold the greatest potential. Discover their capabilities, progress, and commercial prospects, helping you stay ahead.
How will the Synthetic Fuels Market, 2024 to 2034 report help you?
In summary, our 310+ page report provides you with the following knowledge:
-
Revenue forecasts to 2034 for Synthetic Fuels Market, 2024 to 2034 Market, with forecasts for feedstock, fuel type, application and end use, each forecast at a global and regional level – discover the industry’s prospects, finding the most lucrative places for investments and revenues.
-
Revenue forecasts to 2034 for five regional and 15 key national markets – See forecasts for the Synthetic Fuels Market, 2024 to 2034 market in North America, Europe, Asia-Pacific, Latin America, and MEA. Also forecasted is the market in the US, Canada, Mexico, Brazil, Germany, France, UK, Italy, China, India, Japan, and Australia among other prominent economies.
-
Prospects for established firms and those seeking to enter the market – including company profiles for 15 of the major companies involved in the Synthetic Fuels Market, 2024 to 2034.
Find quantitative and qualitative analyses with independent predictions. Receive information that only our report contains, staying informed with invaluable business intelligence.
Information found nowhere else
With our new report, you are less likely to fall behind in knowledge or miss out on opportunities. See how our work could benefit your research, analyses, and decisions. Visiongain’s study is for everybody needing commercial analyses for the Synthetic Fuels Market, 2024 to 2034, market-leading companies. You will find data, trends and predictions.
ページTOPに戻る
Table of Contents
1 Report Overview
1.1 Objectives of the Study
1.2 Introduction to Synthetic Fuels Market
1.3 What This Report Delivers
1.4 Why You Should Read This Report
1.5 Key Questions Answered by This Analytical Report
1.6 Who is This Report for?
1.7 Methodology
1.7.1 Market Definitions
1.7.2 Market Evaluation & Forecasting Methodology
1.7.3 Data Validation
1.7.3.1 Primary Research
1.7.3.2 Secondary Research
1.8 Frequently Asked Questions (FAQs)
1.9 Associated Visiongain Reports
1.10 About Visiongain
2 Executive Summary
3 Market Overview
3.1 Key Findings
3.2 Market Dynamics
3.3 Impact Analysis
3.3.1 Market Driving Factors
3.3.1.1 Carbon Capture Utilisation and Storage to Drive the Market
3.3.1.2 Environmental Regulations and Policies to Drive Synthetic Fuel Industry
3.3.1.3 Availability of Feedstock to Drive Synthetic Fuel Market
3.3.2 Market Restraining Factors
3.3.2.1 High Cost of Synthetic Fuel
3.3.2.2 Growing Electric Vehicle Industry to Restrain Synthetic Fuel Market Growth
3.3.2.3 Factors Restraining Synthetic Fuel Industry Growth
3.3.3 Market Opportunities
3.3.3.1 Renewable Energy Integration to Open New Avenues for the Market
3.3.3.2 Strategic Partnerships and Investments to Propel the Market
3.4 Regulatory Framework
3.5 Emerging Markets and Megatrends
3.6 Porter’s Five Forces Analysis
3.6.1 Bargaining Power of Suppliers
3.6.2 Bargaining Power of Buyers
3.6.3 Competitive Rivalry
3.6.4 Threat of Substitutes
3.6.5 Threat of New Entrants
3.7 PEST Analysis
3.7.1 Political Factors
3.7.2 Economic Factors
3.7.3 Social Factors
3.7.4 Technological Factors
4 Synthetic Fuels Market Analysis by Feedstock
4.1 Key Findings
4.2 Feedstock Segment: Market Attractiveness Index
4.3 Synthetic Fuels Market Size Estimation and Forecast by Feedstock
4.4 Coal
4.4.1 Market Size by Region, 2024-2034 (US$ Billion)
4.4.2 Market Share by Region, 2024 & 2034 (%)
4.5 Natural Gas
4.5.1 Market Size by Region, 2024-2034 (US$ Billion)
4.5.2 Market Share by Region, 2024 & 2034 (%)
4.6 Other Feedstock
4.6.1 Market Size by Region, 2024-2034 (US$ Billion)
4.6.2 Market Share by Region, 2024 & 2034 (%)
5 Synthetic Fuels Market Analysis by Application
5.1 Key Findings
5.2 Application Segment: Market Attractiveness Index
5.3 Synthetic Fuels Market Size Estimation and Forecast by Application
5.4 Gasoline
5.4.1 Market Size by Region, 2024-2034 (US$ Billion)
5.4.2 Market Share by Region, 2024 & 2034 (%)
5.5 Diesel
5.5.1 Market Size by Region, 2024-2034 (US$ Billion)
5.5.2 Market Share by Region, 2024 & 2034 (%)
5.6 Kerosene
5.6.1 Market Size by Region, 2024-2034 (US$ Billion)
5.6.2 Market Share by Region, 2024 & 2034 (%)
6 Synthetic Fuels Market Analysis by Fuel Type
6.1 Key Findings
6.2 Fuel Type Segment: Market Attractiveness Index
6.3 Synthetic Fuels Market Size Estimation and Forecast by Fuel Type
6.4 Extra Heavy Oils
6.4.1 Market Size by Region, 2024-2034 (US$ Billion)
6.4.2 Market Share by Region, 2024 & 2034 (%)
6.5 Gas to Liquid Oils
6.5.1 Market Size by Region, 2024-2034 (US$ Billion)
6.5.2 Market Share by Region, 2024 & 2034 (%)
6.6 Shale Oils
6.6.1 Market Size by Region, 2024-2034 (US$ Billion)
6.6.2 Market Share by Region, 2024 & 2034 (%)
6.7 Oil Sands
6.7.1 Market Size by Region, 2024-2034 (US$ Billion)
6.7.2 Market Share by Region, 2024 & 2034 (%)
6.8 Coal to Liquid
6.8.1 Market Size by Region, 2024-2034 (US$ Billion)
6.8.2 Market Share by Region, 2024 & 2034 (%)
6.9 Others
6.9.1 Market Size by Region, 2024-2034 (US$ Billion)
6.9.2 Market Share by Region, 2024 & 2034 (%)
7 Synthetic Fuels Market Analysis by End Use
7.1 Key Findings
7.2 End Use Segment: Market Attractiveness Index
7.3 Synthetic Fuels Market Size Estimation and Forecast by End Use
7.4 Transportation
7.4.1 E-Fuels Pilot Plant in Chile
7.4.2 Market Size by Region, 2024-2034 (US$ Billion)
7.4.3 Market Share by Region, 2024 & 2034 (%)
7.5 Industrial
7.5.1 Three Parties Collaborated on Synthetic Fuel Supply Chain Development
7.5.2 Market Size by Region, 2024-2034 (US$ Billion)
7.5.3 Market Share by Region, 2024 & 2034 (%)
7.6 Chemical & others
7.6.1 Market Size by Region, 2024-2034 (US$ Billion)
7.6.2 Market Share by Region, 2024 & 2034 (%)
8 Synthetic Fuels Market Analysis by Region
8.1 Key Findings
8.2 Regional Market Size Estimation and Forecast
9 North America Synthetic Fuels Market Analysis
9.1 Key Findings
9.2 North America Synthetic Fuels Market Attractiveness Index
9.3 North America Synthetic Fuels Market by Country, 2024, 2029 & 2034 (US$ Billion)
9.4 North America Synthetic Fuels Market Size Estimation and Forecast by Country
9.5 North America Synthetic Fuels Market Size Estimation and Forecast by Feedstock
9.6 North America Synthetic Fuels Market Size Estimation and Forecast by Application
9.7 North America Synthetic Fuels Market Size Estimation and Forecast by Fuel Type
9.8 North America Synthetic Fuels Market Size Estimation and Forecast by End Use
9.9 U.S. Synthetic Fuels Market Analysis
9.9.1 Texas Set to Host a Major E-Fuel Production Facility
9.9.2 TotalEnergies Plans Synthetic Natural Gas Plant In The U.S.
9.10 Canada Synthetic Fuels Market Analysis
9.10.1 Federal Budget 2024 Backs Clean Fuels
10 Europe Synthetic Fuels Market Analysis
10.1 Key Findings
10.2 Europe Synthetic Fuels Market Attractiveness Index
10.3 Europe Synthetic Fuels Market by Country, 2024, 2029 & 2034 (US$ Billion)
10.4 Europe Synthetic Fuels Market Size Estimation and Forecast by Country
10.5 Europe Synthetic Fuels Market Size Estimation and Forecast by Feedstock
10.6 Europe Synthetic Fuels Market Size Estimation and Forecast by Application
10.7 Europe Synthetic Fuels Market Size Estimation and Forecast by Fuel Type
10.8 Europe Synthetic Fuels Market Size Estimation and Forecast by End Use
10.9 Germany Synthetic Fuels Market Analysis
10.9.1 Germany’s First Large-Scale E-fuel Factory
10.9.2 Germany Sustainable Aviation Fuel Industry
10.10 UK Synthetic Fuels Market Analysis
10.10.1 Zero Petroleum to Open World’s First Fully Synthetic Fuel Facility
10.10.2 Jet Zero Strategy
10.11 France Synthetic Fuels Market Analysis
10.11.1 French E-fuels Air Transport Industry, with the "Take Kair" Project
10.12 Italy Synthetic Fuels Market Analysis
10.12.1 Green Synthetic Fuels Pilot Plant in Italy
10.12.2 Development in Italy Sustainable Aviation Fuel Industry
10.13 Spain Synthetic Fuels Market Analysis
10.13.1 First Synthetic Fuels Plant in Spain
10.13.2 Greenalia, P2X-Europe to Develop Synthetic Fuels
10.14 Rest of Europe Synthetic Fuels Market Analysis
10.14.1 New E-fuel Plant in Norway
11 Asia Pacific Synthetic Fuels Market Analysis
11.1 Key Findings
11.2 Asia Pacific Synthetic Fuels Market Attractiveness Index
11.3 Asia Pacific Synthetic Fuels Market by Country, 2024, 2029 & 2034 (US$ Billion)
11.4 Asia Pacific Synthetic Fuels Market Size Estimation and Forecast by Country
11.5 Asia Pacific Synthetic Fuels Market Size Estimation and Forecast by Feedstock
11.6 Asia Pacific Synthetic Fuels Market Size Estimation and Forecast by Application
11.7 Asia Pacific Synthetic Fuels Market Size Estimation and Forecast by Fuel Type
11.8 Asia Pacific Synthetic Fuels Market Size Estimation and Forecast by End Use
11.9 China Synthetic Fuels Market Analysis
11.9.1 CO₂ To Methanol Plant Inaugurated
11.9.2 Green Aviation Fuel Plant Based on Wind-Powered Hydrogen
11.10 India Synthetic Fuels Market Analysis
11.10.1 E-Fuel Collaborates to Supercharge India’s EV Infrastructure
11.11 Japan Synthetic Fuels Market Analysis
11.11.1 Idemitsu Investment in HIF Global to Develop eFuels
11.11.2 Japan to Help Develop Low-emission Fuels
11.12 South Korea Synthetic Fuels Market Analysis
11.13 Australia Synthetic Fuels Market Analysis
11.13.1 Investment Opportunities In South Australia
11.14 Rest of Asia Pacific Synthetic Fuels Market Analysis
12 Latin America Synthetic Fuels Market Analysis
12.1 Key Findings
12.2 Latin America Synthetic Fuels Market Attractiveness Index
12.3 Latin America Synthetic Fuels Market by Country, 2024, 2029 & 2034 (US$ Billion)
12.4 Latin America Synthetic Fuels Market Size Estimation and Forecast by Country
12.5 Latin America Synthetic Fuels Market Size Estimation and Forecast by Feedstock
12.6 Latin America Synthetic Fuels Market Size Estimation and Forecast by Application
12.7 Latin America Synthetic Fuels Market Size Estimation and Forecast by Fuel Type
12.8 Latin America Synthetic Fuels Market Size Estimation and Forecast by End Use
12.9 Brazil Synthetic Fuels Market Analysis
12.9.1 Eletrobras, Suzano Team Up to Make Green Hydrogen and Synthetic Fuels
12.9.2 Brazilian-German Consortium Launched Brazilian Syncrude-SAF Pilot Project
12.10 Mexico Synthetic Fuels Market Analysis
12.11 Rest of Latin America Synthetic Fuels Market Analysis
13 Middle East & Africa Synthetic Fuels Market Analysis
13.1 Key Findings
13.2 Middle East & Africa Synthetic Fuels Market Attractiveness Index
13.3 Middle East & Africa Synthetic Fuels Market by Country, 2024, 2029 & 2034 (US$ Billion)
13.4 Middle East & Africa Synthetic Fuels Market Size Estimation and Forecast by Country
13.5 Middle East & Africa Synthetic Fuels Market Size Estimation and Forecast by Feedstock
13.6 Middle East & Africa Synthetic Fuels Market Size Estimation and Forecast by Application
13.7 Middle East & Africa Synthetic Fuels Market Size Estimation and Forecast by Fuel Type
13.8 Middle East & Africa Synthetic Fuels Market Size Estimation and Forecast by End Use
13.9 GCC Synthetic Fuels Market Analysis
13.9.1 Aramco Signs Agreement to Set Up Synthetic E-fuel Facility
13.9.2 Zero Petroleum and ADNOC Explore Synthetic Fuel Production in UAE
13.10 South Africa Synthetic Fuels Market Analysis
13.10.1 Germany's PNE to Produce E-fuels in South Africa
13.11 Rest of Middle East & Africa Synthetic Fuels Market Analysis
14 Company Profiles
14.1 Shell plc
14.1.1 Company Snapshot
14.1.2 Company Overview
14.1.3 Financial Analysis
14.1.3.1 Net Revenue, 2019-2023
14.1.3.2 Business Segment Market Shares, 2023
14.1.4 Product Benchmarking
14.1.5 Strategic Outlook
14.1.6 SWOT Analysis
14.2 Sasol
14.2.1 Company Snapshot
14.2.2 Company Overview
14.2.3 Financial Analysis
14.2.3.1 Net Revenue, 2019-2023
14.2.3.2 Regional Market Shares, 2023
14.2.3.3 Business Segment Market Shares, 2023
14.2.4 Product Benchmarking
14.2.5 Strategic Outlook
14.2.6 SWOT Analysis
14.3 Chevron Renewable Energy Group
14.3.1 Company Snapshot
14.3.2 Company Overview
14.3.3 Financial Analysis
14.3.3.1 Net Revenue, 2019-2023
14.3.4 Product Benchmarking
14.3.5 Strategic Outlook
14.4 Exxon Mobil Corporation
14.4.1 Company Snapshot
14.4.2 Company Overview
14.4.3 Financial Analysis
14.4.3.1 Net Revenue, 2019-2023
14.4.3.2 R&D, 2019-2023
14.4.3.3 Business Segment Market Shares, 2023
14.4.4 Product Benchmarking
14.4.5 Strategic Outlook
14.5 TotalEnergies
14.5.1 Company Snapshot
14.5.2 Company Overview
14.5.3 Financial Analysis
14.5.3.1 Net Revenue, 2019-2023
14.5.3.2 R&D, 2019-2023
14.5.3.3 Business Segment Market Shares, 2023
14.5.4 Product Benchmarking
14.5.5 Strategic Outlook
14.6 Neste
14.6.1 Company Snapshot
14.6.2 Company Overview
14.6.3 Financial Analysis
14.6.3.1 Net Revenue, 2019-2023
14.6.3.2 Regional Market Shares, 2023
14.6.3.3 Business Segment Market Shares, 2023
14.6.4 Product Benchmarking
14.6.5 Strategic Outlook
14.6.6 SWOT Analysis
14.7 PetroSA
14.7.1 Company Snapshot
14.7.2 Company Overview
14.7.3 Product Benchmarking
14.8 Linde PLC
14.8.1 Company Snapshot
14.8.2 Company Overview
14.8.3 Financial Analysis
14.8.3.1 Net Revenue, 2019-2023
14.8.3.2 R&D, 2019-2023
14.8.3.3 Regional Market Shares, 2023
14.8.3.4 Business Segment Market Shares, 2023
14.8.4 Product Benchmarking
14.8.5 Strategic Outlook
14.9 Dakota Gasification Company (Basin Electric Power Cooperative)
14.9.1 Company Snapshot
14.9.2 Company Overview
14.9.3 Financial Analysis
14.9.3.1 Net Revenue, 2019-2023
14.9.3.2 Product Market Shares, 2023
14.9.4 Product Benchmarking
14.10 Sunfire GmbH
14.10.1 Company Snapshot
14.10.2 Company Overview
14.10.3 Product Benchmarking
14.10.4 Strategic Outlook
14.11 Maire Tecnimont
14.11.1 Company Snapshot
14.11.2 Company Overview
14.11.3 Financial Analysis
14.11.3.1 Net Revenue, 2019-2023
14.11.3.2 Regional Market Shares, 2023
14.11.3.3 Business Segment Market Shares, 2023
14.11.4 Product Benchmarking
14.11.5 Strategic Outlook
14.12 RWE
14.12.1 Company Snapshot
14.12.2 Company Overview
14.12.3 Financial Analysis
14.12.3.1 Net Revenue, 2019-2023
14.12.3.2 Business Segment Market Shares, 2023
14.12.4 Product Benchmarking
14.12.5 Strategic Outlook
14.12.6 SWOT Analysis
14.13 Gevo
14.13.1 Company Snapshot
14.13.2 Company Overview
14.13.3 Financial Analysis
14.13.3.1 Net Revenue, 2018-2022
14.13.3.2 Business Segment Market Shares, 2023
14.13.4 Product Benchmarking
14.13.5 Strategic Outlook
14.14 Crop Energies AG
14.14.1 Company Snapshot
14.14.2 Company Overview
14.14.3 Financial Analysis
14.14.3.1 Net Revenue, 2018-2022
14.14.3.2 Business Segment Market Shares, 2023
14.14.4 Product Benchmarking
14.14.5 Strategic Outlook
14.15 Zero Petroleum
14.15.1 Company Snapshot
14.15.2 Company Overview
14.15.3 Product Benchmarking
14.15.4 Strategic Outlook
15 Conclusion and Recommendations
15.1 Concluding Remarks from Visiongain
15.2 Recommendations for Market Players
ページTOPに戻る
List of Tables/Graphs
List of Tables
Table 1 Synthetic Fuels Market Snapshot, 2024 & 2034 (US$ Billion, CAGR %)
Table 2 Synthetic Fuels Market Forecast by Feedstock, 2024-2034 (US$ Billion, AGR%, CAGR%)
Table 3 Coal Segment Market Forecast by Region, 2024-2034 (US$ Billion, AGR%, CAGR%)
Table 4 Natural Gas Segment Market Forecast by Region, 2024-2034 (US$ Billion, AGR%, CAGR%)
Table 5 Other Feedstock Segment Market Forecast by Region, 2024-2034 (US$ Billion, AGR%, CAGR%)
Table 6 Synthetic Fuels Market Forecast by Application, 2024-2034 (US$ Billion, AGR%, CAGR%)
Table 7 Gasoline Segment Market Forecast by Region, 2024-2034 (US$ Billion, AGR%, CAGR%)
Table 8 Diesel Segment Market Forecast by Region, 2024-2034 (US$ Billion, AGR%, CAGR%)
Table 9 Kerosene Segment Market Forecast by Region, 2024-2034 (US$ Billion, AGR%, CAGR%)
Table 10 Synthetic Fuels Market Forecast by Fuel Type, 2024-2034 (US$ Billion, AGR%, CAGR%)
Table 11 Extra Heavy Oils Segment Market Forecast by Region, 2024-2034 (US$ Billion, AGR%, CAGR%)
Table 12 Gas to Liquid Oils Segment Market Forecast by Region, 2024-2034 (US$ Billion, AGR%, CAGR%)
Table 13 Shale Oils Segment Market Forecast by Region, 2024-2034 (US$ Billion, AGR%, CAGR%)
Table 14 Oil Sands Segment Market Forecast by Region, 2024-2034 (US$ Billion, AGR%, CAGR%)
Table 15 Coal to Liquid Segment Market Forecast by Region, 2024-2034 (US$ Billion, AGR%, CAGR%)
Table 16 Others Segment Market Forecast by Region, 2024-2034 (US$ Billion, AGR%, CAGR%)
Table 17 Synthetic Fuels Market Forecast by End Use, 2024-2034 (US$ Billion, AGR%, CAGR%)
Table 18 Transportation Segment Market Forecast by Region, 2024-2034 (US$ Billion, AGR%, CAGR%)
Table 19 Industrial Segment Market Forecast by Region, 2024-2034 (US$ Billion, AGR%, CAGR%)
Table 20 Chemical & others Segment Market Forecast by Region, 2024-2034 (US$ Billion, AGR%, CAGR%)
Table 21 Synthetic Fuels Market Forecast by Region, 2024-2034 (US$ Billion, AGR%, CAGR%)
Table 22 North America Synthetic Fuels Market Forecast by Country, 2024-2034 (US$ Billion, AGR%, CAGR%)
Table 23 North America Synthetic Fuels Market Forecast by Feedstock, 2024-2034 (US$ Billion, AGR%, CAGR%)
Table 24 North America Synthetic Fuels Market Forecast by Application, 2024-2034 (US$ Billion, AGR%, CAGR%)
Table 25 North America Synthetic Fuels Market Forecast by Fuel Type, 2024-2034 (US$ Billion, AGR%, CAGR%)
Table 26 North America Synthetic Fuels Market Forecast by End Use, 2024-2034 (US$ Billion, AGR%, CAGR%)
Table 27 U.S. Synthetic Fuels Market Forecast, 2024-2034 (US$ Billion, AGR%, CAGR%)
Table 28 Canada Synthetic Fuels Market Forecast, 2024-2034 (US$ Billion, AGR%, CAGR%)
Table 29 Europe Synthetic Fuels Market Forecast by Country, 2024-2034 (US$ Billion, AGR%, CAGR%)
Table 30 Europe Synthetic Fuels Market Forecast by Feedstock, 2024-2034 (US$ Billion, AGR%, CAGR%)
Table 31 Europe Synthetic Fuels Market Forecast by Application, 2024-2034 (US$ Billion, AGR%, CAGR%)
Table 32 Europe Synthetic Fuels Market Forecast by Fuel Type, 2024-2034 (US$ Billion, AGR%, CAGR%)
Table 33 Europe Synthetic Fuels Market Forecast by End Use, 2024-2034 (US$ Billion, AGR%, CAGR%)
Table 34 Germany Synthetic Fuels Market Forecast, 2024-2034 (US$ Billion, AGR%, CAGR%)
Table 35 UK Synthetic Fuels Market Forecast, 2024-2034 (US$ Billion, AGR%, CAGR%)
Table 36 France Synthetic Fuels Market Forecast, 2024-2034 (US$ Billion, AGR%, CAGR%)
Table 37 Italy Synthetic Fuels Market Forecast, 2024-2034 (US$ Billion, AGR%, CAGR%)
Table 38 Spain Synthetic Fuels Market Forecast, 2024-2034 (US$ Billion, AGR%, CAGR%)
Table 39 Rest of Europe Synthetic Fuels Market Forecast, 2024-2034 (US$ Billion, AGR%, CAGR%)
Table 40 Asia Pacific Synthetic Fuels Market Forecast by Country, 2024-2034 (US$ Billion, AGR%, CAGR%)
Table 41 Asia Pacific Synthetic Fuels Market Forecast by Feedstock, 2024-2034 (US$ Billion, AGR%, CAGR%)
Table 42 Asia Pacific Synthetic Fuels Market Forecast by Application, 2024-2034 (US$ Billion, AGR%, CAGR%)
Table 43 Asia Pacific Synthetic Fuels Market Forecast by Fuel Type, 2024-2034 (US$ Billion, AGR%, CAGR%)
Table 44 Asia Pacific Synthetic Fuels Market Forecast by End Use, 2024-2034 (US$ Billion, AGR%, CAGR%)
Table 45 China Synthetic Fuels Market Forecast, 2024-2034 (US$ Billion, AGR%, CAGR%)
Table 46 India Synthetic Fuels Market Forecast, 2024-2034 (US$ Billion, AGR%, CAGR%)
Table 47 Japan Synthetic Fuels Market Forecast, 2024-2034 (US$ Billion, AGR%, CAGR%)
Table 48 South Korea Synthetic Fuels Market Forecast, 2024-2034 (US$ Billion, AGR%, CAGR%)
Table 49 Australia Synthetic Fuels Market Forecast, 2024-2034 (US$ Billion, AGR%, CAGR%)
Table 50 Rest of Asia Pacific Synthetic Fuels Market Forecast, 2024-2034 (US$ Billion, AGR%, CAGR%)
Table 51 Latin America Synthetic Fuels Market Forecast by Country, 2024-2034 (US$ Billion, AGR%, CAGR%)
Table 52 Latin America Synthetic Fuels Market Forecast by Feedstock, 2024-2034 (US$ Billion, AGR%, CAGR%)
Table 53 Latin America Synthetic Fuels Market Forecast by Application, 2024-2034 (US$ Billion, AGR%, CAGR%)
Table 54 Latin America Synthetic Fuels Market Forecast by Fuel Type, 2024-2034 (US$ Billion, AGR%, CAGR%)
Table 55 Latin America Synthetic Fuels Market Forecast by End Use, 2024-2034 (US$ Billion, AGR%, CAGR%)
Table 56 Brazil Synthetic Fuels Market Forecast, 2024-2034 (US$ Billion, AGR%, CAGR%)
Table 57 Mexico Synthetic Fuels Market Forecast, 2024-2034 (US$ Billion, AGR%, CAGR%)
Table 58 Rest of Latin America Synthetic Fuels Market Forecast, 2024-2034 (US$ Billion, AGR%, CAGR%)
Table 59 Middle East & Africa Synthetic Fuels Market Forecast by Country, 2024-2034 (US$ Billion, AGR%, CAGR%)
Table 60 Middle East & Africa Synthetic Fuels Market Forecast by Feedstock, 2024-2034 (US$ Billion, AGR%, CAGR%)
Table 61 Middle East & Africa Synthetic Fuels Market Forecast by Application, 2024-2034 (US$ Billion, AGR%, CAGR%)
Table 62 Middle East & Africa Synthetic Fuels Market Forecast by Fuel Type, 2024-2034 (US$ Billion, AGR%, CAGR%)
Table 63 Middle East & Africa Synthetic Fuels Market Forecast by End Use, 2024-2034 (US$ Billion, AGR%, CAGR%)
Table 64 GCC Synthetic Fuels Market Forecast, 2024-2034 (US$ Billion, AGR%, CAGR%)
Table 65 South Africa Synthetic Fuels Market Forecast, 2024-2034 (US$ Billion, AGR%, CAGR%)
Table 66 Rest of Middle East & Africa Synthetic Fuels Market Forecast, 2024-2034 (US$ Billion, AGR%, CAGR%)
Table 67 Shell plc: Key Details, (CEO, HQ, Revenue, Founded, No. of Employees, Company Type, Website, Business Segment)
Table 68 Shell plc: Product Benchmarking
Table 69 Shell plc: Strategic Outlook
Table 70 Sasol: Key Details, (CEO, HQ, Revenue, Founded, No. of Employees, Company Type, Website, Business Segment)
Table 71 Sasol: Product Benchmarking
Table 72 Sasol: Strategic Outlook
Table 73 Chevron Renewable Energy Group: Key Details, (CEO, HQ, Revenue, Founded, No. of Employees, Company Type, Website, Business Segment)
Table 74 Chevron Renewable Energy Group: Product Benchmarking
Table 75 Chevron Renewable Energy Group: Strategic Outlook
Table 76 Exxon Mobil Corporation: Key Details, (CEO, HQ, Revenue, Founded, No. of Employees, Company Type, Website, Business Segment)
Table 77 Exxon Mobil Corporation: Product Benchmarking
Table 78 Exxon Mobil Corporation: Strategic Outlook
Table 79 TotalEnergies: Key Details, (CEO, HQ, Revenue, Founded, No. of Employees, Company Type, Website, Business Segment)
Table 80 TotalEnergies: Product Benchmarking
Table 81 TotalEnergies: Strategic Outlook
Table 82 Neste: Key Details, (CEO, HQ, Revenue, Founded, No. of Employees, Company Type, Website, Business Segment)
Table 83 Neste: Product Benchmarking
Table 84 Neste: Strategic Outlook
Table 85 PetroSA: Key Details, (CEO, HQ, Revenue, Founded, No. of Employees, Company Type, Website, Business Segment)
Table 86 PetroSA: Product Benchmarking
Table 87 Linde PLC: Key Details, (CEO, HQ, Revenue, Founded, No. of Employees, Company Type, Website, Business Segment)
Table 88 Linde PLC: Product Benchmarking
Table 89 Linde PLC: Strategic Outlook
Table 90 Dakota Gasification Company: Key Details, (CEO, HQ, Revenue, Founded, No. of Employees, Company Type, Website, Business Segment)
Table 91 Dakota Gasification Company: Product Benchmarking
Table 92 Sunfire GmbH: Key Details, (CEO, HQ, Revenue, Founded, No. of Employees, Company Type, Website, Business Segment)
Table 93 Sunfire GmbH: Product Benchmarking
Table 94 Sunfire GmbH: Strategic Outlook
Table 95 Maire Tecnimont: Key Details, (CEO, HQ, Revenue, Founded, No. of Employees, Company Type, Website, Business Segment)
Table 96 Maire Tecnimont: Product Benchmarking
Table 97 Maire Tecnimont: Strategic Outlook
Table 98 RWE: Key Details, (CEO, HQ, Revenue, Founded, No. of Employees, Company Type, Website, Business Segment)
Table 99 RWE: Product Benchmarking
Table 100 RWE: Strategic Outlook
Table 101 Gevo: Key Details, (CEO, HQ, Revenue, Founded, No. of Employees, Company Type, Website, Business Segment)
Table 102 Gevo: Product Benchmarking
Table 103 Gevo: Strategic Outlook
Table 104 Crop Energies AG: Key Details, (CEO, HQ, Revenue, Founded, No. of Employees, Company Type, Website, Business Segment)
Table 105 Crop Energies AG: Product Benchmarking
Table 106 Crop Energies AG: Strategic Outlook
Table 107 Zero Petroleum: Key Details, (CEO, HQ, Revenue, Founded, No. of Employees, Company Type, Website, Business Segment)
Table 108 Zero Petroleum: Product Benchmarking
Table 109 Zero Petroleum: Strategic Outlook
List of Figures
Figure 1 Synthetic Fuels Market Segmentation
Figure 2 Synthetic Fuels Market by Feedstock: Market Attractiveness Index
Figure 3 Synthetic Fuels Market by Application: Market Attractiveness Index
Figure 4 Synthetic Fuels Market by Fuel Type: Market Attractiveness Index
Figure 5 Synthetic Fuels Market by End Use: Market Attractiveness Index
Figure 6 Synthetic Fuels Market Attractiveness Index by Region
Figure 7 Synthetic Fuels Market: Market Dynamics
Figure 8 Synthetic Fuels Market: Impact Analysis
Figure 9 Domestic Supply of Biomass
Figure 10 Natural Gas Production, 2010 – 2023 (in billion cubic meters)
Figure 11 Coal Production by Region, 2023 (Mt)
Figure 12 Distribution of Costs for Synthetic Fuels
Figure 13 Electric Car Sales, 2020 – 2024 (Million Units)
Figure 14 Renewable Electricity Capacity Growth by Country or Region, 2005-2028 (GW)
Figure 15 Synthetic Fuels Market: Porter’s Five Forces Analysis
Figure 16 Synthetic Fuels Market: PEST Analysis
Figure 17 Synthetic Fuels Market by Feedstock: Market Attractiveness Index
Figure 18 Synthetic Fuels Market Forecast by Feedstock, 2024-2034 (US$ Billion, AGR %)
Figure 19 Synthetic Fuels Market Share Forecast by Feedstock, 2024, 2029, 2034 (%)
Figure 20 Coal Segment Market Forecast by Region, 2024-2034 (US$ Billion, AGR %)
Figure 21 Coal Segment Market Share Forecast by Region, 2024 & 2034 (%)
Figure 22 Natural Gas Segment Market Forecast by Region, 2024-2034 (US$ Billion, AGR %)
Figure 23 Natural Gas Segment Market Share Forecast by Region, 2024 & 2034 (%)
Figure 24 Other Feedstock Segment Market Forecast by Region, 2024-2034 (US$ Billion, AGR %)
Figure 25 Other Feedstock Segment Market Share Forecast by Region, 2024 & 2034 (%)
Figure 26 Synthetic Fuels Market by Application: Market Attractiveness Index
Figure 27 Synthetic Fuels Market Forecast by Application, 2024-2034 (US$ Billion, AGR %)
Figure 28 Synthetic Fuels Market Share Forecast by Application, 2024, 2029, 2034 (%)
Figure 29 Gasoline Segment Market Forecast by Region, 2024-2034 (US$ Billion, AGR %)
Figure 30 Gasoline Segment Market Share Forecast by Region, 2024 & 2034 (%)
Figure 31 Diesel Segment Market Forecast by Region, 2024-2034 (US$ Billion, AGR %)
Figure 32 Diesel Segment Market Share Forecast by Region, 2024 & 2034 (%)
Figure 33 Kerosene Segment Market Forecast by Region, 2024-2034 (US$ Billion, AGR %)
Figure 34 Kerosene Segment Market Share Forecast by Region, 2024 & 2034 (%)
Figure 35 Synthetic Fuels Market by Fuel Type: Market Attractiveness Index
Figure 36 Synthetic Fuels Market Forecast by Fuel Type, 2024-2034 (US$ Billion, AGR %)
Figure 37 Synthetic Fuels Market Share Forecast by Fuel Type, 2024, 2029, 2034 (%)
Figure 38 Extra Heavy Oils Segment Market Forecast by Region, 2024-2034 (US$ Billion, AGR %)
Figure 39 Extra Heavy Oils Segment Market Share Forecast by Region, 2024 & 2034 (%)
Figure 40 Gas to Liquid Oils Segment Market Forecast by Region, 2024-2034 (US$ Billion, AGR %)
Figure 41 Gas to Liquid Oils Segment Market Share Forecast by Region, 2024 & 2034 (%)
Figure 42 Shale Oils Segment Market Forecast by Region, 2024-2034 (US$ Billion, AGR %)
Figure 43 Shale Oils Segment Market Share Forecast by Region, 2024 & 2034 (%)
Figure 44 Oil Sands Segment Market Forecast by Region, 2024-2034 (US$ Billion, AGR %)
Figure 45 Oil Sands Segment Market Share Forecast by Region, 2024 & 2034 (%)
Figure 46 Coal to Liquid Segment Market Forecast by Region, 2024-2034 (US$ Billion, AGR %)
Figure 47 Coal to Liquid Segment Market Share Forecast by Region, 2024 & 2034 (%)
Figure 48 Others Segment Market Forecast by Region, 2024-2034 (US$ Billion, AGR %)
Figure 49 Others Segment Market Share Forecast by Region, 2024 & 2034 (%)
Figure 50 Synthetic Fuels Market by End Use: Market Attractiveness Index
Figure 51 Synthetic Fuels Market Forecast by End Use, 2024-2034 (US$ Billion, AGR %)
Figure 52 Synthetic Fuels Market Share Forecast by End Use, 2024, 2029, 2034 (%)
Figure 53 Transportation Segment Market Forecast by Region, 2024-2034 (US$ Billion, AGR %)
Figure 54 Transportation Segment Market Share Forecast by Region, 2024 & 2034 (%)
Figure 55 Industrial Segment Market Forecast by Region, 2024-2034 (US$ Billion, AGR %)
Figure 56 Industrial Segment Market Share Forecast by Region, 2024 & 2034 (%)
Figure 57 Chemical & others Segment Market Forecast by Region, 2024-2034 (US$ Billion, AGR %)
Figure 58 Chemical & others Segment Market Share Forecast by Region, 2024 & 2034 (%)
Figure 59 Synthetic Fuels Market Forecast by Region 2024 and 2034 (Revenue, CAGR%)
Figure 60 Synthetic Fuels Market Share Forecast by Region 2024, 2029, 2034 (%)
Figure 61 Synthetic Fuels Market by Region, 2024-2034 (US$ Billion, AGR %)
Figure 62 North America Synthetic Fuels Market Attractiveness Index
Figure 63 North America Synthetic Fuels Market by Region, 2024, 2029 & 2034 (US$ Billion)
Figure 64 North America Synthetic Fuels Market Forecast by Country, 2024-2034 (US$ Billion, AGR %)
Figure 65 North America Synthetic Fuels Market Share Forecast by Country, 2024 & 2034 (%)
Figure 66 North America Synthetic Fuels Market Forecast by Feedstock, 2024-2034 (US$ Billion, AGR %)
Figure 67 North America Synthetic Fuels Market Share Forecast by Feedstock, 2024 & 2034 (%)
Figure 68 North America Synthetic Fuels Market Forecast by Application, 2024-2034 (US$ Billion, AGR %)
Figure 69 North America Synthetic Fuels Market Share Forecast by Application, 2024 & 2034 (%)
Figure 70 North America Synthetic Fuels Market Forecast by Fuel Type, 2024-2034 (US$ Billion, AGR %)
Figure 71 North America Synthetic Fuels Market Share Forecast by Fuel Type, 2024 & 2034 (%)
Figure 72 North America Synthetic Fuels Market Forecast by End Use, 2024-2034 (US$ Billion, AGR %)
Figure 73 North America Synthetic Fuels Market Share Forecast by End Use, 2024 & 2034 (%)
Figure 74 U.S. Synthetic Fuels Market Forecast, 2024-2034 (US$ Billion, AGR %)
Figure 75 Canada Synthetic Fuels Market Forecast, 2024-2034 (US$ Billion, AGR %)
Figure 76 Europe Synthetic Fuels Market Attractiveness Index
Figure 77 Europe Synthetic Fuels Market by Region, 2024, 2029 & 2034 (US$ Billion)
Figure 78 Europe Synthetic Fuels Market Forecast by Country, 2024-2034 (US$ Billion, AGR %)
Figure 79 Europe Synthetic Fuels Market Share Forecast by Country, 2024 & 2034 (%)
Figure 80 Europe Synthetic Fuels Market Forecast by Feedstock, 2024-2034 (US$ Billion, AGR %)
Figure 81 Europe Synthetic Fuels Market Share Forecast by Feedstock, 2024 & 2034 (%)
Figure 82 Europe Synthetic Fuels Market Forecast by Application, 2024-2034 (US$ Billion, AGR %)
Figure 83 Europe Synthetic Fuels Market Share Forecast by Application, 2024 & 2034 (%)
Figure 84 Europe Synthetic Fuels Market Forecast by Fuel Type, 2024-2034 (US$ Billion, AGR %)
Figure 85 Europe Synthetic Fuels Market Share Forecast by Fuel Type, 2024 & 2034 (%)
Figure 86 Europe Synthetic Fuels Market Forecast by End Use, 2024-2034 (US$ Billion, AGR %)
Figure 87 Europe Synthetic Fuels Market Share Forecast by End Use, 2024 & 2034 (%)
Figure 88 Germany Synthetic Fuels Market Forecast, 2024-2034 (US$ Billion, AGR %)
Figure 89 UK Synthetic Fuels Market Forecast, 2024-2034 (US$ Billion, AGR %)
Figure 90 France Synthetic Fuels Market Forecast, 2024-2034 (US$ Billion, AGR %)
Figure 91 Italy Synthetic Fuels Market Forecast, 2024-2034 (US$ Billion, AGR %)
Figure 92 Spain Synthetic Fuels Market Forecast, 2024-2034 (US$ Billion, AGR %)
Figure 93 Rest of Europe Synthetic Fuels Market Forecast, 2024-2034 (US$ Billion, AGR %)
Figure 94 Asia Pacific Synthetic Fuels Market Attractiveness Index
Figure 95 Asia Pacific Synthetic Fuels Market by Region, 2024, 2029 & 2034 (US$ Billion)
Figure 96 Asia Pacific Synthetic Fuels Market Forecast by Country, 2024-2034 (US$ Billion, AGR %)
Figure 97 Asia Pacific Synthetic Fuels Market Share Forecast by Country, 2024 & 2034 (%)
Figure 98 Asia Pacific Synthetic Fuels Market Forecast by Feedstock, 2024-2034 (US$ Billion, AGR %)
Figure 99 Asia Pacific Synthetic Fuels Market Share Forecast by Feedstock, 2024 & 2034 (%)
Figure 100 Asia Pacific Synthetic Fuels Market Forecast by Application, 2024-2034 (US$ Billion, AGR %)
Figure 101 Asia Pacific Synthetic Fuels Market Share Forecast by Application, 2024 & 2034 (%)
Figure 102 Asia Pacific Synthetic Fuels Market Forecast by Fuel Type, 2024-2034 (US$ Billion, AGR %)
Figure 103 Asia Pacific Synthetic Fuels Market Share Forecast by Fuel Type, 2024 & 2034 (%)
Figure 104 Asia Pacific Synthetic Fuels Market Forecast by End Use, 2024-2034 (US$ Billion, AGR %)
Figure 105 Asia Pacific Synthetic Fuels Market Share Forecast by End Use, 2024 & 2034 (%)
Figure 106 China Synthetic Fuels Market Forecast, 2024-2034 (US$ Billion, AGR %)
Figure 107 India Synthetic Fuels Market Forecast, 2024-2034 (US$ Billion, AGR %)
Figure 108 Japan Synthetic Fuels Market Forecast, 2024-2034 (US$ Billion, AGR %)
Figure 109 South Korea Synthetic Fuels Market Forecast, 2024-2034 (US$ Billion, AGR %)
Figure 110 Australia Synthetic Fuels Market Forecast, 2024-2034 (US$ Billion, AGR %)
Figure 111 Rest of Asia Pacific Synthetic Fuels Market Forecast, 2024-2034 (US$ Billion, AGR %)
Figure 112 Latin America Synthetic Fuels Market Attractiveness Index
Figure 113 Latin America Synthetic Fuels Market by Region, 2024, 2029 & 2034 (US$ Billion)
Figure 114 Latin America Synthetic Fuels Market Forecast by Country, 2024-2034 (US$ Billion, AGR %)
Figure 115 Latin America Synthetic Fuels Market Share Forecast by Country, 2024 & 2034 (%)
Figure 116 Latin America Synthetic Fuels Market Forecast by Feedstock, 2024-2034 (US$ Billion, AGR %)
Figure 117 Latin America Synthetic Fuels Market Share Forecast by Feedstock, 2024 & 2034 (%)
Figure 118 Latin America Synthetic Fuels Market Forecast by Application, 2024-2034 (US$ Billion, AGR %)
Figure 119 Latin America Synthetic Fuels Market Share Forecast by Application, 2024 & 2034 (%)
Figure 120 Latin America Synthetic Fuels Market Forecast by Fuel Type, 2024-2034 (US$ Billion, AGR %)
Figure 121 Latin America Synthetic Fuels Market Share Forecast by Fuel Type, 2024 & 2034 (%)
Figure 122 Latin America Synthetic Fuels Market Forecast by End Use, 2024-2034 (US$ Billion, AGR %)
Figure 123 Latin America Synthetic Fuels Market Share Forecast by End Use, 2024 & 2034 (%)
Figure 124 Brazil Synthetic Fuels Market Forecast, 2024-2034 (US$ Billion, AGR %)
Figure 125 Mexico Synthetic Fuels Market Forecast, 2024-2034 (US$ Billion, AGR %)
Figure 126 Rest of Latin America Synthetic Fuels Market Forecast, 2024-2034 (US$ Billion, AGR %)
Figure 127 Middle East & Africa Synthetic Fuels Market Attractiveness Index
Figure 128 Middle East & Africa Synthetic Fuels Market by Region, 2024, 2029 & 2034 (US$ Billion)
Figure 129 Middle East & Africa Synthetic Fuels Market Forecast by Country, 2024-2034 (US$ Billion, AGR %)
Figure 130 Middle East & Africa Synthetic Fuels Market Share Forecast by Country, 2024 & 2034 (%)
Figure 131 Middle East & Africa Synthetic Fuels Market Forecast by Feedstock, 2024-2034 (US$ Billion, AGR %)
Figure 132 Middle East & Africa Synthetic Fuels Market Share Forecast by Feedstock, 2024 & 2034 (%)
Figure 133 Middle East & Africa Synthetic Fuels Market Forecast by Application, 2024-2034 (US$ Billion, AGR %)
Figure 134 Middle East & Africa Synthetic Fuels Market Share Forecast by Application, 2024 & 2034 (%)
Figure 135 Middle East & Africa Synthetic Fuels Market Forecast by Fuel Type, 2024-2034 (US$ Billion, AGR %)
Figure 136 Middle East & Africa Synthetic Fuels Market Share Forecast by Fuel Type, 2024 & 2034 (%)
Figure 137 Middle East & Africa Synthetic Fuels Market Forecast by End Use, 2024-2034 (US$ Billion, AGR %)
Figure 138 Middle East & Africa Synthetic Fuels Market Share Forecast by End Use, 2024 & 2034 (%)
Figure 139 GCC Synthetic Fuels Market Forecast, 2024-2034 (US$ Billion, AGR %)
Figure 140 South Africa Synthetic Fuels Market Forecast, 2024-2034 (US$ Billion, AGR %)
Figure 141 Rest of Middle East & Africa Synthetic Fuels Market Forecast, 2024-2034 (US$ Billion, AGR %)
Figure 142 Shell plc: Net Revenue, 2019-2023 (US$ Million, AGR%)
Figure 143 Shell plc: Business Segment Market Shares, 2023
Figure 144 Shell plc: SWOT Analysis
Figure 145 Sasol: Net Revenue, 2019-2023 (US$ Million, AGR%)
Figure 146 Sasol: Regional Market Shares, 2023
Figure 147 Sasol: Business Segment Market Shares, 2023
Figure 148 Sasol: SWOT Analysis
Figure 149 Chevron: Net Revenue, 2019-2023 (US$ Million, AGR%)
Figure 150 Exxon Mobil Corporation: Net Revenue, 2019-2023 (US$ Million, AGR%)
Figure 151 Exxon Mobil Corporation: R&D, 2019-2023 (US$ Million, AGR%)
Figure 152 Exxon Mobil Corporation: Business Segment Market Shares, 2023
Figure 153 TotalEnergies: Net Revenue, 2019-2023 (US$ Million, AGR%)
Figure 154 TotalEnergies: R&D, 2019-2023 (US$ Million, AGR%)
Figure 155 TotalEnergies: Business Segment Market Shares, 2023
Figure 156 Neste: Net Revenue, 2019-2023 (US$ Million, AGR%)
Figure 157 Neste: Regional Market Shares, 2023
Figure 158 Neste: Business Segment Market Shares, 2023
Figure 159 Neste: SWOT Analysis
Figure 160 Linde PLC: Net Revenue, 2019-2023 (US$ Million, AGR%)
Figure 161 Linde PLC: R&D, 2019-2023 (US$ Million, AGR%)
Figure 162 Linde PLC: Regional Market Shares, 2023
Figure 163 Linde PLC: Business Segment Market Shares, 2023
Figure 164 Basin Electric Power Cooperative: Net Revenue, 2019-2023 (US$ Million, AGR%)
Figure 165 Dakota Gasification Company: Product Market Shares, 2023
Figure 166 Maire Tecnimont: Net Revenue, 2019-2023 (US$ Million, AGR%)
Figure 167 Maire Tecnimont: Regional Market Shares, 2023
Figure 168 Maire Tecnimont: Business Segment Market Shares, 2023
Figure 169 RWE: Net Revenue, 2019-2023 (US$ Million, AGR%)
Figure 170 RWE: Business Segment Market Shares, 2023
Figure 171 RWE: SWOT Analysis
Figure 172 Gevo: Net Revenue, 2018-2022 (US$ Million, AGR%)
Figure 173 Gevo: Business Segment Market Shares, 2023
Figure 174 Crop Energies AG: Net Revenue, 2018-2022 (US$ Million, AGR%)
Figure 175 Crop Energies AG: Business Segment Market Shares, 2023
ページTOPに戻る
本レポートと同じKEY WORD(fuel)の最新刊レポート
よくあるご質問
Visiongain社はどのような調査会社ですか?
英国の調査会社ヴィジョンゲイン社(Visiongain)は、通信とエネルギーのほか、自動車や化学・医薬品、金属など、広範な市場を対象に調査を行っています。自動車市場については、市場全般に関する調査のほ... もっと見る
調査レポートの納品までの日数はどの程度ですか?
在庫のあるものは速納となりますが、平均的には 3-4日と見て下さい。
但し、一部の調査レポートでは、発注を受けた段階で内容更新をして納品をする場合もあります。
発注をする前のお問合せをお願いします。
注文の手続きはどのようになっていますか?
1)お客様からの御問い合わせをいただきます。
2)見積書やサンプルの提示をいたします。
3)お客様指定、もしくは弊社の発注書をメール添付にて発送してください。
4)データリソース社からレポート発行元の調査会社へ納品手配します。
5) 調査会社からお客様へ納品されます。最近は、pdfにてのメール納品が大半です。
お支払方法の方法はどのようになっていますか?
納品と同時にデータリソース社よりお客様へ請求書(必要に応じて納品書も)を発送いたします。
お客様よりデータリソース社へ(通常は円払い)の御振り込みをお願いします。
請求書は、納品日の日付で発行しますので、翌月最終営業日までの当社指定口座への振込みをお願いします。振込み手数料は御社負担にてお願いします。
お客様の御支払い条件が60日以上の場合は御相談ください。
尚、初めてのお取引先や個人の場合、前払いをお願いすることもあります。ご了承のほど、お願いします。
データリソース社はどのような会社ですか?
当社は、世界各国の主要調査会社・レポート出版社と提携し、世界各国の市場調査レポートや技術動向レポートなどを日本国内の企業・公官庁及び教育研究機関に提供しております。
世界各国の「市場・技術・法規制などの」実情を調査・収集される時には、データリソース社にご相談ください。
お客様の御要望にあったデータや情報を抽出する為のレポート紹介や調査のアドバイスも致します。
|
|


