Power-to-X(P2X)市場レポート:2024-2034
Power-to-X (P2X) Market Report 2024-2034
レポート詳細
Power-to-X (P2X)市場レポート 2024-2034年 :本レポートは、業界とその基礎となるダイナミクスをより良く理解したいと望むならば、新たな収益ポケットを目指す大手企業にとって貴重な... もっと見る
※上記価格は部署ライセンス(Departmental licence)価格です。
その他の価格についてはデータリソースまでお問合せください。
日本語のページは自動翻訳を利用し作成しています。
実際のレポートは英文のみでご納品いたします。

|

|
サマリー
レポート詳細
Power-to-X (P2X)市場レポート 2024-2034年:本レポートは、業界とその基礎となるダイナミクスをより良く理解したいと望むならば、新たな収益ポケットを目指す大手企業にとって貴重なものとなるでしょう。異業種への進出や新規地域での既存事業の拡大を目指す企業にも有用です。
脱炭素化目標と気候変動緩和への取り組み
世界中の政府や組織は、気候変動と闘うために野心的な脱炭素化目標を掲げるようになってきている。Power-to-X(P2X)技術は、再生可能な資源からの電力を水素、合成燃料、その他の化学物質に変換する技術であり、これらの目標を達成する上で極めて重要である。各国は温室効果ガスの排出を削減するための政策や規制を制定しており、それによってP2X技術の導入に有利な環境が整いつつある。例えば、欧州連合のグリーン・ディールは、2050年までに欧州を気候ニュートラルにすることを目標としており、再生可能エネルギーとP2Xインフラへの大規模な投資を促進している。化石燃料に代わる持続可能な代替燃料を産業界が求める中、このような規制の後押しと経済的インセンティブが相まって、P2X市場を牽引している。
E燃料とE肥料に関する知識不足が市場を減速させると予想される
Power-to-X(P2X)技術の重大な市場阻害要因は、e-Fuelsとe-Fertilizersに関する知識と理解が広まっていないことである。再生可能エネルギーを使って生産される合成燃料であるe-燃料や、同様の持続可能なプロセスを経て作られるe-肥料は、広範なエネルギー・農業分野ではまだ比較的新しい概念である。この馴染みのなさは、潜在的な投資家、政策立案者、エンドユーザーなどの利害関係者の間にためらいをもたらす可能性がある。こうしたステークホルダーは、こうした先進的な製品の利点、用途、可能性を十分に理解していない可能性があり、その結果、既存のシステムへの採用や統合が遅れることになる。さらに、しっかりとした教育キャンペーンや業界への働きかけがないため、市場の成長と受容を促進するために必要な重要情報の普及が制限され、この問題を悪化させている。
市場調査レポートを購入する前にすべき質問とは?
-
Power-to-X(P2X)市場はどのように進化しているのか?
-
Power-to-X(P2X)市場の推進要因と阻害要因は何か?
-
Power-to-X(P2X)サブマーケットの各セグメントは予測期間中にどのように成長し、2034年にはどれくらいの売上を占めるようになるのか?
-
2024年から2034年にかけて、Power-to-X(P2X)サブマーケットごとの市場シェアはどのように推移するのか?
-
2024年から2034年までの市場全体の主な牽引役は何か?
-
主要なPower-to-X(P2X)市場はマクロ経済の動きに大枠で追随するのか、それとも個々の国内市場が他を凌駕するのか。
-
2034年までに各国市場のシェアはどのように変化し、2034年にはどの地域が市場をリードするのか?
-
主要プレーヤーは誰で、予測期間中の見通しは?
-
これらの大手企業のPower-to-X(P2X)プロジェクトは何か?
-
2024年から2034年の間に、産業はどのように発展するのか?現在および今後10年間に実施されるPower-to-X(P2X)プロジェクトにはどのような意味があるのか?
-
Power-to-X(P2X)市場をさらに拡大するために、製品の商業化の必要性は高まっているか?
-
Power-to-X(P2X)市場はどこに向かっているのか、また、どのようにすれば市場の最前線に立てるのか?
-
新製品やサービスラインへの最適な投資方法とは?
-
企業を新たな成長軌道に乗せ、C-suiteに移行させるための重要な展望とは?
このことが、現在、そして今後10年間のPower-to-X(P2X)市場にどのような影響を与えるかを見極める必要がある:
-
356ページに及ぶレポートには、101の表と177の図表が掲載されている。
-
本レポートでは、業界における主要な有利分野を取り上げているため、今すぐターゲットを絞ることができる。
-
世界、地域、国の売上高と成長に関する詳細な分析が含まれている。
-
競合他社が成功した主なトレンド、変化、収益予測をハイライトします。
2034年までの予測やその他の分析から、商業的な展望が明らかになる
-
2034年までの収益予測に加え、最近の実績、成長率、市場シェアも提供している。
-
ビジネスの展望や展開など、独自の分析が掲載されている。
-
定性的分析(市場ダイナミクス、促進要因、機会、阻害要因、課題を含む)、コスト構造、P2X(Power-to-X)価格上昇の影響、最近の動向をご覧ください。
レポート対象セグメント
ソース
-
再生可能エネルギー
-
従来のエネルギー源
-
ハイブリッドエネルギー源
アプリケーション
-
エネルギー貯蔵
-
グリッド安定化
-
燃料生産
-
工業プロセス
エンドユーザー
-
ユーティリティ
-
インダストリアル
-
交通
-
レジデンシャル
-
コマーシャル
技術
-
Power-to-Gas (P2G)
-
Power-to-Heat (P2H)
-
Power-to-Liquids (P2L)
-
Power-to-Chemicals (P2C)
-
Power-to-Hydrogen (P2H2)
-
その他の技術
世界市場全体と各分野の収益予測に加え、5つの地域と15の主要国市場の収益予測も掲載している:
北米
欧州
-
ドイツ
-
英国
-
フランス
-
スペイン
-
イタリア
-
その他の欧州地域
アジア太平洋
-
中国
-
日本
-
インド
-
オーストラリア
-
韓国
-
その他のアジア太平洋地域
ラテンアメリカ
MEA
また、2024年から2034年までのPower-to-X(P2X)市場の主要企業のプロファイルと、これらの企業の事業のこのセグメントに焦点を当てています。
報告書に掲載されている主要企業
-
Air Liquide SA
-
Air Products and Chemicals, Inc
-
Ceres Power Holdings plc
-
Copenhagen Infrastructure Partners
-
International Renewable Energy Agency (IRENA)
-
Linde plc
-
Mitsubishi Power, Ltd
-
ThyssenKrupp AG
-
Underground Sun Conversion
-
Weidmüller Interface GmbH & Co. KG,.
2024年から2034年までのPower-to-X(P2X)市場全体の世界売上高(金額ベース)は、2024年に3億5,600万米ドルを突破する。また、2034年まで収益が大きく伸びると予測している。当調査では、最も大きな可能性を秘めた組織を特定しています。彼らの能力、進歩、商業的展望を発見し、一歩先を行くお手伝いをします。
このレポートはPower-to-X (P2X)市場、2024-2034年について調査したものです。
要約すると、350ページを超えるこのレポートは、以下の知識を提供する:
-
Power-to-X(P2X)市場、2024年から2034年までの収益予測 世界および地域レベルでのソース、アプリケーション、エンドユーザー、テクノロジーの各予測による、Power-to-X(P2X)市場、2034年までの収益予測 - 業界の展望を発見し、投資と収益に最も有利な場所を見つけます。
-
5つの地域とxxの主要国市場の2034年までの収益予測 - Power-to-X(P2X)市場の2024年から2034年までの北米、ヨーロッパ、アジア太平洋、ラテンアメリカ、MEAの市場予測をご覧ください。また、米国、カナダ、メキシコ、ブラジル、ドイツ、フランス、英国、イタリア、中国、インド、日本、オーストラリアなどの著名経済圏の市場も予測しています。
-
2024年から2034年までのPower-to-X(P2X)市場に関わる主要企業10社の企業プロファイルを含む。
独自の予測による定量的・定性的分析をご覧ください。私たちのレポートだけに含まれる情報を入手し、貴重なビジネスインテリジェンスで情報を得ることができます。
他にはない情報
私たちの新しいレポートがあれば、知識に遅れをとったり、チャンスを逃したりする可能性が低くなります。Visiongainのレポートが貴社の調査、分析、意思決定にどのように役立つかをご覧ください。Visiongainの調査は、Power-to-X (P2X)市場、2024年から2034年、市場をリードする企業の商業分析を必要とするすべての人のためのものです。データ、トレンド、予測をご覧いただけます。
ページTOPに戻る
目次
1 レポート概要
1.1 研究の目的
1.2 Power-to-X(P2X)市場の紹介
1.3 本レポートの内容
1.4 本レポートを読むべき理由
1.5 本分析レポートが回答する主な質問
1.6 本レポートの対象者
1.7 方法論
1.7.1 市場の定義
1.7.2 市場評価・予測手法
1.8 よくある質問(FAQ)
1.8.1 データの検証
1.8.1.1 一次調査
1.8.1.2 セカンダリーリサーチ
1.9 Visiongainの関連レポート
1.10 Visiongainについて
2 エグゼクティブ・サマリー
3 市場概要
3.1 主要な調査結果
3.2 市場ダイナミクス
3.3 影響分析
3.3.1 市場促進要因
3.3.1.1 再生可能エネルギープロジェクトに対する政府の補助金、助成金、税制優遇措置がP2X技術の採用をサポート
3.3.1.2 グリーン水素とアンモニアの需要増加が市場成長を牽引
3.3.1.3 再生可能エネルギー源の重視が市場成長を牽引
3.3.2 市場阻害要因
3.3.2.1 電子燃料と電子肥料に関する知識不足が市場を減速させると予測される
3.3.2.2 P2X技術はインフラや設備に多額の先行投資を必要とすることが多い
3.3.3 市場機会
3.3.3.1 市場プレイヤー間のコラボレーションとパートナーシップが市場成長のチャンス
3.3.3.2 P2X市場成長のための事業拡大と新製品発売の機会
3.3.3.3 電池や揚水発電のような現在試験中のエネルギー貯蔵技術を凌駕するパワー・トゥ・アドバンテージが市場成長の原動力
3.4 サプライチェーン分析
3.5 規制の枠組み
3.6 新興市場とメガトレンド
3.7 ポーターのファイブフォース分析
3.7.1 サプライヤーの交渉力(低~中)
3.7.2 買い手の交渉力(中)
3.7.3 競争力(中~高)
3.7.4 代替品の脅威(中)
3.7.5 新規参入企業の脅威(高)
3.8 PEST分析
4 Power-to-X(P2X)市場分析:ソース別
4.1 主要調査結果
4.2 ソースセグメント 市場魅力度指数
4.3 電源別Power-to-X(P2X)市場規模の推定と予測
4.4 再生可能エネルギー源
4.4.1 2024〜2034年の地域別市場規模(US$ Million)
4.4.2 地域別市場シェア、2024年・2034年(%)
4.5 従来型エネルギー源
4.5.1 2024~2034年地域別市場規模(US$ Million)
4.5.2 地域別市場シェア、2024年・2034年(%)
4.6 ハイブリッドエネルギー源
4.6.1 2024~2034年の地域別市場規模(US$ Million)
4.6.2 地域別市場シェア、2024年・2034年(%)
5 Power-to-X(P2X)市場分析:アプリケーション別
5.1 主要調査結果
5.2 アプリケーションセグメント 市場魅力度指数
5.3 用途別Power-to-X(P2X)市場規模の推定と予測
5.4 エネルギー貯蔵
5.4.1 2024〜2034年の地域別市場規模(US$ Million)
5.4.2 地域別市場シェア、2024年・2034年 (%)
5.5 送電網の安定化
5.5.1 2024~2034年の地域別市場規模(US$ Million)
5.5.2 地域別市場シェア、2024年・2034年 (%)
5.6 燃料生産
5.6.1 2024年~2034年の地域別市場規模(US$ Million)
5.6.2 地域別市場シェア、2024年・2034年(%)
5.7 工業プロセス
5.7.1 2024年~2034年の地域別市場規模(US$ Million)
5.7.2 地域別市場シェア、2024年・2034年 (%)
6 Power-to-X(P2X)市場分析:エンドユーザー別
6.1 主要調査結果
6.2 エンドユーザー別セグメント 市場魅力度指数
6.3 エンドユーザー別Power-to-X(P2X)市場規模の推定と予測
6.4 ユーティリティ
6.4.1 2024〜2034年の地域別市場規模(US$ Million)
6.4.2 地域別市場シェア、2024年・2034年(%)
6.5 産業
6.5.1 2024年~2034年の地域別市場規模(US$ Million)
6.5.2 地域別市場シェア、2024年・2034年(%)
6.6 輸送
6.6.1 2024年~2034年の地域別市場規模(US$ Million)
6.6.2 地域別市場シェア、2024年・2034年(%)
6.7 住宅
6.7.1 2024〜2034年の地域別市場規模(US$ Million)
6.7.2 地域別市場シェア、2024年・2034年 (%)
6.8 業務用
6.8.1 2024~2034年地域別市場規模(US$ Million)
6.8.2 地域別市場シェア、2024年・2034年(%)
7 Power-to-X(P2X)市場分析:技術別
7.1 主要な調査結果
7.2 技術セグメント 市場魅力度指数
7.3 技術別のPower-to-X(P2X)市場規模の推定と予測
7.4 パワー・ツー・ガス(P2G)
7.4.1 2024〜2034年の地域別市場規模(US$ Million)
7.4.2 地域別市場シェア、2024年・2034年(%)
7.5 熱電併給(P2H)
7.5.1 2024~2034年の地域別市場規模(US$ Million)
7.5.2 地域別市場シェア、2024年・2034年(%)
7.6 パワー・ツー・リキッド(P2L)
7.6.1 2024~2034年の地域別市場規模(US$ Million)
7.6.2 地域別市場シェア、2024年・2034年(%)
7.7 パワー・ツー・ケミカル(P2C)
7.7.1 2024~2034年の地域別市場規模(US$ Million)
7.7.2 地域別市場シェア、2024年・2034年(%)
7.8 発電水素(P2H2)
7.8.1 2024~2034年の地域別市場規模(US$ Million)
7.8.2 地域別市場シェア、2024年・2034年(%)
7.9 その他の技術
7.9.1 2024~2034年の地域別市場規模(US$ Million)
7.9.2 地域別市場シェア、2024年・2034年(%)
8 Power-to-X(P2X)市場分析:地域別
8.1 主要な調査結果
8.2 地域別市場規模の推定と予測
9 北米のPower-to-X(P2X)市場分析
9.1 主要な調査結果
9.2 北米のPower-to-X(P2X)市場魅力度指数
9.3 北米のPower-to-X(P2X)国別市場、2024年、2029年、2034年(US$ Million)
9.4 北米のPower-to-X(P2X)市場規模推定と予測:国別
9.5 北米のPower-to-X(P2X)市場規模推定と予測:ソース別
9.6 北米のPower-to-X(P2X)市場規模推定と予測:用途別
9.7 北米のPower-to-X(P2X)市場規模推定と予測:エンドユーザー別
9.8 北米のPower-to-X(P2X)市場規模推定と予測:技術別
9.9 米国のPower-to-X(P2X)市場分析
9.10 カナダのPower-to-X(P2X)市場分析
10 欧州のPower-to-X(P2X)市場分析
10.1 主要な調査結果
10.2 欧州Power-to-X(P2X)市場魅力度指数
10.3 欧州のPower-to-X(P2X)国別市場、2024年、2029年、2034年(US$ Million)
10.4 欧州のPower-to-X(P2X)市場規模推定と予測:国別
10.5 欧州のPower-to-X(P2X)市場規模推定と予測:ソース別
10.6 欧州のPower-to-X(P2X)市場規模推定と予測:用途別
10.7 欧州のPower-to-X(P2X)市場規模推定と予測:エンドユーザー別
10.8 欧州のPower-to-X(P2X)市場規模推定と予測:技術別
10.9 ドイツのPower-to-X(P2X)市場分析
10.10 イギリスのPower-to-X(P2X)市場分析
10.11 フランスのPower-to-X(P2X)市場分析
10.12 イタリアのPower-to-X(P2X)市場分析
10.13 スペインのPower-to-X(P2X)市場分析
10.14 その他の欧州のPower-to-X(P2X)市場分析
11 アジア太平洋地域のPower-to-X(P2X)市場分析
11.1 主要な調査結果
11.2 アジア太平洋地域のPower-to-X(P2X)市場魅力度指数
11.3 アジア太平洋地域のPower-to-X(P2X)国別市場、2024年、2029年、2034年(US$ Million)
11.4 アジア太平洋地域のPower-to-X(P2X)市場規模推定と予測:国別
11.5 アジア太平洋地域のPower-to-X(P2X)市場規模推定と予測:ソース別
11.6 アジア太平洋地域のPower-to-X(P2X)市場規模推定と予測:用途別
11.7 アジア太平洋地域のPower-to-X(P2X)市場規模推定と予測:エンドユーザー別
11.8 アジア太平洋地域のPower-to-X(P2X)市場規模推定と予測:技術別
11.9 中国のPower-to-X(P2X)市場分析
11.10 インドのPower-to-X(P2X)市場分析
11.11 日本のPower-to-X(P2X)市場分析
11.12 韓国のPower-to-X (P2X)市場分析
11.13 オーストラリアのPower-to-X(P2X)市場分析
11.14 その他のアジア太平洋地域のPower-to-X (P2X)市場分析
12 中東・アフリカ Power-to-X(P2X)市場分析
12.1 主要な調査結果
12.2 中東・アフリカのPower-to-X(P2X)市場魅力度指数
12.3 中東・アフリカのPower-to-X(P2X)国別市場、2024年、2029年、2034年(US$ Million
12.4 中東・アフリカのPower-to-X(P2X)市場規模推定と予測:国別
12.5 中東・アフリカのPower-to-X(P2X)市場規模推定と予測:ソース別
12.6 中東・アフリカのPower-to-X(P2X)市場規模推定と予測:用途別
12.7 中東・アフリカのPower-to-X(P2X)市場規模推定と予測:エンドユーザー別
12.8 中東・アフリカのPower-to-X(P2X)市場規模推定と予測:技術別
12.9 GCCのPower-to-X(P2X)市場分析
12.10 南アフリカのPower-to-X (P2X)市場分析
12.11 その他の中東・アフリカ地域のPower-to-X (P2X)市場分析
13 ラテンアメリカのPower-to-X(P2X)市場分析
13.1 主要な調査結果
13.2 ラテンアメリカのPower-to-X(P2X)市場魅力度指数
13.3 ラテンアメリカのPower-to-X(P2X)国別市場、2024年、2029年、2034年(US$ Million)
13.4 ラテンアメリカのPower-to-X(P2X)市場規模推定と予測:国別
13.5 ラテンアメリカのPower-to-X(P2X)市場規模推定と予測:ソース別
13.6 ラテンアメリカのPower-to-X(P2X)市場規模推定と予測:用途別
13.7 ラテンアメリカのPower-to-X(P2X)市場規模推定と予測:エンドユーザー別
13.8 ラテンアメリカのPower-to-X(P2X)市場規模推定と予測:技術別
13.9 ブラジルのPower-to-X(P2X)市場分析
13.10 メキシコのPower-to-X(P2X)市場分析
13.11 その他のラテンアメリカのPower-to-X (P2X)市場分析
14 主要企業のプロファイル
14.1 競争環境、2023年
14.2 戦略的展望
14.3 Air Liquide SA
14.3.1 会社概要
14.3.2 会社概要
14.3.3 財務分析
14.3.3.1 純収入、2019-2023年
14.3.3.2 R&D、2019-2023年
14.3.3.3 地域別市場シェア、2023年
14.3.3.4 事業セグメント市場シェア(2023年
14.3.4 製品ベンチマーク
14.3.5 戦略的展望
14.3.6 SWOT分析
14.4 Linde plc
14.4.1 会社概要
14.4.2 会社概要
14.4.3 財務分析
14.4.3.1 純収入、2019-2023年
14.4.3.2 R&D、2019-2023年
14.4.3.3 地域別市場シェア、2023年
14.4.3.4 事業セグメント市場シェア(2023年
14.4.4 製品ベンチマーク
14.4.5 戦略的展望
14.4.6 SWOT分析
14.5 Air Products and Chemicals, Inc
14.5.1 会社概要
14.5.2 会社概要
14.5.3 財務分析
14.5.3.1 純収入、2019-2023年
14.5.3.2 売上高、2019-2023年
14.5.3.3 地域別市場シェア、2023年
14.5.3.4 事業セグメント市場シェア(2023年
14.5.4 製品ベンチマーク
14.5.5 戦略的展望
14.5.6 SWOT分析
14.6 Mitsubishi Power, Ltd
14.6.1 会社概要
14.6.2 会社概要
14.6.3 財務分析
14.6.3.1 純収入、2019-2023年
14.6.3.2 R&D、2019-2023年
14.6.3.3 地域別市場シェア、2023年
14.6.3.4 事業セグメント市場シェア(2023年
14.6.4 製品ベンチマーク
14.6.5 戦略的展望
14.6.6 SWOT分析
14.7 Ceres Power Holdings plc
14.7.1 会社概要
14.7.2 会社概要
14.7.3 財務分析
14.7.3.1 純収入、2019-2023年
14.7.3.2 R&D、2019-2023年
14.7.3.3 地域市場シェア、2023年
14.7.4 製品ベンチマーク
14.7.5 戦略的展望
14.7.6 SWOT分析
14.8 ThyssenKrupp AG
14.8.1 会社概要
14.8.2 会社概要
14.8.3 財務分析
14.8.3.1 純収入、2019-2023年
14.8.3.2 売上高、2019-2023年
14.8.3.3 地域市場シェア、2023年
14.8.3.4 事業セグメント市場シェア(2023年
14.8.4 製品ベンチマーク
14.8.5 戦略的展望
14.9 International Renewable Energy Agency (IRENA)
14.9.1 会社概要
14.9.2 会社概要
14.9.3 製品ベンチマーク
14.10 Copenhagen Infrastructure Partners
14.10.1 会社概要
14.10.2 会社概要
14.10.3 製品ベンチマーク
14.10.4 戦略的展望
14.11 Underground Sun Conversion
14.11.1 会社概要
14.11.2 会社概要
14.11.3 製品ベンチマーク
14.12 Weidmüller Interface GmbH & Co.KG、
14.12.1 会社概要
14.12.2 会社概要
14.12.3 製品ベンチマーク
15 結論と提言
15.1 Visiongainからの結びの言葉
15.2 市場プレイヤーへの提言
ページTOPに戻る
図表リスト
表の一覧
表1 Power-to-X(P2X)市場のスナップショット、2024年〜2034年(百万米ドル、CAGR %)
表2 Power-to-X(P2X)の世界電源別市場、2024年~2034年(百万米ドル、AGR(%)、CAGR(%))
表3 再生可能エネルギー源の地域別市場、2024年~2034年 (US$ Mn, AGR (%), CAGR (%))
表4 従来型エネルギー源の地域別市場:2024-2034年(100万米ドル、AGR (%)、CAGR (%)
表5 ハイブリッドエネルギー源の地域別市場、2024-2034年(100万米ドル、AGR (%)、CAGR (%)
表6 Power-to-X(P2X)の世界市場:用途別、2024-2034年(100万米ドル、AGR (%)、CAGR (%)
表7 エネルギー貯蔵の地域別市場:2024年~2034年(単位:百万米ドル、AGR (%)、CAGR (%)
表8 送電網安定化市場:地域別、2024-2034年(100万米ドル、AGR (%)、CAGR (%)
表9 燃料生産市場:地域別、2024-2034年(100万米ドル、AGR (%)、CAGR (%)
表10 産業プロセス市場:地域別、2024-2034年(100万米ドル、AGR (%)、CAGR (%)
表11 Power-to-X(P2X)の世界市場:エンドユーザー別、2024-2034年(100万米ドル、AGR (%)、CAGR (%)
表12 地域別公益事業市場、2024年~2034年(100万米ドル、AGR (%)、CAGR (%)
表13 地域別産業市場:2024-2034年(100万米ドル、AGR (%)、CAGR (%)
表14 運輸市場:地域別、2024-2034年(100万米ドル、AGR (%)、CAGR (%)
表15 地域別住宅市場、2024-2034年(100万米ドル、AGR (%)、CAGR (%)
表16 地域別商用市場、2024-2034年(100万米ドル、AGR (%)、CAGR (%)
表17 Power-to-X(P2X)の世界市場:技術別、2024-2034年(100万米ドル、AGR(%)、CAGR(%))
表18 Power-to-Gas(P2G)の地域別市場、2024-2034年(100万米ドル、AGR(%)、CAGR(%))
表19 パワー・ツー・ヒート(P2H)市場:地域別、2024-2034年(100万米ドル、AGR (%)、CAGR (%)
表20 電力液化(P2L)地域別市場、2024-2034年(100万米ドル、AGR (%)、CAGR (%)
表21 動力対化学品(P2C)地域別市場:2024-2034年(100万米ドル、AGR (%)、CAGR (%)
表22 Power-to-Hydrogen(P2H2)地域別市場:2024-2034年(100万米ドル、AGR(%)、CAGR(%))
表23 その他の技術の地域別市場、2024年~2034年 (US$ Mn, AGR (%), CAGR (%))
表24 Power-to-X(P2X)の世界地域別市場、2024-2034年(100万米ドル、AGR(%)、CAGR(%))
表25 北米のPower-to-X(P2X)国別市場:2024-2034年(100万米ドル、AGR(%)、CAGR(%))
表26 北米のPower-to-X(P2X)市場:供給源別、2024-2034年(100万米ドル、AGR (%)、CAGR (%)
表27 北米のPower-to-X(P2X)市場:用途別、2024-2034年(100万米ドル、AGR (%)、CAGR (%)
表28 北米のPower-to-X (P2X)市場:エンドユーザー別、2024-2034年 (US$ Mn, AGR (%), CAGR (%))
表29 北米のPower-to-X(P2X)市場:技術別、2024-2034年(100万米ドル、AGR (%)、CAGR (%)
表30 米国Power-to-X(P2X)市場:金額ベース、2024-2034年(100万米ドル、AGR (%)、CAGR (%)
表31 カナダのPower-to-X (P2X)市場:金額 2024-2034 (US$ Mn, AGR (%), CAGR (%))
表32 欧州のPower-to-X (P2X)市場:金額 2024-2034 (US$ Mn, AGR (%), CAGR (%))
表33 欧州のPower-to-X(P2X)国別市場:2024-2034年(100万米ドル、AGR (%)、CAGR (%)
表34 欧州のPower-to-X(P2X)供給源別市場:2024-2034年(100万米ドル、AGR (%)、CAGR (%)
表35 欧州のPower-to-X(P2X)市場:用途別(2024-2034年:100万米ドル、AGR (%)、CAGR (%)
表36 欧州のPower-to-X(P2X)市場:エンドユーザー別、2024-2034年(100万米ドル、AGR (%)、CAGR (%)
表37 欧州のPower-to-X(P2X)技術別市場:2024-2034年(100万米ドル、AGR (%)、CAGR (%)
表38 ドイツのPower-to-X(P2X)市場:金額ベース、2024-2034年(100万米ドル、AGR (%)、CAGR (%)
表 39 イギリス Power-to-X(P2X)市場:金額 2024-2034 (US$ Mn, AGR (%), CAGR (%))
表40 フランスのPower-to-X (P2X)市場:金額 2024-2034 (US$ Mn, AGR (%), CAGR (%))
表 41 イタリア Power-to-X(P2X)市場:金額 2024-2034 (US$ Mn, AGR (%), CAGR (%))
表42 スペインのPower-to-X (P2X)市場:金額 2024-2034 (US$ Mn, AGR (%), CAGR (%))
表43 その他のヨーロッパのPower-to-X (P2X)市場:金額 2024-2034 (US$ Mn, AGR (%), CAGR (%))
表44 アジア太平洋地域のP2X(Power-to-X)市場:2024-2034年(単位:百万米ドル、AGR (%)、CAGR (%)
表45 アジア太平洋地域のPower-to-X(P2X)市場:国別、2024-2034年(100万米ドル、AGR (%)、CAGR (%)
表46 アジア太平洋地域のPower-to-X(P2X)供給源別市場:2024-2034年(100万米ドル、AGR (%)、CAGR (%)
表47 アジア太平洋地域のPower-to-X(P2X)市場:用途別(2024-2034年:100万米ドル、AGR (%)、CAGR (%)
表48 アジア太平洋地域のPower-to-X(P2X)市場:エンドユーザー別、2024年~2034年(100万米ドル、AGR (%)、CAGR (%)
表49 アジア太平洋地域のPower-to-X(P2X)市場:技術別、2024-2034年(100万米ドル、AGR (%)、CAGR (%)
表50 中国Power-to-X(P2X)市場:金額ベース、2024-2034年(100万米ドル、AGR (%)、CAGR (%)
表51 インドのPower-to-X(P2X)市場:金額ベース、2024-2034年(US$ Mn、AGR (%)、CAGR (%)
表52 日本のPower-to-X (P2X)市場:金額 2024-2034 (US$ Mn, AGR (%), CAGR (%))
表 53 韓国 Power-to-X(P2X)市場:金額 2024-2034 (US$ Mn, AGR (%), CAGR (%))
表 54 オーストラリア Power-to-X(P2X)市場:金額 2024-2034 (US$ Mn, AGR (%), CAGR (%))
表55 その他のアジア太平洋地域のPower-to-X (P2X)市場:金額 2024-2034 (US$ Mn, AGR (%), CAGR (%))
表 56 中東・アフリカ Power-to-X(P2X)市場:金額 2024-2034 (US$ Mn, AGR (%), CAGR (%))
表57 中東・アフリカPower-to-X(P2X)国別市場:2024-2034年(100万米ドル、AGR (%)、CAGR (%)
表58 中東・アフリカのPower-to-X(P2X)供給源別市場:2024-2034年(100万米ドル、AGR (%)、CAGR (%)
表59 中東・アフリカPower-to-X(P2X)市場:用途別、2024-2034年(100万米ドル、AGR (%)、CAGR (%)
表60 中東・アフリカのPower-to-X (P2X)市場:エンドユーザー別、2024-2034年 (US$ Mn, AGR (%), CAGR (%))
表61 中東・アフリカのPower-to-X (P2X)市場:技術別、2024-2034年 (百万米ドル、AGR (%)、CAGR (%))
表62 GCCのPower-to-X(P2X)市場:金額ベース、2024-2034年(100万米ドル、AGR (%)、CAGR (%)
表63 南アフリカのPower-to-X (P2X)市場:金額 2024-2034 (US$ Mn, AGR (%), CAGR (%))
表64 中東・アフリカの残りの地域のPower-to-X (P2X)市場:2024-2034年(金額Mnドル、AGR (%)、CAGR (%)
表65 ラテンアメリカのPower-to-X (P2X)市場:2024-2034年(金額:100万米ドル、AGR (%)、CAGR (%)
表66 中南米のPower-to-X(P2X)国別市場:2024-2034年(100万米ドル、AGR (%)、CAGR (%)
表67 ラテンアメリカのPower-to-X(P2X)供給源別市場:2024-2034年(100万米ドル、AGR (%)、CAGR (%)
表68 ラテンアメリカのPower-to-X (P2X)市場:用途別(2024-2034年:100万米ドル、AGR (%)、CAGR (%)
表69 ラテンアメリカのPower-to-X (P2X)市場:エンドユーザー別、2024-2034年 (US$ Mn, AGR (%), CAGR (%))
表70 ラテンアメリカのPower-to-X(P2X)技術別市場:2024-2034年(100万米ドル、AGR (%)、CAGR (%)
表71 ブラジルのPower-to-X (P2X)市場:金額ベース、2024-2034年 (US$ Mn, AGR (%), CAGR (%))
表72 メキシコのP2X(Power-to-X)市場:2024-2034年(単位:百万米ドル、AGR (%)、CAGR (%)
表73 その他のラテンアメリカのPower-to-X(P2X)市場:金額:2024-2034年(US$ Mn、AGR (%)、CAGR (%)
表74 戦略的展望
表75 エア・リキードSA: 主要詳細(CEO, 本社, 売上高, 設立, 従業員数, 企業タイプ, ウェブサイト, 事業セグメント)
表 76 エア・リキードSA: 製品ベンチマーク
表77 Air Liquide SA: 戦略的展望
表78 リンデplc:主な詳細(CEO, 本社, 売上高, 設立, 従業員数, 企業タイプ, ウェブサイト, 事業セグメント)
表 79 リンデ plc:製品ベンチマーク
表 80 リンデ plc:戦略的展望
表81 エアープロダクツ・アンド・ケミカルズ社:戦略的展望主な詳細(CEO, 本社, 売上高, 設立, 従業員数, 企業タイプ, ウェブサイト, 事業セグメント)
表 82 エアープロダクツ・アンド・ケミカルズ, Inc:製品ベンチマーク
表83 エアープロダクツ・アンド・ケミカルズ, Inc:戦略的展望
表84 三菱電機: 主要企業詳細(CEO、本社、売上高、設立、従業員数、企業タイプ、ウェブサイト、事業セグメント)
表 85 三菱電機:製品ベンチマーク
表 86 三菱電機:戦略的展望
表 87 セレスパワーホールディングス plc:主な詳細(CEO, 本社, 売上高, 設立, 従業員数, 企業タイプ, ウェブサイト, 事業セグメント)
表 88 セレスパワーホールディングス plc:製品ベンチマーク
表 89 セレスパワーホールディングス plc:戦略的展望
表90 ティッセンクルップAG: 主要データ(CEO、本社、売上高、設立、従業員数、企業タイプ、ウェブサイト、事業セグメント)
表 91 ティッセンクルップ:製品ベンチマーク
表92 ティッセンクルップAG:戦略的展望
表93 国際再生可能エネルギー機関(IRENA):主な詳細(CEO, 本社, 売上高, 設立, 従業員数, 企業タイプ, ウェブサイト, 事業セグメント)
表 94 国際再生可能エネルギー機関(IRENA):製品ベンチマーク
表95 コペンハーゲン・インフラストラクチャー・パートナーズ主な詳細(CEO, 本社, 売上高, 設立, 従業員数, 企業タイプ, ウェブサイト, 事業セグメント)
表96 コペンハーゲン・インフラストラクチャー・パートナーズ製品ベンチマーク
表 97 コペンハーゲン・インフラストラクチャー・パートナーズ:戦略的展望戦略的展望
表98 アンダーグラウンド・サンコンバージョン主な詳細(CEO, 本社, 売上高, 設立, 従業員数, 企業タイプ, ウェブサイト, 事業セグメント)
表99 アンダーグラウンド・サンコンバージョン製品ベンチマーク
表100 Weidmüller Interface GmbH & Co.KG、主要詳細(CEO、本社、売上高、設立、従業員数、会社タイプ、ウェブサイト、事業セグメント)
表 101 Weidmüller Interface GmbH & Co.KG,:製品ベンチマーク
図の一覧
図1 Power-to-X(P2X)市場のセグメンテーション
図2 ソース別Power-to-X(P2X)市場:市場魅力度指数
図3 Power-to-X(P2X)市場:用途別:市場魅力度指数
図4 Power-to-X(P2X)市場:エンドユーザー別:市場魅力度指数
図5 Power-to-X(P2X)技術別市場:市場魅力度指数市場魅力度指数
図6 Power-to-X(P2X)市場:地域別市場魅力度指数
図7 Power-to-X(P2X)市場:市場ダイナミクス
図8 Power-to-X(P2X)市場:市場ダイナミクスインパクト分析
図9 2022年時点の世界のグリーン水素製造施設数(国別
図10 2019年から2022年までの世界の再生可能エネルギー容量(MW)
図 11 Power-to-X(P2X):サプライチェーン分析
図 12 Power-to-X(P2X)市場:ポーターのファイブフォース分析
図 13 Power-to-X(P2X)市場:PEST分析
図14 Power-to-X(P2X)市場:ソース別:市場魅力度指数
図15 ソース別Power-to-X(P2X)の世界市場、2024年~2034年(100万米ドル、AGR(%))
図16 2024年、2029年、2034年の電源別Power-to-X(P2X)市場シェア予測(%)
図17 再生可能エネルギー源地域別市場予測、2024年~2034年(単位:百万米ドル、AGR (%)
図 18 再生可能エネルギー源セグメントの地域別市場シェア予測、2024 年&2034 年 (%)
図 19 2024-2034 年地域別従来型エネルギー源市場 (US$ Mn, AGR (%))
図 20 2024-2034 地域別従来型エネルギー源セグメント市場シェア予測 (%)
図21 ハイブリッドエネルギー源の地域別市場予測、2024~2034年 (US$ Mn, AGR (%))
図 22 2024-2034 年地域別ハイブリッドエネルギー源市場シェア予測 (%)
図23 Power-to-X(P2X)用途別市場:市場魅力度指数
図24 2024~2034年のPower-to-X(P2X)の世界市場(用途別) (US$ Mn, AGR (%))
図25 2024年、2029年、2034年のPower-to-X(P2X)用途別市場シェア予測 (%)
図26 地域別エネルギー貯蔵市場、2024年~2034年(単位:百万米ドル、AGR (%)
図 27 地域別エネルギー貯蔵セグメント市場シェア予測、2024 年& 2034 年 (%)
図28 送電網安定化市場:地域別(2024年~2034年、100万米ドル、AGR (%)
図 29 送電網安定化セグメントの地域別市場シェア予測、2024 年~2034 年 (%)
図 30 2024-2034 地域別燃料生産市場(単位:百万米ドル、AGR (%)
図 31 燃料生産セグメントの地域別市場シェア予測、2024 年~2034 年 (%)
図32 2024~2034年の工業プロセス地域別市場(単位:百万米ドル、AGR (%)
図 33 産業プロセスセグメントの地域別市場シェア予測、2024 & 2034 (%)
図34 エンドユーザー別Power-to-X(P2X)市場:市場魅力度指数
図35 エンドユーザー別Power-to-X(P2X)の世界市場:2024年~2034年(百万米ドル、AGR (%)
図36 エンドユーザー別Power-to-X(P2X)市場シェア予測(2024年、2029年、2034年) (%)
図 37 地域別ユーティリティ市場、2024~2034年(100万米ドル、AGR (%)
図 38 地域別公益事業セグメント市場シェア予測、2024 & 2034 (%)
図 39 産業用機器市場の地域別予測(2024~2034年、100万米ドル、AGR (%)
図40 産業用機器セグメントの地域別市場シェア予測、2024年〜2034年 (%)
図 41 2024-2034 年の地域別運輸市場(単位:百万米ドル、AGR (%)
図 42 2024-2034 年地域別運輸セグメント市場シェア予測 (%)
図43 地域別住宅市場、2024年~2034年(単位:百万米ドル、AGR (%)
図44 地域別住宅用セグメント市場シェア予測、2024年&2034年 (%)
図45 2024〜2034年の地域別商業市場(単位:百万米ドル、AGR (%)
図 46 地域別商用セグメント市場シェア予測、2024年&2034年(%)
図 47 技術別 Power-to-X(P2X)市場:市場魅力度指数
図 48 技術別パワー・ツー・エックス(P2X)の世界市場:2024~2034年 (US$ Mn, AGR (%))
図 49 2024年、2029年、2034年のPower-to-X(P2X)技術別市場シェア予測 (%)
図50 Power-to-Gas(P2G)地域別市場予測、2024年~2034年(単位:百万米ドル、AGR (%)
図 51 P2G (Power-to-Gas) 地域別市場シェア予測、2024 年~2034 年 (%)
図 52 P2H (Power-to-Heat) 地域別市場予測、2024~2034 年 (US$ Mn, AGR (%))
図 53 2024-2034 年の地域別 P2H (Power-to-Heat) セグメント市場シェア予測 (%)
図 54 パワートゥリキッド(P2L)地域別市場予測、2024~2034年(単位:百万米ドル、AGR (%)
図 55 2024-2034 年地域別パワーツーリキッド(P2L)セグメント市場シェア予測 (%)
図 56 P2C(Power-to-Chemicals) 地域別市場予測、2024~2034 年 (Mn 米ドル、AGR (%)
図 57 2024-2034 年の地域別 P2C(Power to Chemicals)セグメント市場シェア予測 (%)
図 58 P2H2 (Power-to-Hydrogen) 地域別市場予測、2024~2034 年 (US$ Mn, AGR (%))
図 59 P2H2 (Power-to-Hydrogen) セグメントの地域別市場シェア予測、2024 年~2034 年 (%)
図 60 地域別その他技術市場、2024~2034 年(単位:百万米ドル、AGR (%)
図 61 2024-2034 年地域別その他技術セグメント市場シェア予測 (%)
図62 2024年および2034年のPower-to-X(P2X)地域別市場予測(売上高、CAGR)
図 63 2024年、2029年、2034年のPower-to-X(P2X)地域別市場シェア予測(%)
図64 2024年~2034年のPower-to-X(P2X)の世界地域別市場予測(百万米ドル, AGR (%),)
図 65 北米 Power-to-X(P2X)市場魅力度指数
図66 北米の地域別Power-to-X(P2X)市場(2024年、2029年、2034年)(百万米ドル
図67 北米のP2X(Power-to-X)国別市場:2024年~2034年(百万米ドル、AGR (%)
図 68 北米Power-to-X(P2X)国別市場シェア予測、2024~2034年 (%)
図69 北米のPower-to-X(P2X)供給源別市場:2024~2034年(100万米ドル、AGR (%)
図70 北米のPower-to-X(P2X)供給源別市場シェア予測、2024年〜2034年 (%)
図71 北米のPower-to-X(P2X)市場:用途別予測(2024~2034年、100万米ドル、AGR (%)
図 72 北米のPower-to-X(P2X)市場シェア(用途別):2024年~2034年予測 (%)
図73 北米のPower-to-X(P2X)市場:エンドユーザー別予測(2024~2034年、100万米ドル、AGR (%)
図74 北米のPower-to-X(P2X)市場:エンドユーザー別シェア予測、2024年〜2034年 (%)
図75 北米のPower-to-X(P2X)技術別市場予測:2024~2034年(単位:百万米ドル、AGR (%)
図 76 2024-2034 年の北米 P2X (Power-to-X) 技術別市場シェア予測 (%)
図77 米国のPower-to-X(P2X)市場:金額ベース、2024~2034年(100万米ドル、AGR (%)
図 78 カナダ Power-to-X(P2X)市場:金額(US$ Mn、AGR (%)
図 79 欧州 P2X(Power to X)市場魅力度指数
図80 欧州Power-to-X(P2X)地域別市場(2024年、2029年、2034年)(百万米ドル
図 81 欧州のPower-to-X(P2X)市場:金額ベース(2024~2034年、100万米ドル、AGR (%)
図 82 欧州 Power-to-X(P2X)国別市場:2024~2034年(100万米ドル、AGR (%)
図83 欧州Power-to-X(P2X)国別市場シェア予測、2024年~2034年 (%)
図 84 欧州 Power-to-X(P2X)供給源別市場 2024-2034 (US$ Mn, AGR (%))
図 85 欧州 P2X (Power-to-X) 供給源別市場シェア予測、2024 年~2034 年 (%)
図 86 欧州のPower-to-X(P2X)市場:用途別予測(2024~2034年、100万米ドル、AGR (%)
図 87 欧州 P2X (Power-to-X) 用途別市場シェア予測、2024~2034 年 (%)
図 88 欧州のPower-to-X(P2X)市場:エンドユーザー別予測(2024~2034年、100万米ドル、AGR (%)
図 89 欧州 Power-to-X(P2X)市場エンドユーザー別シェア予測、2024 & 2034 (%)
図90 欧州のPower-to-X(P2X)技術別市場予測:2024~2034年(単位:百万米ドル、AGR (%)
図 91 欧州 Power-to-X(P2X)技術別市場シェア予測、2024~2034 年 (%)
図 92 ドイツ Power-to-X(P2X)市場:金額ベース、2024~2034年(100万米ドル、AGR (%)
図 93 イギリス Power-to-X(P2X)市場:金額(US$ Mn、AGR (%)
図 94 フランス Power-to-X(P2X)市場:金額(US$ Mn、AGR (%)
図 95 イタリア Power-to-X(P2X)市場:金額(US$ Mn、AGR (%)
図 96 スペイン Power-to-X(P2X)市場:金額(US$ Mn、AGR (%)
図 97 その他のヨーロッパのP2X(Power-to-X)市場:金額(US$ Mn, AGR (%)
図 98 アジア太平洋地域の P2X (Power-to-X) 市場の魅力度指数
図99 アジア太平洋地域のPower-to-X(P2X)地域別市場(2024年、2029年、2034年)(百万米ドル
図100 アジア太平洋地域のPower-to-X(P2X)市場:金額ベース、2024年~2034年(百万米ドル、AGR (%)
図101 アジア太平洋地域のP2X(Power-to-X)国別市場、2024年~2034年(100万米ドル、AGR (%)
図102 アジア太平洋地域のP2X(Power-to-X)国別市場シェア予測、2024年~2034年 (%)
図103 アジア太平洋地域のPower-to-X(P2X)供給源別市場、2024年~2034年(100万米ドル、AGR (%)
図104 アジア太平洋地域のPower-to-X(P2X)供給源別市場シェア予測、2024年〜2034年 (%)
図105 アジア太平洋地域のPower-to-X(P2X)市場:用途別予測(2024~2034年、100万米ドル、AGR (%)
図106 アジア太平洋地域のPower-to-X(P2X)市場シェア(用途別)予測、2024年~2034年 (%)
図107 アジア太平洋地域のPower-to-X(P2X)市場:エンドユーザー別予測(2024~2034年、100万米ドル、AGR (%)
図108 アジア太平洋地域のPower-to-X(P2X)市場:エンドユーザー別シェア予測(2024年~2034年)
図109 アジア太平洋地域のPower-to-X(P2X)技術別市場予測:2024~2034年(単位:百万米ドル、AGR (%)
図110 アジア太平洋地域のPower-to-X(P2X)技術別市場シェア予測、2024年~2034年 (%)
図111 中国Power-to-X(P2X)市場:金額ベース、2024~2034年(100万米ドル、AGR (%)
図 112 インド Power-to-X(P2X)市場:金額(US$ Mn、AGR (%)
図 113 日本の P2X (Power-to-X) 市場の金額推移、2024~2034 年 (US$ Mn, AGR (%))
図 114 韓国 Power-to-X(P2X)市場:金額(US$ Mn、AGR (%)
図 115 オーストラリア Power-to-X(P2X)市場:金額(US$ Mn、AGR (%)
図 116 その他のアジア太平洋地域の P2X (Power-to-X) 市場:金額 2024-2034 (US$ Mn, AGR (%))
図 117 中東およびアフリカの P2X(Power-to-X) 市場魅力度指数
図 118 中東・アフリカの地域別 Power-to-X(P2X)市場(2024 年、2029 年、2034 年)(百万米ドル
図 119 中東・アフリカ Power-to-X(P2X)市場:金額(百万米ドル、AGR (%)
図 120 中東・アフリカ Power-to-X(P2X)国別市場:2024~2034年(100万米ドル、AGR (%)
図121 中東・アフリカPower-to-X(P2X)国別市場シェア予測、2024~2034年 (%)
図 122 中東・アフリカ Power-to-X(P2X)の供給源別市場予測、2024~2034年 (US$ Mn, AGR (%))
図 123 2024-2034 年における中東・アフリカPower-to-X(P2X)供給源別市場シェア予測 (%)
図 124 中東・アフリカのPower-to-X(P2X)市場:用途別予測(2024~2034年、100万米ドル、AGR (%)
図 125 中東・アフリカのPower-to-X(P2X)市場:用途別シェア予測、2024~2034年 (%)
図 126 中東・アフリカのPower-to-X (P2X)市場:エンドユーザー別、2024~2034年 (US$ Mn, AGR (%))
図 127 中東・アフリカのPower-to-X(P2X)市場:エンドユーザー別シェア予測(2024~2034年)
図128 中東・アフリカのPower-to-X(P2X)技術別市場予測:2024~2034年(単位:百万米ドル、AGR (%)
図 129 中東・アフリカの技術別 Power-to-X(P2X)市場シェア予測、2024~2034 年 (%)
図 130 GCC Power-to-X(P2X)市場:金額ベース、2024~2034年(100万米ドル、AGR (%)
図 131 南アフリカのPower-to-X(P2X)市場:金額(US$ Mn、AGR (%)
図 132 中東・アフリカの残りの Power-to-X (P2X) 市場:金額(US$ Mn, AGR (%)
図 133 ラテンアメリカのP2X(Power-to-X)市場魅力度指数
図134 中南米のPower-to-X(P2X)地域別市場(2024年、2029年、2034年)(百万米ドル
図135 ラテンアメリカのPower-to-X(P2X)市場:金額(百万米ドル、AGR (%)
図 136 ラテンアメリカのPower-to-X(P2X)国別市場:2024~2034年(100万米ドル、AGR (%)
図 137 ラテンアメリカのPower-to-X(P2X)国別市場シェア予測、2024年~2034年 (%)
図 138 ラテンアメリカのPower-to-X(P2X)供給源別市場:2024~2034年(100万米ドル、AGR (%)
図139 ラテンアメリカのPower-to-X(P2X)供給源別市場シェア予測、2024年~2034年 (%)
図140 ラテンアメリカのPower-to-X(P2X)市場:用途別予測(2024~2034年:100万ドル、AGR (%)
図141 ラテンアメリカのPower-to-X(P2X)市場シェア(用途別):2024年~2034年予測 (%)
図142 ラテンアメリカのPower-to-X(P2X)市場:エンドユーザー別予測(2024年~2034年、100万米ドル、AGR (%)
図143 ラテンアメリカのPower-to-X(P2X)市場:エンドユーザー別シェア予測、2024年〜2034年 (%)
図144 中南米のPower-to-X(P2X)技術別市場予測:2024~2034年(単位:百万米ドル、AGR (%)
図 145 ラテンアメリカのPower-to-X(P2X)技術別市場シェア予測、2024~2034年 (%)
図 146 ブラジル Power-to-X(P2X)市場:金額ベース、2024~2034年(100万米ドル、AGR (%)
図 147 メキシコ Power-to-X(P2X)市場:金額(US$ Mn、AGR (%)
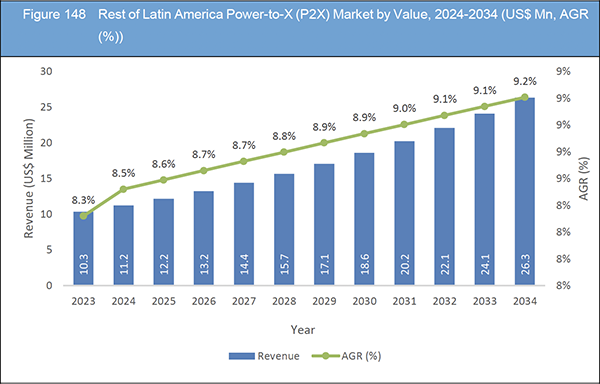
図 148 ラテンアメリカのその他の Power-to-X(P2X)市場:金額(US$ Mn, AGR (%)
図 149 Power-to-X(P2X)市場:企業シェア/ランキング(2023年
図150 エア・リキードSA:純収入、2019年-2023年(百万米ドル、AGR)
図151 エア・リキードSA: R&D、2019年-2023年 (百万米ドル、AGR%)
図152 エア・リキードSA:地域別市場シェア、2023年
図153 エア・リキードSA: 事業セグメント別市場シェア、2023年
図 154 エア・リキード SA:SWOT 分析
図 155 リンデ plc:純収入、2019年~2023年(百万米ドル、AGR)
図 156 リンデ plc:R&D、2019年~2023年(百万米ドル、AGR)
図 157 リンデ plc:地域別市場シェア(2023年
図 158 リンデ plc:事業セグメント別市場シェア、2023 年
図 159 リンデ plc:SWOT 分析
図 160 エアープロダクツ・アンド・ケミカルズ社純収入、2019-2023年(百万米ドル、AGR)
図 161 エアープロダクツ・アンド・ケミカルズ社:純収入(百万米ドル、AGRR&D, 2019-2023 (百万米ドル, AGR%)
図 162 エアープロダクツ・アンド・ケミカルズ, Inc:地域別市場シェア、2023 年
図 163 エアープロダクツ・アンド・ケミカルズ社:事業セグメント別市場シェア、2023 年事業セグメント別市場シェア、2023 年
図 164 エアープロダクツ・アンド・ケミカルズ, Inc:SWOT 分析
図 165 三菱電機:純収入、2019 年~2023 年(百万米ドル、AGR)
図 166 三菱電機:R&D、2019-2023 年(百万米ドル、AGR)
図 167 三菱電機:地域別市場シェア、2023 年
図 168 三菱電機: 事業セグメント別市場シェア(2023 年)
図 169 三菱電機:SWOT 分析
図 170 Ceres Power Holdings plc:純収入、2019 年~2023 年(百万米ドル、AGR)
図 171 Ceres Power Holdings plc:R&D, 2019-2023 (百万米ドル, AGR%)
図 172 Ceres Power Holdings plc:地域別市場シェア(2023 年
図 173 Ceres Power Holdings plc:SWOT 分析
図 174 ティッセンクルップ AG:純収入、2019~2023 年(百万米ドル、AGR)
図 175 ティッセンクルップ AG:研究開発費(百万米ドル、AGR)
図 176 ティッセンクルップ AG:地域別市場シェア(2023 年
図 177 ティッセンクルップ AG:事業セグメント別市場シェア(2023 年
ページTOPに戻る
Summary
Report Details
The Power-to-X (P2X) Market Report 2024-2034: This report will prove invaluable to leading firms striving for new revenue pockets if they wish to better understand the industry and its underlying dynamics. It will be useful for companies that would like to expand into different industries or to expand their existing operations in a new region.
Decarbonisation Goals and Climate Change Mitigation Efforts
Governments and organisations worldwide are increasingly committing to ambitious decarbonisation goals to combat climate change. Power-to-X (P2X) technologies, which convert electricity from renewable sources into hydrogen, synthetic fuels, and other chemicals, are crucial in achieving these targets. Countries are enacting policies and regulations to reduce greenhouse gas emissions, thereby creating a conducive environment for P2X technology adoption. For instance, the European Union’s Green Deal aims to make Europe climate-neutral by 2050, fostering significant investments in renewable energy and P2X infrastructure. This regulatory push, coupled with financial incentives, is driving the P2X market as industries seek sustainable alternatives to fossil fuels.
Lack of Knowledge About E-Fuels and E-Fertilizers is Anticipated to Slow Down the Market
A significant market restraining factor for Power-to-X (P2X) technologies is the lack of widespread knowledge and understanding of e-fuels and e-fertilizers. E-fuels, which are synthetic fuels produced using renewable energy, and e-fertilizers, created through similar sustainable processes, are still relatively new concepts in the broader energy and agricultural sectors. This unfamiliarity can result in hesitancy among stakeholders, including potential investors, policymakers, and end-users. They may not fully grasp the benefits, applications, and potential of these advanced products, which slows adoption and integration into existing systems. Moreover, the absence of robust educational campaigns and industry outreach exacerbates this issue, as it limits the dissemination of critical information needed to drive market growth and acceptance.
What Questions Should You Ask before Buying a Market Research Report?
-
How is the power-to-x (P2X) market evolving?
-
What is driving and restraining the power-to-x (P2X) market?
-
How will each power-to-x (P2X) submarket segment grow over the forecast period and how much revenue will these submarkets account for in 2034?
-
How will the market shares for each power-to-x (P2X) submarket develop from 2024 to 2034?
-
What will be the main driver for the overall market from 2024 to 2034?
-
Will leading power-to-x (P2X) markets broadly follow the macroeconomic dynamics, or will individual national markets outperform others?
-
How will the market shares of the national markets change by 2034 and which geographical region will lead the market in 2034?
-
Who are the leading players and what are their prospects over the forecast period?
-
What are the power-to-x (P2X) projects for these leading companies?
-
How will the industry evolve during the period between 2024 and 2034? What are the implications of power-to-x (P2X) projects taking place now and over the next 10 years?
-
Is there a greater need for product commercialisation to further scale the power-to-x (P2X) market?
-
Where is the power-to-x (P2X) market heading and how can you ensure you are at the forefront of the market?
-
What are the best investment options for new product and service lines?
-
What are the key prospects for moving companies into a new growth path and C-suite?
You need to discover how this will impact the power-to-x (P2X) market today, and over the next 10 years:
-
Our 356-page report provides 101 tables and 177 charts/graphs exclusively to you.
-
The report highlights key lucrative areas in the industry so you can target them – NOW.
-
It contains in-depth analysis of global, regional and national sales and growth.
-
It highlights for you the key successful trends, changes and revenue projections made by your competitors.
Forecasts to 2034 and other analyses reveal commercial prospects
-
In addition to revenue forecasting to 2034, our new study provides you with recent results, growth rates, and market shares.
-
You will find original analyses, with business outlooks and developments.
-
Discover qualitative analyses (including market dynamics, drivers, opportunities, restraints and challenges), cost structure, impact of rising power-to-x (P2X) prices and recent developments.
Segments Covered in the Report
Source
-
Renewable Energy Sources
-
Conventional Energy Sources
-
Hybrid Energy Sources
Application
-
Energy Storage
-
Grid Stabilization
-
Fuel Production
-
Industrial Processes
End-User
-
Utilities
-
Industrial
-
Transportation
-
Residential
-
Commercial
Technology
-
Power-to-Gas (P2G)
-
Power-to-Heat (P2H)
-
Power-to-Liquids (P2L)
-
Power-to-Chemicals (P2C)
-
Power-to-Hydrogen (P2H2)
-
Other Technologies
In addition to the revenue predictions for the overall world market and segments, you will also find revenue forecasts for five regional and 15 leading national markets:
North America
Europe
-
Germany
-
UK
-
France
-
Spain
-
Italy
-
Rest of Europe
Asia Pacific
-
China
-
Japan
-
India
-
Australia
-
South Korea
-
Rest of Asia Pacific
Latin America
-
Brazil
-
Mexico
-
Rest of Latin America
MEA
-
GCC
-
South Africa
-
Rest of MEA
The report also includes profiles and for some of the leading companies in the Power-to-X (P2X) Market, 2024 to 2034, with a focus on this segment of these companies’ operations.
Leading companies profiled in the report
-
Air Liquide SA
-
Air Products and Chemicals, Inc
-
Ceres Power Holdings plc
-
Copenhagen Infrastructure Partners
-
International Renewable Energy Agency (IRENA)
-
Linde plc
-
Mitsubishi Power, Ltd
-
ThyssenKrupp AG
-
Underground Sun Conversion
-
Weidmüller Interface GmbH & Co. KG,.
Overall world revenue for Power-to-X (P2X) Market, 2024 to 2034 in terms of value the market will surpass US$356.0 million in 2024, our work calculates. We predict strong revenue growth through to 2034. Our work identifies which organizations hold the greatest potential. Discover their capabilities, progress, and commercial prospects, helping you stay ahead.
How will the Power-to-X (P2X) Market, 2024 to 2034 report help you?
In summary, our 350+ page report provides you with the following knowledge:
-
Revenue forecasts to 2034 for Power-to-X (P2X) Market, 2024 to 2034 Market, with forecasts for source, application, end-user, and technology, each forecast at a global and regional level – discover the industry’s prospects, finding the most lucrative places for investments and revenues.
-
Revenue forecasts to 2034 for five regional and xx key national markets – See forecasts for the Power-to-X (P2X) Market, 2024 to 2034 market in North America, Europe, Asia-Pacific, Latin America, and MEA. Also forecasted is the market in the US, Canada, Mexico, Brazil, Germany, France, UK, Italy, China, India, Japan, and Australia among other prominent economies.
-
Prospects for established firms and those seeking to enter the market – including company profiles for 10 of the major companies involved in the Power-to-X (P2X) Market, 2024 to 2034.
Find quantitative and qualitative analyses with independent predictions. Receive information that only our report contains, staying informed with invaluable business intelligence.
Information found nowhere else
With our new report, you are less likely to fall behind in knowledge or miss out on opportunities. See how our work could benefit your research, analyses, and decisions. Visiongain’s study is for everybody needing commercial analyses for the Power-to-X (P2X) Market, 2024 to 2034, market-leading companies. You will find data, trends and predictions.
ページTOPに戻る
Table of Contents
1 Report Overview
1.1 Objectives of the Study
1.2 Introduction to Power-to-X (P2X) Market
1.3 What This Report Delivers
1.4 Why You Should Read This Report
1.5 Key Questions Answered by This Analytical Report
1.6 Who is This Report for?
1.7 Methodology
1.7.1 Market Definitions
1.7.2 Market Evaluation & Forecasting Methodology
1.8 Frequently Asked Questions (FAQs)
1.8.1 Data Validation
1.8.1.1 Primary Research
1.8.1.2 Secondary Research
1.9 Associated Visiongain Reports
1.10 About Visiongain
2 Executive Summary
3 Market Overview
3.1 Key Findings
3.2 Market Dynamics
3.3 Impact Analysis
3.3.1 Market Driving Factors
3.3.1.1 Government Subsidies, Grants, and Tax Incentives for Renewable Energy Projects Support the Adoption of P2X Technologies
3.3.1.2 Increasing Demand of Green Hydrogen and Ammonia Driving the Market Growth
3.3.1.3 Emphasis on Renewable Energy Sources Driving the Market Growth
3.3.2 Market Restraining Factors
3.3.2.1 Lack of Knowledge About E-Fuels and E-Fertilizers is Anticipated to Slow Down the Market
3.3.2.2 P2X Technologies Often Require Significant Upfront Investment in Infrastructure and Equipment
3.3.3 Market Opportunities
3.3.3.1 Collaboration and Partnership Between Market Players Opportunities for the Market Growth
3.3.3.2 Expansion and New Product Launch Opportunities for the P2X Market Growth
3.3.3.3 Power-to-Advantages x's Over Currently Being Tested Energy Storage Technologies like Batteries and Pumped Hydro Driving the Market Growth
3.4 Supply Chain Analysis
3.5 Regulatory Framework
3.6 Emerging Markets and Megatrends
3.7 Porter’s Five Forces Analysis
3.7.1 Bargaining Power of Suppliers (Low to Medium)
3.7.2 Bargaining Power of Buyers (Medium)
3.7.3 Competitive Rivalry (Medium to High)
3.7.4 Threat of Substitutes (Medium)
3.7.5 Threat of New Entrants (High)
3.8 PEST Analysis
4 Power-to-X (P2X) Market Analysis by Source
4.1 Key Findings
4.2 Source Segment: Market Attractiveness Index
4.3 Power-to-X (P2X) Market Size Estimation and Forecast by Source
4.4 Renewable Energy Sources
4.4.1 Market Size by Region, 2024-2034 (US$ Million)
4.4.2 Market Share by Region, 2024 & 2034 (%)
4.5 Conventional Energy Sources
4.5.1 Market Size by Region, 2024-2034 (US$ Million)
4.5.2 Market Share by Region, 2024 & 2034 (%)
4.6 Hybrid Energy Sources
4.6.1 Market Size by Region, 2024-2034 (US$ Million)
4.6.2 Market Share by Region, 2024 & 2034 (%)
5 Power-to-X (P2X) Market Analysis by Application
5.1 Key Findings
5.2 Application Segment: Market Attractiveness Index
5.3 Power-to-X (P2X) Market Size Estimation and Forecast by Application
5.4 Energy Storage
5.4.1 Market Size by Region, 2024-2034 (US$ Million)
5.4.2 Market Share by Region, 2024 & 2034 (%)
5.5 Grid Stabilization
5.5.1 Market Size by Region, 2024-2034 (US$ Million)
5.5.2 Market Share by Region, 2024 & 2034 (%)
5.6 Fuel Production
5.6.1 Market Size by Region, 2024-2034 (US$ Million)
5.6.2 Market Share by Region, 2024 & 2034 (%)
5.7 Industrial Processes
5.7.1 Market Size by Region, 2024-2034 (US$ Million)
5.7.2 Market Share by Region, 2024 & 2034 (%)
6 Power-to-X (P2X) Market Analysis by End-User
6.1 Key Findings
6.2 End-User Segment: Market Attractiveness Index
6.3 Power-to-X (P2X) Market Size Estimation and Forecast by End-User
6.4 Utilities
6.4.1 Market Size by Region, 2024-2034 (US$ Million)
6.4.2 Market Share by Region, 2024 & 2034 (%)
6.5 Industrial
6.5.1 Market Size by Region, 2024-2034 (US$ Million)
6.5.2 Market Share by Region, 2024 & 2034 (%)
6.6 Transportation
6.6.1 Market Size by Region, 2024-2034 (US$ Million)
6.6.2 Market Share by Region, 2024 & 2034 (%)
6.7 Residential
6.7.1 Market Size by Region, 2024-2034 (US$ Million)
6.7.2 Market Share by Region, 2024 & 2034 (%)
6.8 Commercial
6.8.1 Market Size by Region, 2024-2034 (US$ Million)
6.8.2 Market Share by Region, 2024 & 2034 (%)
7 Power-to-X (P2X) Market Analysis by Technology
7.1 Key Findings
7.2 Technology Segment: Market Attractiveness Index
7.3 Power-to-X (P2X) Market Size Estimation and Forecast by Technology
7.4 Power-to-Gas (P2G)
7.4.1 Market Size by Region, 2024-2034 (US$ Million)
7.4.2 Market Share by Region, 2024 & 2034 (%)
7.5 Power-to-Heat (P2H)
7.5.1 Market Size by Region, 2024-2034 (US$ Million)
7.5.2 Market Share by Region, 2024 & 2034 (%)
7.6 Power-to-Liquids (P2L)
7.6.1 Market Size by Region, 2024-2034 (US$ Million)
7.6.2 Market Share by Region, 2024 & 2034 (%)
7.7 Power-to-Chemicals (P2C)
7.7.1 Market Size by Region, 2024-2034 (US$ Million)
7.7.2 Market Share by Region, 2024 & 2034 (%)
7.8 Power-to-Hydrogen (P2H2)
7.8.1 Market Size by Region, 2024-2034 (US$ Million)
7.8.2 Market Share by Region, 2024 & 2034 (%)
7.9 Other Technologies
7.9.1 Market Size by Region, 2024-2034 (US$ Million)
7.9.2 Market Share by Region, 2024 & 2034 (%)
8 Power-to-X (P2X) Market Analysis by Region
8.1 Key Findings
8.2 Regional Market Size Estimation and Forecast
9 North America Power-to-X (P2X) Market Analysis
9.1 Key Findings
9.2 North America Power-to-X (P2X) Market Attractiveness Index
9.3 North America Power-to-X (P2X) Market by Country, 2024, 2029 & 2034 (US$ Million)
9.4 North America Power-to-X (P2X) Market Size Estimation and Forecast by Country
9.5 North America Power-to-X (P2X) Market Size Estimation and Forecast by Source
9.6 North America Power-to-X (P2X) Market Size Estimation and Forecast by Application
9.7 North America Power-to-X (P2X) Market Size Estimation and Forecast by End-User
9.8 North America Power-to-X (P2X) Market Size Estimation and Forecast by Technology
9.9 U.S. Power-to-X (P2X) Market Analysis
9.10 Canada Power-to-X (P2X) Market Analysis
10 Europe Power-to-X (P2X) Market Analysis
10.1 Key Findings
10.2 Europe Power-to-X (P2X) Market Attractiveness Index
10.3 Europe Power-to-X (P2X) Market by Country, 2024, 2029 & 2034 (US$ Million)
10.4 Europe Power-to-X (P2X) Market Size Estimation and Forecast by Country
10.5 Europe Power-to-X (P2X) Market Size Estimation and Forecast by Source
10.6 Europe Power-to-X (P2X) Market Size Estimation and Forecast by Application
10.7 Europe Power-to-X (P2X) Market Size Estimation and Forecast by End-User
10.8 Europe Power-to-X (P2X) Market Size Estimation and Forecast by Technology
10.9 Germany Power-to-X (P2X) Market Analysis
10.10 UK Power-to-X (P2X) Market Analysis
10.11 France Power-to-X (P2X) Market Analysis
10.12 Italy Power-to-X (P2X) Market Analysis
10.13 Spain Power-to-X (P2X) Market Analysis
10.14 Rest of Europe Power-to-X (P2X) Market Analysis
11 Asia-Pacific Power-to-X (P2X) Market Analysis
11.1 Key Findings
11.2 Asia-Pacific Power-to-X (P2X) Market Attractiveness Index
11.3 Asia-Pacific Power-to-X (P2X) Market by Country, 2024, 2029 & 2034 (US$ Million)
11.4 Asia-Pacific Power-to-X (P2X) Market Size Estimation and Forecast by Country
11.5 Asia-Pacific Power-to-X (P2X) Market Size Estimation and Forecast by Source
11.6 Asia-Pacific Power-to-X (P2X) Market Size Estimation and Forecast by Application
11.7 Asia-Pacific Power-to-X (P2X) Market Size Estimation and Forecast by End-User
11.8 Asia-Pacific Power-to-X (P2X) Market Size Estimation and Forecast by Technology
11.9 China Power-to-X (P2X) Market Analysis
11.10 India Power-to-X (P2X) Market Analysis
11.11 Japan Power-to-X (P2X) Market Analysis
11.12 South Korea Power-to-X (P2X) Market Analysis
11.13 Australia Power-to-X (P2X) Market Analysis
11.14 Rest of Asia-Pacific Power-to-X (P2X) Market Analysis
12 Middle East and Africa Power-to-X (P2X) Market Analysis
12.1 Key Findings
12.2 Middle East and Africa Power-to-X (P2X) Market Attractiveness Index
12.3 Middle East and Africa Power-to-X (P2X) Market by Country, 2024, 2029 & 2034 (US$ Million)
12.4 Middle East and Africa Power-to-X (P2X) Market Size Estimation and Forecast by Country
12.5 Middle East and Africa Power-to-X (P2X) Market Size Estimation and Forecast by Source
12.6 Middle East and Africa Power-to-X (P2X) Market Size Estimation and Forecast by Application
12.7 Middle East and Africa Power-to-X (P2X) Market Size Estimation and Forecast by End-User
12.8 Middle East and Africa Power-to-X (P2X) Market Size Estimation and Forecast by Technology
12.9 GCC Power-to-X (P2X) Market Analysis
12.10 South Africa Power-to-X (P2X) Market Analysis
12.11 Rest of Middle East and Africa Power-to-X (P2X) Market Analysis
13 Latin America Power-to-X (P2X) Market Analysis
13.1 Key Findings
13.2 Latin America Power-to-X (P2X) Market Attractiveness Index
13.3 Latin America Power-to-X (P2X) Market by Country, 2024, 2029 & 2034 (US$ Million)
13.4 Latin America Power-to-X (P2X) Market Size Estimation and Forecast by Country
13.5 Latin America Power-to-X (P2X) Market Size Estimation and Forecast by Source
13.6 Latin America Power-to-X (P2X) Market Size Estimation and Forecast by Application
13.7 Latin America Power-to-X (P2X) Market Size Estimation and Forecast by End-User
13.8 Latin America Power-to-X (P2X) Market Size Estimation and Forecast by Technology
13.9 Brazil Power-to-X (P2X) Market Analysis
13.10 Mexico Power-to-X (P2X) Market Analysis
13.11 Rest of Latin America Power-to-X (P2X) Market Analysis
14 Company Profiles
14.1 Competitive Landscape, 2023
14.2 Strategic Outlook
14.3 Air Liquide SA
14.3.1 Company Snapshot
14.3.2 Company Overview
14.3.3 Financial Analysis
14.3.3.1 Net Revenue, 2019-2023
14.3.3.2 R&D, 2019-2023
14.3.3.3 Regional Market Shares, 2023
14.3.3.4 Business Segment Market Shares, 2023
14.3.4 Product Benchmarking
14.3.5 Strategic Outlook
14.3.6 SWOT Analysis
14.4 Linde plc
14.4.1 Company Snapshot
14.4.2 Company Overview
14.4.3 Financial Analysis
14.4.3.1 Net Revenue, 2019-2023
14.4.3.2 R&D, 2019-2023
14.4.3.3 Regional Market Shares, 2023
14.4.3.4 Business Segment Market Shares, 2023
14.4.4 Product Benchmarking
14.4.5 Strategic Outlook
14.4.6 SWOT Analysis
14.5 Air Products and Chemicals, Inc
14.5.1 Company Snapshot
14.5.2 Company Overview
14.5.3 Financial Analysis
14.5.3.1 Net Revenue, 2019-2023
14.5.3.2 R&D, 2019-2023
14.5.3.3 Regional Market Shares, 2023
14.5.3.4 Business Segment Market Shares, 2023
14.5.4 Product Benchmarking
14.5.5 Strategic Outlook
14.5.6 SWOT Analysis
14.6 Mitsubishi Power, Ltd
14.6.1 Company Snapshot
14.6.2 Company Overview
14.6.3 Financial Analysis
14.6.3.1 Net Revenue, 2019-2023
14.6.3.2 R&D, 2019-2023
14.6.3.3 Regional Market Shares, 2023
14.6.3.4 Business Segment Market Shares, 2023
14.6.4 Product Benchmarking
14.6.5 Strategic Outlook
14.6.6 SWOT Analysis
14.7 Ceres Power Holdings plc
14.7.1 Company Snapshot
14.7.2 Company Overview
14.7.3 Financial Analysis
14.7.3.1 Net Revenue, 2019-2023
14.7.3.2 R&D, 2019-2023
14.7.3.3 Regional Market Shares, 2023
14.7.4 Product Benchmarking
14.7.5 Strategic Outlook
14.7.6 SWOT Analysis
14.8 ThyssenKrupp AG
14.8.1 Company Snapshot
14.8.2 Company Overview
14.8.3 Financial Analysis
14.8.3.1 Net Revenue, 2019-2023
14.8.3.2 R&D, 2019-2023
14.8.3.3 Regional Market Shares, 2023
14.8.3.4 Business Segment Market Shares, 2023
14.8.4 Product Benchmarking
14.8.5 Strategic Outlook
14.9 International Renewable Energy Agency (IRENA)
14.9.1 Company Snapshot
14.9.2 Company Overview
14.9.3 Product Benchmarking
14.10 Copenhagen Infrastructure Partners
14.10.1 Company Snapshot
14.10.2 Company Overview
14.10.3 Product Benchmarking
14.10.4 Strategic Outlook
14.11 Underground Sun Conversion
14.11.1 Company Snapshot
14.11.2 Company Overview
14.11.3 Product Benchmarking
14.12 Weidmüller Interface GmbH & Co. KG,
14.12.1 Company Snapshot
14.12.2 Company Overview
14.12.3 Product Benchmarking
15 Conclusion and Recommendations
15.1 Concluding Remarks from Visiongain
15.2 Recommendations for Market Players
ページTOPに戻る
List of Tables/Graphs
List of Tables
Table 1 Power-to-X (P2X) Market Snapshot, 2024 & 2034 (US$ Million, CAGR %)
Table 2 Global Power-to-X (P2X) Market by Source, 2024-2034 (US$ Mn, AGR (%), CAGR (%))
Table 3 Renewable Energy Sources Market by Region, 2024-2034 (US$ Mn, AGR (%), CAGR (%))
Table 4 Conventional Energy Sources Market by Region, 2024-2034 (US$ Mn, AGR (%), CAGR (%))
Table 5 Hybrid Energy Sources Market by Region, 2024-2034 (US$ Mn, AGR (%), CAGR (%))
Table 6 Global Power-to-X (P2X) Market by Application, 2024-2034 (US$ Mn, AGR (%), CAGR (%))
Table 7 Energy Storage Market by Region, 2024-2034 (US$ Mn, AGR (%), CAGR (%))
Table 8 Grid Stabilization Market by Region, 2024-2034 (US$ Mn, AGR (%), CAGR (%))
Table 9 Fuel Production Market by Region, 2024-2034 (US$ Mn, AGR (%), CAGR (%))
Table 10 Industrial Processes Market by Region, 2024-2034 (US$ Mn, AGR (%), CAGR (%))
Table 11 Global Power-to-X (P2X) Market by End-User, 2024-2034 (US$ Mn, AGR (%), CAGR (%))
Table 12 Utilities Market by Region, 2024-2034 (US$ Mn, AGR (%), CAGR (%))
Table 13 Industrial Market by Region, 2024-2034 (US$ Mn, AGR (%), CAGR (%))
Table 14 Transportation Market by Region, 2024-2034 (US$ Mn, AGR (%), CAGR (%))
Table 15 Residential Market by Region, 2024-2034 (US$ Mn, AGR (%), CAGR (%))
Table 16 Commercial Market by Region, 2024-2034 (US$ Mn, AGR (%), CAGR (%))
Table 17 Global Power-to-X (P2X) Market by Technology, 2024-2034 (US$ Mn, AGR (%), CAGR (%))
Table 18 Power-to-Gas (P2G) Market by Region, 2024-2034 (US$ Mn, AGR (%), CAGR (%))
Table 19 Power-to-Heat (P2H) Market by Region, 2024-2034 (US$ Mn, AGR (%), CAGR (%))
Table 20 Power-to-Liquids (P2L) Market by Region, 2024-2034 (US$ Mn, AGR (%), CAGR (%))
Table 21 Power-to-Chemicals (P2C) Market by Region, 2024-2034 (US$ Mn, AGR (%), CAGR (%))
Table 22 Power-to-Hydrogen (P2H2) Market by Region, 2024-2034 (US$ Mn, AGR (%), CAGR (%))
Table 23 Other Technologies Market by Region, 2024-2034 (US$ Mn, AGR (%), CAGR (%))
Table 24 Global Power-to-X (P2X) Market by Region, 2024-2034 (US$ Mn, AGR (%), CAGR (%))
Table 25 North America Power-to-X (P2X) Market by Country, 2024-2034 (US$ Mn, AGR (%), CAGR (%))
Table 26 North America Power-to-X (P2X) Market by Source, 2024-2034 (US$ Mn, AGR (%), CAGR (%))
Table 27 North America Power-to-X (P2X) Market by Application, 2024-2034 (US$ Mn, AGR (%), CAGR (%))
Table 28 North America Power-to-X (P2X) Market by End-User, 2024-2034 (US$ Mn, AGR (%), CAGR (%))
Table 29 North America Power-to-X (P2X) Market by Technology, 2024-2034 (US$ Mn, AGR (%), CAGR (%))
Table 30 US Power-to-X (P2X) Market by Value, 2024-2034 (US$ Mn, AGR (%), CAGR (%))
Table 31 Canada Power-to-X (P2X) Market by Value, 2024-2034 (US$ Mn, AGR (%), CAGR (%))
Table 32 Europe Power-to-X (P2X) Market by Value, 2024-2034 (US$ Mn, AGR (%), CAGR (%))
Table 33 Europe Power-to-X (P2X) Market by Country, 2024-2034 (US$ Mn, AGR (%), CAGR (%))
Table 34 Europe Power-to-X (P2X) Market by Source, 2024-2034 (US$ Mn, AGR (%), CAGR (%))
Table 35 Europe Power-to-X (P2X) Market by Application, 2024-2034 (US$ Mn, AGR (%), CAGR (%))
Table 36 Europe Power-to-X (P2X) Market by End-User, 2024-2034 (US$ Mn, AGR (%), CAGR (%))
Table 37 Europe Power-to-X (P2X) Market by Technology, 2024-2034 (US$ Mn, AGR (%), CAGR (%))
Table 38 Germany Power-to-X (P2X) Market by Value, 2024-2034 (US$ Mn, AGR (%), CAGR (%))
Table 39 UK Power-to-X (P2X) Market by Value, 2024-2034 (US$ Mn, AGR (%), CAGR (%))
Table 40 France Power-to-X (P2X) Market by Value, 2024-2034 (US$ Mn, AGR (%), CAGR (%))
Table 41 Italy Power-to-X (P2X) Market by Value, 2024-2034 (US$ Mn, AGR (%), CAGR (%))
Table 42 Spain Power-to-X (P2X) Market by Value, 2024-2034 (US$ Mn, AGR (%), CAGR (%))
Table 43 Rest of Europe Power-to-X (P2X) Market by Value, 2024-2034 (US$ Mn, AGR (%), CAGR (%))
Table 44 Asia-Pacific Power-to-X (P2X) Market by Value, 2024-2034 (US$ Mn, AGR (%), CAGR (%))
Table 45 Asia-Pacific Power-to-X (P2X) Market by Country, 2024-2034 (US$ Mn, AGR (%), CAGR (%))
Table 46 Asia-Pacific Power-to-X (P2X) Market by Source, 2024-2034 (US$ Mn, AGR (%), CAGR (%))
Table 47 Asia-Pacific Power-to-X (P2X) Market by Application, 2024-2034 (US$ Mn, AGR (%), CAGR (%))
Table 48 Asia-Pacific Power-to-X (P2X) Market by End-User, 2024-2034 (US$ Mn, AGR (%), CAGR (%))
Table 49 Asia-Pacific Power-to-X (P2X) Market by Technology, 2024-2034 (US$ Mn, AGR (%), CAGR (%))
Table 50 China Power-to-X (P2X) Market by Value, 2024-2034 (US$ Mn, AGR (%), CAGR (%))
Table 51 India Power-to-X (P2X) Market by Value, 2024-2034 (US$ Mn, AGR (%), CAGR (%))
Table 52 Japan Power-to-X (P2X) Market by Value, 2024-2034 (US$ Mn, AGR (%), CAGR (%))
Table 53 South Korea Power-to-X (P2X) Market by Value, 2024-2034 (US$ Mn, AGR (%), CAGR (%))
Table 54 Australia Power-to-X (P2X) Market by Value, 2024-2034 (US$ Mn, AGR (%), CAGR (%))
Table 55 Rest of Asia-Pacific Power-to-X (P2X) Market by Value, 2024-2034 (US$ Mn, AGR (%), CAGR (%))
Table 56 Middle East & Africa Power-to-X (P2X) Market by Value, 2024-2034 (US$ Mn, AGR (%), CAGR (%))
Table 57 Middle East & Africa Power-to-X (P2X) Market by Country, 2024-2034 (US$ Mn, AGR (%), CAGR (%))
Table 58 Middle East & Africa Power-to-X (P2X) Market by Source, 2024-2034 (US$ Mn, AGR (%), CAGR (%))
Table 59 Middle East & Africa Power-to-X (P2X) Market by Application, 2024-2034 (US$ Mn, AGR (%), CAGR (%))
Table 60 Middle East & Africa Power-to-X (P2X) Market by End-User, 2024-2034 (US$ Mn, AGR (%), CAGR (%))
Table 61 Middle East & Africa Power-to-X (P2X) Market by Technology, 2024-2034 (US$ Mn, AGR (%), CAGR (%))
Table 62 GCC Power-to-X (P2X) Market by Value, 2024-2034 (US$ Mn, AGR (%), CAGR (%))
Table 63 South Africa Power-to-X (P2X) Market by Value, 2024-2034 (US$ Mn, AGR (%), CAGR (%))
Table 64 Rest of Middle East & Africa Power-to-X (P2X) Market by Value, 2024-2034 (US$ Mn, AGR (%), CAGR (%))
Table 65 Latin America Power-to-X (P2X) Market by Value, 2024-2034 (US$ Mn, AGR (%), CAGR (%))
Table 66 Latin America Power-to-X (P2X) Market by Country, 2024-2034 (US$ Mn, AGR (%), CAGR (%))
Table 67 Latin America Power-to-X (P2X) Market by Source, 2024-2034 (US$ Mn, AGR (%), CAGR (%))
Table 68 Latin America Power-to-X (P2X) Market by Application, 2024-2034 (US$ Mn, AGR (%), CAGR (%))
Table 69 Latin America Power-to-X (P2X) Market by End-User, 2024-2034 (US$ Mn, AGR (%), CAGR (%))
Table 70 Latin America Power-to-X (P2X) Market by Technology, 2024-2034 (US$ Mn, AGR (%), CAGR (%))
Table 71 Brazil Power-to-X (P2X) Market by Value, 2024-2034 (US$ Mn, AGR (%), CAGR (%))
Table 72 Mexico Power-to-X (P2X) Market by Value, 2024-2034 (US$ Mn, AGR (%), CAGR (%))
Table 73 Rest of Latin America Power-to-X (P2X) Market by Value, 2024-2034 (US$ Mn, AGR (%), CAGR (%))
Table 74 Strategic Outlook
Table 75 Air Liquide SA: Key Details, (CEO, HQ, Revenue, Founded, No. of Employees, Company Type, Website, Business Segment)
Table 76 Air Liquide SA: Product Benchmarking
Table 77 Air Liquide SA: Strategic Outlook
Table 78 Linde plc: Key Details, (CEO, HQ, Revenue, Founded, No. of Employees, Company Type, Website, Business Segment)
Table 79 Linde plc: Product Benchmarking
Table 80 Linde plc: Strategic Outlook
Table 81 Air Products and Chemicals, Inc: Key Details, (CEO, HQ, Revenue, Founded, No. of Employees, Company Type, Website, Business Segment)
Table 82 Air Products and Chemicals, Inc: Product Benchmarking
Table 83 Air Products and Chemicals, Inc: Strategic Outlook
Table 84 Mitsubishi Power, Ltd: Key Details, (CEO, HQ, Revenue, Founded, No. of Employees, Company Type, Website, Business Segment)
Table 85 Mitsubishi Power, Ltd: Product Benchmarking
Table 86 Mitsubishi Power, Ltd: Strategic Outlook
Table 87 Ceres Power Holdings plc: Key Details, (CEO, HQ, Revenue, Founded, No. of Employees, Company Type, Website, Business Segment)
Table 88 Ceres Power Holdings plc: Product Benchmarking
Table 89 Ceres Power Holdings plc: Strategic Outlook
Table 90 ThyssenKrupp AG: Key Details, (CEO, HQ, Revenue, Founded, No. of Employees, Company Type, Website, Business Segment)
Table 91 ThyssenKrupp AG: Product Benchmarking
Table 92 ThyssenKrupp AG: Strategic Outlook
Table 93 International Renewable Energy Agency (IRENA): Key Details, (CEO, HQ, Revenue, Founded, No. of Employees, Company Type, Website, Business Segment)
Table 94 International Renewable Energy Agency (IRENA): Product Benchmarking
Table 95 Copenhagen Infrastructure Partners: Key Details, (CEO, HQ, Revenue, Founded, No. of Employees, Company Type, Website, Business Segment)
Table 96 Copenhagen Infrastructure Partners: Product Benchmarking
Table 97 Copenhagen Infrastructure Partners: Strategic Outlook
Table 98 Underground Sun Conversion: Key Details, (CEO, HQ, Revenue, Founded, No. of Employees, Company Type, Website, Business Segment)
Table 99 Underground Sun Conversion: Product Benchmarking
Table 100 Weidmüller Interface GmbH & Co. KG, Key Details, (CEO, HQ, Revenue, Founded, No. of Employees, Company Type, Website, Business Segment)
Table 101 Weidmüller Interface GmbH & Co. KG,: Product Benchmarking
List of Figures
Figure 1 Power-to-X (P2X) Market Segmentation
Figure 2 Power-to-X (P2X) Market by Source: Market Attractiveness Index
Figure 3 Power-to-X (P2X) Market by Application: Market Attractiveness Index
Figure 4 Power-to-X (P2X) Market by End-User: Market Attractiveness Index
Figure 5 Power-to-X (P2X) Market by Technology: Market Attractiveness Index
Figure 6 Power-to-X (P2X) Market Attractiveness Index by Region
Figure 7 Power-to-X (P2X) Market: Market Dynamics
Figure 8 Power-to-X (P2X) Market: Impact Analysis
Figure 9 Number of Green Hydrogen Production Facilities Worldwide as of 2022, by Country
Figure 10 Global Renewable Energy Capacity (MW) from 2019 to 2022
Figure 11 Power-to-X (P2X): Supply Chain Analysis
Figure 12 Power-to-X (P2X) Market: Porter’s Five Forces Analysis
Figure 13 Power-to-X (P2X) Market: PEST Analysis
Figure 14 Power-to-X (P2X) Market by Source: Market Attractiveness Index
Figure 15 Global Power-to-X (P2X) Market by Source, 2024-2034 (US$ Mn, AGR (%))
Figure 16 Power-to-X (P2X) Market Share Forecast by Source, 2024, 2029, 2034 (%)
Figure 17 Renewable Energy Sources Market by Region, 2024-2034 (US$ Mn, AGR (%))
Figure 18 Renewable Energy Sources Segment Market Share Forecast by Region, 2024 & 2034 (%)
Figure 19 Conventional Energy Sources Market by Region, 2024-2034 (US$ Mn, AGR (%))
Figure 20 Conventional Energy Sources Segment Market Share Forecast by Region, 2024 & 2034 (%)
Figure 21 Hybrid Energy Sources Market by Region, 2024-2034 (US$ Mn, AGR (%))
Figure 22 Hybrid Energy Sources Segment Market Share Forecast by Region, 2024 & 2034 (%)
Figure 23 Power-to-X (P2X) Market by Application: Market Attractiveness Index
Figure 24 Global Power-to-X (P2X) Market by Application, 2024-2034 (US$ Mn, AGR (%))
Figure 25 Power-to-X (P2X) Market Share Forecast by Application, 2024, 2029, 2034 (%)
Figure 26 Energy Storage Market by Region, 2024-2034 (US$ Mn, AGR (%))
Figure 27 Energy Storage Segment Market Share Forecast by Region, 2024 & 2034 (%)
Figure 28 Grid Stabilization Market by Region, 2024-2034 (US$ Mn, AGR (%))
Figure 29 Grid Stabilization Segment Market Share Forecast by Region, 2024 & 2034 (%)
Figure 30 Fuel Production Market by Region, 2024-2034 (US$ Mn, AGR (%))
Figure 31 Fuel Production Segment Market Share Forecast by Region, 2024 & 2034 (%)
Figure 32 Industrial Processes Market by Region, 2024-2034 (US$ Mn, AGR (%))
Figure 33 Industrial Processes Segment Market Share Forecast by Region, 2024 & 2034 (%)
Figure 34 Power-to-X (P2X) Market by End-User: Market Attractiveness Index
Figure 35 Global Power-to-X (P2X) Market by End-User, 2024-2034 (US$ Mn, AGR (%))
Figure 36 Power-to-X (P2X) Market Share Forecast by End-User, 2024, 2029, 2034 (%)
Figure 37 Utilities Market by Region, 2024-2034 (US$ Mn, AGR (%))
Figure 38 Utilities Segment Market Share Forecast by Region, 2024 & 2034 (%)
Figure 39 Industrial Market by Region, 2024-2034 (US$ Mn, AGR (%))
Figure 40 Industrial Segment Market Share Forecast by Region, 2024 & 2034 (%)
Figure 41 Transportation Market by Region, 2024-2034 (US$ Mn, AGR (%))
Figure 42 Transportation Segment Market Share Forecast by Region, 2024 & 2034 (%)
Figure 43 Residential Market by Region, 2024-2034 (US$ Mn, AGR (%))
Figure 44 Residential Segment Market Share Forecast by Region, 2024 & 2034 (%)
Figure 45 Commercial Market by Region, 2024-2034 (US$ Mn, AGR (%))
Figure 46 Commercial Segment Market Share Forecast by Region, 2024 & 2034 (%)
Figure 47 Power-to-X (P2X) Market by Technology: Market Attractiveness Index
Figure 48 Global Power-to-X (P2X) Market by Technology, 2024-2034 (US$ Mn, AGR (%))
Figure 49 Power-to-X (P2X) Market Share Forecast by Technology, 2024, 2029, 2034 (%)
Figure 50 Power-to-Gas (P2G) Market by Region, 2024-2034 (US$ Mn, AGR (%))
Figure 51 Power-to-Gas (P2G) Segment Market Share Forecast by Region, 2024 & 2034 (%)
Figure 52 Power-to-Heat (P2H) Market by Region, 2024-2034 (US$ Mn, AGR (%))
Figure 53 Power-to-Heat (P2H) Segment Market Share Forecast by Region, 2024 & 2034 (%)
Figure 54 Power-to-Liquids (P2L) Market by Region, 2024-2034 (US$ Mn, AGR (%))
Figure 55 Power-to-Liquids (P2L) Segment Market Share Forecast by Region, 2024 & 2034 (%)
Figure 56 Power-to-Chemicals (P2C) Market by Region, 2024-2034 (US$ Mn, AGR (%))
Figure 57 Power-to-Chemicals (P2C) Segment Market Share Forecast by Region, 2024 & 2034 (%)
Figure 58 Power-to-Hydrogen (P2H2) Market by Region, 2024-2034 (US$ Mn, AGR (%))
Figure 59 Power-to-Hydrogen (P2H2) Segment Market Share Forecast by Region, 2024 & 2034 (%)
Figure 60 Other Technologies Market by Region, 2024-2034 (US$ Mn, AGR (%))
Figure 61 Other Technologies Segment Market Share Forecast by Region, 2024 & 2034 (%)
Figure 62 Power-to-X (P2X) Market Forecast by Region 2024 and 2034 (Revenue, CAGR%)
Figure 63 Power-to-X (P2X) Market Share Forecast by Region 2024, 2029, 2034 (%)
Figure 64 Global Power-to-X (P2X) Market by Region, 2024-2034 (US$ Mn, AGR (%),)
Figure 65 North America Power-to-X (P2X) Market Attractiveness Index
Figure 66 North America Power-to-X (P2X) Market by Region, 2024, 2029 & 2034 (US$ Million)
Figure 67 North America Power-to-X (P2X) Market by Country, 2024-2034 (US$ Mn, AGR (%))
Figure 68 North America Power-to-X (P2X) Market Share Forecast by Country, 2024 & 2034 (%)
Figure 69 North America Power-to-X (P2X) Market by Source, 2024-2034 (US$ Mn, AGR (%))
Figure 70 North America Power-to-X (P2X) Market Share Forecast by Source, 2024 & 2034 (%)
Figure 71 North America Power-to-X (P2X) Market by Application, 2024-2034 (US$ Mn, AGR (%))
Figure 72 North America Power-to-X (P2X) Market Share Forecast by Application, 2024 & 2034 (%)
Figure 73 North America Power-to-X (P2X) Market by End-User, 2024-2034 (US$ Mn, AGR (%))
Figure 74 North America Power-to-X (P2X) Market Share Forecast by End-User, 2024 & 2034 (%)
Figure 75 North America Power-to-X (P2X) Market by Technology, 2024-2034 (US$ Mn, AGR (%))
Figure 76 North America Power-to-X (P2X) Market Share Forecast by Technology, 2024 & 2034 (%)
Figure 77 US Power-to-X (P2X) Market by Value, 2024-2034 (US$ Mn, AGR (%))
Figure 78 Canada Power-to-X (P2X) Market by Value, 2024-2034 (US$ Mn, AGR (%))
Figure 79 Europe Power-to-X (P2X) Market Attractiveness Index
Figure 80 Europe Power-to-X (P2X) Market by Region, 2024, 2029 & 2034 (US$ Million)
Figure 81 Europe Power-to-X (P2X) Market by Value, 2024-2034 (US$ Mn, AGR (%))
Figure 82 Europe Power-to-X (P2X) Market by Country, 2024-2034 (US$ Mn, AGR (%))
Figure 83 Europe Power-to-X (P2X) Market Share Forecast by Country, 2024 & 2034 (%)
Figure 84 Europe Power-to-X (P2X) Market by Source, 2024-2034 (US$ Mn, AGR (%))
Figure 85 Europe Power-to-X (P2X) Market Share Forecast by Source, 2024 & 2034 (%)
Figure 86 Europe Power-to-X (P2X) Market by Application, 2024-2034 (US$ Mn, AGR (%))
Figure 87 Europe Power-to-X (P2X) Market Share Forecast by Application, 2024 & 2034 (%)
Figure 88 Europe Power-to-X (P2X) Market by End-User, 2024-2034 (US$ Mn, AGR (%))
Figure 89 Europe Power-to-X (P2X) Market Share Forecast by End-User, 2024 & 2034 (%)
Figure 90 Europe Power-to-X (P2X) Market by Technology, 2024-2034 (US$ Mn, AGR (%))
Figure 91 Europe Power-to-X (P2X) Market Share Forecast by Technology, 2024 & 2034 (%)
Figure 92 Germany Power-to-X (P2X) Market by Value, 2024-2034 (US$ Mn, AGR (%))
Figure 93 UK Power-to-X (P2X) Market by Value, 2024-2034 (US$ Mn, AGR (%))
Figure 94 France Power-to-X (P2X) Market by Value, 2024-2034 (US$ Mn, AGR (%))
Figure 95 Italy Power-to-X (P2X) Market by Value, 2024-2034 (US$ Mn, AGR (%))
Figure 96 Spain Power-to-X (P2X) Market by Value, 2024-2034 (US$ Mn, AGR (%))
Figure 97 Rest of Europe Power-to-X (P2X) Market by Value, 2024-2034 (US$ Mn, AGR (%))
Figure 98 Asia-Pacific Power-to-X (P2X) Market Attractiveness Index
Figure 99 Asia-Pacific Power-to-X (P2X) Market by Region, 2024, 2029 & 2034 (US$ Million)
Figure 100 Asia-Pacific Power-to-X (P2X) Market by Value, 2024-2034 (US$ Mn, AGR (%))
Figure 101 Asia-Pacific Power-to-X (P2X) Market by Country, 2024-2034 (US$ Mn, AGR (%))
Figure 102 Asia-Pacific Power-to-X (P2X) Market Share Forecast by Country, 2024 & 2034 (%)
Figure 103 Asia-Pacific Power-to-X (P2X) Market by Source, 2024-2034 (US$ Mn, AGR (%))
Figure 104 Asia-Pacific Power-to-X (P2X) Market Share Forecast by Source, 2024 & 2034 (%)
Figure 105 Asia-Pacific Power-to-X (P2X) Market by Application, 2024-2034 (US$ Mn, AGR (%))
Figure 106 Asia-Pacific Power-to-X (P2X) Market Share Forecast by Application, 2024 & 2034 (%)
Figure 107 Asia-Pacific Power-to-X (P2X) Market by End-User, 2024-2034 (US$ Mn, AGR (%))
Figure 108 Asia-Pacific Power-to-X (P2X) Market Share Forecast by End-User, 2024 & 2034 (%)
Figure 109 Asia-Pacific Power-to-X (P2X) Market by Technology, 2024-2034 (US$ Mn, AGR (%))
Figure 110 Asia-Pacific Power-to-X (P2X) Market Share Forecast by Technology, 2024 & 2034 (%)
Figure 111 China Power-to-X (P2X) Market by Value, 2024-2034 (US$ Mn, AGR (%))
Figure 112 India Power-to-X (P2X) Market by Value, 2024-2034 (US$ Mn, AGR (%))
Figure 113 Japan Power-to-X (P2X) Market by Value, 2024-2034 (US$ Mn, AGR (%))
Figure 114 South Korea Power-to-X (P2X) Market by Value, 2024-2034 (US$ Mn, AGR (%))
Figure 115 Australia Power-to-X (P2X) Market by Value, 2024-2034 (US$ Mn, AGR (%))
Figure 116 Rest of Asia-Pacific Power-to-X (P2X) Market by Value, 2024-2034 (US$ Mn, AGR (%))
Figure 117 Middle East and Africa Power-to-X (P2X) Market Attractiveness Index
Figure 118 Middle East and Africa Power-to-X (P2X) Market by Region, 2024, 2029 & 2034 (US$ Million)
Figure 119 Middle East & Africa Power-to-X (P2X) Market by Value, 2024-2034 (US$ Mn, AGR (%))
Figure 120 Middle East & Africa Power-to-X (P2X) Market by Country, 2024-2034 (US$ Mn, AGR (%))
Figure 121 Middle East and Africa Power-to-X (P2X) Market Share Forecast by Country, 2024 & 2034 (%)
Figure 122 Middle East & Africa Power-to-X (P2X) Market by Source, 2024-2034 (US$ Mn, AGR (%))
Figure 123 Middle East and Africa Power-to-X (P2X) Market Share Forecast by Source, 2024 & 2034 (%)
Figure 124 Middle East & Africa Power-to-X (P2X) Market by Application, 2024-2034 (US$ Mn, AGR (%))
Figure 125 Middle East and Africa Power-to-X (P2X) Market Share Forecast by Application, 2024 & 2034 (%)
Figure 126 Middle East & Africa Power-to-X (P2X) Market by End-User, 2024-2034 (US$ Mn, AGR (%))
Figure 127 Middle East and Africa Power-to-X (P2X) Market Share Forecast by End-User, 2024 & 2034 (%)
Figure 128 Middle East & Africa Power-to-X (P2X) Market by Technology, 2024-2034 (US$ Mn, AGR (%))
Figure 129 Middle East and Africa Power-to-X (P2X) Market Share Forecast by Technology, 2024 & 2034 (%)
Figure 130 GCC Power-to-X (P2X) Market by Value, 2024-2034 (US$ Mn, AGR (%))
Figure 131 South Africa Power-to-X (P2X) Market by Value, 2024-2034 (US$ Mn, AGR (%))
Figure 132 Rest of Middle East & Africa Power-to-X (P2X) Market by Value, 2024-2034 (US$ Mn, AGR (%))
Figure 133 Latin America Power-to-X (P2X) Market Attractiveness Index
Figure 134 Latin America Power-to-X (P2X) Market by Region, 2024, 2029 & 2034 (US$ Million)
Figure 135 Latin America Power-to-X (P2X) Market by Value, 2024-2034 (US$ Mn, AGR (%))
Figure 136 Latin America Power-to-X (P2X) Market by Country, 2024-2034 (US$ Mn, AGR (%))
Figure 137 Latin America Power-to-X (P2X) Market Share Forecast by Country, 2024 & 2034 (%)
Figure 138 Latin America Power-to-X (P2X) Market by Source, 2024-2034 (US$ Mn, AGR (%))
Figure 139 Latin America Power-to-X (P2X) Market Share Forecast by Source, 2024 & 2034 (%)
Figure 140 Latin America Power-to-X (P2X) Market by Application, 2024-2034 (US$ Mn, AGR (%))
Figure 141 Latin America Power-to-X (P2X) Market Share Forecast by Application, 2024 & 2034 (%)
Figure 142 Latin America Power-to-X (P2X) Market by End-User, 2024-2034 (US$ Mn, AGR (%))
Figure 143 Latin America Power-to-X (P2X) Market Share Forecast by End-User, 2024 & 2034 (%)
Figure 144 Latin America Power-to-X (P2X) Market by Technology, 2024-2034 (US$ Mn, AGR (%))
Figure 145 Latin America Power-to-X (P2X) Market Share Forecast by Technology, 2024 & 2034 (%)
Figure 146 Brazil Power-to-X (P2X) Market by Value, 2024-2034 (US$ Mn, AGR (%))
Figure 147 Mexico Power-to-X (P2X) Market by Value, 2024-2034 (US$ Mn, AGR (%))
Figure 148 Rest of Latin America Power-to-X (P2X) Market by Value, 2024-2034 (US$ Mn, AGR (%))
Figure 149 Power-to-X (P2X) Market: Company Share/Ranking, 2023
Figure 150 Air Liquide SA: Net Revenue, 2019-2023 (US$ Million, AGR%)
Figure 151 Air Liquide SA: R&D, 2019-2023 (US$ Million, AGR%)
Figure 152 Air Liquide SA: Regional Market Shares, 2023
Figure 153 Air Liquide SA: Business Segment Market Shares, 2023
Figure 154 Air Liquide SA: SWOT Analysis
Figure 155 Linde plc: Net Revenue, 2019-2023 (US$ Million, AGR%)
Figure 156 Linde plc: R&D, 2019-2023 (US$ Million, AGR%)
Figure 157 Linde plc: Regional Market Shares, 2023
Figure 158 Linde plc: Business Segment Market Shares, 2023
Figure 159 Linde plc: SWOT Analysis
Figure 160 Air Products and Chemicals, Inc: Net Revenue, 2019-2023 (US$ Million, AGR%)
Figure 161 Air Products and Chemicals, Inc: R&D, 2019-2023 (US$ Million, AGR%)
Figure 162 Air Products and Chemicals, Inc: Regional Market Shares, 2023
Figure 163 Air Products and Chemicals, Inc: Business Segment Market Shares, 2023
Figure 164 Air Products and Chemicals, Inc: SWOT Analysis
Figure 165 Mitsubishi Power, Ltd: Net Revenue, 2019-2023 (US$ Million, AGR%)
Figure 166 Mitsubishi Power, Ltd: R&D, 2019-2023 (US$ Million, AGR%)
Figure 167 Mitsubishi Power, Ltd: Regional Market Shares, 2023
Figure 168 Mitsubishi Power, Ltd: Business Segment Market Shares, 2023
Figure 169 Mitsubishi Power, Ltd: SWOT Analysis
Figure 170 Ceres Power Holdings plc: Net Revenue, 2019-2023 (US$ Million, AGR%)
Figure 171 Ceres Power Holdings plc: R&D, 2019-2023 (US$ Million, AGR%)
Figure 172 Ceres Power Holdings plc: Regional Market Shares, 2023
Figure 173 Ceres Power Holdings plc: SWOT Analysis
Figure 174 ThyssenKrupp AG: Net Revenue, 2019-2023 (US$ Million, AGR%)
Figure 175 ThyssenKrupp AG: R&D, 2019-2023 (US$ Million, AGR%)
Figure 176 ThyssenKrupp AG: Regional Market Shares, 2023
Figure 177 ThyssenKrupp AG: Business Segment Market Shares, 2023
ページTOPに戻る
本レポートと同じKEY WORD()の最新刊レポート
- 本レポートと同じKEY WORDの最新刊レポートはありません。
よくあるご質問
Visiongain社はどのような調査会社ですか?
英国の調査会社ヴィジョンゲイン社(Visiongain)は、通信とエネルギーのほか、自動車や化学・医薬品、金属など、広範な市場を対象に調査を行っています。自動車市場については、市場全般に関する調査のほ... もっと見る
調査レポートの納品までの日数はどの程度ですか?
在庫のあるものは速納となりますが、平均的には 3-4日と見て下さい。
但し、一部の調査レポートでは、発注を受けた段階で内容更新をして納品をする場合もあります。
発注をする前のお問合せをお願いします。
注文の手続きはどのようになっていますか?
1)お客様からの御問い合わせをいただきます。
2)見積書やサンプルの提示をいたします。
3)お客様指定、もしくは弊社の発注書をメール添付にて発送してください。
4)データリソース社からレポート発行元の調査会社へ納品手配します。
5) 調査会社からお客様へ納品されます。最近は、pdfにてのメール納品が大半です。
お支払方法の方法はどのようになっていますか?
納品と同時にデータリソース社よりお客様へ請求書(必要に応じて納品書も)を発送いたします。
お客様よりデータリソース社へ(通常は円払い)の御振り込みをお願いします。
請求書は、納品日の日付で発行しますので、翌月最終営業日までの当社指定口座への振込みをお願いします。振込み手数料は御社負担にてお願いします。
お客様の御支払い条件が60日以上の場合は御相談ください。
尚、初めてのお取引先や個人の場合、前払いをお願いすることもあります。ご了承のほど、お願いします。
データリソース社はどのような会社ですか?
当社は、世界各国の主要調査会社・レポート出版社と提携し、世界各国の市場調査レポートや技術動向レポートなどを日本国内の企業・公官庁及び教育研究機関に提供しております。
世界各国の「市場・技術・法規制などの」実情を調査・収集される時には、データリソース社にご相談ください。
お客様の御要望にあったデータや情報を抽出する為のレポート紹介や調査のアドバイスも致します。
|
|


