女性の健康市場レポート:2024-2034
Womens Health Market Report 2024-2034
レポート詳細
女性の健康市場レポート 2024-2034年 :本レポートは、業界とその基礎となる原動力をより良く理解したいと望むなら、新たな収益ポケットを目指す大手企業にとって貴重なものとなるでし... もっと見る
※上記価格は部署ライセンス(Departmental licence)価格です。
その他の価格についてはデータリソースまでお問合せください。
日本語のページは自動翻訳を利用し作成しています。
実際のレポートは英文のみでご納品いたします。
サマリー
レポート詳細
女性の健康市場レポート 2024-2034年:本レポートは、業界とその基礎となる原動力をより良く理解したいと望むなら、新たな収益ポケットを目指す大手企業にとって貴重なものとなるでしょう。異業種への進出や新規地域での既存事業の拡大を目指す企業にも有用です。
女性の健康問題に対する意識の高まり
女性の健康問題に対する意識の高まりにより、女性の健康市場は大きな成長を遂げている。この成長の背景には、医療費の増加、医療技術の進歩、予防医療への関心の高まりなど、さまざまな要因がある。リプロダクティブ・ヘルス、妊産婦の健康、乳房の健康、更年期管理、性の健康など、女性特有の健康ニーズに対応する製品やサービスへの需要が高まっている。さらに、女性の健康教育とアドボカシーを推進するイニシアチブが、性別特有の健康懸念と早期発見・早期治療の重要性に対する理解を深めることにも貢献している。女性の健康市場は今後も拡大し続け、世界中の女性に革新と医療成果向上の機会を提供すると予想される。
患者ケアにおける技術の進歩
技術の進歩は女性の健康市場の風景を急速に変え、技術革新と患者ケアの向上の新時代を切り開いている。洗練された診断ツールから最先端の治療法まで、これらの進歩は女性の健康状態の診断、管理、治療の方法に革命をもたらしつつある。3DマンモグラフィやMRIなどの高度な画像診断技術は、乳がんを早期段階で発見する精度を高め、生存率を向上させ、侵襲的な処置の必要性を減らしています。腹腔鏡手術やロボット支援手術などの低侵襲手術技術は、子宮内膜症や子宮筋腫などの婦人科疾患に対処するためのより安全で効果的な選択肢を提供している。さらに、モバイル・アプリ、ウェアラブル端末、遠隔医療プラットフォームなどのデジタル・ヘルス・ソリューションは、情報への便利なアクセス、モニタリング・ツール、医療提供者とのバーチャルなコンサルテーションを提供することで、女性の健康を管理する力を与えている。これらの技術革新は、女性の健康成果を向上させ、市場成長を促進し、女性の健康分野におけるケア全体の質を向上させる上で、計り知れない可能性を秘めている。
市場調査レポートを購入する前に、どのような質問をすべきでしょうか?
-
女性の健康市場はどのように進化しているのか?
-
女性の健康市場を牽引し、抑制しているものは何か?
-
女性の健康の各サブマーケットセグメントは予測期間中にどのように成長し、2034年にどれくらいの収益を占めるのか?
-
2024年から2034年にかけて、女性の健康の各サブマーケットの市場シェアはどのように推移するのか?
-
2024年から2034年までの市場全体の主な牽引役は何か?
-
主要な女性の健康市場はマクロ経済の動きに概ね追随するのか、それとも個々の国内市場が他を凌駕するのか?
-
2034年までに各国市場のシェアはどのように変化し、2034年にはどの地域が市場をリードするのか?
-
主要プレーヤーは誰で、予測期間中の見通しは?
-
これらの大手企業の女性の健康プロジェクトとは?
-
2024年から2034年の間に、産業はどのように発展するのか?現在および今後10年間に実施される女性の健康プロジェクトにはどのような意味がありますか?
-
女性の健康市場をさらに拡大するために、製品の商業化の必要性は高まっていますか?
-
女性の健康市場はどこに向かっているのか、そしてどのようにして市場の最前線に立つことができるのか?
-
新製品や新サービスへの最適な投資方法とは?
-
企業を新たな成長軌道に乗せ、C-suiteに移行させるための重要な展望とは?
女性の健康市場が現在、そして今後10年間でどのような影響を受けるのかを知る必要があります:
-
351ページにわたる本レポートでは、125の表と186の図表を掲載しています。
-
本レポートは、業界における主要な有利分野にハイライトを当てているため、今すぐターゲットを絞ることができます。
-
本レポートには、世界、地域、国の売上と成長に関する詳細な分析が含まれています。
-
競合他社が成功した主なトレンド、変化、収益予測をハイライトしています。
本レポートは、女性の健康市場が今後10年間にどのように発展するか、またCOVID-19の景気後退と好転の変動に合わせて今を伝えます。この市場は、過去10年間のどの時点よりも今が重要です。
2034年までの予測やその他の分析により、商業的展望が明らかに
-
2034年までの収益予測に加え、最新の業績、成長率、市場シェアを提供します。
-
ビジネスの展望と展開に関する独自の分析をご覧いただけます。
-
質的分析(市場力学、促進要因、機会、阻害要因、課題を含む)、コスト構造、女性用医薬品価格上昇の影響、最近の動向をご覧いただけます。
本レポートには、COVID-19が業界と貴社にどのような影響を与えるかについてのデータ分析と貴重な洞察が含まれています。本レポートでは、COVID-19の4つの回収パターン、すなわち「V」、「L」、「W」、「U」の回収パターンとその影響について論じている。
本レポートの対象セグメント
用途別
-
避妊薬
-
閉経後骨粗鬆症
-
ホルモン性不妊症
-
更年期障害
-
多嚢胞性卵巣症候群
-
子宮内膜症・子宮筋腫
-
その他
流通チャネル別
医薬品別
-
Prolia
-
Xgeva
-
Mirena
-
Nexplanon
-
Forteo
-
Nuvaring
-
Premarin
-
Lupron
-
Lo Loestrin
-
Orilissa/Oriahnn
-
その他
タイプ別
世界市場全体とセグメント別の収益予測に加え、4つの地域と20の主要国市場の収益予測も掲載しています:
北米
欧州
-
ドイツ
-
英国
-
フランス
-
スペイン
-
イタリア
-
その他の欧州地域
アジア太平洋地域
-
中国
-
日本
-
インド
-
オーストラリア
-
韓国
-
その他のアジア太平洋地域
ラテンアメリカ
MEA
また、2024年から2034年までの女性の健康市場における主要企業のプロファイルも掲載している。
本レポートに掲載されている主要企業
-
Abbott
-
Bayer AG
-
Caldera Medical
-
Cardinal Health
-
Carestream
-
Cooper Surgical Inc.
-
L. Hoffman-La Roche Ltd.
-
GE Healthcare
-
Hologic
-
Koninklijke Philips N.V
-
MedGyn Products
-
Medline Industries, Inc.
-
Prestige Consumer Healthcare, Inc.
-
Siemens AG
2024年から2034年までの女性の健康市場全体の世界売上高(金額ベース)は、2034年に610億米ドルを突破する。2034年まで力強い収益成長を予測。当研究所では、最大の可能性を秘めた組織を特定しています。彼らの能力、進歩、商業的展望を発見し、あなたが一歩先を行くのを支援します。
女性の健康市場、2024〜2034年レポートはどのように役立つのでしょうか?
350ページを超える本レポートは、要約すると以下の知識を提供します:
-
女性の健康市場、2024年から2034年までの収益予測 女性の健康市場、2024年から2034年までの収益予測 素材、デザイン、タイプ、デリバリー、アプリケーションの各予測を世界および地域レベルで掲載 - 業界の将来性を発見し、投資と収益に最も有利な場所を見つけます。
-
5つの地域と16の主要国市場の2034年までの収益予測 - 女性の健康市場、北米、欧州、アジア太平洋、ラテンアメリカ、MEAの2024年から2034年までの市場予測をご覧ください。また、米国、カナダ、メキシコ、ブラジル、ドイツ、フランス、英国、イタリア、中国、インド、日本、オーストラリアなどの主要経済圏の市場も予測しています。
-
2024年から2034年までの女性の健康市場に関わる主要企業14社の企業プロファイルを含む。
独自の予測による定量的・定性的分析をご覧いただけます。当レポートにしか掲載されていない情報を入手し、貴重なビジネスインテリジェンスで情報を得ることができます。
他では得られない情報
弊社の最新レポートがあれば、知識に遅れをとったり、ビジネスチャンスを逃したりする可能性が低くなります。Visiongainのレポートが貴社の調査、分析、意思決定にどのように役立つかをご覧ください。Visiongainの調査は、2024年から2034年までの女性の健康市場の商業分析を必要とするすべての人、市場をリードする企業のためのものです。データ、トレンド、予測をご覧いただけます。
ページTOPに戻る
目次
目次
1 レポート概要
1.1 調査の目的
1.2 女性の健康市場の紹介
1.3 本レポートの内容
1.4 本レポートを読むべき理由
1.5 本分析レポートが回答する主な質問
1.6 本レポートは誰のためのものか?
1.7 方法論
1.7.1 市場の定義
1.7.2 市場評価・予測手法
1.7.3 データの検証
1.7.3.1 一次調査
1.7.3.2 セカンダリーリサーチ
1.8 よくある質問(FAQ)
1.9 Visiongainの関連レポート
1.10 Visiongainについて
2 エグゼクティブ・サマリー
3 市場概要
3.1 主要な調査結果
3.2 市場ダイナミクス
3.2.1 市場牽引要因
3.2.1.1 新興国に対する注目の高まり
3.2.1.2 新たな治療ソリューションをターゲットとした技術革新の加速
3.2.1.3 患者満足度向上のための技術投資の拡大
3.2.2 市場抑制要因
3.2.2.1 価格高騰が市場拡大の制約要因に
3.2.2.2 先進医療インフラ開発のための協力の増加
3.2.3 市場機会
3.2.3.1 女性特有の健康ニーズに合わせた予防医療サービスの拡大
3.2.3.2 デジタルヘルスプラットフォームの改善による、特にサービスが行き届いていない地域における女性のヘルスケアサービスへのアクセス向上
3.2.3.3 家族計画、不妊治療、妊産婦ケアを含むリプロダクティブ・ヘルス・サービスの技術的進歩
3.3 COVID-19の影響分析
3.4 ポーターのファイブフォース分析
3.4.1 サプライヤーの交渉力
3.4.2 買い手の交渉力
3.4.3 競争相手のライバル関係
3.4.4 代替品による脅威
3.4.5 新規参入企業の脅威
3.5 PEST分析
4 女性の健康市場分析:用途別
4.1 主な調査結果
4.2 用途別セグメント 市場魅力度指数
4.3 女性の健康用途別市場規模の推定と予測
4.4 避妊薬
4.4.1 2024〜2034年の地域別市場規模(US$ Billion)
4.4.2 地域別市場シェア、2024年・2034年(%)
4.5 閉経後骨粗鬆症
4.5.1 2024〜2034年の地域別市場規模(US$ Billion)
4.5.2 地域別市場シェア、2024年・2034年(%)
4.6 ホルモン性不妊症
4.6.1 2024〜2034年の地域別市場規模(US$ Billion)
4.6.2 地域別市場シェア、2024年・2034年(%)
4.7 更年期障害
4.7.1 2024〜2034年の地域別市場規模(US$ Billion)
4.7.2 地域別市場シェア、2024年・2034年(%)
4.8 多嚢胞性卵巣症候群
4.8.1 2024〜2034年の地域別市場規模(US$ Billion)
4.8.2 地域別市場シェア、2024年・2034年(%)
4.9 子宮内膜症および子宮筋腫
4.9.1 2024〜2034年の地域別市場規模(US$ Billion)
4.9.2 地域別市場シェア、2024年・2034年(%)
4.10 その他
4.10.1 2024〜2034年の地域別市場規模(US$ Billion)
4.10.2 地域別市場シェア、2024年・2034年(%)
5 女性の健康市場分析:流通チャネル別
5.1 主な調査結果
5.2 アプリケーション・セグメント 市場魅力度指数
5.3 女性の健康:流通チャネル別市場規模推定と予測
5.4 病院薬局
5.4.1 2024〜2034年の地域別市場規模(US$ Billion)
5.4.2 地域別市場シェア、2024年・2034年(%)
5.5 小売薬局
5.5.1 2024〜2034年の地域別市場規模(US$ Billion)
5.5.2 地域別市場シェア、2024年・2034年(%)
5.6 オンライン薬局
5.6.1 2024〜2034年の地域別市場規模(US$ Billion)
5.6.2 地域別市場シェア、2024年・2034年(%)
6 女性の健康市場分析:医薬品別
6.1 主な調査結果
6.2 用途別セグメント 市場魅力度指数
6.3 女性の健康:医薬品別市場規模の推定と予測
6.4 Xgeva
6.4.1 2024〜2034年の地域別市場規模(US$ Billion)
6.4.2 地域別市場シェア、2024年・2034年(%)
6.5 プロリア
6.5.1 2024〜2034年の地域別市場規模(US$ Billion)
6.5.2 地域別市場シェア、2024年・2034年(%)
6.6 ミレーナ
6.6.1 2024〜2034年の地域別市場規模(US$ Billion)
6.6.2 地域別市場シェア、2024年・2034年(%)
6.7 ネクスプラノン
6.7.1 2024〜2034年の地域別市場規模(US$ Billion)
6.7.2 地域別市場シェア、2024年・2034年(%)
6.8 フォルテオ
6.8.1 2024〜2034年の地域別市場規模(US$ Billion)
6.8.2 地域別市場シェア、2024年・2034年(%)
6.9 ヌバリング
6.9.1 2024〜2034年の地域別市場規模(US$ Billion)
6.9.2 地域別市場シェア、2024年・2034年(%)
6.10 プレマリン
6.10.1 2024-2034年地域別市場規模(US$ Billion)
6.10.2 地域別市場シェア、2024年・2034年(%)
6.11 ルプロン
6.11.1 2024〜2034年の地域別市場規模(US$ Billion)
6.11.2 地域別市場シェア、2024年・2034年(%)
6.12 ロエストリン
6.12.1 2024〜2034年の地域別市場規模(US$ Billion)
6.12.2 地域別市場シェア、2024年・2034年(%)
6.13 オリリッサ/オリアウン
6.13.1 2024年~2034年の地域別市場規模(US$ Billion)
6.13.2 地域別市場シェア、2024年・2034年(%)
6.14 その他
6.14.1 2024〜2034年の地域別市場規模(US$ Billion)
6.14.2 地域別市場シェア、2024年・2034年(%)
7 女性の健康市場分析:タイプ別
7.1 主要な調査結果
7.2 用途別セグメント 市場魅力度指数
7.3 女性の健康:タイプ別市場規模推定と予測
7.4 ジェネリック
7.4.1 2024〜2034年の地域別市場規模(US$ Billion)
7.4.2 地域別市場シェア、2024年・2034年(%)
7.5 ブランド
7.5.1 2024〜2034年の地域別市場規模(US$ Billion)
7.5.2 地域別市場シェア、2024年・2034年(%)
8 女性の健康市場分析:地域別
8.1 主要な調査結果
8.2 地域別市場規模の推定と予測
9 北米の女性の健康市場分析
9.1 主要な調査結果
9.2 北米女性の健康市場魅力度指数
9.3 北米の女性の健康国別市場規模、2024年、2029年、2034年(US$ Billion)
9.4 北米の女性の健康市場規模推定と予測:国別
9.5 北米の女性の健康市場規模推定と予測:用途別
9.6 北米の女性の健康市場規模推定と予測:流通経路別
9.7 北米の女性の健康市場規模推定と予測:医薬品別
9.8 北米の女性の健康市場規模推定と予測:タイプ別
9.9 アメリカ女性の健康市場分析
9.10 カナダの女性の健康市場分析
10 欧州の女性の健康市場分析
10.1 主要な調査結果
10.2 欧州女性の健康市場魅力度指数
10.3 欧州の女性の健康国別市場規模、2024年、2029年、2034年(US$ Billion)
10.4 欧州の女性の健康市場規模推定と予測:国別
10.5 欧州の女性の健康市場規模推定と予測:用途別
10.6 欧州の女性の健康市場規模推定と予測:流通経路別
10.7 欧州の女性の健康市場規模推定と予測:医薬品別
10.8 欧州の女性の健康市場規模推定と予測:タイプ別
10.9 ドイツの女性の健康市場分析
10.10 フランス女性の健康市場分析
10.11 イギリスの女性の健康市場分析
10.12 イタリアの女性の健康市場分析
10.13 スペインの女性の健康市場分析
10.14 ロシア女性の健康市場分析
10.15 ポーランド女性の健康市場分析
10.16 ベルギーの女性の健康市場分析
10.17 その他の欧州の女性の健康市場分析
11 アジア太平洋地域の女性の健康市場分析
11.1 主要な調査結果
11.2 アジア太平洋地域の女性の健康市場魅力度指数
11.3 アジア太平洋地域の女性の健康国別市場規模、2024年、2029年、2034年(US$ Billion)
11.4 アジア太平洋地域の女性の健康市場規模推定と予測:国別
11.5 アジア太平洋地域の女性の健康市場規模推定と予測:用途別
11.6 アジア太平洋地域の女性の健康市場規模推定と予測:流通経路別
11.7 アジア太平洋地域の女性の健康市場規模推定と予測:医薬品別
11.8 アジア太平洋地域の女性の健康市場規模推定と予測:タイプ別
11.9 日本の女性の健康市場分析
11.10 中国の女性の健康市場分析
11.11 インドの女性の健康市場分析
11.12 オーストラリアの女性の健康市場分析
11.13 韓国の女性の健康市場分析
11.14 シンガポールの女性の健康市場分析
11.15 台湾の女性の健康市場分析
11.16 その他のアジア太平洋地域の女性の健康市場分析
12 ラテンアメリカの女性の健康市場分析
12.1 主要な調査結果
12.2 ラテンアメリカの女性の健康市場魅力度指数
12.3 ラテンアメリカの女性の健康市場の国別市場規模、2024年、2029年、2034年(US$ Billion)
12.4 ラテンアメリカの女性の健康市場規模推定と予測:国別
12.5 ラテンアメリカの女性の健康市場規模推定と予測:用途別
12.6 ラテンアメリカの女性の健康市場規模推定と予測:流通経路別
12.7 ラテンアメリカの女性の健康市場規模推定と予測:医薬品別
12.8 ラテンアメリカの女性の健康市場規模推定と予測:タイプ別
12.9 ブラジルの女性の健康市場分析
12.10 メキシコ女性の健康市場分析
12.11 アルゼンチンの女性の健康市場の分析
12.12 コロンビアの女性の健康市場の分析
12.13 その他のラテンアメリカの女性の健康市場の分析
13 MEAの女性の健康市場分析
13.1 主要な調査結果
13.2 MEA女性の健康市場魅力度指数
13.3 MEAの女性の健康市場の国別市場規模(2024年、2029年、2034年)(US$ Billion
13.4 MEAの女性の健康市場規模推定と予測:国別
13.5 MEAの女性の健康市場規模推定と予測:用途別
13.6 MEAの女性の健康市場規模推定と予測:流通経路別
13.7 MEAの女性の健康市場規模推定と予測:医薬品別
13.8 MEAの女性の健康市場規模推定と予測:タイプ別
13.9 GCCの女性の健康市場分析
13.10 南アフリカの女性の健康市場分析
13.11 その他のMEAの女性の健康市場分析
14 主要企業のプロファイル
14.1 競争環境、2022年
14.2 戦略的展望のまとめ
14.3 Abbott Laboratories
14.3.1 会社概要
14.3.2 会社概要
14.3.3 財務分析
14.3.3.1 純収入(2017-2022年
14.3.3.2 売上高、2017-2022年
14.3.4 製品ベンチマーク
14.3.5 戦略的展望
14.4 Bayer AG
14.4.1 会社概要
14.4.2 会社概要
14.4.3 財務分析
14.4.3.1 純収入、2017-2022年
14.4.3.2 売上高、2017-2022年
14.4.3.3 地域市場シェア、2022年
14.4.4 製品ベンチマーク
14.4.5 戦略的展望
14.5 Caldera Medical Inc.
14.5.1 会社概要
14.5.2 会社概要
14.5.3 製品ベンチマーク
14.5.4 戦略的展望
14.6 Cardinal Health
14.6.1 会社概要
14.6.2 会社概要
14.6.3 財務分析
14.6.3.1 純収入、2017年~2023年
14.6.3.2 地域市場シェア、2023年
14.6.4 製品ベンチマーク
14.6.5 戦略的展望
14.7 Carestream Health
14.7.1 会社概要
14.7.2 会社概要
14.7.3 製品ベンチマーク
14.7.4 戦略的展望
14.8 Cooper Surgical Inc.
14.8.1 会社概要
14.8.2 会社概要
14.8.3 財務分析
14.8.3.1 純収入、2017-2023年
14.8.3.2 R&D、2017年~2023年
14.8.3.3 地域市場シェア、2023年
14.8.4 製品ベンチマーク
14.8.5 戦略的展望
14.9 L. Hoffman-La Roche Ltd.
14.9.1 会社概要
14.9.2 会社概要
14.9.3 財務分析
14.9.3.1 純収入、2017-2023年
14.9.3.2 売上高、2017-2023年
14.9.4 製品ベンチマーク
14.9.5 戦略的展望
14.10 General Electric Healthcare
14.10.1 会社概要
14.10.2 会社概要
14.10.3 財務分析
14.10.3.1 純収入、2017-2022年
14.10.3.2 R&D、2017年〜2022年
14.10.3.3 地域市場シェア、2022年
14.10.4 製品ベンチマーク
14.10.5 戦略的展望
14.11 Hologic Inc.
14.11.1 会社概要
14.11.2 会社概要
14.11.3 財務分析
14.11.3.1 純収入、2017-2023年
14.11.3.2 R&D、2017年〜2023年
14.11.3.3 地域市場シェア、2022年
14.11.4 製品ベンチマーク
14.11.5 戦略的展望
14.12 koninklijke philips n.v
14.12.1 会社概要
14.12.2 会社概要
14.12.3 財務分析
14.12.3.1 純収入、2017-2022年
14.12.3.2 売上高、2017年-2022年
14.12.4 製品ベンチマーク
14.12.5 戦略的展望
14.13 MedGyn Products Inc.
14.13.1 会社概要
14.13.2 会社概要
14.13.3 製品ベンチマーク
14.14 Medline Industries, Inc.
14.14.1 会社概要
14.14.2 会社概要
14.14.3 製品ベンチマーク
14.15 Prestige Consumer Healthcare Inc.
14.15.1 会社概要
14.15.2 会社概要
14.15.3 財務分析
14.15.3.1 純収入、2017-2022年
14.15.4 製品ベンチマーク
14.16 Siemens AG
14.16.1 会社概要
14.16.2 会社概要
14.16.3 財務分析
14.16.3.1 純収入(2017-2023年
14.16.3.2 R&D、2017年〜2023年
14.16.3.3 地域市場シェア、2023年
14.16.4 製品ベンチマーク
14.16.5 戦略的展望
15 結論と提言
15.1 Visiongainからの結びの言葉
15.2 市場プレイヤーへの提言
ページTOPに戻る
図表リスト
表の一覧
Table 1 Women’s Health Market Snapshot, 2024 & 2034 (US$ Billion, CAGR %)
Table 2 Women’s Health Market Forecast by Region, 2024-2034 (US$ Billion, AGR%, CAGR%): “V” Shaped Recovery
Table 3 Women’s Health Market Forecast by Region, 2024-2034 (US$ Billion, AGR%, CAGR%): “U” Shaped Recovery
Table 4 Women’s Health Market Forecast by Region, 2024-2034 (US$ Billion, AGR%, CAGR%): “W” Shaped Recovery
Table 5 Women’s Health Market Forecast by Region, 2024-2034 (US$ Billion, AGR%, CAGR%): “L” Shaped Recovery
Table 6 Women’s Health Market Forecast by Application, 2024-2034 (US$ Billion, AGR%, CAGR %)
Table 7 Contraceptives Market Forecast by Region, 2024-2034 (US$ Billion, AGR%, CAGR %)
Table 8 Postmenopausal Osteoporosis Market Forecast by Region, 2024-2034 (US$ Billion, AGR%, CAGR %)
Table 9 Hormonal Infertility Market Forecast by Region, 2024-2034 (US$ Billion, AGR%, CAGR%)
Table 10 Menopause Market Forecast by Region, 2024-2034 (US$ Billion, AGR%, CAGR%)
Table 11 Polycystic Ovary Syndrome Market Forecast by Region, 2024-2034 (US$ Billion, AGR%, CAGR%)
Table 12 Endometriosis and Uterine Fibroids Market Forecast by Region, 2024-2034 (US$ Billion, AGR%, CAGR%)
Table 13 Others Market Forecast by Region, 2024-2034 (US$ Billion, AGR%, CAGR%)
Table 14 Women’s Health Market Forecast by Distribution Channel, 2024-2034 (US$ Billion, AGR%, CAGR %)
Table 15 Hospital Pharmacies Market Forecast by Region, 2024-2034 (US$ Billion, AGR%, CAGR %)
Table 16 Retail Pharmacies Market Forecast by Region, 2024-2034 (US$ Billion, AGR%, CAGR %)
Table 17 Online Pharmacies Market Forecast by Region, 2024-2034 (US$ Billion, AGR%, CAGR%)
Table 18 Women’s Health Market Drugs, 2024-2034 (US$ Million, AGR%, CAGR%)
Table 19 Xgeva Market Forecast by Region, 2024-2034 (US$ Billion, AGR%, CAGR%)
Table 20 Prolia Market Forecast by Region, 2024-2034 (US$ Billion, AGR%, CAGR%)
Table 21 Mirena Market Forecast by Region, 2024-2034 (US$ Billion, AGR%, CAGR%)
Table 22 Nexplanon Market Forecast by Region, 2024-2034 (US$ Billion, AGR%, CAGR%)
Table 23 Forteo Market Forecast by Region, 2024-2034 (US$ Billion, AGR%, CAGR%)
Table 24 Nuvaring Market Forecast by Region, 2024-2034 (US$ Billion, AGR%, CAGR%)
Table 25 Premarin Market Forecast by Region, 2024-2034 (US$ Billion, AGR%, CAGR%)
Table 26 Lupron Market Forecast by Region, 2024-2034 (US$ Billion, AGR%, CAGR%)
Table 27 Lo Loestrin Market Forecast by Region, 2024-2034 (US$ Billion, AGR%, CAGR%)
Table 28 Orilissa/Oriahnn Market Forecast by Region, 2024-2034 (US$ Billion, AGR%, CAGR%)
Table 29 Others Market Forecast by Region, 2024-2034 (US$ Billion, AGR%, CAGR%)
Table 30 Women’s Health Market Type, 2024-2034 (US$ Billion, AGR%, CAGR%)
Table 31 Generic Market Forecast by Region, 2024-2034 (US$ Billion, AGR%, CAGR%)
Table 32 Branded Market Forecast by Region, 2024-2034 (US$ Billion, AGR%, CAGR%)
Table 33 Women’s Health Market Forecast by Region, 2024-2034 (US$ Billion, AGR%, CAGR%)
Table 34 North America Women’s Health Market Forecast by Country, 2024-2034 (US$ Billion, AGR%, CAGR %)
Table 35 North America Women’s Health Market Forecast by Application, 2024-2034 (US$ Billion, AGR%, CAGR %)
Table 36 North America Women’s Health Market Forecast by Distribution Channel, 2024-2034 (US$ Billion, AGR%, CAGR %)
Table 37 North America Women’s Health Market Drugs, 2024-2034 (US$ Billion, AGR%, CAGR%)
Table 38 North America Women’s Health Market Type, 2024-2034 (US$ Billion, AGR%, CAGR%)
Table 39 U.S. Women’s Health Market Forecast, 2024-2034 (US$ Billion, AGR%, CAGR%)
Table 40 Canada Women’s Health Market Forecast, 2024-2034 (US$ Billion, AGR%, CAGR %)
Table 41 Europe Women’s Health Market Forecast by Country, 2024-2034 (US$ Billion, AGR%, CAGR%)
Table 42 Europe Women’s Health Market Forecast by Application, 2024-2034 (US$ Billion, AGR%, CAGR %)
Table 43 Europe Women’s Health Market Forecast by Distribution Channel, 2024-2034 (US$ Billion, AGR%, CAGR %)
Table 44 Europe Women’s Health Market Drugs, 2024-2034 (US$ Million, AGR%, CAGR%)
Table 45 Europe Women’s Health Market Type, 2024-2034 (US$ Billion, AGR%, CAGR%)
Table 46 Germany Women’s Health Market Forecast, 2024-2034 (US$ Billion, AGR%, CAGR %)
Table 47 France Women’s Health Market Forecast, 2024-2034 (US$ Billion, AGR%, CAGR %)
Table 48 UK Women’s Health Market Forecast, 2024-2034 (US$ Billion, AGR%, CAGR%)
Table 49 Italy Women’s Health Market Forecast, 2024-2034 (US$ Billion, AGR%, CAGR %)
Table 50 Spain Women’s Health Market Forecast, 2024-2034 (US$ Billion, AGR%, CAGR%)
Table 51 Russia Women’s Health Market Forecast, 2024-2034 (US$ Billion, AGR%, CAGR%)
Table 52 Poland Women’s Health Market Forecast, 2024-2034 (US$ Billion, AGR%, CAGR%)
Table 53 Belgium Women’s Health Market Forecast, 2024-2034 (US$ Billion, AGR%, CAGR%)
Table 54 Rest of Europe Women’s Health Market Forecast, 2024-2034 (US$ Billion, AGR%, CAGR%)
Table 55 Asia Pacific Women’s Health Market Forecast by Country, 2024-2034 (US$ Billion, AGR%, CAGR%)
Table 56 Women’s Health Market Forecast by Application, 2024-2034 (US$ Billion, AGR%, CAGR %)
Table 57 Asia Pacific Women’s Health Market Forecast by Distribution Channel, 2024-2034 (US$ Billion, AGR%, CAGR %)
Table 58 Asia Pacific Women’s Health Market Drugs, 2024-2034 (US$ Million, AGR%, CAGR%)
Table 59 Asia Pacific Women’s Health Market Type, 2024-2034 (US$ Billion, AGR%, CAGR%)
Table 60 Japan Women’s Health Market Forecast, 2024-2034 (US$ Billion, AGR%, CAGR%)
Table 61 China Women’s Health Market Forecast, 2024-2034 (US$ Billion, AGR%, CAGR%)
Table 62 India Women’s Health Market Forecast, 2024-2034 (US$ Billion, AGR%, CAGR %)
Table 63 Australia Women’s Health Market Forecast, 2024-2034 (US$ Billion, AGR%, CAGR %)
Table 64 South Korea Women’s Health Market Forecast, 2024-2034 (US$ Billion, AGR%, CAGR%)
Table 65 Singapore Women’s Health Market Forecast, 2024-2034 (US$ Billion, AGR%, CAGR%)
Table 66 Taiwan Women’s Health Market Forecast, 2024-2034 (US$ Billion, AGR%, CAGR%)
Table 67 Rest of Asia Pacific Women’s Health Market Forecast, 2024-2034 (US$ Billion, AGR%, CAGR %)
Table 68 Latin America Women’s Health Market Forecast by Country, 2024-2034 (US$ Billion, AGR%, CAGR%)
Table 69 Latin America Women’s Health Market Forecast by Application, 2024-2034 (US$ Billion, AGR%, CAGR %)
Table 70 Latin America Women’s Health Market Forecast by Distribution Channel, 2024-2034 (US$ Billion, AGR%, CAGR %)
Table 71 Latin America Women’s Health Market Drugs, 2024-2034 (US$ Million, AGR%, CAGR%)
Table 72 Latin America Women’s Health Market Type, 2024-2034 (US$ Billion, AGR%, CAGR%)
Table 73 Brazil Women’s Health Market Forecast, 2024-2034 (US$ Billion, AGR%, CAGR %)
Table 74 Mexico Women’s Health Market Forecast, 2024-2034 (US$ Billion, AGR%, CAGR%)
Table 75 Argentina Women’s Health Market Forecast, 2024-2034 (US$ Billion, AGR%, CAGR%)
Table 76 Colombia Women’s Health Market Forecast, 2024-2034 (US$ Billion, AGR%, CAGR%)
Table 77 Rest of Latin America Women’s Health Market Forecast, 2024-2034 (US$ Billion, AGR%, CAGR%)
Table 78 MEA Women’s Health Market Forecast by Country, 2024-2034 (US$ Billion, AGR%, CAGR%)
Table 79 MEA Women’s Health Market Forecast by Application, 2024-2034 (US$ Billion, AGR%, CAGR %)
Table 80 MEA Women’s Health Market Forecast by Distribution Channel, 2024-2034 (US$ Billion, AGR%, CAGR %)
Table 81 MEA Women’s Health Market by Drugs, 2024-2034 (US$ Billion, AGR%, CAGR%)
Table 82 MEA Women’s Health Market by Type, 2024-2034 (US$ Billion, AGR%, CAGR%)
Table 83 GCC Women’s Health Market Forecast, 2024-2034 (US$ Billion, AGR%, CAGR%)
Table 84 South Africa Women’s Health Market Forecast, 2024-2034 (US$ Billion, AGR%, CAGR%)
Table 85 Rest of MEA Women’s Health Market Forecast, 2024-2034 (US$ Billion, AGR%, CAGR %)
Table 86 Strategic Outlook
Table 87 Abbott Laboratories: Key Details, (CEO, HQ, Revenue, Founded, No. of Employees, Company Type, Website, Business Segment)
Table 88 Abbott Laboratories: Product Benchmarking
Table 89 Abbott Laboratories: Strategic Outlook
Table 90 Bayer AG: Key Details, (CEO, HQ, Revenue, Founded, No. of Employees, Company Type, Website, Business Segment)
Table 91 Bayer AG: Product Benchmarking
Table 92 Bayer AG: Strategic Outlook
Table 93 Caldera Medical Inc: Key Details, (CEO, HQ, Revenue, Founded, No. of Employees, Company Type, Website, Business Segment)
Table 94 Caldera Medical Inc: Product Benchmarking
Table 95 Caldera Medical Inc: Strategic Outlook
Table 96 Cardinal Health: Key Details, (CEO, HQ, Revenue, Founded, No. of Employees, Company Type, Website, Business Segment)
Table 97 Cardinal Health: Product Benchmarking
Table 98 Cardinal Health: Strategic Outlook
Table 99 Carestream health: Key Details, (CEO, HQ, Revenue, Founded, No. of Employees, Company Type, Website, Business Segment)
Table 100 Carestream Health: Product Benchmarking
Table 101 Carestream Health: Strategic Outlook
Table 102 Cooper Surgical Inc.: Key Details, (CEO, HQ, Revenue, Founded, No. of Employees, Company Type, Website, Business Segment)
Table 103 Cooper Surgical, Inc.: Product Benchmarking
Table 104 Cooper Surgical, Inc.: Strategic Outlook
Table 105 L. Hoffman-La Roche Ltd.: Key Details, (CEO, HQ, Revenue, Founded, No. of Employees, Company Type, Website, Business Segment)
Table 106 L. Hoffman-La Roche Ltd.: Product Benchmarking
Table 107 Debiotech SA: Strategic Outlook
Table 108 General Electric Healthcare: Key Details, (CEO, HQ, Revenue, Founded, No. of Employees, Company Type, Website, Business Segment)
Table 109 General Electric Healthcare: Product Benchmarking
Table 110 General Electric Healthcare: Strategic Outlook
Table 111 Hologic Inc: Key Details, (CEO, HQ, Revenue, Founded, No. of Employees, Company Type, Website, Business Segment)
Table 112 Hologic Inc: Product Benchmarking
Table 113 Hologic Inc.: Strategic Outlook
Table 114 koninklijke philips n.v: Key Details, (CEO, HQ, Revenue, Founded, No. of Employees, Company Type, Website, Business Segment)
Table 115 Koninklijke Philips N.V: Product Benchmarking
Table 116 Koninklijke Philips N.V: Strategic Outlook
Table 117 MedGyn Products Inc.: Key Details, (CEO, HQ, Revenue, Founded, No. of Employees, Company Type, Website, Business Segment)
Table 118 MedGyn Products, Inc.: Product Benchmarking
Table 119 Medline Industries, Inc.: Key Details, (CEO, HQ, Revenue, Founded, No. of Employees, Company Type, Website, Business Segment)
Table 120 Medline Industries Inc: Product Benchmarking
Table 121 Prestige Consumer Healthcare, Inc.: Key Details, (CEO, HQ, Revenue, Founded, No. of Employees, Company Type, Website, Business Segment)
Table 122 Prestige Consumer Healthcare Inc.: Product Benchmarking
Table 123 Siemens AG: Key Details, (CEO, HQ, Revenue, Founded, No. of Employees, Company Type, Website, Business Segment)
Table 124 Siemens AG: Product Benchmarking
Table 125 Siemens AG: Strategic Outlook
図の一覧
Figure 1 Women’s Health Market Segmentation
Figure 2 Women’s Health Market by Application: Market Attractiveness Index
Figure 3 Women’s Health Market by Distribution Channel: Market Attractiveness Index
Figure 4 Women’s Health Market by Drugs: Market Attractiveness Index
Figure 5 Women’s Health Market by Type: Market Attractiveness Index
Figure 6 Women’s Health Market Attractiveness Index by Region
Figure 7 Women’s Health Market: Market Dynamics
Figure 8 Women’s Health Market by Region, 2024-2034 (US$ Billion, AGR %): “V” Shaped Recovery
Figure 9 Women’s Health Market by Region, 2024-2034 (US$ Billion, AGR %): “U” Shaped Recovery
Figure 10 Women’s Health Market by Region, 2024-2034 (US$ Billion, AGR %): “W” Shaped Recovery
Figure 11 Women’s Health Market by Region, 2024-2034 (US$ Billion, AGR %): “L” Shaped Recovery
Figure 12 Women’s Health Market: Porter’s Five Forces Analysis
Figure 13 Women’s Health Market: PEST Analysis
Figure 14 Women’s Health Market by Application: Market Attractiveness Index
Figure 15 Women’s Health Market Forecast by Application, 2024-2034 (US$ Billion, AGR %)
Figure 16 Women’s Health Market Share Forecast by Application, 2024, 2029, 2034 (%)
Figure 17 Contraceptives Market Forecast by Region, 2024-2034 (US$ Billion, AGR %)
Figure 18 Contraceptives Market Share Forecast by Region, 2024 & 2034 (%)
Figure 19 Postmenopausal Osteoporosis Market Forecast by Region, 2024-2034 (US$ Billion, AGR %)
Figure 20 Postmenopausal Osteoporosis Market Share Forecast by Region, 2024 & 2034 (%)
Figure 21 Hormonal Infertility Market Forecast by Region, 2024-2034 (US$ Billion, AGR %)
Figure 22 Hormonal Infertility Market Share Forecast by Region, 2024 & 2034 (%)
Figure 23 Menopause Market Forecast by Region, 2024-2034 (US$ Billion, AGR %)
Figure 24 Menopause Market Share Forecast by Region, 2024 & 2034 (%)
Figure 25 Polycystic Ovary Syndrome Market Forecast by Region, 2024-2034 (US$ Billion, AGR %)
Figure 26 Polycystic Ovary Syndrome Market Share Forecast by Region, 2024 & 2034 (%)
Figure 27 Endometriosis and Uterine Fibroids Market Forecast by Region, 2024-2034 (US$ Billion, AGR %)
Figure 28 Endometriosis and Uterine Fibroids Market Share Forecast by Region, 2024 & 2034 (%)
Figure 29 Others Market Forecast by Region, 2024-2034 (US$ Billion, AGR %)
Figure 30 Others Market Share Forecast by Region, 2024 & 2034 (%)
Figure 31 Women’s Health Market by Distribution Channel: Market Attractiveness Index
Figure 32 Women’s Health Market Forecast by Distribution Channel, 2024-2034 (US$ Billion, AGR %)
Figure 33 Women’s Health Market Share Forecast by Application, 2024, 2029, 2034 (%)
Figure 34 Hospital Pharmacies Market Forecast by Region, 2024-2034 (US$ Billion, AGR %)
Figure 35 Hospital Pharmacies Market Share Forecast by Region, 2024 & 2034 (%)
Figure 36 Retail Pharmacies Market Forecast by Region, 2024-2034 (US$ Billion, AGR %)
Figure 37 Retail Pharmacies Market Share Forecast by Region, 2024 & 2034 (%)
Figure 38 Online Pharmacies Market Forecast by Region, 2024-2034 (US$ Billion, AGR %)
Figure 39 Online Pharmacies Market Share Forecast by Region, 2024 & 2034 (%)
Figure 40 Women’s Health Market by Drugs: Market Attractiveness Index
Figure 41 Women’s Health Market Forecast by Drugs, 2024-2034 (US$ Billion, AGR %)
Figure 42 Women’s Health Market Share Forecast by Application, 2024, 2029, 2034 (%)
Figure 43 Xgeva Segment Market Forecast by Region, 2024-2034 (US$ Billion, AGR %)
Figure 44 Xgeva Segment Market Share Forecast by Region, 2024 & 2034 (%)
Figure 45 Prolia Market Forecast by Region, 2024-2034 (US$ Billion, AGR %)
Figure 46 Prolia Market Share Forecast by Region, 2024 & 2034 (%)
Figure 47 Mirena Market Forecast by Region, 2024-2034 (US$ Billion, AGR %)
Figure 48 Mirena Market Share Forecast by Region, 2024 & 2034 (%)
Figure 49 Nexplanon Market Forecast by Region, 2024-2034 (US$ Billion, AGR %)
Figure 50 Nexplanon Market Share Forecast by Region, 2024 & 2034 (%)
Figure 51 Forteo Market Forecast by Region, 2024-2034 (US$ Billion, AGR %)
Figure 52 Forteo Market Share Forecast by Region, 2024 & 2034 (%)
Figure 53 Nuvaring Market Forecast by Region, 2024-2034 (US$ Billion, AGR %)
Figure 54 Nuvaring Market Share Forecast by Region, 2024 & 2034 (%)
Figure 55 Premarin Market Forecast by Region, 2024-2034 (US$ Billion, AGR %)
Figure 56 Premarin Market Share Forecast by Region, 2024 & 2034 (%)
Figure 57 Lupron Market Forecast by Region, 2024-2034 (US$ Billion, AGR %)
Figure 58 Lupron Market Share Forecast by Region, 2024 & 2034 (%)
Figure 59 Lo Loestrin Market Forecast by Region, 2024-2034 (US$ Billion, AGR %)
Figure 60 Lo Loestrin Market Share Forecast by Region, 2024 & 2034 (%)
Figure 61 Orilissa/Oriahnn Market Forecast by Region, 2024-2034 (US$ Billion, AGR %)
Figure 62 Orilissa/Oriahnn Market Share Forecast by Region, 2024 & 2034 (%)
Figure 63 Others Market Forecast by Region, 2024-2034 (US$ Billion, AGR %)
Figure 64 Others Market Share Forecast by Region, 2024 & 2034 (%)
Figure 65 Women’s Health Market by Type: Market Attractiveness Index
Figure 66 Women’s Health Market Forecast by Type, 2024-2034 (US$ Billion, AGR %)
Figure 67 Women’s Health Market Share Forecast by Type 2024, 2029, 2034 (%)
Figure 68 Generic Segment Market Forecast by Region, 2024-2034 (US$ Billion, AGR %)
Figure 69 Generic Segment Market Share Forecast by Region, 2024 & 2034 (%)
Figure 70 Branded Market Forecast by Region, 2024-2034 (US$ Billion, AGR %)
Figure 71 Branded Market Share Forecast by Region, 2024 & 2034 (%)
Figure 72 Women’s Health Market Forecast by Region 2024 and 2034 (Revenue, CAGR %)
Figure 73 Women’s Health Market Share Forecast by Region 2024, 2029, 2034 (%)
Figure 74 Women’s Health Market by Region, 2024-2034 (US$ Billion, AGR %)
Figure 75 North America Women’s Health Market Attractiveness Index
Figure 76 North America Women’s Health Market by Region, 2024, 2029 & 2034 (US$ Billion)
Figure 77 North America Women’s Health Market Forecast by Country, 2024-2034 (US$ Billion, AGR %)
Figure 78 North America Women’s Health Market Share Forecast by Country, 2024 & 2034 (%)
Figure 79 North America Women’s Health Market Forecast by Application, 2024-2034 (US$ Billion, AGR %)
Figure 80 North America Women’s Health Market Share Forecast by Application, 2024 & 2034 (%)
Figure 81 North America Women’s Health Market Forecast by Distribution Channel, 2024-2034 (US$ Billion, AGR %)
Figure 82 North America Women’s Health Market Share Forecast by Distribution Channel, 2024 & 2034 (%)
Figure 83 North America Women’s Health Market Forecast by Drugs, 2024-2034 (US$ Billion, AGR %)
Figure 84 North America Women’s Health Market Share Forecast by Drugs, 2024 & 2034 (%)
Figure 85 North America Women’s Health Market Forecast by Type, 2024-2034 (US$ Billion, AGR %)
Figure 86 North America Women’s Health Market Share Forecast by Type, 2024 & 2034 (%)
Figure 87 U.S. Women’s Health Market Forecast, 2024-2034 (US$ Billion, AGR %)
Figure 88 Canada Women’s Health Market Forecast, 2024-2034 (US$ Billion, AGR %)
Figure 89 Europe Women’s Health Market Attractiveness Index
Figure 90 Europe Women’s Health Market by Region, 2024, 2029 & 2034 (US$ Billion)
Figure 91 Europe Women’s Health Market Forecast by Country, 2024-2034 (US$ Billion, AGR %)
Figure 92 Europe Women’s Health Market Share Forecast by Country, 2024 & 2034 (%)
Figure 93 Europe Women’s Health Market Forecast by Application, 2024-2034 (US$ Billion, AGR %)
Figure 94 Europe Women’s Health Market Share Forecast by Application, 2024 & 2034 (%)
Figure 95 Europe Women’s Health Market Forecast by Distribution Channel, 2024-2034 (US$ Billion, AGR %)
Figure 96 Europe Women’s Health Market Share Forecast by Distribution Channel, 2024 & 2034 (%)
Figure 97 Europe Women’s Health Market Forecast by Drugs, 2024-2034 (US$ Billion, AGR %)
Figure 98 Europe Women’s Health Market Share Forecast by Drugs, 2024 & 2034 (%)
Figure 99 Europe Women’s Health Market Forecast by Type, 2024-2034 (US$ Billion, AGR %)
Figure 100 Europe Women’s Health Market Share Forecast by Type, 2024 & 2034 (%)
Figure 101 Germany Women’s Health Market Forecast, 2024-2034 (US$ Billion, AGR %)
Figure 102 France Women’s Health Market Forecast, 2024-2034 (US$ Billion, AGR %)
Figure 103 UK Women’s Health Market Forecast, 2024-2034 (US$ Billion, AGR %)
Figure 104 Italy Women’s Health Market Forecast, 2024-2034 (US$ Billion, AGR %)
Figure 105 Spain Women’s Health Market Forecast, 2024-2034 (US$ Billion, AGR %)
Figure 106 Russia Women’s Health Market Forecast, 2024-2034 (US$ Billion, AGR %)
Figure 107 Poland Women’s Health Market Forecast, 2024-2034 (US$ Billion, AGR %)
Figure 108 Belgium Women’s Health Market Forecast, 2024-2034 (US$ Billion, AGR %)
Figure 109 Rest of Europe Women’s Health Market Forecast, 2024-2034 (US$ Billion, AGR %)
Figure 110 Asia Pacific Women’s Health Market Attractiveness Index
Figure 111 Asia Pacific Women’s Health Market by Country, 2024, 2029 & 2034 (US$ Billion)
Figure 112 Asia Pacific Women’s Health Market Forecast by Country, 2024-2034 (US$ Billion, AGR %)
Figure 113 Asia Pacific Women’s Health Market Share Forecast by Country, 2024 & 2034 (%)
Figure 114 Asia Pacific Women’s Health Market Forecast by Application, 2024-2034 (US$ Billion, AGR %)
Figure 115 Asia Pacific Women’s Health Market Share Forecast by Application, 2024 & 2034 (%)
Figure 116 Asia Pacific Women’s Health Market Forecast by Distribution Channel, 2024-2034 (US$ Billion, AGR %)
Figure 117 Asia Pacific Women’s Health Market Share Forecast by Distribution Channel, 2024 & 2034 (%)
Figure 118 Asia Pacific Women’s Health Market Forecast by Drugs, 2024-2034 (US$ Billion, AGR %)
Figure 119 Asia Pacific Women’s Health Market Share Forecast by Drugs, 2024 & 2034 (%)
Figure 120 Asia Pacific Women’s Health Market Forecast by Type, 2024-2034 (US$ Billion, AGR %)
Figure 121 Asia Pacific Women’s Health Market Share Forecast by Type, 2024 & 2034 (%)
Figure 122 Japan Women’s Health Market Forecast, 2024-2034 (US$ Billion, AGR %)
Figure 123 China Women’s Health Market Forecast, 2024-2034 (US$ Billion, AGR %)
Figure 124 India Women’s Health Market Forecast, 2024-2034 (US$ Billion, AGR %)
Figure 125 Australia Women’s Health Market Forecast, 2024-2034 (US$ Billion, AGR %)
Figure 126 South Korea Women’s Health Market Forecast, 2024-2034 (US$ Billion, AGR %)
Figure 127 Singapore Women’s Health Market Forecast, 2024-2034 (US$ Billion, AGR %)
Figure 128 Taiwan Women’s Health Market Forecast, 2024-2034 (US$ Billion, AGR %)
Figure 129 Rest of Asia Pacific Women’s Health Market Forecast, 2024-2034 (US$ Billion, AGR %)
Figure 130 Latin America Women’s Health Market Attractiveness Index
Figure 131 Latin America Women’s Health Market by Region, 2024, 2029 & 2034 (US$ Billion)
Figure 132 Latin America Women’s Health Market Forecast by Country, 2024-2034 (US$ Billion, AGR %)
Figure 133 Latin America Women’s Health Market Share Forecast by Country, 2024 & 2034 (%)
Figure 134 Latin America Women’s Health Market Forecast by Application, 2024-2034 (US$ Billion, AGR %)
Figure 135 Latin America Women’s Health Market Share Forecast by Application, 2024 & 2034 (%)
Figure 136 Latin America Women’s Health Market Forecast by Distribution Channel, 2024-2034 (US$ Billion, AGR %)
Figure 137 Latin America Women’s Health Market Share Forecast by Distribution Channel, 2024 & 2034 (%)
Figure 138 Latin America Women’s Health Market Forecast by Drugs, 2024-2034 (US$ Billion, AGR %)
Figure 139 Latin America Women’s Health Market Share Forecast by Drugs, 2024 & 2034 (%)
Figure 140 Latin America Women’s Health Market Forecast by Type, 2024-2034 (US$ Billion, AGR %)
Figure 141 Latin America Women’s Health Market Share Forecast by Type, 2024 & 2034 (%)
Figure 142 Brazil Women’s Health Market Forecast, 2024-2034 (US$ Billion, AGR %)
Figure 143 Mexico Women’s Health Market Forecast, 2024-2034 (US$ Billion, AGR %)
Figure 144 Argentina Women’s Health Market Forecast, 2024-2034 (US$ Billion, AGR %)
Figure 145 Colombia Women’s Health Market Forecast, 2024-2034 (US$ Billion, AGR %)
Figure 146 Rest of Latin America Women’s Health Market Forecast, 2024-2034 (US$ Billion, AGR %)
Figure 147 MEA Women’s Health Market Attractiveness Index
Figure 148 MEA Women’s Health Market by Region, 2024, 2029 & 2034 (US$ Billion)
Figure 149 MEA Women’s Health Market Forecast by Country, 2024-2034 (US$ Billion, AGR %)
Figure 150 MEA Women’s Health Market Share Forecast by Country, 2024 & 2034 (%)
Figure 151 MEA Women’s Health Market Forecast by Application, 2024-2034 (US$ Billion, AGR %)
Figure 152 MEA Women’s Health Market Share Forecast by Application, 2024 & 2034 (%)
Figure 153 MEA Women’s Health Market Forecast by Distribution Channel, 2024-2034 (US$ Billion, AGR %)
Figure 154 MEA Women’s Health Market Share Forecast by Distribution Channel, 2024 & 2034 (%)
Figure 155 MEA Women’s Health Market Forecast by Drugs, 2024-2034 (US$ Billion, AGR %)
Figure 156 MEA Women’s Health Market Share Forecast by Drugs, 2024 & 2034 (%)
Figure 157 MEA Women’s Health Market Forecast by Type, 2024-2034 (US$ Billion, AGR %)
Figure 158 MEA Women’s Health Market Share Forecast by Type, 2024 & 2034 (%)
Figure 159 GCC Women’s Health Market Forecast, 2024-2034 (US$ Billion, AGR %)
Figure 160 South Africa Women’s Health Market Forecast, 2024-2034 (US$ Billion, AGR %)
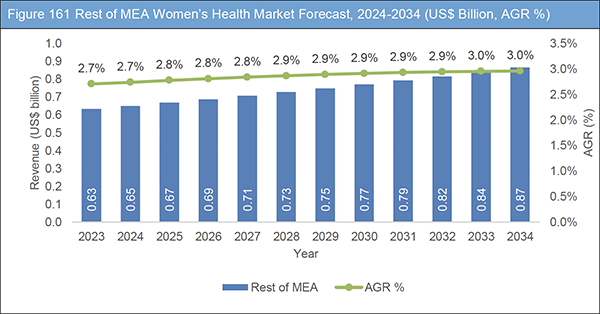
Figure 161 Rest of MEA Women’s Health Market Forecast, 2024-2034 (US$ Billion, AGR %)
Figure 162 Women Health Market Company Share, 2022
Figure 163 Abbott Laboratories: Net Revenue, 2017-2022 (US$ Million, AGR%)
Figure 164 Abbott Laboratories: R&D, 2017-2022 (US$ Million, AGR%)
Figure 165 Bayer AG: Net Revenue, 2017-2022 (US$ Million, AGR%)
Figure 166 Bayer AG : R&D, 2017-2022 (US$ Million, AGR%)
Figure 167 Bayer AG: Regional Market Shares, 2022
Figure 168 Cardinal Health: Net Revenue, 2017-2023 (US$ Million, AGR%)
Figure 169 Cardinal Health: Regional Market Shares, 2023
Figure 170 Cooper Surgical, Inc.: Net Revenue, 2017-2023 (US$ Million, AGR%)
Figure 171 Cooper Surgical, Inc.: R&D, 2017-2023 (US$ Million, AGR%)
Figure 172 Cooper Surgical, Inc.: Regional Market Shares, 2023
Figure 173 L. Hoffman-La Roche Ltd.: Net Revenue, 2017-2023 (US$ Million, AGR%)
Figure 174 L. Hoffman-La Roche Ltd.: R&D, 2017-2023 (US$ Million, AGR%)
Figure 175 General Electric Healthcare: Net Revenue, 2017-2022 (US$ Million, AGR%)
Figure 176 General Electric Healthcare: R&D, 2017-2022 (US$ Million, AGR%)
Figure 177 General Electric Healthcare: Regional Market Shares, 2022
Figure 178 Hologic Inc.: Net Revenue, 2017-2023 (US$ Million, AGR%)
Figure 179 Hologic Inc: R&D, 2017-2023 (US$ Million, AGR%)
Figure 180 Hologic Inc: Regional Market Shares, 2022
Figure 181 Koninklijke Philips N.V: Net Revenue, 2017-2022 (US$ Million, AGR%)
Figure 182 Koninklijke Philips N.V: R&D, 2017-2022 (US$ Million, AGR%)
Figure 183 Prestige Consumer Healthcare Inc.: Net Revenue, 2017-2022 (US$ Million, AGR%)
Figure 184 Siemens AG: Net Revenue, 2017-2023 (US$ Million, AGR%)
Figure 185 Siemens AG: R&D, 2017-2023 (US$ Million, AGR%)
Figure 186 Siemens AG: Regional Market Shares, 2023
ページTOPに戻る
Summary
Report Details
The Women’s Health Market Report 2024-2034: This report will prove invaluable to leading firms striving for new revenue pockets if they wish to better understand the industry and its underlying dynamics. It will be useful for companies that would like to expand into different industries or to expand their existing operations in a new region.
Growing awareness about women’s health issues
The women’s health market is experiencing significant growth due to increasing awareness about women’s health issues. This growth is driven by various factors such as rising healthcare expenditures, advancements in medical technology, and a greater focus on preventive care. There is a growing demand for products and services addressing women’s unique health needs, including reproductive health, maternal health, breast health, menopause management, and sexual health. Additionally, initiatives promoting women’s health education and advocacy have contributed to a greater understanding of gender-specific health concerns and the importance of early detection and treatment. The women’s health market is expected to continue expanding, offering opportunities for innovation and improved healthcare outcomes for women worldwide.
Technological advancements in patient care
Technological advancements are rapidly reshaping the landscape of the women’s health market, ushering in a new era of innovation and improved patient care. From sophisticated diagnostic tools to cutting-edge treatment modalities, these advancements are revolutionizing the way women’s health conditions are diagnosed, managed, and treated. Advanced imaging techniques, such as 3D mammography and MRI, offer greater accuracy in detecting breast cancer at its earliest stages, improving survival rates and reducing the need for invasive procedures. Minimally invasive surgical techniques, including laparoscopy and robotic-assisted surgery, are providing safer and more effective options for addressing gynaecological conditions like endometriosis and fibroids. Moreover, digital health solutions such as mobile apps, wearable devices, and telemedicine platforms are empowering women to take charge of their health by providing convenient access to information, monitoring tools, and virtual consultations with healthcare providers. These technological innovations hold immense promise for enhancing women’s health outcomes, driving market growth, and advancing the overall quality of care in the field of women’s health.
What Questions Should You Ask before Buying a Market Research Report?
-
How is the Women’s Health Market evolving?
-
What is driving and restraining the Women’s Health Market?
-
How will each Women’s Health submarket segment grow over the forecast period and how much revenue will these submarkets account for in 2034?
-
How will the market shares for each Women’s Health submarket develop from 2024 to 2034?
-
What will be the main driver for the overall market from 2024 to 2034?
-
Will leading Women’s Health Markets broadly follow the macroeconomic dynamics, or will individual national markets outperform others?
-
How will the market shares of the national markets change by 2034 and which geographical region will lead the market in 2034?
-
Who are the leading players and what are their prospects over the forecast period?
-
What are the Women’s Health projects for these leading companies?
-
How will the industry evolve during the period between 2024 and 2034? What are the implications of Women’s Health projects taking place now and over the next 10 years?
-
Is there a greater need for product commercialisation to further scale the Women’s Health Market?
-
Where is the Women’s Health Market heading and how can you ensure you are at the forefront of the market?
-
What are the best investment options for new product and service lines?
-
What are the key prospects for moving companies into a new growth path and C-suite?
You need to discover how this will impact the Women’s Health Market today, and over the next 10 years:
-
Our 351-page report provides 125 tables and 186 charts/graphs exclusively to you.
-
The report highlights key lucrative areas in the industry so you can target them – NOW.
-
It contains in-depth analysis of global, regional and national sales and growth.
-
It highlights for you the key successful trends, changes and revenue projections made by your competitors.
This report tells you TODAY how the Women’s Health Market will develop in the next 10 years, and in line with the variations in COVID-19 economic recession and bounce. This market is more critical now than at any point over the last 10 years.
Forecasts to 2034 and other analyses reveal commercial prospects
-
In addition to revenue forecasting to 2034, our new study provides you with recent results, growth rates, and market shares.
-
You will find original analyses, with business outlooks and developments.
-
Discover qualitative analyses (including market dynamics, drivers, opportunities, restraints and challenges), cost structure, impact of rising Women’s Health prices and recent developments.
This report includes data analysis and invaluable insight into how COVID-19 will affect the industry and your company. Four COVID-19 recovery patterns and their impact, namely, “V”, “L”, “W” and “U” are discussed in this report.
Segments Covered in the Report
By Application
-
Contraceptives
-
Postmenopausal osteoporosis
-
Hormonal infertility
-
Menopause
-
Polycystic Ovary Syndrome
-
Endometriosis and Uterine Fibroids
-
Others
By Distribution Channel
-
Hospital Pharmacies
-
Retail Pharmacies
-
Online Pharmacies
By Drugs
-
Prolia
-
Xgeva
-
Mirena
-
Nexplanon
-
Forteo
-
Nuvaring
-
Premarin
-
Lupron
-
Lo Loestrin
-
Orilissa/Oriahnn
-
Others
By Type
In addition to the revenue predictions for the overall world market and segments, you will also find revenue forecasts for four regional and 20 leading national markets:
North America
Europe
-
Germany
-
UK
-
France
-
Spain
-
Italy
-
Rest of Europe
Asia Pacific
-
China
-
Japan
-
India
-
Australia
-
South Korea
-
Rest of Asia Pacific
Latin America
-
Brazil
-
Mexico
-
Rest of Latin America Latin America
MEA
-
GCC
-
South Africa
-
Rest of MEA
The report also includes profiles and for some of the leading companies in the Women’s Health Market, 2024 to 2034, with a focus on this segment of these companies’ operations.
Leading companies profiled in the report
-
Abbott
-
Bayer AG
-
Caldera Medical
-
Cardinal Health
-
Carestream
-
Cooper Surgical Inc.
-
L. Hoffman-La Roche Ltd.
-
GE Healthcare
-
Hologic
-
Koninklijke Philips N.V
-
MedGyn Products
-
Medline Industries, Inc.
-
Prestige Consumer Healthcare, Inc.
-
Siemens AG
Overall world revenue for Women’s Health Market, 2024 to 2034 in terms of value the market will surpass US$ 61.0 billion in 2034, our work calculates. We predict strong revenue growth through to 2034. Our work identifies which organizations hold the greatest potential. Discover their capabilities, progress, and commercial prospects, helping you stay ahead.
H ow will the Women’s Health Market, 2024 to 2034 report help you?
In summary, our 350+ page report provides you with the following knowledge:
-
Revenue forecasts to 2034 for Women’s Health Market, 2024 to 2034 Market, with forecasts for material, design, type, delivery and application, each forecast at a global and regional level – discover the industry’s prospects, finding the most lucrative places for investments and revenues.
-
Revenue forecasts to 2034 for five regional and 16 key national markets – See forecasts for the Women’s Health Market, 2024 to 2034 market in North America, Europe, Asia-Pacific, Latin America, and MEA. Also forecasted is the market in the US, Canada, Mexico, Brazil, Germany, France, UK, Italy, China, India, Japan, and Australia among other prominent economies.
-
Prospects for established firms and those seeking to enter the market – including company profiles for 14 of the major companies involved in the Women’s Health Market, 2024 to 2034.
Find quantitative and qualitative analyses with independent predictions. Receive information that only our report contains, staying informed with invaluable business intelligence.
Information found nowhere else
With our new report, you are less likely to fall behind in knowledge or miss out on opportunities. See how our work could benefit your research, analyses, and decisions. Visiongain’s study is for everybody needing commercial analyses for the Women’s Health Market, 2024 to 2034, market-leading companies. You will find data, trends and predictions.
ページTOPに戻る
Table of Contents
Table of Contents
1 Report Overview
1.1 Objectives of the Study
1.2 Introduction to Women’s Health Market
1.3 What This Report Delivers
1.4 Why You Should Read This Report
1.5 Key Questions Answered by This Analytical Report
1.6 Who is This Report for?
1.7 Methodology
1.7.1 Market Definitions
1.7.2 Market Evaluation & Forecasting Methodology
1.7.3 Data Validation
1.7.3.1 Primary Research
1.7.3.2 Secondary Research
1.8 Frequently Asked Questions (FAQs)
1.9 Associated Visiongain Reports
1.10 About Visiongain
2 Executive Summary
3 Market Overview
3.1 Key Findings
3.2 Market Dynamics
3.2.1 Market Driving Factors
3.2.1.1 Heightened Attention Towards Emerging Economies
3.2.1.2 Escalated Innovation Targeting New Therapeutic Solutions
3.2.1.3 Expanded Investments in Technology to Enhance Patient Satisfaction
3.2.2 Market Restraining Factors
3.2.2.1 Elevated Pricing Poses a Constraint on Market Expansion
3.2.2.2 Increased Collaboration for the Development of Advanced Healthcare Infrastructure
3.2.3 Market Opportunities
3.2.3.1 Expansion of Preventative Care Services Tailored to Women's Unique Health Needs.
3.2.3.2 Improving Digital Health Platforms to Enhance the Access to Healthcare Services for Women, Particularly in Underserved Areas.
3.2.3.3 Technological Advancements in Reproductive Health Services, Including Family Planning, Fertility Management, and Maternal Care
3.3 COVID-19 Impact Analysis
3.4 Porter’s Five Forces Analysis
3.4.1 Bargaining Power of Suppliers
3.4.2 Bargaining Power of Buyers
3.4.3 Competitive Rivalry
3.4.4 Threat from Substitutes
3.4.5 Threat of New Entrants
3.5 PEST Analysis
4 Women’s Health Market Analysis by Application
4.1 Key Findings
4.2 Application Segment: Market Attractiveness Index
4.3 Women’s Health Market Size Estimation and Forecast by Application
4.4 Contraceptives
4.4.1 Market Size by Region, 2024-2034 (US$ Billion)
4.4.2 Market Share by Region, 2024 & 2034 (%)
4.5 Postmenopausal Osteoporosis
4.5.1 Market Size by Region, 2024-2034 (US$ Billion)
4.5.2 Market Share by Region, 2024 & 2034 (%)
4.6 Hormonal Infertility
4.6.1 Market Size by Region, 2024-2034 (US$ Billion)
4.6.2 Market Share by Region, 2024 & 2034 (%)
4.7 Menopause
4.7.1 Market Size by Region, 2024-2034 (US$ Billion)
4.7.2 Market Share by Region, 2024 & 2034 (%)
4.8 Polycystic Ovary Syndrome
4.8.1 Market Size by Region, 2024-2034 (US$ Billion)
4.8.2 Market Share by Region, 2024 & 2034 (%)
4.9 Endometriosis and Uterine Fibroids
4.9.1 Market Size by Region, 2024-2034 (US$ Billion)
4.9.2 Market Share by Region, 2024 & 2034 (%)
4.10 Others
4.10.1 Market Size by Region, 2024-2034 (US$ Billion)
4.10.2 Market Share by Region, 2024 & 2034 (%)
5 Women’s Health Market Analysis by Distribution Channel
5.1 Key Findings
5.2 Application Segment: Market Attractiveness Index
5.3 Women’s Health Market Size Estimation and Forecast by Distribution Channel
5.4 Hospital Pharmacies
5.4.1 Market Size by Region, 2024-2034 (US$ Billion)
5.4.2 Market Share by Region, 2024 & 2034 (%)
5.5 Retail Pharmacies
5.5.1 Market Size by Region, 2024-2034 (US$ Billion)
5.5.2 Market Share by Region, 2024 & 2034 (%)
5.6 Online Pharmacies
5.6.1 Market Size by Region, 2024-2034 (US$ Billion)
5.6.2 Market Share by Region, 2024 & 2034 (%)
6 Women’s Health Market Analysis by Drugs
6.1 Key Findings
6.2 Application Segment: Market Attractiveness Index
6.3 Women’s Health Market Size Estimation and Forecast by Drugs
6.4 Xgeva
6.4.1 Market Size by Region, 2024-2034 (US$ Billion)
6.4.2 Market Share by Region, 2024 & 2034 (%)
6.5 Prolia
6.5.1 Market Size by Region, 2024-2034 (US$ Billion)
6.5.2 Market Share by Region, 2024 & 2034 (%)
6.6 Mirena
6.6.1 Market Size by Region, 2024-2034 (US$ Billion)
6.6.2 Market Share by Region, 2024 & 2034 (%)
6.7 Nexplanon
6.7.1 Market Size by Region, 2024-2034 (US$ Billion)
6.7.2 Market Share by Region, 2024 & 2034 (%)
6.8 Forteo
6.8.1 Market Size by Region, 2024-2034 (US$ Billion)
6.8.2 Market Share by Region, 2024 & 2034 (%)
6.9 Nuvaring
6.9.1 Market Size by Region, 2024-2034 (US$ Billion)
6.9.2 Market Share by Region, 2024 & 2034 (%)
6.10 Premarin
6.10.1 Market Size by Region, 2024-2034 (US$ Billion)
6.10.2 Market Share by Region, 2024 & 2034 (%)
6.11 Lupron
6.11.1 Market Size by Region, 2024-2034 (US$ Billion)
6.11.2 Market Share by Region, 2024 & 2034 (%)
6.12 Lo Loestrin
6.12.1 Market Size by Region, 2024-2034 (US$ Billion)
6.12.2 Market Share by Region, 2024 & 2034 (%)
6.13 Orilissa/Oriahnn
6.13.1 Market Size by Region, 2024-2034 (US$ Billion)
6.13.2 Market Share by Region, 2024 & 2034 (%)
6.14 Others
6.14.1 Market Size by Region, 2024-2034 (US$ Billion)
6.14.2 Market Share by Region, 2024 & 2034 (%)
7 Women’s Health Market Analysis by Type
7.1 Key Findings
7.2 Application Segment: Market Attractiveness Index
7.3 Women’s Health Market Size Estimation and Forecast by Type
7.4 Generic
7.4.1 Market Size by Region, 2024-2034 (US$ Billion)
7.4.2 Market Share by Region, 2024 & 2034 (%)
7.5 Branded
7.5.1 Market Size by Region, 2024-2034 (US$ Billion)
7.5.2 Market Share by Region, 2024 & 2034 (%)
8 Women’s Health Market Analysis by Region
8.1 Key Findings
8.2 Regional Market Size Estimation and Forecast
9 North America Women’s Health Market Analysis
9.1 Key Findings
9.2 North America Women’s Health Market Attractiveness Index
9.3 North America Women’s Health Market by Country, 2024, 2029 & 2034 (US$ Billion)
9.4 North America Women’s Health Market Size Estimation and Forecast by Country
9.5 North America Women’s Health Market Size Estimation and Forecast by Application
9.6 North America Women’s Health Market Size Estimation and Forecast by Distribution Channel
9.7 North America Women’s Health Market Size Estimation and Forecast by Drugs
9.8 North America Women’s Health Market Size Estimation and Forecast by Type
9.9 U.S. Women’s Health Market Analysis
9.10 Canada Women’s Health Market Analysis
10 Europe Women’s Health Market Analysis
10.1 Key Findings
10.2 Europe Women’s Health Market Attractiveness Index
10.3 Europe Women’s Health Market by Country, 2024, 2029 & 2034 (US$ Billion)
10.4 Europe Women’s Health Market Size Estimation and Forecast by Country
10.5 Europe Women’s Health Market Size Estimation and Forecast by Application
10.6 Europe Women’s Health Market Size Estimation and Forecast by Distribution Channel
10.7 Europe Women’s Health Market Size Estimation and Forecast by Drugs
10.8 Europe Women’s Health Market Size Estimation and Forecast by Type
10.9 Germany Women’s Health Market Analysis
10.10 France Women’s Health Market Analysis
10.11 UK Women’s Health Market Analysis
10.12 Italy Women’s Health Market Analysis
10.13 Spain Women’s Health Market Analysis
10.14 Russia Women’s Health Market Analysis
10.15 Poland Women’s Health Market Analysis
10.16 Belgium Women’s Health Market Analysis
10.17 Rest of Europe Women’s Health Market Analysis
11 Asia Pacific Women’s Health Market Analysis
11.1 Key Findings
11.2 Asia Pacific Women’s Health Market Attractiveness Index
11.3 Asia Pacific Women’s Health Market by Country, 2024, 2029 & 2034 (US$ Billion)
11.4 Asia Pacific Women’s Health Market Size Estimation and Forecast by Country
11.5 Asia Pacific Women’s Health Market Size Estimation and Forecast by Application
11.6 Asia Pacific Women’s Health Market Size Estimation and Forecast by Distribution Channel
11.7 Asia Pacific Women’s Health Market Size Estimation and Forecast by Drugs
11.8 Asia Pacific Women’s Health Market Size Estimation and Forecast by Type
11.9 Japan Women’s Health Market Analysis
11.10 China Women’s Health Market Analysis
11.11 India Women’s Health Market Analysis
11.12 Australia Women’s Health Market Analysis
11.13 South Korea Women’s Health Market Analysis
11.14 Singapore Women’s Health Market Analysis
11.15 Taiwan Women’s Health Market Analysis
11.16 Rest of Asia Pacific Women’s Health Market Analysis
12 Latin America Women’s Health Market Analysis
12.1 Key Findings
12.2 Latin America Women’s Health Market Attractiveness Index
12.3 Latin America Women’s Health Market by Country, 2024, 2029 & 2034 (US$ Billion)
12.4 Latin America Women’s Health Market Size Estimation and Forecast by Country
12.5 Latin America Women’s Health Market Size Estimation and Forecast by Application
12.6 Latin America Women’s Health Market Size Estimation and Forecast by Distribution Channel
12.7 Latin America Women’s Health Market Size Estimation and Forecast by Drugs
12.8 Latin America Women’s Health Market Size Estimation and Forecast by Type
12.9 Brazil Women’s Health Market Analysis
12.10 Mexico Women’s Health Market Analysis
12.11 Argentina Women’s Health Market Analysis
12.12 Colombia Women’s Health Market Analysis
12.13 Rest of Latin America Women’s Health Market Analysis
13 MEA Women’s Health Market Analysis
13.1 Key Findings
13.2 MEA Women’s Health Market Attractiveness Index
13.3 MEA Women’s Health Market by Country, 2024, 2029 & 2034 (US$ Billion)
13.4 MEA Women’s Health Market Size Estimation and Forecast by Country
13.5 MEA Women’s Health Market Size Estimation and Forecast by Application
13.6 MEA Women’s Health Market Size Estimation and Forecast by Distribution Channel
13.7 MEA Women’s Health Market Size Estimation and Forecast by Drugs
13.8 MEA Women’s Health Market Size Estimation and Forecast by Type
13.9 GCC Women’s Health Market Analysis
13.10 South Africa Women’s Health Market Analysis
13.11 Rest of MEA Women’s Health Market Analysis
14 Company Profiles
14.1 Competitive Landscape, 2022
14.2 Summary of all Strategic Outlook
14.3 Abbott Laboratories
14.3.1 Company Snapshot
14.3.2 Company Overview
14.3.3 Financial Analysis
14.3.3.1 Net Revenue, 2017-2022
14.3.3.2 R&D, 2017-2022
14.3.4 Product Benchmarking
14.3.5 Strategic Outlook
14.4 Bayer AG
14.4.1 Company Snapshot
14.4.2 Company Overview
14.4.3 Financial Analysis
14.4.3.1 Net Revenue, 2017-2022
14.4.3.2 R&D, 2017-2022
14.4.3.3 Regional Market Shares, 2022
14.4.4 Product Benchmarking
14.4.5 Strategic Outlook
14.5 Caldera Medical Inc.
14.5.1 Company Snapshot
14.5.2 Company Overview
14.5.3 Product Benchmarking
14.5.4 Strategic Outlook
14.6 Cardinal Health
14.6.1 Company Snapshot
14.6.2 Company Overview
14.6.3 Financial Analysis
14.6.3.1 Net Revenue, 2017-2023
14.6.3.2 Regional Market Shares, 2023
14.6.4 Product Benchmarking
14.6.5 Strategic Outlook
14.7 Carestream Health
14.7.1 Company Snapshot
14.7.2 Company Overview
14.7.3 Product Benchmarking
14.7.4 Strategic Outlook
14.8 Cooper Surgical Inc.
14.8.1 Company Snapshot
14.8.2 Company Overview
14.8.3 Financial Analysis
14.8.3.1 Net Revenue, 2017-2023
14.8.3.2 R&D, 2017-2023
14.8.3.3 Regional Market Shares, 2023
14.8.4 Product Benchmarking
14.8.5 Strategic Outlook
14.9 L. Hoffman-La Roche Ltd.
14.9.1 Company Snapshot
14.9.2 Company Overview
14.9.3 Financial Analysis
14.9.3.1 Net Revenue, 2017-2023
14.9.3.2 R&D, 2017-2023
14.9.4 Product Benchmarking
14.9.5 Strategic Outlook
14.10 General Electric Healthcare
14.10.1 Company Snapshot
14.10.2 Company Overview
14.10.3 Financial Analysis
14.10.3.1 Net Revenue, 2017-2022
14.10.3.2 R&D, 2017-2022
14.10.3.3 Regional Market Shares, 2022
14.10.4 Product Benchmarking
14.10.5 Strategic Outlook
14.11 Hologic Inc.
14.11.1 Company Snapshot
14.11.2 Company Overview
14.11.3 Financial Analysis
14.11.3.1 Net Revenue, 2017-2023
14.11.3.2 R&D, 2017-2023
14.11.3.3 Regional Market Shares, 2022
14.11.4 Product Benchmarking
14.11.5 Strategic Outlook
14.12 koninklijke philips n.v
14.12.1 Company Snapshot
14.12.2 Company Overview
14.12.3 Financial Analysis
14.12.3.1 Net Revenue, 2017-2022
14.12.3.2 R&D, 2017-2022
14.12.4 Product Benchmarking
14.12.5 Strategic Outlook
14.13 MedGyn Products Inc.
14.13.1 Company Snapshot
14.13.2 Company Overview
14.13.3 Product Benchmarking
14.14 Medline Industries, Inc.
14.14.1 Company Snapshot
14.14.2 Company Overview
14.14.3 Product Benchmarking
14.15 Prestige Consumer Healthcare Inc.
14.15.1 Company Snapshot
14.15.2 Company Overview
14.15.3 Financial Analysis
14.15.3.1 Net Revenue, 2017-2022
14.15.4 Product Benchmarking
14.16 Siemens AG
14.16.1 Company Snapshot
14.16.2 Company Overview
14.16.3 Financial Analysis
14.16.3.1 Net Revenue, 2017-2023
14.16.3.2 R&D, 2017-2023
14.16.3.3 Regional Market Shares, 2023
14.16.4 Product Benchmarking
14.16.5 Strategic Outlook
15 Conclusion and Recommendations
15.1 Concluding Remarks from Visiongain
15.2 Recommendations for Market Players
ページTOPに戻る
List of Tables/Graphs
List of Tables
Table 1 Women’s Health Market Snapshot, 2024 & 2034 (US$ Billion, CAGR %)
Table 2 Women’s Health Market Forecast by Region, 2024-2034 (US$ Billion, AGR%, CAGR%): “V” Shaped Recovery
Table 3 Women’s Health Market Forecast by Region, 2024-2034 (US$ Billion, AGR%, CAGR%): “U” Shaped Recovery
Table 4 Women’s Health Market Forecast by Region, 2024-2034 (US$ Billion, AGR%, CAGR%): “W” Shaped Recovery
Table 5 Women’s Health Market Forecast by Region, 2024-2034 (US$ Billion, AGR%, CAGR%): “L” Shaped Recovery
Table 6 Women’s Health Market Forecast by Application, 2024-2034 (US$ Billion, AGR%, CAGR %)
Table 7 Contraceptives Market Forecast by Region, 2024-2034 (US$ Billion, AGR%, CAGR %)
Table 8 Postmenopausal Osteoporosis Market Forecast by Region, 2024-2034 (US$ Billion, AGR%, CAGR %)
Table 9 Hormonal Infertility Market Forecast by Region, 2024-2034 (US$ Billion, AGR%, CAGR%)
Table 10 Menopause Market Forecast by Region, 2024-2034 (US$ Billion, AGR%, CAGR%)
Table 11 Polycystic Ovary Syndrome Market Forecast by Region, 2024-2034 (US$ Billion, AGR%, CAGR%)
Table 12 Endometriosis and Uterine Fibroids Market Forecast by Region, 2024-2034 (US$ Billion, AGR%, CAGR%)
Table 13 Others Market Forecast by Region, 2024-2034 (US$ Billion, AGR%, CAGR%)
Table 14 Women’s Health Market Forecast by Distribution Channel, 2024-2034 (US$ Billion, AGR%, CAGR %)
Table 15 Hospital Pharmacies Market Forecast by Region, 2024-2034 (US$ Billion, AGR%, CAGR %)
Table 16 Retail Pharmacies Market Forecast by Region, 2024-2034 (US$ Billion, AGR%, CAGR %)
Table 17 Online Pharmacies Market Forecast by Region, 2024-2034 (US$ Billion, AGR%, CAGR%)
Table 18 Women’s Health Market Drugs, 2024-2034 (US$ Million, AGR%, CAGR%)
Table 19 Xgeva Market Forecast by Region, 2024-2034 (US$ Billion, AGR%, CAGR%)
Table 20 Prolia Market Forecast by Region, 2024-2034 (US$ Billion, AGR%, CAGR%)
Table 21 Mirena Market Forecast by Region, 2024-2034 (US$ Billion, AGR%, CAGR%)
Table 22 Nexplanon Market Forecast by Region, 2024-2034 (US$ Billion, AGR%, CAGR%)
Table 23 Forteo Market Forecast by Region, 2024-2034 (US$ Billion, AGR%, CAGR%)
Table 24 Nuvaring Market Forecast by Region, 2024-2034 (US$ Billion, AGR%, CAGR%)
Table 25 Premarin Market Forecast by Region, 2024-2034 (US$ Billion, AGR%, CAGR%)
Table 26 Lupron Market Forecast by Region, 2024-2034 (US$ Billion, AGR%, CAGR%)
Table 27 Lo Loestrin Market Forecast by Region, 2024-2034 (US$ Billion, AGR%, CAGR%)
Table 28 Orilissa/Oriahnn Market Forecast by Region, 2024-2034 (US$ Billion, AGR%, CAGR%)
Table 29 Others Market Forecast by Region, 2024-2034 (US$ Billion, AGR%, CAGR%)
Table 30 Women’s Health Market Type, 2024-2034 (US$ Billion, AGR%, CAGR%)
Table 31 Generic Market Forecast by Region, 2024-2034 (US$ Billion, AGR%, CAGR%)
Table 32 Branded Market Forecast by Region, 2024-2034 (US$ Billion, AGR%, CAGR%)
Table 33 Women’s Health Market Forecast by Region, 2024-2034 (US$ Billion, AGR%, CAGR%)
Table 34 North America Women’s Health Market Forecast by Country, 2024-2034 (US$ Billion, AGR%, CAGR %)
Table 35 North America Women’s Health Market Forecast by Application, 2024-2034 (US$ Billion, AGR%, CAGR %)
Table 36 North America Women’s Health Market Forecast by Distribution Channel, 2024-2034 (US$ Billion, AGR%, CAGR %)
Table 37 North America Women’s Health Market Drugs, 2024-2034 (US$ Billion, AGR%, CAGR%)
Table 38 North America Women’s Health Market Type, 2024-2034 (US$ Billion, AGR%, CAGR%)
Table 39 U.S. Women’s Health Market Forecast, 2024-2034 (US$ Billion, AGR%, CAGR%)
Table 40 Canada Women’s Health Market Forecast, 2024-2034 (US$ Billion, AGR%, CAGR %)
Table 41 Europe Women’s Health Market Forecast by Country, 2024-2034 (US$ Billion, AGR%, CAGR%)
Table 42 Europe Women’s Health Market Forecast by Application, 2024-2034 (US$ Billion, AGR%, CAGR %)
Table 43 Europe Women’s Health Market Forecast by Distribution Channel, 2024-2034 (US$ Billion, AGR%, CAGR %)
Table 44 Europe Women’s Health Market Drugs, 2024-2034 (US$ Million, AGR%, CAGR%)
Table 45 Europe Women’s Health Market Type, 2024-2034 (US$ Billion, AGR%, CAGR%)
Table 46 Germany Women’s Health Market Forecast, 2024-2034 (US$ Billion, AGR%, CAGR %)
Table 47 France Women’s Health Market Forecast, 2024-2034 (US$ Billion, AGR%, CAGR %)
Table 48 UK Women’s Health Market Forecast, 2024-2034 (US$ Billion, AGR%, CAGR%)
Table 49 Italy Women’s Health Market Forecast, 2024-2034 (US$ Billion, AGR%, CAGR %)
Table 50 Spain Women’s Health Market Forecast, 2024-2034 (US$ Billion, AGR%, CAGR%)
Table 51 Russia Women’s Health Market Forecast, 2024-2034 (US$ Billion, AGR%, CAGR%)
Table 52 Poland Women’s Health Market Forecast, 2024-2034 (US$ Billion, AGR%, CAGR%)
Table 53 Belgium Women’s Health Market Forecast, 2024-2034 (US$ Billion, AGR%, CAGR%)
Table 54 Rest of Europe Women’s Health Market Forecast, 2024-2034 (US$ Billion, AGR%, CAGR%)
Table 55 Asia Pacific Women’s Health Market Forecast by Country, 2024-2034 (US$ Billion, AGR%, CAGR%)
Table 56 Women’s Health Market Forecast by Application, 2024-2034 (US$ Billion, AGR%, CAGR %)
Table 57 Asia Pacific Women’s Health Market Forecast by Distribution Channel, 2024-2034 (US$ Billion, AGR%, CAGR %)
Table 58 Asia Pacific Women’s Health Market Drugs, 2024-2034 (US$ Million, AGR%, CAGR%)
Table 59 Asia Pacific Women’s Health Market Type, 2024-2034 (US$ Billion, AGR%, CAGR%)
Table 60 Japan Women’s Health Market Forecast, 2024-2034 (US$ Billion, AGR%, CAGR%)
Table 61 China Women’s Health Market Forecast, 2024-2034 (US$ Billion, AGR%, CAGR%)
Table 62 India Women’s Health Market Forecast, 2024-2034 (US$ Billion, AGR%, CAGR %)
Table 63 Australia Women’s Health Market Forecast, 2024-2034 (US$ Billion, AGR%, CAGR %)
Table 64 South Korea Women’s Health Market Forecast, 2024-2034 (US$ Billion, AGR%, CAGR%)
Table 65 Singapore Women’s Health Market Forecast, 2024-2034 (US$ Billion, AGR%, CAGR%)
Table 66 Taiwan Women’s Health Market Forecast, 2024-2034 (US$ Billion, AGR%, CAGR%)
Table 67 Rest of Asia Pacific Women’s Health Market Forecast, 2024-2034 (US$ Billion, AGR%, CAGR %)
Table 68 Latin America Women’s Health Market Forecast by Country, 2024-2034 (US$ Billion, AGR%, CAGR%)
Table 69 Latin America Women’s Health Market Forecast by Application, 2024-2034 (US$ Billion, AGR%, CAGR %)
Table 70 Latin America Women’s Health Market Forecast by Distribution Channel, 2024-2034 (US$ Billion, AGR%, CAGR %)
Table 71 Latin America Women’s Health Market Drugs, 2024-2034 (US$ Million, AGR%, CAGR%)
Table 72 Latin America Women’s Health Market Type, 2024-2034 (US$ Billion, AGR%, CAGR%)
Table 73 Brazil Women’s Health Market Forecast, 2024-2034 (US$ Billion, AGR%, CAGR %)
Table 74 Mexico Women’s Health Market Forecast, 2024-2034 (US$ Billion, AGR%, CAGR%)
Table 75 Argentina Women’s Health Market Forecast, 2024-2034 (US$ Billion, AGR%, CAGR%)
Table 76 Colombia Women’s Health Market Forecast, 2024-2034 (US$ Billion, AGR%, CAGR%)
Table 77 Rest of Latin America Women’s Health Market Forecast, 2024-2034 (US$ Billion, AGR%, CAGR%)
Table 78 MEA Women’s Health Market Forecast by Country, 2024-2034 (US$ Billion, AGR%, CAGR%)
Table 79 MEA Women’s Health Market Forecast by Application, 2024-2034 (US$ Billion, AGR%, CAGR %)
Table 80 MEA Women’s Health Market Forecast by Distribution Channel, 2024-2034 (US$ Billion, AGR%, CAGR %)
Table 81 MEA Women’s Health Market by Drugs, 2024-2034 (US$ Billion, AGR%, CAGR%)
Table 82 MEA Women’s Health Market by Type, 2024-2034 (US$ Billion, AGR%, CAGR%)
Table 83 GCC Women’s Health Market Forecast, 2024-2034 (US$ Billion, AGR%, CAGR%)
Table 84 South Africa Women’s Health Market Forecast, 2024-2034 (US$ Billion, AGR%, CAGR%)
Table 85 Rest of MEA Women’s Health Market Forecast, 2024-2034 (US$ Billion, AGR%, CAGR %)
Table 86 Strategic Outlook
Table 87 Abbott Laboratories: Key Details, (CEO, HQ, Revenue, Founded, No. of Employees, Company Type, Website, Business Segment)
Table 88 Abbott Laboratories: Product Benchmarking
Table 89 Abbott Laboratories: Strategic Outlook
Table 90 Bayer AG: Key Details, (CEO, HQ, Revenue, Founded, No. of Employees, Company Type, Website, Business Segment)
Table 91 Bayer AG: Product Benchmarking
Table 92 Bayer AG: Strategic Outlook
Table 93 Caldera Medical Inc: Key Details, (CEO, HQ, Revenue, Founded, No. of Employees, Company Type, Website, Business Segment)
Table 94 Caldera Medical Inc: Product Benchmarking
Table 95 Caldera Medical Inc: Strategic Outlook
Table 96 Cardinal Health: Key Details, (CEO, HQ, Revenue, Founded, No. of Employees, Company Type, Website, Business Segment)
Table 97 Cardinal Health: Product Benchmarking
Table 98 Cardinal Health: Strategic Outlook
Table 99 Carestream health: Key Details, (CEO, HQ, Revenue, Founded, No. of Employees, Company Type, Website, Business Segment)
Table 100 Carestream Health: Product Benchmarking
Table 101 Carestream Health: Strategic Outlook
Table 102 Cooper Surgical Inc.: Key Details, (CEO, HQ, Revenue, Founded, No. of Employees, Company Type, Website, Business Segment)
Table 103 Cooper Surgical, Inc.: Product Benchmarking
Table 104 Cooper Surgical, Inc.: Strategic Outlook
Table 105 L. Hoffman-La Roche Ltd.: Key Details, (CEO, HQ, Revenue, Founded, No. of Employees, Company Type, Website, Business Segment)
Table 106 L. Hoffman-La Roche Ltd.: Product Benchmarking
Table 107 Debiotech SA: Strategic Outlook
Table 108 General Electric Healthcare: Key Details, (CEO, HQ, Revenue, Founded, No. of Employees, Company Type, Website, Business Segment)
Table 109 General Electric Healthcare: Product Benchmarking
Table 110 General Electric Healthcare: Strategic Outlook
Table 111 Hologic Inc: Key Details, (CEO, HQ, Revenue, Founded, No. of Employees, Company Type, Website, Business Segment)
Table 112 Hologic Inc: Product Benchmarking
Table 113 Hologic Inc.: Strategic Outlook
Table 114 koninklijke philips n.v: Key Details, (CEO, HQ, Revenue, Founded, No. of Employees, Company Type, Website, Business Segment)
Table 115 Koninklijke Philips N.V: Product Benchmarking
Table 116 Koninklijke Philips N.V: Strategic Outlook
Table 117 MedGyn Products Inc.: Key Details, (CEO, HQ, Revenue, Founded, No. of Employees, Company Type, Website, Business Segment)
Table 118 MedGyn Products, Inc.: Product Benchmarking
Table 119 Medline Industries, Inc.: Key Details, (CEO, HQ, Revenue, Founded, No. of Employees, Company Type, Website, Business Segment)
Table 120 Medline Industries Inc: Product Benchmarking
Table 121 Prestige Consumer Healthcare, Inc.: Key Details, (CEO, HQ, Revenue, Founded, No. of Employees, Company Type, Website, Business Segment)
Table 122 Prestige Consumer Healthcare Inc.: Product Benchmarking
Table 123 Siemens AG: Key Details, (CEO, HQ, Revenue, Founded, No. of Employees, Company Type, Website, Business Segment)
Table 124 Siemens AG: Product Benchmarking
Table 125 Siemens AG: Strategic Outlook
List of Figures
Figure 1 Women’s Health Market Segmentation
Figure 2 Women’s Health Market by Application: Market Attractiveness Index
Figure 3 Women’s Health Market by Distribution Channel: Market Attractiveness Index
Figure 4 Women’s Health Market by Drugs: Market Attractiveness Index
Figure 5 Women’s Health Market by Type: Market Attractiveness Index
Figure 6 Women’s Health Market Attractiveness Index by Region
Figure 7 Women’s Health Market: Market Dynamics
Figure 8 Women’s Health Market by Region, 2024-2034 (US$ Billion, AGR %): “V” Shaped Recovery
Figure 9 Women’s Health Market by Region, 2024-2034 (US$ Billion, AGR %): “U” Shaped Recovery
Figure 10 Women’s Health Market by Region, 2024-2034 (US$ Billion, AGR %): “W” Shaped Recovery
Figure 11 Women’s Health Market by Region, 2024-2034 (US$ Billion, AGR %): “L” Shaped Recovery
Figure 12 Women’s Health Market: Porter’s Five Forces Analysis
Figure 13 Women’s Health Market: PEST Analysis
Figure 14 Women’s Health Market by Application: Market Attractiveness Index
Figure 15 Women’s Health Market Forecast by Application, 2024-2034 (US$ Billion, AGR %)
Figure 16 Women’s Health Market Share Forecast by Application, 2024, 2029, 2034 (%)
Figure 17 Contraceptives Market Forecast by Region, 2024-2034 (US$ Billion, AGR %)
Figure 18 Contraceptives Market Share Forecast by Region, 2024 & 2034 (%)
Figure 19 Postmenopausal Osteoporosis Market Forecast by Region, 2024-2034 (US$ Billion, AGR %)
Figure 20 Postmenopausal Osteoporosis Market Share Forecast by Region, 2024 & 2034 (%)
Figure 21 Hormonal Infertility Market Forecast by Region, 2024-2034 (US$ Billion, AGR %)
Figure 22 Hormonal Infertility Market Share Forecast by Region, 2024 & 2034 (%)
Figure 23 Menopause Market Forecast by Region, 2024-2034 (US$ Billion, AGR %)
Figure 24 Menopause Market Share Forecast by Region, 2024 & 2034 (%)
Figure 25 Polycystic Ovary Syndrome Market Forecast by Region, 2024-2034 (US$ Billion, AGR %)
Figure 26 Polycystic Ovary Syndrome Market Share Forecast by Region, 2024 & 2034 (%)
Figure 27 Endometriosis and Uterine Fibroids Market Forecast by Region, 2024-2034 (US$ Billion, AGR %)
Figure 28 Endometriosis and Uterine Fibroids Market Share Forecast by Region, 2024 & 2034 (%)
Figure 29 Others Market Forecast by Region, 2024-2034 (US$ Billion, AGR %)
Figure 30 Others Market Share Forecast by Region, 2024 & 2034 (%)
Figure 31 Women’s Health Market by Distribution Channel: Market Attractiveness Index
Figure 32 Women’s Health Market Forecast by Distribution Channel, 2024-2034 (US$ Billion, AGR %)
Figure 33 Women’s Health Market Share Forecast by Application, 2024, 2029, 2034 (%)
Figure 34 Hospital Pharmacies Market Forecast by Region, 2024-2034 (US$ Billion, AGR %)
Figure 35 Hospital Pharmacies Market Share Forecast by Region, 2024 & 2034 (%)
Figure 36 Retail Pharmacies Market Forecast by Region, 2024-2034 (US$ Billion, AGR %)
Figure 37 Retail Pharmacies Market Share Forecast by Region, 2024 & 2034 (%)
Figure 38 Online Pharmacies Market Forecast by Region, 2024-2034 (US$ Billion, AGR %)
Figure 39 Online Pharmacies Market Share Forecast by Region, 2024 & 2034 (%)
Figure 40 Women’s Health Market by Drugs: Market Attractiveness Index
Figure 41 Women’s Health Market Forecast by Drugs, 2024-2034 (US$ Billion, AGR %)
Figure 42 Women’s Health Market Share Forecast by Application, 2024, 2029, 2034 (%)
Figure 43 Xgeva Segment Market Forecast by Region, 2024-2034 (US$ Billion, AGR %)
Figure 44 Xgeva Segment Market Share Forecast by Region, 2024 & 2034 (%)
Figure 45 Prolia Market Forecast by Region, 2024-2034 (US$ Billion, AGR %)
Figure 46 Prolia Market Share Forecast by Region, 2024 & 2034 (%)
Figure 47 Mirena Market Forecast by Region, 2024-2034 (US$ Billion, AGR %)
Figure 48 Mirena Market Share Forecast by Region, 2024 & 2034 (%)
Figure 49 Nexplanon Market Forecast by Region, 2024-2034 (US$ Billion, AGR %)
Figure 50 Nexplanon Market Share Forecast by Region, 2024 & 2034 (%)
Figure 51 Forteo Market Forecast by Region, 2024-2034 (US$ Billion, AGR %)
Figure 52 Forteo Market Share Forecast by Region, 2024 & 2034 (%)
Figure 53 Nuvaring Market Forecast by Region, 2024-2034 (US$ Billion, AGR %)
Figure 54 Nuvaring Market Share Forecast by Region, 2024 & 2034 (%)
Figure 55 Premarin Market Forecast by Region, 2024-2034 (US$ Billion, AGR %)
Figure 56 Premarin Market Share Forecast by Region, 2024 & 2034 (%)
Figure 57 Lupron Market Forecast by Region, 2024-2034 (US$ Billion, AGR %)
Figure 58 Lupron Market Share Forecast by Region, 2024 & 2034 (%)
Figure 59 Lo Loestrin Market Forecast by Region, 2024-2034 (US$ Billion, AGR %)
Figure 60 Lo Loestrin Market Share Forecast by Region, 2024 & 2034 (%)
Figure 61 Orilissa/Oriahnn Market Forecast by Region, 2024-2034 (US$ Billion, AGR %)
Figure 62 Orilissa/Oriahnn Market Share Forecast by Region, 2024 & 2034 (%)
Figure 63 Others Market Forecast by Region, 2024-2034 (US$ Billion, AGR %)
Figure 64 Others Market Share Forecast by Region, 2024 & 2034 (%)
Figure 65 Women’s Health Market by Type: Market Attractiveness Index
Figure 66 Women’s Health Market Forecast by Type, 2024-2034 (US$ Billion, AGR %)
Figure 67 Women’s Health Market Share Forecast by Type 2024, 2029, 2034 (%)
Figure 68 Generic Segment Market Forecast by Region, 2024-2034 (US$ Billion, AGR %)
Figure 69 Generic Segment Market Share Forecast by Region, 2024 & 2034 (%)
Figure 70 Branded Market Forecast by Region, 2024-2034 (US$ Billion, AGR %)
Figure 71 Branded Market Share Forecast by Region, 2024 & 2034 (%)
Figure 72 Women’s Health Market Forecast by Region 2024 and 2034 (Revenue, CAGR %)
Figure 73 Women’s Health Market Share Forecast by Region 2024, 2029, 2034 (%)
Figure 74 Women’s Health Market by Region, 2024-2034 (US$ Billion, AGR %)
Figure 75 North America Women’s Health Market Attractiveness Index
Figure 76 North America Women’s Health Market by Region, 2024, 2029 & 2034 (US$ Billion)
Figure 77 North America Women’s Health Market Forecast by Country, 2024-2034 (US$ Billion, AGR %)
Figure 78 North America Women’s Health Market Share Forecast by Country, 2024 & 2034 (%)
Figure 79 North America Women’s Health Market Forecast by Application, 2024-2034 (US$ Billion, AGR %)
Figure 80 North America Women’s Health Market Share Forecast by Application, 2024 & 2034 (%)
Figure 81 North America Women’s Health Market Forecast by Distribution Channel, 2024-2034 (US$ Billion, AGR %)
Figure 82 North America Women’s Health Market Share Forecast by Distribution Channel, 2024 & 2034 (%)
Figure 83 North America Women’s Health Market Forecast by Drugs, 2024-2034 (US$ Billion, AGR %)
Figure 84 North America Women’s Health Market Share Forecast by Drugs, 2024 & 2034 (%)
Figure 85 North America Women’s Health Market Forecast by Type, 2024-2034 (US$ Billion, AGR %)
Figure 86 North America Women’s Health Market Share Forecast by Type, 2024 & 2034 (%)
Figure 87 U.S. Women’s Health Market Forecast, 2024-2034 (US$ Billion, AGR %)
Figure 88 Canada Women’s Health Market Forecast, 2024-2034 (US$ Billion, AGR %)
Figure 89 Europe Women’s Health Market Attractiveness Index
Figure 90 Europe Women’s Health Market by Region, 2024, 2029 & 2034 (US$ Billion)
Figure 91 Europe Women’s Health Market Forecast by Country, 2024-2034 (US$ Billion, AGR %)
Figure 92 Europe Women’s Health Market Share Forecast by Country, 2024 & 2034 (%)
Figure 93 Europe Women’s Health Market Forecast by Application, 2024-2034 (US$ Billion, AGR %)
Figure 94 Europe Women’s Health Market Share Forecast by Application, 2024 & 2034 (%)
Figure 95 Europe Women’s Health Market Forecast by Distribution Channel, 2024-2034 (US$ Billion, AGR %)
Figure 96 Europe Women’s Health Market Share Forecast by Distribution Channel, 2024 & 2034 (%)
Figure 97 Europe Women’s Health Market Forecast by Drugs, 2024-2034 (US$ Billion, AGR %)
Figure 98 Europe Women’s Health Market Share Forecast by Drugs, 2024 & 2034 (%)
Figure 99 Europe Women’s Health Market Forecast by Type, 2024-2034 (US$ Billion, AGR %)
Figure 100 Europe Women’s Health Market Share Forecast by Type, 2024 & 2034 (%)
Figure 101 Germany Women’s Health Market Forecast, 2024-2034 (US$ Billion, AGR %)
Figure 102 France Women’s Health Market Forecast, 2024-2034 (US$ Billion, AGR %)
Figure 103 UK Women’s Health Market Forecast, 2024-2034 (US$ Billion, AGR %)
Figure 104 Italy Women’s Health Market Forecast, 2024-2034 (US$ Billion, AGR %)
Figure 105 Spain Women’s Health Market Forecast, 2024-2034 (US$ Billion, AGR %)
Figure 106 Russia Women’s Health Market Forecast, 2024-2034 (US$ Billion, AGR %)
Figure 107 Poland Women’s Health Market Forecast, 2024-2034 (US$ Billion, AGR %)
Figure 108 Belgium Women’s Health Market Forecast, 2024-2034 (US$ Billion, AGR %)
Figure 109 Rest of Europe Women’s Health Market Forecast, 2024-2034 (US$ Billion, AGR %)
Figure 110 Asia Pacific Women’s Health Market Attractiveness Index
Figure 111 Asia Pacific Women’s Health Market by Country, 2024, 2029 & 2034 (US$ Billion)
Figure 112 Asia Pacific Women’s Health Market Forecast by Country, 2024-2034 (US$ Billion, AGR %)
Figure 113 Asia Pacific Women’s Health Market Share Forecast by Country, 2024 & 2034 (%)
Figure 114 Asia Pacific Women’s Health Market Forecast by Application, 2024-2034 (US$ Billion, AGR %)
Figure 115 Asia Pacific Women’s Health Market Share Forecast by Application, 2024 & 2034 (%)
Figure 116 Asia Pacific Women’s Health Market Forecast by Distribution Channel, 2024-2034 (US$ Billion, AGR %)
Figure 117 Asia Pacific Women’s Health Market Share Forecast by Distribution Channel, 2024 & 2034 (%)
Figure 118 Asia Pacific Women’s Health Market Forecast by Drugs, 2024-2034 (US$ Billion, AGR %)
Figure 119 Asia Pacific Women’s Health Market Share Forecast by Drugs, 2024 & 2034 (%)
Figure 120 Asia Pacific Women’s Health Market Forecast by Type, 2024-2034 (US$ Billion, AGR %)
Figure 121 Asia Pacific Women’s Health Market Share Forecast by Type, 2024 & 2034 (%)
Figure 122 Japan Women’s Health Market Forecast, 2024-2034 (US$ Billion, AGR %)
Figure 123 China Women’s Health Market Forecast, 2024-2034 (US$ Billion, AGR %)
Figure 124 India Women’s Health Market Forecast, 2024-2034 (US$ Billion, AGR %)
Figure 125 Australia Women’s Health Market Forecast, 2024-2034 (US$ Billion, AGR %)
Figure 126 South Korea Women’s Health Market Forecast, 2024-2034 (US$ Billion, AGR %)
Figure 127 Singapore Women’s Health Market Forecast, 2024-2034 (US$ Billion, AGR %)
Figure 128 Taiwan Women’s Health Market Forecast, 2024-2034 (US$ Billion, AGR %)
Figure 129 Rest of Asia Pacific Women’s Health Market Forecast, 2024-2034 (US$ Billion, AGR %)
Figure 130 Latin America Women’s Health Market Attractiveness Index
Figure 131 Latin America Women’s Health Market by Region, 2024, 2029 & 2034 (US$ Billion)
Figure 132 Latin America Women’s Health Market Forecast by Country, 2024-2034 (US$ Billion, AGR %)
Figure 133 Latin America Women’s Health Market Share Forecast by Country, 2024 & 2034 (%)
Figure 134 Latin America Women’s Health Market Forecast by Application, 2024-2034 (US$ Billion, AGR %)
Figure 135 Latin America Women’s Health Market Share Forecast by Application, 2024 & 2034 (%)
Figure 136 Latin America Women’s Health Market Forecast by Distribution Channel, 2024-2034 (US$ Billion, AGR %)
Figure 137 Latin America Women’s Health Market Share Forecast by Distribution Channel, 2024 & 2034 (%)
Figure 138 Latin America Women’s Health Market Forecast by Drugs, 2024-2034 (US$ Billion, AGR %)
Figure 139 Latin America Women’s Health Market Share Forecast by Drugs, 2024 & 2034 (%)
Figure 140 Latin America Women’s Health Market Forecast by Type, 2024-2034 (US$ Billion, AGR %)
Figure 141 Latin America Women’s Health Market Share Forecast by Type, 2024 & 2034 (%)
Figure 142 Brazil Women’s Health Market Forecast, 2024-2034 (US$ Billion, AGR %)
Figure 143 Mexico Women’s Health Market Forecast, 2024-2034 (US$ Billion, AGR %)
Figure 144 Argentina Women’s Health Market Forecast, 2024-2034 (US$ Billion, AGR %)
Figure 145 Colombia Women’s Health Market Forecast, 2024-2034 (US$ Billion, AGR %)
Figure 146 Rest of Latin America Women’s Health Market Forecast, 2024-2034 (US$ Billion, AGR %)
Figure 147 MEA Women’s Health Market Attractiveness Index
Figure 148 MEA Women’s Health Market by Region, 2024, 2029 & 2034 (US$ Billion)
Figure 149 MEA Women’s Health Market Forecast by Country, 2024-2034 (US$ Billion, AGR %)
Figure 150 MEA Women’s Health Market Share Forecast by Country, 2024 & 2034 (%)
Figure 151 MEA Women’s Health Market Forecast by Application, 2024-2034 (US$ Billion, AGR %)
Figure 152 MEA Women’s Health Market Share Forecast by Application, 2024 & 2034 (%)
Figure 153 MEA Women’s Health Market Forecast by Distribution Channel, 2024-2034 (US$ Billion, AGR %)
Figure 154 MEA Women’s Health Market Share Forecast by Distribution Channel, 2024 & 2034 (%)
Figure 155 MEA Women’s Health Market Forecast by Drugs, 2024-2034 (US$ Billion, AGR %)
Figure 156 MEA Women’s Health Market Share Forecast by Drugs, 2024 & 2034 (%)
Figure 157 MEA Women’s Health Market Forecast by Type, 2024-2034 (US$ Billion, AGR %)
Figure 158 MEA Women’s Health Market Share Forecast by Type, 2024 & 2034 (%)
Figure 159 GCC Women’s Health Market Forecast, 2024-2034 (US$ Billion, AGR %)
Figure 160 South Africa Women’s Health Market Forecast, 2024-2034 (US$ Billion, AGR %)
Figure 161 Rest of MEA Women’s Health Market Forecast, 2024-2034 (US$ Billion, AGR %)
Figure 162 Women Health Market Company Share, 2022
Figure 163 Abbott Laboratories: Net Revenue, 2017-2022 (US$ Million, AGR%)
Figure 164 Abbott Laboratories: R&D, 2017-2022 (US$ Million, AGR%)
Figure 165 Bayer AG: Net Revenue, 2017-2022 (US$ Million, AGR%)
Figure 166 Bayer AG : R&D, 2017-2022 (US$ Million, AGR%)
Figure 167 Bayer AG: Regional Market Shares, 2022
Figure 168 Cardinal Health: Net Revenue, 2017-2023 (US$ Million, AGR%)
Figure 169 Cardinal Health: Regional Market Shares, 2023
Figure 170 Cooper Surgical, Inc.: Net Revenue, 2017-2023 (US$ Million, AGR%)
Figure 171 Cooper Surgical, Inc.: R&D, 2017-2023 (US$ Million, AGR%)
Figure 172 Cooper Surgical, Inc.: Regional Market Shares, 2023
Figure 173 L. Hoffman-La Roche Ltd.: Net Revenue, 2017-2023 (US$ Million, AGR%)
Figure 174 L. Hoffman-La Roche Ltd.: R&D, 2017-2023 (US$ Million, AGR%)
Figure 175 General Electric Healthcare: Net Revenue, 2017-2022 (US$ Million, AGR%)
Figure 176 General Electric Healthcare: R&D, 2017-2022 (US$ Million, AGR%)
Figure 177 General Electric Healthcare: Regional Market Shares, 2022
Figure 178 Hologic Inc.: Net Revenue, 2017-2023 (US$ Million, AGR%)
Figure 179 Hologic Inc: R&D, 2017-2023 (US$ Million, AGR%)
Figure 180 Hologic Inc: Regional Market Shares, 2022
Figure 181 Koninklijke Philips N.V: Net Revenue, 2017-2022 (US$ Million, AGR%)
Figure 182 Koninklijke Philips N.V: R&D, 2017-2022 (US$ Million, AGR%)
Figure 183 Prestige Consumer Healthcare Inc.: Net Revenue, 2017-2022 (US$ Million, AGR%)
Figure 184 Siemens AG: Net Revenue, 2017-2023 (US$ Million, AGR%)
Figure 185 Siemens AG: R&D, 2017-2023 (US$ Million, AGR%)
Figure 186 Siemens AG: Regional Market Shares, 2023
ページTOPに戻る
本レポートと同分野(その他(治療を主目的としない薬物))の最新刊レポート
Visiongain社のヘルスケアと医薬・化学品分野での最新刊レポート
本レポートと同じKEY WORD(womens health)の最新刊レポート
- 本レポートと同じKEY WORDの最新刊レポートはありません。
よくあるご質問
Visiongain社はどのような調査会社ですか?
英国の調査会社ヴィジョンゲイン社(Visiongain)は、通信とエネルギーのほか、自動車や化学・医薬品、金属など、広範な市場を対象に調査を行っています。自動車市場については、市場全般に関する調査のほ... もっと見る
調査レポートの納品までの日数はどの程度ですか?
在庫のあるものは速納となりますが、平均的には 3-4日と見て下さい。
但し、一部の調査レポートでは、発注を受けた段階で内容更新をして納品をする場合もあります。
発注をする前のお問合せをお願いします。
注文の手続きはどのようになっていますか?
1)お客様からの御問い合わせをいただきます。
2)見積書やサンプルの提示をいたします。
3)お客様指定、もしくは弊社の発注書をメール添付にて発送してください。
4)データリソース社からレポート発行元の調査会社へ納品手配します。
5) 調査会社からお客様へ納品されます。最近は、pdfにてのメール納品が大半です。
お支払方法の方法はどのようになっていますか?
納品と同時にデータリソース社よりお客様へ請求書(必要に応じて納品書も)を発送いたします。
お客様よりデータリソース社へ(通常は円払い)の御振り込みをお願いします。
請求書は、納品日の日付で発行しますので、翌月最終営業日までの当社指定口座への振込みをお願いします。振込み手数料は御社負担にてお願いします。
お客様の御支払い条件が60日以上の場合は御相談ください。
尚、初めてのお取引先や個人の場合、前払いをお願いすることもあります。ご了承のほど、お願いします。
データリソース社はどのような会社ですか?
当社は、世界各国の主要調査会社・レポート出版社と提携し、世界各国の市場調査レポートや技術動向レポートなどを日本国内の企業・公官庁及び教育研究機関に提供しております。
世界各国の「市場・技術・法規制などの」実情を調査・収集される時には、データリソース社にご相談ください。
お客様の御要望にあったデータや情報を抽出する為のレポート紹介や調査のアドバイスも致します。
|
|

