スマート空港技術市場レポート:2024-2034
Smart Airport Technologies Market Report 2024-2034
レポート詳細
スマート空港技術市場レポート 2024-2034年 :この調査レポートは、業界とその基礎となるダイナミクスをより良く理解することを望むなら、新たな収益ポケットを目指す大手企業にとって... もっと見る
※上記価格は部署ライセンス(Departmental licence)価格です。
その他の価格についてはデータリソースまでお問合せください。
日本語のページは自動翻訳を利用し作成しています。
実際のレポートは英文のみでご納品いたします。

|

|
サマリー
レポート詳細
スマート空港技術市場レポート 2024-2034年:この調査レポートは、業界とその基礎となるダイナミクスをより良く理解することを望むなら、新たな収益ポケットを目指す大手企業にとって貴重なものとなるでしょう。異業種への進出や新地域での既存事業の拡大を目指す企業にも有用です。
人工知能(AI)と機械学習(ML)の融合: スマート空港運営に革命を起こす
AIとML技術のシームレスな統合は、スマート空港の進化に変革をもたらす。これらの最先端技術は、空港に予測分析を提供し、業務予測を容易にし、手荷物ルーティングを最適化し、セキュリティ脅威評価を強化する。AI主導のチャットボットやバーチャルアシスタントは、リアルタイムの情報や支援を提供することで旅客体験を再定義し、それによって旅客のエンゲージメント全体を向上させる。AIとMLの融合は、空港のプロセスを合理化するだけでなく、スマートな空港運営の効率性と有効性に貢献する、インテリジェントでデータ主導の意思決定の新時代の到来を告げる。
セキュリティと脅威検知の向上: スマートテクノロジーで空港の安全性を強化
空港にとってセキュリティは最重要課題であり、脅威の検知と対応能力を強化するために、スマートテクノロジーの導入が中心となっている。高度な監視システムは、生体認証やAIを活用した分析と相まって、強固なセキュリティ・インフラを形成している。特筆すべきは、スマートビデオ分析が不審な行動パターンを検出できる警戒の目として機能することである。このプロアクティブなアプローチにより、セキュリティ担当者は潜在的な脅威に迅速かつ効果的に対応できるようになり、スマート空港で実施されている安全・セキュリティ対策が強化される。
高い初期投資コストが市場成長を阻害
スマート空港技術市場の成長を妨げる主な課題の1つは、高度なシステムとインフラの導入に必要な多額の初期投資である。生体認証システム、自動手荷物ハンドリング、最先端のセキュリティ・サーベイランス・ソリューションといった最先端技術の統合には、空港当局や利害関係者の多大な財政負担が要求される。
こうした技術の導入には、高価なハードウェアやソフトウェアの取得だけでなく、既存のインフラに大幅な変更を加える必要が伴うことも多い。例えば、バイオメトリクスを組み込んだ高度な旅客処理システムの導入には、専用のスキャニング装置や顔認識カメラの設置、統合データベースの開発が必要になる場合がある。こうした資本集約的な試みは、特に予算が限られている空港の財源を圧迫する可能性があり、スマー ト技術を迅速に導入する妨げとなる。
市場調査レポートを購入する前にすべき質問とは?
-
スマート空港技術市場はどのように進化しているのか?
-
スマート空港技術市場の促進要因と抑制要因は何か?
-
各スマート空港技術のサブ市場セグメントは予測期間中にどのように成長し、2034年にこれらのサブ市場が占める収益はどの程度か?
-
2024年から2034年にかけて、各スマート空港技術サブマーケットの市場シェアはどのように推移するのか?
-
2024年から2034年にかけて市場全体を牽引する主な要因は何か?
-
主要なスマート空港技術市場はマクロ経済の動きに大枠で追随するのか、それとも個々の国内市場が他を凌駕するのか。
-
2034年までに各国市場のシェアはどのように変化し、2034年に市場をリードするのはどの地域か?
-
主要プレーヤーは誰で、予測期間中の見通しは?
-
これら大手企業のスマート空港技術プロジェクトとは?
-
2024年から2034年の間に、業界はどのように進化するのか?現在および今後10年間に実施されるスマート空港技術プロジェクトにはどのような意味があるのか?
-
スマート空港技術市場をさらに拡大するために、製品の商業化の必要性は高まっているか?
-
スマート空港技術市場はどこに向かっており、どのようにすれば市場の最前線に立てるか?
-
新製品やサービスラインに対する最適な投資オプションは何か?
-
企業を新たな成長軌道に乗せ、C-suiteに移行させるための重要な展望とは?
現在、そして今後10年間、スマート空港技術市場にどのような影響を与えるかを知る必要があります:
-
460ページにわたる本レポートは、131の表と204の図表で構成されています。
-
本レポートでは、業界における主要な有利分野をハイライトしているため、今すぐターゲットを絞ることができます。
-
世界、地域、国の売上と成長に関する詳細な分析が含まれています。
-
競合他社が成功した主なトレンド、変化、収益予測をハイライトしています。
本レポートは、スマート空港技術市場が今後10年間でどのように発展するか、またCOVID-19の景気後退と好転の変動に合わせてどのように発展するかをお伝えします。この市場は、過去10年間のどの時点よりも今が重要である。
2034年までの予測およびその他の分析により商業的展望が明らかに
-
2034年までの収益予測に加え、最新の業績、成長率、市場シェアを提供します。
-
ビジネスの展望と展開に関する独自の分析をご覧いただけます。
-
定性的分析(市場力学、促進要因、機会、阻害要因、課題を含む)、コスト構造、スマート空港技術の価格上昇の影響、最近の動向をご覧いただけます。
このレポートには、COVID-19が業界と貴社にどのような影響を与えるかについてのデータ分析と貴重な洞察が含まれています。COVID-19の4つの回復パターンとその影響、すなわち「V」、「L」、「W」、「U」について本レポートで論じています。
レポート対象セグメント
コンポーネント別市場セグメント
規模別市場セグメント
エンドユーザー別市場セグメント
-
空港当局および運営者
-
航空会社
-
地上ハンドラー
-
小売業者および免税業者
用途別市場セグメント
-
旅客処理
-
手荷物ハンドリングとトラッキング
-
セキュリティと監視
-
エアサイドおよびランドサイド業務
-
その他のアプリケーション
技術別市場セグメント
-
バイオメトリクスとアイデンティティ管理
-
モノのインターネット(IoT)デバイス
-
5Gネットワークとコネクティビティ
-
人工知能(AI)と機械学習(ML)
-
拡張現実(AR)と仮想現実(VR)
-
ロボティクスとオートメーション
世界市場全体とセグメント別の収益予測に加え、4つの地域と20の主要国市場の収益予測も掲載しています:
北米
欧州
-
ドイツ
-
スペイン
-
イギリス
-
フランス
-
イタリア
-
その他の欧州
アジア太平洋
-
中国
-
日本
-
インド
-
オーストラリア
-
韓国
-
その他のアジア太平洋地域
ラテンアメリカ
中東・アフリカ
また、2024年から2034年までのスマート空港技術市場の主要企業のプロファイルと、これらの企業のこのセグメントに焦点を当てたいくつかの企業についても記載しています。
主要企業と市場成長の可能性
-
Cisco Systems, Inc
-
Honeywell International Inc
-
Huawei Technologies Co., Ltd
-
Indra Sistemas, S.A.
-
International Business Machines Corporation
-
Leidos Holdings, Inc.
-
Materna IPS GmbH
-
NEC Corporation
-
Raytheon Technologies Corporation
-
Siemens AG
-
SITA
-
Thales Group
-
Unisys Corporation
-
Vanderlande Industries B.V
-
Vision-Box Holding
2024年から2034年にかけてのスマート空港技術市場の世界全体の売上高は、金額ベースで2024年に107億米ドルを突破する。2034年まで力強い収益成長を予測。当社の調査では、最も大きな可能性を秘めた企業を特定しています。彼らの能力、進歩、商業的展望を発見し、あなたが一歩先を行くのを支援します。
スマート空港技術市場、2024〜2034年レポートはどのように役立つのでしょうか?
要約すると、弊社の460ページを超えるレポートは以下の知識を提供します:
-
スマート空港技術市場の2024年から2034年までの収益予測 市場、コンポーネント、サイズ、エンドユーザー、アプリケーション、技術の各予測を世界および地域レベルで掲載 - 業界の将来性を発見し、投資と収益に最も有利な場所を見つけます。
-
4つの地域と20の主要国市場の2034年までの収益予測 - 北米、ヨーロッパ、アジア太平洋、ラテンアメリカ、中東&アフリカのスマート空港技術市場の2024年から2034年までの市場予測をご覧ください。また、米国、カナダ、ブラジル、ドイツ、フランス、英国、イタリア、中国、インド、日本、オーストラリアなどの主要国の市場も予測しています。
-
2024年から2034年までのスマート空港技術市場に関わる主要企業15社の企業プロファイルを含む、既存企業および市場参入を目指す企業の展望。
独自の予測による定量的・定性的分析をご覧いただけます。当レポートにしか掲載されていない情報を入手し、貴重なビジネスインテリジェンスで常に情報を得ることができます。
他では得られない情報
私たちの新しいレポートがあれば、知識に遅れをとったり、チャンスを逃したりする可能性が低くなります。Visiongainのレポートが貴社の調査、分析、意思決定にどのように役立つかをご覧ください。Visiongainの調査は、スマート空港技術市場、2024年から2034年、市場をリードする企業の商業分析を必要とするすべての人のためのものです。データ、トレンド、予測をご覧いただけます。
ページTOPに戻る
目次
目次
1 レポート概要
1.1 調査の目的
1.2 スマート空港技術市場の紹介
1.3 本レポートの内容
1.4 本レポートを読むべき理由
1.5 本分析レポートが回答する主な質問
1.6 本レポートは誰のためのものか?
1.7 方法論
1.7.1 市場の定義
1.7.2 市場評価・予測手法
1.7.3 データの検証
1.7.3.1 一次調査
1.7.3.2 セカンダリーリサーチ
1.8 よくある質問(FAQ)
1.9 Visiongainの関連レポート
1.10 Visiongainについて
2 エグゼクティブ・サマリー
3 市場概要
3.1 主要な調査結果
3.2 市場ダイナミクス
3.2.1 市場促進要因
3.2.1.1 市場成長を牽引するリアルタイム情報へのニーズの高まり
3.2.1.2 空港におけるセルフサービス技術の利用の増加が市場成長を促進
3.2.1.3 空港におけるセキュリティ重視の高まりが市場成長を促進
3.2.2 市場抑制要因
3.2.2.1 初期投資コストの高さが市場成長を妨げる
3.2.2.2 訓練を受けた経験豊富なスタッフの不足が市場成長を抑制する可能性がある
3.2.2.3 旅客の嗜好の把握が市場成長を妨げる
3.2.3 市場機会
3.2.3.1 デジタル化による空港運営の最適化が市場機会をもたらす
3.2.3.2 旅客体験の向上と小売収入
3.2.3.3 進化するスマート空港技術の展望は、パートナーシップとコラボレーションのための十分な機会を提供する
3.3 ポーターのファイブフォース分析
3.3.1 サプライヤーの交渉力(中)
3.3.2 買い手の交渉力(中~高)
3.3.3 競争上のライバル(高)
3.3.4 代替品による脅威(低)
3.3.5 新規参入の脅威(低)
3.4 COVID-19の影響分析
3.4.1 "V字型回復"
3.4.2 "U字型回復"
3.4.3 "W字型回復"
3.4.4 "L字型回復"
3.5 PEST分析
4 スマート空港技術市場分析:コンポーネント別
4.1 主要な調査結果
4.2 コンポーネントセグメント 市場魅力度指数
4.3 スマート空港技術のコンポーネント別市場規模推定と予測
4.4 ハードウェア
4.4.1 2024〜2034年の地域別市場規模(US$ Billion)
4.4.2 地域別市場シェア、2024年・2034年(%)
4.5 ソフトウェア
4.5.1 2024〜2034年の地域別市場規模(US$ Billion)
4.5.2 地域別市場シェア、2024年・2034年(%)
5 スマート空港技術市場分析:規模別
5.1 主要調査結果
5.2 規模別セグメント 市場魅力度指数
5.3 スマート空港技術市場の規模別推定と予測
5.4 大規模空港
5.4.1 2024〜2034年の地域別市場規模(US$ Billion)
5.4.2 地域別市場シェア、2024年・2034年(%)
5.5 中規模空港
5.5.1 2024〜2034年の地域別市場規模(US$ Billion)
5.5.2 地域別市場シェア、2024年・2034年(%)
5.6 小規模空港
5.6.1 2024〜2034年の地域別市場規模(US$ Billion)
5.6.2 地域別市場シェア、2024年・2034年(%)
6 スマート空港技術市場分析:エンドユーザー別
6.1 主要調査結果
6.2 エンドユーザーセグメント 市場魅力度指数
6.3 スマート空港技術のエンドユーザー別市場規模推定と予測
6.4 空港当局と空港運営者
6.4.1 2024〜2034年の地域別市場規模(US$ Billion)
6.4.2 地域別市場シェア、2024年・2034年(%)
6.5 航空会社
6.5.1 2024〜2034年の地域別市場規模(US$ Billion)
6.5.2 地域別市場シェア、2024年・2034年(%)
6.6 地上ハンドラー
6.6.1 2024〜2034年の地域別市場規模(US$ Billion)
6.6.2 地域別市場シェア、2024年・2034年(%)
6.7 小売業者および免税事業者
6.7.1 2024〜2034年の地域別市場規模(US$ Billion)
6.7.2 地域別市場シェア、2024年・2034年(%)
7 スマート空港技術市場分析:用途別
7.1 主要な調査結果
7.2 アプリケーションセグメント 市場魅力度指数
7.3 スマート空港技術の用途別市場規模推定と予測
7.4 旅客処理
7.4.1 2024〜2034年の地域別市場規模(US$ Billion)
7.4.2 地域別市場シェア、2024年・2034年(%)
7.5 手荷物処理と追跡
7.5.1 2024〜2034年の地域別市場規模(US$ Billion)
7.5.2 地域別市場シェア、2024年・2034年(%)
7.6 セキュリティと監視
7.6.1 2024〜2034年の地域別市場規模(US$ Billion)
7.6.2 地域別市場シェア、2024年・2034年(%)
7.7 エアサイドおよびランドサイド業務
7.7.1 2024〜2034年の地域別市場規模(US$ Billion)
7.7.2 地域別市場シェア、2024年・2034年(%)
7.8 その他の用途
7.8.1 2024〜2034年の地域別市場規模(US$ Billion)
7.8.2 地域別市場シェア、2024年・2034年(%)
8 スマート空港技術市場分析:技術別
8.1 主要調査結果
8.2 技術セグメント 市場魅力度指数
8.3 スマート空港技術の技術別市場規模推定と予測
8.4 バイオメトリクスとアイデンティティ管理
8.4.1 2024〜2034年の地域別市場規模(US$ Million)
8.4.2 地域別市場シェア、2024年・2034年(%)
8.5 モノのインターネット(IoT)デバイス
8.5.1 2024~2034年の地域別市場規模(US$ Million)
8.5.2 地域別市場シェア、2024年・2034年(%)
8.6 5Gネットワークとコネクティビティ
8.6.1 2024~2034年の地域別市場規模(US$ Million)
8.6.2 地域別市場シェア、2024年・2034年(%)
8.7 人工知能(AI)と機械学習(ML)
8.7.1 2024~2034年の地域別市場規模(US$ Million)
8.7.2 地域別市場シェア、2024年・2034年(%)
8.8 拡張現実(AR)と仮想現実(VR)
8.8.1 2024〜2034年の地域別市場規模(US$ Million)
8.8.2 地域別市場シェア、2024年・2034年(%)
8.9 ロボティクスとオートメーション
8.9.1 2024〜2034年の地域別市場規模(US$ Million)
8.9.2 地域別市場シェア、2024年・2034年(%)
9 スマート空港技術市場分析:地域別
9.1 主要な調査結果
9.2 地域別市場規模の推定と予測
10 北米のスマート空港技術市場分析
10.1 主要な調査結果
10.2 北米のスマート空港技術市場の魅力度指数
10.3 北米のスマート空港技術市場の国別市場規模、2024年、2029年、2034年(US$ Billion)
10.4 北米のスマート空港技術市場規模推定と予測
10.5 北米のスマート空港技術市場規模推定と予測:国別
10.6 北米のスマート空港技術市場規模推定と予測:コンポーネント別
10.7 北米のスマート空港技術市場規模推定と予測:サイズ別
10.8 北米のスマート空港技術市場規模推定と予測:エンドユーザー別
10.9 北米のスマート空港技術市場規模推定と予測:用途別
10.10 北米のスマート空港技術市場規模推定と予測:技術別
10.11 アメリカのスマート空港技術市場分析
10.12 カナダのスマート空港技術市場分析
11 欧州のスマート空港技術市場分析
11.1 主要な調査結果
11.2 欧州スマート空港技術市場魅力度指数
11.3 欧州のスマート空港技術の国別市場、2024年、2029年、2034年(US$ Billion)
11.4 欧州のスマート空港技術市場規模推定と予測
11.5 欧州のスマート空港技術市場規模推定と予測:国別
11.6 欧州のスマート空港技術市場規模推定と予測:コンポーネント別
11.7 欧州のスマート空港技術市場規模推定と予測:サイズ別
11.8 欧州のスマート空港技術市場規模推定と予測:エンドユーザー別
11.9 欧州のスマート空港技術市場規模推定と予測:用途別
11.10 欧州のスマート空港技術市場規模推定と予測:技術別
11.11 ドイツのスマート空港技術市場分析
11.12 イギリスのスマート空港技術市場分析
11.13 フランスのスマート空港技術市場分析
11.14 イタリアのスマート空港技術市場分析
11.15 スペインのスマート空港技術市場分析
11.16 その他の欧州のスマート空港技術市場分析
12 アジア太平洋地域のスマート空港技術市場分析
12.1 主要な調査結果
12.2 アジア太平洋地域のスマート空港技術市場魅力度指数
12.3 アジア太平洋地域のスマート空港技術国別市場、2024年、2029年、2034年(US$ Billion)
12.4 アジア太平洋地域のスマート空港技術市場規模推定と予測
12.5 アジア太平洋地域のスマート空港技術市場規模推定と予測:国別
12.6 アジア太平洋地域のスマート空港技術市場規模推定と予測:コンポーネント別
12.7 アジア太平洋地域のスマート空港技術市場規模推定と予測:サイズ別
12.8 アジア太平洋地域のスマート空港技術市場規模推定と予測:エンドユーザー別
12.9 アジア太平洋地域のスマート空港技術市場規模推定と予測:用途別
12.10 アジア太平洋地域のスマート空港技術市場規模推定と予測:技術別
12.11 中国のスマート空港技術市場分析
12.12 インドのスマート空港技術市場分析
12.13 日本のスマート空港技術市場分析
12.14 韓国のスマート空港技術市場分析
12.15 オーストラリアのスマート空港技術市場分析
12.16 その他のアジア太平洋地域のスマート空港技術市場分析
13 中東・アフリカのスマート空港技術市場分析
13.1 主要な調査結果
13.2 中東・アフリカのスマート空港技術市場魅力度指数
13.3 中東・アフリカのスマート空港技術国別市場2024年、2029年、2034年)(US$ Billion
13.4 中東・アフリカのスマート空港技術市場規模推定と予測
13.5 中東・アフリカのスマート空港技術市場規模推定と予測:国別
13.6 中東・アフリカのスマート空港技術市場規模推定と予測:コンポーネント別
13.7 中東・アフリカのスマート空港技術市場規模推定と予測:サイズ別
13.8 中東・アフリカのスマート空港技術市場規模推定と予測:エンドユーザー別
13.9 中東・アフリカのスマート空港技術市場規模推定と予測:用途別
13.10 中東・アフリカのスマート空港技術市場規模推定と予測:技術別
13.11 GCCのスマート空港技術市場分析
13.12 南アフリカのスマート空港技術市場分析
13.13 その他の中東・アフリカ地域のスマート空港技術市場分析
14 ラテンアメリカのスマート空港技術の市場分析
14.1 主要な調査結果
14.2 ラテンアメリカのスマート空港技術市場魅力度指数
14.3 ラテンアメリカのスマート空港技術市場の国別市場規模、2024年、2029年、2034年(US$ Billion)
14.4 ラテンアメリカのスマート空港技術市場規模推定と予測
14.5 ラテンアメリカのスマート空港技術市場規模推定と予測:国別
14.6 ラテンアメリカのスマート空港技術市場規模推定と予測:コンポーネント別
14.7 ラテンアメリカのスマート空港技術市場規模推定と予測:サイズ別
14.8 ラテンアメリカのスマート空港技術市場規模推定と予測:エンドユーザー別
14.9 ラテンアメリカのスマート空港技術市場規模推定と予測:用途別
14.10 ラテンアメリカのスマート空港技術市場規模推定と予測:技術別
14.11 ブラジルのスマート空港技術市場分析
14.12 メキシコのスマート空港技術市場分析
14.13 その他のラテンアメリカのスマート空港技術市場分析
15 会社概要
15.1 競争環境、2022年
15.2 戦略的展望
15.3 SITA
15.3.1 会社概要
15.3.2 会社概要
15.3.3 製品ベンチマーク
15.3.4 戦略的展望
15.4 Honeywell International Inc
15.4.1 会社概要
15.4.2 会社概要
15.4.3 財務分析
15.4.3.1 純収入、2018-2022年
15.4.3.2 R&D、2018-2022年
15.4.3.3 地域別収益シェア、2022年(%)
15.4.3.4 事業セグメント収益シェア、2022年(%)
15.4.4 製品ベンチマーク
15.4.5 戦略的展望
15.5 Cisco Systems, Inc
15.5.1 会社概要
15.5.2 会社概要
15.5.3 財務分析
15.5.3.1 純収入、2019-2023年
15.5.3.2 R&D、2019-2023年
15.5.3.3 地域別収益シェア、2023年(%)
15.5.3.4 事業セグメント収益シェア、2023年(%)
15.5.4 製品ベンチマーク
15.5.5 戦略的展望
15.6 Siemens AG
15.6.1 会社概要
15.6.2 会社概要
15.6.3 財務分析
15.6.3.1 純収入、2019-2023年
15.6.3.2 R&D、2019-2023年
15.6.3.3 地域別収益シェア、2023年(%)
15.6.3.4 事業セグメント収益シェア、2023年(%)
15.6.4 製品ベンチマーク
15.6.5 戦略的展望
15.7 International Business Machines Corporation
15.7.1 会社概要
15.7.2 会社概要
15.7.3 財務分析
15.7.3.1 純収入、2018-2022年
15.7.3.2 R&D、2018-2022年
15.7.3.3 地域別収益シェア、2022年(%)
15.7.3.4 事業セグメント収益シェア、2022年(%)
15.7.4 製品ベンチマーク
15.7.5 戦略的展望
15.8 Thales Group
15.8.1 会社概要
15.8.2 会社概要
15.8.3 財務分析
15.8.3.1 純収入、2018-2022年
15.8.4 製品ベンチマーク
15.8.5 戦略的展望
15.9 NEC Corporation
15.9.1 会社概要
15.9.2 会社概要
15.9.3 財務分析
15.9.3.1 純収入(2019-2023年
15.9.3.2 R&D(2019年~2023年
15.9.3.3 事業セグメント収益シェア、2023年(%)
15.9.4 製品ベンチマーク
15.9.5 戦略的展望
15.10 Raytheon Technologies Corporation
15.10.1 会社概要
15.10.2 会社概要
15.10.3 財務分析
15.10.3.1 純収入、2018年~2022年
15.10.3.2 R&D、2018年~2022年
15.10.3.3 地域別収益シェア、2022年(%)
15.10.3.4 事業セグメント収益シェア、2022年(%)
15.10.4 製品ベンチマーク
15.10.5 戦略的展望
15.11 Indra Sistemas, S.A.
15.11.1 会社概要
15.11.2 会社概要
15.11.3 財務分析
15.11.3.1 純収入、2018-2022年
15.11.4 製品ベンチマーク
15.11.5 戦略的展望
15.12 Vanderlande Industries B.V
15.12.1 会社概要
15.12.2 会社概要
15.12.3 財務分析
15.12.3.1 純収入、2018-2022年
15.12.3.2 R&D、2018-2022年
15.12.3.3 地域別収入シェア、2022年(%)
15.12.3.4 事業セグメント収益シェア、2022年(%)
15.12.4 製品ベンチマーク
15.12.5 戦略的展望
15.13 Huawei Technologies Co., Ltd
15.13.1 会社概要
15.13.2 会社概要
15.13.3 財務分析
15.13.3.1 純収入、2018-2022年
15.13.3.2 R&D、2018年~2022年
15.13.3.3 地域別収益シェア、2022年(%)
15.13.3.4 事業セグメント収益シェア、2022年(%)
15.13.4 製品ベンチマーク
15.13.5 戦略的展望
15.14 Unisys Corporation
15.14.1 会社概要
15.14.2 会社概要
15.14.3 財務分析
15.14.3.1 純収入、2018年~2022年
15.14.3.2 R&D、2018年~2022年
15.14.4 製品ベンチマーク
15.14.5 戦略的展望
15.15 Leidos Holdings, Inc.
15.15.1 会社概要
15.15.2 会社概要
15.15.3 財務分析
15.15.3.1 純収入、2018-2022年
15.15.3.2 R&D、2018年〜2022年
15.15.3.3 地域別収益シェア、2022年(%)
15.15.3.4 事業セグメント収益シェア、2022年(%)
15.15.4 製品ベンチマーク
15.15.5 戦略的展望
15.16 Vision-Box Holding
15.16.1 会社概要
15.16.2 会社概要
15.16.3 製品ベンチマーク
15.16.4 戦略的展望
15.17 Materna IPS GmbH
15.17.1 会社概要
15.17.2 会社概要
15.17.3 製品ベンチマーク
15.17.4 戦略的展望
16 結論と提言
16.1 Visiongainからの結びの言葉
16.2 市場プレイヤーへの提言
ページTOPに戻る
図表リスト
表の一覧
Table 1 Smart Airport Technologies Market Snapshot, 2024 & 2034 (US$ Billion, CAGR %)
Table 2 Global Smart Airport Technologies Market by Region, 2024-2034 (US$ Bn, AGR (%), CAGR (%)) (V-Shaped Recovery Scenario)
Table 3 Global Smart Airport Technologies Market by Region, 2024-2034 (US$ Bn, AGR (%), CAGR (%)) (U-Shaped Recovery Scenario)
Table 4 Global Smart Airport Technologies Market by Region, 2024-2034 (US$ Bn, AGR (%), CAGR (%)) (W-Shaped Recovery Scenario)
Table 5 Global Smart Airport Technologies Market by Region, 2024-2034 (US$ Bn, AGR (%), CAGR (%)) (L-Shaped Recovery Scenario)
Table 6 Global Smart Airport Technologies Market by Component, 2024-2034 (US$ Bn, AGR (%), CAGR (%))
Table 7 Hardware Market by Region, 2024-2034 (US$ Bn, AGR (%), CAGR (%))
Table 8 Software Market by Region, 2024-2034 (US$ Bn, AGR (%), CAGR (%))
Table 9 Global Smart Airport Technologies Market by Size, 2024-2034 (US$ Bn, AGR (%), CAGR (%))
Table 10 Large Airports Market by Region, 2024-2034 (US$ Bn, AGR (%), CAGR (%))
Table 11 Medium-Sized Airports Market by Region, 2024-2034 (US$ Bn, AGR (%), CAGR (%))
Table 12 Small Airports Market by Region, 2024-2034 (US$ Bn, AGR (%), CAGR (%))
Table 13 Global Smart Airport Technologies Market by End-User, 2024-2034 (US$ Bn, AGR (%), CAGR (%))
Table 14 Airport Authorities and Operators Market by Region, 2024-2034 (US$ Bn, AGR (%), CAGR (%))
Table 15 Airlines Market by Region, 2024-2034 (US$ Bn, AGR (%), CAGR (%))
Table 16 Ground Handlers Market by Region, 2024-2034 (US$ Bn, AGR (%), CAGR (%))
Table 17 Retailers and Duty-Free Operators Market by Region, 2024-2034 (US$ Bn, AGR (%), CAGR (%))
Table 18 Global Smart Airport Technologies Market by Application, 2024-2034 (US$ Bn, AGR (%), CAGR (%))
Table 19 Passenger Processing Market by Region, 2024-2034 (US$ Bn, AGR (%), CAGR (%))
Table 20 Baggage Handling and Tracking Market by Region, 2024-2034 (US$ Bn, AGR (%), CAGR (%))
Table 21 Security and Surveillance Market by Region, 2024-2034 (US$ Bn, AGR (%), CAGR (%))
Table 22 Airside and Landside Operations Market by Region, 2024-2034 (US$ Bn, AGR (%), CAGR (%))
Table 23 Other Applications Market by Region, 2024-2034 (US$ Bn, AGR (%), CAGR (%))
Table 24 Global Smart Airport Technologies Market by Technology, 2024-2034 (US$ Bn, AGR (%), CAGR (%))
Table 25 Biometrics and Identity Management Market by Region, 2024-2034 (US$ Bn, AGR (%), CAGR (%))
Table 26 Internet of Things (IoT) Devices Market by Region, 2024-2034 (US$ Bn, AGR (%), CAGR (%))
Table 27 5G Networks and Connectivity Market by Region, 2024-2034 (US$ Bn, AGR (%), CAGR (%))
Table 28 Artificial Intelligence (AI) and Machine Learning (ML) Market by Region, 2024-2034 (US$ Bn, AGR (%), CAGR (%))
Table 29 Augmented Reality (AR) and Virtual Reality (VR) Market by Region, 2024-2034 (US$ Bn, AGR (%), CAGR (%))
Table 30 Robotics and Automation Market by Region, 2024-2034 (US$ Bn, AGR (%), CAGR (%))
Table 31 Smart Airport Technologies Market Forecast by Region, 2024-2034 (US$ Billion, AGR%, CAGR%)
Table 32 North America Smart Airport Technologies Market by Value, 2024-2034 (US$ Bn, AGR (%), CAGR (%))
Table 33 North America Smart Airport Technologies Market by Country, 2024-2034 (US$ Bn, AGR (%), CAGR (%))
Table 34 North America Smart Airport Technologies Market by Component, 2024-2034 (US$ Bn, AGR (%), CAGR (%))
Table 35 North America Smart Airport Technologies Market by Size, 2024-2034 (US$ Bn, AGR (%), CAGR (%))
Table 36 North America Smart Airport Technologies Market by End-User, 2024-2034 (US$ Bn, AGR (%), CAGR (%))
Table 37 North America Smart Airport Technologies Market by Application, 2024-2034 (US$ Bn, AGR (%), CAGR (%))
Table 38 North America Smart Airport Technologies Market by Technology, 2024-2034 (US$ Bn, AGR (%), CAGR (%))
Table 39 US Smart Airport Technologies Market by Value, 2024-2034 (US$ Bn, AGR (%), CAGR (%))
Table 40 Canada Smart Airport Technologies Market by Value, 2024-2034 (US$ Bn, AGR (%), CAGR (%))
Table 41 Europe Smart Airport Technologies Market by Value, 2024-2034 (US$ Bn, AGR (%), CAGR (%))
Table 42 Europe Smart Airport Technologies Market by Country, 2024-2034 (US$ Bn, AGR (%), CAGR (%))
Table 43 Europe Smart Airport Technologies Market by Component, 2024-2034 (US$ Bn, AGR (%), CAGR (%))
Table 44 Europe Smart Airport Technologies Market by Size, 2024-2034 (US$ Bn, AGR (%), CAGR (%))
Table 45 Europe Smart Airport Technologies Market by End-User, 2024-2034 (US$ Bn, AGR (%), CAGR (%))
Table 46 Europe Smart Airport Technologies Market by Application, 2024-2034 (US$ Bn, AGR (%), CAGR (%))
Table 47 Europe Smart Airport Technologies Market by Technology, 2024-2034 (US$ Bn, AGR (%), CAGR (%))
Table 48 Germany Smart Airport Technologies Market by Value, 2024-2034 (US$ Bn, AGR (%), CAGR (%))
Table 49 UK Smart Airport Technologies Market by Value, 2024-2034 (US$ Bn, AGR (%), CAGR (%))
Table 50 France Smart Airport Technologies Market by Value, 2024-2034 (US$ Bn, AGR (%), CAGR (%))
Table 51 Italy Smart Airport Technologies Market by Value, 2024-2034 (US$ Bn, AGR (%), CAGR (%))
Table 52 Spain Smart Airport Technologies Market by Value, 2024-2034 (US$ Bn, AGR (%), CAGR (%))
Table 53 Rest of Europe Smart Airport Technologies Market by Value, 2024-2034 (US$ Bn, AGR (%), CAGR (%))
Table 54 Asia-Pacific Smart Airport Technologies Market by Value, 2024-2034 (US$ Bn, AGR (%), CAGR (%))
Table 55 Asia-Pacific Smart Airport Technologies Market by Country, 2024-2034 (US$ Bn, AGR (%), CAGR (%))
Table 56 Asia-Pacific Smart Airport Technologies Market by Component, 2024-2034 (US$ Bn, AGR (%), CAGR (%))
Table 57 Asia-Pacific Smart Airport Technologies Market by Size, 2024-2034 (US$ Bn, AGR (%), CAGR (%))
Table 58 Asia-Pacific Smart Airport Technologies Market by End-User, 2024-2034 (US$ Bn, AGR (%), CAGR (%))
Table 59 Asia-Pacific Smart Airport Technologies Market by Application, 2024-2034 (US$ Bn, AGR (%), CAGR (%))
Table 60 Asia-Pacific Smart Airport Technologies Market by Technology, 2024-2034 (US$ Bn, AGR (%), CAGR (%))
Table 61 China Smart Airport Technologies Market by Value, 2024-2034 (US$ Bn, AGR (%), CAGR (%))
Table 62 India Smart Airport Technologies Market by Value, 2024-2034 (US$ Bn, AGR (%), CAGR (%))
Table 63 Japan Smart Airport Technologies Market by Value, 2024-2034 (US$ Bn, AGR (%), CAGR (%))
Table 64 South Korea Smart Airport Technologies Market by Value, 2024-2034 (US$ Bn, AGR (%), CAGR (%))
Table 65 Australia Smart Airport Technologies Market by Value, 2024-2034 (US$ Bn, AGR (%), CAGR (%))
Table 66 Rest of Asia-Pacific Smart Airport Technologies Market by Value, 2024-2034 (US$ Bn, AGR (%), CAGR (%))
Table 67 Middle East & Africa Smart Airport Technologies Market by Value, 2024-2034 (US$ Bn, AGR (%), CAGR (%))
Table 68 Middle East & Africa Smart Airport Technologies Market by Country, 2024-2034 (US$ Bn, AGR (%), CAGR (%))
Table 69 Middle East & Africa Smart Airport Technologies Market by Component, 2024-2034 (US$ Bn, AGR (%), CAGR (%))
Table 70 Middle East & Africa Smart Airport Technologies Market by Size, 2024-2034 (US$ Bn, AGR (%), CAGR (%))
Table 71 Middle East & Africa Smart Airport Technologies Market by End-User, 2024-2034 (US$ Bn, AGR (%), CAGR (%))
Table 72 Middle East & Africa Smart Airport Technologies Market by Application, 2024-2034 (US$ Bn, AGR (%), CAGR (%))
Table 73 Middle East & Africa Smart Airport Technologies Market by Technology, 2024-2034 (US$ Bn, AGR (%), CAGR (%))
Table 74 GCC Smart Airport Technologies Market by Value, 2024-2034 (US$ Bn, AGR (%), CAGR (%))
Table 75 South Africa Smart Airport Technologies Market by Value, 2024-2034 (US$ Bn, AGR (%), CAGR (%))
Table 76 Rest of Middle East & Africa Smart Airport Technologies Market by Value, 2024-2034 (US$ Bn, AGR (%), CAGR (%))
Table 77 Latin America Smart Airport Technologies Market by Value, 2024-2034 (US$ Bn, AGR (%), CAGR (%))
Table 78 Latin America Smart Airport Technologies Market by Country, 2024-2034 (US$ Bn, AGR (%), CAGR (%))
Table 79 Latin America Smart Airport Technologies Market by Component, 2024-2034 (US$ Bn, AGR (%), CAGR (%))
Table 80 Latin America Smart Airport Technologies Market by Size, 2024-2034 (US$ Bn, AGR (%), CAGR (%))
Table 81 Latin America Smart Airport Technologies Market by End-User, 2024-2034 (US$ Bn, AGR (%), CAGR (%))
Table 82 Latin America Smart Airport Technologies Market by Application, 2024-2034 (US$ Bn, AGR (%), CAGR (%))
Table 83 Latin America Smart Airport Technologies Market by Technology, 2024-2034 (US$ Bn, AGR (%), CAGR (%))
Table 84 Brazil Smart Airport Technologies Market by Value, 2024-2034 (US$ Bn, AGR (%), CAGR (%))
Table 85 Mexico Smart Airport Technologies Market by Value, 2024-2034 (US$ Bn, AGR (%), CAGR (%))
Table 86 Rest of Latin America Smart Airport Technologies Market by Value, 2024-2034 (US$ Bn, AGR (%), CAGR (%))
Table 87 Strategic Outlook – Recent Developments In The Global Market
Table 88 SITA: Key Details, (CEO, HQ, Revenue, Founded, No. of Employees, Company Type, Website, Business Segment)
Table 89 SITA: Product Benchmarking
Table 90 SITA: Strategic Outlook
Table 91 Honeywell International Inc: Key Details, (CEO, HQ, Revenue, Founded, No. of Employees, Company Type, Website, Business Segment)
Table 92 Honeywell International Inc: Product Benchmarking
Table 93 Honeywell International Inc: Strategic Outlook
Table 94 Cisco Systems, Inc: Key Details, (CEO, HQ, Revenue, Founded, No. of Employees, Company Type, Website, Business Segment)
Table 95 Cisco Systems, Inc: Product Benchmarking
Table 96 Cisco Systems, Inc: Strategic Outlook
Table 97 Siemens AG: Key Details, (CEO, HQ, Revenue, Founded, No. of Employees, Company Type, Website, Business Segment)
Table 98 Siemens AG: Product Benchmarking
Table 99 Siemens AG: Strategic Outlook
Table 100 International Business Machines Corporation: Key Details, (CEO, HQ, Revenue, Founded, No. of Employees, Company Type, Website, Business Segment)
Table 101 International Business Machines Corporation: Product Benchmarking
Table 102 International Business Machines Corporation: Strategic Outlook
Table 103 Thales Group: Key Details, (CEO, HQ, Revenue, Founded, No. of Employees, Company Type, Website, Business Segment)
Table 104 Thales Group: Product Benchmarking
Table 105 Thales Group: Strategic Outlook
Table 106 NEC Corporation: Key Details, (CEO, HQ, Revenue, Founded, No. of Employees, Company Type, Website, Business Segment)
Table 107 NEC Corporation: Product Benchmarking
Table 108 NEC Corporation: Strategic Outlook
Table 109 Raytheon Technologies Corporation: Key Details, (CEO, HQ, Revenue, Founded, No. of Employees, Company Type, Website, Business Segment)
Table 110 Raytheon Technologies Corporation: Product Benchmarking
Table 111 Raytheon Technologies Corporation: Strategic Outlook
Table 112 Indra Sistemas, S.A.: Key Details, (CEO, HQ, Revenue, Founded, No. of Employees, Company Type, Website, Business Segment)
Table 113 Indra Sistemas, S.A.: Product Benchmarking
Table 114 Indra Sistemas, S.A.: Strategic Outlook
Table 115 Vanderlande Industries B.V: Key Details, (CEO, HQ, Revenue, Founded, No. of Employees, Company Type, Website, Business Segment)
Table 116 Vanderlande Industries B.V: Product Benchmarking
Table 117 Vanderlande Industries B.V: Strategic Outlook
Table 118 Huawei Technologies Co., Ltd: Key Details, (CEO, HQ, Revenue, Founded, No. of Employees, Company Type, Website, Business Segment)
Table 119 Huawei Technologies Co., Ltd: Product Benchmarking
Table 120 Huawei Technologies Co., Ltd: Strategic Outlook
Table 121 Unisys Corporation: Key Details, (CEO, HQ, Revenue, Founded, No. of Employees, Company Type, Website, Business Segment)
Table 122 Unisys Corporation: Product Benchmarking
Table 123 Unisys Corporation: Strategic Outlook
Table 124 Leidos Holdings, Inc.: Key Details, (CEO, HQ, Revenue, Founded, No. of Employees, Company Type, Website, Business Segment)
Table 125 Leidos Holdings, Inc.: Product Benchmarking
Table 126 Leidos Holdings, Inc.: Strategic Outlook
Table 127 Vision-Box Holding: Key Details, (CEO, HQ, Revenue, Founded, No. of Employees, Company Type, Website, Business Segment)
Table 128 Vision-Box Holding: Product Benchmarking
Table 129 Vision-Box Holding: Strategic Outlook
Table 130 Materna IPS GmbH: Key Details, (CEO, HQ, Revenue, Founded, No. of Employees, Company Type, Website, Business Segment)
Table 131 Materna IPS GmbH: Product Benchmarking
Table 132 Materna IPS GmbH: Strategic Outlook
図の一覧
Figure 1 Smart Airport Technologies Market Segmentation
Figure 2 Smart Airport Technologies Market by Component: Market Attractiveness Index
Figure 3 Smart Airport Technologies Market by Size: Market Attractiveness Index
Figure 4 Smart Airport Technologies Market by End-User: Market Attractiveness Index
Figure 5 Smart Airport Technologies Market by Application: Market Attractiveness Index
Figure 6 Smart Airport Technologies Market by Technology: Market Attractiveness Index
Figure 7 Smart Airport Technologies Market Attractiveness Index by Region
Figure 8 Smart Airport Technologies Market: Market Dynamics
Figure 9 Smart Airport Technologies Market: Porter’s Five Forces Analysis
Figure 10 Global Smart Airport Technologies Market Share Forecast by COVID, 2024-2034 (%)
Figure 11 Global Smart Airport Technologies Market by Region, 2024-2034 (US$ Bn, AGR (%)) (V-Shaped Recovery Scenario)
Figure 12 Global Smart Airport Technologies Market by Region, 2024-2034 (US$ Bn, AGR (%)) (U-Shaped Recovery Scenario)
Figure 13 Global Smart Airport Technologies Market by Region, 2024-2034 (US$ Bn, AGR (%)) (W-Shaped Recovery Scenario)
Figure 14 Global Smart Airport Technologies Market by Region, 2024-2034 (US$ Bn, AGR (%)) (L-Shaped Recovery Scenario)
Figure 15 Smart Airport Technologies Market: PEST Analysis
Figure 16 Smart Airport Technologies Market by Component: Market Attractiveness Index
Figure 17 Global Smart Airport Technologies Market by Component, 2024-2034 (US$ Bn, AGR (%))
Figure 18 Smart Airport Technologies Market Share Forecast by Component, 2024, 2029, 2034 (%)
Figure 19 Hardware Market by Region, 2024-2034 (US$ Bn, AGR (%))
Figure 20 Hardware Market Share Forecast by Region, 2024 & 2034 (%)
Figure 21 Software Market by Region, 2024-2034 (US$ Bn, AGR (%))
Figure 22 Software Market Share Forecast by Region, 2024 & 2034 (%)
Figure 23 Smart Airport Technologies Market by Size: Market Attractiveness Index
Figure 24 Global Smart Airport Technologies Market by Size, 2024-2034 (US$ Bn, AGR (%))
Figure 25 Smart Airport Technologies Market Share Forecast by Size, 2024, 2029, 2034 (%)
Figure 26 Large Airports Market by Region, 2024-2034 (US$ Bn, AGR (%))
Figure 27 Large Airports Market Share Forecast by Region, 2024 & 2034 (%)
Figure 28 Medium-Sized Airports Market by Region, 2024-2034 (US$ Bn, AGR (%))
Figure 29 Medium-Sized Airports Market Share Forecast by Region, 2024 & 2034 (%)
Figure 30 Small Airports Market by Region, 2024-2034 (US$ Bn, AGR (%))
Figure 31 Small Airports Market Share Forecast by Region, 2024 & 2034 (%)
Figure 32 Smart Airport Technologies Market by End-User: Market Attractiveness Index
Figure 33 Global Smart Airport Technologies Market by End-User, 2024-2034 (US$ Bn, AGR (%))
Figure 34 Smart Airport Technologies Market Share Forecast by End-User, 2024, 2029, 2034 (%)
Figure 35 Airport Authorities and Operators Market by Region, 2024-2034 (US$ Bn, AGR (%))
Figure 36 Airport Authorities and Operators Market Share Forecast by Region, 2024 & 2034 (%)
Figure 37 Airlines Market by Region, 2024-2034 (US$ Bn, AGR (%))
Figure 38 Airlines Market Share Forecast by Region, 2024 & 2034 (%)
Figure 39 Ground Handlers Market by Region, 2024-2034 (US$ Bn, AGR (%))
Figure 40 Ground Handlers Market Share Forecast by Region, 2024 & 2034 (%)
Figure 41 Retailers and Duty-Free Operators Market by Region, 2024-2034 (US$ Bn, AGR (%))
Figure 42 Retailers and Duty-Free Operators Market Share Forecast by Region, 2024 & 2034 (%)
Figure 43 Smart Airport Technologies Market by Application: Market Attractiveness Index
Figure 44 Global Smart Airport Technologies Market by Application, 2024-2034 (US$ Bn, AGR (%))
Figure 45 Smart Airport Technologies Market Share Forecast by Application, 2024, 2029, 2034 (%)
Figure 46 Passenger Processing Market by Region, 2024-2034 (US$ Bn, AGR (%))
Figure 47 Passenger Processing Market Share Forecast by Region, 2024 & 2034 (%)
Figure 48 Baggage Handling and Tracking Market by Region, 2024-2034 (US$ Bn, AGR (%))
Figure 49 Baggage Handling and Tracking Market Share Forecast by Region, 2024 & 2034 (%)
Figure 50 Security and Surveillance Market by Region, 2024-2034 (US$ Bn, AGR (%))
Figure 51 Security and Surveillance Market Share Forecast by Region, 2024 & 2034 (%)
Figure 52 Airside and Landside Operations Market by Region, 2024-2034 (US$ Bn, AGR (%))
Figure 53 Airside and Landside Operations Market Share Forecast by Region, 2024 & 2034 (%)
Figure 54 Other Applications Market by Region, 2024-2034 (US$ Bn, AGR (%))
Figure 55 Other Applications Market Share Forecast by Region, 2024 & 2034 (%)
Figure 56 Smart Airport Technologies Market by Technology: Market Attractiveness Index
Figure 57 Global Smart Airport Technologies Market by Technology, 2024-2034 (US$ Bn, AGR (%))
Figure 58 Smart Airport Technologies Market Share Forecast by Technology, 2024, 2029, 2034 (%)
Figure 59 Biometrics and Identity Management Market by Region, 2024-2034 (US$ Bn, AGR (%))
Figure 60 Biometrics and Identity Management Market Share Forecast by Region, 2024 & 2034 (%)
Figure 61 Internet of Things (IoT) Devices Market by Region, 2024-2034 (US$ Bn, AGR (%))
Figure 62 Internet of Things (IoT) Devices Market Share Forecast by Region, 2024 & 2034 (%)
Figure 63 5G Networks and Connectivity Market by Region, 2024-2034 (US$ Bn, AGR (%))
Figure 64 5G Networks and Connectivity Market Share Forecast by Region, 2024 & 2034 (%)
Figure 65 Artificial Intelligence (AI) and Machine Learning (ML) Market by Region, 2024-2034 (US$ Bn, AGR (%))
Figure 66 Artificial Intelligence (AI) and Machine Learning (ML) Market Share Forecast by Region, 2024 & 2034 (%)
Figure 67 Augmented Reality (AR) and Virtual Reality (VR) Market by Region, 2024-2034 (US$ Bn, AGR (%))
Figure 68 Augmented Reality (AR) and Virtual Reality (VR) Market Share Forecast by Region, 2024 & 2034 (%)
Figure 69 Robotics and Automation Market by Region, 2024-2034 (US$ Bn, AGR (%))
Figure 70 Robotics and Automation Market Share Forecast by Region, 2024 & 2034 (%)
Figure 71 Smart Airport Technologies Market Forecast by Region 2024 and 2034 (Revenue, CAGR%)
Figure 72 Smart Airport Technologies Market Share Forecast by Region 2024, 2029, 2034 (%)
Figure 73 Smart Airport Technologies Market by Region, 2024-2034 (US$ Billion, AGR %)
Figure 74 North America Smart Airport Technologies Market Attractiveness Index
Figure 75 North America Smart Airport Technologies Market by Region, 2024, 2029 & 2034 (US$ Billion)
Figure 76 North America Smart Airport Technologies Market by Value, 2024-2034 (US$ Bn, AGR (%))
Figure 77 North America Smart Airport Technologies Market by Country, 2024-2034 (US$ Bn, AGR (%))
Figure 78 North America Smart Airport Technologies Market Share Forecast by Country, 2024 & 2034 (%)
Figure 79 North America Smart Airport Technologies Market by Component, 2024-2034 (US$ Bn, AGR (%))
Figure 80 North America Smart Airport Technologies Market Share Forecast Component, 2024 & 2034 (%)
Figure 81 North America Smart Airport Technologies Market by Size, 2024-2034 (US$ Bn, AGR (%))
Figure 82 North America Smart Airport Technologies Market Share Forecast by Size, 2024 & 2034 (%)
Figure 83 North America Smart Airport Technologies Market by End-User, 2024-2034 (US$ Bn, AGR (%))
Figure 84 North America Smart Airport Technologies Market Share Forecast by End-User, 2024 & 2034 (%)
Figure 85 North America Smart Airport Technologies Market by Application, 2024-2034 (US$ Bn, AGR (%))
Figure 86 North America Smart Airport Technologies Market Share Forecast by Application, 2024 & 2034 (%)
Figure 87 North America Smart Airport Technologies Market by Technology, 2024-2034 (US$ Bn, AGR (%))
Figure 88 North America Smart Airport Technologies Market Share Forecast by Technology, 2024 & 2034 (%)
Figure 89 US Smart Airport Technologies Market by Value, 2024-2034 (US$ Bn, AGR (%))
Figure 90 Canada Smart Airport Technologies Market by Value, 2024-2034 (US$ Bn, AGR (%))
Figure 91 Europe Smart Airport Technologies Market Attractiveness Index
Figure 92 Europe Smart Airport Technologies Market by Region, 2024, 2029 & 2034 (US$ Billion)
Figure 93 Europe Smart Airport Technologies Market by Value, 2024-2034 (US$ Bn, AGR (%))
Figure 94 Europe Smart Airport Technologies Market by Country, 2024-2034 (US$ Bn, AGR (%))
Figure 95 Europe Smart Airport Technologies Market Share Forecast by Country, 2024 & 2034 (%)
Figure 96 Europe Smart Airport Technologies Market by Component, 2024-2034 (US$ Bn, AGR (%))
Figure 97 Europe Smart Airport Technologies Market Share Forecast Component, 2024 & 2034 (%)
Figure 98 Europe Smart Airport Technologies Market by Size, 2024-2034 (US$ Bn, AGR (%))
Figure 99 Europe Smart Airport Technologies Market Share Forecast by Size, 2024 & 2034 (%)
Figure 100 Europe Smart Airport Technologies Market by End-User, 2024-2034 (US$ Bn, AGR (%))
Figure 101 Europe Smart Airport Technologies Market Share Forecast by End-User, 2024 & 2034 (%)
Figure 102 Europe Smart Airport Technologies Market by Application, 2024-2034 (US$ Bn, AGR (%))
Figure 103 Europe Smart Airport Technologies Market Share Forecast by Application, 2024 & 2034 (%)
Figure 104 Europe Smart Airport Technologies Market by Technology, 2024-2034 (US$ Bn, AGR (%))
Figure 105 Europe Smart Airport Technologies Market Share Forecast by Technology, 2024 & 2034 (%)
Figure 106 Germany Smart Airport Technologies Market by Value, 2024-2034 (US$ Bn, AGR (%))
Figure 107 UK Smart Airport Technologies Market by Value, 2024-2034 (US$ Bn, AGR (%))
Figure 108 France Smart Airport Technologies Market by Value, 2024-2034 (US$ Bn, AGR (%))
Figure 109 Italy Smart Airport Technologies Market by Value, 2024-2034 (US$ Bn, AGR (%))
Figure 110 Spain Smart Airport Technologies Market by Value, 2024-2034 (US$ Bn, AGR (%),)
Figure 111 Rest of Europe Smart Airport Technologies Market by Value, 2024-2034 (US$ Bn, AGR (%))
Figure 112 Asia-Pacific Smart Airport Technologies Market Attractiveness Index
Figure 113 Asia-Pacific Smart Airport Technologies Market by Region, 2024, 2029 & 2034 (US$ Billion)
Figure 114 Asia-Pacific Smart Airport Technologies Market by Value, 2024-2034 (US$ Bn, AGR (%))
Figure 115 Asia-Pacific Smart Airport Technologies Market by Country, 2024-2034 (US$ Bn, AGR (%))
Figure 116 Asia-Pacific Smart Airport Technologies Market Share Forecast by Country, 2024 & 2034 (%)
Figure 117 Asia-Pacific Smart Airport Technologies Market by Component, 2024-2034 (US$ Bn, AGR (%))
Figure 118 Asia-Pacific Smart Airport Technologies Market Share Forecast Component, 2024 & 2034 (%)
Figure 119 Asia-Pacific Smart Airport Technologies Market by Size, 2024-2034 (US$ Bn, AGR (%))
Figure 120 Asia-Pacific Smart Airport Technologies Market Share Forecast by Size, 2024 & 2034 (%)
Figure 121 Asia-Pacific Smart Airport Technologies Market by End-User, 2024-2034 (US$ Bn, AGR (%))
Figure 122 Asia-Pacific Smart Airport Technologies Market Share Forecast by End-User, 2024 & 2034 (%)
Figure 123 Asia-Pacific Smart Airport Technologies Market by Application, 2024-2034 (US$ Bn, AGR (%))
Figure 124 Asia-Pacific Smart Airport Technologies Market Share Forecast by Application, 2024 & 2034 (%)
Figure 125 Asia-Pacific Smart Airport Technologies Market by Technology, 2024-2034 (US$ Bn, AGR (%))
Figure 126 Asia-Pacific Smart Airport Technologies Market Share Forecast by Technology, 2024 & 2034 (%)
Figure 127 China Smart Airport Technologies Market by Value, 2024-2034 (US$ Bn, AGR (%))
Figure 128 India Smart Airport Technologies Market by Value, 2024-2034 (US$ Bn, AGR (%))
Figure 129 Japan Smart Airport Technologies Market by Value, 2024-2034 (US$ Bn, AGR (%))
Figure 130 South Korea Smart Airport Technologies Market by Value, 2024-2034 (US$ Bn, AGR (%))
Figure 131 Australia Smart Airport Technologies Market by Value, 2024-2034 (US$ Bn, AGR (%))
Figure 132 Rest of Asia-Pacific Smart Airport Technologies Market by Value, 2024-2034 (US$ Bn, AGR (%))
Figure 133 Middle East and Africa Smart Airport Technologies Market Attractiveness Index
Figure 134 Middle East and Africa Smart Airport Technologies Market by Region, 2024, 2029 & 2034 (US$ Billion)
Figure 135 Middle East & Africa Smart Airport Technologies Market by Value, 2024-2034 (US$ Bn, AGR (%))
Figure 136 Middle East & Africa Smart Airport Technologies Market by Country, 2024-2034 (US$ Bn, AGR (%))
Figure 137 Middle East and Africa Smart Airport Technologies Market Share Forecast by Country, 2024 & 2034 (%)
Figure 138 Middle East & Africa Smart Airport Technologies Market by Component, 2024-2034 (US$ Bn, AGR (%))
Figure 139 Middle East and Africa Smart Airport Technologies Market Share Forecast Component, 2024 & 2034 (%)
Figure 140 Middle East & Africa Smart Airport Technologies Market by Size, 2024-2034 (US$ Bn, AGR (%))
Figure 141 Middle East and Africa Smart Airport Technologies Market Share Forecast by Size, 2024 & 2034 (%)
Figure 142 Middle East & Africa Smart Airport Technologies Market by End-User, 2024-2034 (US$ Bn, AGR (%))
Figure 143 Middle East and Africa Smart Airport Technologies Market Share Forecast by End-User, 2024 & 2034 (%)
Figure 144 Middle East & Africa Smart Airport Technologies Market by Application, 2024-2034 (US$ Bn, AGR (%))
Figure 145 Middle East and Africa Smart Airport Technologies Market Share Forecast by Application, 2024 & 2034 (%)
Figure 146 Middle East & Africa Smart Airport Technologies Market by Technology, 2024-2034 (US$ Bn, AGR (%))
Figure 147 Middle East and Africa Smart Airport Technologies Market Share Forecast by Technology, 2024 & 2034 (%)
Figure 148 GCC Smart Airport Technologies Market by Value, 2024-2034 (US$ Bn, AGR (%))
Figure 149 South Africa Smart Airport Technologies Market by Value, 2024-2034 (US$ Bn, AGR (%))
Figure 150 Rest of Middle East & Africa Smart Airport Technologies Market by Value, 2024-2034 (US$ Bn, AGR (%))
Figure 151 Latin America Smart Airport Technologies Market Attractiveness Index
Figure 152 Latin America Smart Airport Technologies Market by Region, 2024, 2029 & 2034 (US$ Billion)
Figure 153 Latin America Smart Airport Technologies Market by Value, 2024-2034 (US$ Bn, AGR (%))
Figure 154 Latin America Smart Airport Technologies Market by Country, 2024-2034 (US$ Bn, AGR (%))
Figure 155 Latin America Smart Airport Technologies Market Share Forecast by Country, 2024 & 2034 (%)
Figure 156 Latin America Smart Airport Technologies Market by Component, 2024-2034 (US$ Bn, AGR (%))
Figure 157 Latin America Smart Airport Technologies Market Share Forecast Component, 2024 & 2034 (%)
Figure 158 Latin America Smart Airport Technologies Market by Size, 2024-2034 (US$ Bn, AGR (%))
Figure 159 Latin America Smart Airport Technologies Market Share Forecast by Size, 2024 & 2034 (%)
Figure 160 Latin America Smart Airport Technologies Market by End-User, 2024-2034 (US$ Bn, AGR (%))
Figure 161 Latin America Smart Airport Technologies Market Share Forecast by End-User, 2024 & 2034 (%)
Figure 162 Latin America Smart Airport Technologies Market by Application, 2024-2034 (US$ Bn, AGR (%))
Figure 163 Latin America Smart Airport Technologies Market Share Forecast by Application, 2024 & 2034 (%)
Figure 164 Latin America Smart Airport Technologies Market by Technology, 2024-2034 (US$ Bn, AGR (%))
Figure 165 Latin America Smart Airport Technologies Market Share Forecast by Technology, 2024 & 2034 (%)
Figure 166 Brazil Smart Airport Technologies Market by Value, 2024-2034 (US$ Bn, AGR (%))
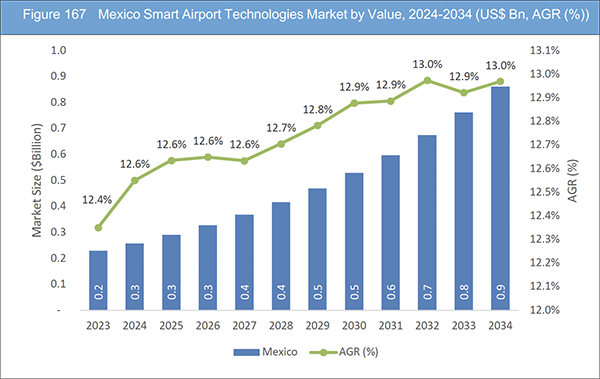
Figure 167 Mexico Smart Airport Technologies Market by Value, 2024-2034 (US$ Bn, AGR (%))
Figure 168 Rest of Latin America Smart Airport Technologies Market by Value, 2024-2034 (US$ Bn, AGR (%))
Figure 169 Smart Airport Technologies Market: Company Share, 2022
Figure 170 Honeywell International Inc.: Net Revenue, 2018-2022 (US$ Million, AGR%)
Figure 171 Honeywell International Inc.: R&D, 2018-2022 (US$ Million, AGR%)
Figure 172 Honeywell International Inc.: Regional Revenue Share, 2022 (%)
Figure 173 Honeywell International Inc.: Business Segment Revenue Share, 2022 (%)
Figure 174 Cisco Systems, Inc.: Net Revenue, 2019-2023 (US$ Million, AGR%)
Figure 175 Cisco Systems, Inc.: R&D, 2019-2023 (US$ Million, AGR%)
Figure 176 Cisco Systems, Inc.: Regional Revenue Share, 2023 (%)
Figure 177 Cisco Systems, Inc.: Business Segment Revenue Share, 2023 (%)
Figure 178 Siemens AG.: Net Revenue, 2019-2023 (US$ Million, AGR%)
Figure 179 Siemens AG.: R&D, 2019-2023 (US$ Million, AGR%)
Figure 180 Siemens AG.: Regional Revenue Share, 2023 (%)
Figure 181 Siemens AG.: Business Segment Revenue Share, 2023 (%)
Figure 182 International Business Machines Corporation.: Net Revenue, 2018-2022 (US$ Million, AGR%)
Figure 183 International Business Machines Corporation.: R&D, 2018-2022 (US$ Million, AGR%)
Figure 184 International Business Machines Corporation.: Regional Revenue Share, 2022 (%)
Figure 185 International Business Machines Corporation.: Business Segment Revenue Share, 2022 (%)
Figure 186 Thales Group.: Net Revenue, 2018-2022 (US$ Million, AGR%)
Figure 187 NEC Corporation.: Net Revenue, 2019-2023 (US$ Million, AGR%)
Figure 188 NEC Corporation.: R&D, 2019-2023 (US$ Million, AGR%)
Figure 189 NEC Corporation.: Business Segment Revenue Share, 2023 (%)
Figure 190 Raytheon Technologies Corporation.: Net Revenue, 2018-2022 (US$ Million, AGR%)
Figure 191 Raytheon Technologies Corporation.: R&D, 2018-2022 (US$ Million, AGR%)
Figure 192 Raytheon Technologies Corporation.: Regional Revenue Share, 2022 (%)
Figure 193 Raytheon Technologies Corporation.: Business Segment Revenue Share, 2022 (%)
Figure 194 Indra Sistemas, S.A..: Net Revenue, 2018-2022 (US$ Million, AGR%)
Figure 195 Vanderlande Industries B.V.: Net Revenue, 2018-2022 (US$ Million, AGR%)
Figure 196 Vanderlande Industries B.V.: R&D, 2018-2022 (US$ Million, AGR%)
Figure 197 Vanderlande Industries B.V.: Regional Revenue Share, 2022 (%)
Figure 198 Vanderlande Industries B.V.: Business Segment Revenue Share, 2022 (%)
Figure 199 Huawei Technologies Co., Ltd.: Net Revenue, 2018-2022 (US$ Million, AGR%)
Figure 200 Huawei Technologies Co., Ltd.: R&D, 2018-2022 (US$ Million, AGR%)
Figure 201 Huawei Technologies Co., Ltd.: Regional Revenue Share, 2022 (%)
Figure 202 Huawei Technologies Co., Ltd.: Business Segment Revenue Share, 2022 (%)
Figure 203 Unisys Corporation.: Net Revenue, 2018-2022 (US$ Million, AGR%)
Figure 204 Unisys Corporation.: R&D, 2018-2022 (US$ Million, AGR%)
Figure 205 Leidos Holdings, Inc..: Net Revenue, 2018-2022 (US$ Million, AGR%)
Figure 206 Leidos Holdings, Inc..: R&D, 2018-2022 (US$ Million, AGR%)
Figure 207 Leidos Holdings, Inc..: Regional Revenue Share, 2022 (%)
Figure 208 Leidos Holdings, Inc..: Business Segment Revenue Share, 2022 (%)
ページTOPに戻る
Summary
Report Details
The Smart Airport Technologies Market Report 2024-2034: This report will prove invaluable to leading firms striving for new revenue pockets if they wish to better understand the industry and its underlying dynamics. It will be useful for companies that would like to expand into different industries or to expand their existing operations in a new region.
Integration of Artificial Intelligence (AI) and Machine Learning (ML): Revolutionizing Smart Airport Operations
The seamless integration of AI and ML technologies represents a transformative force in the evolution of smart airports. These cutting-edge technologies empower airports with predictive analytics, facilitating operational forecasting, optimizing baggage routing, and enhancing security threat assessments. AI-driven chatbots and virtual assistants redefine the passenger experience by delivering real-time information and assistance, thereby elevating overall passenger engagement. The fusion of AI and ML not only streamlines airport processes but also ushers in a new era of intelligent, data-driven decision-making that contributes to the efficiency and effectiveness of smart airport operations.
Improved Security and Threat Detection: Fortifying Airport Safety Through Smart Technologies
With security standing as a paramount concern for airports, the adoption of smart technologies takes centre stage in fortifying threat detection and response capabilities. Advanced surveillance systems, coupled with biometric identification and AI-powered analytics, form a robust security infrastructure. Notably, smart video analytics act as a vigilant eye, capable of detecting suspicious behavior patterns. This proactive approach enables security personnel to respond swiftly and effectively to potential threats, thereby reinforcing the safety and security measures implemented at smart airports.
High Initial Investment Cost Hinder the Market Growth
One of the primary challenges impeding the growth of the smart airport technologies market is the substantial initial investment required for the implementation of advanced systems and infrastructure. The integration of cutting-edge technologies such as biometric identification systems, automated baggage handling, and state-of-the-art security and surveillance solutions demands a significant financial commitment from airport authorities and stakeholders.
The implementation of these technologies often involves not only the acquisition of expensive hardware and software but also the need for substantial modifications to existing infrastructure. For instance, the deployment of advanced passenger processing systems incorporating biometrics may necessitate the installation of specialized scanning devices, facial recognition cameras, and the development of integrated databases. These capital-intensive endeavours can strain the financial resources of airports, particularly those with limited budgets, hindering their ability to swiftly adopt smart technologies.
What Questions Should You Ask before Buying a Market Research Report?
-
How is the smart airport technologies market evolving?
-
What is driving and restraining the smart airport technologies market?
-
How will each smart airport technologies submarket segment grow over the forecast period and how much revenue will these submarkets account for in 2034?
-
How will the market shares for each smart airport technologies submarket develop from 2024 to 2034?
-
What will be the main driver for the overall market from 2024 to 2034?
-
Will leading smart airport technologies markets broadly follow the macroeconomic dynamics, or will individual national markets outperform others?
-
How will the market shares of the national markets change by 2034 and which geographical region will lead the market in 2034?
-
Who are the leading players and what are their prospects over the forecast period?
-
What are the smart airport technologies projects for these leading companies?
-
How will the industry evolve during the period between 2024 and 2034? What are the implications of smart airport technologies projects taking place now and over the next 10 years?
-
Is there a greater need for product commercialisation to further scale the smart airport technologies market?
-
Where is the smart airport technologies market heading and how can you ensure you are at the forefront of the market?
-
What are the best investment options for new product and service lines?
-
What are the key prospects for moving companies into a new growth path and C-suite?
You need to discover how this will impact the smart airport technologies market today, and over the next 10 years:
-
Our 460-page report provides 131 tables and 204 charts/graphs exclusively to you.
-
The report highlights key lucrative areas in the industry so you can target them – NOW.
-
It contains in-depth analysis of global, regional and national sales and growth.
-
It highlights for you the key successful trends, changes and revenue projections made by your competitors.
This report tells you TODAY how the smart airport technologies market will develop in the next 10 years, and in line with the variations in COVID-19 economic recession and bounce. This market is more critical now than at any point over the last 10 years.
Forecasts to 2034 and other analyses reveal commercial prospects
-
In addition to revenue forecasting to 2034, our new study provides you with recent results, growth rates, and market shares.
-
You will find original analyses, with business outlooks and developments.
-
Discover qualitative analyses (including market dynamics, drivers, opportunities, restraints and challenges), cost structure, impact of rising smart airport technologies prices and recent developments.
This report includes data analysis and invaluable insight into how COVID-19 will affect the industry and your company. Four COVID-19 recovery patterns and their impact, namely, “V”, “L”, “W” and “U” are discussed in this report.
Segments Covered in the Report
Market Segment by Component
Market Segment by Size
-
Large Airports
-
Medium-Sized Airports
-
Small Airports
Market Segment by End-User
-
Airport Authorities and Operators
-
Airlines
-
Ground Handlers
-
Retailers and Duty-Free Operators
Market Segment by Application
-
Passenger Processing
-
Baggage Handling and Tracking
-
Security and Surveillance
-
Airside and Landside Operations
-
Other Applications
Market Segment by Technology
-
Biometrics and Identity Management
-
Internet of Things (IoT) Devices
-
5G Networks and Connectivity
-
Artificial Intelligence (AI) and Machine Learning (ML)
-
Augmented Reality (AR) and Virtual Reality (VR)
-
Robotics and Automation
In addition to the revenue predictions for the overall world market and segments, you will also find revenue forecasts for four regional and 20 leading national markets:
North America
Europe
-
Germany
-
Spain
-
United Kingdom
-
France
-
Italy
-
Rest of Europe
Asia Pacific
-
China
-
Japan
-
India
-
Australia
-
South Korea
-
Rest of Asia Pacific
Latin America
-
Brazil
-
Mexico
-
Rest of Latin America
Middle East & Africa
-
GCC
-
South Africa
-
Rest of Middle East & Africa
The report also includes profiles and for some of the leading companies in the Smart Airport Technologies Market, 2024 to 2034, with a focus on this segment of these companies’ operations.
Leading companies and the potential for market growth
-
Cisco Systems, Inc
-
Honeywell International Inc
-
Huawei Technologies Co., Ltd
-
Indra Sistemas, S.A.
-
International Business Machines Corporation
-
Leidos Holdings, Inc.
-
Materna IPS GmbH
-
NEC Corporation
-
Raytheon Technologies Corporation
-
Siemens AG
-
SITA
-
Thales Group
-
Unisys Corporation
-
Vanderlande Industries B.V
-
Vision-Box Holding
Overall world revenue for Smart Airport Technologies Market, 2024 to 2034 in terms of value the market will surpass US$10.7 billion in 2024, our work calculates. We predict strong revenue growth through to 2034. Our work identifies which organizations hold the greatest potential. Discover their capabilities, progress, and commercial prospects, helping you stay ahead.
How will the Smart Airport Technologies Market, 2024 to 2034 report help you?
In summary, our 460+ page report provides you with the following knowledge:
-
Revenue forecasts to 2034 for Smart Airport Technologies Market, 2024 to 2034 Market, with forecasts for component, size, end-user, application, and technology, each forecast at a global and regional level – discover the industry’s prospects, finding the most lucrative places for investments and revenues.
-
Revenue forecasts to 2034 for four regional and 20 key national markets – See forecasts for the Smart Airport Technologies Market, 2024 to 2034 market in North America, Europe, Asia-Pacific, Latin America and Middle East & Africa. Also forecasted is the market in the US, Canada, Brazil, Germany, France, UK, Italy, China, India, Japan, and Australia among other prominent economies.
-
Prospects for established firms and those seeking to enter the market – including company profiles for 15 of the major companies involved in the Smart Airport Technologies Market, 2024 to 2034.
Find quantitative and qualitative analyses with independent predictions. Receive information that only our report contains, staying informed with invaluable business intelligence.
Information found nowhere else
With our new report, you are less likely to fall behind in knowledge or miss out on opportunities. See how our work could benefit your research, analyses, and decisions. Visiongain’s study is for everybody needing commercial analyses for the Smart Airport Technologies Market, 2024 to 2034, market-leading companies. You will find data, trends and predictions.
ページTOPに戻る
Table of Contents
Table of Contents
1 Report Overview
1.1 Objectives of the Study
1.2 Introduction to Smart Airport Technologies Market
1.3 What This Report Delivers
1.4 Why You Should Read This Report
1.5 Key Questions Answered by This Analytical Report
1.6 Who Is This Report for?
1.7 Methodology
1.7.1 Market Definitions
1.7.2 Market Evaluation & Forecasting Methodology
1.7.3 Data Validation
1.7.3.1 Primary Research
1.7.3.2 Secondary Research
1.8 Frequently Asked Questions (FAQs)
1.9 Associated Visiongain Reports
1.10 About Visiongain
2 Executive Summary
3 Market Overview
3.1 Key Findings
3.2 Market Dynamics
3.2.1 Market Driving Factors
3.2.1.1 Growing Need for Real-Time Information Driving the Market Growth
3.2.1.2 Increasing Use of Self-Service Technologies at Airports Driving the Market Growth
3.2.1.3 Increase in Focus on Security on Airports Driving the Market Growth
3.2.2 Market Restraining Factors
3.2.2.1 High Initial Investment Cost Hinder the Market Growth
3.2.2.2 Lack of Trained and Experience Staff can Restrain the Market Growth
3.2.2.3 Comprehension of Passenger Preferences Hinder the Market Growth
3.2.3 Market Opportunities
3.2.3.1 Airport Operation Optimization Through Digitalization Opportunities for the Market
3.2.3.2 Enhanced Passenger Experience and Retail Revenue
3.2.3.3 The Evolving Landscape of Smart Airport Technologies Presents Ample Opportunities for Partnership and Collaboration.
3.3 Porter’s Five Forces Analysis
3.3.1 Bargaining Power of Suppliers (Medium)
3.3.2 Bargaining Power of Buyers (Medium to High)
3.3.3 Competitive Rivalry (High)
3.3.4 Threat from Substitutes (Low)
3.3.5 Threat of New Entrants (Low)
3.4 COVID-19 Impact Analysis
3.4.1 “V-Shaped Recovery”
3.4.2 “U-Shaped Recovery”
3.4.3 “W-Shaped Recovery”
3.4.4 “L-Shaped Recovery”
3.5 PEST Analysis
4 Smart Airport Technologies Market Analysis by Component
4.1 Key Findings
4.2 Component Segment: Market Attractiveness Index
4.3 Smart Airport Technologies Market Size Estimation and Forecast by Component
4.4 Hardware
4.4.1 Market Size by Region, 2024-2034 (US$ Billion)
4.4.2 Market Share by Region, 2024 & 2034 (%)
4.5 Software
4.5.1 Market Size by Region, 2024-2034 (US$ Billion)
4.5.2 Market Share by Region, 2024 & 2034 (%)
5 Smart Airport Technologies Market Analysis by Size
5.1 Key Findings
5.2 Size Segment: Market Attractiveness Index
5.3 Smart Airport Technologies Market Size Estimation and Forecast by Size
5.4 Large Airports
5.4.1 Market Size by Region, 2024-2034 (US$ Billion)
5.4.2 Market Share by Region, 2024 & 2034 (%)
5.5 Medium-Sized Airports
5.5.1 Market Size by Region, 2024-2034 (US$ Billion)
5.5.2 Market Share by Region, 2024 & 2034 (%)
5.6 Small Airports
5.6.1 Market Size by Region, 2024-2034 (US$ Billion)
5.6.2 Market Share by Region, 2024 & 2034 (%)
6 Smart Airport Technologies Market Analysis by End-User
6.1 Key Findings
6.2 End-User Segment: Market Attractiveness Index
6.3 Smart Airport Technologies Market Size Estimation and Forecast by End-User
6.4 Airport Authorities and Operators
6.4.1 Market Size by Region, 2024-2034 (US$ Billion)
6.4.2 Market Share by Region, 2024 & 2034 (%)
6.5 Airlines
6.5.1 Market Size by Region, 2024-2034 (US$ Billion)
6.5.2 Market Share by Region, 2024 & 2034 (%)
6.6 Ground Handlers
6.6.1 Market Size by Region, 2024-2034 (US$ Billion)
6.6.2 Market Share by Region, 2024 & 2034 (%)
6.7 Retailers and Duty-Free Operators
6.7.1 Market Size by Region, 2024-2034 (US$ Billion)
6.7.2 Market Share by Region, 2024 & 2034 (%)
7 Smart Airport Technologies Market Analysis by Application
7.1 Key Findings
7.2 Application Segment: Market Attractiveness Index
7.3 Smart Airport Technologies Market Size Estimation and Forecast by Application
7.4 Passenger Processing
7.4.1 Market Size by Region, 2024-2034 (US$ Billion)
7.4.2 Market Share by Region, 2024 & 2034 (%)
7.5 Baggage Handling and Tracking
7.5.1 Market Size by Region, 2024-2034 (US$ Billion)
7.5.2 Market Share by Region, 2024 & 2034 (%)
7.6 Security and Surveillance
7.6.1 Market Size by Region, 2024-2034 (US$ Billion)
7.6.2 Market Share by Region, 2024 & 2034 (%)
7.7 Airside and Landside Operations
7.7.1 Market Size by Region, 2024-2034 (US$ Billion)
7.7.2 Market Share by Region, 2024 & 2034 (%)
7.8 Other Applications
7.8.1 Market Size by Region, 2024-2034 (US$ Billion)
7.8.2 Market Share by Region, 2024 & 2034 (%)
8 Smart Airport Technologies Market Analysis by Technology
8.1 Key Findings
8.2 Technology Segment: Market Attractiveness Index
8.3 Smart Airport Technologies Market Size Estimation and Forecast by Technology
8.4 Biometrics and Identity Management
8.4.1 Market Size by Region, 2024-2034 (US$ Million)
8.4.2 Market Share by Region, 2024 & 2034 (%)
8.5 Internet of Things (IoT) Devices
8.5.1 Market Size by Region, 2024-2034 (US$ Million)
8.5.2 Market Share by Region, 2024 & 2034 (%)
8.6 5G Networks and Connectivity
8.6.1 Market Size by Region, 2024-2034 (US$ Million)
8.6.2 Market Share by Region, 2024 & 2034 (%)
8.7 Artificial Intelligence (AI) and Machine Learning (ML)
8.7.1 Market Size by Region, 2024-2034 (US$ Million)
8.7.2 Market Share by Region, 2024 & 2034 (%)
8.8 Augmented Reality (AR) and Virtual Reality (VR)
8.8.1 Market Size by Region, 2024-2034 (US$ Million)
8.8.2 Market Share by Region, 2024 & 2034 (%)
8.9 Robotics and Automation
8.9.1 Market Size by Region, 2024-2034 (US$ Million)
8.9.2 Market Share by Region, 2024 & 2034 (%)
9 Smart Airport Technologies Market Analysis by Region
9.1 Key Findings
9.2 Regional Market Size Estimation and Forecast
10 North America Smart Airport Technologies Market Analysis
10.1 Key Findings
10.2 North America Smart Airport Technologies Market Attractiveness Index
10.3 North America Smart Airport Technologies Market by Country, 2024, 2029 & 2034 (US$ Billion)
10.4 North America Smart Airport Technologies Market Size Estimation and Forecast
10.5 North America Smart Airport Technologies Market Size Estimation and Forecast by Country
10.6 North America Smart Airport Technologies Market Size Estimation and Forecast by Component
10.7 North America Smart Airport Technologies Market Size Estimation and Forecast by Size
10.8 North America Smart Airport Technologies Market Size Estimation and Forecast by End-User
10.9 North America Smart Airport Technologies Market Size Estimation and Forecast by Application
10.10 North America Smart Airport Technologies Market Size Estimation and Forecast by Technology
10.11 U.S. Smart Airport Technologies Market Analysis
10.12 Canada Smart Airport Technologies Market Analysis
11 Europe Smart Airport Technologies Market Analysis
11.1 Key Findings
11.2 Europe Smart Airport Technologies Market Attractiveness Index
11.3 Europe Smart Airport Technologies Market by Country, 2024, 2029 & 2034 (US$ Billion)
11.4 Europe Smart Airport Technologies Market Size Estimation and Forecast
11.5 Europe Smart Airport Technologies Market Size Estimation and Forecast by Country
11.6 Europe Smart Airport Technologies Market Size Estimation and Forecast by Component
11.7 Europe Smart Airport Technologies Market Size Estimation and Forecast by Size
11.8 Europe Smart Airport Technologies Market Size Estimation and Forecast by End-User
11.9 Europe Smart Airport Technologies Market Size Estimation and Forecast by Application
11.10 Europe Smart Airport Technologies Market Size Estimation and Forecast by Technology
11.11 Germany Smart Airport Technologies Market Analysis
11.12 UK Smart Airport Technologies Market Analysis
11.13 France Smart Airport Technologies Market Analysis
11.14 Italy Smart Airport Technologies Market Analysis
11.15 Spain Smart Airport Technologies Market Analysis
11.16 Rest of Europe Smart Airport Technologies Market Analysis
12 Asia-Pacific Smart Airport Technologies Market Analysis
12.1 Key Findings
12.2 Asia-Pacific Smart Airport Technologies Market Attractiveness Index
12.3 Asia-Pacific Smart Airport Technologies Market by Country, 2024, 2029 & 2034 (US$ Billion)
12.4 Asia-Pacific Smart Airport Technologies Market Size Estimation and Forecast
12.5 Asia-Pacific Smart Airport Technologies Market Size Estimation and Forecast by Country
12.6 Asia-Pacific Smart Airport Technologies Market Size Estimation and Forecast by Component
12.7 Asia-Pacific Smart Airport Technologies Market Size Estimation and Forecast by Size
12.8 Asia-Pacific Smart Airport Technologies Market Size Estimation and Forecast by End-User
12.9 Asia-Pacific Smart Airport Technologies Market Size Estimation and Forecast by Application
12.10 Asia-Pacific Smart Airport Technologies Market Size Estimation and Forecast by Technology
12.11 China Smart Airport Technologies Market Analysis
12.12 India Smart Airport Technologies Market Analysis
12.13 Japan Smart Airport Technologies Market Analysis
12.14 South Korea Smart Airport Technologies Market Analysis
12.15 Australia Smart Airport Technologies Market Analysis
12.16 Rest of Asia-Pacific Smart Airport Technologies Market Analysis
13 Middle East and Africa Smart Airport Technologies Market Analysis
13.1 Key Findings
13.2 Middle East and Africa Smart Airport Technologies Market Attractiveness Index
13.3 Middle East and Africa Smart Airport Technologies Market by Country, 2024, 2029 & 2034 (US$ Billion)
13.4 Middle East and Africa Smart Airport Technologies Market Size Estimation and Forecast
13.5 Middle East and Africa Smart Airport Technologies Market Size Estimation and Forecast by Country
13.6 Middle East and Africa Smart Airport Technologies Market Size Estimation and Forecast by Component
13.7 Middle East and Africa Smart Airport Technologies Market Size Estimation and Forecast by Size
13.8 Middle East and Africa Smart Airport Technologies Market Size Estimation and Forecast by End-User
13.9 Middle East and Africa Smart Airport Technologies Market Size Estimation and Forecast by Application
13.10 Middle East and Africa Smart Airport Technologies Market Size Estimation and Forecast by Technology
13.11 GCC Smart Airport Technologies Market Analysis
13.12 South Africa Smart Airport Technologies Market Analysis
13.13 Rest of Middle East & Africa Smart Airport Technologies Market Analysis
14 Latin America Smart Airport Technologies Market Analysis
14.1 Key Findings
14.2 Latin America Smart Airport Technologies Market Attractiveness Index
14.3 Latin America Smart Airport Technologies Market by Country, 2024, 2029 & 2034 (US$ Billion)
14.4 Latin America Smart Airport Technologies Market Size Estimation and Forecast
14.5 Latin America Smart Airport Technologies Market Size Estimation and Forecast by Country
14.6 Latin America Smart Airport Technologies Market Size Estimation and Forecast by Component
14.7 Latin America Smart Airport Technologies Market Size Estimation and Forecast by Size
14.8 Latin America Smart Airport Technologies Market Size Estimation and Forecast by End-User
14.9 Latin America Smart Airport Technologies Market Size Estimation and Forecast by Application
14.10 Latin America Smart Airport Technologies Market Size Estimation and Forecast by Technology
14.11 Brazil Smart Airport Technologies Market Analysis
14.12 Mexico Smart Airport Technologies Market Analysis
14.13 Rest of Latin America Smart Airport Technologies Market Analysis
15 Company Profiles
15.1 Competitive Landscape, 2022
15.2 Strategic Outlook
15.3 SITA
15.3.1 Company Snapshot
15.3.2 Company Overview
15.3.3 Product Benchmarking
15.3.4 Strategic Outlook
15.4 Honeywell International Inc
15.4.1 Company Snapshot
15.4.2 Company Overview
15.4.3 Financial Analysis
15.4.3.1 Net Revenue, 2018-2022
15.4.3.2 R&D, 2018-2022
15.4.3.3 Regional Revenue Share, 2022 (%)
15.4.3.4 Business Segment Revenue Share, 2022 (%)
15.4.4 Product Benchmarking
15.4.5 Strategic Outlook
15.5 Cisco Systems, Inc
15.5.1 Company Snapshot
15.5.2 Company Overview
15.5.3 Financial Analysis
15.5.3.1 Net Revenue, 2019-2023
15.5.3.2 R&D, 2019-2023
15.5.3.3 Regional Revenue Share, 2023 (%)
15.5.3.4 Business Segment Revenue Share, 2023 (%)
15.5.4 Product Benchmarking
15.5.5 Strategic Outlook
15.6 Siemens AG
15.6.1 Company Snapshot
15.6.2 Company Overview
15.6.3 Financial Analysis
15.6.3.1 Net Revenue, 2019-2023
15.6.3.2 R&D, 2019-2023
15.6.3.3 Regional Revenue Share, 2023 (%)
15.6.3.4 Business Segment Revenue Share, 2023 (%)
15.6.4 Product Benchmarking
15.6.5 Strategic Outlook
15.7 International Business Machines Corporation
15.7.1 Company Snapshot
15.7.2 Company Overview
15.7.3 Financial Analysis
15.7.3.1 Net Revenue, 2018-2022
15.7.3.2 R&D, 2018-2022
15.7.3.3 Regional Revenue Share, 2022 (%)
15.7.3.4 Business Segment Revenue Share, 2022 (%)
15.7.4 Product Benchmarking
15.7.5 Strategic Outlook
15.8 Thales Group
15.8.1 Company Snapshot
15.8.2 Company Overview
15.8.3 Financial Analysis
15.8.3.1 Net Revenue, 2018-2022
15.8.4 Product Benchmarking
15.8.5 Strategic Outlook
15.9 NEC Corporation
15.9.1 Company Snapshot
15.9.2 Company Overview
15.9.3 Financial Analysis
15.9.3.1 Net Revenue, 2019-2023
15.9.3.2 R&D, 2019-2023
15.9.3.3 Business Segment Revenue Share, 2023 (%)
15.9.4 Product Benchmarking
15.9.5 Strategic Outlook
15.10 Raytheon Technologies Corporation
15.10.1 Company Snapshot
15.10.2 Company Overview
15.10.3 Financial Analysis
15.10.3.1 Net Revenue, 2018-2022
15.10.3.2 R&D, 2018-2022
15.10.3.3 Regional Revenue Share, 2022 (%)
15.10.3.4 Business Segment Revenue Share, 2022 (%)
15.10.4 Product Benchmarking
15.10.5 Strategic Outlook
15.11 Indra Sistemas, S.A.
15.11.1 Company Snapshot
15.11.2 Company Overview
15.11.3 Financial Analysis
15.11.3.1 Net Revenue, 2018-2022
15.11.4 Product Benchmarking
15.11.5 Strategic Outlook
15.12 Vanderlande Industries B.V
15.12.1 Company Snapshot
15.12.2 Company Overview
15.12.3 Financial Analysis
15.12.3.1 Net Revenue, 2018-2022
15.12.3.2 R&D, 2018-2022
15.12.3.3 Regional Revenue Share, 2022 (%)
15.12.3.4 Business Segment Revenue Share, 2022 (%)
15.12.4 Product Benchmarking
15.12.5 Strategic Outlook
15.13 Huawei Technologies Co., Ltd
15.13.1 Company Snapshot
15.13.2 Company Overview
15.13.3 Financial Analysis
15.13.3.1 Net Revenue, 2018-2022
15.13.3.2 R&D, 2018-2022
15.13.3.3 Regional Revenue Share, 2022 (%)
15.13.3.4 Business Segment Revenue Share, 2022 (%)
15.13.4 Product Benchmarking
15.13.5 Strategic Outlook
15.14 Unisys Corporation
15.14.1 Company Snapshot
15.14.2 Company Overview
15.14.3 Financial Analysis
15.14.3.1 Net Revenue, 2018-2022
15.14.3.2 R&D, 2018-2022
15.14.4 Product Benchmarking
15.14.5 Strategic Outlook
15.15 Leidos Holdings, Inc.
15.15.1 Company Snapshot
15.15.2 Company Overview
15.15.3 Financial Analysis
15.15.3.1 Net Revenue, 2018-2022
15.15.3.2 R&D, 2018-2022
15.15.3.3 Regional Revenue Share, 2022 (%)
15.15.3.4 Business Segment Revenue Share, 2022 (%)
15.15.4 Product Benchmarking
15.15.5 Strategic Outlook
15.16 Vision-Box Holding
15.16.1 Company Snapshot
15.16.2 Company Overview
15.16.3 Product Benchmarking
15.16.4 Strategic Outlook
15.17 Materna IPS GmbH
15.17.1 Company Snapshot
15.17.2 Company Overview
15.17.3 Product Benchmarking
15.17.4 Strategic Outlook
16 Conclusion and Recommendations
16.1 Concluding Remarks from Visiongain
16.2 Recommendations for Market Players
ページTOPに戻る
List of Tables/Graphs
List of Tables
Table 1 Smart Airport Technologies Market Snapshot, 2024 & 2034 (US$ Billion, CAGR %)
Table 2 Global Smart Airport Technologies Market by Region, 2024-2034 (US$ Bn, AGR (%), CAGR (%)) (V-Shaped Recovery Scenario)
Table 3 Global Smart Airport Technologies Market by Region, 2024-2034 (US$ Bn, AGR (%), CAGR (%)) (U-Shaped Recovery Scenario)
Table 4 Global Smart Airport Technologies Market by Region, 2024-2034 (US$ Bn, AGR (%), CAGR (%)) (W-Shaped Recovery Scenario)
Table 5 Global Smart Airport Technologies Market by Region, 2024-2034 (US$ Bn, AGR (%), CAGR (%)) (L-Shaped Recovery Scenario)
Table 6 Global Smart Airport Technologies Market by Component, 2024-2034 (US$ Bn, AGR (%), CAGR (%))
Table 7 Hardware Market by Region, 2024-2034 (US$ Bn, AGR (%), CAGR (%))
Table 8 Software Market by Region, 2024-2034 (US$ Bn, AGR (%), CAGR (%))
Table 9 Global Smart Airport Technologies Market by Size, 2024-2034 (US$ Bn, AGR (%), CAGR (%))
Table 10 Large Airports Market by Region, 2024-2034 (US$ Bn, AGR (%), CAGR (%))
Table 11 Medium-Sized Airports Market by Region, 2024-2034 (US$ Bn, AGR (%), CAGR (%))
Table 12 Small Airports Market by Region, 2024-2034 (US$ Bn, AGR (%), CAGR (%))
Table 13 Global Smart Airport Technologies Market by End-User, 2024-2034 (US$ Bn, AGR (%), CAGR (%))
Table 14 Airport Authorities and Operators Market by Region, 2024-2034 (US$ Bn, AGR (%), CAGR (%))
Table 15 Airlines Market by Region, 2024-2034 (US$ Bn, AGR (%), CAGR (%))
Table 16 Ground Handlers Market by Region, 2024-2034 (US$ Bn, AGR (%), CAGR (%))
Table 17 Retailers and Duty-Free Operators Market by Region, 2024-2034 (US$ Bn, AGR (%), CAGR (%))
Table 18 Global Smart Airport Technologies Market by Application, 2024-2034 (US$ Bn, AGR (%), CAGR (%))
Table 19 Passenger Processing Market by Region, 2024-2034 (US$ Bn, AGR (%), CAGR (%))
Table 20 Baggage Handling and Tracking Market by Region, 2024-2034 (US$ Bn, AGR (%), CAGR (%))
Table 21 Security and Surveillance Market by Region, 2024-2034 (US$ Bn, AGR (%), CAGR (%))
Table 22 Airside and Landside Operations Market by Region, 2024-2034 (US$ Bn, AGR (%), CAGR (%))
Table 23 Other Applications Market by Region, 2024-2034 (US$ Bn, AGR (%), CAGR (%))
Table 24 Global Smart Airport Technologies Market by Technology, 2024-2034 (US$ Bn, AGR (%), CAGR (%))
Table 25 Biometrics and Identity Management Market by Region, 2024-2034 (US$ Bn, AGR (%), CAGR (%))
Table 26 Internet of Things (IoT) Devices Market by Region, 2024-2034 (US$ Bn, AGR (%), CAGR (%))
Table 27 5G Networks and Connectivity Market by Region, 2024-2034 (US$ Bn, AGR (%), CAGR (%))
Table 28 Artificial Intelligence (AI) and Machine Learning (ML) Market by Region, 2024-2034 (US$ Bn, AGR (%), CAGR (%))
Table 29 Augmented Reality (AR) and Virtual Reality (VR) Market by Region, 2024-2034 (US$ Bn, AGR (%), CAGR (%))
Table 30 Robotics and Automation Market by Region, 2024-2034 (US$ Bn, AGR (%), CAGR (%))
Table 31 Smart Airport Technologies Market Forecast by Region, 2024-2034 (US$ Billion, AGR%, CAGR%)
Table 32 North America Smart Airport Technologies Market by Value, 2024-2034 (US$ Bn, AGR (%), CAGR (%))
Table 33 North America Smart Airport Technologies Market by Country, 2024-2034 (US$ Bn, AGR (%), CAGR (%))
Table 34 North America Smart Airport Technologies Market by Component, 2024-2034 (US$ Bn, AGR (%), CAGR (%))
Table 35 North America Smart Airport Technologies Market by Size, 2024-2034 (US$ Bn, AGR (%), CAGR (%))
Table 36 North America Smart Airport Technologies Market by End-User, 2024-2034 (US$ Bn, AGR (%), CAGR (%))
Table 37 North America Smart Airport Technologies Market by Application, 2024-2034 (US$ Bn, AGR (%), CAGR (%))
Table 38 North America Smart Airport Technologies Market by Technology, 2024-2034 (US$ Bn, AGR (%), CAGR (%))
Table 39 US Smart Airport Technologies Market by Value, 2024-2034 (US$ Bn, AGR (%), CAGR (%))
Table 40 Canada Smart Airport Technologies Market by Value, 2024-2034 (US$ Bn, AGR (%), CAGR (%))
Table 41 Europe Smart Airport Technologies Market by Value, 2024-2034 (US$ Bn, AGR (%), CAGR (%))
Table 42 Europe Smart Airport Technologies Market by Country, 2024-2034 (US$ Bn, AGR (%), CAGR (%))
Table 43 Europe Smart Airport Technologies Market by Component, 2024-2034 (US$ Bn, AGR (%), CAGR (%))
Table 44 Europe Smart Airport Technologies Market by Size, 2024-2034 (US$ Bn, AGR (%), CAGR (%))
Table 45 Europe Smart Airport Technologies Market by End-User, 2024-2034 (US$ Bn, AGR (%), CAGR (%))
Table 46 Europe Smart Airport Technologies Market by Application, 2024-2034 (US$ Bn, AGR (%), CAGR (%))
Table 47 Europe Smart Airport Technologies Market by Technology, 2024-2034 (US$ Bn, AGR (%), CAGR (%))
Table 48 Germany Smart Airport Technologies Market by Value, 2024-2034 (US$ Bn, AGR (%), CAGR (%))
Table 49 UK Smart Airport Technologies Market by Value, 2024-2034 (US$ Bn, AGR (%), CAGR (%))
Table 50 France Smart Airport Technologies Market by Value, 2024-2034 (US$ Bn, AGR (%), CAGR (%))
Table 51 Italy Smart Airport Technologies Market by Value, 2024-2034 (US$ Bn, AGR (%), CAGR (%))
Table 52 Spain Smart Airport Technologies Market by Value, 2024-2034 (US$ Bn, AGR (%), CAGR (%))
Table 53 Rest of Europe Smart Airport Technologies Market by Value, 2024-2034 (US$ Bn, AGR (%), CAGR (%))
Table 54 Asia-Pacific Smart Airport Technologies Market by Value, 2024-2034 (US$ Bn, AGR (%), CAGR (%))
Table 55 Asia-Pacific Smart Airport Technologies Market by Country, 2024-2034 (US$ Bn, AGR (%), CAGR (%))
Table 56 Asia-Pacific Smart Airport Technologies Market by Component, 2024-2034 (US$ Bn, AGR (%), CAGR (%))
Table 57 Asia-Pacific Smart Airport Technologies Market by Size, 2024-2034 (US$ Bn, AGR (%), CAGR (%))
Table 58 Asia-Pacific Smart Airport Technologies Market by End-User, 2024-2034 (US$ Bn, AGR (%), CAGR (%))
Table 59 Asia-Pacific Smart Airport Technologies Market by Application, 2024-2034 (US$ Bn, AGR (%), CAGR (%))
Table 60 Asia-Pacific Smart Airport Technologies Market by Technology, 2024-2034 (US$ Bn, AGR (%), CAGR (%))
Table 61 China Smart Airport Technologies Market by Value, 2024-2034 (US$ Bn, AGR (%), CAGR (%))
Table 62 India Smart Airport Technologies Market by Value, 2024-2034 (US$ Bn, AGR (%), CAGR (%))
Table 63 Japan Smart Airport Technologies Market by Value, 2024-2034 (US$ Bn, AGR (%), CAGR (%))
Table 64 South Korea Smart Airport Technologies Market by Value, 2024-2034 (US$ Bn, AGR (%), CAGR (%))
Table 65 Australia Smart Airport Technologies Market by Value, 2024-2034 (US$ Bn, AGR (%), CAGR (%))
Table 66 Rest of Asia-Pacific Smart Airport Technologies Market by Value, 2024-2034 (US$ Bn, AGR (%), CAGR (%))
Table 67 Middle East & Africa Smart Airport Technologies Market by Value, 2024-2034 (US$ Bn, AGR (%), CAGR (%))
Table 68 Middle East & Africa Smart Airport Technologies Market by Country, 2024-2034 (US$ Bn, AGR (%), CAGR (%))
Table 69 Middle East & Africa Smart Airport Technologies Market by Component, 2024-2034 (US$ Bn, AGR (%), CAGR (%))
Table 70 Middle East & Africa Smart Airport Technologies Market by Size, 2024-2034 (US$ Bn, AGR (%), CAGR (%))
Table 71 Middle East & Africa Smart Airport Technologies Market by End-User, 2024-2034 (US$ Bn, AGR (%), CAGR (%))
Table 72 Middle East & Africa Smart Airport Technologies Market by Application, 2024-2034 (US$ Bn, AGR (%), CAGR (%))
Table 73 Middle East & Africa Smart Airport Technologies Market by Technology, 2024-2034 (US$ Bn, AGR (%), CAGR (%))
Table 74 GCC Smart Airport Technologies Market by Value, 2024-2034 (US$ Bn, AGR (%), CAGR (%))
Table 75 South Africa Smart Airport Technologies Market by Value, 2024-2034 (US$ Bn, AGR (%), CAGR (%))
Table 76 Rest of Middle East & Africa Smart Airport Technologies Market by Value, 2024-2034 (US$ Bn, AGR (%), CAGR (%))
Table 77 Latin America Smart Airport Technologies Market by Value, 2024-2034 (US$ Bn, AGR (%), CAGR (%))
Table 78 Latin America Smart Airport Technologies Market by Country, 2024-2034 (US$ Bn, AGR (%), CAGR (%))
Table 79 Latin America Smart Airport Technologies Market by Component, 2024-2034 (US$ Bn, AGR (%), CAGR (%))
Table 80 Latin America Smart Airport Technologies Market by Size, 2024-2034 (US$ Bn, AGR (%), CAGR (%))
Table 81 Latin America Smart Airport Technologies Market by End-User, 2024-2034 (US$ Bn, AGR (%), CAGR (%))
Table 82 Latin America Smart Airport Technologies Market by Application, 2024-2034 (US$ Bn, AGR (%), CAGR (%))
Table 83 Latin America Smart Airport Technologies Market by Technology, 2024-2034 (US$ Bn, AGR (%), CAGR (%))
Table 84 Brazil Smart Airport Technologies Market by Value, 2024-2034 (US$ Bn, AGR (%), CAGR (%))
Table 85 Mexico Smart Airport Technologies Market by Value, 2024-2034 (US$ Bn, AGR (%), CAGR (%))
Table 86 Rest of Latin America Smart Airport Technologies Market by Value, 2024-2034 (US$ Bn, AGR (%), CAGR (%))
Table 87 Strategic Outlook – Recent Developments In The Global Market
Table 88 SITA: Key Details, (CEO, HQ, Revenue, Founded, No. of Employees, Company Type, Website, Business Segment)
Table 89 SITA: Product Benchmarking
Table 90 SITA: Strategic Outlook
Table 91 Honeywell International Inc: Key Details, (CEO, HQ, Revenue, Founded, No. of Employees, Company Type, Website, Business Segment)
Table 92 Honeywell International Inc: Product Benchmarking
Table 93 Honeywell International Inc: Strategic Outlook
Table 94 Cisco Systems, Inc: Key Details, (CEO, HQ, Revenue, Founded, No. of Employees, Company Type, Website, Business Segment)
Table 95 Cisco Systems, Inc: Product Benchmarking
Table 96 Cisco Systems, Inc: Strategic Outlook
Table 97 Siemens AG: Key Details, (CEO, HQ, Revenue, Founded, No. of Employees, Company Type, Website, Business Segment)
Table 98 Siemens AG: Product Benchmarking
Table 99 Siemens AG: Strategic Outlook
Table 100 International Business Machines Corporation: Key Details, (CEO, HQ, Revenue, Founded, No. of Employees, Company Type, Website, Business Segment)
Table 101 International Business Machines Corporation: Product Benchmarking
Table 102 International Business Machines Corporation: Strategic Outlook
Table 103 Thales Group: Key Details, (CEO, HQ, Revenue, Founded, No. of Employees, Company Type, Website, Business Segment)
Table 104 Thales Group: Product Benchmarking
Table 105 Thales Group: Strategic Outlook
Table 106 NEC Corporation: Key Details, (CEO, HQ, Revenue, Founded, No. of Employees, Company Type, Website, Business Segment)
Table 107 NEC Corporation: Product Benchmarking
Table 108 NEC Corporation: Strategic Outlook
Table 109 Raytheon Technologies Corporation: Key Details, (CEO, HQ, Revenue, Founded, No. of Employees, Company Type, Website, Business Segment)
Table 110 Raytheon Technologies Corporation: Product Benchmarking
Table 111 Raytheon Technologies Corporation: Strategic Outlook
Table 112 Indra Sistemas, S.A.: Key Details, (CEO, HQ, Revenue, Founded, No. of Employees, Company Type, Website, Business Segment)
Table 113 Indra Sistemas, S.A.: Product Benchmarking
Table 114 Indra Sistemas, S.A.: Strategic Outlook
Table 115 Vanderlande Industries B.V: Key Details, (CEO, HQ, Revenue, Founded, No. of Employees, Company Type, Website, Business Segment)
Table 116 Vanderlande Industries B.V: Product Benchmarking
Table 117 Vanderlande Industries B.V: Strategic Outlook
Table 118 Huawei Technologies Co., Ltd: Key Details, (CEO, HQ, Revenue, Founded, No. of Employees, Company Type, Website, Business Segment)
Table 119 Huawei Technologies Co., Ltd: Product Benchmarking
Table 120 Huawei Technologies Co., Ltd: Strategic Outlook
Table 121 Unisys Corporation: Key Details, (CEO, HQ, Revenue, Founded, No. of Employees, Company Type, Website, Business Segment)
Table 122 Unisys Corporation: Product Benchmarking
Table 123 Unisys Corporation: Strategic Outlook
Table 124 Leidos Holdings, Inc.: Key Details, (CEO, HQ, Revenue, Founded, No. of Employees, Company Type, Website, Business Segment)
Table 125 Leidos Holdings, Inc.: Product Benchmarking
Table 126 Leidos Holdings, Inc.: Strategic Outlook
Table 127 Vision-Box Holding: Key Details, (CEO, HQ, Revenue, Founded, No. of Employees, Company Type, Website, Business Segment)
Table 128 Vision-Box Holding: Product Benchmarking
Table 129 Vision-Box Holding: Strategic Outlook
Table 130 Materna IPS GmbH: Key Details, (CEO, HQ, Revenue, Founded, No. of Employees, Company Type, Website, Business Segment)
Table 131 Materna IPS GmbH: Product Benchmarking
Table 132 Materna IPS GmbH: Strategic Outlook
List of Figures
Figure 1 Smart Airport Technologies Market Segmentation
Figure 2 Smart Airport Technologies Market by Component: Market Attractiveness Index
Figure 3 Smart Airport Technologies Market by Size: Market Attractiveness Index
Figure 4 Smart Airport Technologies Market by End-User: Market Attractiveness Index
Figure 5 Smart Airport Technologies Market by Application: Market Attractiveness Index
Figure 6 Smart Airport Technologies Market by Technology: Market Attractiveness Index
Figure 7 Smart Airport Technologies Market Attractiveness Index by Region
Figure 8 Smart Airport Technologies Market: Market Dynamics
Figure 9 Smart Airport Technologies Market: Porter’s Five Forces Analysis
Figure 10 Global Smart Airport Technologies Market Share Forecast by COVID, 2024-2034 (%)
Figure 11 Global Smart Airport Technologies Market by Region, 2024-2034 (US$ Bn, AGR (%)) (V-Shaped Recovery Scenario)
Figure 12 Global Smart Airport Technologies Market by Region, 2024-2034 (US$ Bn, AGR (%)) (U-Shaped Recovery Scenario)
Figure 13 Global Smart Airport Technologies Market by Region, 2024-2034 (US$ Bn, AGR (%)) (W-Shaped Recovery Scenario)
Figure 14 Global Smart Airport Technologies Market by Region, 2024-2034 (US$ Bn, AGR (%)) (L-Shaped Recovery Scenario)
Figure 15 Smart Airport Technologies Market: PEST Analysis
Figure 16 Smart Airport Technologies Market by Component: Market Attractiveness Index
Figure 17 Global Smart Airport Technologies Market by Component, 2024-2034 (US$ Bn, AGR (%))
Figure 18 Smart Airport Technologies Market Share Forecast by Component, 2024, 2029, 2034 (%)
Figure 19 Hardware Market by Region, 2024-2034 (US$ Bn, AGR (%))
Figure 20 Hardware Market Share Forecast by Region, 2024 & 2034 (%)
Figure 21 Software Market by Region, 2024-2034 (US$ Bn, AGR (%))
Figure 22 Software Market Share Forecast by Region, 2024 & 2034 (%)
Figure 23 Smart Airport Technologies Market by Size: Market Attractiveness Index
Figure 24 Global Smart Airport Technologies Market by Size, 2024-2034 (US$ Bn, AGR (%))
Figure 25 Smart Airport Technologies Market Share Forecast by Size, 2024, 2029, 2034 (%)
Figure 26 Large Airports Market by Region, 2024-2034 (US$ Bn, AGR (%))
Figure 27 Large Airports Market Share Forecast by Region, 2024 & 2034 (%)
Figure 28 Medium-Sized Airports Market by Region, 2024-2034 (US$ Bn, AGR (%))
Figure 29 Medium-Sized Airports Market Share Forecast by Region, 2024 & 2034 (%)
Figure 30 Small Airports Market by Region, 2024-2034 (US$ Bn, AGR (%))
Figure 31 Small Airports Market Share Forecast by Region, 2024 & 2034 (%)
Figure 32 Smart Airport Technologies Market by End-User: Market Attractiveness Index
Figure 33 Global Smart Airport Technologies Market by End-User, 2024-2034 (US$ Bn, AGR (%))
Figure 34 Smart Airport Technologies Market Share Forecast by End-User, 2024, 2029, 2034 (%)
Figure 35 Airport Authorities and Operators Market by Region, 2024-2034 (US$ Bn, AGR (%))
Figure 36 Airport Authorities and Operators Market Share Forecast by Region, 2024 & 2034 (%)
Figure 37 Airlines Market by Region, 2024-2034 (US$ Bn, AGR (%))
Figure 38 Airlines Market Share Forecast by Region, 2024 & 2034 (%)
Figure 39 Ground Handlers Market by Region, 2024-2034 (US$ Bn, AGR (%))
Figure 40 Ground Handlers Market Share Forecast by Region, 2024 & 2034 (%)
Figure 41 Retailers and Duty-Free Operators Market by Region, 2024-2034 (US$ Bn, AGR (%))
Figure 42 Retailers and Duty-Free Operators Market Share Forecast by Region, 2024 & 2034 (%)
Figure 43 Smart Airport Technologies Market by Application: Market Attractiveness Index
Figure 44 Global Smart Airport Technologies Market by Application, 2024-2034 (US$ Bn, AGR (%))
Figure 45 Smart Airport Technologies Market Share Forecast by Application, 2024, 2029, 2034 (%)
Figure 46 Passenger Processing Market by Region, 2024-2034 (US$ Bn, AGR (%))
Figure 47 Passenger Processing Market Share Forecast by Region, 2024 & 2034 (%)
Figure 48 Baggage Handling and Tracking Market by Region, 2024-2034 (US$ Bn, AGR (%))
Figure 49 Baggage Handling and Tracking Market Share Forecast by Region, 2024 & 2034 (%)
Figure 50 Security and Surveillance Market by Region, 2024-2034 (US$ Bn, AGR (%))
Figure 51 Security and Surveillance Market Share Forecast by Region, 2024 & 2034 (%)
Figure 52 Airside and Landside Operations Market by Region, 2024-2034 (US$ Bn, AGR (%))
Figure 53 Airside and Landside Operations Market Share Forecast by Region, 2024 & 2034 (%)
Figure 54 Other Applications Market by Region, 2024-2034 (US$ Bn, AGR (%))
Figure 55 Other Applications Market Share Forecast by Region, 2024 & 2034 (%)
Figure 56 Smart Airport Technologies Market by Technology: Market Attractiveness Index
Figure 57 Global Smart Airport Technologies Market by Technology, 2024-2034 (US$ Bn, AGR (%))
Figure 58 Smart Airport Technologies Market Share Forecast by Technology, 2024, 2029, 2034 (%)
Figure 59 Biometrics and Identity Management Market by Region, 2024-2034 (US$ Bn, AGR (%))
Figure 60 Biometrics and Identity Management Market Share Forecast by Region, 2024 & 2034 (%)
Figure 61 Internet of Things (IoT) Devices Market by Region, 2024-2034 (US$ Bn, AGR (%))
Figure 62 Internet of Things (IoT) Devices Market Share Forecast by Region, 2024 & 2034 (%)
Figure 63 5G Networks and Connectivity Market by Region, 2024-2034 (US$ Bn, AGR (%))
Figure 64 5G Networks and Connectivity Market Share Forecast by Region, 2024 & 2034 (%)
Figure 65 Artificial Intelligence (AI) and Machine Learning (ML) Market by Region, 2024-2034 (US$ Bn, AGR (%))
Figure 66 Artificial Intelligence (AI) and Machine Learning (ML) Market Share Forecast by Region, 2024 & 2034 (%)
Figure 67 Augmented Reality (AR) and Virtual Reality (VR) Market by Region, 2024-2034 (US$ Bn, AGR (%))
Figure 68 Augmented Reality (AR) and Virtual Reality (VR) Market Share Forecast by Region, 2024 & 2034 (%)
Figure 69 Robotics and Automation Market by Region, 2024-2034 (US$ Bn, AGR (%))
Figure 70 Robotics and Automation Market Share Forecast by Region, 2024 & 2034 (%)
Figure 71 Smart Airport Technologies Market Forecast by Region 2024 and 2034 (Revenue, CAGR%)
Figure 72 Smart Airport Technologies Market Share Forecast by Region 2024, 2029, 2034 (%)
Figure 73 Smart Airport Technologies Market by Region, 2024-2034 (US$ Billion, AGR %)
Figure 74 North America Smart Airport Technologies Market Attractiveness Index
Figure 75 North America Smart Airport Technologies Market by Region, 2024, 2029 & 2034 (US$ Billion)
Figure 76 North America Smart Airport Technologies Market by Value, 2024-2034 (US$ Bn, AGR (%))
Figure 77 North America Smart Airport Technologies Market by Country, 2024-2034 (US$ Bn, AGR (%))
Figure 78 North America Smart Airport Technologies Market Share Forecast by Country, 2024 & 2034 (%)
Figure 79 North America Smart Airport Technologies Market by Component, 2024-2034 (US$ Bn, AGR (%))
Figure 80 North America Smart Airport Technologies Market Share Forecast Component, 2024 & 2034 (%)
Figure 81 North America Smart Airport Technologies Market by Size, 2024-2034 (US$ Bn, AGR (%))
Figure 82 North America Smart Airport Technologies Market Share Forecast by Size, 2024 & 2034 (%)
Figure 83 North America Smart Airport Technologies Market by End-User, 2024-2034 (US$ Bn, AGR (%))
Figure 84 North America Smart Airport Technologies Market Share Forecast by End-User, 2024 & 2034 (%)
Figure 85 North America Smart Airport Technologies Market by Application, 2024-2034 (US$ Bn, AGR (%))
Figure 86 North America Smart Airport Technologies Market Share Forecast by Application, 2024 & 2034 (%)
Figure 87 North America Smart Airport Technologies Market by Technology, 2024-2034 (US$ Bn, AGR (%))
Figure 88 North America Smart Airport Technologies Market Share Forecast by Technology, 2024 & 2034 (%)
Figure 89 US Smart Airport Technologies Market by Value, 2024-2034 (US$ Bn, AGR (%))
Figure 90 Canada Smart Airport Technologies Market by Value, 2024-2034 (US$ Bn, AGR (%))
Figure 91 Europe Smart Airport Technologies Market Attractiveness Index
Figure 92 Europe Smart Airport Technologies Market by Region, 2024, 2029 & 2034 (US$ Billion)
Figure 93 Europe Smart Airport Technologies Market by Value, 2024-2034 (US$ Bn, AGR (%))
Figure 94 Europe Smart Airport Technologies Market by Country, 2024-2034 (US$ Bn, AGR (%))
Figure 95 Europe Smart Airport Technologies Market Share Forecast by Country, 2024 & 2034 (%)
Figure 96 Europe Smart Airport Technologies Market by Component, 2024-2034 (US$ Bn, AGR (%))
Figure 97 Europe Smart Airport Technologies Market Share Forecast Component, 2024 & 2034 (%)
Figure 98 Europe Smart Airport Technologies Market by Size, 2024-2034 (US$ Bn, AGR (%))
Figure 99 Europe Smart Airport Technologies Market Share Forecast by Size, 2024 & 2034 (%)
Figure 100 Europe Smart Airport Technologies Market by End-User, 2024-2034 (US$ Bn, AGR (%))
Figure 101 Europe Smart Airport Technologies Market Share Forecast by End-User, 2024 & 2034 (%)
Figure 102 Europe Smart Airport Technologies Market by Application, 2024-2034 (US$ Bn, AGR (%))
Figure 103 Europe Smart Airport Technologies Market Share Forecast by Application, 2024 & 2034 (%)
Figure 104 Europe Smart Airport Technologies Market by Technology, 2024-2034 (US$ Bn, AGR (%))
Figure 105 Europe Smart Airport Technologies Market Share Forecast by Technology, 2024 & 2034 (%)
Figure 106 Germany Smart Airport Technologies Market by Value, 2024-2034 (US$ Bn, AGR (%))
Figure 107 UK Smart Airport Technologies Market by Value, 2024-2034 (US$ Bn, AGR (%))
Figure 108 France Smart Airport Technologies Market by Value, 2024-2034 (US$ Bn, AGR (%))
Figure 109 Italy Smart Airport Technologies Market by Value, 2024-2034 (US$ Bn, AGR (%))
Figure 110 Spain Smart Airport Technologies Market by Value, 2024-2034 (US$ Bn, AGR (%),)
Figure 111 Rest of Europe Smart Airport Technologies Market by Value, 2024-2034 (US$ Bn, AGR (%))
Figure 112 Asia-Pacific Smart Airport Technologies Market Attractiveness Index
Figure 113 Asia-Pacific Smart Airport Technologies Market by Region, 2024, 2029 & 2034 (US$ Billion)
Figure 114 Asia-Pacific Smart Airport Technologies Market by Value, 2024-2034 (US$ Bn, AGR (%))
Figure 115 Asia-Pacific Smart Airport Technologies Market by Country, 2024-2034 (US$ Bn, AGR (%))
Figure 116 Asia-Pacific Smart Airport Technologies Market Share Forecast by Country, 2024 & 2034 (%)
Figure 117 Asia-Pacific Smart Airport Technologies Market by Component, 2024-2034 (US$ Bn, AGR (%))
Figure 118 Asia-Pacific Smart Airport Technologies Market Share Forecast Component, 2024 & 2034 (%)
Figure 119 Asia-Pacific Smart Airport Technologies Market by Size, 2024-2034 (US$ Bn, AGR (%))
Figure 120 Asia-Pacific Smart Airport Technologies Market Share Forecast by Size, 2024 & 2034 (%)
Figure 121 Asia-Pacific Smart Airport Technologies Market by End-User, 2024-2034 (US$ Bn, AGR (%))
Figure 122 Asia-Pacific Smart Airport Technologies Market Share Forecast by End-User, 2024 & 2034 (%)
Figure 123 Asia-Pacific Smart Airport Technologies Market by Application, 2024-2034 (US$ Bn, AGR (%))
Figure 124 Asia-Pacific Smart Airport Technologies Market Share Forecast by Application, 2024 & 2034 (%)
Figure 125 Asia-Pacific Smart Airport Technologies Market by Technology, 2024-2034 (US$ Bn, AGR (%))
Figure 126 Asia-Pacific Smart Airport Technologies Market Share Forecast by Technology, 2024 & 2034 (%)
Figure 127 China Smart Airport Technologies Market by Value, 2024-2034 (US$ Bn, AGR (%))
Figure 128 India Smart Airport Technologies Market by Value, 2024-2034 (US$ Bn, AGR (%))
Figure 129 Japan Smart Airport Technologies Market by Value, 2024-2034 (US$ Bn, AGR (%))
Figure 130 South Korea Smart Airport Technologies Market by Value, 2024-2034 (US$ Bn, AGR (%))
Figure 131 Australia Smart Airport Technologies Market by Value, 2024-2034 (US$ Bn, AGR (%))
Figure 132 Rest of Asia-Pacific Smart Airport Technologies Market by Value, 2024-2034 (US$ Bn, AGR (%))
Figure 133 Middle East and Africa Smart Airport Technologies Market Attractiveness Index
Figure 134 Middle East and Africa Smart Airport Technologies Market by Region, 2024, 2029 & 2034 (US$ Billion)
Figure 135 Middle East & Africa Smart Airport Technologies Market by Value, 2024-2034 (US$ Bn, AGR (%))
Figure 136 Middle East & Africa Smart Airport Technologies Market by Country, 2024-2034 (US$ Bn, AGR (%))
Figure 137 Middle East and Africa Smart Airport Technologies Market Share Forecast by Country, 2024 & 2034 (%)
Figure 138 Middle East & Africa Smart Airport Technologies Market by Component, 2024-2034 (US$ Bn, AGR (%))
Figure 139 Middle East and Africa Smart Airport Technologies Market Share Forecast Component, 2024 & 2034 (%)
Figure 140 Middle East & Africa Smart Airport Technologies Market by Size, 2024-2034 (US$ Bn, AGR (%))
Figure 141 Middle East and Africa Smart Airport Technologies Market Share Forecast by Size, 2024 & 2034 (%)
Figure 142 Middle East & Africa Smart Airport Technologies Market by End-User, 2024-2034 (US$ Bn, AGR (%))
Figure 143 Middle East and Africa Smart Airport Technologies Market Share Forecast by End-User, 2024 & 2034 (%)
Figure 144 Middle East & Africa Smart Airport Technologies Market by Application, 2024-2034 (US$ Bn, AGR (%))
Figure 145 Middle East and Africa Smart Airport Technologies Market Share Forecast by Application, 2024 & 2034 (%)
Figure 146 Middle East & Africa Smart Airport Technologies Market by Technology, 2024-2034 (US$ Bn, AGR (%))
Figure 147 Middle East and Africa Smart Airport Technologies Market Share Forecast by Technology, 2024 & 2034 (%)
Figure 148 GCC Smart Airport Technologies Market by Value, 2024-2034 (US$ Bn, AGR (%))
Figure 149 South Africa Smart Airport Technologies Market by Value, 2024-2034 (US$ Bn, AGR (%))
Figure 150 Rest of Middle East & Africa Smart Airport Technologies Market by Value, 2024-2034 (US$ Bn, AGR (%))
Figure 151 Latin America Smart Airport Technologies Market Attractiveness Index
Figure 152 Latin America Smart Airport Technologies Market by Region, 2024, 2029 & 2034 (US$ Billion)
Figure 153 Latin America Smart Airport Technologies Market by Value, 2024-2034 (US$ Bn, AGR (%))
Figure 154 Latin America Smart Airport Technologies Market by Country, 2024-2034 (US$ Bn, AGR (%))
Figure 155 Latin America Smart Airport Technologies Market Share Forecast by Country, 2024 & 2034 (%)
Figure 156 Latin America Smart Airport Technologies Market by Component, 2024-2034 (US$ Bn, AGR (%))
Figure 157 Latin America Smart Airport Technologies Market Share Forecast Component, 2024 & 2034 (%)
Figure 158 Latin America Smart Airport Technologies Market by Size, 2024-2034 (US$ Bn, AGR (%))
Figure 159 Latin America Smart Airport Technologies Market Share Forecast by Size, 2024 & 2034 (%)
Figure 160 Latin America Smart Airport Technologies Market by End-User, 2024-2034 (US$ Bn, AGR (%))
Figure 161 Latin America Smart Airport Technologies Market Share Forecast by End-User, 2024 & 2034 (%)
Figure 162 Latin America Smart Airport Technologies Market by Application, 2024-2034 (US$ Bn, AGR (%))
Figure 163 Latin America Smart Airport Technologies Market Share Forecast by Application, 2024 & 2034 (%)
Figure 164 Latin America Smart Airport Technologies Market by Technology, 2024-2034 (US$ Bn, AGR (%))
Figure 165 Latin America Smart Airport Technologies Market Share Forecast by Technology, 2024 & 2034 (%)
Figure 166 Brazil Smart Airport Technologies Market by Value, 2024-2034 (US$ Bn, AGR (%))
Figure 167 Mexico Smart Airport Technologies Market by Value, 2024-2034 (US$ Bn, AGR (%))
Figure 168 Rest of Latin America Smart Airport Technologies Market by Value, 2024-2034 (US$ Bn, AGR (%))
Figure 169 Smart Airport Technologies Market: Company Share, 2022
Figure 170 Honeywell International Inc.: Net Revenue, 2018-2022 (US$ Million, AGR%)
Figure 171 Honeywell International Inc.: R&D, 2018-2022 (US$ Million, AGR%)
Figure 172 Honeywell International Inc.: Regional Revenue Share, 2022 (%)
Figure 173 Honeywell International Inc.: Business Segment Revenue Share, 2022 (%)
Figure 174 Cisco Systems, Inc.: Net Revenue, 2019-2023 (US$ Million, AGR%)
Figure 175 Cisco Systems, Inc.: R&D, 2019-2023 (US$ Million, AGR%)
Figure 176 Cisco Systems, Inc.: Regional Revenue Share, 2023 (%)
Figure 177 Cisco Systems, Inc.: Business Segment Revenue Share, 2023 (%)
Figure 178 Siemens AG.: Net Revenue, 2019-2023 (US$ Million, AGR%)
Figure 179 Siemens AG.: R&D, 2019-2023 (US$ Million, AGR%)
Figure 180 Siemens AG.: Regional Revenue Share, 2023 (%)
Figure 181 Siemens AG.: Business Segment Revenue Share, 2023 (%)
Figure 182 International Business Machines Corporation.: Net Revenue, 2018-2022 (US$ Million, AGR%)
Figure 183 International Business Machines Corporation.: R&D, 2018-2022 (US$ Million, AGR%)
Figure 184 International Business Machines Corporation.: Regional Revenue Share, 2022 (%)
Figure 185 International Business Machines Corporation.: Business Segment Revenue Share, 2022 (%)
Figure 186 Thales Group.: Net Revenue, 2018-2022 (US$ Million, AGR%)
Figure 187 NEC Corporation.: Net Revenue, 2019-2023 (US$ Million, AGR%)
Figure 188 NEC Corporation.: R&D, 2019-2023 (US$ Million, AGR%)
Figure 189 NEC Corporation.: Business Segment Revenue Share, 2023 (%)
Figure 190 Raytheon Technologies Corporation.: Net Revenue, 2018-2022 (US$ Million, AGR%)
Figure 191 Raytheon Technologies Corporation.: R&D, 2018-2022 (US$ Million, AGR%)
Figure 192 Raytheon Technologies Corporation.: Regional Revenue Share, 2022 (%)
Figure 193 Raytheon Technologies Corporation.: Business Segment Revenue Share, 2022 (%)
Figure 194 Indra Sistemas, S.A..: Net Revenue, 2018-2022 (US$ Million, AGR%)
Figure 195 Vanderlande Industries B.V.: Net Revenue, 2018-2022 (US$ Million, AGR%)
Figure 196 Vanderlande Industries B.V.: R&D, 2018-2022 (US$ Million, AGR%)
Figure 197 Vanderlande Industries B.V.: Regional Revenue Share, 2022 (%)
Figure 198 Vanderlande Industries B.V.: Business Segment Revenue Share, 2022 (%)
Figure 199 Huawei Technologies Co., Ltd.: Net Revenue, 2018-2022 (US$ Million, AGR%)
Figure 200 Huawei Technologies Co., Ltd.: R&D, 2018-2022 (US$ Million, AGR%)
Figure 201 Huawei Technologies Co., Ltd.: Regional Revenue Share, 2022 (%)
Figure 202 Huawei Technologies Co., Ltd.: Business Segment Revenue Share, 2022 (%)
Figure 203 Unisys Corporation.: Net Revenue, 2018-2022 (US$ Million, AGR%)
Figure 204 Unisys Corporation.: R&D, 2018-2022 (US$ Million, AGR%)
Figure 205 Leidos Holdings, Inc..: Net Revenue, 2018-2022 (US$ Million, AGR%)
Figure 206 Leidos Holdings, Inc..: R&D, 2018-2022 (US$ Million, AGR%)
Figure 207 Leidos Holdings, Inc..: Regional Revenue Share, 2022 (%)
Figure 208 Leidos Holdings, Inc..: Business Segment Revenue Share, 2022 (%)
ページTOPに戻る
本レポートと同じKEY WORD()の最新刊レポート
- 本レポートと同じKEY WORDの最新刊レポートはありません。
よくあるご質問
Visiongain社はどのような調査会社ですか?
英国の調査会社ヴィジョンゲイン社(Visiongain)は、通信とエネルギーのほか、自動車や化学・医薬品、金属など、広範な市場を対象に調査を行っています。自動車市場については、市場全般に関する調査のほ... もっと見る
調査レポートの納品までの日数はどの程度ですか?
在庫のあるものは速納となりますが、平均的には 3-4日と見て下さい。
但し、一部の調査レポートでは、発注を受けた段階で内容更新をして納品をする場合もあります。
発注をする前のお問合せをお願いします。
注文の手続きはどのようになっていますか?
1)お客様からの御問い合わせをいただきます。
2)見積書やサンプルの提示をいたします。
3)お客様指定、もしくは弊社の発注書をメール添付にて発送してください。
4)データリソース社からレポート発行元の調査会社へ納品手配します。
5) 調査会社からお客様へ納品されます。最近は、pdfにてのメール納品が大半です。
お支払方法の方法はどのようになっていますか?
納品と同時にデータリソース社よりお客様へ請求書(必要に応じて納品書も)を発送いたします。
お客様よりデータリソース社へ(通常は円払い)の御振り込みをお願いします。
請求書は、納品日の日付で発行しますので、翌月最終営業日までの当社指定口座への振込みをお願いします。振込み手数料は御社負担にてお願いします。
お客様の御支払い条件が60日以上の場合は御相談ください。
尚、初めてのお取引先や個人の場合、前払いをお願いすることもあります。ご了承のほど、お願いします。
データリソース社はどのような会社ですか?
当社は、世界各国の主要調査会社・レポート出版社と提携し、世界各国の市場調査レポートや技術動向レポートなどを日本国内の企業・公官庁及び教育研究機関に提供しております。
世界各国の「市場・技術・法規制などの」実情を調査・収集される時には、データリソース社にご相談ください。
お客様の御要望にあったデータや情報を抽出する為のレポート紹介や調査のアドバイスも致します。
|
|


