商用アビオニクス市場レポート:2024-2034
Commercial Avionics Market Report 2024-2034
レポート詳細
商用アビオニクス市場レポート 2024-2034年 :この調査レポートは、業界とその基礎となるダイナミクスをより良く理解することを望むなら、新たな収益ポケットを目指す大手企業にとって... もっと見る
※上記価格は部署ライセンス(Departmental licence)価格です。
その他の価格についてはデータリソースまでお問合せください。
日本語のページは自動翻訳を利用し作成しています。
実際のレポートは英文のみでご納品いたします。

|

|
サマリー
レポート詳細
商用アビオニクス市場レポート 2024-2034年:この調査レポートは、業界とその基礎となるダイナミクスをより良く理解することを望むなら、新たな収益ポケットを目指す大手企業にとって貴重なものとなるであろう。異業種への進出や新地域での既存事業の拡大を目指す企業にも有用です。
成長をナビゲートする 世界の商用アビオニクス市場を牽引する要因
世界の商用アビオニクス市場は、業界の進化を形成する様々な要因の収束と高度な航空技術に対する需要の急増に後押しされ、大幅な成長を遂げようとしている。主な推進要因には、現代の航空機の複雑化、燃料効率が高く技術的に高度な飛行機械への需要の高まり、安全性と運航効率の重視の高まりなどがある。統合アビオニクス・スイートや次世代コックピット・テクノロジーなどの革新的技術に後押しされ、機能強化、パイロットの作業負担軽減、航空機性能の全体的向上がもたらされ、市場は顕著な進歩を遂げている。
このような変貌を遂げる情勢の中、航空セクターがデジタルトランスフォーメーションを受け入れるにつれ、商用アビオニクス市場には豊富なビジネスチャンスがもたらされている。最先端の通信、ナビゲーション、監視システムの統合は、人工知能や機械学習のような革命的な技術の採用と相まって、実質的な成長の道として浮上している。さらに、特に新興市場における商用航空機の世界的な拡大は、アビオニクスメーカーに、近代化され接続された航空機に対する需要の高まりに対応する新たな展望を提供している。商用アビオニクス市場の軌跡は、航空の未来を形作る上で極めて重要な役割を担っていることを裏付けている。
アビオニクスシステムの接続性とデジタル化が進み、サイバーセキュリティの脅威にさらされやすくなる
商用アビオニクス市場にとって、アビオニクスシステムの接続性とデジタル化の進展は大きな障害となっており、サイバーセキュリティの脅威に対する脆弱性が高まっている。現代の航空機は、相互接続されたシステムと高度なデジタル技術にますます依存するようになっており、サイバー攻撃の可能性が重大な懸念となっている。例えば、航空電子機器システム内の無線通信、機内接続、データ共有機能の統合が挙げられる。
近年、航空業界では、接続されたシステムにおけるサイバーセキュリティの脆弱性が悪用された事例がある。これらの脆弱性は、重要なアビオニクス・コンポーネントへの不正アクセスから、相互接続されたネットワークを介した潜在的な脅威まで多岐にわたる。例えば、航空機の通信システムに不正アクセスされ、ナビゲーションや航空管制官との通信といった重要な機能を侵害される可能性があるというシナリオが想定されます。
市場調査レポートを購入する前にすべき質問とは?
- 商用アビオニクス市場はどのように進化しているのか?
- 商用アビオニクス市場の推進要因と阻害要因は何か?
- 各商用アビオニクスサブマーケットセグメントは予測期間中にどのように成長し、2034年にはどれくらいの売上を占めるようになるのか?
- 2024年から2034年にかけて、商用アビオニクスの各サブマーケットの市場シェアはどのように推移するのか?
- 2024年から2034年にかけての市場全体の主な牽引役は何か?
- 商用アビオニクスの主要市場はマクロ経済の動きに概ね追随するのか、それとも個々の国内市場が他を凌駕するのか。
- 2034年までに各国市場のシェアはどのように変化し、2034年に市場をリードするのはどの地域か?
- 主要プレイヤーは誰で、予測期間中の見通しは?
- これら主要企業の商用アビオニクス・プロジェクトは?
- 2024年から2034年の間に産業はどのように発展するのか?現在および今後10年間に実施される商用アビオニクス・プロジェクトにはどのような意味があるのか?
- 商用アビオニクス市場をさらに拡大するために、製品の商業化の必要性は高まっているか?
- 商用アビオニクス市場はどこに向かっているのか、そしてどのようにすれば市場の最前線に立つことができるのか?
- 新製品やサービスラインに対する最適な投資オプションは何か?
- 企業を新たな成長軌道に乗せ、C-suiteに移行させるための重要な展望とは?
このことが、現在、そして今後10年間の商用アビオニクス市場にどのような影響を与えるかを見極める必要がある:
- 419ページにわたる本レポートは、132の表と208の図表で構成されています。
- 本レポートは、業界における主要な有利分野にハイライトを当てているため、今すぐターゲットを絞ることができます。
- 世界、地域、国の売上と成長に関する詳細な分析が含まれています。
- 競合他社が成功した主なトレンド、変化、収益予測をハイライトしています。
本レポートは、商用アビオニクス市場が今後10年間でどのように発展するか、またCOVID-19の景気後退と好転の変動に合わせてどのように発展するかをお伝えします。この市場は、過去10年間のどの時点よりも今が重要です。
2034年までの予測やその他の分析から、商業的な展望が明らかになる
- 2034年までの収益予測に加え、直近の実績、成長率、市場シェアを提供します。
- ビジネスの展望と展開に関する独自の分析をご覧いただけます。
- 定性的分析(市場ダイナミクス、促進要因、機会、阻害要因、課題を含む)、コスト構造、商用アビオニクス価格上昇の影響、最近の動向をご覧いただけます。
本レポートには、COVID-19が業界と貴社にどのような影響を与えるかについてのデータ分析と貴重な洞察が含まれている。本レポートでは、COVID-19の4つの回収パターンとその影響、すなわち「V」、「L」、「W」、「U」について論じている。
レポート対象セグメント
フィット別市場セグメント
- レトロフィット
- フォワードフィット
ナビゲーションシステム別市場セグメント
- 飛行管理システム(FMS)
- 全地球航法衛星システム(GNSS)
- 慣性航法システム(INS)
監視システム別市場セグメント
- レーダーシステム
- 交通衝突回避システム(TCAS)
- 自動従属監視放送(ADS-B)
- その他の監視システム
航空機タイプ別市場セグメント
- ナローボディ
- ワイドボディ
- リージョナル&ビジネスジェット
- 貨物機
- その他の航空機タイプ
システムタイプ別市場セグメント
- ナビゲーションシステム
- 監視システム
- 統合モジュラーアビオニクス(IMA)
- 通信システム
- 飛行制御・監視システム
- その他のシステムタイプ
世界市場全体とセグメント別の収益予測に加え、4つの地域と20の主要国市場の収益予測も掲載しています:
北米
- アメリカ
- カナダ
欧州
- ドイツ
- スペイン
- イギリス
- フランス
- イタリア
- その他の欧州
アジア太平洋
- 中国
- 日本
- インド
- オーストラリア
- 韓国
- その他のアジア太平洋地域
ラテンアメリカ
- ブラジル
- メキシコ
- その他ラテンアメリカ
中東・アフリカ
- GCC
- 南アフリカ
- その他の中東・アフリカ
本レポートでは、商用アビオニクス市場の2024年から2034年までの主要企業のプロファイルも掲載している。
報告書に掲載されている主要企業
・ Astronautics Corporation of America
・ BAE Systems PLC
・ Cobham Limited
・ Curtiss-Wright Corporation
・ Diehl Stiftung & Co. KG
・ Garmin Ltd.
・ General Electric Company
・ Honeywell International Inc
・ L3Harris Technologies, Inc.
・ Parker Meggitt
・ Raytheon Technologies Corporation
・ Safran S.A.
・ Teledyne Technologies Incorporated
・ Thales Group
・ TransDigm Group
2024年から2034年にかけての商用アビオニクス市場全体の世界売上高は、金額ベースで2024年に343億米ドルを突破する。2034年まで力強い収益成長を予測。当調査では、最も大きな可能性を秘めた企業を特定しています。彼らの能力、進歩、商業的展望を発見し、一歩先を行くお手伝いをします。
商用アビオニクス市場、2024-2034年レポートはどのように役立つのか?
まとめると、419ページを超えるこのレポートは、以下のような知識を提供する:
- 商用アビオニクス市場、2024年から2034年までの収益予測 フィット、ナビゲーションシステム、監視システム、航空機タイプ、システムタイプごとに世界および地域レベルで予測 - 業界の展望を発見し、投資と収益に最も有利な場所を見つけることができます。
- 4つの地域と20の主要国市場の2034年までの収益予測 - 北米、ヨーロッパ、アジア太平洋、ラテンアメリカ、中東・アフリカの商用アビオニクス市場の2024年から2034年までの市場予測をご覧ください。また、米国、カナダ、ブラジル、ドイツ、フランス、英国、イタリア、中国、インド、日本、オーストラリアなど著名な経済圏の市場も予測しています。
- 既存企業や市場参入を目指す企業の展望 - 2024年から2034年までの商用アビオニクス市場に関わる主要企業15社の企業プロファイルを含む。
独自の予測による定量的・定性的分析をご覧ください。私たちのレポートだけに含まれる情報を入手し、貴重なビジネスインテリジェンスで情報を得ることができます。
他にはない情報
私たちの新しいレポートがあれば、知識に遅れをとったり、チャンスを逃したりする可能性が低くなります。弊社の調査レポートが貴社の調査、分析、意思決定にどのように役立つかをご覧ください。Visiongainの調査は、商用アビオニクス市場、2024年から2034年、市場をリードする企業の商業分析を必要とするすべての人のためのものです。データ、トレンド、予測をご覧いただけます。
ページTOPに戻る
目次
目次
1 レポート概要
1.1 研究の目的
1.2 商用アビオニクス市場の紹介
1.3 本レポートの内容
1.4 本レポートを読むべき理由
1.5 本分析レポートが回答する主な質問
1.6 本レポートの対象者
1.7 方法論
1.7.1 市場の定義
1.7.2 市場評価・予測手法
1.7.3 データの検証
1.7.3.1 一次調査
1.7.3.2 セカンダリーリサーチ
1.8 よくある質問(FAQ)
1.9 Visiongainの関連レポート
1.10 Visiongainについて
2 エグゼクティブ・サマリー
3 市場概要
3.1 主要な調査結果
3.2 市場ダイナミクス
3.2.1 市場促進要因
3.2.1.1 航空機OEMによる高度な運航管理システムの採用増加
3.2.1.2 民間機および軍用機の増加
3.2.1.3 アビオニクスによる安全性と状況認識の向上
3.2.2 市場抑制要因
3.2.2.1 アビオニクスシステムの接続性の向上とデジタル化により、サイバーセキュリティの脅威にさらされやすくなる
3.2.2.2 高い初期投資が市場成長を妨げる
3.2.2.3 既存の航空機への先進アビオニクスの後付けは、統合に課題をもたらす可能性がある
3.2.3 市場機会
3.2.3.1 艦隊近代化プログラムは市場成長の機会
3.2.3.2 AI、ML、ブロックチェーンなどアビオニクス技術の絶え間ない進化が市場に機会をもたらす
3.2.3.3 グリーンアビエーション技術は市場成長の機会
3.3 ポーターのファイブフォース分析
3.3.1 サプライヤーの交渉力(中)
3.3.2 買い手の交渉力(高)
3.3.3 競争力(中〜高)
3.3.4 代替品による脅威(低)
3.3.5 新規参入の脅威(低)
3.4 COVID-19の影響分析
3.4.1 "V字型回復"
3.4.2 "U字型回復"
3.4.3 "W字型回復"
3.4.4 "L字型回復"
3.5 PEST分析
4 商用アビオニクス市場分析:フィット別
4.1 主要な調査結果
4.2 フィットセグメント 市場魅力度指数
4.3 フィット別の商用アビオニクス市場規模の推定と予測
4.4 レトロフィット
4.4.1 2024〜2034年の地域別市場規模(US$ Billion)
4.4.2 地域別市場シェア、2024年・2034年(%)
4.5 フォワードフィット
4.5.1 2024〜2034年の地域別市場規模(US$ Billion)
4.5.2 地域別市場シェア、2024年・2034年(%)
5 商用アビオニクス市場分析:航法システム別
5.1 主要調査結果
5.2 ナビゲーションシステムセグメント 市場魅力度指数
5.3 航法システム別の商用アビオニクス市場規模の推定と予測
5.4 フライト・マネジメント・システム(FMS)
5.4.1 2024〜2034年の地域別市場規模(US$ Billion)
5.4.2 地域別市場シェア、2024年・2034年(%)
5.5 全地球航法衛星システム(GNSS)
5.5.1 2024〜2034年の地域別市場規模(US$ Billion)
5.5.2 地域別市場シェア、2024年・2034年(%)
5.6 慣性航法システム(INS)
5.6.1 2024〜2034年の地域別市場規模(US$ Billion)
5.6.2 地域別市場シェア、2024年・2034年(%)
6 商用アビオニクス市場分析:偵察システム別
6.1 主要調査結果
6.2 監視システムセグメント 市場魅力度指数
6.3 偵察システム別の商用アビオニクス市場規模の推定と予測
6.4 レーダーシステム
6.4.1 2024〜2034年の地域別市場規模(US$ Billion)
6.4.2 地域別市場シェア、2024年・2034年(%)
6.5 衝突回避システム(TCAS)
6.5.1 2024〜2034年の地域別市場規模(US$ Billion)
6.5.2 地域別市場シェア、2024年・2034年(%)
6.6 自動従属監視放送(ADS-B)
6.6.1 2024~2034年地域別市場規模(US$ Billion)
6.6.2 地域別市場シェア、2024年・2034年(%)
6.7 その他の監視システム
6.7.1 2024〜2034年の地域別市場規模(US$ Billion)
6.7.2 地域別市場シェア、2024年・2034年(%)
7 商用アビオニクス市場分析:航空機タイプ別
7.1 主要な調査結果
7.2 航空機タイプ別セグメント 市場魅力度指数
7.3 航空機タイプ別商用アビオニクス市場規模の推定と予測
7.4 ナローボディ
7.4.1 2024〜2034年の地域別市場規模(US$ Billion)
7.4.2 地域別市場シェア、2024年・2034年(%)
7.5 ワイドボディ
7.5.1 2024〜2034年の地域別市場規模(US$ Billion)
7.5.2 地域別市場シェア、2024年・2034年(%)
7.6 リージョナル&ビジネスジェット
7.6.1 2024〜2034年の地域別市場規模(US$ Billion)
7.6.2 地域別市場シェア、2024年・2034年(%)
7.7 貨物機
7.7.1 2024〜2034年の地域別市場規模(US$ Billion)
7.7.2 地域別市場シェア、2024年・2034年(%)
7.8 その他の航空機タイプ
7.8.1 2024〜2034年の地域別市場規模(US$ Billion)
7.8.2 地域別市場シェア、2024年・2034年(%)
8 商用アビオニクス市場分析:システムタイプ別
8.1 主要な調査結果
8.2 システムタイプ別セグメント 市場魅力度指数
8.3 システムタイプ別商用アビオニクス市場規模の推定と予測
8.4 ナビゲーションシステム
8.4.1 2024〜2034年の地域別市場規模(US$ Million)
8.4.2 地域別市場シェア、2024年・2034年(%)
8.5 監視システム
8.5.1 2024~2034年の地域別市場規模(US$ Million)
8.5.2 地域別市場シェア、2024年・2034年(%)
8.6 統合モジュラーアビオニクス(IMA)
8.6.1 2024~2034年の地域別市場規模(US$ Million)
8.6.2 地域別市場シェア、2024年・2034年(%)
8.7 通信システム
8.7.1 2024~2034年の地域別市場規模(US$ Million)
8.7.2 地域別市場シェア、2024年・2034年(%)
8.8 飛行制御・監視システム
8.8.1 2024~2034年の地域別市場規模(US$ Million)
8.8.2 地域別市場シェア、2024年・2034年(%)
8.9 その他のシステムタイプ
8.9.1 2024~2034年の地域別市場規模(US$ Million)
8.9.2 地域別市場シェア、2024年・2034年(%)
9 商用アビオニクス市場分析:地域別
9.1 主要な調査結果
9.2 地域別市場規模の推定と予測
10 北米の商用アビオニクス市場分析
10.1 主要な調査結果
10.2 北米の商用アビオニクス市場魅力度指数
10.3 北米の商用アビオニクス国別市場、2024年、2029年、2034年(US$ Billion)
10.4 北米の商用アビオニクス市場規模推定と予測
10.5 北米の商用アビオニクス市場規模推定と予測:国別
10.6 北米の商用アビオニクス市場規模推定と予測:フィット別
10.7 北米の商用アビオニクス市場規模推定と予測:航法システム別
10.8 北米の商用アビオニクス市場規模推定と予測:監視システム別
10.9 北米の商用アビオニクス市場規模推定と予測:航空機タイプ別
10.10 北米の商用アビオニクス市場規模推定と予測:システムタイプ別
10.11 アメリカの商用アビオニクス市場分析
10.12 カナダの商用アビオニクス市場分析
11 欧州の商用アビオニクス市場分析
11.1 主要な調査結果
11.2 欧州の商用アビオニクス市場魅力度指数
11.3 欧州の商用アビオニクス国別市場、2024年、2029年、2034年(US$ Billion)
11.4 欧州の商用アビオニクス市場規模推定と予測
11.5 欧州の商用アビオニクス市場規模推定と予測:国別
11.6 欧州の商用アビオニクス市場規模推定と予測:フィット別
11.7 欧州の商用アビオニクス市場規模推定と予測:航法システム別
11.8 欧州の商用アビオニクス市場規模推定と予測:監視システム別
11.9 欧州の商用アビオニクス市場規模推定と予測:航空機タイプ別
11.10 欧州の商用アビオニクス市場規模推定と予測:システムタイプ別
11.11 ドイツの商用アビオニクス市場分析
11.12 イギリスの商用アビオニクス市場分析
11.13 フランスの商用アビオニクス市場分析
11.14 イタリアの商用アビオニクス市場の分析
11.15 スペインの商用アビオニクス市場の分析
11.16 その他の欧州の商用アビオニクス市場の分析
12 アジア太平洋地域の商用アビオニクス市場分析
12.1 主要な調査結果
12.2 アジア太平洋地域の商用アビオニクス市場魅力度指数
12.3 アジア太平洋地域の商用アビオニクス国別市場、2024年、2029年、2034年(US$ Billion)
12.4 アジア太平洋地域の商用アビオニクス市場規模の推定と予測
12.5 アジア太平洋地域の商用アビオニクス市場規模推定と予測:国別
12.6 アジア太平洋地域の商用アビオニクス市場規模推定と予測:フィット別
12.7 アジア太平洋地域の商用アビオニクス市場規模推定と予測:航法システム別
12.8 アジア太平洋地域の商用アビオニクス市場規模推定と予測:監視システム別
12.9 アジア太平洋地域の商用アビオニクス市場規模推定と予測:航空機タイプ別
12.10 アジア太平洋地域の商用アビオニクス市場規模推定と予測:システムタイプ別
12.11 中国の商用アビオニクス市場分析
12.12 インドの商用アビオニクス市場分析
12.13 日本の商用アビオニクス市場分析
12.14 韓国の商用アビオニクス市場分析
12.15 オーストラリアの商用アビオニクス市場分析
12.16 その他のアジア太平洋地域の商用アビオニクス市場分析
13 中東とアフリカの商用アビオニクス市場分析
13.1 主要な調査結果
13.2 中東・アフリカの商用アビオニクス市場魅力度指数
13.3 中東・アフリカの商用アビオニクス国別市場:2024年、2029年、2034年(US$ Billion)
13.4 中東・アフリカの商用アビオニクス市場規模推定と予測
13.5 中東・アフリカの商用アビオニクス市場規模推定と予測:国別
13.6 中東・アフリカの商用アビオニクス市場規模推定と予測:フィット別
13.7 中東・アフリカの商用アビオニクス市場規模推定と予測:航法システム別
13.8 中東・アフリカの商用アビオニクス市場規模推定と予測:監視システム別
13.9 中東・アフリカの商用アビオニクス市場規模推定と予測:航空機タイプ別
13.10 中東・アフリカの商用アビオニクス市場規模推定と予測:システムタイプ別
13.11 GCCの商用アビオニクス市場分析
13.12 南アフリカの商用アビオニクス市場分析
13.13 その他の中東・アフリカ地域の商用アビオニクス市場の分析
14 ラテンアメリカの商用アビオニクス市場分析
14.1 主要な調査結果
14.2 ラテンアメリカの商用アビオニクス市場魅力度指数
14.3 ラテンアメリカの商用アビオニクス国別市場、2024年、2029年、2034年 (US$ Billion)
14.4 ラテンアメリカの商用アビオニクス市場規模推定と予測
14.5 ラテンアメリカの商用アビオニクス市場規模推定と予測:国別
14.6 ラテンアメリカの商用アビオニクス市場規模推定と予測:フィット別
14.7 ラテンアメリカの商用アビオニクス市場規模推定と予測:航法システム別
14.8 ラテンアメリカの商用アビオニクス市場規模推定と予測:監視システム別
14.9 ラテンアメリカの商用アビオニクス市場規模推定と予測:航空機タイプ別
14.10 ラテンアメリカの商用アビオニクス市場規模推定と予測:システムタイプ別
14.11 ブラジルの商用アビオニクス市場分析
14.12 メキシコの商用アビオニクス市場分析
14.13 その他のラテンアメリカの商用アビオニクス市場分析
15 会社概要
15.1 競争環境、2022年
15.2 戦略的展望
15.3 Honeywell International Inc
15.3.1 会社概要
15.3.2 会社概要
15.3.3 財務分析
15.3.3.1 純収入、2018-2022年
15.3.3.2 R&D、2018-2022年
15.3.3.3 地域別収益シェア、2022年(%)
15.3.3.4 事業セグメント収益シェア、2022年(%)
15.3.4 製品ベンチマーク
15.3.5 戦略的展望
15.4 General Electric Company
15.4.1 会社概要
15.4.2 会社概要
15.4.3 財務分析
15.4.3.1 純収入、2018-2022年
15.4.3.2 R&D、2018年~2022年
15.4.3.3 事業セグメント収益シェア、2022年(%)
15.4.4 製品ベンチマーク
15.4.5 戦略的展望
15.5 Thales Group
15.5.1 会社概要
15.5.2 会社概要
15.5.3 財務分析
15.5.3.1 純収入、2018-2022年
15.5.4 製品ベンチマーク
15.5.5 戦略的展望
15.6 BAE Systems PLC
15.6.1 会社概要
15.6.2 会社概要
15.6.3 財務分析
15.6.3.1 純収入、2018-2022年
15.6.3.2 R&D、2018年〜2022年
15.6.3.3 地域別収益シェア、2022年(%)
15.6.3.4 事業セグメント収益シェア、2022年(%)
15.6.4 製品ベンチマーク
15.6.5 戦略的展望
15.7 L3Harris Technologies, Inc.
15.7.1 会社概要
15.7.2 会社概要
15.7.3 財務分析
15.7.3.1 純収入、2018-2022年
15.7.3.2 R&D、2018-2022年
15.7.3.3 地域別収益シェア、2022年(%)
15.7.3.4 事業セグメント収益シェア、2022年(%)
15.7.4 製品ベンチマーク
15.7.5 戦略的展望
15.8 Raytheon Technologies Corporation
15.8.1 会社概要
15.8.2 会社概要
15.8.3 財務分析
15.8.3.1 純収入、2018-2022年
15.8.3.2 R&D、2018年~2022年
15.8.3.3 地域別収益シェア、2022年(%)
15.8.3.4 事業セグメント収益シェア、2022年(%)
15.8.4 製品ベンチマーク
15.8.5 戦略的展望
15.9 Cobham Limited
15.9.1 会社概要
15.9.2 会社概要
15.9.3 製品ベンチマーク
15.9.4 戦略的展望
15.10 TransDigm Group
15.10.1 会社概要
15.10.2 会社概要
15.10.3 財務分析
15.10.3.1 純収入、2018-2022年
15.10.3.2 R&D、2018年~2022年
15.10.3.3 地域別収益シェア、2022年(%)
15.10.3.4 事業セグメント収益シェア、2022年(%)
15.10.4 製品ベンチマーク
15.10.5 戦略的展望
15.11 Diehl Stiftung & Co.KG
15.11.1 会社概要
15.11.2 会社概要
15.11.3 製品ベンチマーク
15.11.4 戦略的展望
15.12 Parker Meggitt
15.12.1 会社概要
15.12.2 会社概要
15.12.3 財務分析
15.12.3.1 純収入、2018-2022年
15.12.4 製品ベンチマーク
15.12.5 戦略的展望
15.13 Teledyne Technologies Incorporated
15.13.1 会社概要
15.13.2 会社概要
15.13.3 財務分析
15.13.3.1 純売上高、2018年~2022年
15.13.3.2 事業セグメント収益シェア、2022年(%)
15.13.4 製品ベンチマーク
15.13.5 戦略的展望
15.14 Safran S.A.
15.14.1 会社概要
15.14.2 会社概要
15.14.3 財務分析
15.14.3.1 純収入、2018-2022年
15.14.3.2 R&D、2018年〜2022年
15.14.3.3 事業セグメント収益シェア、2022年(%)
15.14.4 製品ベンチマーク
15.14.5 戦略的展望
15.15 Curtiss-Wright Corporation
15.15.1 会社概要
15.15.2 会社概要
15.15.3 財務分析
15.15.3.1 純収入、2018-2022年
15.15.3.2 R&D、2018年~2022年
15.15.3.3 事業セグメント収益シェア、2022年(%)
15.15.4 製品ベンチマーク
15.15.5 戦略的展望
15.16 Astronautics Corporation of America
15.16.1 会社概要
15.16.2 会社概要
15.16.3 製品ベンチマーク
15.16.4 戦略的展望
15.17 Garmin Ltd.
15.17.1 会社概要
15.17.2 会社概要
15.17.3 財務分析
15.17.3.1 純収入、2018-2022年
15.17.3.2 R&D、2018年〜2022年
15.17.3.3 地域別売上シェア、2022年(%)
15.17.3.4 事業セグメント収益シェア、2022年(%)
15.17.4 製品ベンチマーク
15.17.5 戦略的展望
16 結論と提言
16.1 Visiongainからの結びの言葉
16.2 市場プレイヤーへの提言
ページTOPに戻る
図表リスト
表の一覧
Table 1 Commercial Avionics Market Snapshot, 2024 & 2034 (US$ Billion, CAGR %)
Table 2 IATA 2022 Airline Safety Performance
Table 3 Global Commercial Avionics Market by Region, 2024-2034 (US$ Bn, AGR (%), CAGR (%)) (V-Shaped Recovery Scenario)
Table 4 Global Commercial Avionics Market by Region, 2024-2034 (US$ Bn, AGR (%), CAGR (%)) (U-Shaped Recovery Scenario)
Table 5 Global Commercial Avionics Market by Region, 2024-2034 (US$ Bn, AGR (%), CAGR (%)) (W-Shaped Recovery Scenario)
Table 6 Global Commercial Avionics Market by Region, 2024-2034 (US$ Bn, AGR (%), CAGR (%)) (L-Shaped Recovery Scenario)
Table 7 Global Commercial Avionics Market by Fit, 2024-2034 (US$ Bn, AGR (%), CAGR (%))
Table 8 Retrofit Market by Region, 2024-2034 (US$ Bn, AGR (%), CAGR (%))
Table 9 Forward Fit Market by Region, 2024-2034 (US$ Bn, AGR (%), CAGR (%))
Table 10 Global Commercial Avionics Market by Navigation Systems, 2024-2034 (US$ Bn, AGR (%), CAGR (%))
Table 11 Flight Management Systems (FMS) Market by Region, 2024-2034 (US$ Bn, AGR (%), CAGR (%))
Table 12 Global Navigation Satellite Systems (GNSS) Market by Region, 2024-2034 (US$ Bn, AGR (%), CAGR (%))
Table 13 Inertial Navigation Systems (INS) Market by Region, 2024-2034 (US$ Bn, AGR (%), CAGR (%))
Table 14 Global Commercial Avionics Market by Surveillance Systems, 2024-2034 (US$ Bn, AGR (%), CAGR (%))
Table 15 Radar Systems Market by Region, 2024-2034 (US$ Bn, AGR (%), CAGR (%))
Table 16 Traffic Collision Avoidance Systems (TCAS) Market by Region, 2024-2034 (US$ Bn, AGR (%), CAGR (%))
Table 17 Automatic Dependent Surveillance–Broadcast (ADS-B) Market by Region, 2024-2034 (US$ Bn, AGR (%), CAGR (%))
Table 18 Other Surveillance Systems Market by Region, 2024-2034 (US$ Bn, AGR (%), CAGR (%))
Table 19 Global Commercial Avionics Market by Aircraft Type, 2024-2034 (US$ Bn, AGR (%), CAGR (%))
Table 20 Narrow Body Market by Region, 2024-2034 (US$ Bn, AGR (%), CAGR (%))
Table 21 Wide Body Market by Region, 2024-2034 (US$ Bn, AGR (%), CAGR (%))
Table 22 Regional & Business Jet Market by Region, 2024-2034 (US$ Bn, AGR (%), CAGR (%))
Table 23 Freighter Market by Region, 2024-2034 (US$ Bn, AGR (%), CAGR (%))
Table 24 Other Aircraft Type Market by Region, 2024-2034 (US$ Bn, AGR (%), CAGR (%))
Table 25 Global Commercial Avionics Market by System Type, 2024-2034 (US$ Bn, AGR (%), CAGR (%))
Table 26 Navigation Systems Market by Region, 2024-2034 (US$ Bn, AGR (%), CAGR (%))
Table 27 Surveillance Systems Market by Region, 2024-2034 (US$ Bn, AGR (%), CAGR (%))
Table 28 Integrated Modular Avionics (IMA) Market by Region, 2024-2034 (US$ Bn, AGR (%), CAGR (%))
Table 29 Communication Systems Market by Region, 2024-2034 (US$ Bn, AGR (%), CAGR (%))
Table 30 Flight Control and Monitoring Systems Market by Region, 2024-2034 (US$ Bn, AGR (%), CAGR (%))
Table 31 Other System Type Market by Region, 2024-2034 (US$ Bn, AGR (%), CAGR (%))
Table 32 Commercial Avionics Market Forecast by Region, 2024-2034 (US$ Billion, AGR%, CAGR%)
Table 33 North America Commercial Avionics Market by Value, 2024-2034 (US$ Bn, AGR (%), CAGR (%))
Table 34 North America Commercial Avionics Market by Country, 2024-2034 (US$ Bn, AGR (%), CAGR (%))
Table 35 North America Commercial Avionics Market by Fit, 2024-2034 (US$ Bn, AGR (%), CAGR (%))
Table 36 North America Commercial Avionics Market by Navigation Systems, 2024-2034 (US$ Bn, AGR (%), CAGR (%))
Table 37 North America Commercial Avionics Market by Surveillance Systems, 2024-2034 (US$ Bn, AGR (%), CAGR (%))
Table 38 North America Commercial Avionics Market by Aircraft Type, 2024-2034 (US$ Bn, AGR (%), CAGR (%))
Table 39 North America Commercial Avionics Market by System Type, 2024-2034 (US$ Bn, AGR (%), CAGR (%))
Table 40 US Commercial Avionics Market by Value, 2024-2034 (US$ Bn, AGR (%), CAGR (%))
Table 41 Canada Commercial Avionics Market by Value, 2024-2034 (US$ Bn, AGR (%), CAGR (%))
Table 42 Europe Commercial Avionics Market by Value, 2024-2034 (US$ Bn, AGR (%), CAGR (%))
Table 43 Europe Commercial Avionics Market by Country, 2024-2034 (US$ Bn, AGR (%), CAGR (%))
Table 44 Europe Commercial Avionics Market by Fit, 2024-2034 (US$ Bn, AGR (%), CAGR (%))
Table 45 Europe Commercial Avionics Market by Navigation Systems, 2024-2034 (US$ Bn, AGR (%), CAGR (%))
Table 46 Europe Commercial Avionics Market by Surveillance Systems, 2024-2034 (US$ Bn, AGR (%), CAGR (%))
Table 47 Europe Commercial Avionics Market by Aircraft Type, 2024-2034 (US$ Bn, AGR (%), CAGR (%))
Table 48 Europe Commercial Avionics Market by System Type, 2024-2034 (US$ Bn, AGR (%), CAGR (%))
Table 49 Germany Commercial Avionics Market by Value, 2024-2034 (US$ Bn, AGR (%), CAGR (%))
Table 50 UK Commercial Avionics Market by Value, 2024-2034 (US$ Bn, AGR (%), CAGR (%))
Table 51 France Commercial Avionics Market by Value, 2024-2034 (US$ Bn, AGR (%), CAGR (%))
Table 52 Italy Commercial Avionics Market by Value, 2024-2034 (US$ Bn, AGR (%), CAGR (%))
Table 53 Spain Commercial Avionics Market by Value, 2024-2034 (US$ Bn, AGR (%), CAGR (%))
Table 54 Rest of Europe Commercial Avionics Market by Value, 2024-2034 (US$ Bn, AGR (%), CAGR (%))
Table 55 Asia-Pacific Commercial Avionics Market by Value, 2024-2034 (US$ Bn, AGR (%), CAGR (%))
Table 56 Asia-Pacific Commercial Avionics Market by Country, 2024-2034 (US$ Bn, AGR (%), CAGR (%))
Table 57 Asia-Pacific Commercial Avionics Market by Fit, 2024-2034 (US$ Bn, AGR (%), CAGR (%))
Table 58 Asia-Pacific Commercial Avionics Market by Navigation Systems, 2024-2034 (US$ Bn, AGR (%), CAGR (%))
Table 59 Asia-Pacific Commercial Avionics Market by Surveillance Systems, 2024-2034 (US$ Bn, AGR (%), CAGR (%))
Table 60 Asia-Pacific Commercial Avionics Market by Aircraft Type, 2024-2034 (US$ Bn, AGR (%), CAGR (%))
Table 61 Asia-Pacific Commercial Avionics Market by System Type, 2024-2034 (US$ Bn, AGR (%), CAGR (%))
Table 62 China Commercial Avionics Market by Value, 2024-2034 (US$ Bn, AGR (%), CAGR (%))
Table 63 India Commercial Avionics Market by Value, 2024-2034 (US$ Bn, AGR (%), CAGR (%))
Table 64 Japan Commercial Avionics Market by Value, 2024-2034 (US$ Bn, AGR (%), CAGR (%))
Table 65 South Korea Commercial Avionics Market by Value, 2024-2034 (US$ Bn, AGR (%), CAGR (%))
Table 66 Australia Commercial Avionics Market by Value, 2024-2034 (US$ Bn, AGR (%), CAGR (%))
Table 67 Rest of Asia-Pacific Commercial Avionics Market by Value, 2024-2034 (US$ Bn, AGR (%), CAGR (%))
Table 68 Middle East & Africa Commercial Avionics Market by Value, 2024-2034 (US$ Bn, AGR (%), CAGR (%))
Table 69 Middle East & Africa Commercial Avionics Market by Country, 2024-2034 (US$ Bn, AGR (%), CAGR (%))
Table 70 Middle East & Africa Commercial Avionics Market by Fit, 2024-2034 (US$ Bn, AGR (%), CAGR (%))
Table 71 Middle East & Africa Commercial Avionics Market by Navigation Systems, 2024-2034 (US$ Bn, AGR (%), CAGR (%))
Table 72 Middle East & Africa Commercial Avionics Market by Surveillance Systems, 2024-2034 (US$ Bn, AGR (%), CAGR (%))
Table 73 Middle East & Africa Commercial Avionics Market by Aircraft Type, 2024-2034 (US$ Bn, AGR (%), CAGR (%))
Table 74 Middle East & Africa Commercial Avionics Market by System Type, 2024-2034 (US$ Bn, AGR (%), CAGR (%))
Table 75 GCC Commercial Avionics Market by Value, 2024-2034 (US$ Bn, AGR (%), CAGR (%))
Table 76 South Africa Commercial Avionics Market by Value, 2024-2034 (US$ Bn, AGR (%), CAGR (%))
Table 77 Rest of Middle East & Africa Commercial Avionics Market by Value, 2024-2034 (US$ Bn, AGR (%), CAGR (%))
Table 78 Latin America Commercial Avionics Market by Value, 2024-2034 (US$ Bn, AGR (%), CAGR (%))
Table 79 Latin America Commercial Avionics Market by Country, 2024-2034 (US$ Bn, AGR (%), CAGR (%))
Table 80 Latin America Commercial Avionics Market by Fit, 2024-2034 (US$ Bn, AGR (%), CAGR (%))
Table 81 Latin America Commercial Avionics Market by Navigation Systems, 2024-2034 (US$ Bn, AGR (%), CAGR (%))
Table 82 Latin America Commercial Avionics Market by Surveillance Systems, 2024-2034 (US$ Bn, AGR (%), CAGR (%))
Table 83 Latin America Commercial Avionics Market by Aircraft Type, 2024-2034 (US$ Bn, AGR (%), CAGR (%))
Table 84 Latin America Commercial Avionics Market by System Type, 2024-2034 (US$ Bn, AGR (%), CAGR (%))
Table 85 Brazil Commercial Avionics Market by Value, 2024-2034 (US$ Bn, AGR (%), CAGR (%))
Table 86 Mexico Commercial Avionics Market by Value, 2024-2034 (US$ Bn, AGR (%), CAGR (%))
Table 87 Rest of Latin America Commercial Avionics Market by Value, 2024-2034 (US$ Bn, AGR (%), CAGR (%))
Table 88 Strategic Outlook - Contract
Table 89 Honeywell International Inc: Key Details, (CEO, HQ, Revenue, Founded, No. of Employees, Company Type, Website, Business Segment)
Table 90 Honeywell International Inc: Product Benchmarking
Table 91 Honeywell International Inc: Strategic Outlook
Table 92 General Electric Company: Key Details, (CEO, HQ, Revenue, Founded, No. of Employees, Company Type, Website, Business Segment)
Table 93 General Electric Company: Product Benchmarking
Table 94 General Electric Company: Strategic Outlook
Table 95 Thales Group: Key Details, (CEO, HQ, Revenue, Founded, No. of Employees, Company Type, Website, Business Segment)
Table 96 Thales Group: Product Benchmarking
Table 97 Thales Group: Strategic Outlook
Table 98 BAE Systems PLC: Key Details, (CEO, HQ, Revenue, Founded, No. of Employees, Company Type, Website, Business Segment)
Table 99 BAE Systems PLC: Product Benchmarking
Table 100 BAE Systems PLC: Strategic Outlook
Table 101 L3Harris Technologies, Inc: Key Details, (CEO, HQ, Revenue, Founded, No. of Employees, Company Type, Website, Business Segment)
Table 102 L3Harris Technologies, Inc: Product Benchmarking
Table 103 L3Harris Technologies, Inc: Strategic Outlook
Table 104 Raytheon Technologies Corporation: Key Details, (CEO, HQ, Revenue, Founded, No. of Employees, Company Type, Website, Business Segment)
Table 105 Raytheon Technologies Corporation: Product Benchmarking
Table 106 Raytheon Technologies Corporation: Strategic Outlook
Table 107 Cobham Limited: Key Details, (CEO, HQ, Revenue, Founded, No. of Employees, Company Type, Website, Business Segment)
Table 108 Cobham Limited: Product Benchmarking
Table 109 TransDigm Group: Key Details, (CEO, HQ, Revenue, Founded, No. of Employees, Company Type, Website, Business Segment)
Table 110 TransDigm Group: Product Benchmarking
Table 111 TransDigm Group: Strategic Outlook
Table 112 Diehl Stiftung & Co. KG: Key Details, (CEO, HQ, Revenue, Founded, No. of Employees, Company Type, Website, Business Segment)
Table 113 Diehl Stiftung & Co. KG: Product Benchmarking
Table 114 Diehl Stiftung & Co. KG: Strategic Outlook
Table 115 Parker Meggitt: Key Details, (CEO, HQ, Revenue, Founded, No. of Employees, Company Type, Website, Business Segment)
Table 116 Parker Meggitt: Product Benchmarking
Table 117 Parker Meggitt: Strategic Outlook
Table 118 Teledyne Technologies Incorporated: Key Details, (CEO, HQ, Revenue, Founded, No. of Employees, Company Type, Website, Business Segment)
Table 119 Teledyne Technologies Incorporated: Product Benchmarking
Table 120 Teledyne Technologies Incorporated: Strategic Outlook
Table 121 Safran S.A: Key Details, (CEO, HQ, Revenue, Founded, No. of Employees, Company Type, Website, Business Segment)
Table 122 Safran S.A.: Product Benchmarking
Table 123 Safran S.A.: Strategic Outlook
Table 124 Curtiss-Wright Corporation: Key Details, (CEO, HQ, Revenue, Founded, No. of Employees, Company Type, Website, Business Segment)
Table 125 Curtiss-Wright Corporation: Product Benchmarking
Table 126 Curtiss-Wright Corporation: Strategic Outlook
Table 127 Astronautics Corporation of America: Key Details, (CEO, HQ, Revenue, Founded, No. of Employees, Company Type, Website, Business Segment)
Table 128 Astronautics Corporation of America: Product Benchmarking
Table 129 Astronautics Corporation of America: Strategic Outlook
Table 130 Garmin Ltd.: Key Details, (CEO, HQ, Revenue, Founded, No. of Employees, Company Type, Website, Business Segment)
Table 131 Garmin Ltd.: Product Benchmarking
Table 132 Garmin Ltd.: Strategic Outlook
図の一覧
Figure 1 Commercial Avionics Market Segmentation
Figure 2 Commercial Avionics Market by Fit: Market Attractiveness Index
Figure 3 Commercial Avionics Market by Navigation Systems: Market Attractiveness Index
Figure 4 Commercial Avionics Market by Surveillance Systems: Market Attractiveness Index
Figure 5 Commercial Avionics Market by Aircraft Type: Market Attractiveness Index
Figure 6 Commercial Avionics Market by System Type: Market Attractiveness Index
Figure 7 Commercial Avionics Market Attractiveness Index by Region
Figure 8 Commercial Avionics Market: Market Dynamics
Figure 9 Annual Growth in Global Air Traffic Passenger Demand
Figure 10 Annual Growth in Global Air Traffic Passenger Demand
Figure 11 Commercial Avionics Market: Porter’s Five Forces Analysis
Figure 12 Global Commercial Avionics Market Share Forecast by COVID, 2024-2034 (%)
Figure 13 Global Commercial Avionics Market by Region, 2024-2034 (US$ Bn, AGR (%)) (V-Shaped Recovery Scenario)
Figure 14 Global Commercial Avionics Market by Region, 2024-2034 (US$ Bn, AGR (%)) (U-Shaped Recovery Scenario)
Figure 15 Global Commercial Avionics Market by Region, 2024-2034 (US$ Bn, AGR (%)) (W-Shaped Recovery Scenario)
Figure 16 Global Commercial Avionics Market by Region, 2024-2034 (US$ Bn, AGR (%)) (L-Shaped Recovery Scenario)
Figure 17 Commercial Avionics Market: PEST Analysis
Figure 18 Commercial Avionics Market by Fit: Market Attractiveness Index
Figure 19 Global Commercial Avionics Market by Fit, 2024-2034 (US$ Bn, AGR (%))
Figure 20 Commercial Avionics Market Share Forecast by Fit, 2024, 2029, 2034 (%)
Figure 21 Retrofit Market by Region, 2024-2034 (US$ Bn, AGR (%))
Figure 22 Retrofit Market Share Forecast by Region, 2024 & 2034 (%)
Figure 23 Forward Fit Market by Region, 2024-2034 (US$ Bn, AGR (%))
Figure 24 Forward Fit Market Share Forecast by Region, 2024 & 2034 (%)
Figure 25 Commercial Avionics Market by Navigation Systems: Market Attractiveness Index
Figure 26 Global Commercial Avionics Market by Navigation Systems, 2024-2034 (US$ Bn, AGR (%))
Figure 27 Commercial Avionics Market Share Forecast by Navigation Systems, 2024, 2029, 2034 (%)
Figure 28 Flight Management Systems (FMS) Market by Region, 2024-2034 (US$ Bn, AGR (%))
Figure 29 Flight Management Systems (FMS) Market Share Forecast by Region, 2024 & 2034 (%)
Figure 30 Global Navigation Satellite Systems (GNSS) Market by Region, 2024-2034 (US$ Bn, AGR (%))
Figure 31 Global Navigation Satellite Systems (GNSS) Market Share Forecast by Region, 2024 & 2034 (%)
Figure 32 Inertial Navigation Systems (INS) Market by Region, 2024-2034 (US$ Bn, AGR (%))
Figure 33 Inertial Navigation Systems (INS) Market Share Forecast by Region, 2024 & 2034 (%)
Figure 34 Commercial Avionics Market by Surveillance Systems: Market Attractiveness Index
Figure 35 Global Commercial Avionics Market by Surveillance Systems, 2024-2034 (US$ Bn, AGR (%))
Figure 36 Commercial Avionics Market Share Forecast by Surveillance Systems, 2024, 2029, 2034 (%)
Figure 37 Radar Systems Market by Region, 2024-2034 (US$ Bn, AGR (%))
Figure 38 Radar Systems Market Share Forecast by Region, 2024 & 2034 (%)
Figure 39 Traffic Collision Avoidance Systems (TCAS) Market by Region, 2024-2034 (US$ Bn, AGR (%))
Figure 40 Traffic Collision Avoidance Systems (TCAS) Market Share Forecast by Region, 2024 & 2034 (%)
Figure 41 Automatic Dependent Surveillance–Broadcast (ADS-B) Market by Region, 2024-2034 (US$ Bn, AGR (%))
Figure 42 Automatic Dependent Surveillance–Broadcast (ADS-B) Market Share Forecast by Region, 2024 & 2034 (%)
Figure 43 Other Surveillance Systems Market by Region, 2024-2034 (US$ Bn, AGR (%))
Figure 44 Other Surveillance Systems Market Share Forecast by Region, 2024 & 2034 (%)
Figure 45 Commercial Avionics Market by Aircraft Type: Market Attractiveness Index
Figure 46 Global Commercial Avionics Market by Aircraft Type, 2024-2034 (US$ Bn, AGR (%))
Figure 47 Commercial Avionics Market Share Forecast by Aircraft Type, 2024, 2029, 2034 (%)
Figure 48 Narrow Body Market by Region, 2024-2034 (US$ Bn, AGR (%))
Figure 49 Narrow Body Market Share Forecast by Region, 2024 & 2034 (%)
Figure 50 Wide Body Market by Region, 2024-2034 (US$ Bn, AGR (%))
Figure 51 Wide Body Market Share Forecast by Region, 2024 & 2034 (%)
Figure 52 Regional & Business Jet Market by Region, 2024-2034 (US$ Bn, AGR (%))
Figure 53 Regional & Business Jet Market Share Forecast by Region, 2024 & 2034 (%)
Figure 54 Freighter Market by Region, 2024-2034 (US$ Bn, AGR (%))
Figure 55 Freighter Market Share Forecast by Region, 2024 & 2034 (%)
Figure 56 Other Aircraft Type Market by Region, 2024-2034 (US$ Bn, AGR (%))
Figure 57 Other Aircraft Type Market Share Forecast by Region, 2024 & 2034 (%)
Figure 58 Commercial Avionics Market by System Type: Market Attractiveness Index
Figure 59 Global Commercial Avionics Market by System Type, 2024-2034 (US$ Bn, AGR (%))
Figure 60 Commercial Avionics Market Share Forecast by System Type, 2024, 2029, 2034 (%)
Figure 61 Navigation Systems Market by Region, 2024-2034 (US$ Bn, AGR (%))
Figure 62 Navigation Systems Market Share Forecast by Region, 2024 & 2034 (%)
Figure 63 Surveillance Systems Market by Region, 2024-2034 (US$ Bn, AGR (%))
Figure 64 Surveillance Systems Market Share Forecast by Region, 2024 & 2034 (%)
Figure 65 Integrated Modular Avionics (IMA) Market by Region, 2024-2034 (US$ Bn, AGR (%))
Figure 66 Integrated Modular Avionics (IMA) Market Share Forecast by Region, 2024 & 2034 (%)
Figure 67 Communication Systems Market by Region, 2024-2034 (US$ Bn, AGR (%))
Figure 68 Communication Systems Market Share Forecast by Region, 2024 & 2034 (%)
Figure 69 Flight Control and Monitoring Systems Market by Region, 2024-2034 (US$ Bn, AGR (%))
Figure 70 Flight Control and Monitoring Systems Market Share Forecast by Region, 2024 & 2034 (%)
Figure 71 Other System Type Market by Region, 2024-2034 (US$ Bn, AGR (%))
Figure 72 Other System Type Market Share Forecast by Region, 2024 & 2034 (%)
Figure 73 Commercial Avionics Market Forecast by Region 2024 and 2034 (Revenue, CAGR%)
Figure 74 Commercial Avionics Market Share Forecast by Region 2024, 2029, 2034 (%)
Figure 75 Commercial Avionics Market by Region, 2024-2034 (US$ Billion, AGR %)
Figure 76 North America Commercial Avionics Market Attractiveness Index
Figure 77 North America Commercial Avionics Market by Region, 2024, 2029 & 2034 (US$ Billion)
Figure 78 North America Commercial Avionics Market by Value, 2024-2034 (US$ Bn, AGR (%))
Figure 79 North America Commercial Avionics Market by Country, 2024-2034 (US$ Bn, AGR (%))
Figure 80 North America Commercial Avionics Market Share Forecast by Country, 2024 & 2034 (%)
Figure 81 North America Commercial Avionics Market by Fit, 2024-2034 (US$ Bn, AGR (%))
Figure 82 North America Commercial Avionics Market Share Forecast Fit, 2024 & 2034 (%)
Figure 83 North America Commercial Avionics Market by Navigation Systems, 2024-2034 (US$ Bn, AGR (%))
Figure 84 North America Commercial Avionics Market Share Forecast by Navigation Systems, 2024 & 2034 (%)
Figure 85 North America Commercial Avionics Market by Surveillance Systems, 2024-2034 (US$ Bn, AGR (%))
Figure 86 North America Commercial Avionics Market Share Forecast by Surveillance Systems, 2024 & 2034 (%)
Figure 87 North America Commercial Avionics Market by Aircraft Type, 2024-2034 (US$ Bn, AGR (%))
Figure 88 North America Commercial Avionics Market Share Forecast by Aircraft Type, 2024 & 2034 (%)
Figure 89 North America Commercial Avionics Market by System Type, 2024-2034 (US$ Bn, AGR (%))
Figure 90 North America Commercial Avionics Market Share Forecast by System Type, 2024 & 2034 (%)
Figure 91 US Commercial Avionics Market by Value, 2024-2034 (US$ Bn, AGR (%))
Figure 92 Canada Commercial Avionics Market by Value, 2024-2034 (US$ Bn, AGR (%))
Figure 93 Europe Commercial Avionics Market Attractiveness Index
Figure 94 Europe Commercial Avionics Market by Region, 2024, 2029 & 2034 (US$ Billion)
Figure 95 Europe Commercial Avionics Market by Value, 2024-2034 (US$ Bn, AGR (%))
Figure 96 Europe Commercial Avionics Market by Country, 2024-2034 (US$ Bn, AGR (%))
Figure 97 Europe Commercial Avionics Market Share Forecast by Country, 2024 & 2034 (%)
Figure 98 Europe Commercial Avionics Market by Fit, 2024-2034 (US$ Bn, AGR (%))
Figure 99 Europe Commercial Avionics Market Share Forecast Fit, 2024 & 2034 (%)
Figure 100 Europe Commercial Avionics Market by Navigation Systems, 2024-2034 (US$ Bn, AGR (%))
Figure 101 Europe Commercial Avionics Market Share Forecast by Navigation Systems, 2024 & 2034 (%)
Figure 102 Europe Commercial Avionics Market by Surveillance Systems, 2024-2034 (US$ Bn, AGR (%))
Figure 103 Europe Commercial Avionics Market Share Forecast by Surveillance Systems, 2024 & 2034 (%)
Figure 104 Europe Commercial Avionics Market by Aircraft Type, 2024-2034 (US$ Bn, AGR (%))
Figure 105 Europe Commercial Avionics Market Share Forecast by Aircraft Type, 2024 & 2034 (%)
Figure 106 Europe Commercial Avionics Market by System Type, 2024-2034 (US$ Bn, AGR (%))
Figure 107 Europe Commercial Avionics Market Share Forecast by System Type, 2024 & 2034 (%)
Figure 108 Germany Commercial Avionics Market by Value, 2024-2034 (US$ Bn, AGR (%))
Figure 109 UK Commercial Avionics Market by Value, 2024-2034 (US$ Bn, AGR (%))
Figure 110 France Commercial Avionics Market by Value, 2024-2034 (US$ Bn, AGR (%))
Figure 111 Italy Commercial Avionics Market by Value, 2024-2034 (US$ Bn, AGR (%))
Figure 112 Spain Commercial Avionics Market by Value, 2024-2034 (US$ Bn, AGR (%))
Figure 113 Rest of Europe Commercial Avionics Market by Value, 2024-2034 (US$ Bn, AGR (%))
Figure 114 Asia-Pacific Commercial Avionics Market Attractiveness Index
Figure 115 Asia-Pacific Commercial Avionics Market by Region, 2024, 2029 & 2034 (US$ Billion)
Figure 116 Asia-Pacific Commercial Avionics Market by Value, 2024-2034 (US$ Bn, AGR (%))
Figure 117 Asia-Pacific Commercial Avionics Market by Country, 2024-2034 (US$ Bn, AGR (%))
Figure 118 Asia-Pacific Commercial Avionics Market Share Forecast by Country, 2024 & 2034 (%)
Figure 119 Asia-Pacific Commercial Avionics Market by Fit, 2024-2034 (US$ Bn, AGR (%))
Figure 120 Asia-Pacific Commercial Avionics Market Share Forecast Fit, 2024 & 2034 (%)
Figure 121 Asia-Pacific Commercial Avionics Market by Navigation Systems, 2024-2034 (US$ Bn, AGR (%))
Figure 122 Asia-Pacific Commercial Avionics Market Share Forecast by Navigation Systems, 2024 & 2034 (%)
Figure 123 Asia-Pacific Commercial Avionics Market by Surveillance Systems, 2024-2034 (US$ Bn, AGR (%))
Figure 124 Asia-Pacific Commercial Avionics Market Share Forecast by Surveillance Systems, 2024 & 2034 (%)
Figure 125 Asia-Pacific Commercial Avionics Market by Aircraft Type, 2024-2034 (US$ Bn, AGR (%))
Figure 126 Asia-Pacific Commercial Avionics Market Share Forecast by Aircraft Type, 2024 & 2034 (%)
Figure 127 Asia-Pacific Commercial Avionics Market by System Type, 2024-2034 (US$ Bn, AGR (%))
Figure 128 Asia-Pacific Commercial Avionics Market Share Forecast by System Type, 2024 & 2034 (%)
Figure 129 China Commercial Avionics Market by Value, 2024-2034 (US$ Bn, AGR (%))
Figure 130 India Commercial Avionics Market by Value, 2024-2034 (US$ Bn, AGR (%))
Figure 131 Japan Commercial Avionics Market by Value, 2024-2034 (US$ Bn, AGR (%))
Figure 132 South Korea Commercial Avionics Market by Value, 2024-2034 (US$ Bn, AGR (%))
Figure 133 Australia Commercial Avionics Market by Value, 2024-2034 (US$ Bn, AGR (%))
Figure 134 Rest of Asia-Pacific Commercial Avionics Market by Value, 2024-2034 (US$ Bn, AGR (%))
Figure 135 Middle East and Africa Commercial Avionics Market Attractiveness Index
Figure 136 Middle East and Africa Commercial Avionics Market by Region, 2024, 2029 & 2034 (US$ Billion)
Figure 137 Middle East & Africa Commercial Avionics Market by Value, 2024-2034 (US$ Bn, AGR (%))
Figure 138 Middle East & Africa Commercial Avionics Market by Country, 2024-2034 (US$ Bn, AGR (%))
Figure 139 Middle East and Africa Commercial Avionics Market Share Forecast by Country, 2024 & 2034 (%)
Figure 140 Middle East & Africa Commercial Avionics Market by Fit, 2024-2034 (US$ Bn, AGR (%))
Figure 141 Middle East and Africa Commercial Avionics Market Share Forecast Fit, 2024 & 2034 (%)
Figure 142 Middle East & Africa Commercial Avionics Market by Navigation Systems, 2024-2034 (US$ Bn, AGR (%))
Figure 143 Middle East and Africa Commercial Avionics Market Share Forecast by Navigation Systems, 2024 & 2034 (%)
Figure 144 Middle East & Africa Commercial Avionics Market by Surveillance Systems, 2024-2034 (US$ Bn, AGR (%))
Figure 145 Middle East and Africa Commercial Avionics Market Share Forecast by Surveillance Systems, 2024 & 2034 (%)
Figure 146 Middle East & Africa Commercial Avionics Market by Aircraft Type, 2024-2034 (US$ Bn, AGR (%))
Figure 147 Middle East and Africa Commercial Avionics Market Share Forecast by Aircraft Type, 2024 & 2034 (%)
Figure 148 Middle East & Africa Commercial Avionics Market by System Type, 2024-2034 (US$ Bn, AGR (%))
Figure 149 Middle East and Africa Commercial Avionics Market Share Forecast by System Type, 2024 & 2034 (%)
Figure 150 GCC Commercial Avionics Market by Value, 2024-2034 (US$ Bn, AGR (%))
Figure 151 South Africa Commercial Avionics Market by Value, 2024-2034 (US$ Bn, AGR (%))
Figure 152 Rest of Middle East & Africa Commercial Avionics Market by Value, 2024-2034 (US$ Bn, AGR (%))
Figure 153 Latin America Commercial Avionics Market Attractiveness Index
Figure 154 Latin America Commercial Avionics Market by Region, 2024, 2029 & 2034 (US$ Billion)
Figure 155 Latin America Commercial Avionics Market by Value, 2024-2034 (US$ Bn, AGR (%))
Figure 156 Latin America Commercial Avionics Market by Country, 2024-2034 (US$ Bn, AGR (%))
Figure 157 Latin America Commercial Avionics Market Share Forecast by Country, 2024 & 2034 (%)
Figure 158 Latin America Commercial Avionics Market by Fit, 2024-2034 (US$ Bn, AGR (%))
Figure 159 Latin America Commercial Avionics Market Share Forecast Fit, 2024 & 2034 (%)
Figure 160 Latin America Commercial Avionics Market by Navigation Systems, 2024-2034 (US$ Bn, AGR (%))
Figure 161 Latin America Commercial Avionics Market Share Forecast by Navigation Systems, 2024 & 2034 (%)
Figure 162 Latin America Commercial Avionics Market by Surveillance Systems, 2024-2034 (US$ Bn, AGR (%))
Figure 163 Latin America Commercial Avionics Market Share Forecast by Surveillance Systems, 2024 & 2034 (%)
Figure 164 Latin America Commercial Avionics Market by Aircraft Type, 2024-2034 (US$ Bn, AGR (%))
Figure 165 Latin America Commercial Avionics Market Share Forecast by Aircraft Type, 2024 & 2034 (%)
Figure 166 Latin America Commercial Avionics Market by System Type, 2024-2034 (US$ Bn, AGR (%))
Figure 167 Latin America Commercial Avionics Market Share Forecast by System Type, 2024 & 2034 (%)
Figure 168 Brazil Commercial Avionics Market by Value, 2024-2034 (US$ Bn, AGR (%))
Figure 169 Mexico Commercial Avionics Market by Value, 2024-2034 (US$ Bn, AGR (%))
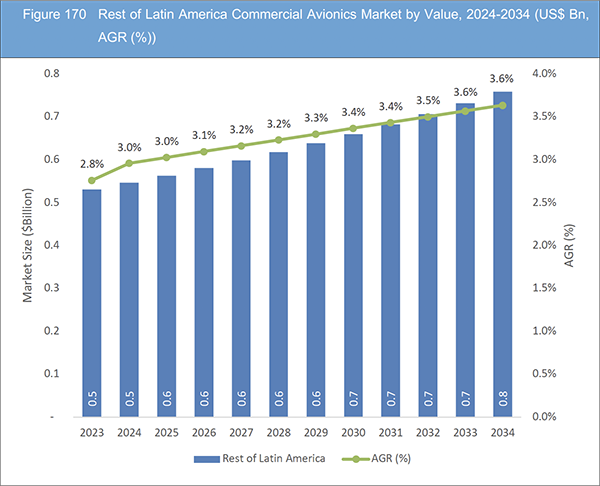
Figure 170 Rest of Latin America Commercial Avionics Market by Value, 2024-2034 (US$ Bn, AGR (%))
Figure 171 Commercial Avionics Market: Company Share, 2022
Figure 172 Honeywell International Inc.: Net Revenue, 2018-2022 (US$ Million, AGR%)
Figure 173 Honeywell International Inc.: R&D, 2018-2022 (US$ Million, AGR%)
Figure 174 Honeywell International Inc.: Regional Revenue Share, 2022 (%)
Figure 175 Honeywell International Inc.: Business Segment Revenue Share, 2022 (%)
Figure 176 General Electric Company.: Net Revenue, 2018-2022 (US$ Million, AGR%)
Figure 177 General Electric Company.: R&D, 2018-2022 (US$ Million, AGR%)
Figure 178 General Electric Company.: Business Segment Revenue Share, 2022 (%)
Figure 179 Thales Group.: Net Revenue, 2018-2022 (US$ Million, AGR%)
Figure 180 BAE Systems PLC.: Net Revenue, 2018-2022 (US$ Million, AGR%)
Figure 181 BAE Systems PLC.: R&D, 2018-2022 (US$ Million, AGR%)
Figure 182 BAE Systems PLC.: Regional Revenue Share, 2022 (%)
Figure 183 BAE Systems PLC.: Business Segment Revenue Share, 2022 (%)
Figure 184 L3Harris Technologies, Inc.: Net Revenue, 2018-2022 (US$ Million, AGR%)
Figure 185 L3Harris Technologies, Inc.: R&D, 2018-2022 (US$ Million, AGR%)
Figure 186 L3Harris Technologies, Inc.: Regional Revenue Share, 2022 (%)
Figure 187 L3Harris Technologies, Inc.: Business Segment Revenue Share, 2022 (%)
Figure 188 Raytheon Technologies Corporation.: Net Revenue, 2018-2022 (US$ Million, AGR%)
Figure 189 Raytheon Technologies Corporation.: R&D, 2018-2022 (US$ Million, AGR%)
Figure 190 Raytheon Technologies Corporation.: Regional Revenue Share, 2022 (%)
Figure 191 Raytheon Technologies Corporation.: Business Segment Revenue Share, 2022 (%)
Figure 192 TransDigm Group.: Net Revenue, 2018-2022 (US$ Million, AGR%)
Figure 193 TransDigm Group.: R&D, 2018-2022 (US$ Million, AGR%)
Figure 194 TransDigm Group.: Regional Revenue Share, 2022 (%)
Figure 195 TransDigm Group.: Business Segment Revenue Share, 2022 (%)
Figure 196 Parker Meggitt.: Net Revenue, 2018-2022 (US$ Million, AGR%)
Figure 197 Teledyne Technologies Incorporated.: Net Revenue, 2018-2022 (US$ Million, AGR%)
Figure 198 Teledyne Technologies Incorporated.: Business Segment Revenue Share, 2022 (%)
Figure 199 Safran S.A.: Net Revenue, 2018-2022 (US$ Million, AGR%)
Figure 200 Safran S.A.: R&D, 2018-2022 (US$ Million, AGR%)
Figure 201 Safran S.A.: Business Segment Revenue Share, 2022 (%)
Figure 202 Curtiss-Wright Corporation.: Net Revenue, 2018-2022 (US$ Million, AGR%)
Figure 203 Curtiss-Wright Corporation.: R&D, 2018-2022 (US$ Million, AGR%)
Figure 204 Curtiss-Wright Corporation.: Business Segment Revenue Share, 2022 (%)
Figure 205 Garmin Ltd.: Net Revenue, 2018-2022 (US$ Million, AGR%)
Figure 206 Garmin Ltd.: R&D, 2018-2022 (US$ Million, AGR%)
Figure 207 Garmin Ltd.: Regional Revenue Share, 2022 (%)
Figure 208 Garmin Ltd.: Business Segment Revenue Share, 2022 (%)
ページTOPに戻る
Summary
Report Details
The Commercial Avionics Market Report 2024-2034: This report will prove invaluable to leading firms striving for new revenue pockets if they wish to better understand the industry and its underlying dynamics. It will be useful for companies that would like to expand into different industries or to expand their existing operations in a new region.
Navigating Growth: Factors Driving the Global Commercial Avionics Market
The global commercial avionics market is on the cusp of substantial growth, propelled by a convergence of factors shaping the industry’s evolution and surging demand for advanced aviation technologies. Key drivers include the escalating complexity of contemporary aircraft, a growing demand for fuel-efficient and technologically advanced flying machines, and an increasing emphasis on safety and operational efficiency. The market is advancing with notable strides, fueled by innovations such as integrated avionics suites and next-generation cockpit technologies, ushering in enhanced functionalities, reduced pilot workload, and an overall improvement in aircraft performance.
Amidst this transformative landscape, the commercial avionics market is presented with abundant opportunities as the aviation sector embraces digital transformation. The integration of cutting-edge communication, navigation, and surveillance systems, coupled with the adoption of revolutionary technologies like artificial intelligence and machine learning, emerges as a substantial growth avenue. Furthermore, the global expansion of the commercial aviation fleet, particularly in emerging markets, offers avionics manufacturers an additional prospect to meet the escalating demand for modernized and connected aircraft. The trajectory of the commercial avionics market underscores its pivotal role in shaping the future of aviation.
The Increasing Connectivity and Digitalization of Avionics Systems Make Them Vulnerable to Cybersecurity Threats
The escalating connectivity and digitalization of avionics systems present a significant restraint for the commercial avionics market, introducing heightened vulnerability to cybersecurity threats. As modern aircraft increasingly rely on interconnected systems and advanced digital technologies, the potential for cyberattacks becomes a critical concern. Example is the integration of wireless communication, in-flight connectivity, and data-sharing capabilities within avionics systems.
In recent years, there have been instances in the aviation industry where cybersecurity vulnerabilities in connected systems have been exploited. These vulnerabilities could range from unauthorized access to critical avionics components to potential threats through interconnected networks. For instance, a hypothetical scenario might involve an unauthorized party gaining access to the communication systems of an aircraft, potentially compromising vital functions like navigation or communication with air traffic control.
What Questions Should You Ask before Buying a Market Research Report?
• How is the commercial avionics market evolving?
• What is driving and restraining the commercial avionics market?
• How will each commercial avionics submarket segment grow over the forecast period and how much revenue will these submarkets account for in 2034?
• How will the market shares for each commercial avionics submarket develop from 2024 to 2034?
• What will be the main driver for the overall market from 2024 to 2034?
• Will leading commercial avionics markets broadly follow the macroeconomic dynamics, or will individual national markets outperform others?
• How will the market shares of the national markets change by 2034 and which geographical region will lead the market in 2034?
• Who are the leading players and what are their prospects over the forecast period?
• What are the commercial avionics projects for these leading companies?
• How will the industry evolve during the period between 2024 and 2034? What are the implications of commercial avionics projects taking place now and over the next 10 years?
• Is there a greater need for product commercialisation to further scale the commercial avionics market?
• Where is the commercial avionics market heading and how can you ensure you are at the forefront of the market?
• What are the best investment options for new product and service lines?
• What are the key prospects for moving companies into a new growth path and C-suite?
You need to discover how this will impact the commercial avionics market today, and over the next 10 years:
• Our 419-page report provides 132 tables and 208 charts/graphs exclusively to you.
• The report highlights key lucrative areas in the industry so you can target them – NOW.
• It contains in-depth analysis of global, regional and national sales and growth.
• It highlights for you the key successful trends, changes and revenue projections made by your competitors.
This report tells you TODAY how the commercial avionics market will develop in the next 10 years, and in line with the variations in COVID-19 economic recession and bounce. This market is more critical now than at any point over the last 10 years.
Forecasts to 2034 and other analyses reveal commercial prospects
• In addition to revenue forecasting to 2034, our new study provides you with recent results, growth rates, and market shares.
• You will find original analyses, with business outlooks and developments.
• Discover qualitative analyses (including market dynamics, drivers, opportunities, restraints and challenges), cost structure, impact of rising commercial avionics prices and recent developments.
This report includes data analysis and invaluable insight into how COVID-19 will affect the industry and your company. Four COVID-19 recovery patterns and their impact, namely, “V”, “L”, “W” and “U” are discussed in this report.
Segments Covered in the Report
Market Segment by Fit
• Retrofit
• Forward Fit
Market Segment by Navigation Systems
• Flight Management Systems (FMS)
• Global Navigation Satellite Systems (GNSS)
• Inertial Navigation Systems (INS)
Market Segment by Surveillance Systems
• Radar Systems
• Traffic Collision Avoidance Systems (TCAS)
• Automatic Dependent Surveillance–Broadcast (ADS-B)
• Other Surveillance Systems
Market Segment by Aircraft Type
• Narrow Body
• Wide Body
• Regional & Business Jet
• Freighter
• Other Aircraft Type
Market Segment by System Type
• Navigation Systems
• Surveillance Systems
• Integrated Modular Avionics (IMA)
• Communication Systems
• Flight Control and Monitoring Systems
• Other System Type
In addition to the revenue predictions for the overall world market and segments, you will also find revenue forecasts for four regional and 20 leading national markets:
North America
• U.S.
• Canada
Europe
• Germany
• Spain
• United Kingdom
• France
• Italy
• Rest of Europe
Asia Pacific
• China
• Japan
• India
• Australia
• South Korea
• Rest of Asia Pacific
Latin America
• Brazil
• Mexico
• Rest of Latin America
Middle East & Africa
• GCC
• South Africa
• Rest of Middle East & Africa
The report also includes profiles and for some of the leading companies in the Commercial Avionics Market, 2024 to 2034, with a focus on this segment of these companies’ operations.
Leading companies profiled in the report
• Astronautics Corporation of America
• BAE Systems PLC
• Cobham Limited
• Curtiss-Wright Corporation
• Diehl Stiftung & Co. KG
• Garmin Ltd.
• General Electric Company
• Honeywell International Inc
• L3Harris Technologies, Inc.
• Parker Meggitt
• Raytheon Technologies Corporation
• Safran S.A.
• Teledyne Technologies Incorporated
• Thales Group
• TransDigm Group
Overall world revenue for Commercial Avionics Market, 2024 to 2034 in terms of value the market will surpass US$34.3 billion in 2024, our work calculates. We predict strong revenue growth through to 2034. Our work identifies which organizations hold the greatest potential. Discover their capabilities, progress, and commercial prospects, helping you stay ahead.
How will the Commercial Avionics Market, 2024 to 2034 report help you?
In summary, our 419+ page report provides you with the following knowledge:
• Revenue forecasts to 2034 for Commercial Avionics Market, 2024 to 2034 Market, with forecasts for fit, navigation systems, surveillance systems, aircraft type, and system type, each forecast at a global and regional level – discover the industry’s prospects, finding the most lucrative places for investments and revenues.
• Revenue forecasts to 2034 for four regional and 20 key national markets – See forecasts for the Commercial Avionics Market, 2024 to 2034 market in North America, Europe, Asia-Pacific, Latin America and Middle East & Africa. Also forecasted is the market in the US, Canada, Brazil, Germany, France, UK, Italy, China, India, Japan, and Australia among other prominent economies.
• Prospects for established firms and those seeking to enter the market – including company profiles for 15 of the major companies involved in the Commercial Avionics Market, 2024 to 2034.
Find quantitative and qualitative analyses with independent predictions. Receive information that only our report contains, staying informed with invaluable business intelligence.
Information found nowhere else
With our new report, you are less likely to fall behind in knowledge or miss out on opportunities. See how our work could benefit your research, analyses, and decisions. Visiongain’s study is for everybody needing commercial analyses for the Commercial Avionics Market, 2024 to 2034, market-leading companies. You will find data, trends and predictions.
ページTOPに戻る
Table of Contents
Table of Contents
1 Report Overview
1.1 Objectives of the Study
1.2 Introduction to Commercial Avionics Market
1.3 What This Report Delivers
1.4 Why You Should Read This Report
1.5 Key Questions Answered by This Analytical Report
1.6 Who Is This Report for?
1.7 Methodology
1.7.1 Market Definitions
1.7.2 Market Evaluation & Forecasting Methodology
1.7.3 Data Validation
1.7.3.1 Primary Research
1.7.3.2 Secondary Research
1.8 Frequently Asked Questions (FAQs)
1.9 Associated Visiongain Reports
1.10 About Visiongain
2 Executive Summary
3 Market Overview
3.1 Key Findings
3.2 Market Dynamics
3.2.1 Market Driving Factors
3.2.1.1 Increasing Adoption of Sophisticated Flight Management Systems by Aircraft OEMs
3.2.1.2 Growing Fleets of Commercial and Military Aircraft
3.2.1.3 Enhanced Safety and Situational Awareness Offered by Avionics
3.2.2 Market Restraining Factors
3.2.2.1 The Increasing Connectivity and Digitalization of Avionics Systems Make Them Vulnerable to Cybersecurity Threats
3.2.2.2 High Initial Investment Hinder the Market Growth
3.2.2.3 Retrofitting Advanced Avionics into Existing Aircraft Fleets Can Pose Integration Challenges
3.2.3 Market Opportunities
3.2.3.1 Fleet Modernization Programs Opportunities for the market Growth
3.2.3.2 The Continuous Evolution of Avionics Technologies, such as AI, ML, and Blockchain, Provides Opportunities for the Market
3.2.3.3 Green Aviation Technologies Opportunities for the Market Growth
3.3 Porter’s Five Forces Analysis
3.3.1 Bargaining Power of Suppliers (Medium)
3.3.2 Bargaining Power of Buyers (High)
3.3.3 Competitive Rivalry (Medium to High)
3.3.4 Threat from Substitutes (Low)
3.3.5 Threat of New Entrants (Low)
3.4 COVID-19 Impact Analysis
3.4.1 “V-Shaped Recovery”
3.4.2 “U-Shaped Recovery”
3.4.3 “W-Shaped Recovery”
3.4.4 “L-Shaped Recovery”
3.5 PEST Analysis
4 Commercial Avionics Market Analysis by Fit
4.1 Key Findings
4.2 Fit Segment: Market Attractiveness Index
4.3 Commercial Avionics Market Size Estimation and Forecast by Fit
4.4 Retrofit
4.4.1 Market Size by Region, 2024-2034 (US$ Billion)
4.4.2 Market Share by Region, 2024 & 2034 (%)
4.5 Forward Fit
4.5.1 Market Size by Region, 2024-2034 (US$ Billion)
4.5.2 Market Share by Region, 2024 & 2034 (%)
5 Commercial Avionics Market Analysis by Navigation Systems
5.1 Key Findings
5.2 Navigation Systems Segment: Market Attractiveness Index
5.3 Commercial Avionics Market Size Estimation and Forecast by Navigation Systems
5.4 Flight Management Systems (FMS)
5.4.1 Market Size by Region, 2024-2034 (US$ Billion)
5.4.2 Market Share by Region, 2024 & 2034 (%)
5.5 Global Navigation Satellite Systems (GNSS)
5.5.1 Market Size by Region, 2024-2034 (US$ Billion)
5.5.2 Market Share by Region, 2024 & 2034 (%)
5.6 Inertial Navigation Systems (INS)
5.6.1 Market Size by Region, 2024-2034 (US$ Billion)
5.6.2 Market Share by Region, 2024 & 2034 (%)
6 Commercial Avionics Market Analysis by Surveillance Systems
6.1 Key Findings
6.2 Surveillance Systems Segment: Market Attractiveness Index
6.3 Commercial Avionics Market Size Estimation and Forecast by Surveillance Systems
6.4 Radar Systems
6.4.1 Market Size by Region, 2024-2034 (US$ Billion)
6.4.2 Market Share by Region, 2024 & 2034 (%)
6.5 Traffic Collision Avoidance Systems (TCAS)
6.5.1 Market Size by Region, 2024-2034 (US$ Billion)
6.5.2 Market Share by Region, 2024 & 2034 (%)
6.6 Automatic Dependent Surveillance–Broadcast (ADS-B)
6.6.1 Market Size by Region, 2024-2034 (US$ Billion)
6.6.2 Market Share by Region, 2024 & 2034 (%)
6.7 Other Surveillance Systems
6.7.1 Market Size by Region, 2024-2034 (US$ Billion)
6.7.2 Market Share by Region, 2024 & 2034 (%)
7 Commercial Avionics Market Analysis by Aircraft Type
7.1 Key Findings
7.2 Aircraft Type Segment: Market Attractiveness Index
7.3 Commercial Avionics Market Size Estimation and Forecast by Aircraft Type
7.4 Narrow Body
7.4.1 Market Size by Region, 2024-2034 (US$ Billion)
7.4.2 Market Share by Region, 2024 & 2034 (%)
7.5 Wide Body
7.5.1 Market Size by Region, 2024-2034 (US$ Billion)
7.5.2 Market Share by Region, 2024 & 2034 (%)
7.6 Regional & Business Jet
7.6.1 Market Size by Region, 2024-2034 (US$ Billion)
7.6.2 Market Share by Region, 2024 & 2034 (%)
7.7 Freighter
7.7.1 Market Size by Region, 2024-2034 (US$ Billion)
7.7.2 Market Share by Region, 2024 & 2034 (%)
7.8 Other Aircraft Type
7.8.1 Market Size by Region, 2024-2034 (US$ Billion)
7.8.2 Market Share by Region, 2024 & 2034 (%)
8 Commercial Avionics Market Analysis by System Type
8.1 Key Findings
8.2 System Type Segment: Market Attractiveness Index
8.3 Commercial Avionics Market Size Estimation and Forecast by System Type
8.4 Navigation Systems
8.4.1 Market Size by Region, 2024-2034 (US$ Million)
8.4.2 Market Share by Region, 2024 & 2034 (%)
8.5 Surveillance Systems
8.5.1 Market Size by Region, 2024-2034 (US$ Million)
8.5.2 Market Share by Region, 2024 & 2034 (%)
8.6 Integrated Modular Avionics (IMA)
8.6.1 Market Size by Region, 2024-2034 (US$ Million)
8.6.2 Market Share by Region, 2024 & 2034 (%)
8.7 Communication Systems
8.7.1 Market Size by Region, 2024-2034 (US$ Million)
8.7.2 Market Share by Region, 2024 & 2034 (%)
8.8 Flight Control and Monitoring Systems
8.8.1 Market Size by Region, 2024-2034 (US$ Million)
8.8.2 Market Share by Region, 2024 & 2034 (%)
8.9 Other System Type
8.9.1 Market Size by Region, 2024-2034 (US$ Million)
8.9.2 Market Share by Region, 2024 & 2034 (%)
9 Commercial Avionics Market Analysis by Region
9.1 Key Findings
9.2 Regional Market Size Estimation and Forecast
10 North America Commercial Avionics Market Analysis
10.1 Key Findings
10.2 North America Commercial Avionics Market Attractiveness Index
10.3 North America Commercial Avionics Market by Country, 2024, 2029 & 2034 (US$ Billion)
10.4 North America Commercial Avionics Market Size Estimation and Forecast
10.5 North America Commercial Avionics Market Size Estimation and Forecast by Country
10.6 North America Commercial Avionics Market Size Estimation and Forecast by Fit
10.7 North America Commercial Avionics Market Size Estimation and Forecast by Navigation Systems
10.8 North America Commercial Avionics Market Size Estimation and Forecast by Surveillance Systems
10.9 North America Commercial Avionics Market Size Estimation and Forecast by Aircraft Type
10.10 North America Commercial Avionics Market Size Estimation and Forecast by System Type
10.11 U.S. Commercial Avionics Market Analysis
10.12 Canada Commercial Avionics Market Analysis
11 Europe Commercial Avionics Market Analysis
11.1 Key Findings
11.2 Europe Commercial Avionics Market Attractiveness Index
11.3 Europe Commercial Avionics Market by Country, 2024, 2029 & 2034 (US$ Billion)
11.4 Europe Commercial Avionics Market Size Estimation and Forecast
11.5 Europe Commercial Avionics Market Size Estimation and Forecast by Country
11.6 Europe Commercial Avionics Market Size Estimation and Forecast by Fit
11.7 Europe Commercial Avionics Market Size Estimation and Forecast by Navigation Systems
11.8 Europe Commercial Avionics Market Size Estimation and Forecast by Surveillance Systems
11.9 Europe Commercial Avionics Market Size Estimation and Forecast by Aircraft Type
11.10 Europe Commercial Avionics Market Size Estimation and Forecast by System Type
11.11 Germany Commercial Avionics Market Analysis
11.12 UK Commercial Avionics Market Analysis
11.13 France Commercial Avionics Market Analysis
11.14 Italy Commercial Avionics Market Analysis
11.15 Spain Commercial Avionics Market Analysis
11.16 Rest of Europe Commercial Avionics Market Analysis
12 Asia-Pacific Commercial Avionics Market Analysis
12.1 Key Findings
12.2 Asia-Pacific Commercial Avionics Market Attractiveness Index
12.3 Asia-Pacific Commercial Avionics Market by Country, 2024, 2029 & 2034 (US$ Billion)
12.4 Asia-Pacific Commercial Avionics Market Size Estimation and Forecast
12.5 Asia-Pacific Commercial Avionics Market Size Estimation and Forecast by Country
12.6 Asia-Pacific Commercial Avionics Market Size Estimation and Forecast by Fit
12.7 Asia-Pacific Commercial Avionics Market Size Estimation and Forecast by Navigation Systems
12.8 Asia-Pacific Commercial Avionics Market Size Estimation and Forecast by Surveillance Systems
12.9 Asia-Pacific Commercial Avionics Market Size Estimation and Forecast by Aircraft Type
12.10 Asia-Pacific Commercial Avionics Market Size Estimation and Forecast by System Type
12.11 China Commercial Avionics Market Analysis
12.12 India Commercial Avionics Market Analysis
12.13 Japan Commercial Avionics Market Analysis
12.14 South Korea Commercial Avionics Market Analysis
12.15 Australia Commercial Avionics Market Analysis
12.16 Rest of Asia-Pacific Commercial Avionics Market Analysis
13 Middle East and Africa Commercial Avionics Market Analysis
13.1 Key Findings
13.2 Middle East and Africa Commercial Avionics Market Attractiveness Index
13.3 Middle East and Africa Commercial Avionics Market by Country, 2024, 2029 & 2034 (US$ Billion)
13.4 Middle East and Africa Commercial Avionics Market Size Estimation and Forecast
13.5 Middle East and Africa Commercial Avionics Market Size Estimation and Forecast by Country
13.6 Middle East and Africa Commercial Avionics Market Size Estimation and Forecast by Fit
13.7 Middle East and Africa Commercial Avionics Market Size Estimation and Forecast by Navigation Systems
13.8 Middle East and Africa Commercial Avionics Market Size Estimation and Forecast by Surveillance Systems
13.9 Middle East and Africa Commercial Avionics Market Size Estimation and Forecast by Aircraft Type
13.10 Middle East and Africa Commercial Avionics Market Size Estimation and Forecast by System Type
13.11 GCC Commercial Avionics Market Analysis
13.12 South Africa Commercial Avionics Market Analysis
13.13 Rest of Middle East & Africa Commercial Avionics Market Analysis
14 Latin America Commercial Avionics Market Analysis
14.1 Key Findings
14.2 Latin America Commercial Avionics Market Attractiveness Index
14.3 Latin America Commercial Avionics Market by Country, 2024, 2029 & 2034 (US$ Billion)
14.4 Latin America Commercial Avionics Market Size Estimation and Forecast
14.5 Latin America Commercial Avionics Market Size Estimation and Forecast by Country
14.6 Latin America Commercial Avionics Market Size Estimation and Forecast by Fit
14.7 Latin America Commercial Avionics Market Size Estimation and Forecast by Navigation Systems
14.8 Latin America Commercial Avionics Market Size Estimation and Forecast by Surveillance Systems
14.9 Latin America Commercial Avionics Market Size Estimation and Forecast by Aircraft Type
14.10 Latin America Commercial Avionics Market Size Estimation and Forecast by System Type
14.11 Brazil Commercial Avionics Market Analysis
14.12 Mexico Commercial Avionics Market Analysis
14.13 Rest of Latin America Commercial Avionics Market Analysis
15 Company Profiles
15.1 Competitive Landscape, 2022
15.2 Strategic Outlook
15.3 Honeywell International Inc
15.3.1 Company Snapshot
15.3.2 Company Overview
15.3.3 Financial Analysis
15.3.3.1 Net Revenue, 2018-2022
15.3.3.2 R&D, 2018-2022
15.3.3.3 Regional Revenue Share, 2022 (%)
15.3.3.4 Business Segment Revenue Share, 2022 (%)
15.3.4 Product Benchmarking
15.3.5 Strategic Outlook
15.4 General Electric Company
15.4.1 Company Snapshot
15.4.2 Company Overview
15.4.3 Financial Analysis
15.4.3.1 Net Revenue, 2018-2022
15.4.3.2 R&D, 2018-2022
15.4.3.3 Business Segment Revenue Share, 2022 (%)
15.4.4 Product Benchmarking
15.4.5 Strategic Outlook
15.5 Thales Group
15.5.1 Company Snapshot
15.5.2 Company Overview
15.5.3 Financial Analysis
15.5.3.1 Net Revenue, 2018-2022
15.5.4 Product Benchmarking
15.5.5 Strategic Outlook
15.6 BAE Systems PLC
15.6.1 Company Snapshot
15.6.2 Company Overview
15.6.3 Financial Analysis
15.6.3.1 Net Revenue, 2018-2022
15.6.3.2 R&D, 2018-2022
15.6.3.3 Regional Revenue Share, 2022 (%)
15.6.3.4 Business Segment Revenue Share, 2022 (%)
15.6.4 Product Benchmarking
15.6.5 Strategic Outlook
15.7 L3Harris Technologies, Inc
15.7.1 Company Snapshot
15.7.2 Company Overview
15.7.3 Financial Analysis
15.7.3.1 Net Revenue, 2018-2022
15.7.3.2 R&D, 2018-2022
15.7.3.3 Regional Revenue Share, 2022 (%)
15.7.3.4 Business Segment Revenue Share, 2022 (%)
15.7.4 Product Benchmarking
15.7.5 Strategic Outlook
15.8 Raytheon Technologies Corporation
15.8.1 Company Snapshot
15.8.2 Company Overview
15.8.3 Financial Analysis
15.8.3.1 Net Revenue, 2018-2022
15.8.3.2 R&D, 2018-2022
15.8.3.3 Regional Revenue Share, 2022 (%)
15.8.3.4 Business Segment Revenue Share, 2022 (%)
15.8.4 Product Benchmarking
15.8.5 Strategic Outlook
15.9 Cobham Limited
15.9.1 Company Snapshot
15.9.2 Company Overview
15.9.3 Product Benchmarking
15.9.4 Strategic Outlook
15.10 TransDigm Group
15.10.1 Company Snapshot
15.10.2 Company Overview
15.10.3 Financial Analysis
15.10.3.1 Net Revenue, 2018-2022
15.10.3.2 R&D, 2018-2022
15.10.3.3 Regional Revenue Share, 2022 (%)
15.10.3.4 Business Segment Revenue Share, 2022 (%)
15.10.4 Product Benchmarking
15.10.5 Strategic Outlook
15.11 Diehl Stiftung & Co. KG
15.11.1 Company Snapshot
15.11.2 Company Overview
15.11.3 Product Benchmarking
15.11.4 Strategic Outlook
15.12 Parker Meggitt
15.12.1 Company Snapshot
15.12.2 Company Overview
15.12.3 Financial Analysis
15.12.3.1 Net Revenue, 2018-2022
15.12.4 Product Benchmarking
15.12.5 Strategic Outlook
15.13 Teledyne Technologies Incorporated
15.13.1 Company Snapshot
15.13.2 Company Overview
15.13.3 Financial Analysis
15.13.3.1 Net Revenue, 2018-2022
15.13.3.2 Business Segment Revenue Share, 2022 (%)
15.13.4 Product Benchmarking
15.13.5 Strategic Outlook
15.14 Safran S.A.
15.14.1 Company Snapshot
15.14.2 Company Overview
15.14.3 Financial Analysis
15.14.3.1 Net Revenue, 2018-2022
15.14.3.2 R&D, 2018-2022
15.14.3.3 Business Segment Revenue Share, 2022 (%)
15.14.4 Product Benchmarking
15.14.5 Strategic Outlook
15.15 Curtiss-Wright Corporation
15.15.1 Company Snapshot
15.15.2 Company Overview
15.15.3 Financial Analysis
15.15.3.1 Net Revenue, 2018-2022
15.15.3.2 R&D, 2018-2022
15.15.3.3 Business Segment Revenue Share, 2022 (%)
15.15.4 Product Benchmarking
15.15.5 Strategic Outlook
15.16 Astronautics Corporation of America
15.16.1 Company Snapshot
15.16.2 Company Overview
15.16.3 Product Benchmarking
15.16.4 Strategic Outlook
15.17 Garmin Ltd.
15.17.1 Company Snapshot
15.17.2 Company Overview
15.17.3 Financial Analysis
15.17.3.1 Net Revenue, 2018-2022
15.17.3.2 R&D, 2018-2022
15.17.3.3 Regional Revenue Share, 2022 (%)
15.17.3.4 Business Segment Revenue Share, 2022 (%)
15.17.4 Product Benchmarking
15.17.5 Strategic Outlook
16 Conclusion and Recommendations
16.1 Concluding Remarks from Visiongain
16.2 Recommendations for Market Players
ページTOPに戻る
List of Tables/Graphs
List of Tables
Table 1 Commercial Avionics Market Snapshot, 2024 & 2034 (US$ Billion, CAGR %)
Table 2 IATA 2022 Airline Safety Performance
Table 3 Global Commercial Avionics Market by Region, 2024-2034 (US$ Bn, AGR (%), CAGR (%)) (V-Shaped Recovery Scenario)
Table 4 Global Commercial Avionics Market by Region, 2024-2034 (US$ Bn, AGR (%), CAGR (%)) (U-Shaped Recovery Scenario)
Table 5 Global Commercial Avionics Market by Region, 2024-2034 (US$ Bn, AGR (%), CAGR (%)) (W-Shaped Recovery Scenario)
Table 6 Global Commercial Avionics Market by Region, 2024-2034 (US$ Bn, AGR (%), CAGR (%)) (L-Shaped Recovery Scenario)
Table 7 Global Commercial Avionics Market by Fit, 2024-2034 (US$ Bn, AGR (%), CAGR (%))
Table 8 Retrofit Market by Region, 2024-2034 (US$ Bn, AGR (%), CAGR (%))
Table 9 Forward Fit Market by Region, 2024-2034 (US$ Bn, AGR (%), CAGR (%))
Table 10 Global Commercial Avionics Market by Navigation Systems, 2024-2034 (US$ Bn, AGR (%), CAGR (%))
Table 11 Flight Management Systems (FMS) Market by Region, 2024-2034 (US$ Bn, AGR (%), CAGR (%))
Table 12 Global Navigation Satellite Systems (GNSS) Market by Region, 2024-2034 (US$ Bn, AGR (%), CAGR (%))
Table 13 Inertial Navigation Systems (INS) Market by Region, 2024-2034 (US$ Bn, AGR (%), CAGR (%))
Table 14 Global Commercial Avionics Market by Surveillance Systems, 2024-2034 (US$ Bn, AGR (%), CAGR (%))
Table 15 Radar Systems Market by Region, 2024-2034 (US$ Bn, AGR (%), CAGR (%))
Table 16 Traffic Collision Avoidance Systems (TCAS) Market by Region, 2024-2034 (US$ Bn, AGR (%), CAGR (%))
Table 17 Automatic Dependent Surveillance–Broadcast (ADS-B) Market by Region, 2024-2034 (US$ Bn, AGR (%), CAGR (%))
Table 18 Other Surveillance Systems Market by Region, 2024-2034 (US$ Bn, AGR (%), CAGR (%))
Table 19 Global Commercial Avionics Market by Aircraft Type, 2024-2034 (US$ Bn, AGR (%), CAGR (%))
Table 20 Narrow Body Market by Region, 2024-2034 (US$ Bn, AGR (%), CAGR (%))
Table 21 Wide Body Market by Region, 2024-2034 (US$ Bn, AGR (%), CAGR (%))
Table 22 Regional & Business Jet Market by Region, 2024-2034 (US$ Bn, AGR (%), CAGR (%))
Table 23 Freighter Market by Region, 2024-2034 (US$ Bn, AGR (%), CAGR (%))
Table 24 Other Aircraft Type Market by Region, 2024-2034 (US$ Bn, AGR (%), CAGR (%))
Table 25 Global Commercial Avionics Market by System Type, 2024-2034 (US$ Bn, AGR (%), CAGR (%))
Table 26 Navigation Systems Market by Region, 2024-2034 (US$ Bn, AGR (%), CAGR (%))
Table 27 Surveillance Systems Market by Region, 2024-2034 (US$ Bn, AGR (%), CAGR (%))
Table 28 Integrated Modular Avionics (IMA) Market by Region, 2024-2034 (US$ Bn, AGR (%), CAGR (%))
Table 29 Communication Systems Market by Region, 2024-2034 (US$ Bn, AGR (%), CAGR (%))
Table 30 Flight Control and Monitoring Systems Market by Region, 2024-2034 (US$ Bn, AGR (%), CAGR (%))
Table 31 Other System Type Market by Region, 2024-2034 (US$ Bn, AGR (%), CAGR (%))
Table 32 Commercial Avionics Market Forecast by Region, 2024-2034 (US$ Billion, AGR%, CAGR%)
Table 33 North America Commercial Avionics Market by Value, 2024-2034 (US$ Bn, AGR (%), CAGR (%))
Table 34 North America Commercial Avionics Market by Country, 2024-2034 (US$ Bn, AGR (%), CAGR (%))
Table 35 North America Commercial Avionics Market by Fit, 2024-2034 (US$ Bn, AGR (%), CAGR (%))
Table 36 North America Commercial Avionics Market by Navigation Systems, 2024-2034 (US$ Bn, AGR (%), CAGR (%))
Table 37 North America Commercial Avionics Market by Surveillance Systems, 2024-2034 (US$ Bn, AGR (%), CAGR (%))
Table 38 North America Commercial Avionics Market by Aircraft Type, 2024-2034 (US$ Bn, AGR (%), CAGR (%))
Table 39 North America Commercial Avionics Market by System Type, 2024-2034 (US$ Bn, AGR (%), CAGR (%))
Table 40 US Commercial Avionics Market by Value, 2024-2034 (US$ Bn, AGR (%), CAGR (%))
Table 41 Canada Commercial Avionics Market by Value, 2024-2034 (US$ Bn, AGR (%), CAGR (%))
Table 42 Europe Commercial Avionics Market by Value, 2024-2034 (US$ Bn, AGR (%), CAGR (%))
Table 43 Europe Commercial Avionics Market by Country, 2024-2034 (US$ Bn, AGR (%), CAGR (%))
Table 44 Europe Commercial Avionics Market by Fit, 2024-2034 (US$ Bn, AGR (%), CAGR (%))
Table 45 Europe Commercial Avionics Market by Navigation Systems, 2024-2034 (US$ Bn, AGR (%), CAGR (%))
Table 46 Europe Commercial Avionics Market by Surveillance Systems, 2024-2034 (US$ Bn, AGR (%), CAGR (%))
Table 47 Europe Commercial Avionics Market by Aircraft Type, 2024-2034 (US$ Bn, AGR (%), CAGR (%))
Table 48 Europe Commercial Avionics Market by System Type, 2024-2034 (US$ Bn, AGR (%), CAGR (%))
Table 49 Germany Commercial Avionics Market by Value, 2024-2034 (US$ Bn, AGR (%), CAGR (%))
Table 50 UK Commercial Avionics Market by Value, 2024-2034 (US$ Bn, AGR (%), CAGR (%))
Table 51 France Commercial Avionics Market by Value, 2024-2034 (US$ Bn, AGR (%), CAGR (%))
Table 52 Italy Commercial Avionics Market by Value, 2024-2034 (US$ Bn, AGR (%), CAGR (%))
Table 53 Spain Commercial Avionics Market by Value, 2024-2034 (US$ Bn, AGR (%), CAGR (%))
Table 54 Rest of Europe Commercial Avionics Market by Value, 2024-2034 (US$ Bn, AGR (%), CAGR (%))
Table 55 Asia-Pacific Commercial Avionics Market by Value, 2024-2034 (US$ Bn, AGR (%), CAGR (%))
Table 56 Asia-Pacific Commercial Avionics Market by Country, 2024-2034 (US$ Bn, AGR (%), CAGR (%))
Table 57 Asia-Pacific Commercial Avionics Market by Fit, 2024-2034 (US$ Bn, AGR (%), CAGR (%))
Table 58 Asia-Pacific Commercial Avionics Market by Navigation Systems, 2024-2034 (US$ Bn, AGR (%), CAGR (%))
Table 59 Asia-Pacific Commercial Avionics Market by Surveillance Systems, 2024-2034 (US$ Bn, AGR (%), CAGR (%))
Table 60 Asia-Pacific Commercial Avionics Market by Aircraft Type, 2024-2034 (US$ Bn, AGR (%), CAGR (%))
Table 61 Asia-Pacific Commercial Avionics Market by System Type, 2024-2034 (US$ Bn, AGR (%), CAGR (%))
Table 62 China Commercial Avionics Market by Value, 2024-2034 (US$ Bn, AGR (%), CAGR (%))
Table 63 India Commercial Avionics Market by Value, 2024-2034 (US$ Bn, AGR (%), CAGR (%))
Table 64 Japan Commercial Avionics Market by Value, 2024-2034 (US$ Bn, AGR (%), CAGR (%))
Table 65 South Korea Commercial Avionics Market by Value, 2024-2034 (US$ Bn, AGR (%), CAGR (%))
Table 66 Australia Commercial Avionics Market by Value, 2024-2034 (US$ Bn, AGR (%), CAGR (%))
Table 67 Rest of Asia-Pacific Commercial Avionics Market by Value, 2024-2034 (US$ Bn, AGR (%), CAGR (%))
Table 68 Middle East & Africa Commercial Avionics Market by Value, 2024-2034 (US$ Bn, AGR (%), CAGR (%))
Table 69 Middle East & Africa Commercial Avionics Market by Country, 2024-2034 (US$ Bn, AGR (%), CAGR (%))
Table 70 Middle East & Africa Commercial Avionics Market by Fit, 2024-2034 (US$ Bn, AGR (%), CAGR (%))
Table 71 Middle East & Africa Commercial Avionics Market by Navigation Systems, 2024-2034 (US$ Bn, AGR (%), CAGR (%))
Table 72 Middle East & Africa Commercial Avionics Market by Surveillance Systems, 2024-2034 (US$ Bn, AGR (%), CAGR (%))
Table 73 Middle East & Africa Commercial Avionics Market by Aircraft Type, 2024-2034 (US$ Bn, AGR (%), CAGR (%))
Table 74 Middle East & Africa Commercial Avionics Market by System Type, 2024-2034 (US$ Bn, AGR (%), CAGR (%))
Table 75 GCC Commercial Avionics Market by Value, 2024-2034 (US$ Bn, AGR (%), CAGR (%))
Table 76 South Africa Commercial Avionics Market by Value, 2024-2034 (US$ Bn, AGR (%), CAGR (%))
Table 77 Rest of Middle East & Africa Commercial Avionics Market by Value, 2024-2034 (US$ Bn, AGR (%), CAGR (%))
Table 78 Latin America Commercial Avionics Market by Value, 2024-2034 (US$ Bn, AGR (%), CAGR (%))
Table 79 Latin America Commercial Avionics Market by Country, 2024-2034 (US$ Bn, AGR (%), CAGR (%))
Table 80 Latin America Commercial Avionics Market by Fit, 2024-2034 (US$ Bn, AGR (%), CAGR (%))
Table 81 Latin America Commercial Avionics Market by Navigation Systems, 2024-2034 (US$ Bn, AGR (%), CAGR (%))
Table 82 Latin America Commercial Avionics Market by Surveillance Systems, 2024-2034 (US$ Bn, AGR (%), CAGR (%))
Table 83 Latin America Commercial Avionics Market by Aircraft Type, 2024-2034 (US$ Bn, AGR (%), CAGR (%))
Table 84 Latin America Commercial Avionics Market by System Type, 2024-2034 (US$ Bn, AGR (%), CAGR (%))
Table 85 Brazil Commercial Avionics Market by Value, 2024-2034 (US$ Bn, AGR (%), CAGR (%))
Table 86 Mexico Commercial Avionics Market by Value, 2024-2034 (US$ Bn, AGR (%), CAGR (%))
Table 87 Rest of Latin America Commercial Avionics Market by Value, 2024-2034 (US$ Bn, AGR (%), CAGR (%))
Table 88 Strategic Outlook - Contract
Table 89 Honeywell International Inc: Key Details, (CEO, HQ, Revenue, Founded, No. of Employees, Company Type, Website, Business Segment)
Table 90 Honeywell International Inc: Product Benchmarking
Table 91 Honeywell International Inc: Strategic Outlook
Table 92 General Electric Company: Key Details, (CEO, HQ, Revenue, Founded, No. of Employees, Company Type, Website, Business Segment)
Table 93 General Electric Company: Product Benchmarking
Table 94 General Electric Company: Strategic Outlook
Table 95 Thales Group: Key Details, (CEO, HQ, Revenue, Founded, No. of Employees, Company Type, Website, Business Segment)
Table 96 Thales Group: Product Benchmarking
Table 97 Thales Group: Strategic Outlook
Table 98 BAE Systems PLC: Key Details, (CEO, HQ, Revenue, Founded, No. of Employees, Company Type, Website, Business Segment)
Table 99 BAE Systems PLC: Product Benchmarking
Table 100 BAE Systems PLC: Strategic Outlook
Table 101 L3Harris Technologies, Inc: Key Details, (CEO, HQ, Revenue, Founded, No. of Employees, Company Type, Website, Business Segment)
Table 102 L3Harris Technologies, Inc: Product Benchmarking
Table 103 L3Harris Technologies, Inc: Strategic Outlook
Table 104 Raytheon Technologies Corporation: Key Details, (CEO, HQ, Revenue, Founded, No. of Employees, Company Type, Website, Business Segment)
Table 105 Raytheon Technologies Corporation: Product Benchmarking
Table 106 Raytheon Technologies Corporation: Strategic Outlook
Table 107 Cobham Limited: Key Details, (CEO, HQ, Revenue, Founded, No. of Employees, Company Type, Website, Business Segment)
Table 108 Cobham Limited: Product Benchmarking
Table 109 TransDigm Group: Key Details, (CEO, HQ, Revenue, Founded, No. of Employees, Company Type, Website, Business Segment)
Table 110 TransDigm Group: Product Benchmarking
Table 111 TransDigm Group: Strategic Outlook
Table 112 Diehl Stiftung & Co. KG: Key Details, (CEO, HQ, Revenue, Founded, No. of Employees, Company Type, Website, Business Segment)
Table 113 Diehl Stiftung & Co. KG: Product Benchmarking
Table 114 Diehl Stiftung & Co. KG: Strategic Outlook
Table 115 Parker Meggitt: Key Details, (CEO, HQ, Revenue, Founded, No. of Employees, Company Type, Website, Business Segment)
Table 116 Parker Meggitt: Product Benchmarking
Table 117 Parker Meggitt: Strategic Outlook
Table 118 Teledyne Technologies Incorporated: Key Details, (CEO, HQ, Revenue, Founded, No. of Employees, Company Type, Website, Business Segment)
Table 119 Teledyne Technologies Incorporated: Product Benchmarking
Table 120 Teledyne Technologies Incorporated: Strategic Outlook
Table 121 Safran S.A: Key Details, (CEO, HQ, Revenue, Founded, No. of Employees, Company Type, Website, Business Segment)
Table 122 Safran S.A.: Product Benchmarking
Table 123 Safran S.A.: Strategic Outlook
Table 124 Curtiss-Wright Corporation: Key Details, (CEO, HQ, Revenue, Founded, No. of Employees, Company Type, Website, Business Segment)
Table 125 Curtiss-Wright Corporation: Product Benchmarking
Table 126 Curtiss-Wright Corporation: Strategic Outlook
Table 127 Astronautics Corporation of America: Key Details, (CEO, HQ, Revenue, Founded, No. of Employees, Company Type, Website, Business Segment)
Table 128 Astronautics Corporation of America: Product Benchmarking
Table 129 Astronautics Corporation of America: Strategic Outlook
Table 130 Garmin Ltd.: Key Details, (CEO, HQ, Revenue, Founded, No. of Employees, Company Type, Website, Business Segment)
Table 131 Garmin Ltd.: Product Benchmarking
Table 132 Garmin Ltd.: Strategic Outlook
List of Figures
Figure 1 Commercial Avionics Market Segmentation
Figure 2 Commercial Avionics Market by Fit: Market Attractiveness Index
Figure 3 Commercial Avionics Market by Navigation Systems: Market Attractiveness Index
Figure 4 Commercial Avionics Market by Surveillance Systems: Market Attractiveness Index
Figure 5 Commercial Avionics Market by Aircraft Type: Market Attractiveness Index
Figure 6 Commercial Avionics Market by System Type: Market Attractiveness Index
Figure 7 Commercial Avionics Market Attractiveness Index by Region
Figure 8 Commercial Avionics Market: Market Dynamics
Figure 9 Annual Growth in Global Air Traffic Passenger Demand
Figure 10 Annual Growth in Global Air Traffic Passenger Demand
Figure 11 Commercial Avionics Market: Porter’s Five Forces Analysis
Figure 12 Global Commercial Avionics Market Share Forecast by COVID, 2024-2034 (%)
Figure 13 Global Commercial Avionics Market by Region, 2024-2034 (US$ Bn, AGR (%)) (V-Shaped Recovery Scenario)
Figure 14 Global Commercial Avionics Market by Region, 2024-2034 (US$ Bn, AGR (%)) (U-Shaped Recovery Scenario)
Figure 15 Global Commercial Avionics Market by Region, 2024-2034 (US$ Bn, AGR (%)) (W-Shaped Recovery Scenario)
Figure 16 Global Commercial Avionics Market by Region, 2024-2034 (US$ Bn, AGR (%)) (L-Shaped Recovery Scenario)
Figure 17 Commercial Avionics Market: PEST Analysis
Figure 18 Commercial Avionics Market by Fit: Market Attractiveness Index
Figure 19 Global Commercial Avionics Market by Fit, 2024-2034 (US$ Bn, AGR (%))
Figure 20 Commercial Avionics Market Share Forecast by Fit, 2024, 2029, 2034 (%)
Figure 21 Retrofit Market by Region, 2024-2034 (US$ Bn, AGR (%))
Figure 22 Retrofit Market Share Forecast by Region, 2024 & 2034 (%)
Figure 23 Forward Fit Market by Region, 2024-2034 (US$ Bn, AGR (%))
Figure 24 Forward Fit Market Share Forecast by Region, 2024 & 2034 (%)
Figure 25 Commercial Avionics Market by Navigation Systems: Market Attractiveness Index
Figure 26 Global Commercial Avionics Market by Navigation Systems, 2024-2034 (US$ Bn, AGR (%))
Figure 27 Commercial Avionics Market Share Forecast by Navigation Systems, 2024, 2029, 2034 (%)
Figure 28 Flight Management Systems (FMS) Market by Region, 2024-2034 (US$ Bn, AGR (%))
Figure 29 Flight Management Systems (FMS) Market Share Forecast by Region, 2024 & 2034 (%)
Figure 30 Global Navigation Satellite Systems (GNSS) Market by Region, 2024-2034 (US$ Bn, AGR (%))
Figure 31 Global Navigation Satellite Systems (GNSS) Market Share Forecast by Region, 2024 & 2034 (%)
Figure 32 Inertial Navigation Systems (INS) Market by Region, 2024-2034 (US$ Bn, AGR (%))
Figure 33 Inertial Navigation Systems (INS) Market Share Forecast by Region, 2024 & 2034 (%)
Figure 34 Commercial Avionics Market by Surveillance Systems: Market Attractiveness Index
Figure 35 Global Commercial Avionics Market by Surveillance Systems, 2024-2034 (US$ Bn, AGR (%))
Figure 36 Commercial Avionics Market Share Forecast by Surveillance Systems, 2024, 2029, 2034 (%)
Figure 37 Radar Systems Market by Region, 2024-2034 (US$ Bn, AGR (%))
Figure 38 Radar Systems Market Share Forecast by Region, 2024 & 2034 (%)
Figure 39 Traffic Collision Avoidance Systems (TCAS) Market by Region, 2024-2034 (US$ Bn, AGR (%))
Figure 40 Traffic Collision Avoidance Systems (TCAS) Market Share Forecast by Region, 2024 & 2034 (%)
Figure 41 Automatic Dependent Surveillance–Broadcast (ADS-B) Market by Region, 2024-2034 (US$ Bn, AGR (%))
Figure 42 Automatic Dependent Surveillance–Broadcast (ADS-B) Market Share Forecast by Region, 2024 & 2034 (%)
Figure 43 Other Surveillance Systems Market by Region, 2024-2034 (US$ Bn, AGR (%))
Figure 44 Other Surveillance Systems Market Share Forecast by Region, 2024 & 2034 (%)
Figure 45 Commercial Avionics Market by Aircraft Type: Market Attractiveness Index
Figure 46 Global Commercial Avionics Market by Aircraft Type, 2024-2034 (US$ Bn, AGR (%))
Figure 47 Commercial Avionics Market Share Forecast by Aircraft Type, 2024, 2029, 2034 (%)
Figure 48 Narrow Body Market by Region, 2024-2034 (US$ Bn, AGR (%))
Figure 49 Narrow Body Market Share Forecast by Region, 2024 & 2034 (%)
Figure 50 Wide Body Market by Region, 2024-2034 (US$ Bn, AGR (%))
Figure 51 Wide Body Market Share Forecast by Region, 2024 & 2034 (%)
Figure 52 Regional & Business Jet Market by Region, 2024-2034 (US$ Bn, AGR (%))
Figure 53 Regional & Business Jet Market Share Forecast by Region, 2024 & 2034 (%)
Figure 54 Freighter Market by Region, 2024-2034 (US$ Bn, AGR (%))
Figure 55 Freighter Market Share Forecast by Region, 2024 & 2034 (%)
Figure 56 Other Aircraft Type Market by Region, 2024-2034 (US$ Bn, AGR (%))
Figure 57 Other Aircraft Type Market Share Forecast by Region, 2024 & 2034 (%)
Figure 58 Commercial Avionics Market by System Type: Market Attractiveness Index
Figure 59 Global Commercial Avionics Market by System Type, 2024-2034 (US$ Bn, AGR (%))
Figure 60 Commercial Avionics Market Share Forecast by System Type, 2024, 2029, 2034 (%)
Figure 61 Navigation Systems Market by Region, 2024-2034 (US$ Bn, AGR (%))
Figure 62 Navigation Systems Market Share Forecast by Region, 2024 & 2034 (%)
Figure 63 Surveillance Systems Market by Region, 2024-2034 (US$ Bn, AGR (%))
Figure 64 Surveillance Systems Market Share Forecast by Region, 2024 & 2034 (%)
Figure 65 Integrated Modular Avionics (IMA) Market by Region, 2024-2034 (US$ Bn, AGR (%))
Figure 66 Integrated Modular Avionics (IMA) Market Share Forecast by Region, 2024 & 2034 (%)
Figure 67 Communication Systems Market by Region, 2024-2034 (US$ Bn, AGR (%))
Figure 68 Communication Systems Market Share Forecast by Region, 2024 & 2034 (%)
Figure 69 Flight Control and Monitoring Systems Market by Region, 2024-2034 (US$ Bn, AGR (%))
Figure 70 Flight Control and Monitoring Systems Market Share Forecast by Region, 2024 & 2034 (%)
Figure 71 Other System Type Market by Region, 2024-2034 (US$ Bn, AGR (%))
Figure 72 Other System Type Market Share Forecast by Region, 2024 & 2034 (%)
Figure 73 Commercial Avionics Market Forecast by Region 2024 and 2034 (Revenue, CAGR%)
Figure 74 Commercial Avionics Market Share Forecast by Region 2024, 2029, 2034 (%)
Figure 75 Commercial Avionics Market by Region, 2024-2034 (US$ Billion, AGR %)
Figure 76 North America Commercial Avionics Market Attractiveness Index
Figure 77 North America Commercial Avionics Market by Region, 2024, 2029 & 2034 (US$ Billion)
Figure 78 North America Commercial Avionics Market by Value, 2024-2034 (US$ Bn, AGR (%))
Figure 79 North America Commercial Avionics Market by Country, 2024-2034 (US$ Bn, AGR (%))
Figure 80 North America Commercial Avionics Market Share Forecast by Country, 2024 & 2034 (%)
Figure 81 North America Commercial Avionics Market by Fit, 2024-2034 (US$ Bn, AGR (%))
Figure 82 North America Commercial Avionics Market Share Forecast Fit, 2024 & 2034 (%)
Figure 83 North America Commercial Avionics Market by Navigation Systems, 2024-2034 (US$ Bn, AGR (%))
Figure 84 North America Commercial Avionics Market Share Forecast by Navigation Systems, 2024 & 2034 (%)
Figure 85 North America Commercial Avionics Market by Surveillance Systems, 2024-2034 (US$ Bn, AGR (%))
Figure 86 North America Commercial Avionics Market Share Forecast by Surveillance Systems, 2024 & 2034 (%)
Figure 87 North America Commercial Avionics Market by Aircraft Type, 2024-2034 (US$ Bn, AGR (%))
Figure 88 North America Commercial Avionics Market Share Forecast by Aircraft Type, 2024 & 2034 (%)
Figure 89 North America Commercial Avionics Market by System Type, 2024-2034 (US$ Bn, AGR (%))
Figure 90 North America Commercial Avionics Market Share Forecast by System Type, 2024 & 2034 (%)
Figure 91 US Commercial Avionics Market by Value, 2024-2034 (US$ Bn, AGR (%))
Figure 92 Canada Commercial Avionics Market by Value, 2024-2034 (US$ Bn, AGR (%))
Figure 93 Europe Commercial Avionics Market Attractiveness Index
Figure 94 Europe Commercial Avionics Market by Region, 2024, 2029 & 2034 (US$ Billion)
Figure 95 Europe Commercial Avionics Market by Value, 2024-2034 (US$ Bn, AGR (%))
Figure 96 Europe Commercial Avionics Market by Country, 2024-2034 (US$ Bn, AGR (%))
Figure 97 Europe Commercial Avionics Market Share Forecast by Country, 2024 & 2034 (%)
Figure 98 Europe Commercial Avionics Market by Fit, 2024-2034 (US$ Bn, AGR (%))
Figure 99 Europe Commercial Avionics Market Share Forecast Fit, 2024 & 2034 (%)
Figure 100 Europe Commercial Avionics Market by Navigation Systems, 2024-2034 (US$ Bn, AGR (%))
Figure 101 Europe Commercial Avionics Market Share Forecast by Navigation Systems, 2024 & 2034 (%)
Figure 102 Europe Commercial Avionics Market by Surveillance Systems, 2024-2034 (US$ Bn, AGR (%))
Figure 103 Europe Commercial Avionics Market Share Forecast by Surveillance Systems, 2024 & 2034 (%)
Figure 104 Europe Commercial Avionics Market by Aircraft Type, 2024-2034 (US$ Bn, AGR (%))
Figure 105 Europe Commercial Avionics Market Share Forecast by Aircraft Type, 2024 & 2034 (%)
Figure 106 Europe Commercial Avionics Market by System Type, 2024-2034 (US$ Bn, AGR (%))
Figure 107 Europe Commercial Avionics Market Share Forecast by System Type, 2024 & 2034 (%)
Figure 108 Germany Commercial Avionics Market by Value, 2024-2034 (US$ Bn, AGR (%))
Figure 109 UK Commercial Avionics Market by Value, 2024-2034 (US$ Bn, AGR (%))
Figure 110 France Commercial Avionics Market by Value, 2024-2034 (US$ Bn, AGR (%))
Figure 111 Italy Commercial Avionics Market by Value, 2024-2034 (US$ Bn, AGR (%))
Figure 112 Spain Commercial Avionics Market by Value, 2024-2034 (US$ Bn, AGR (%))
Figure 113 Rest of Europe Commercial Avionics Market by Value, 2024-2034 (US$ Bn, AGR (%))
Figure 114 Asia-Pacific Commercial Avionics Market Attractiveness Index
Figure 115 Asia-Pacific Commercial Avionics Market by Region, 2024, 2029 & 2034 (US$ Billion)
Figure 116 Asia-Pacific Commercial Avionics Market by Value, 2024-2034 (US$ Bn, AGR (%))
Figure 117 Asia-Pacific Commercial Avionics Market by Country, 2024-2034 (US$ Bn, AGR (%))
Figure 118 Asia-Pacific Commercial Avionics Market Share Forecast by Country, 2024 & 2034 (%)
Figure 119 Asia-Pacific Commercial Avionics Market by Fit, 2024-2034 (US$ Bn, AGR (%))
Figure 120 Asia-Pacific Commercial Avionics Market Share Forecast Fit, 2024 & 2034 (%)
Figure 121 Asia-Pacific Commercial Avionics Market by Navigation Systems, 2024-2034 (US$ Bn, AGR (%))
Figure 122 Asia-Pacific Commercial Avionics Market Share Forecast by Navigation Systems, 2024 & 2034 (%)
Figure 123 Asia-Pacific Commercial Avionics Market by Surveillance Systems, 2024-2034 (US$ Bn, AGR (%))
Figure 124 Asia-Pacific Commercial Avionics Market Share Forecast by Surveillance Systems, 2024 & 2034 (%)
Figure 125 Asia-Pacific Commercial Avionics Market by Aircraft Type, 2024-2034 (US$ Bn, AGR (%))
Figure 126 Asia-Pacific Commercial Avionics Market Share Forecast by Aircraft Type, 2024 & 2034 (%)
Figure 127 Asia-Pacific Commercial Avionics Market by System Type, 2024-2034 (US$ Bn, AGR (%))
Figure 128 Asia-Pacific Commercial Avionics Market Share Forecast by System Type, 2024 & 2034 (%)
Figure 129 China Commercial Avionics Market by Value, 2024-2034 (US$ Bn, AGR (%))
Figure 130 India Commercial Avionics Market by Value, 2024-2034 (US$ Bn, AGR (%))
Figure 131 Japan Commercial Avionics Market by Value, 2024-2034 (US$ Bn, AGR (%))
Figure 132 South Korea Commercial Avionics Market by Value, 2024-2034 (US$ Bn, AGR (%))
Figure 133 Australia Commercial Avionics Market by Value, 2024-2034 (US$ Bn, AGR (%))
Figure 134 Rest of Asia-Pacific Commercial Avionics Market by Value, 2024-2034 (US$ Bn, AGR (%))
Figure 135 Middle East and Africa Commercial Avionics Market Attractiveness Index
Figure 136 Middle East and Africa Commercial Avionics Market by Region, 2024, 2029 & 2034 (US$ Billion)
Figure 137 Middle East & Africa Commercial Avionics Market by Value, 2024-2034 (US$ Bn, AGR (%))
Figure 138 Middle East & Africa Commercial Avionics Market by Country, 2024-2034 (US$ Bn, AGR (%))
Figure 139 Middle East and Africa Commercial Avionics Market Share Forecast by Country, 2024 & 2034 (%)
Figure 140 Middle East & Africa Commercial Avionics Market by Fit, 2024-2034 (US$ Bn, AGR (%))
Figure 141 Middle East and Africa Commercial Avionics Market Share Forecast Fit, 2024 & 2034 (%)
Figure 142 Middle East & Africa Commercial Avionics Market by Navigation Systems, 2024-2034 (US$ Bn, AGR (%))
Figure 143 Middle East and Africa Commercial Avionics Market Share Forecast by Navigation Systems, 2024 & 2034 (%)
Figure 144 Middle East & Africa Commercial Avionics Market by Surveillance Systems, 2024-2034 (US$ Bn, AGR (%))
Figure 145 Middle East and Africa Commercial Avionics Market Share Forecast by Surveillance Systems, 2024 & 2034 (%)
Figure 146 Middle East & Africa Commercial Avionics Market by Aircraft Type, 2024-2034 (US$ Bn, AGR (%))
Figure 147 Middle East and Africa Commercial Avionics Market Share Forecast by Aircraft Type, 2024 & 2034 (%)
Figure 148 Middle East & Africa Commercial Avionics Market by System Type, 2024-2034 (US$ Bn, AGR (%))
Figure 149 Middle East and Africa Commercial Avionics Market Share Forecast by System Type, 2024 & 2034 (%)
Figure 150 GCC Commercial Avionics Market by Value, 2024-2034 (US$ Bn, AGR (%))
Figure 151 South Africa Commercial Avionics Market by Value, 2024-2034 (US$ Bn, AGR (%))
Figure 152 Rest of Middle East & Africa Commercial Avionics Market by Value, 2024-2034 (US$ Bn, AGR (%))
Figure 153 Latin America Commercial Avionics Market Attractiveness Index
Figure 154 Latin America Commercial Avionics Market by Region, 2024, 2029 & 2034 (US$ Billion)
Figure 155 Latin America Commercial Avionics Market by Value, 2024-2034 (US$ Bn, AGR (%))
Figure 156 Latin America Commercial Avionics Market by Country, 2024-2034 (US$ Bn, AGR (%))
Figure 157 Latin America Commercial Avionics Market Share Forecast by Country, 2024 & 2034 (%)
Figure 158 Latin America Commercial Avionics Market by Fit, 2024-2034 (US$ Bn, AGR (%))
Figure 159 Latin America Commercial Avionics Market Share Forecast Fit, 2024 & 2034 (%)
Figure 160 Latin America Commercial Avionics Market by Navigation Systems, 2024-2034 (US$ Bn, AGR (%))
Figure 161 Latin America Commercial Avionics Market Share Forecast by Navigation Systems, 2024 & 2034 (%)
Figure 162 Latin America Commercial Avionics Market by Surveillance Systems, 2024-2034 (US$ Bn, AGR (%))
Figure 163 Latin America Commercial Avionics Market Share Forecast by Surveillance Systems, 2024 & 2034 (%)
Figure 164 Latin America Commercial Avionics Market by Aircraft Type, 2024-2034 (US$ Bn, AGR (%))
Figure 165 Latin America Commercial Avionics Market Share Forecast by Aircraft Type, 2024 & 2034 (%)
Figure 166 Latin America Commercial Avionics Market by System Type, 2024-2034 (US$ Bn, AGR (%))
Figure 167 Latin America Commercial Avionics Market Share Forecast by System Type, 2024 & 2034 (%)
Figure 168 Brazil Commercial Avionics Market by Value, 2024-2034 (US$ Bn, AGR (%))
Figure 169 Mexico Commercial Avionics Market by Value, 2024-2034 (US$ Bn, AGR (%))
Figure 170 Rest of Latin America Commercial Avionics Market by Value, 2024-2034 (US$ Bn, AGR (%))
Figure 171 Commercial Avionics Market: Company Share, 2022
Figure 172 Honeywell International Inc.: Net Revenue, 2018-2022 (US$ Million, AGR%)
Figure 173 Honeywell International Inc.: R&D, 2018-2022 (US$ Million, AGR%)
Figure 174 Honeywell International Inc.: Regional Revenue Share, 2022 (%)
Figure 175 Honeywell International Inc.: Business Segment Revenue Share, 2022 (%)
Figure 176 General Electric Company.: Net Revenue, 2018-2022 (US$ Million, AGR%)
Figure 177 General Electric Company.: R&D, 2018-2022 (US$ Million, AGR%)
Figure 178 General Electric Company.: Business Segment Revenue Share, 2022 (%)
Figure 179 Thales Group.: Net Revenue, 2018-2022 (US$ Million, AGR%)
Figure 180 BAE Systems PLC.: Net Revenue, 2018-2022 (US$ Million, AGR%)
Figure 181 BAE Systems PLC.: R&D, 2018-2022 (US$ Million, AGR%)
Figure 182 BAE Systems PLC.: Regional Revenue Share, 2022 (%)
Figure 183 BAE Systems PLC.: Business Segment Revenue Share, 2022 (%)
Figure 184 L3Harris Technologies, Inc.: Net Revenue, 2018-2022 (US$ Million, AGR%)
Figure 185 L3Harris Technologies, Inc.: R&D, 2018-2022 (US$ Million, AGR%)
Figure 186 L3Harris Technologies, Inc.: Regional Revenue Share, 2022 (%)
Figure 187 L3Harris Technologies, Inc.: Business Segment Revenue Share, 2022 (%)
Figure 188 Raytheon Technologies Corporation.: Net Revenue, 2018-2022 (US$ Million, AGR%)
Figure 189 Raytheon Technologies Corporation.: R&D, 2018-2022 (US$ Million, AGR%)
Figure 190 Raytheon Technologies Corporation.: Regional Revenue Share, 2022 (%)
Figure 191 Raytheon Technologies Corporation.: Business Segment Revenue Share, 2022 (%)
Figure 192 TransDigm Group.: Net Revenue, 2018-2022 (US$ Million, AGR%)
Figure 193 TransDigm Group.: R&D, 2018-2022 (US$ Million, AGR%)
Figure 194 TransDigm Group.: Regional Revenue Share, 2022 (%)
Figure 195 TransDigm Group.: Business Segment Revenue Share, 2022 (%)
Figure 196 Parker Meggitt.: Net Revenue, 2018-2022 (US$ Million, AGR%)
Figure 197 Teledyne Technologies Incorporated.: Net Revenue, 2018-2022 (US$ Million, AGR%)
Figure 198 Teledyne Technologies Incorporated.: Business Segment Revenue Share, 2022 (%)
Figure 199 Safran S.A.: Net Revenue, 2018-2022 (US$ Million, AGR%)
Figure 200 Safran S.A.: R&D, 2018-2022 (US$ Million, AGR%)
Figure 201 Safran S.A.: Business Segment Revenue Share, 2022 (%)
Figure 202 Curtiss-Wright Corporation.: Net Revenue, 2018-2022 (US$ Million, AGR%)
Figure 203 Curtiss-Wright Corporation.: R&D, 2018-2022 (US$ Million, AGR%)
Figure 204 Curtiss-Wright Corporation.: Business Segment Revenue Share, 2022 (%)
Figure 205 Garmin Ltd.: Net Revenue, 2018-2022 (US$ Million, AGR%)
Figure 206 Garmin Ltd.: R&D, 2018-2022 (US$ Million, AGR%)
Figure 207 Garmin Ltd.: Regional Revenue Share, 2022 (%)
Figure 208 Garmin Ltd.: Business Segment Revenue Share, 2022 (%)
ページTOPに戻る
本レポートと同じKEY WORD()の最新刊レポート
- 本レポートと同じKEY WORDの最新刊レポートはありません。
よくあるご質問
Visiongain社はどのような調査会社ですか?
英国の調査会社ヴィジョンゲイン社(Visiongain)は、通信とエネルギーのほか、自動車や化学・医薬品、金属など、広範な市場を対象に調査を行っています。自動車市場については、市場全般に関する調査のほ... もっと見る
調査レポートの納品までの日数はどの程度ですか?
在庫のあるものは速納となりますが、平均的には 3-4日と見て下さい。
但し、一部の調査レポートでは、発注を受けた段階で内容更新をして納品をする場合もあります。
発注をする前のお問合せをお願いします。
注文の手続きはどのようになっていますか?
1)お客様からの御問い合わせをいただきます。
2)見積書やサンプルの提示をいたします。
3)お客様指定、もしくは弊社の発注書をメール添付にて発送してください。
4)データリソース社からレポート発行元の調査会社へ納品手配します。
5) 調査会社からお客様へ納品されます。最近は、pdfにてのメール納品が大半です。
お支払方法の方法はどのようになっていますか?
納品と同時にデータリソース社よりお客様へ請求書(必要に応じて納品書も)を発送いたします。
お客様よりデータリソース社へ(通常は円払い)の御振り込みをお願いします。
請求書は、納品日の日付で発行しますので、翌月最終営業日までの当社指定口座への振込みをお願いします。振込み手数料は御社負担にてお願いします。
お客様の御支払い条件が60日以上の場合は御相談ください。
尚、初めてのお取引先や個人の場合、前払いをお願いすることもあります。ご了承のほど、お願いします。
データリソース社はどのような会社ですか?
当社は、世界各国の主要調査会社・レポート出版社と提携し、世界各国の市場調査レポートや技術動向レポートなどを日本国内の企業・公官庁及び教育研究機関に提供しております。
世界各国の「市場・技術・法規制などの」実情を調査・収集される時には、データリソース社にご相談ください。
お客様の御要望にあったデータや情報を抽出する為のレポート紹介や調査のアドバイスも致します。
|
|

