眼科薬市場レポート:2024-2034
Ophthalmic Drugs Market Report 2024-2034
レポート詳細
眼科薬市場レポート 2024-2034年 :本レポートは、業界とその基礎となる原動力をより良く理解することを望むなら、新たな収益ポケットを目指す大手企業にとって貴重なものとなるでしょ... もっと見る
※上記価格は部署ライセンス(Departmental licence)価格です。
その他の価格についてはデータリソースまでお問合せください。
日本語のページは自動翻訳を利用し作成しています。
実際のレポートは英文のみでご納品いたします。

|

|
サマリー
レポート詳細
眼科薬市場レポート 2024-2034年:本レポートは、業界とその基礎となる原動力をより良く理解することを望むなら、新たな収益ポケットを目指す大手企業にとって貴重なものとなるでしょう。また、異業種への進出や新規地域での既存事業の拡大を目指す企業にとっても有益なレポートです。
世界の眼科薬市場は大幅な成長を遂げているが、その背景にはいくつかの重要な要因がある。緑内障、黄斑変性症、糖尿病性網膜症、ドライアイ症候群などの眼科疾患の有病率の増加が、より効果的な医薬品治療に対する需要を牽引している。世界人口の高齢化とライフスタイルの進化に伴い、これらの眼科疾患の発生率は上昇を続けており、これらに対処するための革新的な医薬品に対する持続的なニーズが生まれています。
強力な新薬パイプラインの存在が市場成長に大きく寄与している。製薬会社は、新しい改良型眼科治療薬を開発するための研究開発に積極的に投資している。これらのパイプライン医薬品は、治療の選択肢を増やし、より的を絞った治療を可能にすることが期待されており、市場の拡大にさらに拍車をかけている。これらの要因が相まって、世界の眼科薬市場はダイナミックに進化しており、当面は継続的な成長が見込まれます。
薬剤の副作用が業界の成長を阻む可能性
外用薬の使用は、一時的な視界の曇り、アレルギー反応、視覚障害、チクチク感、灼熱感、かゆみなど、さまざまな副作用を引き起こす可能性がある。さらに、よりまれな副作用として、視力の急激な変化、激しい頭痛、トンネルビジョン、目の不快感、目の奥の痛み、腫れや排膿といった新たな眼感染症の兆候などがある。その結果、ステロイド外用薬に関連するこれらの副作用の存在は、市場の成長を阻害する可能性があります。
薬剤の副作用が発展途上国の眼科薬市場にもたらす課題は複雑な問題である。この問題を解決するには、医療アクセスの向上、医療インフラの改善、患者教育の促進、偽造薬拡散への対策、眼科薬の安全性と有効性を維持するための厳格な規制枠組みの確立など、さまざまな対策を含む総合的なアプローチが必要です。
市場調査レポートを購入する前にすべき質問とは?
- 眼科薬市場はどのように進化しているのか?
- 何が眼科薬市場を牽引し、阻害しているのか?
- 予測期間中、眼科薬の各サブマーケットセグメントはどのように成長し、2034年にこれらのサブマーケットの売上はいくらになるのか?
- 2024年から2034年にかけて、眼科薬の各サブマーケットの市場シェアはどのように推移するのか?
- 2024年から2034年までの市場全体の主な牽引役は何か?
- 主要な眼科薬市場はマクロ経済の動きに概ね追随するのか、それとも個々の国市場が他を凌駕するのか?
- 2034年までに各国市場のシェアはどのように変化し、2034年に市場をリードするのはどの地域か?
- 主要プレーヤーは誰で、予測期間中の見通しは?
- 2024年から2034年の間に、業界はどのように進化するのか?現在および今後10年間に実施される眼科薬プロジェクトの意味合いは?
- 眼科薬市場をさらに拡大するために、製品の商業化の必要性は高まっていますか?
- 眼科薬市場はどこへ向かっているのか、そして市場の最前線に立つにはどうすればいいのか?
- 新製品やサービスラインへの最適な投資方法とは?
- 企業を新たな成長軌道に乗せ、C-suiteに移行させるための重要な展望とは?
このことが眼科薬市場に現在、そして今後10年間でどのような影響を与えるかを知る必要がある:
- 284ページにわたる本レポートでは、125の表、168の図表を掲載しています。
- 本レポートでは、業界における主要な有利分野を取り上げているため、今すぐターゲットを絞ることができます。
- 世界、地域、国の売上と成長に関する詳細な分析が含まれています。
- 競合他社が成功した主なトレンド、変化、収益予測をハイライトしています。
本レポートは、眼科薬市場が今後10年間でどのように発展するか、またCOVID-19の景気後退と好転の変動に合わせてどのように発展するかをお伝えします。この市場は過去10年間のどの時点よりも今が重要です。
2034年までの予測やその他の分析から、商業的な展望が明らかになる
- 2034年までの収益予測に加え、直近の実績、成長率、市場シェアを提供します。
- ビジネスの展望と展開に関する独自の分析をご覧いただけます。
- 定性的分析(市場ダイナミクス、促進要因、機会、阻害要因、課題など)、コスト構造、眼科薬価格上昇の影響、最近の動向などをご覧いただけます。
本レポートには、COVID-19が業界と貴社にどのような影響を与えるかについてのデータ分析と貴重な洞察が含まれている。本レポートでは、COVID-19の4つの回収パターンとその影響、すなわち「V」、「L」、「W」、「U」について論じている。
レポート対象セグメント
タイプ
- 処方薬
- 一般用医薬品
適応症
- 網膜障害
- 感染症/炎症/アレルギー
- 緑内障
- ドライアイ
投与経路
- 外用薬
- 非経口
販売チャネル
- 病院薬局
- ドラッグストア
- オンライン薬局
世界市場全体と各分野の収益予測に加え、5つの地域と26の主要国市場の収益予測も掲載している:
北米
- アメリカ
- カナダ
欧州
- ドイツ
- スペイン
- 英国
- フランス
- イタリア
- オランダ
- スイス
- その他の欧州
アジア太平洋
- 中国
- 日本
- インド
- オーストラリア
- 韓国
- マレーシア
- シンガポール
- その他のアジア太平洋地域
ラテンアメリカ
- ブラジル
- アルゼンチン
- メキシコ
- チリ
- その他のラテンアメリカ
MEA
- GCC
- 南アフリカ
- その他のMEA
また、このレポートでは2024年から2034年までの眼科薬市場の主要企業のプロファイルと、これらの企業の事業のこのセグメントに焦点を当てています。
主要企業と市場成長の可能性
・ AbbVie Inc.
・ Alimera Sciences
・ Apellis Pharmaceuticals
・ Bausch & Lomb Incorporated
・ Bayer AG
・ Breye Therapeutics ApS
・ EyeBio
・ F. Hoffmann-La Roche Ltd.
・ Johnson & Johnson Services Inc.
・ Novaliq GmbH
・ Novartis AG
・ Pfizer Inc.
・ Regeneron Pharmaceuticals Inc.
・ Santen Pharmaceutical Co., Ltd.
・ SpliceBio
・ Teva Pharmaceutical Industries Ltd.
2024年から2034年までの眼科薬市場全体の世界売上高(金額ベース)は、2024年に320億米ドルを突破する。2034年まで収益の力強い成長を予測。当社の調査では、最も大きな可能性を秘めた組織を特定している。彼らの能力、進歩、商業的展望を発見し、一歩先を行くお手伝いをします。
眼科薬市場、2024-2034年レポートはどのようにお役に立ちますか?
要約すると、280ページを超えるこのレポートは、以下の知識を提供する:
- 眼科薬市場、2024年から2034年までの収益予測 眼科薬市場、2024年から2034年までの収益予測、タイプ、流通チャネル、適応症、投与経路の各予測を世界および地域レベルで掲載。
- 5つの地域と26の主要国市場の2034年までの収益予測 - 北米、ヨーロッパ、アジア太平洋、ラテンアメリカ、MEAの眼科薬市場2024年から2034年までの予測をご覧ください。また、米国、カナダ、メキシコ、ブラジル、ドイツ、フランス、英国、イタリア、中国、インド、日本、オーストラリアなどの主要国の市場も予測しています。
- 既存企業および市場参入を目指す企業の展望 - 眼科薬市場に関わる主要企業16社の企業プロファイルを含む、2024年から2034年までの市場。
独自の予測による定量的・定性的分析をご覧ください。私たちのレポートだけに含まれる情報を入手し、貴重なビジネスインテリジェンスで情報を得ることができます。
他にはない情報
私たちの新しいレポートがあれば、知識に遅れをとったり、チャンスを逃したりする可能性が低くなります。Visiongainのレポートが貴社の調査、分析、意思決定にどのように役立つかをご覧ください。Visiongainの調査は、眼科薬市場、2024年から2034年、市場をリードする企業の商業分析を必要とするすべての人のためのものです。データ、トレンド、予測をご覧いただけます。
ページTOPに戻る
目次
目次
1 レポート概要
1.1 研究の目的
1.2 眼科薬市場の紹介
1.3 本レポートの内容
1.4 本レポートを読むべき理由
1.5 本分析レポートが回答する主な質問
1.6 本レポートの対象者
1.7 方法論
1.7.1 市場の定義
1.7.2 市場評価・予測手法
1.7.3 データの検証
1.7.3.1 一次調査
1.7.3.2 セカンダリーリサーチ
1.8 よくある質問(FAQ)
1.9 Visiongainの関連レポート
1.10 Visiongainについて
2 エグゼクティブ・サマリー
3 市場概要
3.1 主要な調査結果
3.2 市場ダイナミクス
3.2.1 市場促進要因
3.2.1.1 目に関連する症状の頻度と発生率の上昇
3.2.1.2 糖尿病の有病率の増加
3.2.1.3 新興の強力なパイプライン医薬品の存在
3.2.2 市場抑制要因
3.2.2.1 発展途上国における健康保険の欠如
3.2.2.2 利用可能な治療選択肢に関する認識不足
3.2.2.3 医薬品の副作用
3.2.2.4 ブロックバスター医薬品の特許切れ
3.2.3 市場機会
3.2.3.1 研究開発投資の増加
3.2.3.2 老年人口の増加
3.3 COVID-19の影響分析
3.4 ポーターのファイブフォース分析
3.4.1 サプライヤーの交渉力
3.4.2 買い手の交渉力
3.4.3 競争相手のライバル関係
3.4.4 代替品による脅威
3.4.5 新規参入企業の脅威
3.5 PEST分析
3.5.1 政治
3.5.2 経済
3.5.3 社会
3.5.4 技術
4 眼科薬市場分析:タイプ別
4.1 主要な調査結果
4.2 タイプ別セグメント 市場魅力度指数
4.3 眼科薬のタイプ別市場規模の推定と予測
4.4 処方箋薬
4.4.1 2024〜2034年の地域別市場規模(US$ Billion)
4.4.2 地域別市場シェア、2024年・2034年(%)
4.5 OTC医薬品
4.5.1 2024〜2034年の地域別市場規模(US$ Billion)
4.5.2 地域別市場シェア、2024年・2034年(%)
5 眼科薬市場分析:流通チャネル別
5.1 主要調査結果
5.2 流通チャネルセグメント 市場魅力度指数
5.3 流通チャネル別眼科薬市場規模の推定と予測
5.4 病院薬局
5.4.1 2024〜2034年の地域別市場規模(US$ Billion)
5.4.2 地域別市場シェア、2024年・2034年(%)
5.5 ドラッグストア
5.5.1 2024〜2034年の地域別市場規模(US$ Billion)
5.5.2 地域別市場シェア、2024年・2034年(%)
5.6 オンライン薬局
5.6.1 2024〜2034年の地域別市場規模(US$ Billion)
5.6.2 地域別市場シェア、2024年・2034年(%)
6 眼科薬市場分析:適応症別
6.1 主な調査結果
6.2 適応症セグメント 市場魅力度指数
6.3 眼科薬の適応症別市場規模の推定と予測
6.4 網膜疾患
6.4.1 2024〜2034年の地域別市場規模(US$ Billion)
6.4.2 地域別市場シェア、2024年・2034年(%)
6.4.3 網膜障害の薬剤別市場規模、2024〜2034年(US$ Billion)
6.5 感染/炎症/アレルギー
6.5.1 地域別市場規模、2024〜2034年(US$ Billion)
6.5.2 地域別市場シェア、2024年・2034年(%)
6.5.3 感染症/炎症/アレルギーの医薬品別市場規模、2024〜2034年(US$ Billion)
6.6 ドライアイ
6.6.1 地域別市場規模、2024〜2034年(US$ Billion)
6.6.2 地域別市場シェア、2024年・2034年(%)
6.6.3 ドライアイの薬剤別市場規模、2024〜2034年(US$ Billion)
6.7 緑内障
6.7.1 2024〜2034年の地域別市場規模(US$ Billion)
6.7.2 地域別市場シェア、2024年・2034年 (%)
6.7.3 緑内障の薬剤別市場規模、2024〜2034年(US$ Billion)
7 眼科薬市場分析:投与経路別
7.1 主要調査結果
7.2 投与経路セグメント 市場魅力度指数
7.3 投与経路別眼科薬市場規模の推定と予測
7.4 外用薬
7.4.1 2024〜2034年の地域別市場規模(US$ Billion)
7.4.2 地域別市場シェア、2024年・2034年(%)
7.5 非経口剤
7.5.1 2024〜2034年の地域別市場規模(US$ Billion)
7.5.2 地域別市場シェア、2024年・2034年(%)
8 眼科薬市場分析:地域別
8.1 主要な調査結果
8.2 地域別市場規模の推定と予測
9 北米の眼科薬市場分析
9.1 主要な調査結果
9.2 北米の眼科薬市場魅力度指数
9.3 北米の眼科薬国別市場、2024年、2029年、2034年(US$ Billion)
9.4 北米の眼科薬市場規模推定と予測:国別
9.5 北米の眼科薬市場規模推定と予測:タイプ別
9.6 北米の眼科薬市場規模推定と予測:流通チャネル別
9.7 北米の眼科薬市場規模推定と予測:適応症別
9.8 北米の眼科薬市場規模推定と予測:投与経路別
9.9 アメリカの眼科薬市場分析
9.10 カナダの眼科薬市場分析
10 欧州の眼科薬市場分析
10.1 主要な調査結果
10.2 欧州眼科薬市場魅力度指数
10.3 欧州の眼科薬国別市場、2024年、2029年、2034年(US$ Billion)
10.4 欧州の眼科薬市場規模推定と予測:国別
10.5 欧州の眼科薬市場規模推定と予測:タイプ別
10.6 欧州の眼科薬市場規模推定と予測:流通チャネル別
10.7 欧州の眼科薬市場規模推定と予測:適応症別
10.8 欧州の眼科薬市場規模推定と予測:投与経路別
10.9 ドイツの眼科薬市場分析
10.10 フランスの眼科薬市場分析
10.11 イギリスの眼科薬市場分析
10.12 イタリアの眼科薬市場分析
10.13 スペインの眼科薬市場分析
10.14 オランダの眼科薬市場分析
10.15 スイスの眼科薬市場分析
10.16 その他の欧州の眼科薬市場分析
11 アジア太平洋地域の眼科薬市場分析
11.1 主要な調査結果
11.2 アジア太平洋地域の眼科薬市場魅力度指数
11.3 アジア太平洋地域の眼科薬国別市場、2024年、2029年、2034年(US$ Billion)
11.4 アジア太平洋地域の眼科薬市場規模推定と予測:国別
11.5 アジア太平洋地域の眼科薬市場規模推定と予測:タイプ別
11.6 アジア太平洋地域の眼科薬市場規模推定と予測:流通チャネル別
11.7 アジア太平洋地域の眼科薬市場規模推定と予測:適応症別
11.8 アジア太平洋地域の眼科薬市場規模推定と予測:投与経路別
11.9 日本の眼科薬市場分析
11.10 中国の眼科薬市場分析
11.11 インドの眼科薬市場分析
11.12 オーストラリアの眼科薬市場分析
11.13 韓国の眼科薬市場分析
11.14 マレーシアの眼科薬市場分析
11.15 シンガポールの眼科薬市場分析
11.16 その他のアジア太平洋地域の眼科薬市場分析
12 ラテンアメリカの眼科薬市場分析
12.1 主要な調査結果
12.2 ラテンアメリカの眼科薬市場魅力度指数
12.3 ラテンアメリカの眼科用薬国別市場、2024年、2029年、2034年(US$ Billion)
12.4 ラテンアメリカの眼科薬市場規模推定と予測:国別
12.5 ラテンアメリカの眼科薬市場規模推定と予測:タイプ別
12.6 ラテンアメリカの眼科薬市場規模推定と予測:流通経路別
12.7 ラテンアメリカの眼科薬市場規模推定と予測:適応症別
12.8 ラテンアメリカの眼科薬市場規模推定と予測:投与経路別
12.9 ブラジルの眼科薬市場分析
12.10 アルゼンチンの眼科薬市場分析
12.11 メキシコの眼科薬市場分析
12.12 チリの眼科薬の市場分析
12.13 その他のラテンアメリカの眼科薬市場分析
13 MEAの眼科薬市場分析
13.1 主要な調査結果
13.2 MEA眼科薬市場魅力度指数
13.3 MEAの眼科用薬国別市場、2024年、2029年、2034年(US$ Billion)
13.4 MEAの眼科薬市場規模推定と予測:国別
13.5 MEAの眼科薬市場規模推定と予測:タイプ別
13.6 MEAの眼科薬市場規模推定と予測:流通チャネル別
13.7 MEAの眼科薬市場規模推定と予測:適応症別
13.8 MEAの眼科薬市場規模推定と予測:投与経路別
13.9 GCCの眼科薬市場分析
13.10 南アフリカの眼科薬市場分析
13.11 その他のMEAの眼科薬市場分析
14 主要企業のプロファイル
14.1 競争環境、2023年
14.2 戦略的展望
14.3 Novartis AG
14.3.1 会社概要
14.3.2 会社概要
14.3.3 財務分析
14.3.3.1 純収入、2018-2022年
14.3.3.2 地域市場シェア、2022年
14.3.3.3 研究開発費、2018年~2022年
14.3.4 提供製品
14.3.5 戦略的展望
14.4 Bayer AG
14.4.1 会社概要
14.4.2 会社概要
14.4.3 財務分析
14.4.3.1 純収入、2018-2022年
14.4.3.2 地域市場シェア、2022年
14.4.3.3 研究開発費、2018年~2022年
14.4.4 製品ベンチマーク
14.4.5 戦略的展望
14.5 Pfizer Inc.
14.5.1 会社概要
14.5.2 会社概要
14.5.3 財務分析
14.5.3.1 売上高、2018年~2022年
14.5.3.2 地域市場シェア、2022年
14.5.3.3 研究開発費、2018〜2022年
14.5.4 製品ベンチマーク
14.6 Bausch & Lomb Incorporated
14.6.1 会社概要
14.6.2 会社概要
14.6.3 財務分析
14.6.3.1 売上高、2018-2022年
14.6.3.2 研究開発費、2018-2022年
14.6.4 製品ベンチマーク
14.6.5 戦略的展望
14.7 Santen Pharmaceutical Co., Ltd.
14.7.1 会社概要
14.7.2 会社概要
14.7.3 財務分析
14.7.3.1 売上高、2018-2022年
14.7.3.2 研究開発費、2018年~2022年
14.7.4 製品ベンチマーク
14.7.5 戦略的展望
14.8 Johnson & Johnson Services Inc.
14.8.1 会社概要
14.8.2 会社概要
14.8.3 財務分析
14.8.3.1 売上高、2018年~2022年
14.8.3.2 地域市場シェア、2022年
14.8.3.3 研究開発費、2018年〜2022年
14.8.4 製品ベンチマーク
14.8.5 戦略的展望
14.9 Regeneron Pharmaceuticals Inc.
14.9.1 会社概要
14.9.2 会社概要
14.9.3 財務分析
14.9.3.1 売上高、2018-2022年
14.9.3.2 研究開発費、2018年〜2022年
14.9.4 製品ベンチマーク
14.9.5 戦略的展望
14.10 AbbVie Inc.
14.10.1 会社概要
14.10.2 会社概要
14.10.3 財務分析
14.10.3.1 売上高、2018年~2022年
14.10.3.2 地域市場シェア、2022年
14.10.3.3 研究開発費、2018年~2022年
14.10.4 製品ベンチマーク
14.10.5 戦略的展望
14.11 F. Hoffmann-La Roche Ltd
14.11.1 会社概要
14.11.2 会社概要
14.11.3 財務分析
14.11.3.1 売上高、2018年〜2022年
14.11.3.2 地域市場シェア、2022年
14.11.3.3 研究開発費、2018年〜2022年
14.11.4 製品ベンチマーク
14.11.5 戦略的展望
14.12 Teva Pharmaceutical Industries Ltd.
14.12.1 会社概要
14.12.2 会社概要
14.12.3 財務分析
14.12.3.1 売上高、2018年~2022年
14.12.3.2 地域市場シェア、2022年
14.12.3.3 研究開発費、2018年〜2022年
14.12.4 製品ベンチマーク
14.12.5 戦略的展望
14.13 Apellis Pharmaceuticals
14.13.1 会社概要
14.13.2 会社概要
14.13.3 財務分析
14.13.3.1 売上高、2018年~2022年
14.13.3.2 研究開発費、2018年~2022年
14.13.4 製品ベンチマーク
14.13.5 戦略的展望
14.14 Novaliq GmbH
14.14.1 会社概要
14.14.2 会社概要
14.14.3 製品ベンチマーク
14.14.4 戦略的展望
14.15 Alimera Sciences
14.15.1 会社概要
14.15.2 会社概要
14.15.3 財務分析
14.15.3.1 売上高、2018-2022年
14.15.3.2 研究開発費、2018年〜2022年
14.15.4 製品ベンチマーク
14.15.5 戦略的展望
14.16 EyeBio
14.16.1 会社概要
14.16.2 会社概要
14.16.3 製品ベンチマーク
14.16.4 戦略的展望
14.17 SpliceBio
14.17.1 会社概要
14.17.2 会社概要
14.17.3 製品ベンチマーク
14.17.4 戦略的展望
14.18 Breye Therapeutics ApS
14.18.1 会社概要
14.18.2 会社概要
14.18.3 製品ベンチマーク
14.18.4 戦略的展望
15 結論と提言
15.1 Visiongainからの結びの言葉
15.2 市場プレイヤーへの提言
ページTOPに戻る
図表リスト
表の一覧
Table 1 Ophthalmic Drugs Market Snapshot, 2024 & 2034 (US$ billion, CAGR %)
Table 2 Ophthalmic Drugs Market, Product Pipeline
Table 3 Ophthalmic Drugs Contract Manufacturing Market Forecast by Region 2024-2034 (US$ Billion, AGR%, CAGR%): "V" Shaped Recovery
Table 4 Ophthalmic Drugs Contract Manufacturing Market Forecast by Region 2024-2034 (US$ Billion, AGR%, CAGR%): "U" Shaped Recovery
Table 5 Ophthalmic Drugs Contract Manufacturing Market Forecast by Region 2024-2034 (US$ Billion, AGR%, CAGR%): "W" Shaped Recovery
Table 6 Ophthalmic Drugs Contract Manufacturing Market Forecast by Region 2024-2034 (US$ Billion, AGR%, CAGR%): "L" Shaped Recovery
Table 7 Ophthalmic Drugs Market Forecast by Type, 2024-2034 (US$ Billion, AGR%, CAGR%)
Table 8 Prescription Drugs Segment Market Forecast by Region, 2024-2034 (US$ Billion, AGR%, CAGR%)
Table 9 OTC Drugs Segment Market Forecast by Region, 2024-2034 (US$ Billion, AGR%, CAGR%)
Table 10 Ophthalmic Drugs Market Forecast by Distribution Channel, 2024-2034 (US$ Billion, AGR%, CAGR%)
Table 11 Hospital Pharmacies Segment Market Forecast by Region, 2024-2034 (US$ Billion, AGR%, CAGR%)
Table 12 Drug Stores Segment Market Forecast by Region, 2024-2034 (US$ Billion, AGR%, CAGR%)
Table 13 Online Pharmacies Segment Market Forecast by Region, 2024-2034 (US$ Billion, AGR%, CAGR%)
Table 14 Ophthalmic Drugs Market Forecast by Indications, 2024-2034 (US$ Billion, AGR%, CAGR%)
Table 15 Retinal Disorders Segment Market Forecast by Region, 2024-2034 (US$ Billion, AGR%, CAGR%)
Table 16 Retinal Disorders in Ophthalmic Drugs Market Forecast by Indications, 2024-2034 (US$ Billion, AGR%, CAGR%)
Table 17 Infection/Inflammation/Allergy Segment Market Forecast by Region, 2024-2034 (US$ Billion, AGR%, CAGR%)
Table 18 Infection/Inflammation/Allergy in Ophthalmic Drugs Market Forecast by Indications, 2024-2034 (US$ Billion, AGR%, CAGR%)
Table 19 Dry Eye Segment Market Forecast by Region, 2024-2034 (US$ Billion, AGR%, CAGR%)
Table 20 Dry Eye in Ophthalmic Drugs Market Forecast by Indications, 2024-2034 (US$ Billion, AGR%, CAGR%)
Table 21 Glaucoma Segment Market Forecast by Region, 2024-2034 (US$ Billion, AGR%, CAGR%)
Table 22 Glaucoma in Ophthalmic Drugs Market Forecast by Indications, 2024-2034 (US$ Billion, AGR%, CAGR%)
Table 23 Ophthalmic Drugs Market Forecast by Route of Administration, 2024-2034 (US$ Billion, AGR%, CAGR%)
Table 24 Topical Segment Market Forecast by Region, 2024-2034 (US$ Billion, AGR%, CAGR%)
Table 25 Parenteral Segment Market Forecast by Region, 2024-2034 (US$ Billion, AGR%, CAGR%)
Table 26 Ophthalmic Drugs Market Forecast by Region 2024-2034 (US$ Billion, AGR%, CAGR%)
Table 27 North America Ophthalmic Drugs Market Forecast by Country, 2024-2034 (US$ Billion, AGR%, CAGR%)
Table 28 North America Ophthalmic Drugs Market Forecast by Type, 2024-2034 (US$ Billion, AGR%, CAGR%)
Table 29 North America Ophthalmic Drugs Market Forecast by Distribution Channel, 2024-2034 (US$ Billion, AGR%, CAGR%)
Table 30 North America Ophthalmic Drugs Market Forecast by Indications, 2024-2034 (US$ Billion, AGR%, CAGR%)
Table 31 North America Ophthalmic Drugs Market Forecast by Route of Administration, 2024-2034 (US$ Billion, AGR%, CAGR%)
Table 32 U.S. Ophthalmic Drugs Market Forecast by Country, 2024-2034 (US$ Billion, AGR%, CAGR%)
Table 33 Canada Ophthalmic Drugs Market Forecast by Country, 2024-2034 (US$ Billion, AGR%, CAGR%)
Table 34 Europe Ophthalmic Drugs Market Forecast by Country, 2024-2034 (US$ Billion, AGR%, CAGR%)
Table 35 Europe Ophthalmic Drugs Market Forecast by Type, 2024-2034 (US$ Billion, AGR%, CAGR%)
Table 36 Europe Ophthalmic Drugs Market Forecast by Distribution Channel, 2024-2034 (US$ Billion, AGR%, CAGR%)
Table 37 Europe Ophthalmic Drugs Market Forecast by Indications, 2024-2034 (US$ Billion, AGR%, CAGR%)
Table 38 Europe Ophthalmic Drugs Market Forecast by Route of Administration, 2024-2034 (US$ Billion, AGR%, CAGR%)
Table 39 Germany Ophthalmic Drugs Market Forecast by Country, 2024-2034 (US$ Billion, AGR%, CAGR%)
Table 40 France Ophthalmic Drugs Market Forecast, 2024-2034 (US$ Billion, AGR%, CAGR%)
Table 41 UK Ophthalmic Drugs Market Forecast, 2024-2034 (US$ Billion, AGR%, CAGR%)
Table 42 Italy Ophthalmic Drugs Market Forecast, 2024-2034 (US$ Billion, AGR%, CAGR%)
Table 43 Spain Ophthalmic Drugs Market Forecast, 2024-2034 (US$ Billion, AGR%, CAGR%)
Table 44 Netherlands Ophthalmic Drugs Market Forecast, 2024-2034 (US$ Billion, AGR%, CAGR%)
Table 45 Switzerland Ophthalmic Drugs Market Forecast, 2024-2034 (US$ Billion, AGR%, CAGR%)
Table 46 Rest of Europe Ophthalmic Drugs Market Forecast, 2024-2034 (US$ Billion, AGR%, CAGR%)
Table 47 Asia Pacific Ophthalmic Drugs Market Forecast by Country, 2024-2034 (US$ Billion, AGR%, CAGR%)
Table 48 Asia Pacific Ophthalmic Drugs Market Forecast by Type, 2024-2034 (US$ Billion, AGR%, CAGR%)
Table 49 Asia Pacific Ophthalmic Drugs Market Forecast by Distribution Channel, 2024-2034 (US$ Billion, AGR%, CAGR%)
Table 50 Asia Pacific Ophthalmic Drugs Market Forecast by Indications, 2024-2034 (US$ Billion, AGR%, CAGR%)
Table 51 Asia Pacific Ophthalmic Drugs Market Forecast by Route of Administration, 2024-2034 (US$ Billion, AGR%, CAGR%)
Table 52 Japan Ophthalmic Drugs Market Forecast, 2024-2034 (US$ Billion, AGR%, CAGR%)
Table 53 China Ophthalmic Drugs Market Forecast, 2024-2034 (US$ Billion, AGR%, CAGR%)
Table 54 India Ophthalmic Drugs Market Forecast, 2024-2034 (US$ Billion, AGR%, CAGR%)
Table 55 Australia Ophthalmic Drugs Market Forecast, 2024-2034 (US$ Billion, AGR%, CAGR%)
Table 56 South Korea Ophthalmic Drugs Market Forecast, 2024-2034 (US$ Billion, AGR%, CAGR%)
Table 57 Malaysia Ophthalmic Drugs Market Forecast, 2024-2034 (US$ Billion, AGR%, CAGR%)
Table 58 Singapore Ophthalmic Drugs Market Forecast, 2024-2034 (US$ Billion, AGR%, CAGR%)
Table 59 Asia-Pacific Ophthalmic Drugs Market Forecast, 2024-2034 (US$ Billion, AGR%, CAGR%)
Table 60 Latin America Ophthalmic Drugs Market Forecast by Country, 2024-2034 (US$ Billion, AGR%, CAGR%)
Table 61 Latin America Ophthalmic Drugs Market Forecast by Type, 2024-2034 (US$ Billion, AGR%, CAGR%)
Table 62 Latin America Ophthalmic Drugs Market Forecast by Distribution Channel, 2024-2034 (US$ Billion, AGR%, CAGR%)
Table 63 Latin America Ophthalmic Drugs Market Forecast by Indications, 2024-2034 (US$ Billion, AGR%, CAGR%)
Table 64 Latin America Ophthalmic Drugs Market Forecast by Route of Administration, 2024-2034 (US$ Billion, AGR%, CAGR%)
Table 65 Brazil Ophthalmic Drugs Market Forecast, 2024-2034 (US$ Billion, AGR%, CAGR%)
Table 66 Argentina Ophthalmic Drugs Market Forecast, 2024-2034 (US$ Billion, AGR%, CAGR%)
Table 67 Mexico Ophthalmic Drugs Market Forecast, 2024-2034 (US$ Billion, AGR%, CAGR%)
Table 68 Chile Ophthalmic Drugs Market Forecast, 2024-2034 (US$ Billion, AGR%, CAGR%)
Table 69 Rest of Latin America Ophthalmic Drugs Market Forecast, 2024-2034 (US$ Billion, AGR%, CAGR%)
Table 70 MEA Ophthalmic Drugs Market Forecast by Country, 2024-2034 (US$ Billion, AGR%, CAGR%)
Table 71 MEA Ophthalmic Drugs Market Forecast by Type, 2024-2034 (US$ Billion, AGR%, CAGR%)
Table 72 MEA Ophthalmic Drugs Market Forecast by Distribution Channel, 2024-2034 (US$ Billion, AGR%, CAGR%)
Table 73 MEA Ophthalmic Drugs Market Forecast by Indications, 2024-2034 (US$ Billion, AGR%, CAGR%)
Table 74 MEA Ophthalmic Drugs Market Forecast by Route of Administration, 2024-2034 (US$ Billion, AGR%, CAGR%)
Table 75 GCC Ophthalmic Drugs Market Forecast, 2024-2034 (US$ Billion, AGR%, CAGR%)
Table 76 South Africa Ophthalmic Drugs Market Forecast, 2024-2034 (US$ Billion, AGR%, CAGR%)
Table 77 Rest of MEA Ophthalmic Drugs Market Forecast, 2024-2034 (US$ Billion, AGR%, CAGR%)
Table 78 Strategic Outlook
Table 79 Novartis AG: Key Details, (CEO, HQ, Revenue, Founded, No. of Employees, Company Type, Website, Business Segment)
Table 80 Novartis AG: Product Benchmarking
Table 81 Novartis AG: Strategic Outlook
Table 82 Bayer AG: Key Details, (CEO, HQ, Revenue, Founded, No. of Employees, Company Type, Website, Business Segment)
Table 83 Bayer AG: Product Benchmarking
Table 84 Bayer AG: Strategic Outlook
Table 85 Pfizer Inc.: Key Details, (CEO, HQ, Revenue, Founded, No. of Employees, Company Type, Website, Business Segment)
Table 86 Pfizer Inc.: Product Benchmarking
Table 87 Bausch & Lomb Incorporated: Key Details, (CEO, HQ, Revenue, Founded, No. of Employees, Company Type, Website, Business Segment)
Table 88 Bausch & Lomb Incorporated: Product Benchmarking
Table 89 Bausch & Lomb Incorporated: Strategic Outlook
Table 90 Santen Pharmaceutical Co., Ltd.: Key Details, (CEO, HQ, Revenue, Founded, No. of Employees, Company Type, Website, Business Segment)
Table 91 Santen Pharmaceutical Co., Ltd.: Product Benchmarking
Table 92 Santen Pharmaceutical Co., Ltd.: Strategic Outlook
Table 93 Johnson & Johnson Services Inc: Key Details, (CEO, HQ, Revenue, Founded, No. of Employees, Company Type, Website, Business Segment)
Table 94 Johnson & Johnson Private Limited: Product Benchmarking
Table 95 Johnson & Johnson Private Limited: Strategic Outlook
Table 96 Regeneron Pharmaceuticals Inc.: Key Details, (CEO, HQ, Revenue, Founded, No. of Employees, Company Type, Website, Business Segment)
Table 97 Regeneron Pharmaceuticals Inc.: Product Benchmarking
Table 98 Regeneron Pharmaceuticals Inc.: Strategic Outlook
Table 99 AbbVie Inc.: Key Details, (CEO, HQ, Revenue, Founded, No. of Employees, Company Type, Website, Business Segment)
Table 100 AbbVie Inc.: Product Benchmarking
Table 101 AbbVie Inc.: Strategic Outlook
Table 102 F. Hoffmann-La Roche Ltd: Key Details, (CEO, HQ, Revenue, Founded, No. of Employees, Company Type, Website, Business Segment)
Table 103 F. Hoffmann-La Roche Ltd: Product Benchmarking
Table 104 F. Hoffmann-La Roche Ltd: Strategic Outlook
Table 105 Teva Pharmaceutical Industries Ltd.: Key Details, (CEO, HQ, Revenue, Founded, No. of Employees, Company Type, Website, Business Segment)
Table 106 Teva Pharmaceutical Industries Ltd.: Product Benchmarking
Table 107 Teva Pharmaceutical Industries Ltd.: Strategic Outlook
Table 108 Apellis Pharmaceuticals: Key Details, (CEO, HQ, Revenue, Founded, No. of Employees, Company Type, Website, Business Segment)
Table 109 Apellis Pharmaceuticals: Product Benchmarking
Table 110 Apellis Pharmaceuticals: Strategic Outlook
Table 111 Novaliq GmbH: Key Details, (CEO, HQ, Revenue, Founded, No. of Employees, Company Type, Website, Business Segment)
Table 112 Novaliq GmbH.: Product Benchmarking
Table 113 Novaliq GmbH: Strategic Outlook
Table 114 Alimera Sciences: Key Details, (CEO, HQ, Revenue, Founded, No. of Employees, Company Type, Website, Business Segment)
Table 115 Alimera Sciences: Product Benchmarking
Table 116 Alimera Sciences: Strategic Outlook
Table 117 EyeBio: Key Details, (CEO, HQ, Revenue, Founded, No. of Employees, Company Type, Website, Business Segment)
Table 118 EyeBio: Product Benchmarking
Table 119 EyeBio: Strategic Outlook
Table 120 SpliceBio: Key Details, (CEO, HQ, Revenue, Founded, No. of Employees, Company Type, Website, Business Segment)
Table 121 SpliceBio: Product Benchmarking
Table 122 SpliceBio: Strategic Outlook
Table 123 Breye Therapeutics ApS: Key Details, (CEO, HQ, Revenue, Founded, No. of Employees, Company Type, Website, Business Segment)
Table 124 Breye Therapeutics ApS: Product Benchmarking
Table 125 Breye Therapeutics ApS: Strategic Outlook
図の一覧
Figure 1 Ophthalmic Drugs Market Segmentation
Figure 2 Ophthalmic Drugs Market by Type: Market Attractiveness Index
Figure 3 Ophthalmic Drugs Market Forecast by Distribution Channel: Market Attractiveness Index
Figure 4 Ophthalmic Drugs Market Forecast by Indications: Market Attractiveness Index
Figure 5 Ophthalmic Drugs Market Forecast by Route of Administration: Market Attractiveness Index
Figure 6 Ophthalmic Drugs Market Attractiveness Index by Region
Figure 7 Ophthalmic Drugs Market: Market Dynamics
Figure 8 Ophthalmic Drugs Market by Region, 2024-2034 (US$ Billion, AGR (%), CAGR (%)): “V” Shaped Recovery
Figure 9 Ophthalmic Drugs Market by Region, 2024-2034 (US$ Billion, AGR (%), CAGR (%)): “U” Shaped Recovery
Figure 10 Ophthalmic Drugs Market by Region, 2024-2034 (US$ Billion, AGR (%), CAGR (%)): “W” Shaped Recovery
Figure 11 Ophthalmic Drugs Market by Region, 2024-2034 (US$ Billion, AGR (%), CAGR (%)): “L” Shaped Recovery
Figure 12 Ophthalmic Drugs Market: Porter’s Five Forces Analysis
Figure 13 Ophthalmic Drugs Market: PEST Analysis
Figure 14 Ophthalmic Drugs Market Forecast by Type: Market Attractiveness Index
Figure 15 Ophthalmic Drugs Market Forecast by Type, 2024-2034 (US$ Billion, AGR %)
Figure 16 Ophthalmic Drugs Market Share Forecast by Type, 2024, 2029, 2034 (%)
Figure 17 Prescription Drugs Market Forecast by Region, 2023 2034 (US$ Billion)
Figure 18 Prescription Drugs Market Share Forecast by Region, 2024 & 2034 (%)
Figure 19 OTC Drugs Market Forecast by Region, 2024-2034 (US$ Billion, AGR %)
Figure 20 OTC Drugs Market Share Forecast by Region, 2024 & 2034 (%)
Figure 21 Ophthalmic Drugs Market Forecast by Distribution Channel: Market Attractiveness Index
Figure 22 Ophthalmic Drugs Market Forecast By Distribution Channel, 2024-2034 (US$ Billion, AGR %)
Figure 23 Ophthalmic Drugs Market Share Forecast by Distribution Channel, 2024, 2029, 2034 (%)
Figure 24 Hospital Pharmacies Market Forecast by Region, 2024-2034 (US$ Billion, AGR %)
Figure 25 Hospital Pharmacies Market Share Forecast by Region, 2024 & 2034 (%)
Figure 26 Drug Stores Market Forecast by Region, 2024-2034 (US$ Billion, AGR %)
Figure 27 Drug Stores Market Share Forecast by Region, 2024 & 2034 (%)
Figure 28 Online Pharmacies Market Forecast by Region, 2024-2034 (US$ Billion, AGR %)
Figure 29 Online Pharmacies Market Share Forecast by Region, 2024 & 2034 (%)
Figure 30 Ophthalmic Drugs Market Forecast by Indication: Market Attractiveness Index
Figure 31 Ophthalmic Drugs Market Forecast By Indications, 2024-2034 (US$ Billion, AGR %)
Figure 32 Ophthalmic Drugs Market Share Forecast by Indications, 2024, 2029, 2034 (%)
Figure 33 Retinal Disorders Market Forecast by Region, 2024-2034 (US$ Billion, AGR %)
Figure 34 Retinal Disorders Market Share Forecast by Region, 2024 & 2034 (%)
Figure 35 Infection/Inflammation/Allergy Market Forecast by Region, 2024-2034 (US$ Billion, AGR %)
Figure 36 Infection/Inflammation/Allergy Market Share Forecast by Region, 2024 & 2034 (%)
Figure 37 Dry Eye Market Forecast by Region, 2024-2034 (US$ Billion, AGR %)
Figure 38 Dry Eye Market Share Forecast by Region, 2024 & 2034 (%)
Figure 39 Glaucoma Market Forecast by Region, 2024-2034 (US$ Billion, AGR %)
Figure 40 Glaucoma Market Share Forecast by Region, 2024 & 2034 (%)
Figure 41 Ophthalmic Drugs Market Forecast by Route of Administration: Market Attractiveness Index
Figure 42 Ophthalmic Drugs Market Forecast by Route of Administration, 2024-2034 (US$ Billion, AGR %)
Figure 43 Ophthalmic Drugs Market Share Forecast by Route of administration, 2024, 2029, 2034 (%)
Figure 44 Topical Market Forecast by Region, 2024-2034 (US$ Billion, AGR %)
Figure 45 Topical Market Share Forecast by Region, 2024 & 2034 (%)
Figure 46 Parenteral Market Forecast by Region, 2024-2034 (US$ Billion, AGR %)
Figure 47 Parenteral Market Share Forecast by Region, 2024 & 2034 (%)
Figure 48 Ophthalmic Drugs Market Forecast by Region 2024 & 2034 (Revenue, CAGR%)
Figure 49 Ophthalmic Drugs Market Share Forecast by Region 2024, 2029, 2034(%)
Figure 50 Ophthalmic Drugs Market by Region, 2024-2034 (US$ Billion, AGR (%), CAGR (%))
Figure 51 North America Ophthalmic Drugs Market Attractiveness Index
Figure 52 North America Ophthalmic Drugs Market by Region, 2024, 2029 & 2034 (US$ Billion)
Figure 53 North America Ophthalmic Drugs Market Forecast by Country, 2024-2034 (US$ Billion, AGR %)
Figure 54 North America Ophthalmic Drugs Market Share Forecast by Country, 2024 & 2034 (%)
Figure 55 North America Ophthalmic Drugs Market Forecast by Type, 2024-2034 (US$ Billion, AGR %)
Figure 56 North America Ophthalmic Drugs Market Share Forecast by Type, 2024 & 2034 (%)
Figure 57 North America Ophthalmic Drugs Market Forecast by Distribution Channel, 2024-2034 (US$ Billion
Figure 58 North America Ophthalmic Drugs Market Share Forecast by Distribution Channel, 2024 & 2034 (%)
Figure 59 North America Ophthalmic Drugs Market Forecast by Indications, 2024-2034 (US$ Billion, AGR %)
Figure 60 North America Ophthalmic Drugs Market Share Forecast by Indications, 2024 & 2034 (%)
Figure 61 North America Ophthalmic Drugs Market Forecast by Route of Administration, 2024-2034 (US$ Billion, AGR %)
Figure 62 North America Ophthalmic Drugs Market Share Forecast by Route of Administration, 2024 & 2034 (%)
Figure 63 U.S. Ophthalmic Drugs Market Forecast, 2024-2034 (US$ Billion, AGR %)
Figure 64 Canada Ophthalmic Drugs Market Forecast, 2024-2034 (US$ Billion, AGR %)
Figure 65 Europe Ophthalmic Drugs Market Attractiveness Index
Figure 66 Europe Ophthalmic Drugs Market by Region, 2024, 2029 & 2034 (US$ Billion)
Figure 67 Europe Ophthalmic Drugs Market Forecast by Country, 2024-2034 (US$ Billion, AGR %)
Figure 68 Europe Ophthalmic Drugs Market Share Forecast by Country, 2024 & 2034 (%)
Figure 69 Europe Ophthalmic Drugs Market Forecast by Type, 2024-2034 (US$ Billion, AGR %)
Figure 70 Europe Ophthalmic Drugs Market Share Forecast by Type, 2024 & 2034 (%)
Figure 71 Europe Ophthalmic Drugs Market Forecast by Distribution Channel, 2024-2034 (US$ Billion
Figure 72 Europe Ophthalmic Drugs Market Share Forecast by Distribution Channel, 2024 & 2034 (%)
Figure 73 Europe Ophthalmic Drugs Market Forecast by Indications, 2024-2034 (US$ Billion, AGR %)
Figure 74 Europe Ophthalmic Drugs Market Share Forecast by Indications, 2024 & 2034 (%)
Figure 75 Europe Ophthalmic Drugs Market Forecast by Route of Administration, 2024-2034 (US$ Billion, AGR %)
Figure 76 Europe Ophthalmic Drugs Market Share Forecast by Route of Administration, 2024 & 2034 (%)
Figure 77 Germany Ophthalmic Drugs Market Forecast, 2024-2034 (US$ Billion, AGR %)
Figure 78 France Ophthalmic Drugs Market Forecast, 2024-2034 (US$ Billion, AGR %)
Figure 79 U.K. Ophthalmic Drugs Market Forecast, 2024-2034 (US$ Billion, AGR %)
Figure 80 Italy Ophthalmic Drugs Market Forecast, 2024-2034 (US$ Billion, AGR %)
Figure 81 Spain Ophthalmic Drugs Market Forecast, 2024-2034 (US$ Billion, AGR %)
Figure 82 Netherlands Ophthalmic Drugs Market Forecast, 2024-2034 (US$ Billion, AGR %)
Figure 83 Switzerland Ophthalmic Drugs Market Forecast, 2024-2034 (US$ Billion, AGR %)
Figure 84 Rest of Europe Ophthalmic Drugs Market Forecast, 2024-2034 (US$ Billion, AGR %)
Figure 85 Asia Pacific Ophthalmic Drugs Market Attractiveness Index
Figure 86 Asia Pacific Ophthalmic Drugs Market by Region, 2024, 2029 & 2034 (US$ Billion)
Figure 87 Asia Pacific Ophthalmic Drugs Market Forecast by Country, 2024-2034 (US$ Billion, AGR %)
Figure 88 Asia Pacific Ophthalmic Drugs Market Share Forecast by Country, 2024 & 2034 (%)
Figure 89 Asia Pacific Ophthalmic Drugs Market Forecast by Type, 2024-2034 (US$ Billion, AGR %)
Figure 90 Asia Pacific Ophthalmic Drugs Market Share Forecast by Type, 2024 & 2034 (%)
Figure 91 Asia Pacific Ophthalmic Drugs Market Forecast by Distribution Channel, 2024-2034 (US$ Billion
Figure 92 Asia Pacific Ophthalmic Drugs Market Share Forecast by Distribution Channel, 2024 & 2034 (%)
Figure 93 Asia Pacific Ophthalmic Drugs Market Forecast by Indications, 2024-2034 (US$ Billion, AGR %)
Figure 94 Asia Pacific Ophthalmic Drugs Market Share Forecast by Indications, 2024 & 2034 (%)
Figure 95 Asia Pacific Ophthalmic Drugs Market Forecast by Route of Administration, 2024-2034 (US$ Billion, AGR %)
Figure 96 Asia Pacific Ophthalmic Drugs Market Share Forecast by Route of Administration, 2024 & 2034 (%)
Figure 97 Japan Ophthalmic Drugs Market Forecast, 2024-2034 (US$ Billion, AGR %)
Figure 98 China Ophthalmic Drugs Market Forecast, 2024-2034 (US$ Billion, AGR %)
Figure 99 India Ophthalmic Drugs Market Forecast, 2024-2034 (US$ Billion, AGR %)
Figure 100 Australia Ophthalmic Drugs Market Forecast, 2024-2034 (US$ Billion, AGR %)
Figure 101 South Korea Ophthalmic Drugs Market Forecast, 2024-2034 (US$ Billion, AGR %)
Figure 102 Malaysia Ophthalmic Drugs Market Forecast, 2024-2034 (US$ Billion, AGR %)
Figure 103 Singapore Ophthalmic Drugs Market Forecast, 2024-2034 (US$ Billion, AGR %)
Figure 104 Rest of Asia Pacific Ophthalmic Drugs Market Forecast, 2024-2034 (US$ Billion, AGR %)
Figure 105 Latin America Ophthalmic Drugs Market Attractiveness Index
Figure 106 Latin America Ophthalmic Drugs Market by Region, 2024, 2029 & 2034 (US$ Billion)
Figure 107 Latin America Ophthalmic Drugs Market Forecast by Country, 2024-2034 (US$ Billion, AGR %)
Figure 108 Latin America Ophthalmic Drugs Market Share Forecast by Country, 2024 & 2034 (%)
Figure 109 Latin America Ophthalmic Drugs Market Forecast by Type, 2024-2034 (US$ Billion, AGR %)
Figure 110 Latin America Ophthalmic Drugs Market Share Forecast by Type, 2024 & 2034 (%)
Figure 111 Latin America Ophthalmic Drugs Market Forecast by Distribution Channel, 2024-2034 (US$ Billion, AGR %)
Figure 112 Latin America Ophthalmic Drugs Market Share Forecast by Distribution Channel, 2024 & 2034 (%)
Figure 113 Latin America Ophthalmic Drugs Market Forecast by Indications, 2024-2034 (US$ Billion, AGR %)
Figure 114 Latin America Ophthalmic Drugs Market Share Forecast by Indications, 2024 & 2034 (%)
Figure 115 Latin America Ophthalmic Drugs Market Forecast by Route of Administration, 2024-2034 (US$ Billion, AGR %)
Figure 116 Latin America Ophthalmic Drugs Market Share Forecast by Route of Administration, 2024 & 2034 (%
Figure 117 Brazil Ophthalmic Drugs Market Forecast, 2024-2034 (US$ Billion, AGR %)
Figure 118 Argentina Ophthalmic Drugs Market Forecast, 2024-2034 (US$ Billion, AGR %)
Figure 119 Mexico Ophthalmic Drugs Market Forecast, 2024-2034 (US$ Billion, AGR %)
Figure 120 Chile Ophthalmic Drugs Market Forecast, 2024-2034 (US$ Billion, AGR %)
Figure 121 Rest of Latin America Ophthalmic Drugs Market Forecast, 2024-2034 (US$ Billion, AGR %)
Figure 122 MEA Ophthalmic Drugs Market Attractiveness Index
Figure 123 MEA Ophthalmic Drugs Market by Region, 2024, 2029 & 2034 (US$ Billion)
Figure 124 MEA Ophthalmic Drugs Market Forecast by Country, 2024-2034 (US$ Billion, AGR %)
Figure 125 MEA Ophthalmic Drugs Market Share Forecast by Country, 2024 & 2034 (%)
Figure 126 MEA Ophthalmic Drugs Market Forecast by Type, 2024-2034 (US$ Billion, AGR %)
Figure 127 MEA Ophthalmic Drugs Market Share Forecast by Type, 2024 & 2034 (%)
Figure 128 MEA Ophthalmic Drugs Market Forecast by Distribution Channel, 2024-2034 (US$ Billion, AGR %)
Figure 129 MEA Ophthalmic Drugs Market Share Forecast by Distribution Channel, 2024 & 2034 (%)
Figure 130 MEA Ophthalmic Drugs Market Forecast by Indications, 2024-2034 (US$ Billion, AGR %)
Figure 131 MEA Ophthalmic Drugs Market Share Forecast by Indications, 2024 & 2034 (%)
Figure 132 MEA Ophthalmic Drugs Market Forecast by Route of Administration, 2024-2034 (US$ Billion, AGR %)
Figure 133 MEA Ophthalmic Drugs Market Share Forecast by Route of Administration, 2024 & 2034 (%
Figure 134 GCC Ophthalmic Drugs Market Forecast, 2024-2034 (US$ Billion, AGR %)
Figure 135 South Africa Ophthalmic Drugs Market Forecast, 2024-2034 (US$ Billion, AGR %)
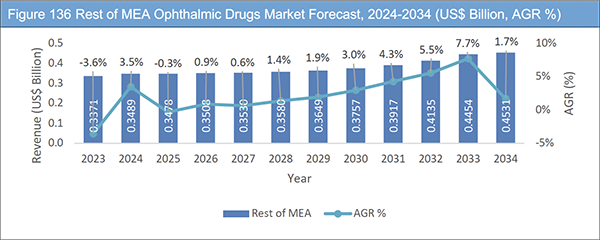
Figure 136 Rest of MEA Ophthalmic Drugs Market Forecast, 2024-2034 (US$ Billion, AGR %)
Figure 137 Ophthalmic Drugs Market: Company Share Analysis, 2023
Figure 138 Novartis AG: Net Revenue, 2018-2022 (US$ Million, AGR %)
Figure 139 Novartis AG: Regional Market Shares, 2022
Figure 140 Novartis AG: R&D Expense, 2018-2022 (US$ Million, AGR %)
Figure 141 Bayer AG: Net Revenue, 2018-2022 (US$ Million, AGR %)
Figure 142 Bayer AG: Regional Market Shares, 2022
Figure 143 Bayer AG: R&D Expense, 2018-2022 (US$ Million, AGR %)
Figure 144 Pfizer Inc.: Annual Revenue, 2018-2022 (US$ Million, AGR %)
Figure 145 Pfizer Inc.: Regional Market Shares, 2022
Figure 146 Pfizer Inc.: R&D Expense, 2018-2022 (US$ Million, AGR %)
Figure 147 Bausch & Lomb Incorporated: Annual Revenue, 2018-2022 (US$ Million, AGR %)
Figure 148 Bausch & Lomb Incorporated: R&D Expense, 2018-2022 (US$ Million, AGR %)
Figure 149 Santen Pharmaceutical Co., Ltd.: Annual Revenue, 2018-2022 (US$ Million, AGR %)
Figure 150 Santen Pharmaceutical Co., Ltd.: R&D Expense, 2018-2022 (US$ Million, AGR %)
Figure 151 Johnson & Johnson Services Inc.: Annual Revenue, 2018-2022 (US$ Million, AGR %)
Figure 152 Johnson & Johnson Private Limited: Regional Market Shares, 2022
Figure 153 Johnson & Johnson Private Limited: R&D Expense, 2018-2022 (US$ Million, AGR %)
Figure 154 Regeneron Pharmaceuticals Inc.: Annual Revenue, 2018-2022 (US$ Million, AGR %)
Figure 155 Regeneron Pharmaceuticals Inc: R&D Expense, 2018-2022 (US$ Million, AGR %)
Figure 156 AbbVie Inc.: Annual Revenue, 2018-2022 (US$ Million, AGR %)
Figure 157 AbbVie Inc.: Regional Market Shares, 2022
Figure 158 AbbVie Inc.: R&D Expense, 2018-2022 (US$ Million, AGR %)
Figure 159 F. Hoffmann-La Roche Ltd: Annual Revenue, 2018-2022 (US$ Million, AGR %)
Figure 160 F. Hoffmann-La Roche Ltd.: Regional Market Shares, 2022
Figure 161 F. Hoffmann-La Roche Ltd: R&D Expense, 2018-2022 (US$ Million, AGR %)
Figure 162 Teva Pharmaceutical Industries Ltd.: Annual Revenue, 2018-2022 (US$ Million, AGR%)
Figure 163 Teva Pharmaceutical Industries Ltd: Regional Market Shares, 2022
Figure 164 Teva Pharmaceutical Industries Ltd.: R&D Expense, 2018-2022 (US$ Million, AGR %)
Figure 165 Apellis Pharmaceuticals: Annual Revenue, 2018-2022 (US$ Million, AGR %)
Figure 166 Apellis Pharmaceuticals: R&D Expense, 2018-2022 (US$ Million, AGR %)
Figure 167 Alimera Sciences: Annual Revenue, 2018-2022 (US$ Million, AGR %)
Figure 168 Alimera Sciences: R&D Expense, 2018-2022 (US$ Million, AGR %)
ページTOPに戻る
Summary
Report Details
The Ophthalmic Drugs Market Report 2024-2034: This report will prove invaluable to leading firms striving for new revenue pockets if they wish to better understand the industry and its underlying dynamics. It will be useful for companies that would like to expand into different industries or to expand their existing operations in a new region.
The global ophthalmic drugs market is experiencing substantial growth, and this can be attributed to several key factors. The increasing prevalence of ophthalmic disorders, including conditions like glaucoma, macular degeneration, diabetic retinopathy, and dry eye syndrome, is driving the demand for more effective pharmaceutical treatments. As the world’s population ages and lifestyles evolve, the incidence of these eye-related disorders continues to rise, creating a sustained need for innovative drugs to address them.
The presence of a robust emerging pipeline of drugs is contributing significantly to market growth. Pharmaceutical companies are actively investing in research and development efforts to develop new and improved ophthalmic medications. These pipeline drugs hold the promise of enhanced therapeutic options and more targeted treatments, further fueling the market’s expansion. Together, these factors underscore the dynamic and evolving nature of the global ophthalmic drugs market, which is poised for continued growth in the foreseeable future.
Side Effects of Drugs Likely to Challenge Industry Growth
The utilization of topical drugs can result in various side effects, encompassing temporary vision cloudiness, allergic responses, visual disruptions, and sensations of stinging, burning, or itching. Additionally, more infrequent side effects encompass sudden alterations in vision, severe headaches, tunnel vision, eye discomfort, pain behind the eyes, and indications of potential new eye infections, such as swelling and drainage. Consequently, the presence of these side effects linked to topical steroidal drugs has the potential to impede market growth.
The challenge posed to the ophthalmic drugs market in developing nations by drug side effects is a complex issue. Resolving this concern demands a holistic approach that encompasses various measures, such as enhancing healthcare accessibility, improving medical infrastructure, fostering patient education, countering counterfeit drug proliferation, and establishing stringent regulatory frameworks to uphold the safety and effectiveness of ophthalmic medications.
What Questions Should You Ask before Buying a Market Research Report?
• How is the ophthalmic drugs market evolving?
• What is driving and restraining the ophthalmic drugs market?
• How will each ophthalmic drugs submarket segment grow over the forecast period and how much revenue will these submarkets account for in 2034?
• How will the market shares for each ophthalmic drugs submarket develop from 2024 to 2034?
• What will be the main driver for the overall market from 2024 to 2034?
• Will leading ophthalmic drugs markets broadly follow the macroeconomic dynamics, or will individual national markets outperform others?
• How will the market shares of the national markets change by 2034 and which geographical region will lead the market in 2034?
• Who are the leading players and what are their prospects over the forecast period?
• How will the industry evolve during the period between 2024 and 2034? What are the implications of ophthalmic drugs projects taking place now and over the next 10 years?
• Is there a greater need for product commercialisation to further scale the ophthalmic drugs market?
• Where is the ophthalmic drugs market heading and how can you ensure you are at the forefront of the market?
• What are the best investment options for new product and service lines?
• What are the key prospects for moving companies into a new growth path and C-suite?
You need to discover how this will impact the Ophthalmic Drugs Market today, and over the next 10 years:
• Our 284-page report provides 125 tables, 168 charts/graphs exclusively to you.
• The report highlights key lucrative areas in the industry so you can target them – NOW.
• It contains in-depth analysis of global, regional and national sales and growth.
• It highlights for you the key successful trends, changes and revenue projections made by your competitors.
This report tells you TODAY how the Ophthalmic Drugs Market will develop in the next 10 years, and in line with the variations in COVID-19 economic recession and bounce. This market is more critical now than at any point over the last 10 years.
Forecasts to 2034 and other analyses reveal commercial prospects
• In addition to revenue forecasting to 2034, our new study provides you with recent results, growth rates, and market shares.
• You will find original analyses, with business outlooks and developments.
• Discover qualitative analyses (including market dynamics, drivers, opportunities, restraints and challenges), cost structure, impact of rising ophthalmic drugs prices and recent developments.
This report includes data analysis and invaluable insight into how COVID-19 will affect the industry and your company. Four COVID-19 recovery patterns and their impact, namely, “V”, “L”, “W” and “U” are discussed in this report.
Segments Covered in the Report
Type
• Prescription Drugs
• OTC Drugs
Indication
• Retinal Disorders
• Infection/Inflammation/Allergy
• Glaucoma
• Dry Eye
Route of Administration
• Topical
• Parenteral
Distribution Channel
• Hospital Pharmacies
• Drug Stores
• Online Pharmacies
In addition to the revenue predictions for the overall world market and segments, you will also find revenue forecasts for five regional and 26 leading national markets:
North America
• U.S.
• Canada
Europe
• Germany
• Spain
• UK
• France
• Italy
• Netherlands
• Switzerland
• Rest of Europe
Asia Pacific
• China
• Japan
• India
• Australia
• South Korea
• Malaysia
• Singapore
• Rest of Asia Pacific
Latin America
• Brazil
• Argentina
• Mexico
• Chile
• Rest of Latin America
MEA
• GCC
• South Africa
• Rest of MEA
The report also includes profiles and for some of the leading companies in the Ophthalmic Drugs Market, 2024 to 2034, with a focus on this segment of these companies’ operations.
Leading companies and the potential for market growth
• AbbVie Inc.
• Alimera Sciences
• Apellis Pharmaceuticals
• Bausch & Lomb Incorporated
• Bayer AG
• Breye Therapeutics ApS
• EyeBio
• F. Hoffmann-La Roche Ltd.
• Johnson & Johnson Services Inc.
• Novaliq GmbH
• Novartis AG
• Pfizer Inc.
• Regeneron Pharmaceuticals Inc.
• Santen Pharmaceutical Co., Ltd.
• SpliceBio
• Teva Pharmaceutical Industries Ltd.
Overall world revenue for ophthalmic drugs market, 2024 to 2034 in terms of value the market will surpass US$32.0 billion in 2024, our work calculates. We predict strong revenue growth through to 2034. Our work identifies which organizations hold the greatest potential. Discover their capabilities, progress, and commercial prospects, helping you stay ahead.
How will the Ophthalmic Drugs Market, 2024 to 2034 report help you?
In summary, our 280+ page report provides you with the following knowledge:
• Revenue forecasts to 2034 for Ophthalmic Drugs Market, 2024 to 2034 Market, with forecasts for type, distribution channel, indication, route of administration, each forecast at a global and regional level – discover the industry’s prospects, finding the most lucrative places for investments and revenues.
• Revenue forecasts to 2034 for five regional and 26 key national markets – See forecasts for the Ophthalmic Drugs Market, 2024 to 2034 market in North America, Europe, Asia-Pacific, Latin America and MEA. Also forecasted is the market in the US, Canada, Mexico, Brazil, Germany, France, UK, Italy, China, India, Japan, and Australia among other prominent economies.
• Prospects for established firms and those seeking to enter the market – including company profiles for 16 of the major companies involved in the Ophthalmic Drugs Market, 2024 to 2034.
Find quantitative and qualitative analyses with independent predictions. Receive information that only our report contains, staying informed with invaluable business intelligence.
Information found nowhere else
With our new report, you are less likely to fall behind in knowledge or miss out on opportunities. See how our work could benefit your research, analyses, and decisions. Visiongain’s study is for everybody needing commercial analyses for the Ophthalmic Drugs Market, 2024 to 2034, market-leading companies. You will find data, trends and predictions.
ページTOPに戻る
Table of Contents
Table of Contents
1 Report Overview
1.1 Objectives of the Study
1.2 Introduction to Ophthalmic Drugs Market
1.3 What This Report Delivers
1.4 Why You Should Read This Report
1.5 Key Questions Answered by This Analytical Report
1.6 Who is This Report for?
1.7 Methodology
1.7.1 Market Definitions
1.7.2 Market Evaluation & Forecasting Methodology
1.7.3 Data Validation
1.7.3.1 Primary Research
1.7.3.2 Secondary Research
1.8 Frequently Asked Questions (FAQs)
1.9 Associated Visiongain Reports
1.10 About Visiongain
2 Executive Summary
3 Market Overview
3.1 Key Findings
3.2 Market Dynamics
3.2.1 Market Driving Factors
3.2.1.1 Rising Frequency and Occurrence of Eye-related Conditions
3.2.1.2 Increasing Prevalence of Diabetes
3.2.1.3 Presence of Strong Emerging Pipeline Drugs
3.2.2 Market Restraining Factors
3.2.2.1 Lack of Health Insurance in the Developing Countries
3.2.2.2 Lack of Awareness Regarding the Available Treatment Options
3.2.2.3 Side Effects of Drugs
3.2.2.4 Patent Expiry of Blockbuster Drugs
3.2.3 Market Opportunities
3.2.3.1 Rise in Investment in Research and Development
3.2.3.2 Rise in Geriatric Population
3.3 COVID-19 Impact Analysis
3.4 Porter’s Five Forces Analysis
3.4.1 Bargaining Power of Suppliers
3.4.2 Bargaining Power of Buyers
3.4.3 Competitive Rivalry
3.4.4 Threat from Substitutes
3.4.5 Threat of New Entrants
3.5 PEST Analysis
3.5.1 Political
3.5.2 Economical
3.5.3 Social
3.5.4 Technological
4 Ophthalmic Drugs Market Analysis by Type
4.1 Key Findings
4.2 Type Segment: Market Attractiveness Index
4.3 Ophthalmic Drugs Market Size Estimation and Forecast by Type
4.4 Prescription Drugs
4.4.1 Market Size by Region, 2024-2034 (US$ Billion)
4.4.2 Market Share by Region, 2024 & 2034 (%)
4.5 OTC Drugs
4.5.1 Market Size by Region, 2024-2034 (US$ Billion)
4.5.2 Market Share by Region, 2024 & 2034 (%)
5 Ophthalmic Drugs Market Analysis by Distribution Channel
5.1 Key Findings
5.2 Distribution Channel Segment: Market Attractiveness Index
5.3 Ophthalmic Drugs Market Size Estimation and Forecast by Distribution Channel
5.4 Hospital Pharmacies
5.4.1 Market Size by Region, 2024-2034 (US$ Billion)
5.4.2 Market Share by Region, 2024 & 2034 (%)
5.5 Drug Stores
5.5.1 Market Size by Region, 2024-2034 (US$ Billion)
5.5.2 Market Share by Region, 2024 & 2034 (%)
5.6 Online Pharmacies
5.6.1 Market Size by Region, 2024-2034 (US$ Billion)
5.6.2 Market Share by Region, 2024 & 2034 (%)
6 Ophthalmic Drugs Market Analysis by Indication
6.1 Key Findings
6.2 Indication Segment: Market Attractiveness Index
6.3 Ophthalmic Drugs Market Size Estimation and Forecast by Indications
6.4 Retinal Disorders
6.4.1 Market Size by Region, 2024-2034 (US$ Billion)
6.4.2 Market Share by Region, 2024 & 2034 (%)
6.4.3 Retinal Disorders Market Size by Drugs, 2024-2034 (US$ Billion)
6.5 Infection/Inflammation/Allergy
6.5.1 Market Size by Region, 2024-2034 (US$ Billion)
6.5.2 Market Share by Region, 2024 & 2034 (%)
6.5.3 Infection/Inflammation/Allergy Market Size by Drugs, 2024-2034 (US$ Billion)
6.6 Dry Eye
6.6.1 Market Size by Region, 2024-2034 (US$ Billion)
6.6.2 Market Share by Region, 2024 & 2034 (%)
6.6.3 Dry Eye Market Size by Drugs, 2024-2034 (US$ Billion)
6.7 Glaucoma
6.7.1 Market Size by Region, 2024-2034 (US$ Billion)
6.7.2 Market Share by Region, 2024 & 2034 (%)
6.7.3 Glaucoma Market Size by Drugs, 2024-2034 (US$ Billion)
7 Ophthalmic Drugs Market Analysis by Route of Administration
7.1 Key Findings
7.2 Route of Administration Segment: Market Attractiveness Index
7.3 Ophthalmic Drugs Market Size Estimation and Forecast by Route of Administration
7.4 Topical
7.4.1 Market Size by Region, 2024-2034 (US$ Billion)
7.4.2 Market Share by Region, 2024 & 2034 (%)
7.5 Parenteral
7.5.1 Market Size by Region, 2024-2034 (US$ Billion)
7.5.2 Market Share by Region, 2024 & 2034 (%)
8 Ophthalmic Drugs Market Analysis by Region
8.1 Key Findings
8.2 Regional Market Size Estimation and Forecast
9 North America Ophthalmic Drugs Market Analysis
9.1 Key Findings
9.2 North America Ophthalmic Drugs Market Attractiveness Index
9.3 North America Ophthalmic Drugs Market by Country, 2024, 2029 & 2034 (US$ Billion)
9.4 North America Ophthalmic Drugs Market Size Estimation and Forecast by Country
9.5 North America Ophthalmic Drugs Market Size Estimation and Forecast by Type
9.6 North America Ophthalmic Drugs Market Size Estimation and Forecast by Distribution channel
9.7 North America Ophthalmic Drugs Market Size Estimation and Forecast by Indications
9.8 North America Ophthalmic Drugs Market Size Estimation and Forecast by Route of Administration
9.9 U.S. Ophthalmic Drugs Market Analysis
9.10 Canada Ophthalmic Drugs Market Analysis
10 Europe Ophthalmic Drugs Market Analysis
10.1 Key Findings
10.2 Europe Ophthalmic Drugs Market Attractiveness Index
10.3 Europe Ophthalmic Drugs Market by Country, 2024, 2029 & 2034 (US$ Billion)
10.4 Europe Ophthalmic Drugs Market Size Estimation and Forecast by Country
10.5 Europe Ophthalmic Drugs Market Size Estimation and Forecast by Type
10.6 Europe Ophthalmic Drugs Market Size Estimation and Forecast by Distribution Channel
10.7 Europe Ophthalmic Drugs Market Size Estimation and Forecast by Indications
10.8 Europe Ophthalmic Drugs Market Size Estimation and Forecast by Route of Administration
10.9 Germany Ophthalmic Drugs Market Analysis
10.10 France Ophthalmic Drugs Market Analysis
10.11 UK Ophthalmic Drugs Market Analysis
10.12 Italy Ophthalmic Drugs Market Analysis
10.13 Spain Ophthalmic Drugs Market Analysis
10.14 Netherlands Ophthalmic Drugs Market Analysis
10.15 Switzerland Ophthalmic Drugs Market Analysis
10.16 Rest of Europe Ophthalmic Drugs Market Analysis
11 Asia Pacific Ophthalmic Drugs Market Analysis
11.1 Key Findings
11.2 Asia Pacific Ophthalmic Drugs Market Attractiveness Index
11.3 Asia Pacific Ophthalmic Drugs Market by Country, 2024, 2029 & 2034 (US$ Billion)
11.4 Asia Pacific Ophthalmic Drugs Market Size Estimation and Forecast by Country
11.5 Asia Pacific Ophthalmic Drugs Market Size Estimation and Forecast by Type
11.6 Asia Pacific Ophthalmic Drugs Market Size Estimation and Forecast by Distribution Channel
11.7 Asia Pacific Ophthalmic Drugs Market Size Estimation and Forecast by Indications
11.8 Asia Pacific Ophthalmic Drugs Market Size Estimation and Forecast by Route of Administration
11.9 Japan Ophthalmic Drugs Market Analysis
11.10 China Ophthalmic Drugs Market Analysis
11.11 India Ophthalmic Drugs Market Analysis
11.12 Australia Ophthalmic Drugs Market Analysis
11.13 South Korea Ophthalmic Drugs Market Analysis
11.14 Malaysia Ophthalmic Drugs Market Analysis
11.15 Singapore Ophthalmic Drugs Market Analysis
11.16 Rest of Asia Pacific Ophthalmic Drugs Market Analysis
12 Latin America Ophthalmic Drugs Market Analysis
12.1 Key Findings
12.2 Latin America Ophthalmic Drugs Market Attractiveness Index
12.3 Latin America Ophthalmic Drugs Market by Country, 2024, 2029 & 2034 (US$ Billion)
12.4 Latin America Ophthalmic Drugs Market Size Estimation and Forecast by Country
12.5 Latin America Ophthalmic Drugs Market Size Estimation and Forecast by Type
12.6 Latin America Ophthalmic Drugs Market Size Estimation and Forecast by Distribution Channel
12.7 Latin America Ophthalmic Drugs Market Size Estimation and Forecast by Indications
12.8 Latin America Ophthalmic Drugs Market Size Estimation and Forecast by Route of Administration
12.9 Brazil Ophthalmic Drugs Market Analysis
12.10 Argentina Ophthalmic Drugs Market Analysis
12.11 Mexico Ophthalmic Drugs Market Analysis
12.12 Chile Ophthalmic Drugs Market Analysis
12.13 Rest of Latin America Ophthalmic Drugs Market Analysis
13 MEA Ophthalmic Drugs Market Analysis
13.1 Key Findings
13.2 MEA Ophthalmic Drugs Market Attractiveness Index
13.3 MEA Ophthalmic Drugs Market by Country, 2024, 2029 & 2034 (US$ Billion)
13.4 MEA Ophthalmic Drugs Market Size Estimation and Forecast by Country
13.5 MEA Ophthalmic Drugs Market Size Estimation and Forecast by Type
13.6 MEA Ophthalmic Drugs Market Size Estimation and Forecast by Distribution Channel
13.7 MEA Ophthalmic Drugs Market Size Estimation and Forecast by Indications
13.8 MEA Ophthalmic Drugs Market Size Estimation and Forecast by Route of Administration
13.9 GCC Ophthalmic Drugs Market Analysis
13.10 South Africa Ophthalmic Drugs Market Analysis
13.11 Rest of MEA Ophthalmic Drugs Market Analysis
14 Company Profiles
14.1 Competitive Landscape, 2023
14.2 Strategic Outlook
14.3 Novartis AG
14.3.1 Company Snapshot
14.3.2 Company Overview
14.3.3 Financial Analysis
14.3.3.1 Net Revenue, 2018-2022
14.3.3.2 Regional Market Shares, 2022
14.3.3.3 R&D Expense, 2018-2022
14.3.4 Product Offered
14.3.5 Strategic Outlook
14.4 Bayer AG
14.4.1 Company Snapshot
14.4.2 Company Overview
14.4.3 Financial Analysis
14.4.3.1 Net Revenue, 2018-2022
14.4.3.2 Regional Market Shares, 2022
14.4.3.3 R&D Expense, 2018-2022
14.4.4 Product Benchmarking
14.4.5 Strategic Outlook
14.5 Pfizer Inc.
14.5.1 Company Snapshot
14.5.2 Company Overview
14.5.3 Financial Analysis
14.5.3.1 Revenue, 2018-2022
14.5.3.2 Regional Market Shares, 2022
14.5.3.3 R&D Expense, 2018-2022
14.5.4 Product Benchmarking
14.6 Bausch & Lomb Incorporated
14.6.1 Company Snapshot
14.6.2 Company Overview
14.6.3 Financial Analysis
14.6.3.1 Revenue, 2018-2022
14.6.3.2 R&D Expense, 2018-2022
14.6.4 Product Benchmarking
14.6.5 Strategic Outlook
14.7 Santen Pharmaceutical Co., Ltd.
14.7.1 Company Snapshot
14.7.2 Company Overview
14.7.3 Financial Analysis
14.7.3.1 Revenue, 2018-2022
14.7.3.2 R&D Expense, 2018-2022
14.7.4 Product Benchmarking
14.7.5 Strategic Outlook
14.8 Johnson & Johnson Services Inc.
14.8.1 Company Snapshot
14.8.2 Company Overview
14.8.3 Financial Analysis
14.8.3.1 Revenue, 2018-2022
14.8.3.2 Regional Market Shares, 2022
14.8.3.3 R&D Expense, 2018-2022
14.8.4 Product Benchmarking
14.8.5 Strategic Outlook
14.9 Regeneron Pharmaceuticals Inc.
14.9.1 Company Snapshot
14.9.2 Company Overview
14.9.3 Financial Analysis
14.9.3.1 Revenue, 2018-2022
14.9.3.2 R&D Expense, 2018-2022
14.9.4 Product Benchmarking
14.9.5 Strategic Outlook
14.10 AbbVie Inc.
14.10.1 Company Snapshot
14.10.2 Company Overview
14.10.3 Financial Analysis
14.10.3.1 Revenue, 2018-2022
14.10.3.2 Regional Market Shares, 2022
14.10.3.3 R&D Expense, 2018-2022
14.10.4 Product Benchmarking
14.10.5 Strategic Outlook
14.11 F. Hoffmann-La Roche Ltd
14.11.1 Company Snapshot
14.11.2 Company Overview
14.11.3 Financial Analysis
14.11.3.1 Revenue, 2018-2022
14.11.3.2 Regional Market Shares, 2022
14.11.3.3 R&D Expense, 2018-2022
14.11.4 Product Benchmarking
14.11.5 Strategic Outlook
14.12 Teva Pharmaceutical Industries Ltd.
14.12.1 Company Snapshot
14.12.2 Company Overview
14.12.3 Financial Analysis
14.12.3.1 Revenue, 2018-2022
14.12.3.2 Regional Market Shares, 2022
14.12.3.3 R&D Expense, 2018-2022
14.12.4 Product Benchmarking
14.12.5 Strategic Outlook
14.13 Apellis Pharmaceuticals
14.13.1 Company Snapshot
14.13.2 Company Overview
14.13.3 Financial Analysis
14.13.3.1 Revenue, 2018-2022
14.13.3.2 R&D Expense, 2018-2022
14.13.4 Product Benchmarking
14.13.5 Strategic Outlook
14.14 Novaliq GmbH
14.14.1 Company Snapshot
14.14.2 Company Overview
14.14.3 Product Benchmarking
14.14.4 Strategic Outlook
14.15 Alimera Sciences
14.15.1 Company Snapshot
14.15.2 Company Overview
14.15.3 Financial Analysis
14.15.3.1 Revenue, 2018-2022
14.15.3.2 R&D Expense, 2018-2022
14.15.4 Product Benchmarking
14.15.5 Strategic Outlook
14.16 EyeBio
14.16.1 Company Snapshot
14.16.2 Company Overview
14.16.3 Product Benchmarking
14.16.4 Strategic Outlook
14.17 SpliceBio
14.17.1 Company Snapshot
14.17.2 Company Overview
14.17.3 Product Benchmarking
14.17.4 Strategic Outlook
14.18 Breye Therapeutics ApS
14.18.1 Company Snapshot
14.18.2 Company Overview
14.18.3 Product Benchmarking
14.18.4 Strategic Outlook
15 Conclusion and Recommendations
15.1 Concluding Remarks from Visiongain
15.2 Recommendations for Market Players
ページTOPに戻る
List of Tables/Graphs
List of Tables
Table 1 Ophthalmic Drugs Market Snapshot, 2024 & 2034 (US$ billion, CAGR %)
Table 2 Ophthalmic Drugs Market, Product Pipeline
Table 3 Ophthalmic Drugs Contract Manufacturing Market Forecast by Region 2024-2034 (US$ Billion, AGR%, CAGR%): "V" Shaped Recovery
Table 4 Ophthalmic Drugs Contract Manufacturing Market Forecast by Region 2024-2034 (US$ Billion, AGR%, CAGR%): "U" Shaped Recovery
Table 5 Ophthalmic Drugs Contract Manufacturing Market Forecast by Region 2024-2034 (US$ Billion, AGR%, CAGR%): "W" Shaped Recovery
Table 6 Ophthalmic Drugs Contract Manufacturing Market Forecast by Region 2024-2034 (US$ Billion, AGR%, CAGR%): "L" Shaped Recovery
Table 7 Ophthalmic Drugs Market Forecast by Type, 2024-2034 (US$ Billion, AGR%, CAGR%)
Table 8 Prescription Drugs Segment Market Forecast by Region, 2024-2034 (US$ Billion, AGR%, CAGR%)
Table 9 OTC Drugs Segment Market Forecast by Region, 2024-2034 (US$ Billion, AGR%, CAGR%)
Table 10 Ophthalmic Drugs Market Forecast by Distribution Channel, 2024-2034 (US$ Billion, AGR%, CAGR%)
Table 11 Hospital Pharmacies Segment Market Forecast by Region, 2024-2034 (US$ Billion, AGR%, CAGR%)
Table 12 Drug Stores Segment Market Forecast by Region, 2024-2034 (US$ Billion, AGR%, CAGR%)
Table 13 Online Pharmacies Segment Market Forecast by Region, 2024-2034 (US$ Billion, AGR%, CAGR%)
Table 14 Ophthalmic Drugs Market Forecast by Indications, 2024-2034 (US$ Billion, AGR%, CAGR%)
Table 15 Retinal Disorders Segment Market Forecast by Region, 2024-2034 (US$ Billion, AGR%, CAGR%)
Table 16 Retinal Disorders in Ophthalmic Drugs Market Forecast by Indications, 2024-2034 (US$ Billion, AGR%, CAGR%)
Table 17 Infection/Inflammation/Allergy Segment Market Forecast by Region, 2024-2034 (US$ Billion, AGR%, CAGR%)
Table 18 Infection/Inflammation/Allergy in Ophthalmic Drugs Market Forecast by Indications, 2024-2034 (US$ Billion, AGR%, CAGR%)
Table 19 Dry Eye Segment Market Forecast by Region, 2024-2034 (US$ Billion, AGR%, CAGR%)
Table 20 Dry Eye in Ophthalmic Drugs Market Forecast by Indications, 2024-2034 (US$ Billion, AGR%, CAGR%)
Table 21 Glaucoma Segment Market Forecast by Region, 2024-2034 (US$ Billion, AGR%, CAGR%)
Table 22 Glaucoma in Ophthalmic Drugs Market Forecast by Indications, 2024-2034 (US$ Billion, AGR%, CAGR%)
Table 23 Ophthalmic Drugs Market Forecast by Route of Administration, 2024-2034 (US$ Billion, AGR%, CAGR%)
Table 24 Topical Segment Market Forecast by Region, 2024-2034 (US$ Billion, AGR%, CAGR%)
Table 25 Parenteral Segment Market Forecast by Region, 2024-2034 (US$ Billion, AGR%, CAGR%)
Table 26 Ophthalmic Drugs Market Forecast by Region 2024-2034 (US$ Billion, AGR%, CAGR%)
Table 27 North America Ophthalmic Drugs Market Forecast by Country, 2024-2034 (US$ Billion, AGR%, CAGR%)
Table 28 North America Ophthalmic Drugs Market Forecast by Type, 2024-2034 (US$ Billion, AGR%, CAGR%)
Table 29 North America Ophthalmic Drugs Market Forecast by Distribution Channel, 2024-2034 (US$ Billion, AGR%, CAGR%)
Table 30 North America Ophthalmic Drugs Market Forecast by Indications, 2024-2034 (US$ Billion, AGR%, CAGR%)
Table 31 North America Ophthalmic Drugs Market Forecast by Route of Administration, 2024-2034 (US$ Billion, AGR%, CAGR%)
Table 32 U.S. Ophthalmic Drugs Market Forecast by Country, 2024-2034 (US$ Billion, AGR%, CAGR%)
Table 33 Canada Ophthalmic Drugs Market Forecast by Country, 2024-2034 (US$ Billion, AGR%, CAGR%)
Table 34 Europe Ophthalmic Drugs Market Forecast by Country, 2024-2034 (US$ Billion, AGR%, CAGR%)
Table 35 Europe Ophthalmic Drugs Market Forecast by Type, 2024-2034 (US$ Billion, AGR%, CAGR%)
Table 36 Europe Ophthalmic Drugs Market Forecast by Distribution Channel, 2024-2034 (US$ Billion, AGR%, CAGR%)
Table 37 Europe Ophthalmic Drugs Market Forecast by Indications, 2024-2034 (US$ Billion, AGR%, CAGR%)
Table 38 Europe Ophthalmic Drugs Market Forecast by Route of Administration, 2024-2034 (US$ Billion, AGR%, CAGR%)
Table 39 Germany Ophthalmic Drugs Market Forecast by Country, 2024-2034 (US$ Billion, AGR%, CAGR%)
Table 40 France Ophthalmic Drugs Market Forecast, 2024-2034 (US$ Billion, AGR%, CAGR%)
Table 41 UK Ophthalmic Drugs Market Forecast, 2024-2034 (US$ Billion, AGR%, CAGR%)
Table 42 Italy Ophthalmic Drugs Market Forecast, 2024-2034 (US$ Billion, AGR%, CAGR%)
Table 43 Spain Ophthalmic Drugs Market Forecast, 2024-2034 (US$ Billion, AGR%, CAGR%)
Table 44 Netherlands Ophthalmic Drugs Market Forecast, 2024-2034 (US$ Billion, AGR%, CAGR%)
Table 45 Switzerland Ophthalmic Drugs Market Forecast, 2024-2034 (US$ Billion, AGR%, CAGR%)
Table 46 Rest of Europe Ophthalmic Drugs Market Forecast, 2024-2034 (US$ Billion, AGR%, CAGR%)
Table 47 Asia Pacific Ophthalmic Drugs Market Forecast by Country, 2024-2034 (US$ Billion, AGR%, CAGR%)
Table 48 Asia Pacific Ophthalmic Drugs Market Forecast by Type, 2024-2034 (US$ Billion, AGR%, CAGR%)
Table 49 Asia Pacific Ophthalmic Drugs Market Forecast by Distribution Channel, 2024-2034 (US$ Billion, AGR%, CAGR%)
Table 50 Asia Pacific Ophthalmic Drugs Market Forecast by Indications, 2024-2034 (US$ Billion, AGR%, CAGR%)
Table 51 Asia Pacific Ophthalmic Drugs Market Forecast by Route of Administration, 2024-2034 (US$ Billion, AGR%, CAGR%)
Table 52 Japan Ophthalmic Drugs Market Forecast, 2024-2034 (US$ Billion, AGR%, CAGR%)
Table 53 China Ophthalmic Drugs Market Forecast, 2024-2034 (US$ Billion, AGR%, CAGR%)
Table 54 India Ophthalmic Drugs Market Forecast, 2024-2034 (US$ Billion, AGR%, CAGR%)
Table 55 Australia Ophthalmic Drugs Market Forecast, 2024-2034 (US$ Billion, AGR%, CAGR%)
Table 56 South Korea Ophthalmic Drugs Market Forecast, 2024-2034 (US$ Billion, AGR%, CAGR%)
Table 57 Malaysia Ophthalmic Drugs Market Forecast, 2024-2034 (US$ Billion, AGR%, CAGR%)
Table 58 Singapore Ophthalmic Drugs Market Forecast, 2024-2034 (US$ Billion, AGR%, CAGR%)
Table 59 Asia-Pacific Ophthalmic Drugs Market Forecast, 2024-2034 (US$ Billion, AGR%, CAGR%)
Table 60 Latin America Ophthalmic Drugs Market Forecast by Country, 2024-2034 (US$ Billion, AGR%, CAGR%)
Table 61 Latin America Ophthalmic Drugs Market Forecast by Type, 2024-2034 (US$ Billion, AGR%, CAGR%)
Table 62 Latin America Ophthalmic Drugs Market Forecast by Distribution Channel, 2024-2034 (US$ Billion, AGR%, CAGR%)
Table 63 Latin America Ophthalmic Drugs Market Forecast by Indications, 2024-2034 (US$ Billion, AGR%, CAGR%)
Table 64 Latin America Ophthalmic Drugs Market Forecast by Route of Administration, 2024-2034 (US$ Billion, AGR%, CAGR%)
Table 65 Brazil Ophthalmic Drugs Market Forecast, 2024-2034 (US$ Billion, AGR%, CAGR%)
Table 66 Argentina Ophthalmic Drugs Market Forecast, 2024-2034 (US$ Billion, AGR%, CAGR%)
Table 67 Mexico Ophthalmic Drugs Market Forecast, 2024-2034 (US$ Billion, AGR%, CAGR%)
Table 68 Chile Ophthalmic Drugs Market Forecast, 2024-2034 (US$ Billion, AGR%, CAGR%)
Table 69 Rest of Latin America Ophthalmic Drugs Market Forecast, 2024-2034 (US$ Billion, AGR%, CAGR%)
Table 70 MEA Ophthalmic Drugs Market Forecast by Country, 2024-2034 (US$ Billion, AGR%, CAGR%)
Table 71 MEA Ophthalmic Drugs Market Forecast by Type, 2024-2034 (US$ Billion, AGR%, CAGR%)
Table 72 MEA Ophthalmic Drugs Market Forecast by Distribution Channel, 2024-2034 (US$ Billion, AGR%, CAGR%)
Table 73 MEA Ophthalmic Drugs Market Forecast by Indications, 2024-2034 (US$ Billion, AGR%, CAGR%)
Table 74 MEA Ophthalmic Drugs Market Forecast by Route of Administration, 2024-2034 (US$ Billion, AGR%, CAGR%)
Table 75 GCC Ophthalmic Drugs Market Forecast, 2024-2034 (US$ Billion, AGR%, CAGR%)
Table 76 South Africa Ophthalmic Drugs Market Forecast, 2024-2034 (US$ Billion, AGR%, CAGR%)
Table 77 Rest of MEA Ophthalmic Drugs Market Forecast, 2024-2034 (US$ Billion, AGR%, CAGR%)
Table 78 Strategic Outlook
Table 79 Novartis AG: Key Details, (CEO, HQ, Revenue, Founded, No. of Employees, Company Type, Website, Business Segment)
Table 80 Novartis AG: Product Benchmarking
Table 81 Novartis AG: Strategic Outlook
Table 82 Bayer AG: Key Details, (CEO, HQ, Revenue, Founded, No. of Employees, Company Type, Website, Business Segment)
Table 83 Bayer AG: Product Benchmarking
Table 84 Bayer AG: Strategic Outlook
Table 85 Pfizer Inc.: Key Details, (CEO, HQ, Revenue, Founded, No. of Employees, Company Type, Website, Business Segment)
Table 86 Pfizer Inc.: Product Benchmarking
Table 87 Bausch & Lomb Incorporated: Key Details, (CEO, HQ, Revenue, Founded, No. of Employees, Company Type, Website, Business Segment)
Table 88 Bausch & Lomb Incorporated: Product Benchmarking
Table 89 Bausch & Lomb Incorporated: Strategic Outlook
Table 90 Santen Pharmaceutical Co., Ltd.: Key Details, (CEO, HQ, Revenue, Founded, No. of Employees, Company Type, Website, Business Segment)
Table 91 Santen Pharmaceutical Co., Ltd.: Product Benchmarking
Table 92 Santen Pharmaceutical Co., Ltd.: Strategic Outlook
Table 93 Johnson & Johnson Services Inc: Key Details, (CEO, HQ, Revenue, Founded, No. of Employees, Company Type, Website, Business Segment)
Table 94 Johnson & Johnson Private Limited: Product Benchmarking
Table 95 Johnson & Johnson Private Limited: Strategic Outlook
Table 96 Regeneron Pharmaceuticals Inc.: Key Details, (CEO, HQ, Revenue, Founded, No. of Employees, Company Type, Website, Business Segment)
Table 97 Regeneron Pharmaceuticals Inc.: Product Benchmarking
Table 98 Regeneron Pharmaceuticals Inc.: Strategic Outlook
Table 99 AbbVie Inc.: Key Details, (CEO, HQ, Revenue, Founded, No. of Employees, Company Type, Website, Business Segment)
Table 100 AbbVie Inc.: Product Benchmarking
Table 101 AbbVie Inc.: Strategic Outlook
Table 102 F. Hoffmann-La Roche Ltd: Key Details, (CEO, HQ, Revenue, Founded, No. of Employees, Company Type, Website, Business Segment)
Table 103 F. Hoffmann-La Roche Ltd: Product Benchmarking
Table 104 F. Hoffmann-La Roche Ltd: Strategic Outlook
Table 105 Teva Pharmaceutical Industries Ltd.: Key Details, (CEO, HQ, Revenue, Founded, No. of Employees, Company Type, Website, Business Segment)
Table 106 Teva Pharmaceutical Industries Ltd.: Product Benchmarking
Table 107 Teva Pharmaceutical Industries Ltd.: Strategic Outlook
Table 108 Apellis Pharmaceuticals: Key Details, (CEO, HQ, Revenue, Founded, No. of Employees, Company Type, Website, Business Segment)
Table 109 Apellis Pharmaceuticals: Product Benchmarking
Table 110 Apellis Pharmaceuticals: Strategic Outlook
Table 111 Novaliq GmbH: Key Details, (CEO, HQ, Revenue, Founded, No. of Employees, Company Type, Website, Business Segment)
Table 112 Novaliq GmbH.: Product Benchmarking
Table 113 Novaliq GmbH: Strategic Outlook
Table 114 Alimera Sciences: Key Details, (CEO, HQ, Revenue, Founded, No. of Employees, Company Type, Website, Business Segment)
Table 115 Alimera Sciences: Product Benchmarking
Table 116 Alimera Sciences: Strategic Outlook
Table 117 EyeBio: Key Details, (CEO, HQ, Revenue, Founded, No. of Employees, Company Type, Website, Business Segment)
Table 118 EyeBio: Product Benchmarking
Table 119 EyeBio: Strategic Outlook
Table 120 SpliceBio: Key Details, (CEO, HQ, Revenue, Founded, No. of Employees, Company Type, Website, Business Segment)
Table 121 SpliceBio: Product Benchmarking
Table 122 SpliceBio: Strategic Outlook
Table 123 Breye Therapeutics ApS: Key Details, (CEO, HQ, Revenue, Founded, No. of Employees, Company Type, Website, Business Segment)
Table 124 Breye Therapeutics ApS: Product Benchmarking
Table 125 Breye Therapeutics ApS: Strategic Outlook
List of Figures
Figure 1 Ophthalmic Drugs Market Segmentation
Figure 2 Ophthalmic Drugs Market by Type: Market Attractiveness Index
Figure 3 Ophthalmic Drugs Market Forecast by Distribution Channel: Market Attractiveness Index
Figure 4 Ophthalmic Drugs Market Forecast by Indications: Market Attractiveness Index
Figure 5 Ophthalmic Drugs Market Forecast by Route of Administration: Market Attractiveness Index
Figure 6 Ophthalmic Drugs Market Attractiveness Index by Region
Figure 7 Ophthalmic Drugs Market: Market Dynamics
Figure 8 Ophthalmic Drugs Market by Region, 2024-2034 (US$ Billion, AGR (%), CAGR (%)): “V” Shaped Recovery
Figure 9 Ophthalmic Drugs Market by Region, 2024-2034 (US$ Billion, AGR (%), CAGR (%)): “U” Shaped Recovery
Figure 10 Ophthalmic Drugs Market by Region, 2024-2034 (US$ Billion, AGR (%), CAGR (%)): “W” Shaped Recovery
Figure 11 Ophthalmic Drugs Market by Region, 2024-2034 (US$ Billion, AGR (%), CAGR (%)): “L” Shaped Recovery
Figure 12 Ophthalmic Drugs Market: Porter’s Five Forces Analysis
Figure 13 Ophthalmic Drugs Market: PEST Analysis
Figure 14 Ophthalmic Drugs Market Forecast by Type: Market Attractiveness Index
Figure 15 Ophthalmic Drugs Market Forecast by Type, 2024-2034 (US$ Billion, AGR %)
Figure 16 Ophthalmic Drugs Market Share Forecast by Type, 2024, 2029, 2034 (%)
Figure 17 Prescription Drugs Market Forecast by Region, 2023 2034 (US$ Billion)
Figure 18 Prescription Drugs Market Share Forecast by Region, 2024 & 2034 (%)
Figure 19 OTC Drugs Market Forecast by Region, 2024-2034 (US$ Billion, AGR %)
Figure 20 OTC Drugs Market Share Forecast by Region, 2024 & 2034 (%)
Figure 21 Ophthalmic Drugs Market Forecast by Distribution Channel: Market Attractiveness Index
Figure 22 Ophthalmic Drugs Market Forecast By Distribution Channel, 2024-2034 (US$ Billion, AGR %)
Figure 23 Ophthalmic Drugs Market Share Forecast by Distribution Channel, 2024, 2029, 2034 (%)
Figure 24 Hospital Pharmacies Market Forecast by Region, 2024-2034 (US$ Billion, AGR %)
Figure 25 Hospital Pharmacies Market Share Forecast by Region, 2024 & 2034 (%)
Figure 26 Drug Stores Market Forecast by Region, 2024-2034 (US$ Billion, AGR %)
Figure 27 Drug Stores Market Share Forecast by Region, 2024 & 2034 (%)
Figure 28 Online Pharmacies Market Forecast by Region, 2024-2034 (US$ Billion, AGR %)
Figure 29 Online Pharmacies Market Share Forecast by Region, 2024 & 2034 (%)
Figure 30 Ophthalmic Drugs Market Forecast by Indication: Market Attractiveness Index
Figure 31 Ophthalmic Drugs Market Forecast By Indications, 2024-2034 (US$ Billion, AGR %)
Figure 32 Ophthalmic Drugs Market Share Forecast by Indications, 2024, 2029, 2034 (%)
Figure 33 Retinal Disorders Market Forecast by Region, 2024-2034 (US$ Billion, AGR %)
Figure 34 Retinal Disorders Market Share Forecast by Region, 2024 & 2034 (%)
Figure 35 Infection/Inflammation/Allergy Market Forecast by Region, 2024-2034 (US$ Billion, AGR %)
Figure 36 Infection/Inflammation/Allergy Market Share Forecast by Region, 2024 & 2034 (%)
Figure 37 Dry Eye Market Forecast by Region, 2024-2034 (US$ Billion, AGR %)
Figure 38 Dry Eye Market Share Forecast by Region, 2024 & 2034 (%)
Figure 39 Glaucoma Market Forecast by Region, 2024-2034 (US$ Billion, AGR %)
Figure 40 Glaucoma Market Share Forecast by Region, 2024 & 2034 (%)
Figure 41 Ophthalmic Drugs Market Forecast by Route of Administration: Market Attractiveness Index
Figure 42 Ophthalmic Drugs Market Forecast by Route of Administration, 2024-2034 (US$ Billion, AGR %)
Figure 43 Ophthalmic Drugs Market Share Forecast by Route of administration, 2024, 2029, 2034 (%)
Figure 44 Topical Market Forecast by Region, 2024-2034 (US$ Billion, AGR %)
Figure 45 Topical Market Share Forecast by Region, 2024 & 2034 (%)
Figure 46 Parenteral Market Forecast by Region, 2024-2034 (US$ Billion, AGR %)
Figure 47 Parenteral Market Share Forecast by Region, 2024 & 2034 (%)
Figure 48 Ophthalmic Drugs Market Forecast by Region 2024 & 2034 (Revenue, CAGR%)
Figure 49 Ophthalmic Drugs Market Share Forecast by Region 2024, 2029, 2034(%)
Figure 50 Ophthalmic Drugs Market by Region, 2024-2034 (US$ Billion, AGR (%), CAGR (%))
Figure 51 North America Ophthalmic Drugs Market Attractiveness Index
Figure 52 North America Ophthalmic Drugs Market by Region, 2024, 2029 & 2034 (US$ Billion)
Figure 53 North America Ophthalmic Drugs Market Forecast by Country, 2024-2034 (US$ Billion, AGR %)
Figure 54 North America Ophthalmic Drugs Market Share Forecast by Country, 2024 & 2034 (%)
Figure 55 North America Ophthalmic Drugs Market Forecast by Type, 2024-2034 (US$ Billion, AGR %)
Figure 56 North America Ophthalmic Drugs Market Share Forecast by Type, 2024 & 2034 (%)
Figure 57 North America Ophthalmic Drugs Market Forecast by Distribution Channel, 2024-2034 (US$ Billion
Figure 58 North America Ophthalmic Drugs Market Share Forecast by Distribution Channel, 2024 & 2034 (%)
Figure 59 North America Ophthalmic Drugs Market Forecast by Indications, 2024-2034 (US$ Billion, AGR %)
Figure 60 North America Ophthalmic Drugs Market Share Forecast by Indications, 2024 & 2034 (%)
Figure 61 North America Ophthalmic Drugs Market Forecast by Route of Administration, 2024-2034 (US$ Billion, AGR %)
Figure 62 North America Ophthalmic Drugs Market Share Forecast by Route of Administration, 2024 & 2034 (%)
Figure 63 U.S. Ophthalmic Drugs Market Forecast, 2024-2034 (US$ Billion, AGR %)
Figure 64 Canada Ophthalmic Drugs Market Forecast, 2024-2034 (US$ Billion, AGR %)
Figure 65 Europe Ophthalmic Drugs Market Attractiveness Index
Figure 66 Europe Ophthalmic Drugs Market by Region, 2024, 2029 & 2034 (US$ Billion)
Figure 67 Europe Ophthalmic Drugs Market Forecast by Country, 2024-2034 (US$ Billion, AGR %)
Figure 68 Europe Ophthalmic Drugs Market Share Forecast by Country, 2024 & 2034 (%)
Figure 69 Europe Ophthalmic Drugs Market Forecast by Type, 2024-2034 (US$ Billion, AGR %)
Figure 70 Europe Ophthalmic Drugs Market Share Forecast by Type, 2024 & 2034 (%)
Figure 71 Europe Ophthalmic Drugs Market Forecast by Distribution Channel, 2024-2034 (US$ Billion
Figure 72 Europe Ophthalmic Drugs Market Share Forecast by Distribution Channel, 2024 & 2034 (%)
Figure 73 Europe Ophthalmic Drugs Market Forecast by Indications, 2024-2034 (US$ Billion, AGR %)
Figure 74 Europe Ophthalmic Drugs Market Share Forecast by Indications, 2024 & 2034 (%)
Figure 75 Europe Ophthalmic Drugs Market Forecast by Route of Administration, 2024-2034 (US$ Billion, AGR %)
Figure 76 Europe Ophthalmic Drugs Market Share Forecast by Route of Administration, 2024 & 2034 (%)
Figure 77 Germany Ophthalmic Drugs Market Forecast, 2024-2034 (US$ Billion, AGR %)
Figure 78 France Ophthalmic Drugs Market Forecast, 2024-2034 (US$ Billion, AGR %)
Figure 79 U.K. Ophthalmic Drugs Market Forecast, 2024-2034 (US$ Billion, AGR %)
Figure 80 Italy Ophthalmic Drugs Market Forecast, 2024-2034 (US$ Billion, AGR %)
Figure 81 Spain Ophthalmic Drugs Market Forecast, 2024-2034 (US$ Billion, AGR %)
Figure 82 Netherlands Ophthalmic Drugs Market Forecast, 2024-2034 (US$ Billion, AGR %)
Figure 83 Switzerland Ophthalmic Drugs Market Forecast, 2024-2034 (US$ Billion, AGR %)
Figure 84 Rest of Europe Ophthalmic Drugs Market Forecast, 2024-2034 (US$ Billion, AGR %)
Figure 85 Asia Pacific Ophthalmic Drugs Market Attractiveness Index
Figure 86 Asia Pacific Ophthalmic Drugs Market by Region, 2024, 2029 & 2034 (US$ Billion)
Figure 87 Asia Pacific Ophthalmic Drugs Market Forecast by Country, 2024-2034 (US$ Billion, AGR %)
Figure 88 Asia Pacific Ophthalmic Drugs Market Share Forecast by Country, 2024 & 2034 (%)
Figure 89 Asia Pacific Ophthalmic Drugs Market Forecast by Type, 2024-2034 (US$ Billion, AGR %)
Figure 90 Asia Pacific Ophthalmic Drugs Market Share Forecast by Type, 2024 & 2034 (%)
Figure 91 Asia Pacific Ophthalmic Drugs Market Forecast by Distribution Channel, 2024-2034 (US$ Billion
Figure 92 Asia Pacific Ophthalmic Drugs Market Share Forecast by Distribution Channel, 2024 & 2034 (%)
Figure 93 Asia Pacific Ophthalmic Drugs Market Forecast by Indications, 2024-2034 (US$ Billion, AGR %)
Figure 94 Asia Pacific Ophthalmic Drugs Market Share Forecast by Indications, 2024 & 2034 (%)
Figure 95 Asia Pacific Ophthalmic Drugs Market Forecast by Route of Administration, 2024-2034 (US$ Billion, AGR %)
Figure 96 Asia Pacific Ophthalmic Drugs Market Share Forecast by Route of Administration, 2024 & 2034 (%)
Figure 97 Japan Ophthalmic Drugs Market Forecast, 2024-2034 (US$ Billion, AGR %)
Figure 98 China Ophthalmic Drugs Market Forecast, 2024-2034 (US$ Billion, AGR %)
Figure 99 India Ophthalmic Drugs Market Forecast, 2024-2034 (US$ Billion, AGR %)
Figure 100 Australia Ophthalmic Drugs Market Forecast, 2024-2034 (US$ Billion, AGR %)
Figure 101 South Korea Ophthalmic Drugs Market Forecast, 2024-2034 (US$ Billion, AGR %)
Figure 102 Malaysia Ophthalmic Drugs Market Forecast, 2024-2034 (US$ Billion, AGR %)
Figure 103 Singapore Ophthalmic Drugs Market Forecast, 2024-2034 (US$ Billion, AGR %)
Figure 104 Rest of Asia Pacific Ophthalmic Drugs Market Forecast, 2024-2034 (US$ Billion, AGR %)
Figure 105 Latin America Ophthalmic Drugs Market Attractiveness Index
Figure 106 Latin America Ophthalmic Drugs Market by Region, 2024, 2029 & 2034 (US$ Billion)
Figure 107 Latin America Ophthalmic Drugs Market Forecast by Country, 2024-2034 (US$ Billion, AGR %)
Figure 108 Latin America Ophthalmic Drugs Market Share Forecast by Country, 2024 & 2034 (%)
Figure 109 Latin America Ophthalmic Drugs Market Forecast by Type, 2024-2034 (US$ Billion, AGR %)
Figure 110 Latin America Ophthalmic Drugs Market Share Forecast by Type, 2024 & 2034 (%)
Figure 111 Latin America Ophthalmic Drugs Market Forecast by Distribution Channel, 2024-2034 (US$ Billion, AGR %)
Figure 112 Latin America Ophthalmic Drugs Market Share Forecast by Distribution Channel, 2024 & 2034 (%)
Figure 113 Latin America Ophthalmic Drugs Market Forecast by Indications, 2024-2034 (US$ Billion, AGR %)
Figure 114 Latin America Ophthalmic Drugs Market Share Forecast by Indications, 2024 & 2034 (%)
Figure 115 Latin America Ophthalmic Drugs Market Forecast by Route of Administration, 2024-2034 (US$ Billion, AGR %)
Figure 116 Latin America Ophthalmic Drugs Market Share Forecast by Route of Administration, 2024 & 2034 (%
Figure 117 Brazil Ophthalmic Drugs Market Forecast, 2024-2034 (US$ Billion, AGR %)
Figure 118 Argentina Ophthalmic Drugs Market Forecast, 2024-2034 (US$ Billion, AGR %)
Figure 119 Mexico Ophthalmic Drugs Market Forecast, 2024-2034 (US$ Billion, AGR %)
Figure 120 Chile Ophthalmic Drugs Market Forecast, 2024-2034 (US$ Billion, AGR %)
Figure 121 Rest of Latin America Ophthalmic Drugs Market Forecast, 2024-2034 (US$ Billion, AGR %)
Figure 122 MEA Ophthalmic Drugs Market Attractiveness Index
Figure 123 MEA Ophthalmic Drugs Market by Region, 2024, 2029 & 2034 (US$ Billion)
Figure 124 MEA Ophthalmic Drugs Market Forecast by Country, 2024-2034 (US$ Billion, AGR %)
Figure 125 MEA Ophthalmic Drugs Market Share Forecast by Country, 2024 & 2034 (%)
Figure 126 MEA Ophthalmic Drugs Market Forecast by Type, 2024-2034 (US$ Billion, AGR %)
Figure 127 MEA Ophthalmic Drugs Market Share Forecast by Type, 2024 & 2034 (%)
Figure 128 MEA Ophthalmic Drugs Market Forecast by Distribution Channel, 2024-2034 (US$ Billion, AGR %)
Figure 129 MEA Ophthalmic Drugs Market Share Forecast by Distribution Channel, 2024 & 2034 (%)
Figure 130 MEA Ophthalmic Drugs Market Forecast by Indications, 2024-2034 (US$ Billion, AGR %)
Figure 131 MEA Ophthalmic Drugs Market Share Forecast by Indications, 2024 & 2034 (%)
Figure 132 MEA Ophthalmic Drugs Market Forecast by Route of Administration, 2024-2034 (US$ Billion, AGR %)
Figure 133 MEA Ophthalmic Drugs Market Share Forecast by Route of Administration, 2024 & 2034 (%
Figure 134 GCC Ophthalmic Drugs Market Forecast, 2024-2034 (US$ Billion, AGR %)
Figure 135 South Africa Ophthalmic Drugs Market Forecast, 2024-2034 (US$ Billion, AGR %)
Figure 136 Rest of MEA Ophthalmic Drugs Market Forecast, 2024-2034 (US$ Billion, AGR %)
Figure 137 Ophthalmic Drugs Market: Company Share Analysis, 2023
Figure 138 Novartis AG: Net Revenue, 2018-2022 (US$ Million, AGR %)
Figure 139 Novartis AG: Regional Market Shares, 2022
Figure 140 Novartis AG: R&D Expense, 2018-2022 (US$ Million, AGR %)
Figure 141 Bayer AG: Net Revenue, 2018-2022 (US$ Million, AGR %)
Figure 142 Bayer AG: Regional Market Shares, 2022
Figure 143 Bayer AG: R&D Expense, 2018-2022 (US$ Million, AGR %)
Figure 144 Pfizer Inc.: Annual Revenue, 2018-2022 (US$ Million, AGR %)
Figure 145 Pfizer Inc.: Regional Market Shares, 2022
Figure 146 Pfizer Inc.: R&D Expense, 2018-2022 (US$ Million, AGR %)
Figure 147 Bausch & Lomb Incorporated: Annual Revenue, 2018-2022 (US$ Million, AGR %)
Figure 148 Bausch & Lomb Incorporated: R&D Expense, 2018-2022 (US$ Million, AGR %)
Figure 149 Santen Pharmaceutical Co., Ltd.: Annual Revenue, 2018-2022 (US$ Million, AGR %)
Figure 150 Santen Pharmaceutical Co., Ltd.: R&D Expense, 2018-2022 (US$ Million, AGR %)
Figure 151 Johnson & Johnson Services Inc.: Annual Revenue, 2018-2022 (US$ Million, AGR %)
Figure 152 Johnson & Johnson Private Limited: Regional Market Shares, 2022
Figure 153 Johnson & Johnson Private Limited: R&D Expense, 2018-2022 (US$ Million, AGR %)
Figure 154 Regeneron Pharmaceuticals Inc.: Annual Revenue, 2018-2022 (US$ Million, AGR %)
Figure 155 Regeneron Pharmaceuticals Inc: R&D Expense, 2018-2022 (US$ Million, AGR %)
Figure 156 AbbVie Inc.: Annual Revenue, 2018-2022 (US$ Million, AGR %)
Figure 157 AbbVie Inc.: Regional Market Shares, 2022
Figure 158 AbbVie Inc.: R&D Expense, 2018-2022 (US$ Million, AGR %)
Figure 159 F. Hoffmann-La Roche Ltd: Annual Revenue, 2018-2022 (US$ Million, AGR %)
Figure 160 F. Hoffmann-La Roche Ltd.: Regional Market Shares, 2022
Figure 161 F. Hoffmann-La Roche Ltd: R&D Expense, 2018-2022 (US$ Million, AGR %)
Figure 162 Teva Pharmaceutical Industries Ltd.: Annual Revenue, 2018-2022 (US$ Million, AGR%)
Figure 163 Teva Pharmaceutical Industries Ltd: Regional Market Shares, 2022
Figure 164 Teva Pharmaceutical Industries Ltd.: R&D Expense, 2018-2022 (US$ Million, AGR %)
Figure 165 Apellis Pharmaceuticals: Annual Revenue, 2018-2022 (US$ Million, AGR %)
Figure 166 Apellis Pharmaceuticals: R&D Expense, 2018-2022 (US$ Million, AGR %)
Figure 167 Alimera Sciences: Annual Revenue, 2018-2022 (US$ Million, AGR %)
Figure 168 Alimera Sciences: R&D Expense, 2018-2022 (US$ Million, AGR %)
ページTOPに戻る
本レポートと同じKEY WORD(drug)の最新刊レポート
よくあるご質問
Visiongain社はどのような調査会社ですか?
英国の調査会社ヴィジョンゲイン社(Visiongain)は、通信とエネルギーのほか、自動車や化学・医薬品、金属など、広範な市場を対象に調査を行っています。自動車市場については、市場全般に関する調査のほ... もっと見る
調査レポートの納品までの日数はどの程度ですか?
在庫のあるものは速納となりますが、平均的には 3-4日と見て下さい。
但し、一部の調査レポートでは、発注を受けた段階で内容更新をして納品をする場合もあります。
発注をする前のお問合せをお願いします。
注文の手続きはどのようになっていますか?
1)お客様からの御問い合わせをいただきます。
2)見積書やサンプルの提示をいたします。
3)お客様指定、もしくは弊社の発注書をメール添付にて発送してください。
4)データリソース社からレポート発行元の調査会社へ納品手配します。
5) 調査会社からお客様へ納品されます。最近は、pdfにてのメール納品が大半です。
お支払方法の方法はどのようになっていますか?
納品と同時にデータリソース社よりお客様へ請求書(必要に応じて納品書も)を発送いたします。
お客様よりデータリソース社へ(通常は円払い)の御振り込みをお願いします。
請求書は、納品日の日付で発行しますので、翌月最終営業日までの当社指定口座への振込みをお願いします。振込み手数料は御社負担にてお願いします。
お客様の御支払い条件が60日以上の場合は御相談ください。
尚、初めてのお取引先や個人の場合、前払いをお願いすることもあります。ご了承のほど、お願いします。
データリソース社はどのような会社ですか?
当社は、世界各国の主要調査会社・レポート出版社と提携し、世界各国の市場調査レポートや技術動向レポートなどを日本国内の企業・公官庁及び教育研究機関に提供しております。
世界各国の「市場・技術・法規制などの」実情を調査・収集される時には、データリソース社にご相談ください。
お客様の御要望にあったデータや情報を抽出する為のレポート紹介や調査のアドバイスも致します。
|
|

