ロケット推進市場レポート:2023-2033
Rocket Propulsion Market Report 2023-2033
レポート詳細
ロケット推進市場レポート 2023-2033年: 本レポートは、業界とその基礎となる原動力をより良く理解することを望むならば、新たな収益ポケットを目指す大手企業にとって非常に貴重なも... もっと見る
※上記価格は部署ライセンス(Departmental licence)価格です。
その他の価格についてはデータリソースまでお問合せください。
日本語のページは自動翻訳を利用し作成しています。
実際のレポートは英文のみでご納品いたします。
サマリー
レポート詳細
ロケット推進市場レポート 2023-2033年:本レポートは、業界とその基礎となる原動力をより良く理解することを望むならば、新たな収益ポケットを目指す大手企業にとって非常に貴重なものとなるでしょう。異業種への進出や新地域での既存事業の拡大を目指す企業にも有用です。
宇宙探査への需要と宇宙分野への投資拡大
ロケットの再利用可能性は、ロケット推進市場全体の成長の主な原動力であり、宇宙産業に変革的な影響を与えている。従来の使い捨てロケットは製造コストが高く、1回限りの使用であるため打ち上げのたびにコストがかかる。一方、再使用型ロケットは何度も飛ばすことができるため、開発・製造コストを複数のミッションに分散することができる。このコスト削減により、宇宙へのアクセスがより安価になり、商業、科学、探査ミッションに新たな機会が開かれた。この産業の進歩は、宇宙機関がより効率的に資源を配分し、より多くのミッションや科学実験を実施するのに役立っている。
高い開発・製造コストと環境への影響が業界の成長を妨げる
ロケット推進システムの開発と導入には、しばしば大きなコスト制約がつきまとい、これが市場力学や業界プレイヤーの選択に影響を与えることがある。ロケット推進市場におけるコスト制約の原因は様々である。信頼性が高く効率的な推進システムの構築に伴う研究・開発・製造コストの高さが主な要因である。宇宙打ち上げシステム(SLS)ロケットのエンジンだけでも、非常に拡張性が高く、5億8,000万米ドル以上の費用がかかる。資金力の乏しい新興プレーヤーや新興企業にとって、こうしたSLSロケットを購入するのは非常に困難である。例えば、新しいロケットエンジンの開発コストは、プロジェクトの複雑さや規模にもよるが、数千万ドルから数十億ドルに及ぶ。
さらに、コスト上の制約から、代替推進技術が台頭してきている。例えば、イオンスラスターのような電気推進システムは、従来の化学ロケットエンジンと比べて燃料効率が向上し、運用コストが削減できる。これらのシステムは、推進剤の節約が電気推進技術の初期コストの高さを上回る長期ミッションに特に適している。
市場調査レポートを購入する前にすべき質問とは?
- ロケット推進剤市場はどのように進化しているのか?
- ロケット推進剤市場の推進要因と抑制要因は何か?
- 各ロケット推進剤サブ市場セグメントは予測期間中にどのように成長し、2033年にこれらのサブ市場の売上はどの程度になるのか?
- 2023年から2033年にかけて、各ロケット推進サブ市場の市場シェアはどのように推移するのか?
- 2023年から2033年にかけての市場全体の主な牽引役は何か?
- 主要なロケット推進器市場はマクロ経済の動きに概ね追随するのか、それとも個々の国別市場が他を凌駕するのか。
- 2033年までに各国市場のシェアはどう変化し、2033年に市場をリードするのはどの地域か。
- 主要プレイヤーは誰で、予測期間中の見通しは?
- 主要企業のロケット推進プロジェクトは何か?
- 2023年から2033年の間に産業はどのように発展するのか?現在および今後10年間に実施されるロケット推進プロジェクトにはどのような意味があるのか?
- ロケット推進市場をさらに拡大するために、製品の商業化の必要性は高まっているのか?
- ロケット推進市場はどこに向かっているのか、そしてどのようにすれば市場の最前線に立てるのか?
- 新製品やサービスラインに対する最適な投資オプションは何か?
- 企業を新たな成長軌道に乗せ、C-suiteに移行させるための重要な展望とは?
このことが、現在、そして今後10年間のロケット推進市場にどのような影響を与えるかを見極める必要がある:
- 全237ページにわたる本レポートは、94の表と145の図表で構成されています。
- 本レポートでは、業界における主要な有利分野を取り上げているため、今すぐターゲットを絞ることができます。
- 世界、地域、国の売上と成長に関する詳細な分析が含まれています。
- 競合他社が成功した主なトレンド、変化、収益予測をハイライトしています。
本レポートは、ロケット推進市場が今後10年間でどのように発展するか、またCOVID-19の景気後退と好転の変動に合わせてどのように発展するかをお伝えします。この市場は、過去10年間のどの時点よりも今が重要である。
2033年までの予測やその他の分析から、商業的な展望が明らかになる
- 2033年までの収益予測に加え、直近の業績、成長率、市場シェアもご覧いただけます。
- ビジネスの展望と展開に関する独自の分析をご覧いただけます。
- 定性的分析(市場力学、促進要因、機会、阻害要因、課題を含む)、コスト構造、ロケット推進剤価格上昇の影響、最近の動向をご覧いただけます。
本レポートには、COVID-19が業界と貴社にどのような影響を与えるかについてのデータ分析と貴重な洞察が含まれている。本レポートでは、COVID-19の4つの回収パターンとその影響、すなわち「V」、「L」、「W」、「U」について論じている。
レポート対象セグメント
タイプ
- ロケットエンジン
- ロケットモーター
コンポーネント
- エンジン
- ノズル
- 点火装置
- ハードウェア
- バルブ
- ターボ
- ポンプ
- 燃焼室
- 推進剤
- その他
エンドユーザー
- 軍事
- 商業用
世界市場全体と各分野の売上予測に加え、5つの地域と16の主要国市場の売上予測も掲載しています:
北米
- アメリカ
- カナダ
欧州
- ドイツ
- 英国
- フランス
- スペイン
- イタリア
- その他の欧州
アジア太平洋
- 中国
- 日本
- インド
- オーストラリア
- 韓国
- その他のアジア太平洋地域
ラテンアメリカ
- ブラジル
- メキシコ
- その他のラテンアメリカ
MEA
- GCC
- 南アフリカ
- その他のMEA
本レポートには、ロケット推進市場の2023年から2033年にかけての主要企業のプロファイルと、これらの企業の事業のこのセグメントに焦点を当てている。
報告書に掲載されている主要企業
・ Antrix
・ Aerojet Rocketdyne Holding, Inc.
・ Mitsubishi Heavy Industries Ltd.
・ Northrop Grumman Corporation
・ Safran S.A.
・ Spacex
・ Blue Origin
・ China Great Wall Industry Corporation
・ Virgin Galactic Holdings, Inc.
・ IHI Aerospace Co. Ltd.
2023年から2033年までのロケット推進市場全体の世界売上高(金額ベース)は、2023年に55億6,710万米ドルを突破する。2033年まで力強い収益成長を予測。当研究所では、最も大きな可能性を秘めた組織を特定する。彼らの能力、進歩、商業的展望を発見し、一歩先を行くお手伝いをします。
ロケット推進市場、2023-2033年レポートはどのようにお役に立ちますか?
要約すると、230ページを超えるこのレポートは、以下のような知識を提供する:
- ロケット推進市場の2023年から2033年までの収益予測 用途別、システム別、エンドユーザー別の予測を世界レベルと地域レベルで掲載 - 業界の将来性を発見し、投資と収益に最も有利な場所を見つけます。
- 5つの地域と16の主要国市場の2033年までの収益予測 - 北米、欧州、アジア太平洋、中南米、MEAのロケット推進市場の2023年から2033年までの市場予測をご覧ください。また、米国、カナダ、メキシコ、ブラジル、ドイツ、フランス、英国、イタリア、中国、インド、日本、オーストラリアなどの主要経済圏の市場も予測しています。
- 既存企業および市場参入を目指す企業の展望 - ロケット推進市場に関わる主要企業10社の企業プロファイルを含む、2023年から2033年までの展望。
独自の予測による定量的・定性的分析をご覧ください。私たちのレポートだけに含まれる情報を入手し、貴重なビジネスインテリジェンスで情報を得ることができます。
他にはない情報
私たちの新しいレポートがあれば、知識に遅れをとったり、チャンスを逃したりする可能性が低くなります。弊社の調査レポートが貴社の調査・分析・意思決定にどのように役立つかをご覧ください。Visiongainの調査は、ロケット推進市場、2023年から2033年、市場をリードする企業の商業分析を必要とするすべての人のためのものです。データ、トレンド、予測をご覧いただけます。
ページTOPに戻る
目次
目次
1 レポート概要
1.1 研究の目的
1.2 ロケット推進市場の紹介
1.3 本レポートの内容
1.4 本レポートを読むべき理由
1.5 本分析レポートが回答する主な質問
1.6 本レポートは誰のためのものか?
1.7 方法論
1.7.1 市場の定義
1.7.2 市場評価・予測手法
1.7.3 データの検証
1.7.3.1 一次調査
1.7.3.2 セカンダリーリサーチ
1.8 よくある質問(FAQ)
1.9 Visiongainの関連レポート
1.10 Visiongainについて
2 エグゼクティブ・サマリー
3 市場概要
3.1 主要な調査結果
3.2 市場ダイナミクス
3.2.1 市場促進要因
3.2.1.1 宇宙探査需要の増加
3.2.1.2 世界的な打上げ活動の活発化と宇宙分野への投資の増加
3.2.1.3 ロケットの再利用性
3.2.2 市場抑制要因
3.2.2.1 高い開発・製造コスト
3.2.2.2 環境への影響
3.2.3 市場機会
3.2.3.1 宇宙分野における小型衛星市場の成長
3.2.3.2 環境に優しい推進システムへの需要の高まり
3.3 COVID-19影響分析
3.4 ポーターのファイブフォース分析
3.4.1 サプライヤーの中程度の交渉力
3.4.2 買い手の中程度の交渉力
3.4.3 高競争力
3.4.4 低い代替品の脅威
3.4.5 低い新規参入の脅威
3.5 PEST分析
4 ロケット推進市場分析:タイプ別
4.1 主要な調査結果
4.2 タイプ別セグメント 市場魅力度指数
4.3 ロケット推進のタイプ別市場規模推定と予測
4.4 ロケットエンジン
4.4.1 2023〜2033年の地域別市場規模(US$ Million)
4.4.2 地域別市場シェア、2023年・2033年(%)
4.5 ロケットモーター
4.5.1 2023~2033年の地域別市場規模(US$ Million)
4.5.2 地域別市場シェア、2023年~2033年 (%)
5 ロケット推進市場分析:コンポーネント別
5.1 主要な調査結果
5.2 コンポーネントセグメント 市場魅力度指数
5.3 ロケット推進のコンポーネント別市場規模推定と予測
5.4 モーター
5.4.1 2023〜2033年の地域別市場規模(US$ Million)
5.4.2 地域別市場シェア、2023年・2033年(%)
5.5 ノズル
5.5.1 2023~2033年の地域別市場規模(US$ Million)
5.5.2 地域別市場シェア、2023年・2033年 (%)
5.6 イグナイター
5.6.1 2023~2033年の地域別市場規模(US$ Million)
5.6.2 地域別市場シェア、2023年・2033年 (%)
5.7 ハードウェア
5.7.1 2023〜2033年の地域別市場規模(US$ Million)
5.7.2 地域別市場シェア、2023年・2033年 (%)
5.8 バルブ
5.8.1 2023~2033年の地域別市場規模(US$ Million)
5.8.2 地域別市場シェア、2023年・2033年 (%)
5.9 ターボ
5.9.1 2023~2033年の地域別市場規模(US$ Million)
5.9.2 地域別市場シェア、2023年・2033年 (%)
5.10 ポンプ
5.10.1 2023~2033年の地域別市場規模(US$ Million)
5.10.2 地域別市場シェア、2023年・2033年 (%)
5.11 燃焼室
5.11.1 2023~2033年の地域別市場規模(US$ Million)
5.11.2 地域別市場シェア、2023年・2033年(%)
5.12 プロペラント
5.12.1 2023~2033年の地域別市場規模(US$ Million)
5.12.2 地域別市場シェア、2023年・2033年 (%)
5.13 その他
5.13.1 2023年~2033年の地域別市場規模(US$ Million)
5.13.2 地域別市場シェア、2023年・2033年 (%)
6 ロケット推進市場分析:エンドユーザー別
6.1 主要調査結果
6.2 エンドユーザーセグメント 市場魅力度指数
6.3 ロケット推進のエンドユーザー別市場規模推定と予測
6.4 軍事
6.4.1 2023〜2033年の地域別市場規模(US$ Million)
6.4.2 地域別市場シェア、2023年・2033年(%)
6.5 商用
6.5.1 2023~2033年の地域別市場規模(US$ Million)
6.5.2 地域別市場シェア、2023年・2033年 (%)
7 ロケット推進市場分析:地域別
7.1 主要な調査結果
7.2 地域別市場規模の推定と予測
8 北米のロケット推進市場分析
8.1 主要な調査結果
8.2 北米のロケット推進市場魅力度指数
8.3 北米のロケット推進市場:国別、2023年、2028年、2033年 (US$ Million)
8.4 北米のロケット推進市場規模推定と予測:国別
8.5 北米のロケット推進市場規模推定と予測:タイプ別
8.6 北米のロケット推進市場規模推定と予測:コンポーネント別
8.7 北米のロケット推進市場規模推定と予測:エンドユーザー別
8.8 アメリカのロケット推進市場分析
8.9 カナダのロケット推進市場分析
9 欧州ロケット推進の市場分析
9.1 主要な調査結果
9.2 欧州ロケット推進市場魅力度指数
9.3 欧州のロケット推進市場:国別、2023年、2028年、2033年 (US$ Million)
9.4 欧州のロケット推進市場規模推定と予測:国別
9.5 欧州のロケット推進市場規模推定と予測:タイプ別
9.6 欧州のロケット推進市場規模推定と予測:コンポーネント別
9.7 欧州のロケット推進市場規模推定と予測:エンドユーザー別
9.8 ドイツのロケット推進市場分析
9.9 フランスのロケット推進市場分析
9.10 イギリスのロケット推進市場分析
9.11 イタリアのロケット推進市場分析
9.12 スペインのロケット推進市場分析
9.13 その他の欧州のロケット推進市場分析
10 アジア太平洋地域のロケット推進市場分析
10.1 主要な調査結果
10.2 アジア太平洋地域のロケット推進市場魅力度指数
10.3 アジア太平洋地域のロケット推進国別市場:2023年、2028年、2033年(US$ Million)
10.4 アジア太平洋地域のロケット推進市場規模推定と予測:国別
10.5 アジア太平洋地域のロケット推進市場規模推定と予測:タイプ別
10.6 アジア太平洋地域のロケット推進市場規模推定と予測:コンポーネント別
10.7 アジア太平洋地域のロケット推進市場規模推定と予測:エンドユーザー別
10.8 中国のロケット推進剤市場分析
10.9 日本のロケット推進剤の市場分析
10.10 インドロケット推進剤の市場分析
10.11 オーストラリアのロケット推進剤の市場分析
10.12 韓国ロケット推進の市場分析
10.13 その他のアジア太平洋地域のロケット推進市場分析
11 ラテンアメリカのロケット推進器市場の分析
11.1 主要な調査結果
11.2 ラテンアメリカのロケット推進市場魅力度指数
11.3 ラテンアメリカのロケット推進国別市場、2023年、2028年、2033年 (US$ Million)
11.4 ラテンアメリカのロケット推進市場規模推定と予測:国別
11.5 ラテンアメリカのロケット推進市場規模推定と予測:タイプ別
11.6 ラテンアメリカのロケット推進市場規模推定と予測:コンポーネント別
11.7 ラテンアメリカのロケット推進市場規模推定と予測:エンドユーザー別
11.8 ブラジルのロケット推進市場分析
11.9 メキシコのロケット推進市場分析
11.10 その他のラテンアメリカのロケット推進市場分析
12 MEAのロケット推進の市場分析
12.1 主要な調査結果
12.2 MEAのロケット推進市場魅力度指数
12.3 MEAのロケット推進の国別市場規模予測:2023年、2028年、2033年 (US$百万)
12.4 MEAのロケット推進市場規模推定と予測:国別
12.5 MEAのロケット推進市場規模推定と予測:タイプ別
12.6 MEAのロケット推進市場規模推定と予測:コンポーネント別
12.7 MEAのロケット推進市場規模推定と予測:エンドユーザー別
12.8 GCCのロケット推進市場分析
12.9 南アフリカのロケット推進市場の分析
12.10 その他のMEAロケット推進市場の分析
13 企業のプロフィール
13.1 競争環境、2022年
13.2 戦略的展望
13.3 Aerojet Rocketdyne Holdings, Inc.
13.3.1 会社概要
13.3.2 会社概要
13.3.3 財務分析
13.3.3.1 純収入、2017-2022年
13.3.3.2 R&D、2017-2022年
13.3.3.3 地域市場シェア、2022年
13.3.3.4 セグメント市場シェア、2022年
13.3.4 製品ベンチマーク
13.3.5 戦略的展望
13.4 Antrix Corporation Limited
13.4.1 会社概要
13.4.2 会社概要
13.4.3 財務分析
13.4.3.1 純収入、2017-2022年
13.4.4 製品ベンチマーク
13.4.5 戦略的展望
13.5 Blue Origin
13.5.1 会社概要
13.5.2 会社概要
13.5.3 製品ベンチマーク
13.5.4 戦略的展望
13.6 China Great Wall Industry Corporation
13.6.1 会社概要
13.6.2 会社概要
13.6.3 製品ベンチマーク
13.6.4 戦略的展望
13.7 IHI Aerospace Co. Ltd.
13.7.1 会社概要
13.7.2 会社概要
13.7.3 財務分析
13.7.3.1 純収入、2017-2021年
13.7.3.2 R&D、2017-2021年
13.7.3.3 地域市場シェア、2021年
13.7.3.4 セグメント市場シェア、2021年
13.7.4 製品ベンチマーク
13.7.5 戦略的展望
13.8 Mitsubishi Heavy Industries Ltd.
13.8.1 会社概要
13.8.2 会社概要
13.8.3 財務分析
13.8.3.1 純収入、2017年~2022年
13.8.3.2 地域市場シェア、2022年
13.8.3.3 セグメント市場シェア、2022年
13.8.4 製品ベンチマーク
13.8.5 戦略的展望
13.9 Northrop Grumman Corporation
13.9.1 会社概要
13.9.2 会社概要
13.9.3 財務分析
13.9.3.1 純収入、2017-2022年
13.9.3.2 R&D、2017年〜2022年
13.9.3.3 地域市場シェア、2022年
13.9.3.4 セグメント市場シェア、2022年
13.9.4 製品ベンチマーク
13.9.5 戦略的展望
13.10 Safran S.A.
13.10.1 会社概要
13.10.2 会社概要
13.10.3 財務分析
13.10.3.1 純収入、2017-2022年
13.10.3.2 R&D、2017年〜2022年
13.10.3.3 地域市場シェア、2022年
13.10.3.4 セグメント市場シェア、2022年
13.10.4 製品ベンチマーク
13.10.5 戦略的展望
13.11 Space Exploration Technologies Corp.
13.11.1 会社概要
13.11.2 会社概要
13.11.3 製品ベンチマーク
13.11.4 戦略的展望
13.12 Virgin Galactic Holdings, Inc.
13.12.1 会社概要
13.12.2 会社概要
13.12.3 財務分析
13.12.3.1 純収入、2017-2022年
13.12.3.2 R&D、2017-2022年
13.12.4 製品ベンチマーク
13.12.5 戦略的展望
14 結論と提言
14.1 Visiongainからの結びの言葉
14.2 市場プレイヤーへの提言
ページTOPに戻る
図表リスト
表の一覧
Table 1 Rocket Propulsion Market Snapshot, 2023 & 2033 (US$ Million, CAGR %)
Table 2 Rocket Propulsion Market Forecast by Region, 2023-2033 (US$ Million, AGR%, CAGR%): “V” Shaped Recovery
Table 3 Rocket Propulsion Market Forecast by Region, 2023-2033 (US$ Million, AGR%, CAGR%): “U” Shaped Recovery
Table 4 Rocket Propulsion Market Forecast by Region, 2023-2033 (US$ Million, AGR%, CAGR%): “W” Shaped Recovery
Table 5 Rocket Propulsion Market Forecast by Region, 2023-2033 (US$ Million, AGR%, CAGR%): “L” Shaped Recovery
Table 6 Rocket Propulsion Market Forecast by Type, 2023-2033 (US$ Million, AGR%, CAGR%)
Table 7 Rocket Engine Market Forecast by Region, 2023-2033 (US$ Million, AGR%, CAGR%)
Table 8 Rocket Motor Segment Market Forecast by Region, 2023-2033 (US$ Million, AGR%, CAGR%)
Table 9 Rocket Propulsion Market Forecast by Component, 2023-2033 (US$ Million, AGR%, CAGR%)
Table 10 Motor Segment Market Forecast by Region, 2023-2033 (US$ Million, AGR%, CAGR%)
Table 11 Nozzle Segment Market Forecast by Region, 2023-2033 (US$ Million, AGR%, CAGR%)
Table 12 Igniter Segment Market Forecast by Region, 2023-2033 (US$ Million, AGR%, CAGR%)
Table 13 Hardware Segment Market Forecast by Region, 2023-2033 (US$ Million, AGR%, CAGR%)
Table 14 Valve Segment Market Forecast by Region, 2023-2033 (US$ Million, AGR%, CAGR%)
Table 15 Turbo Segment Market Forecast by Region, 2023-2033 (US$ Million, AGR%, CAGR%)
Table 16 Pump Segment Market Forecast by Region, 2023-2033 (US$ Million, AGR%, CAGR%)
Table 17 Combustion Chamber Segment Market Forecast by Region, 2023-2033 (US$ Million, AGR%, CAGR%)
Table 18 Propellant Segment Market Forecast by Region, 2023-2033 (US$ Million, AGR%, CAGR%)
Table 19 Others Segment Market Forecast by Region, 2023-2033 (US$ Million, AGR%, CAGR%)
Table 20 Rocket Propulsion Market Forecast by End User, 2023-2033 (US$ Million, AGR%, CAGR%)
Table 21 Military Segment Market Forecast by Region, 2023-2033 (US$ Million, AGR%, CAGR%)
Table 22 Commercial Segment Market Forecast by Region, 2023-2033 (US$ Million, AGR%, CAGR%)
Table 23 Rocket Propulsion Market Forecast by Region, 2023-2033 (US$ Million, AGR%, CAGR%)
Table 24 North America Rocket Propulsion Market Forecast by Country, 2023-2033 (US$ Million, AGR%, CAGR%)
Table 25 North America Rocket Propulsion Market Forecast by Type, 2023-2033 (US$ Million, AGR%, CAGR%)
Table 26 North America Rocket Propulsion Market Forecast by Component, 2023-2033 (US$ Million, AGR%, CAGR%)
Table 27 North America Rocket Propulsion Market Forecast by End User, 2023-2033 (US$ Million, AGR%, CAGR%)
Table 28 U.S. Rocket Propulsion Market Forecast, 2023-2033 (US$ Million, AGR%, CAGR%)
Table 29 Canada Rocket Propulsion Market Forecast, 2023-2033 (US$ Million, AGR%, CAGR%)
Table 30 Europe Rocket Propulsion Market Forecast by Country, 2023-2033 (US$ Million, AGR%, CAGR%)
Table 31 Europe Rocket Propulsion Market Forecast by Type, 2023-2033 (US$ Million, AGR%, CAGR%)
Table 32 Europe Rocket Propulsion Market Forecast by Component, 2023-2033 (US$ Million, AGR%, CAGR%)
Table 33 Europe Rocket Propulsion Market Forecast by End User, 2023-2033 (US$ Million, AGR%, CAGR%)
Table 34 Germany Rocket Propulsion Market Forecast, 2023-2033 (US$ Million, AGR%, CAGR%)
Table 35 France Rocket Propulsion Market Forecast, 2023-2033 (US$ Million, AGR%, CAGR%)
Table 36 UK Rocket Propulsion Market Forecast, 2023-2033 (US$ Million, AGR%, CAGR%)
Table 37 Italy Rocket Propulsion Market Forecast, 2023-2033 (US$ Million, AGR%, CAGR%)
Table 38 Spain Rocket Propulsion Market Forecast, 2023-2033 (US$ Million, AGR%, CAGR%)
Table 39 Rest of Europe Rocket Propulsion Market Forecast, 2023-2033 (US$ Million, AGR%, CAGR%)
Table 40 Asia Pacific Rocket Propulsion Market Forecast by Country, 2023-2033 (US$ Million, AGR%, CAGR%)
Table 41 Asia Pacific Rocket Propulsion Market Forecast by Type, 2023-2033 (US$ Million, AGR%, CAGR%)
Table 42 Asia Pacific Rocket Propulsion Market Forecast by Component, 2023-2033 (US$ Million, AGR%, CAGR%)
Table 43 Asia Pacific Rocket Propulsion Market Forecast by End User, 2023-2033 (US$ Million, AGR%, CAGR%)
Table 44 China Rocket Propulsion Market Forecast, 2023-2033 (US$ Million, AGR%, CAGR%)
Table 45 Japan Rocket Propulsion Market Forecast, 2023-2033 (US$ Million, AGR%, CAGR%)
Table 46 India Rocket Propulsion Market Forecast, 2023-2033 (US$ Million, AGR%, CAGR%)
Table 47 Australia Rocket Propulsion Market Forecast, 2023-2033 (US$ Million, AGR%, CAGR%)
Table 48 South Korea Rocket Propulsion Market Forecast, 2023-2033 (US$ Million, AGR%, CAGR%)
Table 49 Rest of Asia Pacific Rocket Propulsion Market Forecast, 2023-2033 (US$ Million, AGR%, CAGR%)
Table 50 Latin America Rocket Propulsion Market Forecast by Country, 2023-2033 (US$ Million, AGR%, CAGR%)
Table 51 Latin America Rocket Propulsion Market Forecast by Type, 2023-2033 (US$ Million, AGR%, CAGR%)
Table 52 Asia Pacific Rocket Propulsion Market Forecast by Component, 2023-2033 (US$ Million, AGR%, CAGR%)
Table 53 Latin America Rocket Propulsion Market Forecast by End User, 2023-2033 (US$ Million, AGR%, CAGR%)
Table 54 Brazil Rocket Propulsion Market Forecast, 2023-2033 (US$ Million, AGR%, CAGR%)
Table 55 Mexico Rocket Propulsion Market Forecast, 2023-2033 (US$ Million, AGR%, CAGR%)
Table 56 Rest of Latin America Rocket Propulsion Market Forecast, 2023-2033 (US$ Million, AGR%, CAGR%)
Table 57 MEA Rocket Propulsion Market Forecast by Country, 2023-2033 (US$ Million, AGR%, CAGR%)
Table 58 MEA Rocket Propulsion Market Forecast by Type, 2023-2033 (US$ Million, AGR%, CAGR%)
Table 59 Asia Pacific Rocket Propulsion Market Forecast by Component, 2023-2033 (US$ Million, AGR%, CAGR%)
Table 60 MEA Rocket Propulsion Market Forecast by End User, 2023-2033 (US$ Million, AGR%, CAGR%)
Table 61 GCC Rocket Propulsion Market Forecast, 2023-2033 (US$ Million, AGR%, CAGR%)
Table 62 South Africa Rocket Propulsion Market Forecast, 2023-2033 (US$ Million, AGR%, CAGR%)
Table 63 Rest of MEA Rocket Propulsion Market Forecast, 2023-2033 (US$ Million, AGR%, CAGR%)
Table 64 Strategic Outlook
Table 65 Aerojet Rocketdyne Holdings, Inc.: Key Details, (CEO, HQ, Revenue, Founded, No. of Employees, Company Type, Website, Business Segment)
Table 66. Aerojet Rocketdyne Holdings, Inc.: Product Benchmarking
Table 67 Aerojet Rocketdyne Holdings, Inc.: Strategic Outlook
Table 68 Antrix Corporation Limited: Key Details, (CEO, HQ, Revenue, Founded, Company Type, Website, Business Segment)
Table 69 Antrix Corporation Limited: Product Benchmarking
Table 70 Antrix Corporation Limited: Strategic Outlook
Table 71 Blue Origin: Key Details, (CEO, HQ, Founded, No. of Employees, Company Type, Website, Business Segment)
Table 72 Blue Origin: Product Benchmarking
Table 73 Blue Origin: Strategic Outlook
Table 74 China Great Wall Industry Corporation: Key Details, (CEO, HQ, Revenue, Founded, No. of Employees, Company Type, Website, Business Segment)
Table 75 China Great Wall Industry Corporation: Product Benchmarking
Table 76 China Great Wall Industry Corporation: Strategic Outlook
Table 77 IHI Aerospace Co. Ltd.: Key Details, (CEO, HQ, Revenue, Founded, No. of Employees, Company Type, Website, Business Segment)
Table 78 IHI Aerospace Co. Ltd.: Product Benchmarking
Table 79 IHI Aerospace Co. Ltd.: Strategic Outlook
Table 80 Mitsubishi Heavy Industries Ltd.: Key Details, (CEO, HQ, Revenue, Founded, No. of Employees, Company Type, Website, Business Segment)
Table 81 Mitsubishi Heavy Industries Ltd.: Product Benchmarking
Table 82 Mitsubishi Heavy Industries Ltd.: Strategic Outlook
Table 83 Northrop Grumman Corporation: Key Details, (CEO, HQ, Revenue, Founded, No. of Employees, Company Type, Website, Business Segment)
Table 84 Northrop Grumman Corporation: Product Benchmarking
Table 85 Northrop Grumman Corporation: Strategic Outlook
Table 86 Safran S.A.: Key Details, (CEO, HQ, Revenue, Founded, No. of Employees, Company Type, Website, Business Segment)
Table 87 Safran S.A.: Product Benchmarking
Table 88 Safran S.A.: Strategic Outlook
Table 89 Space Exploration Technologies Corp.: Key Details, (CEO, HQ, Founded, No. of Employees, Company Type, Website, Business Segment)
Table 90 Space Exploration Technologies Corp.: Product Benchmarking
Table 91 Space Exploration Technologies Corp.: Strategic Outlook
Table 92 Virgin Galactic Holdings, Inc.: Key Details, (CEO, HQ, Revenue, Founded, No. of Employees, Company Type, Website, Business Segment)
Table 93 Virgin Galactic Holdings, Inc.: Product Benchmarking
Table 94 Virgin Galactic Holdings, Inc.: Strategic Outlook
図の一覧
Figure 1 Rocket Propulsion Market Segmentation
Figure 2 Rocket Propulsion Market by Type: Market Attractiveness Index
Figure 3 Rocket Propulsion Market by Component: Market Attractiveness Index
Figure 4 Rocket Propulsion Market by End User: Market Attractiveness Index
Figure 5 Rocket Propulsion Market Attractiveness Index by Region
Figure 6 Rocket Propulsion Market: Market Dynamics
Figure 7 Rocket Propulsion Market by Region, 2023-2033 (US$ Million, AGR %): “V” Shaped Recovery
Figure 8 Rocket Propulsion Market by Region, 2023-2033 (US$ Million, AGR %): “U” Shaped Recovery
Figure 9 Rocket Propulsion Market by Region, 2023-2033 (US$ Million, AGR %): “W” Shaped Recovery
Figure 10 Rocket Propulsion Market by Region, 2023-2033 (US$ Million, AGR %): “L” Shaped Recovery
Figure 11 Rocket Propulsion Market: Porter’s Five Forces Analysis
Figure 12 Rocket Propulsion Market: PEST Analysis
Figure 13 Rocket Propulsion Market by Type: Market Attractiveness Index
Figure 14 Rocket Propulsion Market Forecast by Type, 2023-2033 (US$ Million, AGR %)
Figure 15 Rocket Propulsion Market Share Forecast by Type, 2023, 2028, 2033 (%)
Figure 16 Rocket Engine Segment Market Forecast by Region, 2023-2033 (US$ Million, AGR %)
Figure 17 Surveillance Segment Market Share Forecast by Region, 2023 & 2033 (%)
Figure 18 Rocket Motor Segment Market Forecast by Region, 2023-2033 (US$ Million, AGR %)
Figure 19 Rocket Motor Segment Market Share Forecast by Region, 2023 & 2033 (%)
Figure 20 Rocket Propulsion Market by Component: Market Attractiveness Index
Figure 21 Rocket Propulsion Market Forecast by Component, 2023-2033 (US$ Million, AGR %)
Figure 22 Rocket Propulsion Market Share Forecast by Component, 2023, 2028, 2033 (%)
Figure 23 Motor Segment Market Forecast by Region, 2023-2033 (US$ Million, AGR %)
Figure 24 Motor Segment Market Share Forecast by Region, 2023 & 2033 (%)
Figure 25 Nozzle Segment Market Forecast by Region, 2023-2033 (US$ Million, AGR %)
Figure 26 Nozzle Segment Market Share Forecast by Region, 2023 & 2033 (%)
Figure 27 Igniter Segment Market Forecast by Region, 2023-2033 (US$ Million, AGR %)
Figure 28 Igniter Segment Market Share Forecast by Region, 2023 & 2033 (%)
Figure 29 Hardware Segment Market Forecast by Region, 2023-2033 (US$ Million, AGR %)
Figure 30 Hardware Segment Market Share Forecast by Region, 2023 & 2033 (%)
Figure 31 Valve Segment Market Forecast by Region, 2023-2033 (US$ Million, AGR %)
Figure 32 Valve Segment Market Share Forecast by Region, 2023 & 2033 (%)
Figure 33 Turbo Segment Market Forecast by Region, 2023-2033 (US$ Million, AGR %)
Figure 34 Turbo Segment Market Share Forecast by Region, 2023 & 2033 (%)
Figure 35 Pump Segment Market Forecast by Region, 2023-2033 (US$ Million, AGR %)
Figure 36 Pump Segment Market Share Forecast by Region, 2023 & 2033 (%)
Figure 37 Combustion Chamber Segment Market Forecast by Region, 2023-2033 (US$ Million, AGR %)
Figure 38 Combustion Chamber Segment Market Share Forecast by Region, 2023 & 2033 (%)
Figure 39 Propellant Segment Market Forecast by Region, 2023-2033 (US$ Million, AGR %)
Figure 40 Propellant Segment Market Share Forecast by Region, 2023 & 2033 (%)
Figure 41 Others Segment Market Forecast by Region, 2023-2033 (US$ Million, AGR %)
Figure 42 Others Segment Market Share Forecast by Region, 2023 & 2033 (%)
Figure 43 Rocket Propulsion Market by End User: Market Attractiveness Index
Figure 44 Rocket Propulsion Market Forecast by End User, 2023-2033 (US$ Million, AGR %)
Figure 45 Rocket Propulsion Market Share Forecast by End User, 2023, 2028, 2033 (%)
Figure 46 Military Segment Market Forecast by Region, 2023-2033 (US$ Million, AGR %)
Figure 47 Military Segment Market Share Forecast by Region, 2023 & 2033 (%)
Figure 48 Commercial Segment Market Forecast by Region, 2023-2033 (US$ Million, AGR %)
Figure 49 Commercial Segment Market Share Forecast by Region, 2023 & 2033 (%)
Figure 50 Rocket Propulsion Market Forecast by Region 2023 and 2033 (Revenue, CAGR%)
Figure 51 Rocket Propulsion Market Share Forecast by Region 2023, 2028, 2033 (%)
Figure 52 Rocket Propulsion Market by Region, 2023-2033 (US$ Million, AGR %)
Figure 53 North America Rocket Propulsion Market Attractiveness Index
Figure 54 North America Rocket Propulsion Market by Region, 2023, 2028 & 2033 (US$ Million)
Figure 55 North America Rocket Propulsion Market Forecast by Country, 2023-2033 (US$ Million, AGR %)
Figure 56 North America Rocket Propulsion Market Share Forecast by Country, 2023 & 2033 (%)
Figure 57 North America Rocket Propulsion Market Forecast by Type, 2023-2033 (US$ Million, AGR %)
Figure 58 North America Rocket Propulsion Market Share Forecast by Type, 2023 & 2033 (%)
Figure 59 North America Rocket Propulsion Market Forecast by Component, 2023-2033 (US$ Million, AGR %)
Figure 60 North America Rocket Propulsion Market Share Forecast by Component, 2023 & 2033 (%)
Figure 61 North America Rocket Propulsion Market Forecast by End User, 2023-2033 (US$ Million, AGR %)
Figure 62 North America Rocket Propulsion Market Share Forecast by End User, 2023 & 2033 (%)
Figure 63 U.S. Rocket Propulsion Market Forecast, 2023-2033 (US$ Million, AGR %)
Figure 64 Canada Rocket Propulsion Market Forecast, 2023-2033 (US$ Million, AGR %)
Figure 65 Europe Rocket Propulsion Market Attractiveness Index
Figure 66 Europe Rocket Propulsion Market by Region, 2023, 2028 & 2033 (US$ Million)
Figure 67 Europe Rocket Propulsion Market Forecast by Country, 2023-2033 (US$ Million, AGR %)
Figure 68 Europe Rocket Propulsion Market Share Forecast by Country, 2023 & 2033 (%)
Figure 69 Europe Rocket Propulsion Market Forecast by Type, 2023-2033 (US$ Million, AGR %)
Figure 70 Europe Rocket Propulsion Market Share Forecast by Type, 2023 & 2033 (%)
Figure 71 Europe Rocket Propulsion Market Forecast by Component, 2023-2033 (US$ Million, AGR %)
Figure 72 Europe Rocket Propulsion Market Share Forecast by Component, 2023 & 2033 (%)
Figure 73 Europe Rocket Propulsion Market Forecast by End User, 2023-2033 (US$ Million, AGR %)
Figure 74 Europe Rocket Propulsion Market Share Forecast by End User, 2023 & 2033 (%)
Figure 75 Germany Rocket Propulsion Market Forecast, 2023-2033 (US$ Million, AGR %)
Figure 76 France Rocket Propulsion Market Forecast, 2023-2033 (US$ Million, AGR %)
Figure 77 UK Rocket Propulsion Market Forecast, 2023-2033 (US$ Million, AGR %)
Figure 78 Italy Rocket Propulsion Market Forecast, 2023-2033 (US$ Million, AGR %)
Figure 79 Spain Rocket Propulsion Market Forecast, 2023-2033 (US$ Million, AGR %)
Figure 80 Rest of Europe Rocket Propulsion Market Forecast, 2023-2033 (US$ Million, AGR %)
Figure 81 Asia Pacific Rocket Propulsion Market Attractiveness Index
Figure 82 Asia Pacific Rocket Propulsion Market by Region, 2023, 2028 & 2033 (US$ Million)
Figure 83 Asia Pacific Rocket Propulsion Market Forecast by Country, 2023-2033 (US$ Million, AGR %)
Figure 84 Asia Pacific Rocket Propulsion Market Share Forecast by Country, 2023 & 2033 (%)
Figure 85 Asia Pacific Rocket Propulsion Market Forecast by Type, 2023-2033 (US$ Million, AGR %)
Figure 86 Asia Pacific Rocket Propulsion Market Share Forecast by Type, 2023 & 2033 (%)
Figure 87 Asia Pacific Rocket Propulsion Market Forecast by Component, 2023-2033 (US$ Million, AGR %)
Figure 88 Asia Pacific Rocket Propulsion Market Share Forecast by Component, 2023 & 2033 (%)
Figure 89 Asia Pacific Rocket Propulsion Market Forecast by End User, 2023-2033 (US$ Million, AGR %)
Figure 90 Asia Pacific Rocket Propulsion Market Share Forecast by End User, 2023 & 2033 (%)
Figure 91 China Rocket Propulsion Market Forecast, 2023-2033 (US$ Million, AGR %)
Figure 92 Japan Rocket Propulsion Market Forecast, 2023-2033 (US$ Million, AGR %)
Figure 93 India Rocket Propulsion Market Forecast, 2023-2033 (US$ Million, AGR %)
Figure 94 Australia Rocket Propulsion Market Forecast, 2023-2033 (US$ Million, AGR %)
Figure 95 South Korea Rocket Propulsion Market Forecast, 2023-2033 (US$ Million, AGR %)
Figure 96 Rest of Asia Pacific Rocket Propulsion Market Forecast, 2023-2033 (US$ Million, AGR %)
Figure 97 Latin America Rocket Propulsion Market Attractiveness Index
Figure 98 Latin America Rocket Propulsion Market by Region, 2023, 2028 & 2033 (US$ Million)
Figure 99 Latin America Rocket Propulsion Market Forecast by Country, 2023-2033 (US$ Million, AGR %)
Figure 100 Latin America Rocket Propulsion Market Share Forecast by Country, 2023 & 2033 (%)
Figure 101 Latin America Rocket Propulsion Market Forecast by Type, 2023-2033 (US$ Million, AGR %)
Figure 102 Latin America Pacific Rocket Propulsion Market Share Forecast by Type, 2023 & 2033 (%)
Figure 103 Latin America Rocket Propulsion Market Forecast by Component, 2023-2033 (US$ Million, AGR %)
Figure 104 Latin America Rocket Propulsion Market Share Forecast by Component, 2023 & 2033 (%)
Figure 105 Latin America Rocket Propulsion Market Forecast by End User, 2023-2033 (US$ Million, AGR %)
Figure 106 Latin America Rocket Propulsion Market Share Forecast by End User, 2023 & 2033 (%)
Figure 107 Brazil Rocket Propulsion Market Forecast, 2023-2033 (US$ Million, AGR %)
Figure 108 Mexico Rocket Propulsion Market Forecast, 2023-2033 (US$ Million, AGR %)
Figure 109 Rest of Latin America Rocket Propulsion Market Forecast, 2023-2033 (US$ Million, AGR %)
Figure 110 MEA Rocket Propulsion Market Attractiveness Index
Figure 111 MEA Rocket Propulsion Market by Region, 2023, 2028 & 2033 (US$ Million)
Figure 112 MEA Rocket Propulsion Market Forecast by Country, 2023-2033 (US$ Million, AGR %)
Figure 113 MEA Rocket Propulsion Market Share Forecast by Country, 2023 & 2033 (%)
Figure 114 MEA Rocket Propulsion Market Forecast by Type, 2023-2033 (US$ Million, AGR %)
Figure 115 MEA Pacific Rocket Propulsion Market Share Forecast by Type, 2023 & 2033 (%)
Figure 116 MEA Rocket Propulsion Market Forecast by Component, 2023-2033 (US$ Million, AGR %)
Figure 117 MEA Rocket Propulsion Market Share Forecast by Component, 2023 & 2033 (%)
Figure 118 MEA Rocket Propulsion Market Forecast by End User, 2023-2033 (US$ Million, AGR %)
Figure 119 MEA Rocket Propulsion Market Share Forecast by End User, 2023 & 2033 (%)
Figure 120 GCC Rocket Propulsion Market Forecast, 2023-2033 (US$ Million, AGR %)
Figure 121 South Africa Rocket Propulsion Market Forecast, 2023-2033 (US$ Million, AGR %)
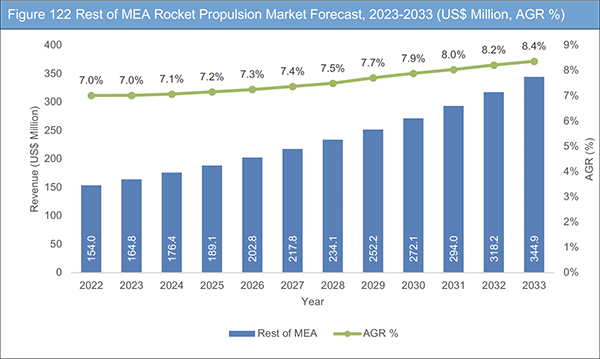
Figure 122 Rest of MEA Rocket Propulsion Market Forecast, 2023-2033 (US$ Million, AGR %)
Figure 123 Rocket Propulsion Market: Company Share/Ranking, 2022
Figure 124 Aerojet Rocketdyne Holdings, Inc.: Net Revenue, 2017-2022 (US$ Million, AGR%)
Figure 125 Aerojet Rocketdyne Holdings, Inc.: R&D, 2017-2022 (US$ Million, AGR%)
Figure 126 Aerojet Rocketdyne Holdings, Inc.: Regional Market Shares, 2022
Figure 127 Aerojet Rocketdyne Holdings, Inc.: Segment Market Shares, 2022
Figure 128 Antrix Corporation: Net Revenue, 2017-2022 (US$ Million, AGR%)
Figure 129 IHI Aerospace Co. Ltd.: Net Revenue, 2017-2021 (US$ Million, AGR%)
Figure 130 IHI Aerospace Co. Ltd.: R&D, 2017-2021 (US$ Million, AGR%)
Figure 131 IHI Aerospace Co. Ltd.: Regional Market Shares, 2021
Figure 132 IHI Aerospace Co. Ltd.: Segment Market Shares, 2021
Figure 133 Mitsubishi Heavy Industries Ltd.: Net Revenue, 2017-2022 (US$ Million, AGR%)
Figure 134 Mitsubishi Heavy Industries Ltd.: Regional Market Shares, 2022
Figure 135 Mitsubishi Heavy Industries Ltd.: Segment Market Shares, 2022
Figure 136 Northrop Grumman Corporation: Net Revenue, 2017-2022 (US$ Million, AGR%)
Figure 137 Northrop Grumman Corporation: R&D, 2017-2022 (US$ Million, AGR%)
Figure 138 Northrop Grumman Corporation: Regional Market Shares, 2022
Figure 139 Northrop Grumman Corporation: Segment Market Shares, 2022
Figure 140 Safran S.A.: Net Revenue, 2017-2022 (US$ Million, AGR%)
Figure 141 Safran S.A.: R&D, 2017-2022 (US$ Million, AGR%)
Figure 142 Safran S.A.: Regional Market Shares, 2022
Figure 143 Safran S.A.: Segment Market Shares, 2022
Figure 144 Virgin Galactic Holdings, Inc.: Net Revenue, 2017-2022 (US$ Million, AGR%)
Figure 145 Virgin Galactic Holdings, Inc.: R&D, 2017-2022 (US$ Million, AGR%)
ページTOPに戻る
Summary
Report Details
The Rocket Propulsion Market Report 2023-2033: This report will prove invaluable to leading firms striving for new revenue pockets if they wish to better understand the industry and its underlying dynamics. It will be useful for companies that would like to expand into different industries or to expand their existing operations in a new region.
Demand for Space Exploration Coupled with Growing Investments in the Space Sector
The reusability of launch vehicles is the major driving factor for overall rocket propulsion market growth and has had a transformative impact on the space industry. Traditional expendable rockets are costly to manufacture, and their one-time use makes each launch expensive. Reusable rockets, on the other hand, can be flown multiple times, spreading the development and manufacturing costs over several missions. This cost reduction has made space access more affordable, opening up new opportunities for commercial, scientific, and exploration missions. This advancement in the industry helps to space agencies to allocate resources more efficiently, which helps them to conduct more missions and scientific experiments.
High Development and Manufacturing Costs and Environmental Impact to Hamper Industry Growth
The development and implementation of rocket propulsion systems are often subject to significant cost constraints, which can impact the market dynamics and choices made by industry players. Cost constraints in the rocket propulsion market stem from various factors. High research, development, and manufacturing costs associated with building reliable and efficient propulsion systems is the major factor. The engines for a space launch system (SLS) rocket alone is very expandable and will cost more than US$580 million. It is very challenging to purchase these SLS rocket for emerging players or start-ups with limited financial resources. For example, the cost of developing a new rocket engine can range from tens of millions to billions of dollars, depending on the complexity and scale of the project.
Moreover, cost constraints have led to the rise of alternative propulsion technologies. For instance, electric propulsion systems, such as ion thrusters, offer improved fuel efficiency and reduced operational costs compared to traditional chemical rocket engines. These systems are particularly suitable for long-duration missions, where the savings in propellant outweigh the higher initial costs of electric propulsion technology.
What Questions Should You Ask before Buying a Market Research Report?
• How is the rocket propulsion market evolving?
• What is driving and restraining the rocket propulsion market?
• How will each rocket propulsion submarket segment grow over the forecast period and how much revenue will these submarkets account for in 2033?
• How will the market shares for each rocket propulsion submarket develop from 2023 to 2033?
• What will be the main driver for the overall market from 2023 to 2033?
• Will leading rocket propulsion markets broadly follow the macroeconomic dynamics, or will individual national markets outperform others?
• How will the market shares of the national markets change by 2033 and which geographical region will lead the market in 2033?
• Who are the leading players and what are their prospects over the forecast period?
• What are the rocket propulsion projects for these leading companies?
• How will the industry evolve during the period between 2023 and 2033? What are the implications of rocket propulsion projects taking place now and over the next 10 years?
• Is there a greater need for product commercialisation to further scale the rocket propulsion market?
• Where is the rocket propulsion market heading and how can you ensure you are at the forefront of the market?
• What are the best investment options for new product and service lines?
• What are the key prospects for moving companies into a new growth path and C-suite?
You need to discover how this will impact the rocket propulsion market today, and over the next 10 years:
• Our 237-page report provides 94 tables and 145 charts/graphs exclusively to you.
• The report highlights key lucrative areas in the industry so you can target them – NOW.
• It contains in-depth analysis of global, regional and national sales and growth.
• It highlights for you the key successful trends, changes and revenue projections made by your competitors.
This report tells you TODAY how the rocket propulsion market will develop in the next 10 years, and in line with the variations in COVID-19 economic recession and bounce. This market is more critical now than at any point over the last 10 years.
Forecasts to 2033 and other analyses reveal commercial prospects
• In addition to revenue forecasting to 2033, our new study provides you with recent results, growth rates, and market shares.
• You will find original analyses, with business outlooks and developments.
• Discover qualitative analyses (including market dynamics, drivers, opportunities, restraints and challenges), cost structure, impact of rising rocket propulsion prices and recent developments.
This report includes data analysis and invaluable insight into how COVID-19 will affect the industry and your company. Four COVID-19 recovery patterns and their impact, namely, “V”, “L”, “W” and “U” are discussed in this report.
Segments Covered in the Report
Type
• Rocket Engine
• Rocket Motor
Component
• Motor
• Nozzle
• Igniter
• Hardware
• Vavle
• Turbo
• Pump
• Combustion Chamber
• Propellant
• Others
End User
• Military
• Commercial
In addition to the revenue predictions for the overall world market and segments, you will also find revenue forecasts for five regional and 16 leading national markets:
North America
• U.S.
• Canada
Europe
• Germany
• UK
• France
• Spain
• Italy
• Rest of Europe
Asia Pacific
• China
• Japan
• India
• Australia
• South Korea
• Rest of Asia Pacific
Latin America
• Brazil
• Mexico
• Rest of Latin America
MEA
• GCC
• South Africa
• Rest of MEA
The report also includes profiles and for some of the leading companies in the Rocket Propulsion Market, 2023 to 2033, with a focus on this segment of these companies’ operations.
Leading companies profiled in the report
• Antrix
• Aerojet Rocketdyne Holding, Inc.
• Mitsubishi Heavy Industries Ltd.
• Northrop Grumman Corporation
• Safran S.A.
• Spacex
• Blue Origin
• China Great Wall Industry Corporation
• Virgin Galactic Holdings, Inc.
• IHI Aerospace Co. Ltd.
Overall world revenue for Rocket Propulsion Market, 2023 to 2033 in terms of value the market will surpass US$5,567.1 million in 2023, our work calculates. We predict strong revenue growth through to 2033. Our work identifies which organizations hold the greatest potential. Discover their capabilities, progress, and commercial prospects, helping you stay ahead.
How will the Rocket Propulsion Market, 2023 to 2033 report help you?
In summary, our 230+ page report provides you with the following knowledge:
• Revenue forecasts to 2033 for Rocket Propulsion Market, 2023 to 2033 Market, with forecasts for application, system, and end user, each forecast at a global and regional level – discover the industry’s prospects, finding the most lucrative places for investments and revenues.
• Revenue forecasts to 2033 for five regional and 16 key national markets – See forecasts for the Rocket Propulsion Market, 2023 to 2033 market in North America, Europe, Asia-Pacific, Latin America, and MEA. Also forecasted is the market in the US, Canada, Mexico, Brazil, Germany, France, UK, Italy, China, India, Japan, and Australia among other prominent economies.
• Prospects for established firms and those seeking to enter the market – including company profiles for 10 of the major companies involved in the Rocket Propulsion Market, 2023 to 2033.
Find quantitative and qualitative analyses with independent predictions. Receive information that only our report contains, staying informed with invaluable business intelligence.
Information found nowhere else
With our new report, you are less likely to fall behind in knowledge or miss out on opportunities. See how our work could benefit your research, analyses, and decisions. Visiongain’s study is for everybody needing commercial analyses for the Rocket Propulsion Market, 2023 to 2033, market-leading companies. You will find data, trends and predictions.
ページTOPに戻る
Table of Contents
Table of Contents
1 Report Overview
1.1 Objectives of the Study
1.2 Introduction to Rocket Propulsion Market
1.3 What This Report Delivers
1.4 Why You Should Read This Report
1.5 Key Questions Answered by This Analytical Report
1.6 Who is This Report for?
1.7 Methodology
1.7.1 Market Definitions
1.7.2 Market Evaluation & Forecasting Methodology
1.7.3 Data Validation
1.7.3.1 Primary Research
1.7.3.2 Secondary Research
1.8 Frequently Asked Questions (FAQs)
1.9 Associated Visiongain Reports
1.10 About Visiongain
2 Executive Summary
3 Market Overview
3.1 Key Findings
3.2 Market Dynamics
3.2.1 Market Driving Factors
3.2.1.1 Increasing Demand for Space Exploration
3.2.1.2 Increasing Global Launch Activities and Investments in the Space Sector
3.2.1.3 Reusability of Launch Vehicles
3.2.2 Market Restraining Factors
3.2.2.1 High Development and Manufacturing Costs
3.2.2.2 Environmental Impact
3.2.3 Market Opportunities
3.2.3.1 Growing Market for Small Satellites in Space Sector
3.2.3.2 Rising Demand for Environmentally Friendly Propulsion Systems
3.3 COVID-19 Impact Analysis
3.4 Porter’s Five Forces Analysis
3.4.1 Moderate Bargaining Power of Suppliers
3.4.2 Moderate Bargaining Power of Buyers
3.4.3 Highly Competitive Rivalry
3.4.4 Low Threat from Substitutes
3.4.5 Low Threat of New Entrants
3.5 PEST Analysis
4 Rocket Propulsion Market Analysis by Type
4.1 Key Findings
4.2 Type Segment: Market Attractiveness Index
4.3 Rocket Propulsion Market Size Estimation and Forecast by Type
4.4 Rocket Engine
4.4.1 Market Size by Region, 2023-2033 (US$ Million)
4.4.2 Market Share by Region, 2023 & 2033 (%)
4.5 Rocket Motor
4.5.1 Market Size by Region, 2023-2033 (US$ Million)
4.5.2 Market Share by Region, 2023 & 2033 (%)
5 Rocket Propulsion Market Analysis by Component
5.1 Key Findings
5.2 Component Segment: Market Attractiveness Index
5.3 Rocket Propulsion Market Size Estimation and Forecast by Component
5.4 Motor
5.4.1 Market Size by Region, 2023-2033 (US$ Million)
5.4.2 Market Share by Region, 2023 & 2033 (%)
5.5 Nozzle
5.5.1 Market Size by Region, 2023-2033 (US$ Million)
5.5.2 Market Share by Region, 2023 & 2033 (%)
5.6 Igniter
5.6.1 Market Size by Region, 2023-2033 (US$ Million)
5.6.2 Market Share by Region, 2023 & 2033 (%)
5.7 Hardware
5.7.1 Market Size by Region, 2023-2033 (US$ Million)
5.7.2 Market Share by Region, 2023 & 2033 (%)
5.8 Valve
5.8.1 Market Size by Region, 2023-2033 (US$ Million)
5.8.2 Market Share by Region, 2023 & 2033 (%)
5.9 Turbo
5.9.1 Market Size by Region, 2023-2033 (US$ Million)
5.9.2 Market Share by Region, 2023 & 2033 (%)
5.10 Pump
5.10.1 Market Size by Region, 2023-2033 (US$ Million)
5.10.2 Market Share by Region, 2023 & 2033 (%)
5.11 Combustion Chamber
5.11.1 Market Size by Region, 2023-2033 (US$ Million)
5.11.2 Market Share by Region, 2023 & 2033 (%)
5.12 Propellant
5.12.1 Market Size by Region, 2023-2033 (US$ Million)
5.12.2 Market Share by Region, 2023 & 2033 (%)
5.13 Others
5.13.1 Market Size by Region, 2023-2033 (US$ Million)
5.13.2 Market Share by Region, 2023 & 2033 (%)
6 Rocket Propulsion Market Analysis by End User
6.1 Key Findings
6.2 End User Segment: Market Attractiveness Index
6.3 Rocket Propulsion Market Size Estimation and Forecast by End User
6.4 Military
6.4.1 Market Size by Region, 2023-2033 (US$ Million)
6.4.2 Market Share by Region, 2023 & 2033 (%)
6.5 Commercial
6.5.1 Market Size by Region, 2023-2033 (US$ Million)
6.5.2 Market Share by Region, 2023 & 2033 (%)
7 Rocket Propulsion Market Analysis by Region
7.1 Key Findings
7.2 Regional Market Size Estimation and Forecast
8 North America Rocket Propulsion Market Analysis
8.1 Key Findings
8.2 North America Rocket Propulsion Market Attractiveness Index
8.3 North America Rocket Propulsion Market by Country, 2023, 2028 & 2033 (US$ Million)
8.4 North America Rocket Propulsion Market Size Estimation and Forecast by Country
8.5 North America Rocket Propulsion Market Size Estimation and Forecast by Type
8.6 North America Rocket Propulsion Market Size Estimation and Forecast by Component
8.7 North America Rocket Propulsion Market Size Estimation and Forecast by End User
8.8 U.S. Rocket Propulsion Market Analysis
8.9 Canada Rocket Propulsion Market Analysis
9 Europe Rocket Propulsion Market Analysis
9.1 Key Findings
9.2 Europe Rocket Propulsion Market Attractiveness Index
9.3 Europe Rocket Propulsion Market by Country, 2023, 2028 & 2033 (US$ Million)
9.4 Europe Rocket Propulsion Market Size Estimation and Forecast by Country
9.5 Europe Rocket Propulsion Market Size Estimation and Forecast by Type
9.6 Europe Rocket Propulsion Market Size Estimation and Forecast by Component
9.7 Europe Rocket Propulsion Market Size Estimation and Forecast by End User
9.8 Germany Rocket Propulsion Market Analysis
9.9 France Rocket Propulsion Market Analysis
9.10 UK Rocket Propulsion Market Analysis
9.11 Italy Rocket Propulsion Market Analysis
9.12 Spain Rocket Propulsion Market Analysis
9.13 Rest of Europe Rocket Propulsion Market Analysis
10 Asia Pacific Rocket Propulsion Market Analysis
10.1 Key Findings
10.2 Asia Pacific Rocket Propulsion Market Attractiveness Index
10.3 Asia Pacific Rocket Propulsion Market by Country, 2023, 2028 & 2033 (US$ Million)
10.4 Asia Pacific Rocket Propulsion Market Size Estimation and Forecast by Country
10.5 Asia Pacific Rocket Propulsion Market Size Estimation and Forecast by Type
10.6 Asia Pacific Rocket Propulsion Market Size Estimation and Forecast by Component
10.7 Asia Pacific Rocket Propulsion Market Size Estimation and Forecast by End User
10.8 China Rocket Propulsion Market Analysis
10.9 Japan Rocket Propulsion Market Analysis
10.10 India Rocket Propulsion Market Analysis
10.11 Australia Rocket Propulsion Market Analysis
10.12 South Korea Rocket Propulsion Market Analysis
10.13 Rest of Asia Pacific Rocket Propulsion Market Analysis
11 Latin America Rocket Propulsion Market Analysis
11.1 Key Findings
11.2 Latin America Rocket Propulsion Market Attractiveness Index
11.3 Latin America Rocket Propulsion Market by Country, 2023, 2028 & 2033 (US$ Million)
11.4 Latin America Rocket Propulsion Market Size Estimation and Forecast by Country
11.5 Latin America Rocket Propulsion Market Size Estimation and Forecast by Type
11.6 Latin America Rocket Propulsion Market Size Estimation and Forecast by Component
11.7 Latin America Rocket Propulsion Market Size Estimation and Forecast by End User
11.8 Brazil Rocket Propulsion Market Analysis
11.9 Mexico Rocket Propulsion Market Analysis
11.10 Rest of Latin America Rocket Propulsion Market Analysis
12 MEA Rocket Propulsion Market Analysis
12.1 Key Findings
12.2 MEA Rocket Propulsion Market Attractiveness Index
12.3 MEA Rocket Propulsion Market by Country, 2023, 2028 & 2033 (US$ Million)
12.4 MEA Rocket Propulsion Market Size Estimation and Forecast by Country
12.5 MEA Rocket Propulsion Market Size Estimation and Forecast by Type
12.6 MEA Rocket Propulsion Market Size Estimation and Forecast by Component
12.7 MEA Rocket Propulsion Market Size Estimation and Forecast by End User
12.8 GCC Rocket Propulsion Market Analysis
12.9 South Africa Rocket Propulsion Market Analysis
12.10 Rest of MEA Rocket Propulsion Market Analysis
13 Company Profiles
13.1 Competitive Landscape, 2022
13.2 Strategic Outlook
13.3 Aerojet Rocketdyne Holdings, Inc.
13.3.1 Company Snapshot
13.3.2 Company Overview
13.3.3 Financial Analysis
13.3.3.1 Net Revenue, 2017-2022
13.3.3.2 R&D, 2017-2022
13.3.3.3 Regional Market Shares, 2022
13.3.3.4 Segment Market Shares, 2022
13.3.4 Product Benchmarking
13.3.5 Strategic Outlook
13.4 Antrix Corporation Limited
13.4.1 Company Snapshot
13.4.2 Company Overview
13.4.3 Financial Analysis
13.4.3.1 Net Revenue, 2017-2022
13.4.4 Product Benchmarking
13.4.5 Strategic Outlook
13.5 Blue Origin
13.5.1 Company Snapshot
13.5.2 Company Overview
13.5.3 Product Benchmarking
13.5.4 Strategic Outlook
13.6 China Great Wall Industry Corporation
13.6.1 Company Snapshot
13.6.2 Company Overview
13.6.3 Product Benchmarking
13.6.4 Strategic Outlook
13.7 IHI Aerospace Co. Ltd.
13.7.1 Company Snapshot
13.7.2 Company Overview
13.7.3 Financial Analysis
13.7.3.1 Net Revenue, 2017-2021
13.7.3.2 R&D, 2017-2021
13.7.3.3 Regional Market Shares, 2021
13.7.3.4 Segment Market Shares, 2021
13.7.4 Product Benchmarking
13.7.5 Strategic Outlook
13.8 Mitsubishi Heavy Industries Ltd.
13.8.1 Company Snapshot
13.8.2 Company Overview
13.8.3 Financial Analysis
13.8.3.1 Net Revenue, 2017-2022
13.8.3.2 Regional Market Shares, 2022
13.8.3.3 Segment Market Shares, 2022
13.8.4 Product Benchmarking
13.8.5 Strategic Outlook
13.9 Northrop Grumman Corporation
13.9.1 Company Snapshot
13.9.2 Company Overview
13.9.3 Financial Analysis
13.9.3.1 Net Revenue, 2017-2022
13.9.3.2 R&D, 2017-2022
13.9.3.3 Regional Market Shares, 2022
13.9.3.4 Segment Market Shares, 2022
13.9.4 Product Benchmarking
13.9.5 Strategic Outlook
13.10 Safran S.A.
13.10.1 Company Snapshot
13.10.2 Company Overview
13.10.3 Financial Analysis
13.10.3.1 Net Revenue, 2017-2022
13.10.3.2 R&D, 2017-2022
13.10.3.3 Regional Market Shares, 2022
13.10.3.4 Segment Market Shares, 2022
13.10.4 Product Benchmarking
13.10.5 Strategic Outlook
13.11 Space Exploration Technologies Corp.
13.11.1 Company Snapshot
13.11.2 Company Overview
13.11.3 Product Benchmarking
13.11.4 Strategic Outlook
13.12 Virgin Galactic Holdings, Inc.
13.12.1 Company Snapshot
13.12.2 Company Overview
13.12.3 Financial Analysis
13.12.3.1 Net Revenue, 2017-2022
13.12.3.2 R&D, 2017-2022
13.12.4 Product Benchmarking
13.12.5 Strategic Outlook
14 Conclusion and Recommendations
14.1 Concluding Remarks from Visiongain
14.2 Recommendations for Market Players
ページTOPに戻る
List of Tables/Graphs
List of Tables
Table 1 Rocket Propulsion Market Snapshot, 2023 & 2033 (US$ Million, CAGR %)
Table 2 Rocket Propulsion Market Forecast by Region, 2023-2033 (US$ Million, AGR%, CAGR%): “V” Shaped Recovery
Table 3 Rocket Propulsion Market Forecast by Region, 2023-2033 (US$ Million, AGR%, CAGR%): “U” Shaped Recovery
Table 4 Rocket Propulsion Market Forecast by Region, 2023-2033 (US$ Million, AGR%, CAGR%): “W” Shaped Recovery
Table 5 Rocket Propulsion Market Forecast by Region, 2023-2033 (US$ Million, AGR%, CAGR%): “L” Shaped Recovery
Table 6 Rocket Propulsion Market Forecast by Type, 2023-2033 (US$ Million, AGR%, CAGR%)
Table 7 Rocket Engine Market Forecast by Region, 2023-2033 (US$ Million, AGR%, CAGR%)
Table 8 Rocket Motor Segment Market Forecast by Region, 2023-2033 (US$ Million, AGR%, CAGR%)
Table 9 Rocket Propulsion Market Forecast by Component, 2023-2033 (US$ Million, AGR%, CAGR%)
Table 10 Motor Segment Market Forecast by Region, 2023-2033 (US$ Million, AGR%, CAGR%)
Table 11 Nozzle Segment Market Forecast by Region, 2023-2033 (US$ Million, AGR%, CAGR%)
Table 12 Igniter Segment Market Forecast by Region, 2023-2033 (US$ Million, AGR%, CAGR%)
Table 13 Hardware Segment Market Forecast by Region, 2023-2033 (US$ Million, AGR%, CAGR%)
Table 14 Valve Segment Market Forecast by Region, 2023-2033 (US$ Million, AGR%, CAGR%)
Table 15 Turbo Segment Market Forecast by Region, 2023-2033 (US$ Million, AGR%, CAGR%)
Table 16 Pump Segment Market Forecast by Region, 2023-2033 (US$ Million, AGR%, CAGR%)
Table 17 Combustion Chamber Segment Market Forecast by Region, 2023-2033 (US$ Million, AGR%, CAGR%)
Table 18 Propellant Segment Market Forecast by Region, 2023-2033 (US$ Million, AGR%, CAGR%)
Table 19 Others Segment Market Forecast by Region, 2023-2033 (US$ Million, AGR%, CAGR%)
Table 20 Rocket Propulsion Market Forecast by End User, 2023-2033 (US$ Million, AGR%, CAGR%)
Table 21 Military Segment Market Forecast by Region, 2023-2033 (US$ Million, AGR%, CAGR%)
Table 22 Commercial Segment Market Forecast by Region, 2023-2033 (US$ Million, AGR%, CAGR%)
Table 23 Rocket Propulsion Market Forecast by Region, 2023-2033 (US$ Million, AGR%, CAGR%)
Table 24 North America Rocket Propulsion Market Forecast by Country, 2023-2033 (US$ Million, AGR%, CAGR%)
Table 25 North America Rocket Propulsion Market Forecast by Type, 2023-2033 (US$ Million, AGR%, CAGR%)
Table 26 North America Rocket Propulsion Market Forecast by Component, 2023-2033 (US$ Million, AGR%, CAGR%)
Table 27 North America Rocket Propulsion Market Forecast by End User, 2023-2033 (US$ Million, AGR%, CAGR%)
Table 28 U.S. Rocket Propulsion Market Forecast, 2023-2033 (US$ Million, AGR%, CAGR%)
Table 29 Canada Rocket Propulsion Market Forecast, 2023-2033 (US$ Million, AGR%, CAGR%)
Table 30 Europe Rocket Propulsion Market Forecast by Country, 2023-2033 (US$ Million, AGR%, CAGR%)
Table 31 Europe Rocket Propulsion Market Forecast by Type, 2023-2033 (US$ Million, AGR%, CAGR%)
Table 32 Europe Rocket Propulsion Market Forecast by Component, 2023-2033 (US$ Million, AGR%, CAGR%)
Table 33 Europe Rocket Propulsion Market Forecast by End User, 2023-2033 (US$ Million, AGR%, CAGR%)
Table 34 Germany Rocket Propulsion Market Forecast, 2023-2033 (US$ Million, AGR%, CAGR%)
Table 35 France Rocket Propulsion Market Forecast, 2023-2033 (US$ Million, AGR%, CAGR%)
Table 36 UK Rocket Propulsion Market Forecast, 2023-2033 (US$ Million, AGR%, CAGR%)
Table 37 Italy Rocket Propulsion Market Forecast, 2023-2033 (US$ Million, AGR%, CAGR%)
Table 38 Spain Rocket Propulsion Market Forecast, 2023-2033 (US$ Million, AGR%, CAGR%)
Table 39 Rest of Europe Rocket Propulsion Market Forecast, 2023-2033 (US$ Million, AGR%, CAGR%)
Table 40 Asia Pacific Rocket Propulsion Market Forecast by Country, 2023-2033 (US$ Million, AGR%, CAGR%)
Table 41 Asia Pacific Rocket Propulsion Market Forecast by Type, 2023-2033 (US$ Million, AGR%, CAGR%)
Table 42 Asia Pacific Rocket Propulsion Market Forecast by Component, 2023-2033 (US$ Million, AGR%, CAGR%)
Table 43 Asia Pacific Rocket Propulsion Market Forecast by End User, 2023-2033 (US$ Million, AGR%, CAGR%)
Table 44 China Rocket Propulsion Market Forecast, 2023-2033 (US$ Million, AGR%, CAGR%)
Table 45 Japan Rocket Propulsion Market Forecast, 2023-2033 (US$ Million, AGR%, CAGR%)
Table 46 India Rocket Propulsion Market Forecast, 2023-2033 (US$ Million, AGR%, CAGR%)
Table 47 Australia Rocket Propulsion Market Forecast, 2023-2033 (US$ Million, AGR%, CAGR%)
Table 48 South Korea Rocket Propulsion Market Forecast, 2023-2033 (US$ Million, AGR%, CAGR%)
Table 49 Rest of Asia Pacific Rocket Propulsion Market Forecast, 2023-2033 (US$ Million, AGR%, CAGR%)
Table 50 Latin America Rocket Propulsion Market Forecast by Country, 2023-2033 (US$ Million, AGR%, CAGR%)
Table 51 Latin America Rocket Propulsion Market Forecast by Type, 2023-2033 (US$ Million, AGR%, CAGR%)
Table 52 Asia Pacific Rocket Propulsion Market Forecast by Component, 2023-2033 (US$ Million, AGR%, CAGR%)
Table 53 Latin America Rocket Propulsion Market Forecast by End User, 2023-2033 (US$ Million, AGR%, CAGR%)
Table 54 Brazil Rocket Propulsion Market Forecast, 2023-2033 (US$ Million, AGR%, CAGR%)
Table 55 Mexico Rocket Propulsion Market Forecast, 2023-2033 (US$ Million, AGR%, CAGR%)
Table 56 Rest of Latin America Rocket Propulsion Market Forecast, 2023-2033 (US$ Million, AGR%, CAGR%)
Table 57 MEA Rocket Propulsion Market Forecast by Country, 2023-2033 (US$ Million, AGR%, CAGR%)
Table 58 MEA Rocket Propulsion Market Forecast by Type, 2023-2033 (US$ Million, AGR%, CAGR%)
Table 59 Asia Pacific Rocket Propulsion Market Forecast by Component, 2023-2033 (US$ Million, AGR%, CAGR%)
Table 60 MEA Rocket Propulsion Market Forecast by End User, 2023-2033 (US$ Million, AGR%, CAGR%)
Table 61 GCC Rocket Propulsion Market Forecast, 2023-2033 (US$ Million, AGR%, CAGR%)
Table 62 South Africa Rocket Propulsion Market Forecast, 2023-2033 (US$ Million, AGR%, CAGR%)
Table 63 Rest of MEA Rocket Propulsion Market Forecast, 2023-2033 (US$ Million, AGR%, CAGR%)
Table 64 Strategic Outlook
Table 65 Aerojet Rocketdyne Holdings, Inc.: Key Details, (CEO, HQ, Revenue, Founded, No. of Employees, Company Type, Website, Business Segment)
Table 66. Aerojet Rocketdyne Holdings, Inc.: Product Benchmarking
Table 67 Aerojet Rocketdyne Holdings, Inc.: Strategic Outlook
Table 68 Antrix Corporation Limited: Key Details, (CEO, HQ, Revenue, Founded, Company Type, Website, Business Segment)
Table 69 Antrix Corporation Limited: Product Benchmarking
Table 70 Antrix Corporation Limited: Strategic Outlook
Table 71 Blue Origin: Key Details, (CEO, HQ, Founded, No. of Employees, Company Type, Website, Business Segment)
Table 72 Blue Origin: Product Benchmarking
Table 73 Blue Origin: Strategic Outlook
Table 74 China Great Wall Industry Corporation: Key Details, (CEO, HQ, Revenue, Founded, No. of Employees, Company Type, Website, Business Segment)
Table 75 China Great Wall Industry Corporation: Product Benchmarking
Table 76 China Great Wall Industry Corporation: Strategic Outlook
Table 77 IHI Aerospace Co. Ltd.: Key Details, (CEO, HQ, Revenue, Founded, No. of Employees, Company Type, Website, Business Segment)
Table 78 IHI Aerospace Co. Ltd.: Product Benchmarking
Table 79 IHI Aerospace Co. Ltd.: Strategic Outlook
Table 80 Mitsubishi Heavy Industries Ltd.: Key Details, (CEO, HQ, Revenue, Founded, No. of Employees, Company Type, Website, Business Segment)
Table 81 Mitsubishi Heavy Industries Ltd.: Product Benchmarking
Table 82 Mitsubishi Heavy Industries Ltd.: Strategic Outlook
Table 83 Northrop Grumman Corporation: Key Details, (CEO, HQ, Revenue, Founded, No. of Employees, Company Type, Website, Business Segment)
Table 84 Northrop Grumman Corporation: Product Benchmarking
Table 85 Northrop Grumman Corporation: Strategic Outlook
Table 86 Safran S.A.: Key Details, (CEO, HQ, Revenue, Founded, No. of Employees, Company Type, Website, Business Segment)
Table 87 Safran S.A.: Product Benchmarking
Table 88 Safran S.A.: Strategic Outlook
Table 89 Space Exploration Technologies Corp.: Key Details, (CEO, HQ, Founded, No. of Employees, Company Type, Website, Business Segment)
Table 90 Space Exploration Technologies Corp.: Product Benchmarking
Table 91 Space Exploration Technologies Corp.: Strategic Outlook
Table 92 Virgin Galactic Holdings, Inc.: Key Details, (CEO, HQ, Revenue, Founded, No. of Employees, Company Type, Website, Business Segment)
Table 93 Virgin Galactic Holdings, Inc.: Product Benchmarking
Table 94 Virgin Galactic Holdings, Inc.: Strategic Outlook
List of Figures
Figure 1 Rocket Propulsion Market Segmentation
Figure 2 Rocket Propulsion Market by Type: Market Attractiveness Index
Figure 3 Rocket Propulsion Market by Component: Market Attractiveness Index
Figure 4 Rocket Propulsion Market by End User: Market Attractiveness Index
Figure 5 Rocket Propulsion Market Attractiveness Index by Region
Figure 6 Rocket Propulsion Market: Market Dynamics
Figure 7 Rocket Propulsion Market by Region, 2023-2033 (US$ Million, AGR %): “V” Shaped Recovery
Figure 8 Rocket Propulsion Market by Region, 2023-2033 (US$ Million, AGR %): “U” Shaped Recovery
Figure 9 Rocket Propulsion Market by Region, 2023-2033 (US$ Million, AGR %): “W” Shaped Recovery
Figure 10 Rocket Propulsion Market by Region, 2023-2033 (US$ Million, AGR %): “L” Shaped Recovery
Figure 11 Rocket Propulsion Market: Porter’s Five Forces Analysis
Figure 12 Rocket Propulsion Market: PEST Analysis
Figure 13 Rocket Propulsion Market by Type: Market Attractiveness Index
Figure 14 Rocket Propulsion Market Forecast by Type, 2023-2033 (US$ Million, AGR %)
Figure 15 Rocket Propulsion Market Share Forecast by Type, 2023, 2028, 2033 (%)
Figure 16 Rocket Engine Segment Market Forecast by Region, 2023-2033 (US$ Million, AGR %)
Figure 17 Surveillance Segment Market Share Forecast by Region, 2023 & 2033 (%)
Figure 18 Rocket Motor Segment Market Forecast by Region, 2023-2033 (US$ Million, AGR %)
Figure 19 Rocket Motor Segment Market Share Forecast by Region, 2023 & 2033 (%)
Figure 20 Rocket Propulsion Market by Component: Market Attractiveness Index
Figure 21 Rocket Propulsion Market Forecast by Component, 2023-2033 (US$ Million, AGR %)
Figure 22 Rocket Propulsion Market Share Forecast by Component, 2023, 2028, 2033 (%)
Figure 23 Motor Segment Market Forecast by Region, 2023-2033 (US$ Million, AGR %)
Figure 24 Motor Segment Market Share Forecast by Region, 2023 & 2033 (%)
Figure 25 Nozzle Segment Market Forecast by Region, 2023-2033 (US$ Million, AGR %)
Figure 26 Nozzle Segment Market Share Forecast by Region, 2023 & 2033 (%)
Figure 27 Igniter Segment Market Forecast by Region, 2023-2033 (US$ Million, AGR %)
Figure 28 Igniter Segment Market Share Forecast by Region, 2023 & 2033 (%)
Figure 29 Hardware Segment Market Forecast by Region, 2023-2033 (US$ Million, AGR %)
Figure 30 Hardware Segment Market Share Forecast by Region, 2023 & 2033 (%)
Figure 31 Valve Segment Market Forecast by Region, 2023-2033 (US$ Million, AGR %)
Figure 32 Valve Segment Market Share Forecast by Region, 2023 & 2033 (%)
Figure 33 Turbo Segment Market Forecast by Region, 2023-2033 (US$ Million, AGR %)
Figure 34 Turbo Segment Market Share Forecast by Region, 2023 & 2033 (%)
Figure 35 Pump Segment Market Forecast by Region, 2023-2033 (US$ Million, AGR %)
Figure 36 Pump Segment Market Share Forecast by Region, 2023 & 2033 (%)
Figure 37 Combustion Chamber Segment Market Forecast by Region, 2023-2033 (US$ Million, AGR %)
Figure 38 Combustion Chamber Segment Market Share Forecast by Region, 2023 & 2033 (%)
Figure 39 Propellant Segment Market Forecast by Region, 2023-2033 (US$ Million, AGR %)
Figure 40 Propellant Segment Market Share Forecast by Region, 2023 & 2033 (%)
Figure 41 Others Segment Market Forecast by Region, 2023-2033 (US$ Million, AGR %)
Figure 42 Others Segment Market Share Forecast by Region, 2023 & 2033 (%)
Figure 43 Rocket Propulsion Market by End User: Market Attractiveness Index
Figure 44 Rocket Propulsion Market Forecast by End User, 2023-2033 (US$ Million, AGR %)
Figure 45 Rocket Propulsion Market Share Forecast by End User, 2023, 2028, 2033 (%)
Figure 46 Military Segment Market Forecast by Region, 2023-2033 (US$ Million, AGR %)
Figure 47 Military Segment Market Share Forecast by Region, 2023 & 2033 (%)
Figure 48 Commercial Segment Market Forecast by Region, 2023-2033 (US$ Million, AGR %)
Figure 49 Commercial Segment Market Share Forecast by Region, 2023 & 2033 (%)
Figure 50 Rocket Propulsion Market Forecast by Region 2023 and 2033 (Revenue, CAGR%)
Figure 51 Rocket Propulsion Market Share Forecast by Region 2023, 2028, 2033 (%)
Figure 52 Rocket Propulsion Market by Region, 2023-2033 (US$ Million, AGR %)
Figure 53 North America Rocket Propulsion Market Attractiveness Index
Figure 54 North America Rocket Propulsion Market by Region, 2023, 2028 & 2033 (US$ Million)
Figure 55 North America Rocket Propulsion Market Forecast by Country, 2023-2033 (US$ Million, AGR %)
Figure 56 North America Rocket Propulsion Market Share Forecast by Country, 2023 & 2033 (%)
Figure 57 North America Rocket Propulsion Market Forecast by Type, 2023-2033 (US$ Million, AGR %)
Figure 58 North America Rocket Propulsion Market Share Forecast by Type, 2023 & 2033 (%)
Figure 59 North America Rocket Propulsion Market Forecast by Component, 2023-2033 (US$ Million, AGR %)
Figure 60 North America Rocket Propulsion Market Share Forecast by Component, 2023 & 2033 (%)
Figure 61 North America Rocket Propulsion Market Forecast by End User, 2023-2033 (US$ Million, AGR %)
Figure 62 North America Rocket Propulsion Market Share Forecast by End User, 2023 & 2033 (%)
Figure 63 U.S. Rocket Propulsion Market Forecast, 2023-2033 (US$ Million, AGR %)
Figure 64 Canada Rocket Propulsion Market Forecast, 2023-2033 (US$ Million, AGR %)
Figure 65 Europe Rocket Propulsion Market Attractiveness Index
Figure 66 Europe Rocket Propulsion Market by Region, 2023, 2028 & 2033 (US$ Million)
Figure 67 Europe Rocket Propulsion Market Forecast by Country, 2023-2033 (US$ Million, AGR %)
Figure 68 Europe Rocket Propulsion Market Share Forecast by Country, 2023 & 2033 (%)
Figure 69 Europe Rocket Propulsion Market Forecast by Type, 2023-2033 (US$ Million, AGR %)
Figure 70 Europe Rocket Propulsion Market Share Forecast by Type, 2023 & 2033 (%)
Figure 71 Europe Rocket Propulsion Market Forecast by Component, 2023-2033 (US$ Million, AGR %)
Figure 72 Europe Rocket Propulsion Market Share Forecast by Component, 2023 & 2033 (%)
Figure 73 Europe Rocket Propulsion Market Forecast by End User, 2023-2033 (US$ Million, AGR %)
Figure 74 Europe Rocket Propulsion Market Share Forecast by End User, 2023 & 2033 (%)
Figure 75 Germany Rocket Propulsion Market Forecast, 2023-2033 (US$ Million, AGR %)
Figure 76 France Rocket Propulsion Market Forecast, 2023-2033 (US$ Million, AGR %)
Figure 77 UK Rocket Propulsion Market Forecast, 2023-2033 (US$ Million, AGR %)
Figure 78 Italy Rocket Propulsion Market Forecast, 2023-2033 (US$ Million, AGR %)
Figure 79 Spain Rocket Propulsion Market Forecast, 2023-2033 (US$ Million, AGR %)
Figure 80 Rest of Europe Rocket Propulsion Market Forecast, 2023-2033 (US$ Million, AGR %)
Figure 81 Asia Pacific Rocket Propulsion Market Attractiveness Index
Figure 82 Asia Pacific Rocket Propulsion Market by Region, 2023, 2028 & 2033 (US$ Million)
Figure 83 Asia Pacific Rocket Propulsion Market Forecast by Country, 2023-2033 (US$ Million, AGR %)
Figure 84 Asia Pacific Rocket Propulsion Market Share Forecast by Country, 2023 & 2033 (%)
Figure 85 Asia Pacific Rocket Propulsion Market Forecast by Type, 2023-2033 (US$ Million, AGR %)
Figure 86 Asia Pacific Rocket Propulsion Market Share Forecast by Type, 2023 & 2033 (%)
Figure 87 Asia Pacific Rocket Propulsion Market Forecast by Component, 2023-2033 (US$ Million, AGR %)
Figure 88 Asia Pacific Rocket Propulsion Market Share Forecast by Component, 2023 & 2033 (%)
Figure 89 Asia Pacific Rocket Propulsion Market Forecast by End User, 2023-2033 (US$ Million, AGR %)
Figure 90 Asia Pacific Rocket Propulsion Market Share Forecast by End User, 2023 & 2033 (%)
Figure 91 China Rocket Propulsion Market Forecast, 2023-2033 (US$ Million, AGR %)
Figure 92 Japan Rocket Propulsion Market Forecast, 2023-2033 (US$ Million, AGR %)
Figure 93 India Rocket Propulsion Market Forecast, 2023-2033 (US$ Million, AGR %)
Figure 94 Australia Rocket Propulsion Market Forecast, 2023-2033 (US$ Million, AGR %)
Figure 95 South Korea Rocket Propulsion Market Forecast, 2023-2033 (US$ Million, AGR %)
Figure 96 Rest of Asia Pacific Rocket Propulsion Market Forecast, 2023-2033 (US$ Million, AGR %)
Figure 97 Latin America Rocket Propulsion Market Attractiveness Index
Figure 98 Latin America Rocket Propulsion Market by Region, 2023, 2028 & 2033 (US$ Million)
Figure 99 Latin America Rocket Propulsion Market Forecast by Country, 2023-2033 (US$ Million, AGR %)
Figure 100 Latin America Rocket Propulsion Market Share Forecast by Country, 2023 & 2033 (%)
Figure 101 Latin America Rocket Propulsion Market Forecast by Type, 2023-2033 (US$ Million, AGR %)
Figure 102 Latin America Pacific Rocket Propulsion Market Share Forecast by Type, 2023 & 2033 (%)
Figure 103 Latin America Rocket Propulsion Market Forecast by Component, 2023-2033 (US$ Million, AGR %)
Figure 104 Latin America Rocket Propulsion Market Share Forecast by Component, 2023 & 2033 (%)
Figure 105 Latin America Rocket Propulsion Market Forecast by End User, 2023-2033 (US$ Million, AGR %)
Figure 106 Latin America Rocket Propulsion Market Share Forecast by End User, 2023 & 2033 (%)
Figure 107 Brazil Rocket Propulsion Market Forecast, 2023-2033 (US$ Million, AGR %)
Figure 108 Mexico Rocket Propulsion Market Forecast, 2023-2033 (US$ Million, AGR %)
Figure 109 Rest of Latin America Rocket Propulsion Market Forecast, 2023-2033 (US$ Million, AGR %)
Figure 110 MEA Rocket Propulsion Market Attractiveness Index
Figure 111 MEA Rocket Propulsion Market by Region, 2023, 2028 & 2033 (US$ Million)
Figure 112 MEA Rocket Propulsion Market Forecast by Country, 2023-2033 (US$ Million, AGR %)
Figure 113 MEA Rocket Propulsion Market Share Forecast by Country, 2023 & 2033 (%)
Figure 114 MEA Rocket Propulsion Market Forecast by Type, 2023-2033 (US$ Million, AGR %)
Figure 115 MEA Pacific Rocket Propulsion Market Share Forecast by Type, 2023 & 2033 (%)
Figure 116 MEA Rocket Propulsion Market Forecast by Component, 2023-2033 (US$ Million, AGR %)
Figure 117 MEA Rocket Propulsion Market Share Forecast by Component, 2023 & 2033 (%)
Figure 118 MEA Rocket Propulsion Market Forecast by End User, 2023-2033 (US$ Million, AGR %)
Figure 119 MEA Rocket Propulsion Market Share Forecast by End User, 2023 & 2033 (%)
Figure 120 GCC Rocket Propulsion Market Forecast, 2023-2033 (US$ Million, AGR %)
Figure 121 South Africa Rocket Propulsion Market Forecast, 2023-2033 (US$ Million, AGR %)
Figure 122 Rest of MEA Rocket Propulsion Market Forecast, 2023-2033 (US$ Million, AGR %)
Figure 123 Rocket Propulsion Market: Company Share/Ranking, 2022
Figure 124 Aerojet Rocketdyne Holdings, Inc.: Net Revenue, 2017-2022 (US$ Million, AGR%)
Figure 125 Aerojet Rocketdyne Holdings, Inc.: R&D, 2017-2022 (US$ Million, AGR%)
Figure 126 Aerojet Rocketdyne Holdings, Inc.: Regional Market Shares, 2022
Figure 127 Aerojet Rocketdyne Holdings, Inc.: Segment Market Shares, 2022
Figure 128 Antrix Corporation: Net Revenue, 2017-2022 (US$ Million, AGR%)
Figure 129 IHI Aerospace Co. Ltd.: Net Revenue, 2017-2021 (US$ Million, AGR%)
Figure 130 IHI Aerospace Co. Ltd.: R&D, 2017-2021 (US$ Million, AGR%)
Figure 131 IHI Aerospace Co. Ltd.: Regional Market Shares, 2021
Figure 132 IHI Aerospace Co. Ltd.: Segment Market Shares, 2021
Figure 133 Mitsubishi Heavy Industries Ltd.: Net Revenue, 2017-2022 (US$ Million, AGR%)
Figure 134 Mitsubishi Heavy Industries Ltd.: Regional Market Shares, 2022
Figure 135 Mitsubishi Heavy Industries Ltd.: Segment Market Shares, 2022
Figure 136 Northrop Grumman Corporation: Net Revenue, 2017-2022 (US$ Million, AGR%)
Figure 137 Northrop Grumman Corporation: R&D, 2017-2022 (US$ Million, AGR%)
Figure 138 Northrop Grumman Corporation: Regional Market Shares, 2022
Figure 139 Northrop Grumman Corporation: Segment Market Shares, 2022
Figure 140 Safran S.A.: Net Revenue, 2017-2022 (US$ Million, AGR%)
Figure 141 Safran S.A.: R&D, 2017-2022 (US$ Million, AGR%)
Figure 142 Safran S.A.: Regional Market Shares, 2022
Figure 143 Safran S.A.: Segment Market Shares, 2022
Figure 144 Virgin Galactic Holdings, Inc.: Net Revenue, 2017-2022 (US$ Million, AGR%)
Figure 145 Virgin Galactic Holdings, Inc.: R&D, 2017-2022 (US$ Million, AGR%)
ページTOPに戻る
Visiongain社の航空・海事分野での最新刊レポート
本レポートと同じKEY WORD(rocket)の最新刊レポート
- 本レポートと同じKEY WORDの最新刊レポートはありません。
よくあるご質問
Visiongain社はどのような調査会社ですか?
英国の調査会社ヴィジョンゲイン社(Visiongain)は、通信とエネルギーのほか、自動車や化学・医薬品、金属など、広範な市場を対象に調査を行っています。自動車市場については、市場全般に関する調査のほ... もっと見る
調査レポートの納品までの日数はどの程度ですか?
在庫のあるものは速納となりますが、平均的には 3-4日と見て下さい。
但し、一部の調査レポートでは、発注を受けた段階で内容更新をして納品をする場合もあります。
発注をする前のお問合せをお願いします。
注文の手続きはどのようになっていますか?
1)お客様からの御問い合わせをいただきます。
2)見積書やサンプルの提示をいたします。
3)お客様指定、もしくは弊社の発注書をメール添付にて発送してください。
4)データリソース社からレポート発行元の調査会社へ納品手配します。
5) 調査会社からお客様へ納品されます。最近は、pdfにてのメール納品が大半です。
お支払方法の方法はどのようになっていますか?
納品と同時にデータリソース社よりお客様へ請求書(必要に応じて納品書も)を発送いたします。
お客様よりデータリソース社へ(通常は円払い)の御振り込みをお願いします。
請求書は、納品日の日付で発行しますので、翌月最終営業日までの当社指定口座への振込みをお願いします。振込み手数料は御社負担にてお願いします。
お客様の御支払い条件が60日以上の場合は御相談ください。
尚、初めてのお取引先や個人の場合、前払いをお願いすることもあります。ご了承のほど、お願いします。
データリソース社はどのような会社ですか?
当社は、世界各国の主要調査会社・レポート出版社と提携し、世界各国の市場調査レポートや技術動向レポートなどを日本国内の企業・公官庁及び教育研究機関に提供しております。
世界各国の「市場・技術・法規制などの」実情を調査・収集される時には、データリソース社にご相談ください。
お客様の御要望にあったデータや情報を抽出する為のレポート紹介や調査のアドバイスも致します。
|
|

