バイオ燃料産業市場レポート:2023-2033
Biofuel Industry Market Report 2023-2033
レポート詳細
バイオ燃料産業市場レポート 2023-2033 :本レポートは、新たな収益源の開拓を目指すリーディングカンパニーにとって、業界とその基礎となる力学をより深く理解する上で、非常に貴重なも... もっと見る
※上記価格は部署ライセンス(Departmental licence)価格です。
その他の価格についてはデータリソースまでお問合せください。
日本語のページは自動翻訳を利用し作成しています。
実際のレポートは英文のみでご納品いたします。
サマリー
レポート詳細
バイオ燃料産業市場レポート 2023-2033:本レポートは、新たな収益源の開拓を目指すリーディングカンパニーにとって、業界とその基礎となる力学をより深く理解する上で、非常に貴重なものとなるでしょう。また、異業種への進出や新地域での既存事業の拡大を目指す企業にとっても有益なレポートです。
より持続可能なエネルギー源へのニーズと気候変動への懸念が市場を牽引する
バイオ燃料産業は、化石燃料に代わる有力な燃料として登場しました。バイオ燃料は、植物や廃棄物などの再生可能な有機材料から作られます。バイオ燃料産業は、土地や資源をめぐる競争、生産コスト、流通や貯蔵のための限られたインフラなど、いくつかの課題に直面しています。しかし、バイオ燃料産業は成長と革新を続けており、効率を高め、コストを削減するための新しい技術が開発されています。また、世界各国の政府は、輸送用燃料に一定割合のバイオ燃料を使用することを義務付けるなど、バイオ燃料の利用を促進する政策を実施しています。
世界が持続可能性を優先し、温室効果ガス排出量を削減していく中で、バイオ燃料産業はエネルギーミックスにおいてますます重要な役割を果たすと考えられます。この産業は、化石燃料への依存を減らしつつ、新たな雇用を創出し、経済成長を促進する可能性を秘めています。しかし、環境への影響を軽減し、責任ある土地利用を促進し、バイオ燃料産業によって影響を受ける可能性のある地域社会や農家を支援する努力によって、バイオ燃料産業の成長を持続可能にすることが重要です。全体として、バイオ燃料産業は、より持続可能で公平なエネルギーの未来へ移行するためのエキサイティングな機会となります。
マーケットリサーチレポートを購入する前に、どのような質問をするべきか?
- バイオ燃料産業市場はどのように進化しているのか?
- バイオ燃料産業市場を牽引し、抑制しているものは何か?
- バイオ燃料産業の各サブマーケットセグメントは予測期間中にどのように成長し、2033年にこれらのサブマーケットが占める売上はどの程度になるのか?
- 2023年から2033年にかけて、バイオ燃料産業の各サブマーケットの市場シェアはどのように推移するのか?
- 2023年から2033年にかけて、市場全体の主な牽引役となるのは何か?
- 主要なバイオ燃料産業市場はマクロ経済のダイナミクスに幅広く追随するのか、それとも個々の国別市場が他を凌駕するのか?
- 2033年までに各国市場のシェアはどのように変化し、2033年に市場をリードするのはどの地域か?
- 主要プレイヤーは誰で、予測期間中の見通しはどうか?
- これらの主要企業のバイオ燃料産業プロジェクトはどのようなものか?
- 2023年から2033年の間に、業界はどのように進化していくのか?現在および今後10年間に行われるバイオ燃料産業のプロジェクトは、どのような意味を持つのか?
- バイオ燃料産業市場をさらに拡大するために、製品の商業化の必要性は高まっているのか?
- バイオ燃料産業市場はどこに向かっているのか、そして市場の最前線に立つためにはどうすればよいのか?
- 新製品やサービスラインに対する最適な投資オプションは何か?
- 企業を新たな成長軌道に乗せ、C-suiteに移行させるための重要な展望は何か?
このことが、現在、そして今後10年間のバイオ燃料産業市場にどのような影響を与えるかを見極める必要があります:
- 296ページにわたる本レポートでは、114の表と181のチャート/グラフを独占的に提供します。
- 本レポートでは、業界における主要な収益性の高い分野を取り上げているため、今すぐその分野をターゲットにすることができます。
- 世界、地域、国の売上と成長に関する詳細な分析が含まれています。
- 競合他社が成功した主要なトレンド、変化、収益予測をハイライトしています。
本レポートは、バイオ燃料産業市場が今後10年間にどのように発展するか、またCOVID-19の景気後退やバウンスの変動に合わせて、今日のあなたに伝えます。この市場は、過去10年間のどの時点よりも、今が重要なのです。
2033年までの予測やその他の分析により、商業的な展望を明らかにする。
- 2033年までの収益予測に加え、直近の実績や成長率、市場シェアなど、本調査では
- ビジネスの展望や展開など、独自の分析がご覧いただけます。
- 定性的分析(市場力学、促進要因、機会、阻害要因、課題など)、コスト構造、バイオ燃料産業価格上昇の影響、最近の動向をご覧いただけます。
本レポートでは、COVID-19が業界や貴社にどのような影響を与えるかについて、データ分析および貴重な知見を提供しています。COVID-19の4つの回収パターン、すなわち「V」「L」「W」「U」の回収パターンとその影響について考察しています。
報告書の対象セグメント
タイプ別市場セグメント
- バイオディーゼル
- エタノール
- その他のタイプ
エンドユーズ別市場セグメント
- トランスポーテーション
- 発電量
- 暖房用ビル
- その他の最終用途
世代別市場セグメント
- 第一世代バイオ燃料
- 第二世代バイオ燃料
- 第三世代バイオ燃料
- 第四世代バイオ燃料
- 第五世代バイオ燃料
原料別市場セグメント
- メイズ
- 植物性油脂
- 甜菜
- ウィート
- サトウキビ
- その他の情報源
世界市場全体およびセグメントの収益予測に加え、4地域および主要20カ国市場の収益予測も掲載しています:
北米
- 米国
- カナダ
欧州
- ドイツ
- スペイン
- イギリス
- フランス
- イタリア
- その他の欧州地域
アジア太平洋
- 中国
- インドネシア
- インド
- オーストラリア
- 韓国
- その他のアジア太平洋地域
ラテンアメリカ
- ブラジル
- メキシコ
- その他のラテンアメリカ地域
中近東・アフリカ
- GCC
- 南ア
- その他の中東・アフリカ地域
バイオ燃料産業市場の2023年から2033年にかけての主要企業のプロファイルと、これらの企業のこのセグメントに焦点を当てたいくつかの企業についても報告しています。
主要企業と市場成長の可能性
・ Abengoa, S.A.
・ Air Liquide
・ Bunge Limited
・ Butamax Advanced Biofuels, LLC
・ Cosan S. A.
・ CropEnergies AG
・ FutureFuel Corporation
・ Gevo, Inc.
・ Green Plains
・ Pacific Ethanol, Inc.
・ Petróleo Brasileiro S.A. ? Petrobras
・ Renewable Energy Group, Inc.
・ Royal Dutch Shell PLC
・ Valero Marketing and Supply Company
・ Wilmar International Limited
バイオ燃料産業市場の世界全体の収益、金額ベースで2023年から2033年まで、市場は2023年に1239億8000万米ドルを突破すると、我々の仕事は計算されます。2033年まで収益が大きく伸びることが予測されます。当社の調査では、最も大きな可能性を秘めた企業を特定しています。彼らの能力、進歩、商業的展望を発見することで、先手を打つことができます。
バイオ燃料産業市場、2023年から2033年までのレポートはどのように役立つのでしょうか?
まとめると、290ページを超えるレポートでは、以下のような知識を得ることができます:
- バイオ燃料産業市場、2023年から2033年までの収益予測 世界と地域レベルで、タイプ、ソース、生成、最終用途、企業規模をそれぞれ予測 - 産業の展望を発見し、投資と収益のための最も有利な場所を見つけることができます。
- 4つの地域と20の主要国市場の2033年までの収益予測 - 北米、欧州、アジア太平洋、ラテンアメリカ、中東&アフリカのバイオ燃料産業市場、2023年から2033年の市場予測をご覧ください。また、米国、カナダ、ブラジル、ドイツ、フランス、英国、イタリア、中国、インド、インドネシア、オーストラリアなど、著名な経済圏の市場も予測されています。
- 既存企業および市場参入を目指す企業の展望 - 2023年から2033年までのバイオ燃料産業市場に関わる主要企業15社の企業プロファイルを含む。
独自の予測による定量・定性分析をご覧いただけます。私たちのレポートだけが持つ情報を入手し、貴重なビジネスインテリジェンスとして情報を得ることができます。
他にはない情報
私たちの新しいレポートがあれば、知識に遅れをとったり、チャンスを逃したりする可能性は低くなります。私たちの仕事があなたの調査、分析、意思決定にどのように役立つかをご覧ください。Visiongainの研究は、バイオ燃料産業市場、2023年から2033年、市場をリードする企業のための商業分析を必要とするすべての人のためのものです。データ、トレンド、予測を見つけることができます。
ページTOPに戻る
目次
目次
1 レポートの概要
1.1 研究の目的
1.2 バイオ燃料産業市場の紹介
1.3 この報告書がもたらすもの
1.4 本レポートを読むべき理由
1.本分析レポートが回答する5つの重要な質問
1.6 本レポートは誰のためのものか?
1.7 調査方法
1.7.1 市場の定義
1.7.2 市場評価・予測手法
1.7.3 データバリデーション
1.7.3.1 一次調査
1.7.3.2 セカンダリーリサーチ
1.8 よくある質問(FAQ)
1.9 関連するVisiongainのレポート
1.10 ビジョンゲインについて
2 エグゼクティブサマリー
2.1 セグメント別分析
2.1.1 タイプ別セグメント:市場魅力度指数
2.1.2 エンドユース別セグメント:市場魅力度指数
2.1.3 世代別セグメント:市場魅力度指数
2.1.4 原料別セグメント:市場魅力度指数
2.2 地域別分析
3 市場概要
3.1 キーファインディング
3.2 マーケットダイナミクス
3.2.1 市場促進要因
3.2.1.1 バイオ燃料生産インフラの拡大
3.2.1.2 EV需要の高まりがバイオ燃料産業のイノベーションを促進する
3.2.1.3 バイオ燃料産業における化石燃料価格の変動性
3.2.2 市場の抑制要因
3.2.2.1 土地利用の競合が業界の大きな課題として続く
3.2.2.2 十分なインフラの欠如は産業の成長を制限する可能性がある
3.2.3 マーケットオポチュニティ
3.2.3.1 バイオ燃料産業における持続可能なエネルギー源への需要の高まり
3.2.3.2 バイオ燃料産業における、よりクリーンな燃焼燃料への要求
3.2.3.3 バイオ燃料産業におけるパートナーシップとコラボレーション
3.3 COVID-19の影響度分析
3.4 ポーターのファイブフォース分析
3.4.1 サプライヤーのバーゲニングパワー
3.4.2 バイヤーのバーゲニングパワー
3.4.3 競争力のあるライバル
3.4.4 代替品による脅威
3.4.5 新規参入の脅威
3.5 PEST分析
3.5.1 政治的要因
3.5.2 経済的要因
3.5.3 社会的要因
3.5.4 技術的要因
4 バイオ燃料産業市場分析:タイプ別
4.1 キーファインディング
4.2 タイプ別セグメント:市場魅力度指数
4.3 バイオ燃料産業のタイプ別市場規模の推定と予測
4.4 バイオディーゼルのセグメント
4.4.1 地域別市場規模、2023-2033年(US$ Bn)
4.4.2 2023年&2033年地域別市場シェア(%)
4.5 エタノールセグメント
4.5.1 地域別市場規模、2023-2033年(US$ Bn)
4.5.2 2023年&2033年地域別市場シェア(%)
4.6 その他のタイプ別セグメント
4.6.1 地域別市場規模、2023-2033年(US$ Bn)
4.6.2 2023年&2033年地域別市場シェア(%)
5 バイオ燃料産業市場分析:エンドユーズ別
5.1 キーファインディング
5.2 エンドユースセグメント:市場魅力度指数
5.3 バイオ燃料産業のエンドユーズ別市場規模の推定と予測
5.4 運輸セグメント
5.4.1 地域別市場規模、2023-2033年(US$ Bn)
5.4.2 2023年&2033年地域別市場シェア(%)
5.5 電力事業セグメント
5.5.1 地域別市場規模、2023-2033年(US$ Bn)
5.5.2 2023年&2033年地域別市場シェア(%)
5.6 暖房用ビルディングセグメント
5.6.1 地域別市場規模、2023-2033年(US$ Bn)
5.6.2 2023年&2033年地域別市場シェア(%)
5.7 その他のエンドユーズ分野
5.7.1 地域別市場規模、2023-2033年(US$ Bn)
5.7.2 2023年&2033年地域別市場シェア(%)
6 バイオ燃料産業市場分析:世代別
6.1 キーファインディング
6.2 世代別セグメント:市場魅力度指数
6.3 バイオ燃料産業の世代別市場規模推計と予測
6.4 第一世代バイオ燃料のセグメント
6.4.1 地域別市場規模、2023-2033年(US$ Bn)
6.4.2 2023年&2033年地域別市場シェア(%)
6.5 第二世代バイオ燃料
6.5.1 地域別市場規模、2023-2033年(US$ Bn)
6.5.2 2023年&2033年地域別市場シェア(%)
6.6 第三世代バイオ燃料
6.6.1 地域別市場規模、2023-2033年(US$ Bn)
6.6.2 2023年&2033年地域別市場シェア(%)
6.7 第四世代バイオ燃料のセグメント
6.7.1 地域別市場規模、2023-2033年(US$ Bn)
6.7.2 2023年&2033年地域別市場シェア(%)
6.8 第五世代バイオ燃料のセグメント
6.8.1 地域別市場規模、2023-2033年(US$ Bn)
6.8.2 2023年&2033年地域別市場シェア(%)
7 バイオ燃料産業の市場分析:原料別
7.1 キーファインディング
7.2 ソースセグメント:市場魅力度指数
7.3 バイオ燃料産業の市場規模の推定とソース別予測
7.4 トウモロコシセグメント
7.4.1 地域別市場規模、2023-2033年(US$ Bn)
7.4.2 2023年&2033年地域別市場シェア(%)
7.5 植物性油脂セグメント
7.5.1 地域別市場規模、2023-2033年(US$ Bn)
7.5.2 2023年&2033年地域別市場シェア(%)
7.6 シュガービート セグメント
7.6.1 地域別市場規模、2023-2033年(US$ Bn)
7.6.2 2023年&2033年地域別市場シェア(%)
7.7 小麦セグメント
7.7.1 地域別市場規模、2023-2033年(US$ Bn)
7.7.2 2023年&2033年地域別市場シェア(%)
7.8 さとうきびセグメント
7.8.1 地域別市場規模、2023-2033年(US$ Bn)
7.8.2 2023年&2033年地域別市場シェア(%)
7.9 その他の情報源
7.9.1 地域別市場規模、2023-2033年(US$ Bn)
7.9.2 2023年&2033年地域別市場シェア(%)
8 バイオ燃料産業市場分析:地域別
8.1 キーファインディング
8.2 地域別市場規模の推計と予測
9 北米のバイオ燃料産業市場分析
9.1 キーファインディング
9.2 北米バイオ燃料産業市場魅力度指数
9.3 北米バイオ燃料産業の国別市場規模推計と予測
9.4 北米バイオ燃料産業のタイプ別市場規模の推定と予測
9.5 北米バイオ燃料産業のエンドユーズ別市場規模の推定と予測
9.6 北米バイオ燃料産業の世代別市場規模推計と予測
9.7 北米バイオ燃料産業の原料別市場規模の推定と予測
9.8 米国のバイオ燃料産業市場分析
9.9 カナダのバイオ燃料産業市場分析
10 欧州のバイオ燃料産業市場分析
10.1 キーファインディング
10.2 欧州バイオ燃料産業市場魅力度指数
10.3 欧州バイオ燃料産業の国別市場規模の推定と予測
10.4 欧州バイオ燃料産業のタイプ別市場規模の推定と予測
10.5 欧州バイオ燃料産業のエンドユーズ別市場規模の推定と予測
10.6 欧州バイオ燃料産業の世代別市場規模の推定と予測
10.7 欧州バイオ燃料産業の原料別市場規模の推定と予測
10.8 ドイツのバイオ燃料産業市場分析
10.9 英国バイオ燃料産業市場分析
10.10 フランス バイオ燃料産業市場分析
10.11 イタリア バイオ燃料産業市場分析
10.12 スペイン バイオ燃料産業市場分析
10.13 その他の欧州のバイオ燃料産業市場分析
11 アジア太平洋地域のバイオ燃料産業市場分析
11.1 キーファインディング
11.2 アジア太平洋地域のバイオ燃料産業市場魅力度指数
11.3 アジア太平洋地域のバイオ燃料産業の国別市場規模の推定と予測
11.4 アジア太平洋地域のバイオ燃料産業のタイプ別市場規模の推定と予測
11.5 アジア太平洋地域のバイオ燃料産業のエンドユーザー別市場規模の推定と予測
11.6 アジア太平洋地域のバイオ燃料産業の世代別市場規模の推定と予測
11.7 アジア太平洋地域のバイオ燃料産業の原料別市場規模の推定と予測
11.8 中国バイオ燃料産業市場分析
11.9 インドのバイオ燃料産業市場分析
11.10 インドネシア バイオ燃料産業市場分析
11.11 韓国バイオ燃料産業市場分析
11.12 オーストラリアのバイオ燃料産業市場分析
11.13 その他のアジア太平洋地域のバイオ燃料産業市場分析
12 中東・アフリカのバイオ燃料産業市場分析
12.1 キーファインディング
12.2 中東・アフリカ バイオ燃料産業市場魅力度指数
12.3 中東・アフリカ バイオ燃料産業の国別市場規模推計と予測
12.4 中東・アフリカ バイオ燃料産業のタイプ別市場規模の推定と予測
12.5 中東・アフリカ バイオ燃料産業のエンドユーザー別市場規模推定・予測
12.6 中東・アフリカ バイオ燃料産業の世代別市場規模の推定と予測
12.7 中東・アフリカ バイオ燃料産業の原料別市場規模推計と予測
12.8 GCCバイオ燃料産業市場分析
12.9 南アフリカのバイオ燃料産業市場分析
12.10 その他の中東・アフリカ地域 バイオ燃料産業市場分析
13 ラテンアメリカのバイオ燃料産業市場分析
13.1 キーファインディング
13.2 ラテンアメリカのバイオ燃料産業市場魅力度指数
13.3 ラテンアメリカ バイオ燃料産業の国別市場規模の推定と予測
13.4 ラテンアメリカ バイオ燃料産業のタイプ別市場規模の推定と予測
13.5 ラテンアメリカ バイオ燃料産業のエンドユーザー別市場規模の推定と予測
13.6 ラテンアメリカ バイオ燃料産業の世代別市場規模の推定と予測
13.7 ラテンアメリカのバイオ燃料産業の原料別市場規模の推定との予測
13.8 ブラジル バイオ燃料産業市場分析
13.9 アルゼンチン バイオ燃料産業市場分析
13.10 その他のラテンアメリカ地域のバイオ燃料産業市場分析
14 会社概要
14.1 競合他社の状況、2021年
14.2 戦略的展望
14.2.1 主要なビジネス戦略としての契約
14.2.2 主要なビジネス戦略としてのコラボレーション
14.2.3 主要なビジネス戦略としての契約
14.2.4 主要なビジネス戦略としての新製品発売
14.2.5 主要なビジネス戦略としての投資
14.2.6 主要なビジネス戦略としてのジョイントベンチャー
14.2.7 主要なビジネス戦略としてのパートナーシップ
14.3 Green Plains
14.3.1 企業スナップショット
14.3.2 会社概要
14.3.3 財務分析
14.3.3.1 純収益、2018年~2022年
14.3.3.2 事業セグメント別市場シェア、2022年
14.3.4 製品ベンチマーキング
14.3.5 戦略的な展望
14.4 Petróleo Brasileiro S.A. — Petrobras
14.4.1 企業スナップショット
14.4.2 会社概要
14.4.3 財務分析
14.4.3.1 純収益、2017-2021年
14.4.3.2 R&D、2017年~2021年
14.4.3.3 事業セグメント別市場シェア、2021年
14.4.4 製品ベンチマーキング
14.4.5 戦略的な展望
14.5 Valero Marketing and Supply Company
14.5.1 企業スナップショット
14.5.2 会社概要
14.5.3 財務分析
14.5.3.1 純収益、2018年~2022年
14.5.3.2 地域別市場占有率、2022年
14.5.3.3 事業セグメント別市場シェア、2022年
14.5.4 製品ベンチマーキング
14.6 Pacific Ethanol, Inc.
14.6.1 企業スナップショット
14.6.2 会社概要
14.6.3 財務分析
14.6.3.1 純収益、2017-2021年
14.6.3.2 事業セグメント別市場シェア、2021年
14.6.4 製品ベンチマーキング
14.7 Butamax Advanced Biofuels, LLC
14.7.1 企業スナップショット
14.7.2 会社概要
14.7.3 製品ベンチマーキング
14.8 Gevo, Inc.
14.8.1 企業スナップショット
14.8.2 会社概要
14.8.3 財務分析
14.8.3.1 純収益、2017-2021年
14.8.3.2 R&D、2017年~2021年
14.8.3.3 地域別市場シェア、2022年
14.8.3.4 事業セグメント別市場シェア、2022年
14.8.4 製品ベンチマーキング
14.8.5 戦略的な展望
14.9 Wilmar International Limited
14.9.1 企業スナップショット
14.9.2 会社概要
14.9.3 財務分析
14.9.3.1 純収益、2017-2021年
14.9.3.2 地域別市場占有率、2021年
14.9.3.3 事業セグメント別市場シェア、2021年
14.9.4 製品ベンチマーキング
14.10 Renewable Energy Group, Inc.
14.10.1 企業スナップショット
14.10.2 会社概要
14.10.3 財務分析
14.10.3.1 純収益、2017-2021年
14.10.3.2 地域別市場占有率、2021年
14.10.3.3 ビジネスセグメント市場シェア、2021年
14.10.4 製品ベンチマーキング
14.10.5 戦略的な展望
14.11 Bunge Limited
14.11.1 企業スナップショット
14.11.2 会社概要
14.11.3 財務分析
14.11.3.1 純収益、2017-2021年
14.11.3.2 R&D、2017年~2021年
14.11.3.3 地域別市場占有率、2021年
14.11.3.4 ビジネスセグメント市場シェア、2021年
14.11.4 製品ベンチマーキング
14.12 Royal Dutch Shell PLC
14.12.1 企業スナップショット
14.12.2 会社概要
14.12.3 財務分析
14.12.3.1 純収益、2017-2021年
14.12.3.2 R&D、2017年~2021年
14.12.3.3 地域別市場シェア、2021年
14.12.3.4 ビジネスセグメント市場シェア、2021年
14.12.4 製品ベンチマーキング
14.12.5 戦略的な展望
14.13 CropEnergies AG
14.13.1 企業スナップショット
14.13.2 会社概要
14.13.3 財務分析
14.13.3.1 純収益、2017-2021年
14.13.3.2 R&D、2017年~2021年
14.13.3.3 事業セグメント別市場シェア、2021年
14.13.4 製品ベンチマーキング
14.14 Air Liquide
14.14.1 企業スナップショット
14.14.2 会社概要
14.14.3 財務分析
14.14.3.1 純収益、2018年~2022年
14.14.3.2 R&D、2018年~2022年
14.14.3.3 地域別市場占有率、2022年
14.14.3.4 事業セグメント別市場シェア、2022年
14.14.4 製品ベンチマーキング
14.14.5 戦略的な展望
14.15 Abengoa, S.A.
14.15.1 会社概要
14.15.2 会社概要
14.15.3 製品ベンチマーキング
14.16 Cosan S. A.
14.16.1 会社概要
14.16.2 会社概要
14.16.3 財務分析
14.16.3.1 純収益、2017-2021年
14.16.3.2 ビジネスセグメント市場シェア、2021年
14.16.4 製品ベンチマーキング
14.16.5 戦略的な展望
14.17 FutureFuel Corporation
14.17.1 企業スナップショット
14.17.2 会社概要
14.17.3 財務分析
14.17.3.1 純収益、2017-2021年
14.17.3.2 R&D、2017年~2021年
14.17.3.3 地域別市場シェア、2021年
14.17.3.4 ビジネスセグメント市場シェア、2021年
14.17.4 製品ベンチマーキング
15 結論と提言
15.1 ビジョンゲインからの結びの言葉
15.2 市場関係者への提言
表の一覧
Table 1 Biofuel Industry Market Snapshot, 2023 & 2033 (US$billion, CAGR %)
Table 2 Global Biofuel Industry Market by Region, 2023-2033 (US$ Bn, AGR (%), CAGR (%)) (V-Shaped Recovery Scenario)
Table 3 Global Biofuel Industry Market by Region, 2023-2033 (US$ Bn, AGR (%), CAGR (%)) (W-Shaped Recovery Scenario)
Table 4 Global Biofuel Industry Market by Region, 2023-2033 (US$ Bn, AGR (%), CAGR (%)) (U-Shaped Recovery Scenario)
Table 5 Global Biofuel Industry Market by Region, 2023-2033 (US$ Bn, AGR (%), CAGR (%)) (L-Shaped Recovery Scenario)
Table 6 Global Biofuel Industry Market by Type, 2023-2033 (US$ Bn, AGR (%), CAGR (%))
Table 7 Biodiesel Market by Region, 2023-2033 (US$ Bn, AGR (%), CAGR (%))
Table 8 Ethanol Market by Region, 2023-2033 (US$ Bn, AGR (%), CAGR (%))
Table 9 Other Type Market by Region, 2023-2033 (US$ Bn, AGR (%), CAGR (%))
Table 10 Global Biofuel Industry Market by End-Use, 2023-2033 (US$ Bn, AGR (%), CAGR (%))
Table 11 Transportation Market by Region, 2023-2033 (US$ Bn, AGR (%), CAGR (%))
Table 12 Electricity Generation Market by Region, 2023-2033 (US$ Bn, AGR (%), CAGR (%))
Table 13 Heating Buildings Market by Region, 2023-2033 (US$ Bn, AGR (%), CAGR (%))
Table 14 Other End-Uses Market by Region, 2023-2033 (US$ Bn, AGR (%), CAGR (%))
Table 15 Global Biofuel Industry Market by Generation, 2023-2033 (US$ Bn, AGR (%), CAGR (%))
Table 16 First-generation Biofuels Market by Region, 2023-2033 (US$ Bn, AGR (%), CAGR (%))
Table 17 Second-generation Biofuels Market by Region, 2023-2033 (US$ Bn, AGR (%), CAGR (%))
Table 18 Third-generation Biofuels Market by Region, 2023-2033 (US$ Bn, AGR (%), CAGR (%))
Table 19 Fourth-generation Biofuels Market by Region, 2023-2033 (US$ Bn, AGR (%), CAGR (%))
Table 20 Fifth-generation Biofuels Market by Region, 2023-2033 (US$ Bn, AGR (%), CAGR (%))
Table 21 Global Biofuel Industry Market by Source, 2023-2033 (US$ Bn, AGR (%), CAGR (%))
Table 22 Maize Market by Region, 2023-2033 (US$ Bn, AGR (%), CAGR (%))
Table 23 Vegetable oils Market by Region, 2023-2033 (US$ Bn, AGR (%), CAGR (%))
Table 24 Sugar beet Market by Region, 2023-2033 (US$ Bn, AGR (%), CAGR (%))
Table 25 Wheat Market by Region, 2023-2033 (US$ Bn, AGR (%), CAGR (%))
Table 26 Sugar Cane Market by Region, 2023-2033 (US$ Bn, AGR (%), CAGR (%))
Table 27 Other Sources Market by Region, 2023-2033 (US$ Bn, AGR (%), CAGR (%))
Table 28 Global Biofuel Industry Market by Region, 2023-2033 (US$ Bn, AGR (%), CAGR (%))
Table 29 North America Biofuel Industry Market by Country, 2023-2033 (US$ Bn, AGR (%), CAGR (%))
Table 30 North America Biofuel Industry Market by Type, 2023-2033 (US$ Bn, AGR (%), CAGR (%))
Table 31 North America Biofuel Industry Market by End-Use, 2023-2033 (US$ Bn, AGR (%), CAGR (%))
Table 32 North America Biofuel Industry Market by Generation, 2023-2033 (US$ Bn, AGR (%), CAGR (%))
Table 33 North America Biofuel Industry Market by Source, 2023-2033 (US$ Bn, AGR (%), CAGR (%))
Table 34 US Biofuel Industry Market by Value, 2023-2033 (US$ Bn, AGR (%), CAGR (%))
Table 35 Canada Biofuel Industry Market by Value, 2023-2033 (US$ Bn, AGR (%), CAGR (%))
Table 36 Europe Biofuel Industry Market by Country, 2023-2033 (US$ Bn, AGR (%), CAGR (%))
Table 37 Europe Biofuel Industry Market by Type, 2023-2033 (US$ Bn, AGR (%), CAGR (%))
Table 38 Europe Biofuel Industry Market by End-Use, 2023-2033 (US$ Bn, AGR (%), CAGR (%))
Table 39 Europe Biofuel Industry Market by Generation, 2023-2033 (US$ Bn, AGR (%), CAGR (%))
Table 40 Europe Biofuel Industry Market by Source, 2023-2033 (US$ Bn, AGR (%), CAGR (%))
Table 41 Germany Biofuel Industry Market by Value, 2023-2033 (US$ Bn, AGR (%), CAGR (%))
Table 42 UK Biofuel Industry Market by Value, 2023-2033 (US$ Bn, AGR (%), CAGR (%))
Table 43 France Biofuel Industry Market by Value, 2023-2033 (US$ Bn, AGR (%), CAGR (%))
Table 44 Italy Biofuel Industry Market by Value, 2023-2033 (US$ Bn, AGR (%), CAGR (%))
Table 45 Spain Biofuel Industry Market by Value, 2023-2033 (US$ Bn, AGR (%), CAGR (%))
Table 46 Rest of Europe Biofuel Industry Market by Value, 2023-2033 (US$ Bn, AGR (%), CAGR (%))
Table 47 Asia-Pacific Biofuel Industry Market by Country, 2023-2033 (US$ Bn, AGR (%), CAGR (%))
Table 48 Asia-Pacific Biofuel Industry Market by Type, 2023-2033 (US$ Bn, AGR (%), CAGR (%))
Table 49 Asia-Pacific Biofuel Industry Market by End-Use, 2023-2033 (US$ Bn, AGR (%), CAGR (%))
Table 50 Asia-Pacific Biofuel Industry Market by Generation, 2023-2033 (US$ Bn, AGR (%), CAGR (%))
Table 51 Asia-Pacific Biofuel Industry Market by Source, 2023-2033 (US$ Bn, AGR (%), CAGR (%))
Table 52 China Biofuel Industry Market by Value, 2023-2033 (US$ Bn, AGR (%), CAGR (%))
Table 53 India Biofuel Industry Market by Value, 2023-2033 (US$ Bn, AGR (%), CAGR (%))
Table 54 Indonesia Biofuel Industry Market by Value, 2023-2033 (US$ Bn, AGR (%), CAGR (%))
Table 55 South Korea Biofuel Industry Market by Value, 2023-2033 (US$ Bn, AGR (%), CAGR (%))
Table 56 Australia Biofuel Industry Market by Value, 2023-2033 (US$ Bn, AGR (%), CAGR (%))
Table 57 Rest of Asia-Pacific Biofuel Industry Market by Value, 2023-2033 (US$ Bn, AGR (%), CAGR (%))
Table 58 Middle East & Africa Biofuel Industry Market by Country, 2023-2033 (US$ Bn, AGR (%), CAGR (%))
Table 59 Middle East & Africa Biofuel Industry Market by Type, 2023-2033 (US$ Bn, AGR (%), CAGR (%))
Table 60 Middle East & Africa Biofuel Industry Market by End-Use, 2023-2033 (US$ Bn, AGR (%), CAGR (%))
Table 61 Middle East & Africa Biofuel Industry Market by Generation, 2023-2033 (US$ Bn, AGR (%), CAGR (%))
Table 62 Middle East & Africa Biofuel Industry Market by Source, 2023-2033 (US$ Bn, AGR (%), CAGR (%))
Table 63 GCC Biofuel Industry Market by Value, 2023-2033 (US$ Bn, AGR (%), CAGR (%))
Table 64 South Africa Biofuel Industry Market by Value, 2023-2033 (US$ Bn, AGR (%), CAGR (%))
Table 65 Rest of Middle East & Africa Biofuel Industry Market by Value, 2023-2033 (US$ Bn, AGR (%), CAGR (%))
Table 66 Latin America Biofuel Industry Market by Country, 2023-2033 (US$ Bn, AGR (%), CAGR (%))
Table 67 Latin America Biofuel Industry Market by Type, 2023-2033 (US$ Bn, AGR (%), CAGR (%))
Table 68 Latin America Biofuel Industry Market by End-Use, 2023-2033 (US$ Bn, AGR (%), CAGR (%))
Table 69 Latin America Biofuel Industry Market by Generation, 2023-2033 (US$ Bn, AGR (%), CAGR (%))
Table 70 Latin America Biofuel Industry Market by Source, 2023-2033 (US$ Bn, AGR (%), CAGR (%))
Table 71 Brazil Biofuel Industry Market by Value, 2023-2033 (US$ Bn, AGR (%), CAGR (%))
Table 72 Argentina Biofuel Industry Market by Value, 2023-2033 (US$ Bn, AGR (%), CAGR (%))
Table 73 Rest of Latin America Biofuel Industry Market by Value, 2023-2033 (US$ Bn, AGR (%), CAGR (%))
Table 74 Biofuel Industry Market: Company Share/Ranking, 2021
Table 75 Green Plains: Key Details, (CEO, HQ, Revenue, Founded, No. of Employees, Company Type, Website, Business Segment)
Table 76 Green Plains: Product Benchmarking
Table 77 Green Plains: Strategic Outlook
Table 78 Petróleo Brasileiro S.A. — Petrobras: Key Details, (CEO, HQ, Revenue, Founded, No. of Employees, Company Type, Website, Business Segment)
Table 79 Petróleo Brasileiro S.A. — Petrobras: Product Benchmarking
Table 80 Petróleo Brasileiro S.A. — Petrobras: Strategic Outlook
Table 81 Valero Marketing and Supply Company: Key Details, (CEO, HQ, Revenue, Founded, No. of Employees, Company Type, Website, Business Segment)
Table 82 Valero Marketing and Supply Company: Product Benchmarking
Table 83 Pacific Ethanol, Inc.: Key Details, (CEO, HQ, Revenue, Founded, No. of Employees, Company Type, Website, Business Segment)
Table 84 Pacific Ethanol, Inc.: Product Benchmarking
Table 85 Butamax Advanced Biofuels, LLC: Key Details, (CEO, HQ, Revenue, Founded, No. of Employees, Company Type, Website, Business Segment)
Table 86 Butamax Advanced Biofuels, LLC: Product Benchmarking
Table 87 Gevo, Inc.: Key Details, (CEO, HQ, Revenue, Founded, No. of Employees, Company Type, Website, Business Segment)
Table 88 Gevo, Inc.: Product Benchmarking
Table 89 Gevo, Inc.: Strategic Outlook
Table 90 Wilmar International Limited: Key Details, (CEO, HQ, Revenue, Founded, No. of Employees, Company Type, Website, Business Segment)
Table 91 Wilmar International Limited: Product Benchmarking
Table 92 Renewable Energy Group, Inc.: Key Details, (CEO, HQ, Revenue, Founded, No. of Employees, Company Type, Website, Business Segment)
Table 93 Renewable Energy Group, Inc.: Product Benchmarking
Table 94 Renewable Energy Group, Inc.: Strategic Outlook
Table 95 Bunge Limited: Key Details, (CEO, HQ, Revenue, Founded, No. of Employees, Company Type, Website, Business Segment)
Table 96 Bunge Limited: Product Benchmarking
Table 97 Royal Dutch Shell PLC: Key Details, (CEO, HQ, Revenue, Founded, No. of Employees, Company Type, Website, Business Segment)
Table 98 Royal Dutch Shell PLC: Product Benchmarking
Table 99 Royal Dutch Shell PLC: Strategic Outlook
Table 100 CropEnergies AG: Key Details, (CEO, HQ, Revenue, Founded, No. of Employees, Company Type, Website, Business Segment)
Table 101 CropEnergies AG: Product Benchmarking
Table 102 Air Liquide: Key Details, (CEO, HQ, Revenue, Founded, No. of Employees, Company Type, Website, Business Segment)
Table 103 Air Liquide: Product Benchmarking
Table 104 Air Liquide: Strategic Outlook
Table 105 Abengoa, S.A.: Key Details, (CEO, HQ, Revenue, Founded, No. of Employees, Company Type, Website, Business Segment)
Table 106 Abengoa, S.A.: Product Benchmarking
Table 107 Cosan S. A.: Key Details, (CEO, HQ, Revenue, Founded, No. of Employees, Company Type, Website, Business Segment)
Table 108 Cosan S. A.: Product Benchmarking
Table 109 Cosan S. A.: Strategic Outlook
Table 110 FutureFuel Corporation: Key Details, (CEO, HQ, Revenue, Founded, No. of Employees, Company Type, Website, Business Segment)
Table 111 FutureFuel Corporation: Product Benchmarking
図の一覧
Figure 1 Biofuel Industry Market Segmentation
Figure 2 Biofuel Industry Market by Type: Market Attractiveness Index
Figure 3 Biofuel Industry Market by End-Use: Market Attractiveness Index
Figure 4 Biofuel Industry Market by Generation: Market Attractiveness Index
Figure 5 Biofuel Industry Market by Source: Market Attractiveness Index
Figure 6 Biofuel Industry Market Attractiveness Index by Region
Figure 7 Biofuel Industry Market: Market Dynamics
Figure 8 COVID Impact Analysis: Biofuel Industry Market Recovery Scenarios
Figure 9 Global Biofuel Industry Market by Region, 2023-2033 (US$ Bn, AGR (%)) (V-Shaped Recovery Scenario)
Figure 10 Global Biofuel Industry Market by Region, 2023-2033 (US$ Bn, AGR (%)) (W-Shaped Recovery Scenario)
Figure 11 Global Biofuel Industry Market by Region, 2023-2033 (US$ Bn, AGR (%)) (U-Shaped Recovery Scenario)
Figure 12 Global Biofuel Industry Market by Region, 2023-2033 (US$ Bn, AGR (%)) (L-Shaped Recovery Scenario)
Figure 13 Biofuel Industry Market: Porter’s Five Forces Analysis
Figure 14 Biofuel Industry Market: PEST Analysis
Figure 15 Biofuel Industry Market by Type: Market Attractiveness Index
Figure 16 Global Biofuel Industry Market by Type, 2023-2033 (US$ Bn, AGR (%))
Figure 17 Global Biofuel Industry Market Share Forecast by Type, 2023-2033 (%)
Figure 18 Biodiesel Market by Region, 2023-2033 (US$ Bn, AGR (%))
Figure 19 Biodiesel Market Share Forecast by Region, 2023 & 2033 (%)
Figure 20 Ethanol Market by Region, 2023-2033 (US$ Bn, AGR (%))
Figure 21 Ethanol Market Share Forecast by Region, 2023 & 2033 (%)
Figure 22 Other Type Market by Region, 2023-2033 (US$ Bn, AGR (%))
Figure 23 Other Type Market Share Forecast by Region, 2023 & 2033 (%)
Figure 24 Biofuel Industry Market by End-Use: Market Attractiveness Index
Figure 25 Global Biofuel Industry Market by End-Use, 2023-2033 (US$ Bn, AGR (%))
Figure 26 Global Biofuel Industry Market Share Forecast by End-Use, 2023-2033 (%)
Figure 27 Transportation Market by Region, 2023-2033 (US$ Bn, AGR (%))
Figure 28 Transportation Market Share Forecast by Region, 2023 & 2033 (%)
Figure 29 Electricity Generation Market by Region, 2023-2033 (US$ Bn, AGR (%))
Figure 30 Electricity Generation Market Share Forecast by Region, 2023 & 2033 (%)
Figure 31 Heating Buildings Market by Region, 2023-2033 (US$ Bn, AGR (%))
Figure 32 Heating Buildings Market Share Forecast by Region, 2023 & 2033 (%)
Figure 33 Other End-Uses Market by Region, 2023-2033 (US$ Bn, AGR (%))
Figure 34 Other End-Uses Market Share Forecast by Region, 2023 & 2033 (%)
Figure 35 Biofuel Industry Market by Generation: Market Attractiveness Index
Figure 36 Global Biofuel Industry Market by Generation, 2023-2033 (US$ Bn, AGR (%))
Figure 37 Global Biofuel Industry Market Share Forecast by Generation, 2023-2033 (%)
Figure 38 First-generation Biofuels Market by Region, 2023-2033 (US$ Bn, AGR (%))
Figure 39 First-generation Biofuels Market Share Forecast by Region, 2023 & 2033 (%)
Figure 40 Second-generation Biofuels Market by Region, 2023-2033 (US$ Bn, AGR (%))
Figure 41 Second-generation Biofuels Market Share Forecast by Region, 2023 & 2033 (%)
Figure 42 Third-generation Biofuels Market by Region, 2023-2033 (US$ Bn, AGR (%))
Figure 43 Third-generation Biofuels Market Share Forecast by Region, 2023 & 2033 (%)
Figure 44 Fourth-generation Biofuels Market by Region, 2023-2033 (US$ Bn, AGR (%))
Figure 45 Fourth-generation Biofuels Market Share Forecast by Region, 2023 & 2033 (%)
Figure 46 Fifth-generation Biofuels Market by Region, 2023-2033 (US$ Bn, AGR (%))
Figure 47 Fifth-generation Biofuels Market Share Forecast by Region, 2023 & 2033 (%)
Figure 48 Biofuel Industry Market by Source: Market Attractiveness Index
Figure 49 Global Biofuel Industry Market by Source, 2023-2033 (US$ Bn, AGR (%))
Figure 50 Global Biofuel Industry Market Share Forecast by Source, 2023-2033 (%)
Figure 51 Maize Market by Region, 2023-2033 (US$ Bn, AGR (%))
Figure 52 Maize Market Share Forecast by Region, 2023 & 2033 (%)
Figure 53 Vegetable oils Market by Region, 2023-2033 (US$ Bn, AGR (%))
Figure 54 Vegetable oils Biofuels Market Share Forecast by Region, 2023 & 2033 (%)
Figure 55 Sugar beet Market by Region, 2023-2033 (US$ Bn, AGR (%))
Figure 56 Sugar beet Market Share Forecast by Region, 2023 & 2033 (%)
Figure 57 Wheat Market by Region, 2023-2033 (US$ Bn, AGR (%))
Figure 58 Wheat Market Share Forecast by Region, 2023 & 2033 (%)
Figure 59 Sugar Cane Market by Region, 2023-2033 (US$ Bn, AGR (%))
Figure 60 Sugar Cane Market Share Forecast by Region, 2023 & 2033 (%)
Figure 61 Other Sources Market by Region, 2023-2033 (US$ Bn, AGR (%))
Figure 62 Other Sources Market Share Forecast by Region, 2023 & 2033 (%)
Figure 63 Global Biofuel Industry Market Share Forecast by Region,2023-2033 (%)
Figure 64 Global Biofuel Industry Market by Region, 2023-2033 (US$ Bn, AGR (%))
Figure 65 Global Biofuel Industry Market Share Forecast by Region, 2023-2033 (%)
Figure 66 North America Biofuel Industry Market Attractiveness Index
Figure 67 North America Biofuel Industry Market by Country, 2023-2033 (US$ Bn, AGR (%))
Figure 68 North America Biofuel Industry Market Share Forecast by Country, 2023 & 2033 (%)
Figure 69 North America Biofuel Industry Market by Type, 2023-2033 (US$ Bn, AGR (%))
Figure 70 North America Biofuel Industry Market Share Forecast by Type, 2023 & 2033 (%)
Figure 71 North America Biofuel Industry Market by End-Use, 2023-2033 (US$ Bn, AGR (%))
Figure 72 Global Biofuel Industry Market Share Forecast by End-Use, 2023-2033 (%)
Figure 73 North America Biofuel Industry Market by Generation, 2023-2033 (US$ Bn, AGR (%))
Figure 74 Global Biofuel Industry Market Share Forecast by Generation, 2023-2033 (%)
Figure 75 North America Biofuel Industry Market by Source, 2023-2033 (US$ Bn, AGR (%))
Figure 76 Global Biofuel Industry Market Share Forecast by Source, 2023-2033 (%)
Figure 77 US Biofuel Industry Market by Value, 2023-2033 (US$ Bn, AGR (%))
Figure 78 Canada Biofuel Industry Market by Value, 2023-2033 (US$ Bn, AGR (%))
Figure 79 Europe Biofuel Industry Market Attractiveness Index
Figure 80 Europe Biofuel Industry Market by Country, 2023-2033 (US$ Bn, AGR (%))
Figure 81 Europe Biofuel Industry Market Share Forecast by Country, 2023 & 2033 (%)
Figure 82 Europe Biofuel Industry Market by Type, 2023-2033 (US$ Bn, AGR (%))
Figure 83 Europe Biofuel Industry Market Share Forecast by Type, 2023 & 2033 (%)
Figure 84 Europe Biofuel Industry Market by End-Use, 2023-2033 (US$ Bn, AGR (%))
Figure 85 Global Biofuel Industry Market Share Forecast by End-Use, 2023-2033 (%)
Figure 86 Europe Biofuel Industry Market by Generation, 2023-2033 (US$ Bn, AGR (%))
Figure 87 Global Biofuel Industry Market Share Forecast by Generation, 2023-2033 (%)
Figure 88 Europe Biofuel Industry Market by Source, 2023-2033 (US$ Bn, AGR (%))
Figure 89 Global Biofuel Industry Market Share Forecast by Source, 2023-2033 (%)
Figure 90 Germany Biofuel Industry Market by Value, 2023-2033 (US$ Bn, AGR (%))
Figure 91 UK Biofuel Industry Market by Value, 2023-2033 (US$ Bn, AGR (%))
Figure 92 France Biofuel Industry Market by Value, 2023-2033 (US$ Bn, AGR (%))
Figure 93 Italy Biofuel Industry Market by Value, 2023-2033 (US$ Bn, AGR (%))
Figure 94 Spain Biofuel Industry Market by Value, 2023-2033 (US$ Bn, AGR (%))
Figure 95 Rest of Europe Biofuel Industry Market by Value, 2023-2033 (US$ Bn, AGR (%))
Figure 96 Asia-Pacific Biofuel Industry Market Attractiveness Index
Figure 97 Asia-Pacific Biofuel Industry Market by Country, 2023-2033 (US$ Bn, AGR (%))
Figure 98 Asia-Pacific Biofuel Industry Market Share Forecast by Country, 2023 & 2033 (%)
Figure 99 Asia-Pacific Biofuel Industry Market by Type, 2023-2033 (US$ Bn, AGR (%))
Figure 100 Asia-Pacific Biofuel Industry Market Share Forecast by Type, 2023 & 2033 (%)
Figure 101 Asia-Pacific Biofuel Industry Market by End-Use, 2023-2033 (US$ Bn, AGR (%))
Figure 102 Global Biofuel Industry Market Share Forecast by End-Use, 2023-2033 (%)
Figure 103 Asia-Pacific Biofuel Industry Market by Generation, 2023-2033 (US$ Bn, AGR (%))
Figure 104 Global Biofuel Industry Market Share Forecast by Generation, 2023-2033 (%)
Figure 105 Asia-Pacific Biofuel Industry Market by Source, 2023-2033 (US$ Bn, AGR (%))
Figure 106 Global Biofuel Industry Market Share Forecast by Source, 2023-2033 (%)
Figure 107 China Biofuel Industry Market by Value, 2023-2033 (US$ Bn, AGR (%))
Figure 108 India Biofuel Industry Market by Value, 2023-2033 (US$ Bn, AGR (%))
Figure 109 Indonesia Biofuel Industry Market by Value, 2023-2033 (US$ Bn, AGR (%))
Figure 110 South Korea Biofuel Industry Market by Value, 2023-2033 (US$ Bn, AGR (%))
Figure 111 Australia Biofuel Industry Market by Value, 2023-2033 (US$ Bn, AGR (%))
Figure 112 Rest of Asia-Pacific Biofuel Industry Market by Value, 2023-2033 (US$ Bn, AGR (%))
Figure 113 Middle East & Africa Biofuel Industry Market Attractiveness Index
Figure 114 Middle East & Africa Biofuel Industry Market by Country, 2023-2033 (US$ Bn, AGR (%))
Figure 115 Middle East & Africa Biofuel Industry Market Share Forecast by Country, 2023 & 2033 (%)
Figure 116 Middle East & Africa Biofuel Industry Market by Type, 2023-2033 (US$ Bn, AGR (%))
Figure 117 Middle East & Africa Biofuel Industry Market Share Forecast by Type, 2023 & 2033 (%)
Figure 118 Middle East & Africa Biofuel Industry Market by End-Use, 2023-2033 (US$ Bn, AGR (%))
Figure 119 Global Biofuel Industry Market Share Forecast by End-Use, 2023-2033 (%)
Figure 120 Middle East & Africa Biofuel Industry Market by Generation, 2023-2033 (US$ Bn, AGR (%))
Figure 121 Global Biofuel Industry Market Share Forecast by Generation, 2023-2033 (%)
Figure 122 Middle East & Africa Biofuel Industry Market by Source, 2023-2033 (US$ Bn, AGR (%))
Figure 123 Global Biofuel Industry Market Share Forecast by Source, 2023-2033 (%)
Figure 124 GCC Biofuel Industry Market by Value, 2023-2033 (US$ Bn, AGR (%))
Figure 125 South Africa Biofuel Industry Market by Value, 2023-2033 (US$ Bn, AGR (%))
Figure 126 Rest of Middle East & Africa Biofuel Industry Market by Value, 2023-2033 (US$ Bn, AGR (%))
Figure 127 Latin America Biofuel Industry Market Attractiveness Index
Figure 128 Latin America Biofuel Industry Market by Country, 2023-2033 (US$ Bn, AGR (%))
Figure 129 Latin America Biofuel Industry Market Share Forecast by Country, 2023 & 2033 (%)
Figure 130 Latin America Biofuel Industry Market by Type, 2023-2033 (US$ Bn, AGR (%))
Figure 131 Latin America Biofuel Industry Market Share Forecast by Type, 2023 & 2033 (%)
Figure 132 Latin America Biofuel Industry Market by End-Use, 2023-2033 (US$ Bn, AGR (%))
Figure 133 Global Biofuel Industry Market Share Forecast by End-Use, 2023-2033 (%)
Figure 134 Latin America Biofuel Industry Market by Generation, 2023-2033 (US$ Bn, AGR (%))
Figure 135 Global Biofuel Industry Market Share Forecast by Generation, 2023-2033 (%)
Figure 136 Latin America Biofuel Industry Market by Source, 2023-2033 (US$ Bn, AGR (%))
Figure 137 Global Biofuel Industry Market Share Forecast by Source, 2023-2033 (%)
Figure 138 Brazil Biofuel Industry Market by Value, 2023-2033 (US$ Bn, AGR (%))
Figure 139 Argentina Biofuel Industry Market by Value, 2023-2033 (US$ Bn, AGR (%))
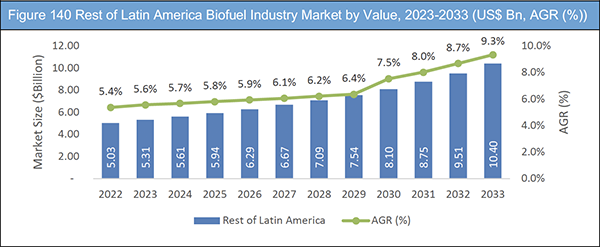
Figure 140 Rest of Latin America Biofuel Industry Market by Value, 2023-2033 (US$ Bn, AGR (%))
Figure 141 Green Plains: Net Revenue, 2018-2022 (US$ million, AGR%)
Figure 142 Green Plains: Business Segment Market Shares, 2022
Figure 143 Petróleo Brasileiro S.A. — Petrobras: Net Revenue, 2017-2021 (US$ million, AGR%)
Figure 144 Petróleo Brasileiro S.A. — Petrobras: R&D, 2017-2021 (US$ million, AGR%)
Figure 145 Petróleo Brasileiro S.A. — Petrobras: Business Segment Market Shares, 2021
Figure 146 Valero Marketing and Supply Company: Net Revenue, 2018-2022 (US$ million, AGR%)
Figure 147 Valero Marketing and Supply Company: Regional Market Shares, 2022
Figure 148 Valero Marketing and Supply Company: Business Segment Market Shares, 2022
Figure 149 Pacific Ethanol, Inc.: Net Revenue, 2017-2021 (US$ million, AGR%)
Figure 150 Pacific Ethanol, Inc.: Business Segment Market Shares, 2021
Figure 151 Gevo, Inc.: Net Revenue, 2017-2021 (US$ million, AGR%)
Figure 152 Gevo, Inc.: R&D 2017-2021 (US$ million, AGR%)
Figure 153 Gevo, Inc.: Regional Market Shares, 2022
Figure 154 Gevo, Inc.: Business Segment Market Shares, 2022
Figure 155 Wilmar International Limited: Net Revenue, 2017-2021 (US$ million, AGR%)
Figure 156 Wilmar International Limited: Regional Market Shares, 2021
Figure 157 Wilmar International Limited: Business Segment Market Shares, 2021
Figure 158 Renewable Energy Group, Inc.: Net Revenue, 2017-2021 (US$ million, AGR%)
Figure 159 Renewable Energy Group, Inc.: Regional Market Shares, 2021
Figure 160 Renewable Energy Group, Inc.: Business Segment Market Shares, 2021
Figure 161 Bunge Limited: Net Revenue, 2017-2021 (US$ million, AGR%)
Figure 162 Bunge Limited: R&D, 2017-2021 (US$ million, AGR%)
Figure 163 Bunge Limited: Regional Market Shares, 2021
Figure 164 Bunge Limited: Business Segment Market Shares, 2021
Figure 165 Royal Dutch Shell PLC: Net Revenue, 2017-2021 (US$ million, AGR%)
Figure 166 Royal Dutch Shell PLC: R&D, 2017-2021 (US$ million, AGR%)
Figure 167 Royal Dutch Shell PLC: Regional Market Shares, 2021
Figure 168 Royal Dutch Shell PLC: Business Segment Market Shares, 2021
Figure 169 CropEnergies AG: Net Revenue, 2017-2021 (US$ million, AGR%)
Figure 170 CropEnergies AG: R&D, 2017-2021 (US$ million, AGR%)
Figure 171 CropEnergies AG: Business Segment Market Shares, 2021
Figure 172 Air Liquide: Net Revenue, 2018-2022 (US$ million, AGR%)
Figure 173 Air Liquide: R&D, 2018-2022 (US$ million, AGR%)
Figure 174 Air Liquide: Regional Market Shares, 2022
Figure 175 Air Liquide: Business Segment Market Shares, 2022
Figure 176 Cosan S. A.: Net Revenue, 2018-2022 (US$ million, AGR%)
Figure 177 Cosan S. A.: Business Segment Market Shares, 2021
Figure 178 FutureFuel Corporation: Net Revenue, 2018-2022 (US$ million, AGR%)
Figure 179 FutureFuel Corporation: R&D, 2017-2021 (US$ million, AGR%)
Figure 180 FutureFuel Corporation: Regional Market Shares, 2021
Figure 181 FutureFuel Corporation: Business Segment Market Shares, 2021
ページTOPに戻る
Summary
Report Details
The Biofuel Industry Market Report 2023-2033: This report will prove invaluable to leading firms striving for new revenue pockets if they wish to better understand the industry and its underlying dynamics. It will be useful for companies that would like to expand into different industries or to expand their existing operations in a new region.
The Market Is Driven by the Need for More Sustainable Energy Sources and Concerns Over Climate Change
The biofuel industry has emerged as a viable alternative to fossil fuels, with biofuels being derived from renewable organic materials such as plants and waste materials. The biofuel industry faces several challenges, including competition for land and resources, the cost of production, and limited infrastructure for distribution and storage. However, the industry continues to grow and innovate, with new technologies being developed to increase efficiency and reduce costs. Governments around the world are also implementing policies to encourage the use of biofuels, such as mandates requiring a certain percentage of biofuels to be used in transportation fuel.
As the world continues to prioritize sustainability and reduce greenhouse gas emissions, the biofuel industry is likely to play an increasingly important role in the energy mix. The industry has the potential to create new jobs and promote economic growth while reducing dependence on fossil fuels. However, it is important to ensure that the growth of the biofuel industry is sustainable, with efforts to mitigate environmental impacts, promote responsible land-use practices, and support communities and farmers who may be affected by the industry. Overall, the biofuel industry represents an exciting opportunity to transition towards a more sustainable and equitable energy future
What Questions Should You Ask before Buying a Market Research Report?
• How is the biofuel industry market evolving?
• What is driving and restraining the biofuel industry market?
• How will each biofuel industry submarket segment grow over the forecast period and how much revenue will these submarkets account for in 2033?
• How will the market shares for each biofuel industry submarket develop from 2023 to 2033?
• What will be the main driver for the overall market from 2023 to 2033?
• Will leading biofuel industry markets broadly follow the macroeconomic dynamics, or will individual national markets outperform others?
• How will the market shares of the national markets change by 2033 and which geographical region will lead the market in 2033?
• Who are the leading players and what are their prospects over the forecast period?
• What are the biofuel industry projects for these leading companies?
• How will the industry evolve during the period between 2023 and 2033? What are the implications of biofuel industry projects taking place now and over the next 10 years?
• Is there a greater need for product commercialisation to further scale the biofuel industry market?
• Where is the biofuel industry market heading and how can you ensure you are at the forefront of the market?
• What are the best investment options for new product and service lines?
• What are the key prospects for moving companies into a new growth path and C-suite?
You need to discover how this will impact the biofuel industry market today, and over the next 10 years:
• Our 296-page report provides 114 tables and 181 charts/graphs exclusively to you.
• The report highlights key lucrative areas in the industry so you can target them – NOW.
• It contains in-depth analysis of global, regional and national sales and growth.
• It highlights for you the key successful trends, changes and revenue projections made by your competitors.
This report tells you TODAY how the biofuel industry market will develop in the next 10 years, and in line with the variations in COVID-19 economic recession and bounce. This market is more critical now than at any point over the last 10 years.
Forecasts to 2033 and other analyses reveal commercial prospects
• In addition to revenue forecasting to 2033, our new study provides you with recent results, growth rates, and market shares.
• You will find original analyses, with business outlooks and developments.
• Discover qualitative analyses (including market dynamics, drivers, opportunities, restraints and challenges), cost structure, impact of rising biofuel industry prices and recent developments.
This report includes data analysis and invaluable insight into how COVID-19 will affect the industry and your company. Four COVID-19 recovery patterns and their impact, namely, “V”, “L”, “W” and “U” are discussed in this report.
Segments Covered in the Report
Market Segment by Type
• Biodiesel
• Ethanol
• Other Type
Market Segment by End-Use
• Transportation
• Electricity Generation
• Heating Buildings
• Other End-Uses
Market Segment by Generation
• First-generation Biofuels
• Second-generation Biofuels
• Third-generation Biofuels
• Fourth-generation Biofuels
• Fifth-generation Biofuels
Market Segment by Source
• Maize
• Vegetable oils
• Sugar beet
• Wheat
• Sugar Cane
• Other Sources
In addition to the revenue predictions for the overall world market and segments, you will also find revenue forecasts for four regional and 20 leading national markets:
North America
• U.S.
• Canada
Europe
• Germany
• Spain
• United Kingdom
• France
• Italy
• Rest of Europe
Asia Pacific
• China
• Indonesia
• India
• Australia
• South Korea
• Rest of Asia Pacific
Latin America
• Brazil
• Mexico
• Rest of Latin America
Middle East & Africa
• GCC
• South Africa
• Rest of Middle East & Africa
The report also includes profiles and for some of the leading companies in the Biofuel Industry Market, 2023 to 2033, with a focus on this segment of these companies’ operations.
Leading companies and the potential for market growth
• Abengoa, S.A.
• Air Liquide
• Bunge Limited
• Butamax Advanced Biofuels, LLC
• Cosan S. A.
• CropEnergies AG
• FutureFuel Corporation
• Gevo, Inc.
• Green Plains
• Pacific Ethanol, Inc.
• Petróleo Brasileiro S.A. — Petrobras
• Renewable Energy Group, Inc.
• Royal Dutch Shell PLC
• Valero Marketing and Supply Company
• Wilmar International Limited
Overall world revenue for Biofuel Industry Market, 2023 to 2033 in terms of value the market will surpass US$123.98 billion in 2023, our work calculates. We predict strong revenue growth through to 2033. Our work identifies which organizations hold the greatest potential. Discover their capabilities, progress, and commercial prospects, helping you stay ahead.
How will the Biofuel Industry Market, 2023 to 2033 report help you?
In summary, our 290+ page report provides you with the following knowledge:
• Revenue forecasts to 2033 for Biofuel Industry Market, 2023 to 2033 Market, with forecasts for type, source, generation, end-use and company size, each forecast at a global and regional level – discover the industry’s prospects, finding the most lucrative places for investments and revenues.
• Revenue forecasts to 2033 for four regional and 20 key national markets – See forecasts for the Biofuel Industry Market, 2023 to 2033 market in North America, Europe, Asia-Pacific, Latin America and Middle East & Africa. Also forecasted is the market in the US, Canada, Brazil, Germany, France, UK, Italy, China, India, Indonesia, and Australia among other prominent economies.
• Prospects for established firms and those seeking to enter the market – including company profiles for 15 of the major companies involved in the Biofuel Industry Market, 2023 to 2033.
Find quantitative and qualitative analyses with independent predictions. Receive information that only our report contains, staying informed with invaluable business intelligence.
Information found nowhere else
With our new report, you are less likely to fall behind in knowledge or miss out on opportunities. See how our work could benefit your research, analyses, and decisions. Visiongain’s study is for everybody needing commercial analyses for the Biofuel Industry Market, 2023 to 2033, market-leading companies. You will find data, trends and predictions.
ページTOPに戻る
Table of Contents
Table of Contents
1 Report Overview
1.1 Objectives of the Study
1.2 Introduction to Biofuel Industry Market
1.3 What This Report Delivers
1.4 Why You Should Read This Report
1.5 Key Questions Answered by This Analytical Report
1.6 Who is This Report for?
1.7 Research Methodology
1.7.1 Market Definitions
1.7.2 Market Evaluation & Forecasting Methodology
1.7.3 Data Validation
1.7.3.1 Primary Research
1.7.3.2 Secondary Research
1.8 Frequently Asked Questions (FAQs)
1.9 Associated Visiongain Reports
1.10 About Visiongain
2 Executive Summary
2.1 Segment Analysis
2.1.1 Type Segment: Market Attractiveness Index
2.1.2 End-Use Segment: Market Attractiveness Index
2.1.3 Generation Segment: Market Attractiveness Index
2.1.4 Source Segment: Market Attractiveness Index
2.2 Regional analysis
3 Market Overview
3.1 Key Findings
3.2 Market Dynamics
3.2.1 Market Driving Factors
3.2.1.1 Expansion of Biofuel Production Infrastructure
3.2.1.2 The Growing Demand for EVs is Driving Innovation in the Biofuel Industry
3.2.1.3 The Volatility of Fossil Fuel Prices for the Biofuel Industry
3.2.2 Market Restraining Factors
3.2.2.1 Land-Use Conflicts Continue to Be a Major Issue for the Industry
3.2.2.2 The Lack of Adequate Infrastructure Can Limit the Growth of the Industry
3.2.3 Market Opportunities
3.2.3.1 Increased Demand for Sustainable Energy Sources in Biofuel Industry
3.2.3.2 The Demand for Cleaner-Burning Fuels in the Biofuel Industry
3.2.3.3 Partnerships and Collaborations in Biofuel Industry
3.3 COVID-19 Impact Analysis
3.4 Porter’s Five Forces Analysis
3.4.1 Bargaining Power of Suppliers
3.4.2 Bargaining Power of Buyers
3.4.3 Competitive Rivalry
3.4.4 Threat from Substitutes
3.4.5 Threat of New Entrants
3.5 PEST Analysis
3.5.1 Political Factors
3.5.2 Economic Factors
3.5.3 Social Factors
3.5.4 Technological Factors
4 Biofuel Industry Market Analysis by Type
4.1 Key Findings
4.2 Type Segment: Market Attractiveness Index
4.3 Biofuel Industry Market Size Estimation and Forecast by Type
4.4 Biodiesel Segment
4.4.1 Market Size by Region, 2023-2033 (US$ Bn)
4.4.2 Market Share by Region, 2023 & 2033 (%)
4.5 Ethanol Segment
4.5.1 Market Size by Region, 2023-2033 (US$ Bn)
4.5.2 Market Share by Region, 2023 & 2033 (%)
4.6 Other Type Segment
4.6.1 Market Size by Region, 2023-2033 (US$ Bn)
4.6.2 Market Share by Region, 2023 & 2033 (%)
5 Biofuel Industry Market Analysis by End-Use
5.1 Key Findings
5.2 End-Use Segment: Market Attractiveness Index
5.3 Biofuel Industry Market Size Estimation and Forecast by End-Use
5.4 Transportation Segment
5.4.1 Market Size by Region, 2023-2033 (US$ Bn)
5.4.2 Market Share by Region, 2023 & 2033 (%)
5.5 Electricity Generation Segment
5.5.1 Market Size by Region, 2023-2033 (US$ Bn)
5.5.2 Market Share by Region, 2023 & 2033 (%)
5.6 Heating Buildings Segment
5.6.1 Market Size by Region, 2023-2033 (US$ Bn)
5.6.2 Market Share by Region, 2023 & 2033 (%)
5.7 Other End-Uses Segment
5.7.1 Market Size by Region, 2023-2033 (US$ Bn)
5.7.2 Market Share by Region, 2023 & 2033 (%)
6 Biofuel Industry Market Analysis by Generation
6.1 Key Findings
6.2 Generation Segment: Market Attractiveness Index
6.3 Biofuel Industry Market Size Estimation and Forecast by Generation
6.4 First-generation Biofuels Segment
6.4.1 Market Size by Region, 2023-2033 (US$ Bn)
6.4.2 Market Share by Region, 2023 & 2033 (%)
6.5 Second-generation Biofuels
6.5.1 Market Size by Region, 2023-2033 (US$ Bn)
6.5.2 Market Share by Region, 2023 & 2033 (%)
6.6 Third-generation Biofuels
6.6.1 Market Size by Region, 2023-2033 (US$ Bn)
6.6.2 Market Share by Region, 2023 & 2033 (%)
6.7 Fourth-generation Biofuels Segment
6.7.1 Market Size by Region, 2023-2033 (US$ Bn)
6.7.2 Market Share by Region, 2023 & 2033 (%)
6.8 Fifth-generation Biofuels Segment
6.8.1 Market Size by Region, 2023-2033 (US$ Bn)
6.8.2 Market Share by Region, 2023 & 2033 (%)
7 Biofuel Industry Market Analysis by Source
7.1 Key Findings
7.2 Source Segment: Market Attractiveness Index
7.3 Biofuel Industry Market Size Estimation and Forecast by Source
7.4 Maize Segment
7.4.1 Market Size by Region, 2023-2033 (US$ Bn)
7.4.2 Market Share by Region, 2023 & 2033 (%)
7.5 Vegetable Oils Segment
7.5.1 Market Size by Region, 2023-2033 (US$ Bn)
7.5.2 Market Share by Region, 2023 & 2033 (%)
7.6 Sugar Beet Segment
7.6.1 Market Size by Region, 2023-2033 (US$ Bn)
7.6.2 Market Share by Region, 2023 & 2033 (%)
7.7 Wheat Segment
7.7.1 Market Size by Region, 2023-2033 (US$ Bn)
7.7.2 Market Share by Region, 2023 & 2033 (%)
7.8 Sugar Cane Segment
7.8.1 Market Size by Region, 2023-2033 (US$ Bn)
7.8.2 Market Share by Region, 2023 & 2033 (%)
7.9 Other Sources
7.9.1 Market Size by Region, 2023-2033 (US$ Bn)
7.9.2 Market Share by Region, 2023 & 2033 (%)
8 Biofuel Industry Market Analysis by Region
8.1 Key Findings
8.2 Regional Market Size Estimation and Forecast
9 North America Biofuel Industry Market Analysis
9.1 Key Findings
9.2 North America Biofuel Industry Market Attractiveness Index
9.3 North America Biofuel Industry Market Size Estimation and Forecast by Country
9.4 North America Biofuel Industry Market Size Estimation and Forecast by Type
9.5 North America Biofuel Industry Market Size Estimation and Forecast by End-Use
9.6 North America Biofuel Industry Market Size Estimation and Forecast by Generation
9.7 North America Biofuel Industry Market Size Estimation and Forecast by Source
9.8 U.S. Biofuel Industry Market Analysis
9.9 Canada Biofuel Industry Market Analysis
10 Europe Biofuel Industry Market Analysis
10.1 Key Findings
10.2 Europe Biofuel Industry Market Attractiveness Index
10.3 Europe Biofuel Industry Market Size Estimation and Forecast by Country
10.4 Europe Biofuel Industry Market Size Estimation and Forecast by Type
10.5 Europe Biofuel Industry Market Size Estimation and Forecast by End-Use
10.6 Europe Biofuel Industry Market Size Estimation and Forecast by Generation
10.7 Europe Biofuel Industry Market Size Estimation and Forecast by Source
10.8 Germany Biofuel Industry Market Analysis
10.9 UK Biofuel Industry Market Analysis
10.10 France Biofuel Industry Market Analysis
10.11 Italy Biofuel Industry Market Analysis
10.12 Spain Biofuel Industry Market Analysis
10.13 Rest of Europe Biofuel Industry Market Analysis
11 Asia-Pacific Biofuel Industry Market Analysis
11.1 Key Findings
11.2 Asia-Pacific Biofuel Industry Market Attractiveness Index
11.3 Asia-Pacific Biofuel Industry Market Size Estimation and Forecast by Country
11.4 Asia-Pacific Biofuel Industry Market Size Estimation and Forecast by Type
11.5 Asia-Pacific Biofuel Industry Market Size Estimation and Forecast by End-Use
11.6 Asia-Pacific Biofuel Industry Market Size Estimation and Forecast by Generation
11.7 Asia-Pacific Biofuel Industry Market Size Estimation and Forecast by Source
11.8 China Biofuel Industry Market Analysis
11.9 India Biofuel Industry Market Analysis
11.10 Indonesia Biofuel Industry Market Analysis
11.11 South Korea Biofuel Industry Market Analysis
11.12 Australia Biofuel Industry Market Analysis
11.13 Rest of Asia-Pacific Biofuel Industry Market Analysis
12 Middle East & Africa Biofuel Industry Market Analysis
12.1 Key Findings
12.2 Middle East & Africa Biofuel Industry Market Attractiveness Index
12.3 Middle East & Africa Biofuel Industry Market Size Estimation and Forecast by Country
12.4 Middle East & Africa Biofuel Industry Market Size Estimation and Forecast by Type
12.5 Middle East & Africa Biofuel Industry Market Size Estimation and Forecast by End-Use
12.6 Middle East & Africa Biofuel Industry Market Size Estimation and Forecast by Generation
12.7 Middle East & Africa Biofuel Industry Market Size Estimation and Forecast by Source
12.8 GCC Biofuel Industry Market Analysis
12.9 South Africa Biofuel Industry Market Analysis
12.10 Rest of Middle East & Africa Biofuel Industry Market Analysis
13 Latin America Biofuel Industry Market Analysis
13.1 Key Findings
13.2 Latin America Biofuel Industry Market Attractiveness Index
13.3 Latin America Biofuel Industry Market Size Estimation and Forecast by Country
13.4 Latin America Biofuel Industry Market Size Estimation and Forecast by Type
13.5 Latin America Biofuel Industry Market Size Estimation and Forecast by End-Use
13.6 Latin America Biofuel Industry Market Size Estimation and Forecast by Generation
13.7 Latin America Biofuel Industry Market Size Estimation and Forecast by Source
13.8 Brazil Biofuel Industry Market Analysis
13.9 Argentina Biofuel Industry Market Analysis
13.10 Rest of Latin America Biofuel Industry Market Analysis
14 Company Profiles
14.1 Competitive Landscape, 2021
14.2 Strategic Outlook
14.2.1 Agreement as Key Business Strategy
14.2.2 Collaboration as Key Business Strategy
14.2.3 Contract as Key Business Strategy
14.2.4 New Product Launch as Key Business Strategy
14.2.5 Investment as Key Business Strategy
14.2.6 Joint Venture as Key Business Strategy
14.2.7 Partnership as Key Business Strategy
14.3 Green Plains
14.3.1 Company Snapshot
14.3.2 Company Overview
14.3.3 Financial Analysis
14.3.3.1 Net Revenue, 2018-2022
14.3.3.2 Business Segment Market Shares, 2022
14.3.4 Product Benchmarking
14.3.5 Strategic Outlook
14.4 Petróleo Brasileiro S.A. — Petrobras
14.4.1 Company Snapshot
14.4.2 Company Overview
14.4.3 Financial Analysis
14.4.3.1 Net Revenue, 2017-2021
14.4.3.2 R&D, 2017-2021
14.4.3.3 Business Segment Market Shares, 2021
14.4.4 Product Benchmarking
14.4.5 Strategic Outlook
14.5 Valero Marketing and Supply Company
14.5.1 Company Snapshot
14.5.2 Company Overview
14.5.3 Financial Analysis
14.5.3.1 Net Revenue, 2018-2022
14.5.3.2 Regional Market Shares, 2022
14.5.3.3 Business Segment Market Shares, 2022
14.5.4 Product Benchmarking
14.6 Pacific Ethanol, Inc.
14.6.1 Company Snapshot
14.6.2 Company Overview
14.6.3 Financial Analysis
14.6.3.1 Net Revenue, 2017-2021
14.6.3.2 Business Segment Market Shares, 2021
14.6.4 Product Benchmarking
14.7 Butamax Advanced Biofuels, LLC
14.7.1 Company Snapshot
14.7.2 Company Overview
14.7.3 Product Benchmarking
14.8 Gevo, Inc.
14.8.1 Company Snapshot
14.8.2 Company Overview
14.8.3 Financial Analysis
14.8.3.1 Net Revenue, 2017-2021
14.8.3.2 R&D, 2017-2021
14.8.3.3 Regional Market Shares, 2022
14.8.3.4 Business Segment Market Shares, 2022
14.8.4 Product Benchmarking
14.8.5 Strategic Outlook
14.9 Wilmar International Limited
14.9.1 Company Snapshot
14.9.2 Company Overview
14.9.3 Financial Analysis
14.9.3.1 Net Revenue, 2017-2021
14.9.3.2 Regional Market Shares, 2021
14.9.3.3 Business Segment Market Shares, 2021
14.9.4 Product Benchmarking
14.10 Renewable Energy Group, Inc.
14.10.1 Company Snapshot
14.10.2 Company Overview
14.10.3 Financial Analysis
14.10.3.1 Net Revenue, 2017-2021
14.10.3.2 Regional Market Shares, 2021
14.10.3.3 Business Segment Market Shares, 2021
14.10.4 Product Benchmarking
14.10.5 Strategic Outlook
14.11 Bunge Limited
14.11.1 Company Snapshot
14.11.2 Company Overview
14.11.3 Financial Analysis
14.11.3.1 Net Revenue, 2017-2021
14.11.3.2 R&D, 2017-2021
14.11.3.3 Regional Market Shares, 2021
14.11.3.4 Business Segment Market Shares, 2021
14.11.4 Product Benchmarking
14.12 Royal Dutch Shell PLC
14.12.1 Company Snapshot
14.12.2 Company Overview
14.12.3 Financial Analysis
14.12.3.1 Net Revenue, 2017-2021
14.12.3.2 R&D, 2017-2021
14.12.3.3 Regional Market Shares, 2021
14.12.3.4 Business Segment Market Shares, 2021
14.12.4 Product Benchmarking
14.12.5 Strategic Outlook
14.13 CropEnergies AG
14.13.1 Company Snapshot
14.13.2 Company Overview
14.13.3 Financial Analysis
14.13.3.1 Net Revenue, 2017-2021
14.13.3.2 R&D, 2017-2021
14.13.3.3 Business Segment Market Shares, 2021
14.13.4 Product Benchmarking
14.14 Air Liquide
14.14.1 Company Snapshot
14.14.2 Company Overview
14.14.3 Financial Analysis
14.14.3.1 Net Revenue, 2018-2022
14.14.3.2 R&D, 2018-2022
14.14.3.3 Regional Market Shares, 2022
14.14.3.4 Business Segment Market Shares, 2022
14.14.4 Product Benchmarking
14.14.5 Strategic Outlook
14.15 Abengoa, S.A.
14.15.1 Company Snapshot
14.15.2 Company Overview
14.15.3 Product Benchmarking
14.16 Cosan S. A.
14.16.1 Company Snapshot
14.16.2 Company Overview
14.16.3 Financial Analysis
14.16.3.1 Net Revenue, 2017-2021
14.16.3.2 Business Segment Market Shares, 2021
14.16.4 Product Benchmarking
14.16.5 Strategic Outlook
14.17 FutureFuel Corporation
14.17.1 Company Snapshot
14.17.2 Company Overview
14.17.3 Financial Analysis
14.17.3.1 Net Revenue, 2017-2021
14.17.3.2 R&D, 2017-2021
14.17.3.3 Regional Market Shares, 2021
14.17.3.4 Business Segment Market Shares, 2021
14.17.4 Product Benchmarking
15 Conclusion and Recommendations
15.1 Concluding Remarks from Visiongain
15.2 Recommendations for Market Players
List of Tables
Table 1 Biofuel Industry Market Snapshot, 2023 & 2033 (US$billion, CAGR %)
Table 2 Global Biofuel Industry Market by Region, 2023-2033 (US$ Bn, AGR (%), CAGR (%)) (V-Shaped Recovery Scenario)
Table 3 Global Biofuel Industry Market by Region, 2023-2033 (US$ Bn, AGR (%), CAGR (%)) (W-Shaped Recovery Scenario)
Table 4 Global Biofuel Industry Market by Region, 2023-2033 (US$ Bn, AGR (%), CAGR (%)) (U-Shaped Recovery Scenario)
Table 5 Global Biofuel Industry Market by Region, 2023-2033 (US$ Bn, AGR (%), CAGR (%)) (L-Shaped Recovery Scenario)
Table 6 Global Biofuel Industry Market by Type, 2023-2033 (US$ Bn, AGR (%), CAGR (%))
Table 7 Biodiesel Market by Region, 2023-2033 (US$ Bn, AGR (%), CAGR (%))
Table 8 Ethanol Market by Region, 2023-2033 (US$ Bn, AGR (%), CAGR (%))
Table 9 Other Type Market by Region, 2023-2033 (US$ Bn, AGR (%), CAGR (%))
Table 10 Global Biofuel Industry Market by End-Use, 2023-2033 (US$ Bn, AGR (%), CAGR (%))
Table 11 Transportation Market by Region, 2023-2033 (US$ Bn, AGR (%), CAGR (%))
Table 12 Electricity Generation Market by Region, 2023-2033 (US$ Bn, AGR (%), CAGR (%))
Table 13 Heating Buildings Market by Region, 2023-2033 (US$ Bn, AGR (%), CAGR (%))
Table 14 Other End-Uses Market by Region, 2023-2033 (US$ Bn, AGR (%), CAGR (%))
Table 15 Global Biofuel Industry Market by Generation, 2023-2033 (US$ Bn, AGR (%), CAGR (%))
Table 16 First-generation Biofuels Market by Region, 2023-2033 (US$ Bn, AGR (%), CAGR (%))
Table 17 Second-generation Biofuels Market by Region, 2023-2033 (US$ Bn, AGR (%), CAGR (%))
Table 18 Third-generation Biofuels Market by Region, 2023-2033 (US$ Bn, AGR (%), CAGR (%))
Table 19 Fourth-generation Biofuels Market by Region, 2023-2033 (US$ Bn, AGR (%), CAGR (%))
Table 20 Fifth-generation Biofuels Market by Region, 2023-2033 (US$ Bn, AGR (%), CAGR (%))
Table 21 Global Biofuel Industry Market by Source, 2023-2033 (US$ Bn, AGR (%), CAGR (%))
Table 22 Maize Market by Region, 2023-2033 (US$ Bn, AGR (%), CAGR (%))
Table 23 Vegetable oils Market by Region, 2023-2033 (US$ Bn, AGR (%), CAGR (%))
Table 24 Sugar beet Market by Region, 2023-2033 (US$ Bn, AGR (%), CAGR (%))
Table 25 Wheat Market by Region, 2023-2033 (US$ Bn, AGR (%), CAGR (%))
Table 26 Sugar Cane Market by Region, 2023-2033 (US$ Bn, AGR (%), CAGR (%))
Table 27 Other Sources Market by Region, 2023-2033 (US$ Bn, AGR (%), CAGR (%))
Table 28 Global Biofuel Industry Market by Region, 2023-2033 (US$ Bn, AGR (%), CAGR (%))
Table 29 North America Biofuel Industry Market by Country, 2023-2033 (US$ Bn, AGR (%), CAGR (%))
Table 30 North America Biofuel Industry Market by Type, 2023-2033 (US$ Bn, AGR (%), CAGR (%))
Table 31 North America Biofuel Industry Market by End-Use, 2023-2033 (US$ Bn, AGR (%), CAGR (%))
Table 32 North America Biofuel Industry Market by Generation, 2023-2033 (US$ Bn, AGR (%), CAGR (%))
Table 33 North America Biofuel Industry Market by Source, 2023-2033 (US$ Bn, AGR (%), CAGR (%))
Table 34 US Biofuel Industry Market by Value, 2023-2033 (US$ Bn, AGR (%), CAGR (%))
Table 35 Canada Biofuel Industry Market by Value, 2023-2033 (US$ Bn, AGR (%), CAGR (%))
Table 36 Europe Biofuel Industry Market by Country, 2023-2033 (US$ Bn, AGR (%), CAGR (%))
Table 37 Europe Biofuel Industry Market by Type, 2023-2033 (US$ Bn, AGR (%), CAGR (%))
Table 38 Europe Biofuel Industry Market by End-Use, 2023-2033 (US$ Bn, AGR (%), CAGR (%))
Table 39 Europe Biofuel Industry Market by Generation, 2023-2033 (US$ Bn, AGR (%), CAGR (%))
Table 40 Europe Biofuel Industry Market by Source, 2023-2033 (US$ Bn, AGR (%), CAGR (%))
Table 41 Germany Biofuel Industry Market by Value, 2023-2033 (US$ Bn, AGR (%), CAGR (%))
Table 42 UK Biofuel Industry Market by Value, 2023-2033 (US$ Bn, AGR (%), CAGR (%))
Table 43 France Biofuel Industry Market by Value, 2023-2033 (US$ Bn, AGR (%), CAGR (%))
Table 44 Italy Biofuel Industry Market by Value, 2023-2033 (US$ Bn, AGR (%), CAGR (%))
Table 45 Spain Biofuel Industry Market by Value, 2023-2033 (US$ Bn, AGR (%), CAGR (%))
Table 46 Rest of Europe Biofuel Industry Market by Value, 2023-2033 (US$ Bn, AGR (%), CAGR (%))
Table 47 Asia-Pacific Biofuel Industry Market by Country, 2023-2033 (US$ Bn, AGR (%), CAGR (%))
Table 48 Asia-Pacific Biofuel Industry Market by Type, 2023-2033 (US$ Bn, AGR (%), CAGR (%))
Table 49 Asia-Pacific Biofuel Industry Market by End-Use, 2023-2033 (US$ Bn, AGR (%), CAGR (%))
Table 50 Asia-Pacific Biofuel Industry Market by Generation, 2023-2033 (US$ Bn, AGR (%), CAGR (%))
Table 51 Asia-Pacific Biofuel Industry Market by Source, 2023-2033 (US$ Bn, AGR (%), CAGR (%))
Table 52 China Biofuel Industry Market by Value, 2023-2033 (US$ Bn, AGR (%), CAGR (%))
Table 53 India Biofuel Industry Market by Value, 2023-2033 (US$ Bn, AGR (%), CAGR (%))
Table 54 Indonesia Biofuel Industry Market by Value, 2023-2033 (US$ Bn, AGR (%), CAGR (%))
Table 55 South Korea Biofuel Industry Market by Value, 2023-2033 (US$ Bn, AGR (%), CAGR (%))
Table 56 Australia Biofuel Industry Market by Value, 2023-2033 (US$ Bn, AGR (%), CAGR (%))
Table 57 Rest of Asia-Pacific Biofuel Industry Market by Value, 2023-2033 (US$ Bn, AGR (%), CAGR (%))
Table 58 Middle East & Africa Biofuel Industry Market by Country, 2023-2033 (US$ Bn, AGR (%), CAGR (%))
Table 59 Middle East & Africa Biofuel Industry Market by Type, 2023-2033 (US$ Bn, AGR (%), CAGR (%))
Table 60 Middle East & Africa Biofuel Industry Market by End-Use, 2023-2033 (US$ Bn, AGR (%), CAGR (%))
Table 61 Middle East & Africa Biofuel Industry Market by Generation, 2023-2033 (US$ Bn, AGR (%), CAGR (%))
Table 62 Middle East & Africa Biofuel Industry Market by Source, 2023-2033 (US$ Bn, AGR (%), CAGR (%))
Table 63 GCC Biofuel Industry Market by Value, 2023-2033 (US$ Bn, AGR (%), CAGR (%))
Table 64 South Africa Biofuel Industry Market by Value, 2023-2033 (US$ Bn, AGR (%), CAGR (%))
Table 65 Rest of Middle East & Africa Biofuel Industry Market by Value, 2023-2033 (US$ Bn, AGR (%), CAGR (%))
Table 66 Latin America Biofuel Industry Market by Country, 2023-2033 (US$ Bn, AGR (%), CAGR (%))
Table 67 Latin America Biofuel Industry Market by Type, 2023-2033 (US$ Bn, AGR (%), CAGR (%))
Table 68 Latin America Biofuel Industry Market by End-Use, 2023-2033 (US$ Bn, AGR (%), CAGR (%))
Table 69 Latin America Biofuel Industry Market by Generation, 2023-2033 (US$ Bn, AGR (%), CAGR (%))
Table 70 Latin America Biofuel Industry Market by Source, 2023-2033 (US$ Bn, AGR (%), CAGR (%))
Table 71 Brazil Biofuel Industry Market by Value, 2023-2033 (US$ Bn, AGR (%), CAGR (%))
Table 72 Argentina Biofuel Industry Market by Value, 2023-2033 (US$ Bn, AGR (%), CAGR (%))
Table 73 Rest of Latin America Biofuel Industry Market by Value, 2023-2033 (US$ Bn, AGR (%), CAGR (%))
Table 74 Biofuel Industry Market: Company Share/Ranking, 2021
Table 75 Green Plains: Key Details, (CEO, HQ, Revenue, Founded, No. of Employees, Company Type, Website, Business Segment)
Table 76 Green Plains: Product Benchmarking
Table 77 Green Plains: Strategic Outlook
Table 78 Petróleo Brasileiro S.A. — Petrobras: Key Details, (CEO, HQ, Revenue, Founded, No. of Employees, Company Type, Website, Business Segment)
Table 79 Petróleo Brasileiro S.A. — Petrobras: Product Benchmarking
Table 80 Petróleo Brasileiro S.A. — Petrobras: Strategic Outlook
Table 81 Valero Marketing and Supply Company: Key Details, (CEO, HQ, Revenue, Founded, No. of Employees, Company Type, Website, Business Segment)
Table 82 Valero Marketing and Supply Company: Product Benchmarking
Table 83 Pacific Ethanol, Inc.: Key Details, (CEO, HQ, Revenue, Founded, No. of Employees, Company Type, Website, Business Segment)
Table 84 Pacific Ethanol, Inc.: Product Benchmarking
Table 85 Butamax Advanced Biofuels, LLC: Key Details, (CEO, HQ, Revenue, Founded, No. of Employees, Company Type, Website, Business Segment)
Table 86 Butamax Advanced Biofuels, LLC: Product Benchmarking
Table 87 Gevo, Inc.: Key Details, (CEO, HQ, Revenue, Founded, No. of Employees, Company Type, Website, Business Segment)
Table 88 Gevo, Inc.: Product Benchmarking
Table 89 Gevo, Inc.: Strategic Outlook
Table 90 Wilmar International Limited: Key Details, (CEO, HQ, Revenue, Founded, No. of Employees, Company Type, Website, Business Segment)
Table 91 Wilmar International Limited: Product Benchmarking
Table 92 Renewable Energy Group, Inc.: Key Details, (CEO, HQ, Revenue, Founded, No. of Employees, Company Type, Website, Business Segment)
Table 93 Renewable Energy Group, Inc.: Product Benchmarking
Table 94 Renewable Energy Group, Inc.: Strategic Outlook
Table 95 Bunge Limited: Key Details, (CEO, HQ, Revenue, Founded, No. of Employees, Company Type, Website, Business Segment)
Table 96 Bunge Limited: Product Benchmarking
Table 97 Royal Dutch Shell PLC: Key Details, (CEO, HQ, Revenue, Founded, No. of Employees, Company Type, Website, Business Segment)
Table 98 Royal Dutch Shell PLC: Product Benchmarking
Table 99 Royal Dutch Shell PLC: Strategic Outlook
Table 100 CropEnergies AG: Key Details, (CEO, HQ, Revenue, Founded, No. of Employees, Company Type, Website, Business Segment)
Table 101 CropEnergies AG: Product Benchmarking
Table 102 Air Liquide: Key Details, (CEO, HQ, Revenue, Founded, No. of Employees, Company Type, Website, Business Segment)
Table 103 Air Liquide: Product Benchmarking
Table 104 Air Liquide: Strategic Outlook
Table 105 Abengoa, S.A.: Key Details, (CEO, HQ, Revenue, Founded, No. of Employees, Company Type, Website, Business Segment)
Table 106 Abengoa, S.A.: Product Benchmarking
Table 107 Cosan S. A.: Key Details, (CEO, HQ, Revenue, Founded, No. of Employees, Company Type, Website, Business Segment)
Table 108 Cosan S. A.: Product Benchmarking
Table 109 Cosan S. A.: Strategic Outlook
Table 110 FutureFuel Corporation: Key Details, (CEO, HQ, Revenue, Founded, No. of Employees, Company Type, Website, Business Segment)
Table 111 FutureFuel Corporation: Product Benchmarking
List of Figures
Figure 1 Biofuel Industry Market Segmentation
Figure 2 Biofuel Industry Market by Type: Market Attractiveness Index
Figure 3 Biofuel Industry Market by End-Use: Market Attractiveness Index
Figure 4 Biofuel Industry Market by Generation: Market Attractiveness Index
Figure 5 Biofuel Industry Market by Source: Market Attractiveness Index
Figure 6 Biofuel Industry Market Attractiveness Index by Region
Figure 7 Biofuel Industry Market: Market Dynamics
Figure 8 COVID Impact Analysis: Biofuel Industry Market Recovery Scenarios
Figure 9 Global Biofuel Industry Market by Region, 2023-2033 (US$ Bn, AGR (%)) (V-Shaped Recovery Scenario)
Figure 10 Global Biofuel Industry Market by Region, 2023-2033 (US$ Bn, AGR (%)) (W-Shaped Recovery Scenario)
Figure 11 Global Biofuel Industry Market by Region, 2023-2033 (US$ Bn, AGR (%)) (U-Shaped Recovery Scenario)
Figure 12 Global Biofuel Industry Market by Region, 2023-2033 (US$ Bn, AGR (%)) (L-Shaped Recovery Scenario)
Figure 13 Biofuel Industry Market: Porter’s Five Forces Analysis
Figure 14 Biofuel Industry Market: PEST Analysis
Figure 15 Biofuel Industry Market by Type: Market Attractiveness Index
Figure 16 Global Biofuel Industry Market by Type, 2023-2033 (US$ Bn, AGR (%))
Figure 17 Global Biofuel Industry Market Share Forecast by Type, 2023-2033 (%)
Figure 18 Biodiesel Market by Region, 2023-2033 (US$ Bn, AGR (%))
Figure 19 Biodiesel Market Share Forecast by Region, 2023 & 2033 (%)
Figure 20 Ethanol Market by Region, 2023-2033 (US$ Bn, AGR (%))
Figure 21 Ethanol Market Share Forecast by Region, 2023 & 2033 (%)
Figure 22 Other Type Market by Region, 2023-2033 (US$ Bn, AGR (%))
Figure 23 Other Type Market Share Forecast by Region, 2023 & 2033 (%)
Figure 24 Biofuel Industry Market by End-Use: Market Attractiveness Index
Figure 25 Global Biofuel Industry Market by End-Use, 2023-2033 (US$ Bn, AGR (%))
Figure 26 Global Biofuel Industry Market Share Forecast by End-Use, 2023-2033 (%)
Figure 27 Transportation Market by Region, 2023-2033 (US$ Bn, AGR (%))
Figure 28 Transportation Market Share Forecast by Region, 2023 & 2033 (%)
Figure 29 Electricity Generation Market by Region, 2023-2033 (US$ Bn, AGR (%))
Figure 30 Electricity Generation Market Share Forecast by Region, 2023 & 2033 (%)
Figure 31 Heating Buildings Market by Region, 2023-2033 (US$ Bn, AGR (%))
Figure 32 Heating Buildings Market Share Forecast by Region, 2023 & 2033 (%)
Figure 33 Other End-Uses Market by Region, 2023-2033 (US$ Bn, AGR (%))
Figure 34 Other End-Uses Market Share Forecast by Region, 2023 & 2033 (%)
Figure 35 Biofuel Industry Market by Generation: Market Attractiveness Index
Figure 36 Global Biofuel Industry Market by Generation, 2023-2033 (US$ Bn, AGR (%))
Figure 37 Global Biofuel Industry Market Share Forecast by Generation, 2023-2033 (%)
Figure 38 First-generation Biofuels Market by Region, 2023-2033 (US$ Bn, AGR (%))
Figure 39 First-generation Biofuels Market Share Forecast by Region, 2023 & 2033 (%)
Figure 40 Second-generation Biofuels Market by Region, 2023-2033 (US$ Bn, AGR (%))
Figure 41 Second-generation Biofuels Market Share Forecast by Region, 2023 & 2033 (%)
Figure 42 Third-generation Biofuels Market by Region, 2023-2033 (US$ Bn, AGR (%))
Figure 43 Third-generation Biofuels Market Share Forecast by Region, 2023 & 2033 (%)
Figure 44 Fourth-generation Biofuels Market by Region, 2023-2033 (US$ Bn, AGR (%))
Figure 45 Fourth-generation Biofuels Market Share Forecast by Region, 2023 & 2033 (%)
Figure 46 Fifth-generation Biofuels Market by Region, 2023-2033 (US$ Bn, AGR (%))
Figure 47 Fifth-generation Biofuels Market Share Forecast by Region, 2023 & 2033 (%)
Figure 48 Biofuel Industry Market by Source: Market Attractiveness Index
Figure 49 Global Biofuel Industry Market by Source, 2023-2033 (US$ Bn, AGR (%))
Figure 50 Global Biofuel Industry Market Share Forecast by Source, 2023-2033 (%)
Figure 51 Maize Market by Region, 2023-2033 (US$ Bn, AGR (%))
Figure 52 Maize Market Share Forecast by Region, 2023 & 2033 (%)
Figure 53 Vegetable oils Market by Region, 2023-2033 (US$ Bn, AGR (%))
Figure 54 Vegetable oils Biofuels Market Share Forecast by Region, 2023 & 2033 (%)
Figure 55 Sugar beet Market by Region, 2023-2033 (US$ Bn, AGR (%))
Figure 56 Sugar beet Market Share Forecast by Region, 2023 & 2033 (%)
Figure 57 Wheat Market by Region, 2023-2033 (US$ Bn, AGR (%))
Figure 58 Wheat Market Share Forecast by Region, 2023 & 2033 (%)
Figure 59 Sugar Cane Market by Region, 2023-2033 (US$ Bn, AGR (%))
Figure 60 Sugar Cane Market Share Forecast by Region, 2023 & 2033 (%)
Figure 61 Other Sources Market by Region, 2023-2033 (US$ Bn, AGR (%))
Figure 62 Other Sources Market Share Forecast by Region, 2023 & 2033 (%)
Figure 63 Global Biofuel Industry Market Share Forecast by Region,2023-2033 (%)
Figure 64 Global Biofuel Industry Market by Region, 2023-2033 (US$ Bn, AGR (%))
Figure 65 Global Biofuel Industry Market Share Forecast by Region, 2023-2033 (%)
Figure 66 North America Biofuel Industry Market Attractiveness Index
Figure 67 North America Biofuel Industry Market by Country, 2023-2033 (US$ Bn, AGR (%))
Figure 68 North America Biofuel Industry Market Share Forecast by Country, 2023 & 2033 (%)
Figure 69 North America Biofuel Industry Market by Type, 2023-2033 (US$ Bn, AGR (%))
Figure 70 North America Biofuel Industry Market Share Forecast by Type, 2023 & 2033 (%)
Figure 71 North America Biofuel Industry Market by End-Use, 2023-2033 (US$ Bn, AGR (%))
Figure 72 Global Biofuel Industry Market Share Forecast by End-Use, 2023-2033 (%)
Figure 73 North America Biofuel Industry Market by Generation, 2023-2033 (US$ Bn, AGR (%))
Figure 74 Global Biofuel Industry Market Share Forecast by Generation, 2023-2033 (%)
Figure 75 North America Biofuel Industry Market by Source, 2023-2033 (US$ Bn, AGR (%))
Figure 76 Global Biofuel Industry Market Share Forecast by Source, 2023-2033 (%)
Figure 77 US Biofuel Industry Market by Value, 2023-2033 (US$ Bn, AGR (%))
Figure 78 Canada Biofuel Industry Market by Value, 2023-2033 (US$ Bn, AGR (%))
Figure 79 Europe Biofuel Industry Market Attractiveness Index
Figure 80 Europe Biofuel Industry Market by Country, 2023-2033 (US$ Bn, AGR (%))
Figure 81 Europe Biofuel Industry Market Share Forecast by Country, 2023 & 2033 (%)
Figure 82 Europe Biofuel Industry Market by Type, 2023-2033 (US$ Bn, AGR (%))
Figure 83 Europe Biofuel Industry Market Share Forecast by Type, 2023 & 2033 (%)
Figure 84 Europe Biofuel Industry Market by End-Use, 2023-2033 (US$ Bn, AGR (%))
Figure 85 Global Biofuel Industry Market Share Forecast by End-Use, 2023-2033 (%)
Figure 86 Europe Biofuel Industry Market by Generation, 2023-2033 (US$ Bn, AGR (%))
Figure 87 Global Biofuel Industry Market Share Forecast by Generation, 2023-2033 (%)
Figure 88 Europe Biofuel Industry Market by Source, 2023-2033 (US$ Bn, AGR (%))
Figure 89 Global Biofuel Industry Market Share Forecast by Source, 2023-2033 (%)
Figure 90 Germany Biofuel Industry Market by Value, 2023-2033 (US$ Bn, AGR (%))
Figure 91 UK Biofuel Industry Market by Value, 2023-2033 (US$ Bn, AGR (%))
Figure 92 France Biofuel Industry Market by Value, 2023-2033 (US$ Bn, AGR (%))
Figure 93 Italy Biofuel Industry Market by Value, 2023-2033 (US$ Bn, AGR (%))
Figure 94 Spain Biofuel Industry Market by Value, 2023-2033 (US$ Bn, AGR (%))
Figure 95 Rest of Europe Biofuel Industry Market by Value, 2023-2033 (US$ Bn, AGR (%))
Figure 96 Asia-Pacific Biofuel Industry Market Attractiveness Index
Figure 97 Asia-Pacific Biofuel Industry Market by Country, 2023-2033 (US$ Bn, AGR (%))
Figure 98 Asia-Pacific Biofuel Industry Market Share Forecast by Country, 2023 & 2033 (%)
Figure 99 Asia-Pacific Biofuel Industry Market by Type, 2023-2033 (US$ Bn, AGR (%))
Figure 100 Asia-Pacific Biofuel Industry Market Share Forecast by Type, 2023 & 2033 (%)
Figure 101 Asia-Pacific Biofuel Industry Market by End-Use, 2023-2033 (US$ Bn, AGR (%))
Figure 102 Global Biofuel Industry Market Share Forecast by End-Use, 2023-2033 (%)
Figure 103 Asia-Pacific Biofuel Industry Market by Generation, 2023-2033 (US$ Bn, AGR (%))
Figure 104 Global Biofuel Industry Market Share Forecast by Generation, 2023-2033 (%)
Figure 105 Asia-Pacific Biofuel Industry Market by Source, 2023-2033 (US$ Bn, AGR (%))
Figure 106 Global Biofuel Industry Market Share Forecast by Source, 2023-2033 (%)
Figure 107 China Biofuel Industry Market by Value, 2023-2033 (US$ Bn, AGR (%))
Figure 108 India Biofuel Industry Market by Value, 2023-2033 (US$ Bn, AGR (%))
Figure 109 Indonesia Biofuel Industry Market by Value, 2023-2033 (US$ Bn, AGR (%))
Figure 110 South Korea Biofuel Industry Market by Value, 2023-2033 (US$ Bn, AGR (%))
Figure 111 Australia Biofuel Industry Market by Value, 2023-2033 (US$ Bn, AGR (%))
Figure 112 Rest of Asia-Pacific Biofuel Industry Market by Value, 2023-2033 (US$ Bn, AGR (%))
Figure 113 Middle East & Africa Biofuel Industry Market Attractiveness Index
Figure 114 Middle East & Africa Biofuel Industry Market by Country, 2023-2033 (US$ Bn, AGR (%))
Figure 115 Middle East & Africa Biofuel Industry Market Share Forecast by Country, 2023 & 2033 (%)
Figure 116 Middle East & Africa Biofuel Industry Market by Type, 2023-2033 (US$ Bn, AGR (%))
Figure 117 Middle East & Africa Biofuel Industry Market Share Forecast by Type, 2023 & 2033 (%)
Figure 118 Middle East & Africa Biofuel Industry Market by End-Use, 2023-2033 (US$ Bn, AGR (%))
Figure 119 Global Biofuel Industry Market Share Forecast by End-Use, 2023-2033 (%)
Figure 120 Middle East & Africa Biofuel Industry Market by Generation, 2023-2033 (US$ Bn, AGR (%))
Figure 121 Global Biofuel Industry Market Share Forecast by Generation, 2023-2033 (%)
Figure 122 Middle East & Africa Biofuel Industry Market by Source, 2023-2033 (US$ Bn, AGR (%))
Figure 123 Global Biofuel Industry Market Share Forecast by Source, 2023-2033 (%)
Figure 124 GCC Biofuel Industry Market by Value, 2023-2033 (US$ Bn, AGR (%))
Figure 125 South Africa Biofuel Industry Market by Value, 2023-2033 (US$ Bn, AGR (%))
Figure 126 Rest of Middle East & Africa Biofuel Industry Market by Value, 2023-2033 (US$ Bn, AGR (%))
Figure 127 Latin America Biofuel Industry Market Attractiveness Index
Figure 128 Latin America Biofuel Industry Market by Country, 2023-2033 (US$ Bn, AGR (%))
Figure 129 Latin America Biofuel Industry Market Share Forecast by Country, 2023 & 2033 (%)
Figure 130 Latin America Biofuel Industry Market by Type, 2023-2033 (US$ Bn, AGR (%))
Figure 131 Latin America Biofuel Industry Market Share Forecast by Type, 2023 & 2033 (%)
Figure 132 Latin America Biofuel Industry Market by End-Use, 2023-2033 (US$ Bn, AGR (%))
Figure 133 Global Biofuel Industry Market Share Forecast by End-Use, 2023-2033 (%)
Figure 134 Latin America Biofuel Industry Market by Generation, 2023-2033 (US$ Bn, AGR (%))
Figure 135 Global Biofuel Industry Market Share Forecast by Generation, 2023-2033 (%)
Figure 136 Latin America Biofuel Industry Market by Source, 2023-2033 (US$ Bn, AGR (%))
Figure 137 Global Biofuel Industry Market Share Forecast by Source, 2023-2033 (%)
Figure 138 Brazil Biofuel Industry Market by Value, 2023-2033 (US$ Bn, AGR (%))
Figure 139 Argentina Biofuel Industry Market by Value, 2023-2033 (US$ Bn, AGR (%))
Figure 140 Rest of Latin America Biofuel Industry Market by Value, 2023-2033 (US$ Bn, AGR (%))
Figure 141 Green Plains: Net Revenue, 2018-2022 (US$ million, AGR%)
Figure 142 Green Plains: Business Segment Market Shares, 2022
Figure 143 Petróleo Brasileiro S.A. — Petrobras: Net Revenue, 2017-2021 (US$ million, AGR%)
Figure 144 Petróleo Brasileiro S.A. — Petrobras: R&D, 2017-2021 (US$ million, AGR%)
Figure 145 Petróleo Brasileiro S.A. — Petrobras: Business Segment Market Shares, 2021
Figure 146 Valero Marketing and Supply Company: Net Revenue, 2018-2022 (US$ million, AGR%)
Figure 147 Valero Marketing and Supply Company: Regional Market Shares, 2022
Figure 148 Valero Marketing and Supply Company: Business Segment Market Shares, 2022
Figure 149 Pacific Ethanol, Inc.: Net Revenue, 2017-2021 (US$ million, AGR%)
Figure 150 Pacific Ethanol, Inc.: Business Segment Market Shares, 2021
Figure 151 Gevo, Inc.: Net Revenue, 2017-2021 (US$ million, AGR%)
Figure 152 Gevo, Inc.: R&D 2017-2021 (US$ million, AGR%)
Figure 153 Gevo, Inc.: Regional Market Shares, 2022
Figure 154 Gevo, Inc.: Business Segment Market Shares, 2022
Figure 155 Wilmar International Limited: Net Revenue, 2017-2021 (US$ million, AGR%)
Figure 156 Wilmar International Limited: Regional Market Shares, 2021
Figure 157 Wilmar International Limited: Business Segment Market Shares, 2021
Figure 158 Renewable Energy Group, Inc.: Net Revenue, 2017-2021 (US$ million, AGR%)
Figure 159 Renewable Energy Group, Inc.: Regional Market Shares, 2021
Figure 160 Renewable Energy Group, Inc.: Business Segment Market Shares, 2021
Figure 161 Bunge Limited: Net Revenue, 2017-2021 (US$ million, AGR%)
Figure 162 Bunge Limited: R&D, 2017-2021 (US$ million, AGR%)
Figure 163 Bunge Limited: Regional Market Shares, 2021
Figure 164 Bunge Limited: Business Segment Market Shares, 2021
Figure 165 Royal Dutch Shell PLC: Net Revenue, 2017-2021 (US$ million, AGR%)
Figure 166 Royal Dutch Shell PLC: R&D, 2017-2021 (US$ million, AGR%)
Figure 167 Royal Dutch Shell PLC: Regional Market Shares, 2021
Figure 168 Royal Dutch Shell PLC: Business Segment Market Shares, 2021
Figure 169 CropEnergies AG: Net Revenue, 2017-2021 (US$ million, AGR%)
Figure 170 CropEnergies AG: R&D, 2017-2021 (US$ million, AGR%)
Figure 171 CropEnergies AG: Business Segment Market Shares, 2021
Figure 172 Air Liquide: Net Revenue, 2018-2022 (US$ million, AGR%)
Figure 173 Air Liquide: R&D, 2018-2022 (US$ million, AGR%)
Figure 174 Air Liquide: Regional Market Shares, 2022
Figure 175 Air Liquide: Business Segment Market Shares, 2022
Figure 176 Cosan S. A.: Net Revenue, 2018-2022 (US$ million, AGR%)
Figure 177 Cosan S. A.: Business Segment Market Shares, 2021
Figure 178 FutureFuel Corporation: Net Revenue, 2018-2022 (US$ million, AGR%)
Figure 179 FutureFuel Corporation: R&D, 2017-2021 (US$ million, AGR%)
Figure 180 FutureFuel Corporation: Regional Market Shares, 2021
Figure 181 FutureFuel Corporation: Business Segment Market Shares, 2021
ページTOPに戻る
Visiongain社のエネルギー・再生可能エネルギー分野での最新刊レポート
本レポートと同じKEY WORD(biofuel)の最新刊レポート
よくあるご質問
Visiongain社はどのような調査会社ですか?
英国の調査会社ヴィジョンゲイン社(Visiongain)は、通信とエネルギーのほか、自動車や化学・医薬品、金属など、広範な市場を対象に調査を行っています。自動車市場については、市場全般に関する調査のほ... もっと見る
調査レポートの納品までの日数はどの程度ですか?
在庫のあるものは速納となりますが、平均的には 3-4日と見て下さい。
但し、一部の調査レポートでは、発注を受けた段階で内容更新をして納品をする場合もあります。
発注をする前のお問合せをお願いします。
注文の手続きはどのようになっていますか?
1)お客様からの御問い合わせをいただきます。
2)見積書やサンプルの提示をいたします。
3)お客様指定、もしくは弊社の発注書をメール添付にて発送してください。
4)データリソース社からレポート発行元の調査会社へ納品手配します。
5) 調査会社からお客様へ納品されます。最近は、pdfにてのメール納品が大半です。
お支払方法の方法はどのようになっていますか?
納品と同時にデータリソース社よりお客様へ請求書(必要に応じて納品書も)を発送いたします。
お客様よりデータリソース社へ(通常は円払い)の御振り込みをお願いします。
請求書は、納品日の日付で発行しますので、翌月最終営業日までの当社指定口座への振込みをお願いします。振込み手数料は御社負担にてお願いします。
お客様の御支払い条件が60日以上の場合は御相談ください。
尚、初めてのお取引先や個人の場合、前払いをお願いすることもあります。ご了承のほど、お願いします。
データリソース社はどのような会社ですか?
当社は、世界各国の主要調査会社・レポート出版社と提携し、世界各国の市場調査レポートや技術動向レポートなどを日本国内の企業・公官庁及び教育研究機関に提供しております。
世界各国の「市場・技術・法規制などの」実情を調査・収集される時には、データリソース社にご相談ください。
お客様の御要望にあったデータや情報を抽出する為のレポート紹介や調査のアドバイスも致します。
|
|

