水素燃料電池市場レポート:2024-2034
Hydrogen Fuel Cell Market Report 2024-2034
レポート詳細
水素燃料電池市場レポート 2024-2034 :本レポートは、業界とその基礎となるダイナミクスをより良く理解したい場合、新たな収益ポケットを目指す大手企業にとって貴重なものとなるでし... もっと見る
※上記価格は部署ライセンス(Departmental licence)価格です。
その他の価格についてはデータリソースまでお問合せください。
日本語のページは自動翻訳を利用し作成しています。
実際のレポートは英文のみでご納品いたします。

|

|
サマリー
レポート詳細
水素燃料電池市場レポート 2024-2034:本レポートは、業界とその基礎となるダイナミクスをより良く理解したい場合、新たな収益ポケットを目指す大手企業にとって貴重なものとなるでしょう。異業種への進出や新規地域での既存事業の拡大を目指す企業にも有用です。
さまざまな分野でクリーンで持続可能なエネルギー・ソリューションへの需要が高まる
水素燃料電池の世界市場は、様々な分野におけるクリーンで持続可能なエネルギー・ソリューションに対する需要の増加を背景に、大幅な成長を遂げている。水素燃料電池は、従来の化石燃料に代わる有望な選択肢であり、定置用および輸送用アプリケーションに効率的で環境に優しい発電を提供する。このエグゼクティブサマリーは、業界を形成する主要な推進要因、機会、課題、競争力学に焦点を当て、市場展望の概要を提供します。
水素燃料電池市場の成長を後押ししている要因はいくつかある。第一に、環境への関心の高まりと、二酸化炭素排出量の削減を目的とした厳しい規制が、クリーンエネルギー技術の採用を促進している。水素燃料電池は、そのゼロエミッション特性と汎用性により、こうした課題に対処するための実行可能なソリューションとして支持を集めている。さらに、効率、耐久性、費用対効果の改善といった燃料電池技術の進歩が、さまざまなエンドユーザー産業で市場の可能性を広げている。さらに、水素インフラ整備に対する政府の取り組みや投資が、民間セクターの関与の増加と相まって、市場の成長をさらに促進している。
水素自動車よりもバッテリー電気自動車への高い選好が市場成長を抑制
水素自動車にとって重要な市場抑制要因のひとつは、水素自動車よりもバッテリー電気自動車(BEV)の方が選好度が高いことである。近年、BEVはいくつかの要因から自動車市場で大きな支持を得ている。第一に、BEVはバッテリー技術の著しい進歩を目の当たりにし、エネルギー密度の向上、走行距離の延長、充電時間の短縮につながった。これにより、電気自動車に関する主な懸念事項である航続距離の短さと充電時間の長さが緩和された。第二に、充電ステーションやネットワークといったBEVのためのインフラが、特に脱炭素化の野心的な目標を掲げている地域では急速に拡大している。政府や民間団体は、充電インフラの整備に多額の投資を行っており、消費者にとってBEVがより身近で便利なものとなっている。その結果、消費者は、異なる燃料補給インフラを必要とする水素自動車と比較して、BEV をより実用的で容易に入手可能な選択肢として認識している可能性がある。
市場調査レポートを購入する前にすべき質問とは?
-
水素燃料電池市場はどのように進化しているのか?
-
水素燃料電池市場を牽引しているもの、抑制しているものは何か?
-
水素燃料電池の各サブマーケットは予測期間中にどのように成長し、2034年にはどれくらいの売上を占めるようになるのか?
-
2024年から2034年にかけて、水素燃料電池の各サブマーケットの市場シェアはどのように推移するのか?
-
2024年から2034年にかけて、市場全体を牽引する主な要因は何か?
-
主要な水素燃料電池市場は、マクロ経済の動きに大枠で追随するのか、それとも個々の国の市場が他を凌駕するのか。
-
2034年までに各国市場のシェアはどのように変化し、どの地域が2034年の市場をリードするのか。
-
主要プレーヤーと予測期間中の見通しは?
-
これらの大手企業の水素燃料電池プロジェクトとは?
-
2024年から2034年の間に、業界はどのように進化するのか?現在、そして今後10年間に行われる水素燃料電池プロジェクトにはどのような意味があるのか?
-
水素燃料電池市場をさらに拡大するためには、製品の商業化がより必要なのでしょうか?
-
水素燃料電池市場はどこに向かっているのか、そしてどのようにすれば市場の最前線に立てるのか?
-
新商品や新サービスに最適な投資方法とは?
-
企業を新たな成長軌道に乗せ、C-suiteに移行させるための重要な展望とは?
このことが、現在、そして今後10年間の水素燃料電池市場にどのような影響を与えるかを見極める必要がある:
-
394ページに及ぶレポートには、115の表と184の図表が掲載されている。
-
本レポートでは、業界における主要な有利分野を取り上げているため、今すぐターゲットを絞ることができる。
-
世界、地域、国の売上高と成長に関する詳細な分析が含まれている。
-
競合他社が成功した主なトレンド、変化、収益予測をハイライトします。
本レポートは、水素燃料電池市場が今後10年間にどのように発展していくのか、またCOVID-19の景気後退と好転の変動に合わせてどのように発展していくのかをTODAYでお伝えする。この市場は、過去10年間のどの時点よりも今が重要である。
2034年までの予測やその他の分析から、商業的な展望が明らかになる
-
2034年までの収益予測に加え、最近の実績、成長率、市場シェアも提供している。
-
ビジネスの展望や展開など、独自の分析が掲載されている。
-
質的分析(市場ダイナミクス、促進要因、機会、阻害要因、課題を含む)、コスト構造、水素燃料電池価格上昇の影響、最近の動向をご覧いただけます。
本レポートには、COVID-19が業界と貴社にどのような影響を与えるかについてのデータ分析と貴重な洞察が含まれている。本レポートでは、COVID-19の4つの回収パターンとその影響、すなわち「V」、「L」、「W」、「U」について論じている。
レポート対象セグメント
用途別市場セグメント
タイプ別市場セグメント
-
固体高分子形燃料電池
-
固体高分子形燃料電池(PEMFC)
-
固体酸化物燃料電池
-
溶融炭酸塩燃料電池
-
その他のタイプ
エンドユーザー別市場セグメント
-
商業・工業
-
運輸業界
-
データセンター
-
軍事・防衛
-
公共事業&政府
-
その他のエンドユーザー
世界市場全体とセグメント別の収益予測に加え、4つの地域と20の主要国市場の収益予測も掲載しています:
北米
欧州
-
ドイツ
-
英国
-
フランス
-
ノルウェー
-
デンマーク
-
その他の欧州
アジア太平洋
-
中国
-
日本
-
インド
-
オーストラリア
-
韓国
-
その他のアジア太平洋
ラテンアメリカ
中東・アフリカ
このレポートには、2024年から2034年までの水素燃料電池市場における主要企業の概要も含まれており、これらの企業の事業のこのセグメントに重点を置いています。
報告書に掲載されている主要企業
-
Air Liquide S.A.
-
Aisin Corporation
-
Ballard Power Systems Inc.
-
Bloom Energy
-
Cummins Inc.
-
Fuel Cell Energy, Inc.
-
Hyundai Motor Company
-
ITM Power plc
-
Mitsubishi Heavy Industries, Ltd
-
Nel ASA
-
Nikola Corporation
-
Panasonic Holdings Corporation
-
Plug Power Inc.
-
Toshiba Energy Systems & Solutions Corporation
-
Toyota Motor Corporation
2024年から2034年までの水素燃料電池市場全体の世界売上高(金額ベース)は、2024年に23億3,850万米ドルを突破する。2034年まで力強い収益成長を予測している。当研究所では、最大の可能性を秘めた組織を特定しています。彼らの能力、進歩、商業的展望を発見し、一歩先を行くお手伝いをします。
2024年から2034年までの水素燃料電池市場」レポートはどのようにお役に立ちますか?
要約すると、390ページを超えるこのレポートは、以下の知識を提供する:
-
水素燃料電池市場、2024年から2034年までの収益予測 用途、タイプ、エンドユーザー別に世界と地域レベルで予測 - 業界の将来性を発見し、投資と収益に最も有利な場所を見つけることができます。
-
4つの地域と20の主要国市場の2034年までの収益予測 - 北米、欧州、アジア太平洋、中南米、中東・アフリカの水素燃料電池市場の2024年から2034年までの予測をご覧ください。また、米国、カナダ、ブラジル、ドイツ、フランス、英国、ノルウェー、デンマーク、中国、インド、日本、オーストラリアなどの主要経済圏の市場も予測しています。
-
2024年から2034年までの水素燃料電池市場に関わる主要企業15社の企業プロファイルを含む。
独自の予測による定量的・定性的分析をご覧ください。私たちのレポートだけに含まれる情報を入手し、貴重なビジネスインテリジェンスで情報を得ることができます。
他にはない情報
私たちの新しいレポートがあれば、知識に遅れをとったり、チャンスを逃したりする可能性が低くなります。弊社のレポートが貴社の調査、分析、意思決定にどのように役立つかをご覧ください。Visiongainの調査は、水素燃料電池市場、2024年から2034年、市場をリードする企業の商業分析を必要とするすべての人のためのものです。データ、トレンド、予測をご覧いただけます。
ページTOPに戻る
目次
1 レポート概要
1.1 研究の目的
1.2 水素燃料電池市場の紹介
1.3 本レポートの特徴
1.4 本レポートを読むべき理由
1.5 本分析レポートが回答する主な質問
1.6 本レポートは誰のためのものか?
1.7 方法論
1.7.1 市場の定義
1.7.2 市場評価・予測手法
1.7.3 データの検証
1.7.3.1 一次調査
1.7.3.2 セカンダリーリサーチ
1.8 よくある質問(FAQ)
1.9 Visiongainの関連レポート
1.10 Visiongainについて
2 エグゼクティブ・サマリー
3 市場概要
3.1 主要な調査結果
3.2 市場ダイナミクス
3.2.1 市場促進要因
3.2.1.1 水素燃料電池自動車(FCV)の需要増加
3.2.1.2 水素燃料電池自動車への投資増加が市場成長を牽引
3.2.1.3 温室効果ガス排出削減への世界的な取り組みが市場成長を牽引
3.2.2 市場抑制要因
3.2.2.1 水素自動車よりもバッテリー電気自動車への高い選好が市場成長を抑制
3.2.2.2 燃料電池用白金触媒の高コストが市場成長の阻害要因
3.2.2.3 低炭素燃料による分散型発電の増加
3.2.3 市場機会
3.2.3.1 国際レベルでの市場拡大が市場プレーヤーのビジネスチャンスとなる
3.2.3.2 政府の取り組みと政策 市場成長の機会
3.2.3.3 市場プレイヤー間の協力とパートナーシップ
3.3 ポーターのファイブフォース分析
3.3.1 サプライヤーの交渉力(中〜高)
3.3.2 買い手の交渉力(低)
3.3.3 競争力(低)
3.3.4 代替品による脅威(高)
3.3.5 新規参入の脅威(低)
3.4 COVID-19の影響分析
3.4.1 "V字型回復"
3.4.2 "U字型回復"
3.4.3 "W字型回復"
3.4.4 "L字型回復"
3.5 PEST分析
4 水素燃料電池市場分析:用途別
4.1 主要な調査結果
4.2 用途別セグメント 市場魅力度指数
4.3 用途別水素燃料電池市場規模の推定と予測
4.4 定置用発電
4.4.1 2024〜2034年の地域別市場規模(US$ Million)
4.4.2 地域別市場シェア、2024年・2034年(%)
4.5 輸送
4.5.1 2024年~2034年の地域別市場規模(US$ Million)
4.5.2 地域別市場シェア、2024年・2034年(%)
4.6 携帯機器
4.6.1 2024〜2034年の地域別市場規模(US$ Million)
4.6.2 地域別市場シェア、2024年・2034年(%)
4.7 その他
4.7.1 2024-2034年地域別市場規模(US$ Million)
4.7.2 地域別市場シェア、2024年・2034年(%)
5 水素燃料電池市場分析:タイプ別
5.1 主要な調査結果
5.2 タイプ別セグメント 市場魅力度指数
5.3 水素燃料電池のタイプ別市場規模推定と予測
5.4 プロトン交換膜型燃料電池
5.4.1 2024〜2034年の地域別市場規模(US$ Million)
5.4.2 地域別市場シェア、2024年・2034年(%)
5.5 高分子電解質膜燃料電池(PEMFC)
5.5.1 2024~2034年の地域別市場規模(US$ Million)
5.5.2 地域別市場シェア、2024年・2034年(%)
5.6 固体酸化物燃料電池
5.6.1 2024~2034年の地域別市場規模(US$ Million)
5.6.2 地域別市場シェア、2024年・2034年(%)
5.7 溶融炭酸塩燃料電池
5.7.1 2024~2034年の地域別市場規模(US$ Million)
5.7.2 地域別市場シェア、2024年・2034年(%)
5.8 その他のタイプ
5.8.1 2024年~2034年の地域別市場規模(US$ Million)
5.8.2 地域別市場シェア、2024年・2034年 (%)
6 水素燃料電池市場分析:エンドユーザー別
6.1 主要調査結果
6.2 エンドユーザー・セグメント 市場魅力度指数
6.3 エンドユーザー別水素燃料電池市場規模の推定と予測
6.4 商業・産業
6.4.1 2024〜2034年の地域別市場規模(US$ Million)
6.4.2 地域別市場シェア、2024年・2034年(%)
6.5 輸送産業
6.5.1 2024〜2034年の地域別市場規模(US$ Million)
6.5.2 地域別市場シェア、2024年・2034年(%)
6.6 データセンター
6.6.1 2024年~2034年の地域別市場規模(US$ Million)
6.6.2 地域別市場シェア、2024年・2034年(%)
6.7 軍事・防衛
6.7.1 2024〜2034年の地域別市場規模(US$ Million)
6.7.2 地域別市場シェア、2024年・2034年(%)
6.8 公共事業と政府
6.8.1 2024〜2034年の地域別市場規模(US$ Million)
6.8.2 地域別市場シェア、2024年・2034年(%)
6.9 その他のエンドユーザー
6.9.1 2024〜2034年の地域別市場規模(US$ Million)
6.9.2 地域別市場シェア、2024年・2034年(%)
7 水素燃料電池市場分析:地域別
7.1 主要な調査結果
7.2 地域別市場規模の推定と予測
8 北米の水素燃料電池市場分析
8.1 主要な調査結果
8.2 北米の水素燃料電池市場魅力度指数
8.3 北米の水素燃料電池国別市場、2024年、2029年、2034年(US$ Million)
8.4 北米の水素燃料電池市場規模推定と予測
8.5 北米の水素燃料電池市場規模推定と予測:国別
8.6 北米の水素燃料電池市場規模推定と予測:用途別
8.7 北米の水素燃料電池市場規模推定と予測:タイプ別
8.8 北米の水素燃料電池市場規模推定と予測:エンドユーザー別
8.9 米国の水素燃料電池市場分析
8.10 カナダの水素燃料電池市場分析
9 欧州の水素燃料電池市場分析
9.1 主要な調査結果
9.2 欧州水素燃料電池市場魅力度指数
9.3 欧州の水素燃料電池国別市場、2024年、2029年、2034年(US$ Million)
9.4 欧州の水素燃料電池市場規模推定と予測
9.5 欧州の水素燃料電池市場規模推定と予測:国別
9.6 欧州の水素燃料電池市場規模推定と予測:用途別
9.7 欧州の水素燃料電池市場規模推定と予測:タイプ別
9.8 欧州の水素燃料電池市場規模推定と予測:エンドユーザー別
9.9 ドイツの水素燃料電池市場分析
9.10 イギリスの水素燃料電池市場分析
9.11 フランスの水素燃料電池市場分析
9.12 ノルウェーの水素燃料電池市場分析
9.13 デンマークの水素燃料電池市場分析
9.14 その他の欧州の水素燃料電池市場分析
10 アジア太平洋地域の水素燃料電池市場分析
10.1 主要な調査結果
10.2 アジア太平洋地域の水素燃料電池市場魅力度指数
10.3 アジア太平洋地域の水素燃料電池国別市場、2024年、2029年、2034年(US$ Million)
10.4 アジア太平洋地域の水素燃料電池市場規模の推定と予測
10.5 アジア太平洋地域の水素燃料電池市場規模推定と予測:国別
10.6 アジア太平洋地域の水素燃料電池市場規模推定と予測:用途別
10.7 アジア太平洋地域の水素燃料電池市場規模推定と予測:タイプ別
10.8 アジア太平洋地域の水素燃料電池市場規模推定と予測:エンドユーザー別
10.9 中国の水素燃料電池市場分析
10.10 インドの水素燃料電池市場分析
10.11 日本の水素燃料電池市場分析
10.12 韓国の水素燃料電池市場分析
10.13 オーストラリアの水素燃料電池市場分析
10.14 その他のアジア太平洋地域の水素燃料電池市場分析
11 中東・アフリカの水素燃料電池市場分析
11.1 主要な調査結果
11.2 中東・アフリカの水素燃料電池市場魅力度指数
11.3 中東・アフリカの水素燃料電池国別市場、2024年、2029年、2034年(US$ Million)
11.4 中東・アフリカの水素燃料電池市場規模推定と予測
11.5 中東・アフリカの水素燃料電池市場規模推定と予測:国別
11.6 中東・アフリカの水素燃料電池市場規模推定と予測:用途別
11.7 中東・アフリカの水素燃料電池市場規模推定と予測:タイプ別
11.8 中東・アフリカの水素燃料電池市場規模推定と予測:エンドユーザー別
11.9 GCCの水素燃料電池市場分析
11.10 南アフリカの水素燃料電池市場分析
11.11 その他の中東・アフリカ地域の水素燃料電池市場分析
12 ラテンアメリカの水素燃料電池市場分析
12.1 主要な調査結果
12.2 ラテンアメリカの水素燃料電池市場魅力度指数
12.3 ラテンアメリカの水素燃料電池国別市場、2024年、2029年、2034年(US$ Million)
12.4 ラテンアメリカの水素燃料電池市場規模推定と予測
12.5 ラテンアメリカの水素燃料電池市場規模推定と予測:国別
12.6 ラテンアメリカの水素燃料電池市場規模推定と予測:用途別
12.7 ラテンアメリカの水素燃料電池市場規模推定と予測:タイプ別
12.8 ラテンアメリカの水素燃料電池市場規模推定と予測:エンドユーザー別
12.9 ブラジルの水素燃料電池市場分析
12.10 メキシコの水素燃料電池市場分析
12.11 その他のラテンアメリカの水素燃料電池市場分析
13 企業プロフィール
13.1 競争環境、2023年
13.2 戦略的展望
13.3 Ballard Power Systems Inc
13.3.1 会社概要
13.3.2 会社概要
13.3.3 財務分析
13.3.3.1 純収入、2019-2023年
13.3.3.2 R&D、2019-2023年
13.3.3.3 地域別売上高シェア(2023年)
13.3.4 製品ベンチマーク
13.3.5 戦略的展望
13.4 Toyota Motor Corporation
13.4.1 会社概要
13.4.2 会社概要
13.4.3 財務分析
13.4.3.1 純収入、2019-2023年
13.4.3.2 R&D、2019-2023年
13.4.3.3 地域別収益シェア、2023年(%)
13.4.3.4 事業セグメント収益シェア、2023年(%)
13.4.4 製品ベンチマーク
13.4.5 戦略的展望
13.5 Plug Power Inc.
13.5.1 会社概要
13.5.2 会社概要
13.5.3 財務分析
13.5.3.1 純収入、2019-2023年
13.5.3.2 R&D、2019-2023年
13.5.3.3 地域別収益シェア、2023年(%)
13.5.4 製品ベンチマーク
13.5.5 戦略的展望
13.6 Air Liquide S.A.
13.6.1 会社概要
13.6.2 会社概要
13.6.3 財務分析
13.6.3.1 純収入、2019-2023年
13.6.3.2 R&D、2019年〜2023年
13.6.3.3 地域別収益シェア、2023年(%)
13.6.3.4 事業セグメント収益シェア、2023年(%)
13.6.4 製品ベンチマーク
13.6.5 戦略的展望
13.7 Nikola Corporation
13.7.1 会社概要
13.7.2 会社概要
13.7.3 財務分析
13.7.3.1 純収入、2019-2023年
13.7.3.2 R&D、2019-2023年
13.7.4 製品ベンチマーク
13.7.5 戦略的展望
13.8 Hyundai Motor Company
13.8.1 会社概要
13.8.2 会社概要
13.8.3 財務分析
13.8.3.1 純収入、2019-2023年
13.8.3.2 R&D、2019-2023年
13.8.3.3 地域別収益シェア、2023年(%)
13.8.3.4 事業セグメント収益シェア、2023年(%)
13.8.4 製品ベンチマーク
13.8.5 戦略的展望
13.9 Mitsubishi Heavy Industries, Ltd
13.9.1 会社概要
13.9.2 会社概要
13.9.3 財務分析
13.9.3.1 純収入(2019-2023年
13.9.3.2 R&D、2019年~2023年
13.9.3.3 地域別収益シェア、2023年(%)
13.9.3.4 事業セグメント収益シェア、2023年(%)
13.9.4 製品ベンチマーク
13.10 Nel ASA
13.10.1 会社概要
13.10.2 会社概要
13.10.3 財務分析
13.10.3.1 純収入、2019-2023年
13.10.3.2 R&D、2019-2023年
13.10.3.3 地域別収益シェア、2023年(%)
13.10.3.4 事業セグメント収益シェア、2023年(%)
13.10.4 製品ベンチマーク
13.10.5 戦略的展望
13.11 Cummins Inc.
13.11.1 会社概要
13.11.2 会社概要
13.11.3 財務分析
13.11.3.1 純収入、2019-2023年
13.11.3.2 売上高、2019-2023年
13.11.4 製品ベンチマーク
13.11.5 戦略的展望
13.12 Toshiba Energy Systems & Solutions Corporation
13.12.1 会社概要
13.12.2 会社概要
13.12.3 財務分析
13.12.3.1 純収入(2019-2023年
13.12.3.2 売上高、2019年~2023年
13.12.3.3 地域別収益シェア、2023年(%)
13.12.3.4 事業セグメント収益シェア、2023年(%)
13.12.4 製品ベンチマーク
13.12.5 戦略的展望
13.13 Aisin Corporation
13.13.1 会社概要
13.13.2 会社概要
13.13.3 財務分析
13.13.3.1 純収入(2019-2023年
13.13.3.2 売上高、2019-2023年
13.13.4 製品ベンチマーク
13.13.5 戦略的展望
13.14 ITM Power plc
13.14.1 会社概要
13.14.2 会社概要
13.14.3 財務分析
13.14.3.1 純収入、2019-2023年
13.14.3.2 R&D、2019-2023年
13.14.3.3 地域別売上高シェア(2023年)
13.14.3.4 事業セグメント収益シェア、2023年(%)
13.14.4 製品ベンチマーク
13.14.5 戦略的展望
13.15 Panasonic Holdings Corporation
13.15.1 会社概要
13.15.2 会社概要
13.15.3 財務分析
13.15.3.1 純収入(2019-2023年
13.15.3.2 売上高、2019-2023年
13.15.3.3 地域別収益シェア、2023年(%)
13.15.3.4 事業セグメント収益シェア、2023年(%)
13.15.4 製品ベンチマーク
13.15.5 戦略的展望
13.16 Bloom Energy
13.16.1 会社概要
13.16.2 会社概要
13.16.3 財務分析
13.16.3.1 純収入(2019-2023年
13.16.3.2 R&D、2019-2023年
13.16.3.3 事業セグメント収益シェア、2023年(%)
13.16.4 製品ベンチマーク
13.16.5 戦略的展望
13.17 Fuel Cell Energy, Inc.
13.17.1 会社概要
13.17.2 会社概要
13.17.3 財務分析
13.17.3.1 純収入(2019-2023年
13.17.3.2 R&D、2019-2023年
13.17.3.3 地域別売上高シェア(2023年)
13.17.4 製品ベンチマーク
13.17.5 戦略的展望
14 結論と提言
14.1 Visiongainからの結びの言葉
14.2 市場プレイヤーへの提言
ページTOPに戻る
図表リスト テーブル一覧
表1 水素燃料電池市場のスナップショット、2024年~2034年(百万米ドル、CAGR %)
表2 水素燃料電池の世界地域別市場:2024年~2034年(単位:百万米ドル、AGR(%)、CAGR(%))(V字回復シナリオ)
表3 水素燃料電池の世界地域別市場:2024~2034年(単位:百万米ドル、AGR(%)、CAGR(%))(U字回復シナリオ)
表4 水素燃料電池の世界地域別市場:2024~2034年(単位:百万米ドル、AGR(%)、CAGR(%))(W字型回復シナリオ)
表5 水素燃料電池の世界地域別市場:2024~2034年(単位:百万米ドル、AGR(%)、CAGR(%))(L字型回復シナリオ)
表6 水素燃料電池の世界市場:用途別(2024-2034年、100万米ドル、AGR (%)、CAGR (%)
表7 定置用発電の地域別市場:2024年~2034年(単位:百万米ドル、AGR (%)、CAGR (%)
表8 輸送機器市場の地域別市場規模:2024-2034年(100万米ドル、AGR (%)、CAGR (%)
表9 携帯機器市場:地域別、2024-2034年(100万米ドル、AGR (%)、CAGR (%)
表10 その他のアプリケーション地域別市場:2024-2034年(単位:百万米ドル、AGR (%)、CAGR (%)
表11 その他の用途の地域別市場、2024-2034年(単位:百万米ドル、AGR (%)、CAGR (%)
表12 水素燃料電池の世界市場:タイプ別、2024-2034年(100万米ドル、AGR (%)、CAGR (%)
表13 プロトン交換膜燃料電池の地域別市場、2024-2034年(100万米ドル、AGR (%)、CAGR (%)
表14 高分子電解質膜燃料電池(PEMFC)地域別市場:2024-2034年(単位:米ドル、AGR (%)、CAGR (%)
表15 固体酸化物燃料電池の地域別市場:2024-2034年(100万米ドル、AGR (%)、CAGR (%)
表16 溶融炭酸塩型燃料電池の地域別市場:2024-2034年(100万米ドル、AGR (%)、CAGR (%)
表17 その他型燃料電池の地域別市場:2024-2034年(100万米ドル、AGR (%)、CAGR (%)
表18 水素燃料電池の世界市場:エンドユーザー別、2024-2034年(100万米ドル、AGR (%)、CAGR (%)
表19 業務用・産業用地域別市場:2024-2034年(単位:百万米ドル、AGR (%)、CAGR (%)
表20 輸送産業の地域別市場:2024-2034年(100万米ドル、AGR (%)、CAGR (%)
表21 データセンター市場:地域別、2024-2034年(100万米ドル、AGR (%)、CAGR (%)
表22 軍事・防衛市場の地域別市場規模(単位:百万米ドル、AGR (%)、CAGR (%)
表23 公共事業・官公庁市場:地域別、2024-2034年 (US$ Mn, AGR (%), CAGR (%))
表24 その他のエンドユーザー市場:地域別、2024-2034年(100万米ドル、AGR (%)、CAGR (%)
表25 水素燃料電池の世界地域別市場:2024-2034年(100万米ドル、AGR (%)、CAGR (%)
表26 北米の水素燃料電池市場:金額ベース、2024-2034年(100万米ドル、AGR (%)、CAGR (%)
表27 北米の水素燃料電池国別市場:2024-2034年(単位:百万米ドル、AGR (%)、CAGR (%)
表28 北米の水素燃料電池市場:用途別(2024-2034年:100万米ドル、AGR (%)、CAGR (%)
表29 北米の水素燃料電池市場:タイプ別(2024-2034年:100万米ドル、AGR (%)、CAGR (%)
表30 北米の水素燃料電池市場:エンドユーザー別(2024-2034年:100万米ドル、AGR (%)、CAGR (%)
表31 米国の水素燃料電池市場:金額ベース、2024-2034年 (US$ Mn, AGR (%), CAGR (%))
表32 カナダの水素燃料電池市場:金額 2024-2034 (US$ Mn, AGR (%), CAGR (%))
表33 欧州の水素燃料電池市場:金額ベース、2024-2034年(100万米ドル、AGR (%)、CAGR (%)
表34 欧州の水素燃料電池市場:国別、2024-2034年(100万米ドル、AGR (%)、CAGR (%)
表35 欧州の水素燃料電池市場:用途別(2024-2034年:100万米ドル、AGR (%)、CAGR (%)
表36 欧州の水素燃料電池市場:タイプ別(2024-2034年:100万米ドル、AGR (%)、CAGR (%)
表37 欧州の水素燃料電池市場:エンドユーザー別 2024-2034 (US$ Mn, AGR (%), CAGR (%))
表38 ドイツの水素燃料電池市場:金額ベース、2024-2034年 (US$ Mn, AGR (%), CAGR (%))
表39 イギリスの水素燃料電池市場:金額(US$ Mn、AGR (%)、CAGR (%)
表40 フランスの水素燃料電池市場:金額 2024-2034 (US$ Mn, AGR (%), CAGR (%))
表41 ノルウェーの水素燃料電池市場:金額(US$ Mn、AGR (%)、CAGR (%)
表42 デンマークの水素燃料電池市場:金額(US$ Mn、AGR (%)、CAGR (%)
表43 その他のヨーロッパの水素燃料電池市場:金額 2024-2034 (US$ Mn, AGR (%), CAGR (%))
表44 アジア太平洋地域の水素燃料電池市場:金額 2024-2034 (US$ Mn, AGR (%), CAGR (%))
表45 アジア太平洋地域の水素燃料電池国別市場:2024-2034年(100万米ドル、AGR (%)、CAGR (%)
表46 アジア太平洋地域の水素燃料電池市場:用途別(2024-2034年:100万米ドル、AGR (%)、CAGR (%)
表47 アジア太平洋地域の水素燃料電池市場:タイプ別(2024-2034年、100万米ドル、AGR (%)、CAGR (%)
表48 アジア太平洋地域の水素燃料電池市場:エンドユーザー別(2024-2034年、100万米ドル、AGR (%)、CAGR (%)
表49 中国の水素燃料電池市場:金額ベース、2024-2034年(100万米ドル、AGR (%)、CAGR (%)
表50 インドの水素燃料電池市場:金額ベース、2024-2034年(100万米ドル、AGR (%)、CAGR (%)
表51 日本 水素燃料電池市場:金額 2024-2034 (US$ Mn, AGR (%), CAGR (%))
表 52 韓国の水素燃料電池市場:金額(US$ Mn、AGR (%)、CAGR (%)
表 53 オーストラリアの水素燃料電池市場:金額(US$ Mn、AGR (%)、CAGR (%)
表 54 その他のアジア太平洋地域の水素燃料電池市場:金額(US$ Mn、AGR (%)、CAGR (%)
表 55 中東・アフリカの水素燃料電池市場:金額 2024-2034 (US$ Mn, AGR (%), CAGR (%))
表56 中東・アフリカの水素燃料電池国別市場:2024-2034年 (US$ Mn, AGR (%), CAGR (%))
表57 中東・アフリカの水素燃料電池市場:用途別(2024-2034年:100万米ドル、AGR (%)、CAGR (%)
表58 中東・アフリカ水素燃料電池市場:タイプ別(2024-2034年:100万米ドル、AGR (%)、CAGR (%)
表59 中東・アフリカの水素燃料電池市場:エンドユーザー別(2024-2034年:100万米ドル、AGR (%)、CAGR (%)
表60 GCCの水素燃料電池市場:金額ベース、2024-2034年(100万米ドル、AGR (%)、CAGR (%)
表61 南アフリカの水素燃料電池市場:金額(US$ Mn、AGR (%)、CAGR (%)
表62 中東・アフリカの残りの水素燃料電池市場:金額(US$ Mn、AGR (%)、CAGR (%)
表63 中南米の水素燃料電池市場:金額(US$ Mn、AGR (%)、CAGR (%)
表64 ラテンアメリカの水素燃料電池国別市場:2024-2034年 (US$ Mn, AGR (%), CAGR (%))
表65 ラテンアメリカの水素燃料電池市場:用途別(2024-2034年:100万米ドル、AGR (%)、CAGR (%)
表66 ラテンアメリカの水素燃料電池市場:タイプ別(2024-2034年:100万米ドル、AGR (%)、CAGR (%)
表67 ラテンアメリカの水素燃料電池市場:エンドユーザー別(2024-2034年:100万米ドル、AGR (%)、CAGR (%)
表68 ブラジルの水素燃料電池市場:金額ベース、2024-2034年 (US$ Mn, AGR (%), CAGR (%))
表69 メキシコの水素燃料電池市場:金額(2024-2034年) (US$ Mn, AGR (%), CAGR (%))
表70 その他のラテンアメリカの水素燃料電池市場:金額(US$ Mn, AGR (%), CAGR (%)
表 71 戦略的展望 - 契約
表 72 バラード・パワー・システムズ社主な詳細(CEO, 本社, 売上高, 設立, 従業員数, 企業タイプ, ウェブサイト, 事業セグメント)
表 73 バラード・パワー・システムズ社製品ベンチマーク
表 74 バラード・パワー・システムズ社戦略的展望
表75 トヨタ自動車株式会社主な詳細(CEO, 本社, 売上高, 設立, 従業員数, 企業タイプ, ウェブサイト, 事業セグメント)
表 76 トヨタ自動車株式会社製品ベンチマーク
表77 トヨタ自動車:戦略的展望戦略的展望
表78 プラグパワー社主な詳細(CEO, 本社, 売上高, 設立, 従業員数, 企業タイプ, ウェブサイト, 事業セグメント)
表 79 プラグパワー社製品ベンチマーク
表 80 プラグパワー社戦略的展望
表81 Air Liquide S.A.:主要詳細(CEO, 本社, 売上高, 設立, 従業員数, 企業タイプ, ウェブサイト, 事業セグメント)
表82 Air Liquide S.A.: 製品ベンチマーク
表83 Air Liquide S.A.:戦略的展望
表84 ニコラ・コーポレーション主な詳細(CEO, 本社, 売上高, 設立, 従業員数, 企業タイプ, ウェブサイト, 事業セグメント)
表 85 ニコラ・コーポレーション製品ベンチマーク
表 86 ニコラ・コーポレーション戦略的展望
表87 現代自動車主な詳細(CEO, 本社, 売上高, 設立, 従業員数, 企業タイプ, ウェブサイト, 事業セグメント)
表 88 現代自動車製品ベンチマーク
表 89 現代自動車:戦略的展望戦略的展望
表90 三菱重工業:主要業績(CEO, 本社, 売上高, 設立, 従業員数, 企業タイプ, ウェブサイト, 事業セグメント)
表91 三菱重工業:製品ベンチマーク
表92 ネルASA:主な詳細(CEO, 本社, 売上高, 設立, 従業員数, 企業タイプ, ウェブサイト, 事業セグメント)
表93 ネルASA:製品ベンチマーク
表94 ネルASA:戦略的展望
表95 カミンズInc:主な詳細(CEO, 本社, 売上高, 設立, 従業員数, 企業タイプ, ウェブサイト, 事業セグメント)
表 96 カミンズInc:製品のベンチマーキング
表 97 カミンズInc:戦略的展望
表98 東芝エネルギーシステム&ソリューション株式会社主な詳細(CEO, 本社, 売上高, 設立, 従業員数, 企業タイプ, ウェブサイト, 事業セグメント)
表 99 東芝エネルギーシステム&ソリューション:製品ベンチマーク
表100 東芝エネルギーシステム&ソリューション株式会社戦略的展望
表 101 アイシン株式会社主な詳細(CEO, 本社, 売上高, 設立, 従業員数, 企業タイプ, ウェブサイト, 事業セグメント)
表 102 アイシン株式会社製品ベンチマーク
表 103 アイシン:戦略的展望
表104 ITM Power plc:主な詳細(CEO, 本社, 売上高, 設立, 従業員数, 企業タイプ, ウェブサイト, 事業セグメント)
表 105 ITM Power plc:製品ベンチマーク
表 106 ITM Power plc:戦略的展望
表 107 パナソニックホールディングス主な詳細(CEO, 本社, 売上高, 設立, 従業員数, 企業タイプ, ウェブサイト, 事業セグメント)
表 108 パナソニックホールディングス株式会社製品ベンチマーク
表 109 パナソニックホールディングス戦略的展望
表110 ブルームエナジー主な詳細(CEO, 本社, 売上高, 設立, 従業員数, 企業タイプ, ウェブサイト, 事業セグメント)
表111 ブルームエナジー製品ベンチマーク
表112 ブルーム・エナジー戦略的展望
表113 燃料電池エネルギー社主な詳細(CEO, 本社, 売上高, 設立, 従業員数, 企業タイプ, ウェブサイト, 事業セグメント)
表 114 フュエルセル・エナジー社:製品ベンチマーク
表115 フュエルセル・エナジー社:戦略的展望戦略的展望
表115 フュエルセル・エナジー社:戦略的展望
図表一覧
図 1 水素燃料電池市場のセグメント化
図2 水素燃料電池の用途別市場:市場魅力度指数
図3 水素燃料電池のタイプ別市場:市場魅力度指数
図4 水素燃料電池市場:エンドユーザー別市場魅力度指数
図5 水素燃料電池市場:地域別市場魅力度指数
図6 水素燃料電池市場市場ダイナミクス
図7 電気自動車販売台数(2019~2023年
図8 水素自動車と電気自動車の比較
図9 水素燃料電池市場ポーターのファイブフォース分析
図10 水素燃料電池の世界市場:COVID別シェア予測(2024~2034年)
図11 水素燃料電池の世界市場(地域別)、2024年~2034年(百万米ドル、AGR (%))(V字回復シナリオ
図12 水素燃料電池の世界地域別市場:2024~2034年(100万米ドル、AGR (%))(U字回復シナリオ)
図13 水素燃料電池の世界地域別市場:2024~2034年(100万米ドル、AGR (%))(W字型回復シナリオ)
図14 水素燃料電池の世界地域別市場:2024~2034年(100万米ドル、AGR (%))(L字型回復シナリオ)
図 15 水素燃料電池市場PEST分析
図16 水素燃料電池の用途別市場市場魅力度指数
図17 水素燃料電池の世界市場(用途別):2024~2034年(百万米ドル、AGR (%)
図18 水素燃料電池の用途別市場シェア予測、2024年、2029年、2034年 (%)
図 19 定置用発電の地域別市場予測(2024~2034年、100万米ドル、AGR (%)
図 20 地域別定置発電市場シェア予測、2024 年& 2034 年 (%)
図21 2024~2034年の地域別輸送機市場予測(単位:百万米ドル、AGR (%)
図22 地域別輸送機器市場シェア予測、2024年~2034年 (%)
図23 地域別携帯機器市場:2024年〜2034年(単位:百万米ドル、AGR (%)
図24 地域別携帯機器市場シェア予測、2024年&2034年(%)
図25 その他のアプリケーション地域別市場:2024年〜2034年 (US$ Mn, AGR (%))
図26 その他のアプリケーションの地域別市場規模予測(単位:百万米ドル、AGR (%)
図 27 その他の地域別市場シェア予測、2024 年~2034 年 (%)
図28 水素燃料電池のタイプ別市場市場魅力度指数
図 29 水素燃料電池のタイプ別世界市場、2024~2034 年 (Mn 米ドル、AGR (%)
図30 水素燃料電池のタイプ別市場シェア予測(2024年、2029年、2034年)
図31 プロトン交換膜燃料電池の地域別市場予測、2024~2034年 (Mn 米ドル、AGR (%)
図 32 陽子交換膜燃料電池の地域別市場シェア予測、2024 年~2034 年 (%)
図 33 高分子電解質膜燃料電池(PEMFC)の地域別市場予測、2024~2034 年(単位:米ドル、AGR (%)
図 34 高分子電解質膜燃料電池(PEMFC)の地域別市場シェア予測、2024 年&2034 年 (%)
図 35 固体酸化物形燃料電池の地域別市場予測、2024~2034 年(単位:百万米ドル、AGR (%)
図 36 固体酸化物燃料電池の地域別市場シェア予測、2024 年~2034 年 (%)
図 37 溶融炭酸塩燃料電池の地域別市場予測、2024~2034 年 (Mn 米ドル、AGR (%)
図 38 溶融炭酸塩型燃料電池の地域別市場シェア予測、2024 年~2034 年 (%)
図39 その他型燃料電池の地域別市場予測、2024~2034年(単位:百万米ドル、AGR (%)
図 40 その他のタイプの地域別市場シェア予測、2024 年~2034 年 (%)
図 41 水素燃料電池のエンドユーザー別市場:市場魅力度指数
図 42 水素燃料電池の世界市場(エンドユーザー別):2024~2034年 (百万米ドル、AGR (%)
図43 水素燃料電池のエンドユーザー別市場シェア予測(2024年、2029年、2034年)
図 44 業務用・産業用市場の地域別予測(2024~2034 年) (US$ Mn, AGR (%))
図 45 地域別商業・産業市場シェア予測、2024 年~2034 年 (%)
図 46 運輸産業の地域別市場予測(2024~2034年、100万米ドル、AGR (%)
図47 輸送産業の地域別市場シェア予測、2024年~2034年(%)
図48 データセンター地域別市場規模予測(単位:百万米ドル、AGR (%)
図49 データセンター市場地域別シェア予測、2024年~2034年(%)
図50 2024~2034年地域別軍事・防衛市場(単位:百万米ドル、AGR (%)
図51 2024年~2034年の地域別軍事・防衛市場シェア予測(%)
図52 2024~2034年地域別公益事業・政府市場予測(単位:百万米ドル、AGR (%)
図 53 2024-2034 地域別公益事業・政府機関市場シェア予測 (%)
図 54 その他のエンドユーザー市場:地域別 2024-2034 (US$ Mn, AGR (%))
図55 その他のエンドユーザー市場地域別シェア予測、2024年&2034年(%)
図56 水素燃料電池の地域別市場予測(2024年、2034年)(売上高、CAGR
図 57 2024年、2029年、2034年の水素燃料電池の地域別市場シェア予測(%)
図 58 水素燃料電池の世界地域別市場予測 2024-2034 (US$ Mn, AGR (%))
図 59 北米の水素燃料電池市場魅力度指数
図 60 北米の水素燃料電池地域別市場(2024 年、2029 年、2034 年)(百万米ドル
図 61 北米の水素燃料電池市場:金額ベース(2024~2034年、100万米ドル、AGR (%)
図 62 北米の水素燃料電池国別市場:2024~2034年(100万米ドル、AGR (%)
図63 北米の水素燃料電池国別市場シェア予測、2024年~2034年 (%)
図 64 北米の水素燃料電池市場:用途別予測(2024~2034年、100万米ドル、AGR (%)
図65 北米の水素燃料電池市場シェア予測:用途別、2024年~2034年 (%)
図 66 北米の水素燃料電池市場:タイプ別(2024~2034年、100万米ドル、AGR (%)
図67 北米の水素燃料電池市場タイプ別シェア予測、2024年&2034年 (%)
図 68 北米の水素燃料電池市場:エンドユーザー別予測(2024~2034年、100万米ドル、AGR (%)
図 69 北米の水素燃料電池市場:エンドユーザー別 2024-2034 年シェア予測 (%)
図 70 米国の水素燃料電池市場:金額ベース(2024~2034 年)(単位:百万米ドル、AGR (%)
図 71 カナダの水素燃料電池市場:金額(US$ Mn、AGR (%)
図 72 欧州の水素燃料電池市場魅力度指数
図 73 欧州の水素燃料電池地域別市場(2024 年、2029 年、2034 年)(百万米ドル
図 74 水素燃料電池の欧州市場:金額ベース(2024~2034年、100万米ドル、AGR (%)
図 75 水素燃料電池の欧州国別市場:2024~2034年(100万米ドル、AGR (%)
図 76 水素燃料電池の欧州国別市場シェア予測、2024~2034 年 (%)
図77 欧州の水素燃料電池市場:用途別予測(2024~2034年、100万米ドル、AGR (%)
図 78 水素燃料電池の欧州市場シェア予測:用途別、2024年~2034年 (%)
図 79 欧州の水素燃料電池市場:タイプ別 (2024-2034) (US$ Mn, AGR (%))
図 80 水素燃料電池の欧州市場タイプ別シェア予測、2024年~2034年 (%)
図 81 欧州の水素燃料電池市場:エンドユーザー別予測(2024~2034年、100万米ドル、AGR (%)
図 82 欧州の水素燃料電池市場:エンドユーザー別 2024-2034 年シェア予測 (%)
図 83 ドイツの水素燃料電池市場規模別予測(2024~2034 年) (US$ Mn, AGR (%))
図 84 イギリスの水素燃料電池市場:金額(US$ Mn、AGR (%)
図 85 フランスの水素燃料電池市場:金額(US$ Mn、AGR (%)
図 86 ノルウェーの水素燃料電池市場:金額(US$ Mn、AGR (%)
図 87 デンマークの水素燃料電池市場:金額(US$ Mn、AGR (%)
図 88 その他の地域の水素燃料電池市場:金額(US$ Mn、AGR (%)
図 89 アジア太平洋地域の水素燃料電池市場魅力度指数
図 90 アジア太平洋地域の水素燃料電池地域別市場(2024 年、2029 年、2034 年)(百万米ドル
図 91 アジア太平洋地域の水素燃料電池市場:金額ベース(2024~2034年、100万米ドル、AGR (%)
図 92 アジア太平洋地域の水素燃料電池国別市場、2024~2034年(100万米ドル、AGR (%)
図93 アジア太平洋地域の水素燃料電池の国別市場シェア予測、2024年~2034年 (%)
図94 アジア太平洋地域の水素燃料電池市場:用途別予測(2024年~2034年、100万米ドル、AGR (%)
図95 アジア太平洋地域の水素燃料電池市場シェア予測:用途別、2024年~2034年 (%)
図96 アジア太平洋地域の水素燃料電池市場:タイプ別(2024年~2034年、100万米ドル、AGR (%)
図 97 アジア太平洋地域の水素燃料電池市場タイプ別シェア予測、2024年~2034年 (%)
図98 アジア太平洋地域の水素燃料電池市場:エンドユーザー別予測(2024年~2034年、100万米ドル、AGR (%)
図 99 アジア太平洋地域の水素燃料電池市場:エンドユーザー別シェア予測、2024年~2034年 (%)
図 100 中国の水素燃料電池市場:金額ベース、2024~2034 年(100 万米ドル、AGR (%)
図 101 インドの水素燃料電池市場:金額(US$ Mn、AGR (%)
図 102 日本の水素燃料電池市場:金額(US$ Mn、AGR (%)
図 103 韓国の水素燃料電池市場:金額(US$ Mn、AGR (%)
図 104 オーストラリアの水素燃料電池市場:金額(US$ Mn、AGR (%)
図 105 その他のアジア太平洋地域の水素燃料電池市場:金額(US$ Mn、AGR (%)
図 106 中東・アフリカの水素燃料電池市場魅力度指数
図 107 中東・アフリカの水素燃料電池地域別市場(2024 年、2029 年、2034 年)(百万米ドル
図 108 中東・アフリカの水素燃料電池市場:金額ベース(2024~2034年、100万米ドル、AGR (%)
図 109 中東・アフリカ水素燃料電池国別市場:2024~2034年(100万米ドル、AGR (%)
図 110 2024~2034 年中東・アフリカ水素燃料電池国別市場シェア予測 (%)
図111 中東・アフリカの水素燃料電池市場:用途別予測(2024~2034年、100万米ドル、AGR (%)
図 112 中東・アフリカの水素燃料電池市場シェア予測、2024~2034 年用途別 (%)
図 113 中東・アフリカの水素燃料電池市場タイプ別予測、2024~2034年 (US$ Mn, AGR (%))
図 114 2024-2034 年中東・アフリカ水素燃料電池タイプ別市場シェア予測 (%)
図 115 中東・アフリカの水素燃料電池市場:エンドユーザー別予測(単位:百万米ドル、AGR (%)
図 116 中東・アフリカの水素燃料電池市場:エンドユーザー別シェア予測(2024 年~2034 年) (%)
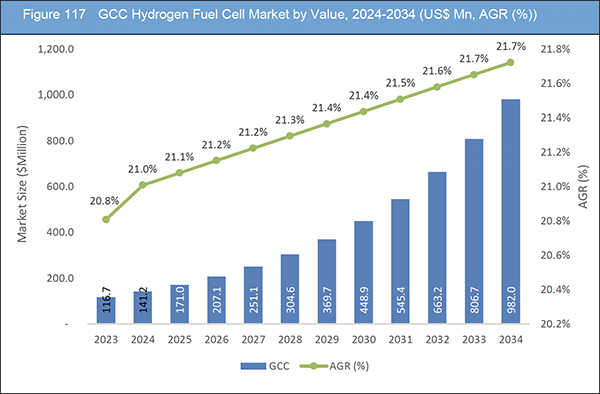
図 117 GCC 水素燃料電池市場の金額別予測(2024~2034 年) (US$ Mn, AGR (%))
図 118 南アフリカの水素燃料電池市場:金額(US$ Mn、AGR (%)
図 119 中東・アフリカの残りの地域の水素燃料電池市場:金額(US$ Mn, AGR (%)
図 120 中南米の水素燃料電池市場魅力度指数
図 121 中南米の水素燃料電池地域別市場(2024 年、2029 年、2034 年)(百万米ドル
図 122 中南米の水素燃料電池市場:金額ベース(2024~2034年、100万米ドル、AGR (%)
図 123 中南米の水素燃料電池国別市場:2024~2034年(100万米ドル、AGR (%)
図124 ラテンアメリカの水素燃料電池国別市場シェア予測、2024年~2034年 (%)
図125 中南米の水素燃料電池市場:用途別予測(2024~2034年、100万米ドル、AGR (%)
図126 ラテンアメリカの水素燃料電池市場シェア予測:用途別、2024年~2034年 (%)
図 127 ラテンアメリカの水素燃料電池市場:タイプ別(2024~2034年、100万米ドル、AGR (%)
図128 ラテンアメリカの水素燃料電池市場タイプ別シェア予測、2024年~2034年 (%)
図129 中南米の水素燃料電池市場:エンドユーザー別 (2024-2034) (US$ Mn, AGR (%))
図 130 ラテンアメリカの水素燃料電池市場:エンドユーザー別 2024-2034 年シェア予測 (%)
図 131 ブラジルの水素燃料電池市場:金額ベース(2024~2034 年) (US$ Mn, AGR (%))
図 132 メキシコの水素燃料電池市場:金額(US$ Mn、AGR (%)
図 133 その他のラテンアメリカの水素燃料電池市場:金額(US$ Mn、AGR (%)
図 134 水素燃料電池市場:企業シェア(2023 年
図 135 Ballard Power Systems Inc:純収入、2019 年~2023 年(百万米ドル、AGR)
図 136 Ballard Power Systems Inc:R&D、2019年~2023年(百万米ドル、AGR)
図 137 Ballard Power Systems Inc:地域別売上高シェア、2023 年
図 138 トヨタ自動車株式会社純収入、2019年~2023年(百万米ドル、AGR)
図 139 トヨタ自動車R&D、2019年~2023年(百万米ドル、AGR)
図 140 トヨタ自動車:地域別売上高シェア、2023年
図 141 トヨタ自動車:事業セグメント別売上高シェア、2023年(%)
図 142 プラグパワー社:純収入、2019 年~2023 年(百万米ドル、AGR)
図 143 プラグパワー社R&D, 2019-2023 (百万米ドル, AGR%)
図 144 プラグパワー社:地域別売上高シェア、2023年(%)
図145 Air Liquide S.A.:純収入、2019年~2023年(百万米ドル、AGR)
図 146 Air Liquide S.A...:R&D、2019年-2023年 (百万米ドル、AGR%)
図147 エア・リキード・エス・エー:地域別売上高シェア(%)
図148 Air Liquide S.A.:事業別売上高シェア、2023年(%)
図 149 ニコラ・コーポレーション:純収入、2019年~2023年(百万米ドル、AGR)
図 150 ニコラ社:R&D、2019年~2023年(百万米ドル、AGR)
図 151 現代自動車純収入、2019年~2023年(百万米ドル、AGR)
図 152 現代自動車R&D、2019年~2023年(百万米ドル、AGR)
図 153 現代自動車:地域別売上高シェア(%)
図 154 現代自動車:事業セグメント別売上高シェア、2023 年 (%)
図 155 三菱重工業:純収入、2019 年~2023 年(百万米ドル、AGR)
図 156 三菱重工業(株):R&D, 2019-2023 (百万米ドル, AGR%)
図 157 三菱重工業(株):地域別売上高シェア、2023 年
図 158 三菱重工業(株):事業別収益シェア、2023 年(%)
図 159 ネル ASA.:純収入、2019 年~2023 年(百万米ドル、AGR)
図 160 Nel ASA.:R&D、2019年~2023年(百万米ドル、AGR)
図161 ネルASA.:地域別収益シェア、2023年(%)
図 162 ネル ASA.:事業別売上高シェア、2023 年(%)
図 163 Cummins Inc:純収入、2019年~2023年(百万米ドル、AGR)
図 164 Cummins Inc:R&D, 2019-2023 (百万米ドル, AGR%)
図 165 東芝エネルギーシステム&ソリューション(株):純収入、2019 年~2023 年(百万米ドル、AGR)
図 166 東芝エネルギーシステム&ソリューション(株):R&D, 2019-2023 (US$ M, AGR%)
図 167 東芝エネルギーシステム&ソリューション(株):地域別売上高シェア(%)
図 168 東芝エネルギーシステム&ソリューション(株):事業別売上高シェア(%)
図 169 アイシン株式会社純収入、2019年~2023年 (百万米ドル、AGR%)
図 170 アイシン株式会社:R&D, 2019-2023 (百万米ドル, AGR%)
図 171 ITM Power plc.:純収入、2019~2023 年(百万米ドル、AGR)
図 172 ITM Power plc.:R&D、2019年~2023年(百万米ドル、AGR)
図 173 ITM Power plc.:地域別収益シェア、2023 年(%)
図 174 ITM Power plc.:事業別売上高シェア、2023 年(%)
図 175 パナソニックホールディングス(株):純収入、2019年~2023年(百万米ドル、AGR)
図 176 パナソニックホールディングス(株):R&D、2019-2023年(百万米ドル、AGR)
図 177 パナソニックホールディングス(株):地域別売上高シェア、2023 年
図 178 パナソニックホールディングス(株):事業別売上高シェア、2023 年(%)
図 179 ブルームエナジー:純収入、2019年~2023年(百万米ドル、AGR)
図 180 ブルームエナジー:R&D, 2019-2023 (百万米ドル, AGR%)
図 181 ブルーム・エナジー:事業セグメント収益シェア, 2023 (%)
図 182 Fuel Cell Energy, Inc.:純収入、2019~2023 年(百万米ドル、AGR)
図 183 Fuel Cell Energy, Inc:R&D、2019年~2023年(百万米ドル、AGR)
図 184 Fuel Cell Energy, Inc:地域別売上高シェア、2023年
ページTOPに戻る
Summary
Report Details
The Hydrogen Fuel Cell Market Report 2024-2034: This report will prove invaluable to leading firms striving for new revenue pockets if they wish to better understand the industry and its underlying dynamics. It will be useful for companies that would like to expand into different industries or to expand their existing operations in a new region.
Increasing Demand for Clean and Sustainable Energy Solutions Across Various Sectors
The global hydrogen fuel cell market is witnessing substantial growth, driven by the increasing demand for clean and sustainable energy solutions across various sectors. Hydrogen fuel cells offer a promising alternative to traditional fossil fuels, providing efficient and environmentally friendly power generation for stationery and transportation applications. This executive summary provides an overview of the market landscape, highlighting key drivers, opportunities, challenges, and competitive dynamics shaping the industry.
Several factors are propelling the growth of the hydrogen fuel cell market. Firstly, rising environmental concerns and stringent regulations aimed at reducing carbon emissions are driving the adoption of clean energy technologies. Hydrogen fuel cells, with their zero-emission characteristics and versatility, are gaining traction as a viable solution to address these challenges. Additionally, advancements in fuel cell technology, such as improvements in efficiency, durability, and cost-effectiveness, are expanding the market’s potential across various end-user industries. Furthermore, government initiatives and investments in hydrogen infrastructure development, coupled with increasing private sector involvement, are further fuelling market growth.
High Preference for Battery Electric Vehicles Over Hydrogen Vehicle to Restrain Market Growth
One significant market restraining factor for hydrogen vehicles is the high preference for battery electric vehicles (BEVs) over hydrogen-powered vehicles. In recent years, BEVs have gained considerable traction in the automotive market due to several factors. Firstly, BEVs have witnessed significant advancements in battery technology, leading to improved energy density, longer driving ranges, and reduced charging times. This has alleviated one of the primary concerns regarding electric vehicles—their limited range and lengthy charging periods. Secondly, the infrastructure for BEVs, such as charging stations and networks, has expanded rapidly, especially in regions with ambitious decarbonization goals. Governments and private entities have invested heavily in establishing charging infrastructure, making BEVs more accessible and convenient for consumers. As a result, consumers may perceive BEVs as a more practical and readily available option compared to hydrogen vehicles, which require a different refuelling infrastructure.
What Questions Should You Ask before Buying a Market Research Report?
-
How is the hydrogen fuel cell market evolving?
-
What is driving and restraining the hydrogen fuel cell market?
-
How will each hydrogen fuel cell submarket segment grow over the forecast period and how much revenue will these submarkets account for in 2034?
-
How will the market shares for each hydrogen fuel cell submarket develop from 2024 to 2034?
-
What will be the main driver for the overall market from 2024 to 2034?
-
Will leading hydrogen fuel cell markets broadly follow the macroeconomic dynamics, or will individual national markets outperform others?
-
How will the market shares of the national markets change by 2034 and which geographical region will lead the market in 2034?
-
Who are the leading players and what are their prospects over the forecast period?
-
What are the hydrogen fuel cell projects for these leading companies?
-
How will the industry evolve during the period between 2024 and 2034? What are the implications of hydrogen fuel cell projects taking place now and over the next 10 years?
-
Is there a greater need for product commercialisation to further scale the hydrogen fuel cell market?
-
Where is the hydrogen fuel cell market heading and how can you ensure you are at the forefront of the market?
-
What are the best investment options for new product and service lines?
-
What are the key prospects for moving companies into a new growth path and C-suite?
You need to discover how this will impact the hydrogen fuel cell market today, and over the next 10 years:
-
Our 394-page report provides 115 tables and 184 charts/graphs exclusively to you.
-
The report highlights key lucrative areas in the industry so you can target them – NOW.
-
It contains in-depth analysis of global, regional and national sales and growth.
-
It highlights for you the key successful trends, changes and revenue projections made by your competitors.
This report tells you TODAY how the hydrogen fuel cell market will develop in the next 10 years, and in line with the variations in COVID-19 economic recession and bounce. This market is more critical now than at any point over the last 10 years.
Forecasts to 2034 and other analyses reveal commercial prospects
-
In addition to revenue forecasting to 2034, our new study provides you with recent results, growth rates, and market shares.
-
You will find original analyses, with business outlooks and developments.
-
Discover qualitative analyses (including market dynamics, drivers, opportunities, restraints and challenges), cost structure, impact of rising hydrogen fuel cell prices and recent developments.
This report includes data analysis and invaluable insight into how COVID-19 will affect the industry and your company. Four COVID-19 recovery patterns and their impact, namely, “V”, “L”, “W” and “U” are discussed in this report.
Segments Covered in the Report
Market Segment by Application
-
Stationary Power Generation
-
Transportation
-
Portable Devices
-
Other Applications
Market Segment by Type
-
Proton Exchange Membrane Fuel Cells
-
Polymer Electrolyte Membrane Fuel Cells (PEMFC)
-
Solid Oxide Fuel Cells
-
Molten Carbonate Fuel Cells
-
Other Types
Market Segment by End-User
-
Commercial & Industrial
-
Transport Industry
-
Data Centres
-
Military & Defence
-
Utilities & Government
-
Other End-Users
In addition to the revenue predictions for the overall world market and segments, you will also find revenue forecasts for four regional and 20 leading national markets:
North America
Europe
-
Germany
-
UK
-
France
-
Norway
-
Denmark
-
Rest of Europe
Asia Pacific
-
China
-
Japan
-
India
-
Australia
-
South Korea
-
Rest of Asia Pacific
Latin America
-
Brazil
-
Mexico
-
Rest of Latin America
Middle East & Africa
-
GCC
-
South Africa
-
Rest of Middle East & Africa
The report also includes profiles and for some of the leading companies in the Hydrogen Fuel Cell Market, 2024 to 2034, with a focus on this segment of these companies’ operations.
Leading companies profiled in the report
-
Air Liquide S.A.
-
Aisin Corporation
-
Ballard Power Systems Inc.
-
Bloom Energy
-
Cummins Inc.
-
Fuel Cell Energy, Inc.
-
Hyundai Motor Company
-
ITM Power plc
-
Mitsubishi Heavy Industries, Ltd
-
Nel ASA
-
Nikola Corporation
-
Panasonic Holdings Corporation
-
Plug Power Inc.
-
Toshiba Energy Systems & Solutions Corporation
-
Toyota Motor Corporation
Overall world revenue for Hydrogen Fuel Cell Market, 2024 to 2034 in terms of value the market will surpass US$2,338.5 million in 2024, our work calculates. We predict strong revenue growth through to 2034. Our work identifies which organizations hold the greatest potential. Discover their capabilities, progress, and commercial prospects, helping you stay ahead.
How will the Hydrogen Fuel Cell Market, 2024 to 2034 report help you?
In summary, our 390+ page report provides you with the following knowledge:
-
Revenue forecasts to 2034 for Hydrogen Fuel Cell Market, 2024 to 2034 Market, with forecasts for application, type, and end-user, each forecast at a global and regional level – discover the industry’s prospects, finding the most lucrative places for investments and revenues.
-
Revenue forecasts to 2034 for four regional and 20 key national markets – See forecasts for the Hydrogen Fuel Cell Market, 2024 to 2034 market in North America, Europe, Asia-Pacific, Latin America and Middle East & Africa. Also forecasted is the market in the US, Canada, Brazil, Germany, France, UK, Norway, Denmark, China, India, Japan, and Australia among other prominent economies.
-
Prospects for established firms and those seeking to enter the market – including company profiles for 15 of the major companies involved in the Hydrogen Fuel Cell Market, 2024 to 2034.
Find quantitative and qualitative analyses with independent predictions. Receive information that only our report contains, staying informed with invaluable business intelligence.
Information found nowhere else
With our new report, you are less likely to fall behind in knowledge or miss out on opportunities. See how our work could benefit your research, analyses, and decisions. Visiongain’s study is for everybody needing commercial analyses for the Hydrogen Fuel Cell Market, 2024 to 2034, market-leading companies. You will find data, trends and predictions.
ページTOPに戻る
Table of Contents
1 Report Overview
1.1 Objectives of the Study
1.2 Introduction to Hydrogen Fuel Cell Market
1.3 What This Report Delivers
1.4 Why You Should Read This Report
1.5 Key Questions Answered by This Analytical Report
1.6 Who Is This Report for?
1.7 Methodology
1.7.1 Market Definitions
1.7.2 Market Evaluation & Forecasting Methodology
1.7.3 Data Validation
1.7.3.1 Primary Research
1.7.3.2 Secondary Research
1.8 Frequently Asked Questions (FAQs)
1.9 Associated Visiongain Reports
1.10 About Visiongain
2 Executive Summary
3 Market Overview
3.1 Key Findings
3.2 Market Dynamics
3.2.1 Market Driving Factors
3.2.1.1 Rising Demand for Hydrogen Fuel Cell Vehicles (FCVs)
3.2.1.2 Rising Investment in Hydrogen Fuel Cell Vehicle Driving the Market Growth
3.2.1.3 Global Efforts to Reduce Greenhouse Gas Emissions Driving the Market Growth
3.2.2 Market Restraining Factors
3.2.2.1 High Preference for Battery Electric Vehicles Over Hydrogen Vehicle Restrain Market Growth
3.2.2.2 High Cost of Platinum Catalyst for Fuel Cells Hinder the Market Growth
3.2.2.3 Increasing Generation of Distributed Power Using Low-Carbon Fuels
3.2.3 Market Opportunities
3.2.3.1 Expansion of Market on International Level Opportunities for the Market Players
3.2.3.2 Government Initiatives and Policies Opportunities for the Market Growth
3.2.3.3 Collaboration and Partnership Between Market Players
3.3 Porter’s Five Forces Analysis
3.3.1 Bargaining Power of Suppliers (Medium to High)
3.3.2 Bargaining Power of Buyers (Low)
3.3.3 Competitive Rivalry (Low)
3.3.4 Threat from Substitutes (High)
3.3.5 Threat of New Entrants (Low)
3.4 COVID-19 Impact Analysis
3.4.1 “V-Shaped Recovery”
3.4.2 “U-Shaped Recovery”
3.4.3 “W-Shaped Recovery”
3.4.4 “L-Shaped Recovery”
3.5 PEST Analysis
4 Hydrogen Fuel Cell Market Analysis by Application
4.1 Key Findings
4.2 Application Segment: Market Attractiveness Index
4.3 Hydrogen Fuel Cell Market Size Estimation and Forecast by Application
4.4 Stationary Power Generation
4.4.1 Market Size by Region, 2024-2034 (US$ Million)
4.4.2 Market Share by Region, 2024 & 2034 (%)
4.5 Transportation
4.5.1 Market Size by Region, 2024-2034 (US$ Million)
4.5.2 Market Share by Region, 2024 & 2034 (%)
4.6 Portable Devices
4.6.1 Market Size by Region, 2024-2034 (US$ Million)
4.6.2 Market Share by Region, 2024 & 2034 (%)
4.7 Others
4.7.1 Market Size by Region, 2024-2034 (US$ Million)
4.7.2 Market Share by Region, 2024 & 2034 (%)
5 Hydrogen Fuel Cell Market Analysis by Type
5.1 Key Findings
5.2 Type Segment: Market Attractiveness Index
5.3 Hydrogen Fuel Cell Market Size Estimation and Forecast by Type
5.4 Proton Exchange Membrane Fuel Cells
5.4.1 Market Size by Region, 2024-2034 (US$ Million)
5.4.2 Market Share by Region, 2024 & 2034 (%)
5.5 Polymer Electrolyte Membrane Fuel Cells (PEMFC)
5.5.1 Market Size by Region, 2024-2034 (US$ Million)
5.5.2 Market Share by Region, 2024 & 2034 (%)
5.6 Solid Oxide Fuel Cells
5.6.1 Market Size by Region, 2024-2034 (US$ Million)
5.6.2 Market Share by Region, 2024 & 2034 (%)
5.7 Molten Carbonate Fuel Cells
5.7.1 Market Size by Region, 2024-2034 (US$ Million)
5.7.2 Market Share by Region, 2024 & 2034 (%)
5.8 Others Types
5.8.1 Market Size by Region, 2024-2034 (US$ Million)
5.8.2 Market Share by Region, 2024 & 2034 (%)
6 Hydrogen Fuel Cell Market Analysis by End-User
6.1 Key Findings
6.2 End-User Segment: Market Attractiveness Index
6.3 Hydrogen Fuel Cell Market Size Estimation and Forecast by End-User
6.4 Commercial & Industrial
6.4.1 Market Size by Region, 2024-2034 (US$ Million)
6.4.2 Market Share by Region, 2024 & 2034 (%)
6.5 Transport Industry
6.5.1 Market Size by Region, 2024-2034 (US$ Million)
6.5.2 Market Share by Region, 2024 & 2034 (%)
6.6 Data Centers
6.6.1 Market Size by Region, 2024-2034 (US$ Million)
6.6.2 Market Share by Region, 2024 & 2034 (%)
6.7 Military & Defense
6.7.1 Market Size by Region, 2024-2034 (US$ Million)
6.7.2 Market Share by Region, 2024 & 2034 (%)
6.8 Utilities & Government
6.8.1 Market Size by Region, 2024-2034 (US$ Million)
6.8.2 Market Share by Region, 2024 & 2034 (%)
6.9 Other End-Users
6.9.1 Market Size by Region, 2024-2034 (US$ Million)
6.9.2 Market Share by Region, 2024 & 2034 (%)
7 Hydrogen Fuel Cell Market Analysis by Region
7.1 Key Findings
7.2 Regional Market Size Estimation and Forecast
8 North America Hydrogen Fuel Cell Market Analysis
8.1 Key Findings
8.2 North America Hydrogen Fuel Cell Market Attractiveness Index
8.3 North America Hydrogen Fuel Cell Market by Country, 2024, 2029 & 2034 (US$ Million)
8.4 North America Hydrogen Fuel Cell Market Size Estimation and Forecast
8.5 North America Hydrogen Fuel Cell Market Size Estimation and Forecast by Country
8.6 North America Hydrogen Fuel Cell Market Size Estimation and Forecast by Application
8.7 North America Hydrogen Fuel Cell Market Size Estimation and Forecast by Type
8.8 North America Hydrogen Fuel Cell Market Size Estimation and Forecast by End-User
8.9 U.S. Hydrogen Fuel Cell Market Analysis
8.10 Canada Hydrogen Fuel Cell Market Analysis
9 Europe Hydrogen Fuel Cell Market Analysis
9.1 Key Findings
9.2 Europe Hydrogen Fuel Cell Market Attractiveness Index
9.3 Europe Hydrogen Fuel Cell Market by Country, 2024, 2029 & 2034 (US$ Million)
9.4 Europe Hydrogen Fuel Cell Market Size Estimation and Forecast
9.5 Europe Hydrogen Fuel Cell Market Size Estimation and Forecast by Country
9.6 Europe Hydrogen Fuel Cell Market Size Estimation and Forecast by Application
9.7 Europe Hydrogen Fuel Cell Market Size Estimation and Forecast by Type
9.8 Europe Hydrogen Fuel Cell Market Size Estimation and Forecast by End-User
9.9 Germany Hydrogen Fuel Cell Market Analysis
9.10 UK Hydrogen Fuel Cell Market Analysis
9.11 France Hydrogen Fuel Cell Market Analysis
9.12 Norway Hydrogen Fuel Cell Market Analysis
9.13 Denmark Hydrogen Fuel Cell Market Analysis
9.14 Rest of Europe Hydrogen Fuel Cell Market Analysis
10 Asia-Pacific Hydrogen Fuel Cell Market Analysis
10.1 Key Findings
10.2 Asia-Pacific Hydrogen Fuel Cell Market Attractiveness Index
10.3 Asia-Pacific Hydrogen Fuel Cell Market by Country, 2024, 2029 & 2034 (US$ Million)
10.4 Asia-Pacific Hydrogen Fuel Cell Market Size Estimation and Forecast
10.5 Asia-Pacific Hydrogen Fuel Cell Market Size Estimation and Forecast by Country
10.6 Asia-Pacific Hydrogen Fuel Cell Market Size Estimation and Forecast by Application
10.7 Asia-Pacific Hydrogen Fuel Cell Market Size Estimation and Forecast by Type
10.8 Asia-Pacific Hydrogen Fuel Cell Market Size Estimation and Forecast by End-User
10.9 China Hydrogen Fuel Cell Market Analysis
10.10 India Hydrogen Fuel Cell Market Analysis
10.11 Japan Hydrogen Fuel Cell Market Analysis
10.12 South Korea Hydrogen Fuel Cell Market Analysis
10.13 Australia Hydrogen Fuel Cell Market Analysis
10.14 Rest of Asia-Pacific Hydrogen Fuel Cell Market Analysis
11 Middle East and Africa Hydrogen Fuel Cell Market Analysis
11.1 Key Findings
11.2 Middle East and Africa Hydrogen Fuel Cell Market Attractiveness Index
11.3 Middle East and Africa Hydrogen Fuel Cell Market by Country, 2024, 2029 & 2034 (US$ Million)
11.4 Middle East and Africa Hydrogen Fuel Cell Market Size Estimation and Forecast
11.5 Middle East and Africa Hydrogen Fuel Cell Market Size Estimation and Forecast by Country
11.6 Middle East and Africa Hydrogen Fuel Cell Market Size Estimation and Forecast by Application
11.7 Middle East and Africa Hydrogen Fuel Cell Market Size Estimation and Forecast by Type
11.8 Middle East and Africa Hydrogen Fuel Cell Market Size Estimation and Forecast by End-User
11.9 GCC Hydrogen Fuel Cell Market Analysis
11.10 South Africa Hydrogen Fuel Cell Market Analysis
11.11 Rest of Middle East & Africa Hydrogen Fuel Cell Market Analysis
12 Latin America Hydrogen Fuel Cell Market Analysis
12.1 Key Findings
12.2 Latin America Hydrogen Fuel Cell Market Attractiveness Index
12.3 Latin America Hydrogen Fuel Cell Market by Country, 2024, 2029 & 2034 (US$ Million)
12.4 Latin America Hydrogen Fuel Cell Market Size Estimation and Forecast
12.5 Latin America Hydrogen Fuel Cell Market Size Estimation and Forecast by Country
12.6 Latin America Hydrogen Fuel Cell Market Size Estimation and Forecast by Application
12.7 Latin America Hydrogen Fuel Cell Market Size Estimation and Forecast by Type
12.8 Latin America Hydrogen Fuel Cell Market Size Estimation and Forecast by End-User
12.9 Brazil Hydrogen Fuel Cell Market Analysis
12.10 Mexico Hydrogen Fuel Cell Market Analysis
12.11 Rest of Latin America Hydrogen Fuel Cell Market Analysis
13 Company Profiles
13.1 Competitive Landscape, 2023
13.2 Strategic Outlook
13.3 Ballard Power Systems Inc
13.3.1 Company Snapshot
13.3.2 Company Overview
13.3.3 Financial Analysis
13.3.3.1 Net Revenue, 2019-2023
13.3.3.2 R&D, 2019-2023
13.3.3.3 Regional Revenue Share, 2023 (%)
13.3.4 Product Benchmarking
13.3.5 Strategic Outlook
13.4 Toyota Motor Corporation
13.4.1 Company Snapshot
13.4.2 Company Overview
13.4.3 Financial Analysis
13.4.3.1 Net Revenue, 2019-2023
13.4.3.2 R&D, 2019-2023
13.4.3.3 Regional Revenue Share, 2023 (%)
13.4.3.4 Business Segment Revenue Share, 2023 (%)
13.4.4 Product Benchmarking
13.4.5 Strategic Outlook
13.5 Plug Power Inc.
13.5.1 Company Snapshot
13.5.2 Company Overview
13.5.3 Financial Analysis
13.5.3.1 Net Revenue, 2019-2023
13.5.3.2 R&D, 2019-2023
13.5.3.3 Regional Revenue Share, 2023 (%)
13.5.4 Product Benchmarking
13.5.5 Strategic Outlook
13.6 Air Liquide S.A.
13.6.1 Company Snapshot
13.6.2 Company Overview
13.6.3 Financial Analysis
13.6.3.1 Net Revenue, 2019-2023
13.6.3.2 R&D, 2019-2023
13.6.3.3 Regional Revenue Share, 2023 (%)
13.6.3.4 Business Segment Revenue Share, 2023 (%)
13.6.4 Product Benchmarking
13.6.5 Strategic Outlook
13.7 Nikola Corporation
13.7.1 Company Snapshot
13.7.2 Company Overview
13.7.3 Financial Analysis
13.7.3.1 Net Revenue, 2019-2023
13.7.3.2 R&D, 2019-2023
13.7.4 Product Benchmarking
13.7.5 Strategic Outlook
13.8 Hyundai Motor Company
13.8.1 Company Snapshot
13.8.2 Company Overview
13.8.3 Financial Analysis
13.8.3.1 Net Revenue, 2019-2023
13.8.3.2 R&D, 2019-2023
13.8.3.3 Regional Revenue Share, 2023 (%)
13.8.3.4 Business Segment Revenue Share, 2023 (%)
13.8.4 Product Benchmarking
13.8.5 Strategic Outlook
13.9 Mitsubishi Heavy Industries, Ltd
13.9.1 Company Snapshot
13.9.2 Company Overview
13.9.3 Financial Analysis
13.9.3.1 Net Revenue, 2019-2023
13.9.3.2 R&D, 2019-2023
13.9.3.3 Regional Revenue Share, 2023 (%)
13.9.3.4 Business Segment Revenue Share, 2023 (%)
13.9.4 Product Benchmarking
13.10 Nel ASA
13.10.1 Company Snapshot
13.10.2 Company Overview
13.10.3 Financial Analysis
13.10.3.1 Net Revenue, 2019-2023
13.10.3.2 R&D, 2019-2023
13.10.3.3 Regional Revenue Share, 2023 (%)
13.10.3.4 Business Segment Revenue Share, 2023 (%)
13.10.4 Product Benchmarking
13.10.5 Strategic Outlook
13.11 Cummins Inc.
13.11.1 Company Snapshot
13.11.2 Company Overview
13.11.3 Financial Analysis
13.11.3.1 Net Revenue, 2019-2023
13.11.3.2 R&D, 2019-2023
13.11.4 Product Benchmarking
13.11.5 Strategic Outlook
13.12 Toshiba Energy Systems & Solutions Corporation
13.12.1 Company Snapshot
13.12.2 Company Overview
13.12.3 Financial Analysis
13.12.3.1 Net Revenue, 2019-2023
13.12.3.2 R&D, 2019-2023
13.12.3.3 Regional Revenue Share, 2023 (%)
13.12.3.4 Business Segment Revenue Share, 2023 (%)
13.12.4 Product Benchmarking
13.12.5 Strategic Outlook
13.13 Aisin Corporation
13.13.1 Company Snapshot
13.13.2 Company Overview
13.13.3 Financial Analysis
13.13.3.1 Net Revenue, 2019-2023
13.13.3.2 R&D, 2019-2023
13.13.4 Product Benchmarking
13.13.5 Strategic Outlook
13.14 ITM Power plc
13.14.1 Company Snapshot
13.14.2 Company Overview
13.14.3 Financial Analysis
13.14.3.1 Net Revenue, 2019-2023
13.14.3.2 R&D, 2019-2023
13.14.3.3 Regional Revenue Share, 2023 (%)
13.14.3.4 Business Segment Revenue Share, 2023 (%)
13.14.4 Product Benchmarking
13.14.5 Strategic Outlook
13.15 Panasonic Holdings Corporation
13.15.1 Company Snapshot
13.15.2 Company Overview
13.15.3 Financial Analysis
13.15.3.1 Net Revenue, 2019-2023
13.15.3.2 R&D, 2019-2023
13.15.3.3 Regional Revenue Share, 2023 (%)
13.15.3.4 Business Segment Revenue Share, 2023 (%)
13.15.4 Product Benchmarking
13.15.5 Strategic Outlook
13.16 Bloom Energy
13.16.1 Company Snapshot
13.16.2 Company Overview
13.16.3 Financial Analysis
13.16.3.1 Net Revenue, 2019-2023
13.16.3.2 R&D, 2019-2023
13.16.3.3 Business Segment Revenue Share, 2023 (%)
13.16.4 Product Benchmarking
13.16.5 Strategic Outlook
13.17 Fuel Cell Energy, Inc.
13.17.1 Company Snapshot
13.17.2 Company Overview
13.17.3 Financial Analysis
13.17.3.1 Net Revenue, 2019-2023
13.17.3.2 R&D, 2019-2023
13.17.3.3 Regional Revenue Share, 2023 (%)
13.17.4 Product Benchmarking
13.17.5 Strategic Outlook
14 Conclusion and Recommendations
14.1 Concluding Remarks from Visiongain
14.2 Recommendations for Market Players
ページTOPに戻る
List of Tables/Graphs
List of Tables
Table 1 Hydrogen Fuel Cell Market Snapshot, 2024 & 2034 (US$ Million, CAGR %)
Table 2 Global Hydrogen Fuel Cell Market by Region, 2024-2034 (US$ Mn, AGR (%), CAGR (%)) (V-Shaped Recovery Scenario)
Table 3 Global Hydrogen Fuel Cell Market by Region, 2024-2034 (US$ Mn, AGR (%), CAGR (%)) (U-Shaped Recovery Scenario)
Table 4 Global Hydrogen Fuel Cell Market by Region, 2024-2034 (US$ Mn, AGR (%), CAGR (%)) (W-Shaped Recovery Scenario)
Table 5 Global Hydrogen Fuel Cell Market by Region, 2024-2034 (US$ Mn, AGR (%), CAGR (%)) (L-Shaped Recovery Scenario)
Table 6 Global Hydrogen Fuel Cell Market by Application, 2024-2034 (US$ Mn, AGR (%), CAGR (%))
Table 7 Stationary Power Generation Market by Region, 2024-2034 (US$ Mn, AGR (%), CAGR (%))
Table 8 Transportation Market by Region, 2024-2034 (US$ Mn, AGR (%), CAGR (%))
Table 9 Portable Devices Market by Region, 2024-2034 (US$ Mn, AGR (%), CAGR (%))
Table 10 Other Applications Market by Region, 2024-2034 (US$ Mn, AGR (%), CAGR (%))
Table 11 Other Applications Market by Region, 2024-2034 (US$ Mn, AGR (%), CAGR (%))
Table 12 Global Hydrogen Fuel Cell Market by Type, 2024-2034 (US$ Mn, AGR (%), CAGR (%))
Table 13 Proton Exchange Membrane Fuel Cells Market by Region, 2024-2034 (US$ Mn, AGR (%), CAGR (%))
Table 14 Polymer Electrolyte Membrane Fuel Cells (PEMFC) Market by Region, 2024-2034 (US$ Mn, AGR (%), CAGR (%))
Table 15 Solid Oxide Fuel Cells Market by Region, 2024-2034 (US$ Mn, AGR (%), CAGR (%))
Table 16 Molten Carbonate Fuel Cells Market by Region, 2024-2034 (US$ Mn, AGR (%), CAGR (%))
Table 17 Other Types Market by Region, 2024-2034 (US$ Mn, AGR (%), CAGR (%))
Table 18 Global Hydrogen Fuel Cell Market by End-User, 2024-2034 (US$ Mn, AGR (%), CAGR (%))
Table 19 Commercial & Industrial Market by Region, 2024-2034 (US$ Mn, AGR (%), CAGR (%))
Table 20 Transport Industry Market by Region, 2024-2034 (US$ Mn, AGR (%), CAGR (%))
Table 21 Data Centers Market by Region, 2024-2034 (US$ Mn, AGR (%), CAGR (%))
Table 22 Military & Defense Market by Region, 2024-2034 (US$ Mn, AGR (%), CAGR (%))
Table 23 Utilities & Government Market by Region, 2024-2034 (US$ Mn, AGR (%), CAGR (%))
Table 24 Other End-Users Market by Region, 2024-2034 (US$ Mn, AGR (%), CAGR (%))
Table 25 Global Hydrogen Fuel Cell Market by Region, 2024-2034 (US$ Mn, AGR (%), CAGR (%))
Table 26 North America Hydrogen Fuel Cell Market by Value, 2024-2034 (US$ Mn, AGR (%), CAGR (%))
Table 27 North America Hydrogen Fuel Cell Market by Country, 2024-2034 (US$ Mn, AGR (%), CAGR (%))
Table 28 North America Hydrogen Fuel Cell Market by Application, 2024-2034 (US$ Mn, AGR (%), CAGR (%))
Table 29 North America Hydrogen Fuel Cell Market by Type, 2024-2034 (US$ Mn, AGR (%), CAGR (%))
Table 30 North America Hydrogen Fuel Cell Market by End-User, 2024-2034 (US$ Mn, AGR (%), CAGR (%))
Table 31 US Hydrogen Fuel Cell Market by Value, 2024-2034 (US$ Mn, AGR (%), CAGR (%))
Table 32 Canada Hydrogen Fuel Cell Market by Value, 2024-2034 (US$ Mn, AGR (%), CAGR (%))
Table 33 Europe Hydrogen Fuel Cell Market by Value, 2024-2034 (US$ Mn, AGR (%), CAGR (%))
Table 34 Europe Hydrogen Fuel Cell Market by Country, 2024-2034 (US$ Mn, AGR (%), CAGR (%))
Table 35 Europe Hydrogen Fuel Cell Market by Application, 2024-2034 (US$ Mn, AGR (%), CAGR (%))
Table 36 Europe Hydrogen Fuel Cell Market by Type, 2024-2034 (US$ Mn, AGR (%), CAGR (%))
Table 37 Europe Hydrogen Fuel Cell Market by End-User, 2024-2034 (US$ Mn, AGR (%), CAGR (%))
Table 38 Germany Hydrogen Fuel Cell Market by Value, 2024-2034 (US$ Mn, AGR (%), CAGR (%))
Table 39 UK Hydrogen Fuel Cell Market by Value, 2024-2034 (US$ Mn, AGR (%), CAGR (%))
Table 40 France Hydrogen Fuel Cell Market by Value, 2024-2034 (US$ Mn, AGR (%), CAGR (%))
Table 41 Norway Hydrogen Fuel Cell Market by Value, 2024-2034 (US$ Mn, AGR (%), CAGR (%))
Table 42 Denmark Hydrogen Fuel Cell Market by Value, 2024-2034 (US$ Mn, AGR (%), CAGR (%))
Table 43 Rest of Europe Hydrogen Fuel Cell Market by Value, 2024-2034 (US$ Mn, AGR (%), CAGR (%))
Table 44 Asia-Pacific Hydrogen Fuel Cell Market by Value, 2024-2034 (US$ Mn, AGR (%), CAGR (%))
Table 45 Asia-Pacific Hydrogen Fuel Cell Market by Country, 2024-2034 (US$ Mn, AGR (%), CAGR (%))
Table 46 Asia-Pacific Hydrogen Fuel Cell Market by Application, 2024-2034 (US$ Mn, AGR (%), CAGR (%))
Table 47 Asia-Pacific Hydrogen Fuel Cell Market by Type, 2024-2034 (US$ Mn, AGR (%), CAGR (%))
Table 48 Asia-Pacific Hydrogen Fuel Cell Market by End-User, 2024-2034 (US$ Mn, AGR (%), CAGR (%))
Table 49 China Hydrogen Fuel Cell Market by Value, 2024-2034 (US$ Mn, AGR (%), CAGR (%))
Table 50 India Hydrogen Fuel Cell Market by Value, 2024-2034 (US$ Mn, AGR (%), CAGR (%))
Table 51 Japan Hydrogen Fuel Cell Market by Value, 2024-2034 (US$ Mn, AGR (%), CAGR (%))
Table 52 South Korea Hydrogen Fuel Cell Market by Value, 2024-2034 (US$ Mn, AGR (%), CAGR (%))
Table 53 Australia Hydrogen Fuel Cell Market by Value, 2024-2034 (US$ Mn, AGR (%), CAGR (%))
Table 54 Rest of Asia-Pacific Hydrogen Fuel Cell Market by Value, 2024-2034 (US$ Mn, AGR (%), CAGR (%))
Table 55 Middle East & Africa Hydrogen Fuel Cell Market by Value, 2024-2034 (US$ Mn, AGR (%), CAGR (%))
Table 56 Middle East & Africa Hydrogen Fuel Cell Market by Country, 2024-2034 (US$ Mn, AGR (%), CAGR (%))
Table 57 Middle East & Africa Hydrogen Fuel Cell Market by Application, 2024-2034 (US$ Mn, AGR (%), CAGR (%))
Table 58 Middle East & Africa Hydrogen Fuel Cell Market by Type, 2024-2034 (US$ Mn, AGR (%), CAGR (%))
Table 59 Middle East & Africa Hydrogen Fuel Cell Market by End-User, 2024-2034 (US$ Mn, AGR (%), CAGR (%))
Table 60 GCC Hydrogen Fuel Cell Market by Value, 2024-2034 (US$ Mn, AGR (%), CAGR (%))
Table 61 South Africa Hydrogen Fuel Cell Market by Value, 2024-2034 (US$ Mn, AGR (%), CAGR (%))
Table 62 Rest of Middle East & Africa Hydrogen Fuel Cell Market by Value, 2024-2034 (US$ Mn, AGR (%), CAGR (%))
Table 63 Latin America Hydrogen Fuel Cell Market by Value, 2024-2034 (US$ Mn, AGR (%), CAGR (%))
Table 64 Latin America Hydrogen Fuel Cell Market by Country, 2024-2034 (US$ Mn, AGR (%), CAGR (%))
Table 65 Latin America Hydrogen Fuel Cell Market by Application, 2024-2034 (US$ Mn, AGR (%), CAGR (%))
Table 66 Latin America Hydrogen Fuel Cell Market by Type, 2024-2034 (US$ Mn, AGR (%), CAGR (%))
Table 67 Latin America Hydrogen Fuel Cell Market by End-User, 2024-2034 (US$ Mn, AGR (%), CAGR (%))
Table 68 Brazil Hydrogen Fuel Cell Market by Value, 2024-2034 (US$ Mn, AGR (%), CAGR (%))
Table 69 Mexico Hydrogen Fuel Cell Market by Value, 2024-2034 (US$ Mn, AGR (%), CAGR (%))
Table 70 Rest of Latin America Hydrogen Fuel Cell Market by Value, 2024-2034 (US$ Mn, AGR (%), CAGR (%))
Table 71 Strategic Outlook - Contract
Table 72 Ballard Power Systems Inc: Key Details, (CEO, HQ, Revenue, Founded, No. of Employees, Company Type, Website, Business Segment)
Table 73 Ballard Power Systems Inc: Product Benchmarking
Table 74 Ballard Power Systems Inc: Strategic Outlook
Table 75 Toyota Motor Corporation: Key Details, (CEO, HQ, Revenue, Founded, No. of Employees, Company Type, Website, Business Segment)
Table 76 Toyota Motor Corporation: Product Benchmarking
Table 77 Toyota Motor Corporation: Strategic Outlook
Table 78 Plug Power Inc.: Key Details, (CEO, HQ, Revenue, Founded, No. of Employees, Company Type, Website, Business Segment)
Table 79 Plug Power Inc.: Product Benchmarking
Table 80 Plug Power Inc.: Strategic Outlook
Table 81 Air Liquide S.A.: Key Details, (CEO, HQ, Revenue, Founded, No. of Employees, Company Type, Website, Business Segment)
Table 82 Air Liquide S.A.: Product Benchmarking
Table 83 Air Liquide S.A.: Strategic Outlook
Table 84 Nikola Corporation: Key Details, (CEO, HQ, Revenue, Founded, No. of Employees, Company Type, Website, Business Segment)
Table 85 Nikola Corporation: Product Benchmarking
Table 86 Nikola Corporation: Strategic Outlook
Table 87 Hyundai Motor Company: Key Details, (CEO, HQ, Revenue, Founded, No. of Employees, Company Type, Website, Business Segment)
Table 88 Hyundai Motor Company: Product Benchmarking
Table 89 Hyundai Motor Company: Strategic Outlook
Table 90 Mitsubishi Heavy Industries, Ltd: Key Details, (CEO, HQ, Revenue, Founded, No. of Employees, Company Type, Website, Business Segment)
Table 91 Mitsubishi Heavy Industries, Ltd: Product Benchmarking
Table 92 Nel ASA: Key Details, (CEO, HQ, Revenue, Founded, No. of Employees, Company Type, Website, Business Segment)
Table 93 Nel ASA: Product Benchmarking
Table 94 Nel ASA: Strategic Outlook
Table 95 Cummins Inc: Key Details, (CEO, HQ, Revenue, Founded, No. of Employees, Company Type, Website, Business Segment)
Table 96 Cummins Inc: Product Benchmarking
Table 97 Cummins Inc: Strategic Outlook
Table 98 Toshiba Energy Systems & Solutions Corporation: Key Details, (CEO, HQ, Revenue, Founded, No. of Employees, Company Type, Website, Business Segment)
Table 99 Toshiba Energy Systems & Solutions Corporation: Product Benchmarking
Table 100 Toshiba Energy Systems & Solutions Corporation: Strategic Outlook
Table 101 Aisin Corporation.: Key Details, (CEO, HQ, Revenue, Founded, No. of Employees, Company Type, Website, Business Segment)
Table 102 Aisin Corporation.: Product Benchmarking
Table 103 Aisin Corporation.: Strategic Outlook
Table 104 ITM Power plc: Key Details, (CEO, HQ, Revenue, Founded, No. of Employees, Company Type, Website, Business Segment)
Table 105 ITM Power plc: Product Benchmarking
Table 106 ITM Power plc: Strategic Outlook
Table 107 Panasonic Holdings Corporation: Key Details, (CEO, HQ, Revenue, Founded, No. of Employees, Company Type, Website, Business Segment)
Table 108 Panasonic Holdings Corporation: Product Benchmarking
Table 109 Panasonic Holdings Corporation: Strategic Outlook
Table 110 Bloom Energy: Key Details, (CEO, HQ, Revenue, Founded, No. of Employees, Company Type, Website, Business Segment)
Table 111 Bloom Energy: Product Benchmarking
Table 112 Bloom Energy: Strategic Outlook
Table 113 Fuel Cell Energy, Inc.: Key Details, (CEO, HQ, Revenue, Founded, No. of Employees, Company Type, Website, Business Segment)
Table 114 Fuel Cell Energy, Inc.: Product Benchmarking
Table 115 Fuel Cell Energy, Inc.: Strategic Outlook
List of Figures
Figure 1 Hydrogen Fuel Cell Market Segmentation
Figure 2 Hydrogen Fuel Cell Market by Application: Market Attractiveness Index
Figure 3 Hydrogen Fuel Cell Market by Type: Market Attractiveness Index
Figure 4 Hydrogen Fuel Cell Market by End-User: Market Attractiveness Index
Figure 5 Hydrogen Fuel Cell Market Attractiveness Index by Region
Figure 6 Hydrogen Fuel Cell Market: Market Dynamics
Figure 7 Electric Car Sales, 2019-2023
Figure 8 Comparison Hydrogen-Powered and Electric-Powered Cars
Figure 9 Hydrogen Fuel Cell Market: Porter’s Five Forces Analysis
Figure 10 Global Hydrogen Fuel Cell Market Share Forecast by COVID, 2024-2034 (%)
Figure 11 Global Hydrogen Fuel Cell Market by Region, 2024-2034 (US$ Mn, AGR (%)) (V-Shaped Recovery Scenario)
Figure 12 Global Hydrogen Fuel Cell Market by Region, 2024-2034 (US$ Mn, AGR (%)) (U-Shaped Recovery Scenario)
Figure 13 Global Hydrogen Fuel Cell Market by Region, 2024-2034 (US$ Mn, AGR (%)) (W-Shaped Recovery Scenario)
Figure 14 Global Hydrogen Fuel Cell Market by Region, 2024-2034 (US$ Mn, AGR (%)) (L-Shaped Recovery Scenario)
Figure 15 Hydrogen Fuel Cell Market: PEST Analysis
Figure 16 Hydrogen Fuel Cell Market by Application: Market Attractiveness Index
Figure 17 Global Hydrogen Fuel Cell Market by Application, 2024-2034 (US$ Mn, AGR (%))
Figure 18 Hydrogen Fuel Cell Market Share Forecast by Application, 2024, 2029, 2034 (%)
Figure 19 Stationary Power Generation Market by Region, 2024-2034 (US$ Mn, AGR (%))
Figure 20 Stationary Power Generation Market Share Forecast by Region, 2024 & 2034 (%)
Figure 21 Transportation Market by Region, 2024-2034 (US$ Mn, AGR (%))
Figure 22 Transportation Market Share Forecast by Region, 2024 & 2034 (%)
Figure 23 Portable Devices Market by Region, 2024-2034 (US$ Mn, AGR (%))
Figure 24 Portable Devices Market Share Forecast by Region, 2024 & 2034 (%)
Figure 25 Other Applications Market by Region, 2024-2034 (US$ Mn, AGR (%))
Figure 26 Other Applications Market by Region, 2024-2034 (US$ Mn, AGR (%))
Figure 27 Others Market Share Forecast by Region, 2024 & 2034 (%)
Figure 28 Hydrogen Fuel Cell Market by Type: Market Attractiveness Index
Figure 29 Global Hydrogen Fuel Cell Market by Type, 2024-2034 (US$ Mn, AGR (%))
Figure 30 Hydrogen Fuel Cell Market Share Forecast by Type, 2024, 2029, 2034 (%)
Figure 31 Proton Exchange Membrane Fuel Cells Market by Region, 2024-2034 (US$ Mn, AGR (%))
Figure 32 Proton Exchange Membrane Fuel Cells Market Share Forecast by Region, 2024 & 2034 (%)
Figure 33 Polymer Electrolyte Membrane Fuel Cells (PEMFC) Market by Region, 2024-2034 (US$ Mn, AGR (%))
Figure 34 Polymer Electrolyte Membrane Fuel Cells (PEMFC) Market Share Forecast by Region, 2024 & 2034 (%)
Figure 35 Solid Oxide Fuel Cells Market by Region, 2024-2034 (US$ Mn, AGR (%))
Figure 36 Solid Oxide Fuel Cells Market Share Forecast by Region, 2024 & 2034 (%)
Figure 37 Molten Carbonate Fuel Cells Market by Region, 2024-2034 (US$ Mn, AGR (%))
Figure 38 Molten Carbonate Fuel Cells Market Share Forecast by Region, 2024 & 2034 (%)
Figure 39 Other Types Market by Region, 2024-2034 (US$ Mn, AGR (%))
Figure 40 Others Types Market Share Forecast by Region, 2024 & 2034 (%)
Figure 41 Hydrogen Fuel Cell Market by End-User: Market Attractiveness Index
Figure 42 Global Hydrogen Fuel Cell Market by End-User, 2024-2034 (US$ Mn, AGR (%))
Figure 43 Hydrogen Fuel Cell Market Share Forecast by End-User, 2024, 2029, 2034 (%)
Figure 44 Commercial & Industrial Market by Region, 2024-2034 (US$ Mn, AGR (%))
Figure 45 Commercial & Industrial Market Share Forecast by Region, 2024 & 2034 (%)
Figure 46 Transport Industry Market by Region, 2024-2034 (US$ Mn, AGR (%))
Figure 47 Transport Industry Market Share Forecast by Region, 2024 & 2034 (%)
Figure 48 Data Centers Market by Region, 2024-2034 (US$ Mn, AGR (%))
Figure 49 Data Centers Market Share Forecast by Region, 2024 & 2034 (%)
Figure 50 Military & Defense Market by Region, 2024-2034 (US$ Mn, AGR (%))
Figure 51 Military & Defense Market Share Forecast by Region, 2024 & 2034 (%)
Figure 52 Utilities & Government Market by Region, 2024-2034 (US$ Mn, AGR (%))
Figure 53 Utilities & Government Market Share Forecast by Region, 2024 & 2034 (%)
Figure 54 Other End-Users Market by Region, 2024-2034 (US$ Mn, AGR (%))
Figure 55 Other End-Users Market Share Forecast by Region, 2024 & 2034 (%)
Figure 56 Hydrogen Fuel Cell Market Forecast by Region 2024 and 2034 (Revenue, CAGR%)
Figure 57 Hydrogen Fuel Cell Market Share Forecast by Region 2024, 2029, 2034 (%)
Figure 58 Global Hydrogen Fuel Cell Market by Region, 2024-2034 (US$ Mn, AGR (%))
Figure 59 North America Hydrogen Fuel Cell Market Attractiveness Index
Figure 60 North America Hydrogen Fuel Cell Market by Region, 2024, 2029 & 2034 (US$ Million)
Figure 61 North America Hydrogen Fuel Cell Market by Value, 2024-2034 (US$ Mn, AGR (%))
Figure 62 North America Hydrogen Fuel Cell Market by Country, 2024-2034 (US$ Mn, AGR (%))
Figure 63 North America Hydrogen Fuel Cell Market Share Forecast by Country, 2024 & 2034 (%)
Figure 64 North America Hydrogen Fuel Cell Market by Application, 2024-2034 (US$ Mn, AGR (%))
Figure 65 North America Hydrogen Fuel Cell Market Share Forecast Application, 2024 & 2034 (%)
Figure 66 North America Hydrogen Fuel Cell Market by Type, 2024-2034 (US$ Mn, AGR (%))
Figure 67 North America Hydrogen Fuel Cell Market Share Forecast by Type, 2024 & 2034 (%)
Figure 68 North America Hydrogen Fuel Cell Market by End-User, 2024-2034 (US$ Mn, AGR (%))
Figure 69 North America Hydrogen Fuel Cell Market Share Forecast by End-User, 2024 & 2034 (%)
Figure 70 US Hydrogen Fuel Cell Market by Value, 2024-2034 (US$ Mn, AGR (%))
Figure 71 Canada Hydrogen Fuel Cell Market by Value, 2024-2034 (US$ Mn, AGR (%))
Figure 72 Europe Hydrogen Fuel Cell Market Attractiveness Index
Figure 73 Europe Hydrogen Fuel Cell Market by Region, 2024, 2029 & 2034 (US$ Million)
Figure 74 Europe Hydrogen Fuel Cell Market by Value, 2024-2034 (US$ Mn, AGR (%))
Figure 75 Europe Hydrogen Fuel Cell Market by Country, 2024-2034 (US$ Mn, AGR (%))
Figure 76 Europe Hydrogen Fuel Cell Market Share Forecast by Country, 2024 & 2034 (%)
Figure 77 Europe Hydrogen Fuel Cell Market by Application, 2024-2034 (US$ Mn, AGR (%))
Figure 78 Europe Hydrogen Fuel Cell Market Share Forecast Application, 2024 & 2034 (%)
Figure 79 Europe Hydrogen Fuel Cell Market by Type, 2024-2034 (US$ Mn, AGR (%))
Figure 80 Europe Hydrogen Fuel Cell Market Share Forecast by Type, 2024 & 2034 (%)
Figure 81 Europe Hydrogen Fuel Cell Market by End-user, 2024-2034 (US$ Mn, AGR (%))
Figure 82 Europe Hydrogen Fuel Cell Market Share Forecast by End-User, 2024 & 2034 (%)
Figure 83 Germany Hydrogen Fuel Cell Market by Value, 2024-2034 (US$ Mn, AGR (%))
Figure 84 UK Hydrogen Fuel Cell Market by Value, 2024-2034 (US$ Mn, AGR (%))
Figure 85 France Hydrogen Fuel Cell Market by Value, 2024-2034 (US$ Mn, AGR (%))
Figure 86 Norway Hydrogen Fuel Cell Market by Value, 2024-2034 (US$ Mn, AGR (%))
Figure 87 Denmark Hydrogen Fuel Cell Market by Value, 2024-2034 (US$ Mn, AGR (%))
Figure 88 Rest of Europe Hydrogen Fuel Cell Market by Value, 2024-2034 (US$ Mn, AGR (%))
Figure 89 Asia-Pacific Hydrogen Fuel Cell Market Attractiveness Index
Figure 90 Asia-Pacific Hydrogen Fuel Cell Market by Region, 2024, 2029 & 2034 (US$ Million)
Figure 91 Asia-Pacific Hydrogen Fuel Cell Market by Value, 2024-2034 (US$ Mn, AGR (%))
Figure 92 Asia-Pacific Hydrogen Fuel Cell Market by Country, 2024-2034 (US$ Mn, AGR (%))
Figure 93 Asia-Pacific Hydrogen Fuel Cell Market Share Forecast by Country, 2024 & 2034 (%)
Figure 94 Asia-Pacific Hydrogen Fuel Cell Market by Application, 2024-2034 (US$ Mn, AGR (%))
Figure 95 Asia-Pacific Hydrogen Fuel Cell Market Share Forecast Application, 2024 & 2034 (%)
Figure 96 Asia-Pacific Hydrogen Fuel Cell Market by Type, 2024-2034 (US$ Mn, AGR (%))
Figure 97 Asia-Pacific Hydrogen Fuel Cell Market Share Forecast by Type, 2024 & 2034 (%)
Figure 98 Asia-Pacific Hydrogen Fuel Cell Market by End-User, 2024-2034 (US$ Mn, AGR (%))
Figure 99 Asia-Pacific Hydrogen Fuel Cell Market Share Forecast by End-User, 2024 & 2034 (%)
Figure 100 China Hydrogen Fuel Cell Market by Value, 2024-2034 (US$ Mn, AGR (%))
Figure 101 India Hydrogen Fuel Cell Market by Value, 2024-2034 (US$ Mn, AGR (%))
Figure 102 Japan Hydrogen Fuel Cell Market by Value, 2024-2034 (US$ Mn, AGR (%))
Figure 103 South Korea Hydrogen Fuel Cell Market by Value, 2024-2034 (US$ Mn, AGR (%))
Figure 104 Australia Hydrogen Fuel Cell Market by Value, 2024-2034 (US$ Mn, AGR (%))
Figure 105 Rest of Asia-Pacific Hydrogen Fuel Cell Market by Value, 2024-2034 (US$ Mn, AGR (%))
Figure 106 Middle East and Africa Hydrogen Fuel Cell Market Attractiveness Index
Figure 107 Middle East and Africa Hydrogen Fuel Cell Market by Region, 2024, 2029 & 2034 (US$ Million)
Figure 108 Middle East & Africa Hydrogen Fuel Cell Market by Value, 2024-2034 (US$ Mn, AGR (%))
Figure 109 Middle East & Africa Hydrogen Fuel Cell Market by Country, 2024-2034 (US$ Mn, AGR (%))
Figure 110 Middle East and Africa Hydrogen Fuel Cell Market Share Forecast by Country, 2024 & 2034 (%)
Figure 111 Middle East & Africa Hydrogen Fuel Cell Market by Application, 2024-2034 (US$ Mn, AGR (%))
Figure 112 Middle East and Africa Hydrogen Fuel Cell Market Share Forecast Application, 2024 & 2034 (%)
Figure 113 Middle East & Africa Hydrogen Fuel Cell Market by Type, 2024-2034 (US$ Mn, AGR (%))
Figure 114 Middle East and Africa Hydrogen Fuel Cell Market Share Forecast by Type, 2024 & 2034 (%)
Figure 115 Middle East & Africa Hydrogen Fuel Cell Market by End-User, 2024-2034 (US$ Mn, AGR (%))
Figure 116 Middle East and Africa Hydrogen Fuel Cell Market Share Forecast by End-User, 2024 & 2034 (%)
Figure 117 GCC Hydrogen Fuel Cell Market by Value, 2024-2034 (US$ Mn, AGR (%))
Figure 118 South Africa Hydrogen Fuel Cell Market by Value, 2024-2034 (US$ Mn, AGR (%))
Figure 119 Rest of Middle East & Africa Hydrogen Fuel Cell Market by Value, 2024-2034 (US$ Mn, AGR (%))
Figure 120 Latin America Hydrogen Fuel Cell Market Attractiveness Index
Figure 121 Latin America Hydrogen Fuel Cell Market by Region, 2024, 2029 & 2034 (US$ Million)
Figure 122 Latin America Hydrogen Fuel Cell Market by Value, 2024-2034 (US$ Mn, AGR (%))
Figure 123 Latin America Hydrogen Fuel Cell Market by Country, 2024-2034 (US$ Mn, AGR (%))
Figure 124 Latin America Hydrogen Fuel Cell Market Share Forecast by Country, 2024 & 2034 (%)
Figure 125 Latin America Hydrogen Fuel Cell Market by Application, 2024-2034 (US$ Mn, AGR (%))
Figure 126 Latin America Hydrogen Fuel Cell Market Share Forecast Application, 2024 & 2034 (%)
Figure 127 Latin America Hydrogen Fuel Cell Market by Type, 2024-2034 (US$ Mn, AGR (%))
Figure 128 Latin America Hydrogen Fuel Cell Market Share Forecast by Type, 2024 & 2034 (%)
Figure 129 Latin America Hydrogen Fuel Cell Market by End-User, 2024-2034 (US$ Mn, AGR (%))
Figure 130 Latin America Hydrogen Fuel Cell Market Share Forecast by End-User, 2024 & 2034 (%)
Figure 131 Brazil Hydrogen Fuel Cell Market by Value, 2024-2034 (US$ Mn, AGR (%))
Figure 132 Mexico Hydrogen Fuel Cell Market by Value, 2024-2034 (US$ Mn, AGR (%))
Figure 133 Rest of Latin America Hydrogen Fuel Cell Market by Value, 2024-2034 (US$ Mn, AGR (%))
Figure 134 Hydrogen Fuel Cell Market: Company Share, 2023
Figure 135 Ballard Power Systems Inc.: Net Revenue, 2019-2023 (US$ Million, AGR%)
Figure 136 Ballard Power Systems Inc.: R&D, 2019-2023 (US$ Million, AGR%)
Figure 137 Ballard Power Systems Inc.: Regional Revenue Share, 2023 (%)
Figure 138 Toyota Motor Corporation.: Net Revenue, 2019-2023 (US$ Million, AGR%)
Figure 139 Toyota Motor Corporation.: R&D, 2019-2023 (US$ Million, AGR%)
Figure 140 Toyota Motor Corporation.: Regional Revenue Share, 2023 (%)
Figure 141 Toyota Motor Corporation.: Business Segment Revenue Share, 2023 (%)
Figure 142 Plug Power Inc..: Net Revenue, 2019-2023 (US$ Million, AGR%)
Figure 143 Plug Power Inc..: R&D, 2019-2023 (US$ Million, AGR%)
Figure 144 Plug Power Inc.: Regional Revenue Share, 2023 (%)
Figure 145 Air Liquide S.A..: Net Revenue, 2019-2023 (US$ Million, AGR%)
Figure 146 Air Liquide S.A..: R&D, 2019-2023 (US$ Million, AGR%)
Figure 147 Air Liquide S.A..: Regional Revenue Share, 2023 (%)
Figure 148 Air Liquide S.A..: Business Segment Revenue Share, 2023 (%)
Figure 149 Nikola Corporation.: Net Revenue, 2019-2023 (US$ Million, AGR%)
Figure 150 Nikola Corporation.: R&D, 2019-2023 (US$ Million, AGR%)
Figure 151 Hyundai Motor Company.: Net Revenue, 2019-2023 (US$ Million, AGR%)
Figure 152 Hyundai Motor Company.: R&D, 2019-2023 (US$ Million, AGR%)
Figure 153 Hyundai Motor Company.: Regional Revenue Share, 2023 (%)
Figure 154 Hyundai Motor Company.: Business Segment Revenue Share, 2023 (%)
Figure 155 Mitsubishi Heavy Industries, Ltd.: Net Revenue, 2019-2023 (US$ Million, AGR%)
Figure 156 Mitsubishi Heavy Industries, Ltd.: R&D, 2019-2023 (US$ Million, AGR%)
Figure 157 Mitsubishi Heavy Industries, Ltd.: Regional Revenue Share, 2023 (%)
Figure 158 Mitsubishi Heavy Industries, Ltd.: Business Segment Revenue Share, 2023 (%)
Figure 159 Nel ASA.: Net Revenue, 2019-2023 (US$ Million, AGR%)
Figure 160 Nel ASA.: R&D, 2019-2023 (US$ Million, AGR%)
Figure 161 Nel ASA.: Regional Revenue Share, 2023 (%)
Figure 162 Nel ASA.: Business Segment Revenue Share, 2023 (%)
Figure 163 Cummins Inc.: Net Revenue, 2019-2023 (US$ Million, AGR%)
Figure 164 Cummins Inc.: R&D, 2019-2023 (US$ Million, AGR%)
Figure 165 Toshiba Energy Systems & Solutions Corporation.: Net Revenue, 2019-2023 (US$ Million, AGR%)
Figure 166 Toshiba Energy Systems & Solutions Corporation.: R&D, 2019-2023 (US$ Million, AGR%)
Figure 167 Toshiba Energy Systems & Solutions Corporation.: Regional Revenue Share, 2023 (%)
Figure 168 Toshiba Energy Systems & Solutions Corporation.: Business Segment Revenue Share, 2023 (%)
Figure 169 Aisin Corporation.: Net Revenue, 2019-2023 (US$ Million, AGR%)
Figure 170 Aisin Corporation.: R&D, 2019-2023 (US$ Million, AGR%)
Figure 171 ITM Power plc.: Net Revenue, 2019-2023 (US$ Million, AGR%)
Figure 172 ITM Power plc.: R&D, 2019-2023 (US$ Million, AGR%)
Figure 173 ITM Power plc.: Regional Revenue Share, 2023 (%)
Figure 174 ITM Power plc.: Business Segment Revenue Share, 2023 (%)
Figure 175 Panasonic Holdings Corporation.: Net Revenue, 2019-2023 (US$ Million, AGR%)
Figure 176 Panasonic Holdings Corporation.: R&D, 2019-2023 (US$ Million, AGR%)
Figure 177 Panasonic Holdings Corporation.: Regional Revenue Share, 2023 (%)
Figure 178 Panasonic Holdings Corporation.: Business Segment Revenue Share, 2023 (%)
Figure 179 Bloom Energy.: Net Revenue, 2019-2023 (US$ Million, AGR%)
Figure 180 Bloom Energy.: R&D, 2019-2023 (US$ Million, AGR%)
Figure 181 Bloom Energy.: Business Segment Revenue Share, 2023 (%)
Figure 182 Fuel Cell Energy, Inc..: Net Revenue, 2019-2023 (US$ Million, AGR%)
Figure 183 Fuel Cell Energy, Inc..: R&D, 2019-2023 (US$ Million, AGR%)
Figure 184 Fuel Cell Energy, Inc..: Regional Revenue Share, 2023 (%)
ページTOPに戻る
よくあるご質問
Visiongain社はどのような調査会社ですか?
英国の調査会社ヴィジョンゲイン社(Visiongain)は、通信とエネルギーのほか、自動車や化学・医薬品、金属など、広範な市場を対象に調査を行っています。自動車市場については、市場全般に関する調査のほ... もっと見る
調査レポートの納品までの日数はどの程度ですか?
在庫のあるものは速納となりますが、平均的には 3-4日と見て下さい。
但し、一部の調査レポートでは、発注を受けた段階で内容更新をして納品をする場合もあります。
発注をする前のお問合せをお願いします。
注文の手続きはどのようになっていますか?
1)お客様からの御問い合わせをいただきます。
2)見積書やサンプルの提示をいたします。
3)お客様指定、もしくは弊社の発注書をメール添付にて発送してください。
4)データリソース社からレポート発行元の調査会社へ納品手配します。
5) 調査会社からお客様へ納品されます。最近は、pdfにてのメール納品が大半です。
お支払方法の方法はどのようになっていますか?
納品と同時にデータリソース社よりお客様へ請求書(必要に応じて納品書も)を発送いたします。
お客様よりデータリソース社へ(通常は円払い)の御振り込みをお願いします。
請求書は、納品日の日付で発行しますので、翌月最終営業日までの当社指定口座への振込みをお願いします。振込み手数料は御社負担にてお願いします。
お客様の御支払い条件が60日以上の場合は御相談ください。
尚、初めてのお取引先や個人の場合、前払いをお願いすることもあります。ご了承のほど、お願いします。
データリソース社はどのような会社ですか?
当社は、世界各国の主要調査会社・レポート出版社と提携し、世界各国の市場調査レポートや技術動向レポートなどを日本国内の企業・公官庁及び教育研究機関に提供しております。
世界各国の「市場・技術・法規制などの」実情を調査・収集される時には、データリソース社にご相談ください。
お客様の御要望にあったデータや情報を抽出する為のレポート紹介や調査のアドバイスも致します。
|
|

