リチウムイオン電池リサイクル市場レポート:2024-2034
Lithium-ion Battery Recycling Market Report 2024-2034
レポート詳細
リチウムイオン電池リサイクル市場レポート 2024-2034年 :本レポートは、業界とその根底にあるダイナミクスをより良く理解したい場合、新たな収益ポケットを目指している大手企業にと... もっと見る
※上記価格は部署ライセンス(Departmental licence)価格です。
その他の価格についてはデータリソースまでお問合せください。
日本語のページは自動翻訳を利用し作成しています。
実際のレポートは英文のみでご納品いたします。
サマリー
レポート詳細
リチウムイオン電池リサイクル市場レポート 2024-2034年:本レポートは、業界とその根底にあるダイナミクスをより良く理解したい場合、新たな収益ポケットを目指している大手企業にとって貴重なものとなるでしょう。異業種への進出や新規地域での既存事業の拡大を目指す企業にも有用です。
高まる環境への懸念と規制圧力
リチウムイオン電池の廃棄とリサイクルに関連する環境問題への懸念から、政府や規制機関は電池のリサイクルを促進し、環境汚染を減らすために、より厳しい規制や政策を実施している。欧州連合や北米など環境規制が厳しい地域では、メーカーやリサイクル業者はリチウムイオン電池のリサイクル目標や基準を守ることが求められている。さらに、欧州電池指令や米国電池リサイクル法などのイニシアチブは、電池リサイクルを奨励し、使用済み電池の適切な廃棄とリサイクルを保証するために、電池バリューチェーン全体の利害関係者に責任を課しています。
使用済みバッテリーの保管と輸送に関する安全問題
リチウムイオン電池のリサイクル業界における重要な市場抑制要因は、使用済み電池の保管と輸送に関連する安全性の懸念である。電気自動車や携帯電子機器の急増によってリチウムイオン電池の需要が拡大し続ける中、リサイクルを必要とする使用済み電池の量も増加している。安全性の課題は、主にリチウムイオン電池の化学組成と、取り扱いを誤ると起こりうるリスクに起因する。
リチウムイオン電池には揮発性物質が含まれており、保管や輸送の際に適切に取り扱われないと、火災や有害物質の漏出といった重大な安全上のリスクを引き起こす可能性がある。これらのバッテリー内の電解液は可燃性であり、バッテリーの構造的完全性が損なわれると、オーバーヒートや燃焼を引き起こす連鎖反応である熱暴走につながる可能性があります。
市場調査レポートを購入する前にすべき質問とは?
-
リチウムイオン電池のリサイクル市場はどのように進化しているのか?
-
何がリチウムイオン電池リサイクル市場を促進し、抑制しているのか?
-
リチウムイオン電池リサイクルの各サブマーケットは予測期間中にどのように成長し、2034年にはどれくらいの売上を占めるようになるのか?
-
2024年から2034年にかけて、リチウムイオン電池リサイクルの各サブマーケットの市場シェアはどのように推移するのか?
-
2024年から2034年にかけて、市場全体を牽引する主な要因は何か?
-
主要なリチウムイオン電池リサイクル市場は、マクロ経済の動きに大枠で追随するのか、それとも個々の国の市場が他を凌駕するのか。
-
2034年までに各国市場のシェアはどのように変化し、どの地域が2034年の市場をリードするのか。
-
主要プレーヤーと予測期間中の見通しは?
-
これらの大手企業のリチウムイオン電池リサイクル・プロジェクトとは?
-
2024年から2034年の間に、業界はどのように発展するのか?リチウムイオン電池のリサイクルプロジェクトは、現在、そして今後10年間でどのような影響を及ぼすのか?
-
リチウムイオン電池のリサイクル市場をさらに拡大するためには、製品の商品化がより必要なのでしょうか?
-
リチウムイオンバッテリーのリサイクル市場はどこへ向かっているのか。
-
新商品や新サービスに最適な投資方法とは?
-
企業を新たな成長軌道に乗せ、C-suiteに移行させるための重要な展望とは?
リチウムイオン電池のリサイクル市場が、現在、そして今後10年間でどのような影響を受けるかを知る必要がある:
-
119の表と155の図表で構成される364ページのレポート。
-
このレポートでは、業界の主要な収益分野に焦点を当てているため、今すぐそこにターゲットを絞ることができます。
-
世界、地域、国の売上高と成長に関する詳細な分析が含まれている。
-
競合他社が成功した主なトレンド、変化、収益予測をハイライトします。
本レポートは、リチウムイオン電池リサイクル市場が今後10年間、COVID-19の景気後退と好転の変動に合わせてどのように発展するかを今でお伝えします。この市場は、過去10年間のどの時点よりも今が重要である。
本レポートは、COVID-19のバリエーションと経済データを提供します。
-
2034年までの収益予測に加え、最近の実績、成長率、市場シェアも提供している。
-
ビジネスの展望や展開など、独自の分析が掲載されている。
-
定性的分析(市場ダイナミクス、促進要因、機会、阻害要因、課題を含む)、コスト構造、リチウムイオン電池リサイクル価格上昇の影響、最近の動向をご覧いただけます。
本レポートには、COVID-19が業界と貴社にどのような影響を与えるかについてのデータ分析と貴重な洞察が含まれている。本レポートでは、COVID-19の4つの回収パターンとその影響、すなわち「V」、「L」、「W」、「U」について論じている。
レポート対象セグメント
ソース別市場セグメント
-
コンシューマーエレクトロニクス
-
電気自動車
-
インダストリアル
リサイクル工程別市場セグメント
産業別市場セグメント
-
自動車
-
エレクトロニクス
-
インダストリアル
-
パワー
-
その他の業種
タイプ別市場セグメント
-
リチウムニッケルマンガンコバルト(Li-NMC)
-
リン酸鉄リチウム(LFP)
-
リチウムマンガン酸化物(LMO)
-
チタン酸リチウム(LTO)
-
リチウムニッケルコバルトアルミニウム酸化物(NCA)
-
その他のタイプ
世界市場全体とセグメント別の収益予測に加え、4つの地域と20の主要国市場の収益予測も掲載しています:
北米
欧州
-
ドイツ
-
英国
-
フランス
-
ハンガリー
-
ポーランド
-
その他の欧州
アジア太平洋
-
中国
-
日本
-
インド
-
オーストラリア
-
韓国
-
その他のアジア太平洋
ラテンアメリカ
中東・アフリカ
また、2024年から2034年までのリチウムイオン電池リサイクル市場の主要企業のプロファイルと、これらの企業の事業のこのセグメントに焦点を当てています。
報告書に掲載されている主要企業
-
Accurec Recycling GmbH
-
American Battery Technology Company
-
Battery Recycling Made Easy
-
Contemporary Amperex Technology Co. Limited (CATL)
-
Duesenfeld Gmbh
-
Ecobat
-
Envirostream Australia Pty Ltd
-
Fortum Oyj
-
Glencore plc
-
Li-Cycle Corp.
-
RecycLiCo Battery Materials Inc
-
Redwood Materials, Inc.
-
SMC Recycling Inc.
-
Stena Recycling
-
The International Metals Reclamation Company
リチウムイオン電池リサイクル市場の2024年から2034年までの世界全体の売上高(金額ベース)は、2024年に30億米ドルを突破すると弊社は算出した。2034年まで力強い収益成長を予測。当社の調査では、最も大きな可能性を秘めた企業を特定しています。彼らの能力、進歩、商業的展望を発見し、あなたが一歩先を行くのを支援します。
2024年から2034年までのリチウムイオン電池リサイクル市場」レポートはどのようにお役に立ちますか?
要約すると、360ページを超えるレポートでは、以下のような知識を得ることができる:
-
リチウムイオン電池リサイクル市場の2034年までの収益予測、2024年から2034年までの市場、供給源、リサイクルプロセス、業種および種類の予測、それぞれの予測を世界レベルおよび地域レベルで – 業界の見通しを発見し、最も収益性の高い場所を見つける 投資と収益。
-
4 つの地域市場および 20 の主要国内市場における 2034 年までの収益予測 – 北米、ヨーロッパ、アジア太平洋、ラテンアメリカ、中東およびアフリカにおけるリチウムイオン電池リサイクル市場の 2024 年から 2034 年の予測をご覧ください。 また、米国、カナダ、ブラジル、ドイツ、フランス、英国、イタリア、中国、インド、日本、オーストラリアなどの主要経済国の市場も予測されています。
-
確立された企業と市場への参入を目指す企業の見通し – 2024年から2034年までのリチウムイオン電池リサイクル市場に関与する主要企業15社の企業概要を含む。
独自の予測による定量的・定性的分析をご覧ください。私たちのレポートだけに含まれる情報を入手し、貴重なビジネスインテリジェンスで情報を得ることができます。
他にはない情報
私たちの新しいレポートがあれば、知識に遅れをとったり、チャンスを逃したりする可能性が低くなります。Visiongainの調査レポートが貴社の調査、分析、意思決定にどのように役立つかをご覧ください。Visiongainの調査は、リチウムイオン電池リサイクル市場、2024年から2034年、市場をリードする企業の商業分析を必要とするすべての人のためのものです。データ、トレンド、予測をご覧いただけます。
ページTOPに戻る
目次
目次
1 レポート概要
1.1 研究の目的
1.2 リチウムイオン電池リサイクル市場の紹介
1.3 本レポートの内容
1.4 本レポートを読むべき理由
1.5 本分析レポートが回答する主な質問
1.6 本レポートは誰のためのものか?
1.7 方法論
1.7.1 市場の定義
1.7.2 市場評価・予測手法
1.7.3 データの検証
1.7.3.1 一次調査
1.7.3.2 セカンダリーリサーチ
1.8 よくある質問(FAQ)
1.9 Visiongainの関連レポート
1.10 Visiongainについて
2 エグゼクティブ・サマリー
3 市場概要
3.1 主要な調査結果
3.2 市場ダイナミクス
3.2.1 市場促進要因
3.2.1.1 リチウムイオン電池リサイクル業界に新たな可能性をもたらす電気自動車需要の増加
3.2.1.2 リサイクル製品・材料に対する需要の高まり
3.2.1.3 工業化と消費者需要の増加を伴う新興市場への地理的拡大が市場全体の成長に貢献
3.2.2 市場抑制要因
3.2.2.1 使用済み電池の保管・輸送に関する安全問題
3.2.2.2 リサイクルコストの高さと技術の不足
3.2.2.3 環境と安全への懸念が市場成長を妨げる
3.2.3 市場機会
3.2.3.1 電池リサイクルを奨励する補助金
3.2.3.2 価格低下によるリチウムイオン電池の採用増加
3.2.3.3 政府の新しい規則と奨励金によりリチウムイオン電池リサイクル産業の生産が強化されている
3.3 ポーターのファイブフォース分析
3.3.1 サプライヤーの交渉力(中〜高)
3.3.2 買い手の交渉力(高)
3.3.3 競争力(中~高)
3.3.4 代替品による脅威(中)
3.3.5 新規参入の脅威(低)
3.4 COVID-19の影響分析
3.4.1 "V字型回復"
3.4.2 "U字型回復"
3.4.3 "W字型回復"
3.4.4 "L字型回復"
3.5 PEST分析
4 リチウムイオン電池リサイクル市場分析:電池供給源別
4.1 主要調査結果
4.2 電池供給源セグメント 市場魅力度指数
4.3 電池供給源別リチウムイオン電池リサイクル市場規模の推定と予測
4.4 コンシューマーエレクトロニクス
4.4.1 2024〜2034年の地域別市場規模(US$ Billion)
4.4.2 地域別市場シェア、2024年・2034年(%)
4.5 電気自動車
4.5.1 2024〜2034年の地域別市場規模(US$ Billion)
4.5.2 地域別市場シェア、2024年・2034年(%)
4.6 産業用
4.6.1 2024〜2034年の地域別市場規模(US$ Billion)
4.6.2 地域別市場シェア、2024年・2034年(%)
5 リチウムイオン電池リサイクル市場分析:リサイクルプロセス別
5.1 主要調査結果
5.2 再資源化プロセスセグメント 市場魅力度指数
5.3 リチウムイオン電池のリサイクル工程別市場規模の推定と予測
5.4 機械
5.4.1 2024〜2034年の地域別市場規模(US$ Billion)
5.4.2 地域別市場シェア、2024年・2034年(%)
5.5 乾式製錬
5.5.1 2024年~2034年の地域別市場規模(US$ Billion)
5.5.2 地域別市場シェア、2024年・2034年(%)
5.6 炭化水素冶金
5.6.1 2024年~2034年の地域別市場規模(US$ Billion)
5.6.2 地域別市場シェア、2024年・2034年(%)
5.7 直接回収
5.7.1 2024〜2034年の地域別市場規模(US$ Billion)
5.7.2 地域別市場シェア、2024年・2034年(%)
6 リチウムイオン電池リサイクル市場分析:産業分野別
6.1 主要調査結果
6.2 産業分野セグメント: 市場魅力度指数
6.3 産業分野別リチウムイオン電池リサイクル市場規模の推定と予測
6.4 自動車
6.4.1 2024〜2034年の地域別市場規模(US$ Billion)
6.4.2 地域別市場シェア、2024年・2034年(%)
6.5 エレクトロニクス
6.5.1 2024〜2034年の地域別市場規模(US$ Billion)
6.5.2 地域別市場シェア、2024年・2034年(%)
6.6 産業
6.6.1 2024年~2034年の地域別市場規模(US$ Billion)
6.6.2 地域別市場シェア、2024年・2034年(%)
6.7 電力
6.7.1 2024年~2034年の地域別市場規模(US$ Billion)
6.7.2 地域別市場シェア、2024年・2034年(%)
6.8 その他の産業分野
6.8.1 2024〜2034年の地域別市場規模(US$ Billion)
6.8.2 地域別市場シェア、2024年・2034年(%)
7 リチウムイオン電池リサイクル市場分析:タイプ別
7.1 主要な調査結果
7.2 タイプ別セグメント 市場魅力度指数
7.3 リチウムイオン電池リサイクルのタイプ別市場規模推定と予測
7.4 リチウムニッケルマンガンコバルト(Li-NMC)
7.4.1 2024~2034年の地域別市場規模(US$ Billion)
7.4.2 地域別市場シェア、2024年・2034年(%)
7.5 リン酸鉄リチウム(LFP)
7.5.1 2024~2034年の地域別市場規模(US$ Billion)
7.5.2 地域別市場シェア、2024年・2034年(%)
7.6 酸化リチウムマンガン(LMO)
7.6.1 2024~2034年の地域別市場規模(US$ Billion)
7.6.2 地域別市場シェア、2024年・2034年(%)
7.7 チタン酸リチウム酸化物(LTO)
7.7.1 2024年~2034年の地域別市場規模(US$ Billion)
7.7.2 地域別市場シェア、2024年・2034年(%)
7.8 リチウムニッケルコバルトアルミニウム酸化物(NCA)
7.8.1 2024~2034年の地域別市場規模(US$ Billion)
7.8.2 地域別市場シェア、2024年・2034年(%)
7.9 その他のタイプ
7.9.1 2024〜2034年の地域別市場規模(US$ Billion)
7.9.2 地域別市場シェア、2024年・2034年(%)
8 リチウムイオン電池リサイクル市場分析:地域別
8.1 主要な調査結果
8.2 地域別市場規模の推定と予測
9 北米のリチウムイオン電池リサイクル市場分析
9.1 主要な調査結果
9.2 北米のリチウムイオン電池リサイクル市場魅力度指数
9.3 北米のリチウムイオン電池リサイクル国別市場、2024年、2029年、2034年(US$ Billion)
9.4 北米のリチウムイオン電池リサイクル市場規模推定と予測
9.5 北米のリチウムイオン電池リサイクル市場規模推定と予測:国別
9.6 北米のリチウムイオン電池リサイクル市場規模推定と予測:電池供給源別
9.7 北米のリチウムイオン電池リサイクル市場規模推定と予測:リサイクル工程別
9.8 北米のリチウムイオン電池リサイクル市場規模推定と予測:産業分野別
9.9 北米のリチウムイオン電池リサイクル市場規模推定と予測:タイプ別
9.10 アメリカのリチウムイオン電池リサイクル市場分析
9.11 カナダのリチウムイオン電池リサイクル市場分析
10 欧州のリチウムイオン電池リサイクル市場分析
10.1 主要な調査結果
10.2 欧州リチウムイオン電池リサイクル市場魅力度指数
10.3 欧州のリチウムイオン電池リサイクル国別市場、2024年、2029年、2034年(US$ Billion)
10.4 欧州のリチウムイオン電池リサイクル市場規模推定と予測
10.5 欧州のリチウムイオン電池リサイクル市場規模推定と予測:国別
10.6 欧州のリチウムイオン電池リサイクル市場規模推定と予測:電池供給源別
10.7 欧州のリチウムイオン電池リサイクル市場規模推定と予測:リサイクル工程別
10.8 欧州のリチウムイオン電池リサイクル市場規模推定と予測:産業分野別
10.9 欧州のリチウムイオン電池リサイクル市場規模推定と予測:タイプ別
10.10 ドイツのリチウムイオン電池リサイクル市場分析
10.11 イギリスのリチウムイオン電池リサイクル市場分析
10.12 フランスのリチウムイオン電池リサイクル市場分析
10.13 ハンガリーのリチウムイオン電池リサイクル市場分析
10.14 ポーランドのリチウムイオン電池リサイクル市場分析
10.15 その他の欧州のリチウムイオン電池リサイクル市場分析
11 アジア太平洋地域のリチウムイオン電池リサイクル市場分析
11.1 主要な調査結果
11.2 アジア太平洋地域のリチウムイオン電池リサイクル市場魅力度指数
11.3 アジア太平洋地域のリチウムイオン電池リサイクル国別市場、2024年、2029年、2034年(US$ Billion)
11.4 アジア太平洋地域のリチウムイオン電池リサイクル市場規模推定と予測
11.5 アジア太平洋地域のリチウムイオン電池リサイクル市場規模推定と予測:国別
11.6 アジア太平洋地域のリチウムイオン電池リサイクル市場規模推定と予測:電池供給源別
11.7 アジア太平洋地域のリチウムイオン電池リサイクル市場規模推定と予測:リサイクル工程別
11.8 アジア太平洋地域のリチウムイオン電池リサイクル市場規模推定と予測:産業分野別
11.9 アジア太平洋地域のリチウムイオン電池リサイクル市場規模推定と予測:タイプ別
11.10 中国のリチウムイオン電池リサイクル市場分析
11.11 インドのリチウムイオン電池リサイクル市場分析
11.12 日本のリチウムイオン電池リサイクル市場分析
11.13 韓国のリチウムイオン電池リサイクル市場分析
11.14 オーストラリアのリチウムイオン電池リサイクル市場分析
11.15 その他のアジア太平洋地域のリチウムイオン電池リサイクル市場分析
12 中東・アフリカのリチウムイオン電池リサイクル市場分析
12.1 主要な調査結果
12.2 中東・アフリカのリチウムイオン電池リサイクル市場魅力度指数
12.3 中東・アフリカのリチウムイオン電池リサイクル国別市場、2024年、2029年、2034年(US$ Billion)
12.4 中東・アフリカのリチウムイオン電池リサイクル市場規模推定と予測
12.5 中東・アフリカのリチウムイオン電池リサイクル市場規模推定と予測:国別
12.6 中東・アフリカのリチウムイオン電池リサイクル市場規模推定と予測:電池供給源別
12.7 中東・アフリカのリチウムイオン電池リサイクル市場規模推定と予測:再生工程別
12.8 中東・アフリカのリチウムイオン電池リサイクル市場規模推定と予測:産業分野別
12.9 中東・アフリカのリチウムイオン電池リサイクル市場規模推定と予測:タイプ別
12.10 GCCのリチウムイオン電池リサイクル市場分析
12.11 南アフリカのリチウムイオン電池リサイクル市場分析
12.12 その他の中東・アフリカ地域のリチウムイオン電池リサイクル市場分析
13 ラテンアメリカのリチウムイオン電池リサイクル市場分析
13.1 主要な調査結果
13.2 ラテンアメリカのリチウムイオン電池リサイクル市場魅力度指数
13.3 ラテンアメリカのリチウムイオン電池リサイクル国別市場、2024年、2029年、2034年(US$ Billion
13.4 ラテンアメリカのリチウムイオン電池リサイクル市場規模推定と予測
13.5 ラテンアメリカのリチウムイオン電池リサイクル市場規模推定と予測:国別
13.6 ラテンアメリカのリチウムイオン電池リサイクル市場規模推定と予測:電池供給源別
13.7 ラテンアメリカのリチウムイオン電池リサイクル市場規模推定と予測:リサイクル工程別
13.8 ラテンアメリカのリチウムイオン電池リサイクル市場規模推定と予測:産業分野別
13.9 ラテンアメリカのリチウムイオン電池リサイクル市場規模推定と予測:タイプ別
13.10 ブラジルのリチウムイオン電池リサイクル市場分析
13.11 メキシコのリチウムイオン電池リサイクル市場分析
13.12 その他のラテンアメリカのリチウムイオン電池リサイクル市場分析
14社のプロファイル
14.1 競争環境、2023年
14.2 戦略的展望
14.3 Glencore plc
14.3.1 会社概要
14.3.2 会社概要
14.3.3 財務分析
14.3.3.1 純収入、2018年~2022年
14.3.3.2 地域別収益シェア、2022年(%)
14.3.3.3 事業セグメント別売上シェア、2022年(%)
14.3.4 製品ベンチマーク
14.3.5 戦略的展望
14.4 Contemporary Amperex Technology Co. Limited (CATL)
14.4.1 会社概要
14.4.2 会社概要
14.4.3 製品ベンチマーク
14.4.4 戦略的展望
14.5 RecycLiCo Battery Materials Inc
14.5.1 会社概要
14.5.2 会社概要
14.5.3 製品ベンチマーク
14.5.4 戦略的展望
14.6 American Battery Technology Company
14.6.1 会社概要
14.6.2 会社概要
14.6.3 製品ベンチマーク
14.6.4 戦略的展望
14.7 ACCUREC RECYCLING GMBH
14.7.1 会社概要
14.7.2 会社概要
14.7.3 製品ベンチマーク
14.8 Ecobat
14.8.1 会社概要
14.8.2 会社概要
14.8.3 製品ベンチマーク
14.8.4 戦略的展望
14.9 Fortum Oyj
14.9.1 会社概要
14.9.2 会社概要
14.9.3 製品ベンチマーク
14.9.4 戦略的展望
14.10 The International Metals Reclamation Company
14.10.1 会社概要
14.10.2 会社概要
14.10.3 製品ベンチマーク
14.11 Redwood Materials, Inc.
14.11.1 会社概要
14.11.2 会社概要
14.11.3 製品ベンチマーク
14.11.4 戦略的展望
14.12 Stena Recycling
14.12.1 会社概要
14.12.2 会社概要
14.12.3 製品ベンチマーク
14.12.4 戦略的展望
14.13 Envirostream Australia Pty Ltd
14.13.1 会社概要
14.13.2 会社概要
14.13.3 製品ベンチマーク
14.13.4 戦略的展望
14.14 Battery Recycling Made Easy
14.14.1 会社概要
14.14.2 会社概要
14.14.3 製品ベンチマーク
14.15 Duesenfeld Gmbh
14.15.1 会社概要
14.15.2 会社概要
14.15.3 製品ベンチマーク
14.16 SMC Recycling Inc
14.16.1 会社概要
14.16.2 会社概要
14.16.3 製品ベンチマーク
14.17 Li-Cycle Corp.
14.17.1 会社概要
14.17.2 会社概要
14.17.3 財務分析
14.17.3.1 純収入、2018-2022年
14.17.3.2 売上高、2018-2022年
14.17.4 製品ベンチマーク
14.17.5 戦略的展望
15 結論と提言
15.1 Visiongainからの結びの言葉
15.2 市場プレイヤーへの提言
ページTOPに戻る
図表リスト
表の一覧
Table 1 Lithium-ion Battery Recycling Market Snapshot, 2024 & 2034 (US$ Billion, CAGR %)
Table 2 Lithium Battery Price
Table 3 Global Lithium-ion Battery Recycling Market by Region, 2024-2034 (US$ Bn, AGR (%), CAGR (%)) (V-Shaped Recovery Scenario)
Table 4 Global Lithium-ion Battery Recycling Market by Region, 2024-2034 (US$ Bn, AGR (%), CAGR (%)) (U-Shaped Recovery Scenario)
Table 5 Global Lithium-ion Battery Recycling Market by Region, 2024-2034 (US$ Bn, AGR (%), CAGR (%)) (W-Shaped Recovery Scenario)
Table 6 Global Lithium-ion Battery Recycling Market by Region, 2024-2034 (US$ Bn, AGR (%), CAGR (%)) (L-Shaped Recovery Scenario)
Table 7 Global Lithium-ion Battery Recycling Market by Source, 2024-2034 (US$ Bn, AGR (%), CAGR (%))
Table 8 Consumer Electronics Market by Region, 2024-2034 (US$ Bn, AGR (%), CAGR (%))
Table 9 Electric Vehicles Market by Region, 2024-2034 (US$ Bn, AGR (%), CAGR (%))
Table 10 Industrial Market by Region, 2024-2034 (US$ Bn, AGR (%), CAGR (%))
Table 11 Global Lithium-ion Battery Recycling Market by Recycling Process, 2024-2034 (US$ Bn, AGR (%), CAGR (%))
Table 12 Mechanical Market by Region, 2024-2034 (US$ Bn, AGR (%), CAGR (%))
Table 13 Pyrometallurgical Market by Region, 2024-2034 (US$ Bn, AGR (%), CAGR (%))
Table 14 Hydrometallurgical Market by Region, 2024-2034 (US$ Bn, AGR (%), CAGR (%))
Table 15 Direct Recovery Market by Region, 2024-2034 (US$ Bn, AGR (%), CAGR (%))
Table 16 Global Lithium-ion Battery Recycling Market by Industry Vertical, 2024-2034 (US$ Bn, AGR (%), CAGR (%))
Table 17 Automotive Market by Region, 2024-2034 (US$ Bn, AGR (%), CAGR (%))
Table 18 Electronics Market by Region, 2024-2034 (US$ Bn, AGR (%), CAGR (%))
Table 19 Industrial Market by Region, 2024-2034 (US$ Bn, AGR (%), CAGR (%))
Table 20 Power Market by Region, 2024-2034 (US$ Bn, AGR (%), CAGR (%))
Table 21 Other Industry Vertical Market by Region, 2024-2034 (US$ Bn, AGR (%), CAGR (%))
Table 22 Global Lithium-ion Battery Recycling Market by Type, 2024-2034 (US$ Bn, AGR (%), CAGR (%))
Table 23 Lithium-nickel Manganese Cobalt (Li-NMC) Market by Region, 2024-2034 (US$ Bn, AGR (%), CAGR (%))
Table 24 Lithium-iron Phosphate (LFP) Market by Region, 2024-2034 (US$ Bn, AGR (%), CAGR (%))
Table 25 Lithium-manganese Oxide (LMO) Market by Region, 2024-2034 (US$ Bn, AGR (%), CAGR (%))
Table 26 Lithium-titanate Oxide (LTO) Market by Region, 2024-2034 (US$ Bn, AGR (%), CAGR (%))
Table 27 Lithium-nickel Cobalt Aluminum Oxide (NCA) Market by Region, 2024-2034 (US$ Bn, AGR (%), CAGR (%))
Table 28 Other Types Market by Region, 2024-2034 (US$ Bn, AGR (%), CAGR (%))
Table 29 Global Lithium-ion Battery Recycling Market by Region, 2024-2034 (US$ Bn, AGR (%), CAGR (%))
Table 30 North America Lithium-ion Battery Recycling Market by Value, 2024-2034 (US$ Bn, AGR (%), CAGR (%))
Table 31 North America Lithium-ion Battery Recycling Market by Country, 2024-2034 (US$ Bn, AGR (%), CAGR (%))
Table 32 North America Lithium-ion Battery Recycling Market by Source, 2024-2034 (US$ Bn, AGR (%), CAGR (%))
Table 33 North America Lithium-ion Battery Recycling Market by Recycling Process, 2024-2034 (US$ Bn, AGR (%), CAGR (%))
Table 34 North America Lithium-ion Battery Recycling Market by Industry Vertical, 2024-2034 (US$ Bn, AGR (%), CAGR (%))
Table 35 North America Lithium-ion Battery Recycling Market by Type, 2024-2034 (US$ Bn, AGR (%), CAGR (%))
Table 36 US Lithium-ion Battery Recycling Market by Value, 2024-2034 (US$ Bn, AGR (%), CAGR (%))
Table 37 Canada Lithium-ion Battery Recycling Market by Value, 2024-2034 (US$ Bn, AGR (%), CAGR (%))
Table 38 Europe Lithium-ion Battery Recycling Market by Value, 2024-2034 (US$ Bn, AGR (%), CAGR (%))
Table 39 Europe Lithium-ion Battery Recycling Market by Country, 2024-2034 (US$ Bn, AGR (%), CAGR (%))
Table 40 Europe Lithium-ion Battery Recycling Market by Source, 2024-2034 (US$ Bn, AGR (%), CAGR (%))
Table 41 Europe Lithium-ion Battery Recycling Market by Recycling Process, 2024-2034 (US$ Bn, AGR (%), CAGR (%))
Table 42 Europe Lithium-ion Battery Recycling Market by Industry Vertical, 2024-2034 (US$ Bn, AGR (%), CAGR (%))
Table 43 Europe Lithium-ion Battery Recycling Market by Type, 2024-2034 (US$ Bn, AGR (%), CAGR (%))
Table 44 Germany Lithium-ion Battery Recycling Market by Value, 2024-2034 (US$ Bn, AGR (%), CAGR (%))
Table 45 UK Lithium-ion Battery Recycling Market by Value, 2024-2034 (US$ Bn, AGR (%), CAGR (%))
Table 46 France Lithium-ion Battery Recycling Market by Value, 2024-2034 (US$ Bn, AGR (%), CAGR (%))
Table 47 Hungary Lithium-ion Battery Recycling Market by Value, 2024-2034 (US$ Bn, AGR (%), CAGR (%))
Table 48 Poland Lithium-ion Battery Recycling Market by Value, 2024-2034 (US$ Bn, AGR (%), CAGR (%))
Table 49 Rest of Europe Lithium-ion Battery Recycling Market by Value, 2024-2034 (US$ Bn, AGR (%), CAGR (%))
Table 50 Asia-Pacific Lithium-ion Battery Recycling Market by Value, 2024-2034 (US$ Bn, AGR (%), CAGR (%))
Table 51 Asia-Pacific Lithium-ion Battery Recycling Market by Country, 2024-2034 (US$ Bn, AGR (%), CAGR (%))
Table 52 Asia-Pacific Lithium-ion Battery Recycling Market by Source, 2024-2034 (US$ Bn, AGR (%), CAGR (%))
Table 53 Asia-Pacific Lithium-ion Battery Recycling Market by Recycling Process, 2024-2034 (US$ Bn, AGR (%), CAGR (%))
Table 54 Asia-Pacific Lithium-ion Battery Recycling Market by Industry Vertical, 2024-2034 (US$ Bn, AGR (%), CAGR (%))
Table 55 Asia-Pacific Lithium-ion Battery Recycling Market by Type, 2024-2034 (US$ Bn, AGR (%), CAGR (%))
Table 56 China Lithium-ion Battery Recycling Market by Value, 2024-2034 (US$ Bn, AGR (%), CAGR (%))
Table 57 India Lithium-ion Battery Recycling Market by Value, 2024-2034 (US$ Bn, AGR (%), CAGR (%))
Table 58 Japan Lithium-ion Battery Recycling Market by Value, 2024-2034 (US$ Bn, AGR (%), CAGR (%))
Table 59 South Korea Lithium-ion Battery Recycling Market by Value, 2024-2034 (US$ Bn, AGR (%), CAGR (%))
Table 60 Australia Lithium-ion Battery Recycling Market by Value, 2024-2034 (US$ Bn, AGR (%), CAGR (%))
Table 61 Rest of Asia-Pacific Lithium-ion Battery Recycling Market by Value, 2024-2034 (US$ Bn, AGR (%), CAGR (%))
Table 62 Middle East & Africa Lithium-ion Battery Recycling Market by Value, 2024-2034 (US$ Bn, AGR (%), CAGR (%))
Table 63 Middle East & Africa Lithium-ion Battery Recycling Market by Country, 2024-2034 (US$ Bn, AGR (%), CAGR (%))
Table 64 Middle East & Africa Lithium-ion Battery Recycling Market by Source, 2024-2034 (US$ Bn, AGR (%), CAGR (%))
Table 65 Middle East & Africa Lithium-ion Battery Recycling Market by Recycling Process, 2024-2034 (US$ Bn, AGR (%), CAGR (%))
Table 66 Middle East & Africa Lithium-ion Battery Recycling Market by Industry Vertical, 2024-2034 (US$ Bn, AGR (%), CAGR (%))
Table 67 Middle East & Africa Lithium-ion Battery Recycling Market by Type, 2024-2034 (US$ Bn, AGR (%), CAGR (%))
Table 68 GCC Lithium-ion Battery Recycling Market by Value, 2024-2034 (US$ Bn, AGR (%), CAGR (%))
Table 69 South Africa Lithium-ion Battery Recycling Market by Value, 2024-2034 (US$ Bn, AGR (%), CAGR (%))
Table 70 Rest of Middle East & Africa Lithium-ion Battery Recycling Market by Value, 2024-2034 (US$ Bn, AGR (%), CAGR (%))
Table 71 Latin America Lithium-ion Battery Recycling Market by Value, 2024-2034 (US$ Bn, AGR (%), CAGR (%))
Table 72 Latin America Lithium-ion Battery Recycling Market by Country, 2024-2034 (US$ Bn, AGR (%), CAGR (%))
Table 73 Latin America Lithium-ion Battery Recycling Market by Source, 2024-2034 (US$ Bn, AGR (%), CAGR (%))
Table 74 Latin America Lithium-ion Battery Recycling Market by Recycling Process, 2024-2034 (US$ Bn, AGR (%), CAGR (%))
Table 75 Latin America Lithium-ion Battery Recycling Market by Industry Vertical, 2024-2034 (US$ Bn, AGR (%), CAGR (%))
Table 76 Latin America Lithium-ion Battery Recycling Market by Type, 2024-2034 (US$ Bn, AGR (%), CAGR (%))
Table 77 Brazil Lithium-ion Battery Recycling Market by Value, 2024-2034 (US$ Bn, AGR (%), CAGR (%))
Table 78 Mexico Lithium-ion Battery Recycling Market by Value, 2024-2034 (US$ Bn, AGR (%), CAGR (%))
Table 79 Rest of Latin America Lithium-ion Battery Recycling Market by Value, 2024-2034 (US$ Bn, AGR (%), CAGR (%))
Table 80 Ranking on bases of Number of Employee, 2023
Table 81 Strategic Outlook - Contract
Table 82 Glencore plc: Key Details, (CEO, HQ, Revenue, Founded, No. of Employees, Company Type, Website, Business Segment)
Table 83 Glencore plc: Product Benchmarking
Table 84 Glencore plc: Strategic Outlook
Table 85 Contemporary Amperex Technology Co. Limited (CATL): Key Details, (CEO, HQ, Revenue, Founded, No. of Employees, Company Type, Website, Business Segment)
Table 86 Contemporary Amperex Technology Co. Limited (CATL): Product Benchmarking
Table 87 Contemporary Amperex Technology Co. Limited (CATL): Strategic Outlook
Table 88 Recycles Battery Materials Inc: Key Details, (CEO, HQ, Revenue, Founded, No. of Employees, Company Type, Website, Business Segment)
Table 89 RecycLiCo Battery Materials Inc: Product Benchmarking
Table 90 RecycLiCo Battery Materials Inc: Strategic Outlook
Table 91 American Battery Technology Company: Key Details, (CEO, HQ, Revenue, Founded, No. of Employees, Company Type, Website, Business Segment)
Table 92 American Battery Technology Company: Product Benchmarking
Table 93 American Battery Technology Company: Strategic Outlook
Table 94 ACCUREC RECYCLING GMBH: Key Details, (CEO, HQ, Revenue, Founded, No. of Employees, Company Type, Website, Business Segment)
Table 95 ACCUREC RECYCLING GMBH: Product Benchmarking
Table 96 Ecobat: Key Details, (CEO, HQ, Revenue, Founded, No. of Employees, Company Type, Website, Business Segment)
Table 97 Ecobat: Product Benchmarking
Table 98 Ecobat: Strategic Outlook
Table 99 Fortum Oyj: Key Details, (CEO, HQ, Revenue, Founded, No. of Employees, Company Type, Website, Business Segment)
Table 100 Fortum Oyj: Product Benchmarking
Table 101 Fortum Oyj: Strategic Outlook
Table 102 The International Metals Reclamation Company: Key Details, (CEO, HQ, Revenue, Founded, No. of Employees, Company Type, Website, Business Segment)
Table 103 The International Metals Reclamation Company: Product Benchmarking
Table 104 Redwood Materials, Inc.: Key Details, (CEO, HQ, Revenue, Founded, No. of Employees, Company Type, Website, Business Segment)
Table 105 Redwood Materials, Inc.: Product Benchmarking
Table 106 Redwood Materials, Inc.: Strategic Outlook
Table 107 Stena Recycling: Key Details, (CEO, HQ, Revenue, Founded, No. of Employees, Company Type, Website, Business Segment)
Table 108 Stena Recycling: Product Benchmarking
Table 109 Stena Recycling: Strategic Outlook
Table 110 Envirostream Australia Pty Ltd: Key Details, (CEO, HQ, Revenue, Founded, No. of Employees, Company Type, Website, Business Segment)
Table 111 Envirostream Australia Pty Ltd: Product Benchmarking
Table 112 Envirostream Australia Pty Ltd: Strategic Outlook
Table 113 Battery Recycling Made Easy: Key Details, (CEO, HQ, Revenue, Founded, No. of Employees, Company Type, Website, Business Segment)
Table 114 Battery Recycling Made Easy: Product Benchmarking
Table 115 Duesenfeld Gmbh: Key Details, (CEO, HQ, Revenue, Founded, No. of Employees, Company Type, Website, Business Segment)
Table 116 Duesenfeld Gmbh: Product Benchmarking
Table 117 SMC Recycling Inc: Key Details, (CEO, HQ, Revenue, Founded, No. of Employees, Company Type, Website, Business Segment)
Table 118 SMC Recycling Inc: Product Benchmarking
Table 119 Li-Cycle Corp: Key Details, (CEO, HQ, Revenue, Founded, No. of Employees, Company Type, Website, Business Segment)
Table 120 Li-Cycle Corp: Product Benchmarking
Table 121 Li-Cycle Corp: Strategic Outlook
図の一覧
Figure 1 Lithium-ion Battery Recycling Market Segmentation
Figure 2 Lithium-ion Battery Recycling Market by Battery Source: Market Attractiveness Index
Figure 3 Lithium-ion Battery Recycling Market by Recycling Process: Market Attractiveness Index
Figure 4 Lithium-ion Battery Recycling Market by Industry Vertical: Market Attractiveness Index
Figure 5 Lithium-ion Battery Recycling Market by Type: Market Attractiveness Index
Figure 6 Lithium-ion Battery Recycling Market Attractiveness Index by Region
Figure 7 Lithium-ion Battery Recycling Market: Market Dynamics
Figure 8 Lithium-ion Battery Recycling Market: Porter’s Five Forces Analysis
Figure 9 Global Lithium-ion Battery Recycling Market Share Forecast by COVID, 2024-2034 (%)
Figure 10 Global Lithium-ion Battery Recycling Market by Region, 2024-2034 (US$ Bn, AGR (%)) (V-Shaped Recovery Scenario)
Figure 11 Global Lithium-ion Battery Recycling Market by Region, 2024-2034 (US$ Bn, AGR (%)) (U-Shaped Recovery Scenario)
Figure 12 Global Lithium-ion Battery Recycling Market by Region, 2024-2034 (US$ Bn, AGR (%)) (W-Shaped Recovery Scenario)
Figure 13 Global Lithium-ion Battery Recycling Market by Region, 2024-2034 (US$ Bn, AGR (%)) (L-Shaped Recovery Scenario)
Figure 14 Lithium-ion Battery Recycling Market: PEST Analysis
Figure 15 Lithium-ion Battery Recycling Market by Battery Source: Market Attractiveness Index
Figure 16 Global Lithium-ion Battery Recycling Market by Source, 2024-2034 (US$ Bn, AGR (%))
Figure 17 Lithium-ion Battery Recycling Market Share Forecast by Battery Source, 2024, 2029, 2034 (%)
Figure 18 Consumer Electronics Market by Region, 2024-2034 (US$ Bn, AGR (%))
Figure 19 Consumer Electronics Market Share Forecast by Region, 2024 & 2034 (%)
Figure 20 Electric Vehicles Market by Region, 2024-2034 (US$ Bn, AGR (%))
Figure 21 Electric Vehicles Market Share Forecast by Region, 2024 & 2034 (%)
Figure 22 Industrial Market by Region, 2024-2034 (US$ Bn, AGR (%))
Figure 23 Industrial Market Share Forecast by Region, 2024 & 2034 (%)
Figure 24 Lithium-ion Battery Recycling Market by Recycling Process: Market Attractiveness Index
Figure 25 Global Lithium-ion Battery Recycling Market by Recycling Process, 2024-2034 (US$ Bn, AGR (%))
Figure 26 Lithium-ion Battery Recycling Market Share Forecast by Recycling Process, 2024, 2029, 2034 (%)
Figure 27 Mechanical Market by Region, 2024-2034 (US$ Bn, AGR (%))
Figure 28 Mechanical Market Share Forecast by Region, 2024 & 2034 (%)
Figure 29 Pyrometallurgical Market by Region, 2024-2034 (US$ Bn, AGR (%))
Figure 30 Pyrometallurgical Market Share Forecast by Region, 2024 & 2034 (%)
Figure 31 Hydrometallurgical Market by Region, 2024-2034 (US$ Bn, AGR (%))
Figure 32 Hydrometallurgical Market Share Forecast by Region, 2024 & 2034 (%)
Figure 33 Direct Recovery Market by Region, 2024-2034 (US$ Bn, AGR (%))
Figure 34 Direct Recovery Market Share Forecast by Region, 2024 & 2034 (%)
Figure 35 Lithium-ion Battery Recycling Market by Industry Vertical: Market Attractiveness Index
Figure 36 Global Lithium-ion Battery Recycling Market by Industry Vertical, 2024-2034 (US$ Bn, AGR (%))
Figure 37 Lithium-ion Battery Recycling Market Share Forecast by Industry Vertical, 2024, 2029, 2034 (%)
Figure 38 Automotive Market by Region, 2024-2034 (US$ Bn, AGR (%))
Figure 39 Automotive Market Share Forecast by Region, 2024 & 2034 (%)
Figure 40 Electronics Market by Region, 2024-2034 (US$ Bn, AGR (%))
Figure 41 Electronics Market Share Forecast by Region, 2024 & 2034 (%)
Figure 42 Industrial Market by Region, 2024-2034 (US$ Bn, AGR (%))
Figure 43 Industrial Market Share Forecast by Region, 2024 & 2034 (%)
Figure 44 Power Market by Region, 2024-2034 (US$ Bn, AGR (%))
Figure 45 Power Market Share Forecast by Region, 2024 & 2034 (%)
Figure 46 Other Industry Vertical Market by Region, 2024-2034 (US$ Bn, AGR (%))
Figure 47 Other Industry Vertical Market Share Forecast by Region, 2024 & 2034 (%)
Figure 48 Lithium-ion Battery Recycling Market by Type: Market Attractiveness Index
Figure 49 Global Lithium-ion Battery Recycling Market by Type, 2024-2034 (US$ Bn, AGR (%))
Figure 50 Lithium-ion Battery Recycling Market Share Forecast by Type, 2024, 2029, 2034 (%)
Figure 51 Lithium-nickel Manganese Cobalt (Li-NMC) Market by Region, 2024-2034 (US$ Bn, AGR (%))
Figure 52 Lithium-nickel Manganese Cobalt (Li-NMC) Market Share Forecast by Region, 2024 & 2034 (%)
Figure 53 Lithium-iron Phosphate (LFP) Market by Region, 2024-2034 (US$ Bn, AGR (%))
Figure 54 Lithium-iron Phosphate (LFP) Market Share Forecast by Region, 2024 & 2034 (%)
Figure 55 Lithium-manganese Oxide (LMO) Market by Region, 2024-2034 (US$ Bn, AGR (%))
Figure 56 Lithium-manganese Oxide (LMO) Market Share Forecast by Region, 2024 & 2034 (%)
Figure 57 Lithium-titanate Oxide (LTO) Market by Region, 2024-2034 (US$ Bn, AGR (%))
Figure 58 Lithium-titanate Oxide (LTO) Market Share Forecast by Region, 2024 & 2034 (%)
Figure 59 Lithium-nickel Cobalt Aluminum Oxide (NCA) Market by Region, 2024-2034 (US$ Bn, AGR (%))
Figure 60 Lithium-nickel Cobalt Aluminum Oxide (NCA) Market Share Forecast by Region, 2024 & 2034 (%)
Figure 61 Other Types Market by Region, 2024-2034 (US$ Bn, AGR (%))
Figure 62 Other Types Market Share Forecast by Region, 2024 & 2034 (%)
Figure 63 Lithium-ion Battery Recycling Market Forecast by Region 2024 and 2034 (Revenue, CAGR%)
Figure 64 Lithium-ion Battery Recycling Market Share Forecast by Region 2024, 2029, 2034 (%)
Figure 65 Global Lithium-ion Battery Recycling Market by Region, 2024-2034 (US$ Bn, AGR (%))
Figure 66 North America Lithium-ion Battery Recycling Market Attractiveness Index
Figure 67 North America Lithium-ion Battery Recycling Market by Region, 2024, 2029 & 2034 (US$ Billion)
Figure 68 North America Lithium-ion Battery Recycling Market by Value, 2024-2034 (US$ Bn, AGR (%))
Figure 69 North America Lithium-ion Battery Recycling Market by Country, 2024-2034 (US$ Bn, AGR (%))
Figure 70 North America Lithium-ion Battery Recycling Market Share Forecast by Country, 2024 & 2034 (%)
Figure 71 North America Lithium-ion Battery Recycling Market by Source, 2024-2034 (US$ Bn, AGR (%))
Figure 72 North America Lithium-ion Battery Recycling Market Share Forecast Battery Source, 2024 & 2034 (%)
Figure 73 North America Lithium-ion Battery Recycling Market by Recycling Process, 2024-2034 (US$ Bn, AGR (%))
Figure 74 North America Lithium-ion Battery Recycling Market Share Forecast by Recycling Process, 2024 & 2034 (%)
Figure 75 North America Lithium-ion Battery Recycling Market by Industry Vertical, 2024-2034 (US$ Bn, AGR (%))
Figure 76 North America Lithium-ion Battery Recycling Market Share Forecast by Industry Vertical, 2024 & 2034 (%)
Figure 77 North America Lithium-ion Battery Recycling Market by Type, 2024-2034 (US$ Bn, AGR (%))
Figure 78 North America Lithium-ion Battery Recycling Market Share Forecast by Type, 2024 & 2034 (%)
Figure 79 US Lithium-ion Battery Recycling Market by Value, 2024-2034 (US$ Bn, AGR (%))
Figure 80 Canada Lithium-ion Battery Recycling Market by Value, 2024-2034 (US$ Bn, AGR (%))
Figure 81 Europe Lithium-ion Battery Recycling Market Attractiveness Index
Figure 82 Europe Lithium-ion Battery Recycling Market by Region, 2024, 2029 & 2034 (US$ Billion)
Figure 83 Europe Lithium-ion Battery Recycling Market by Value, 2024-2034 (US$ Bn, AGR (%))
Figure 84 Europe Lithium-ion Battery Recycling Market by Country, 2024-2034 (US$ Bn, AGR (%))
Figure 85 Europe Lithium-ion Battery Recycling Market Share Forecast by Country, 2024 & 2034 (%)
Figure 86 Europe Lithium-ion Battery Recycling Market by Source, 2024-2034 (US$ Bn, AGR (%))
Figure 87 Europe Lithium-ion Battery Recycling Market Share Forecast Battery Source, 2024 & 2034 (%)
Figure 88 Europe Lithium-ion Battery Recycling Market by Recycling Process, 2024-2034 (US$ Bn, AGR (%))
Figure 89 Europe Lithium-ion Battery Recycling Market Share Forecast by Recycling Process, 2024 & 2034 (%)
Figure 90 Europe Lithium-ion Battery Recycling Market by Industry Vertical, 2024-2034 (US$ Bn, AGR (%))
Figure 91 Europe Lithium-ion Battery Recycling Market Share Forecast by Industry Vertical, 2024 & 2034 (%)
Figure 92 Europe Lithium-ion Battery Recycling Market by Type, 2024-2034 (US$ Bn, AGR (%))
Figure 93 Europe Lithium-ion Battery Recycling Market Share Forecast by Type, 2024 & 2034 (%)
Figure 94 Germany Lithium-ion Battery Recycling Market by Value, 2024-2034 (US$ Bn, AGR (%))
Figure 95 UK Lithium-ion Battery Recycling Market by Value, 2024-2034 (US$ Bn, AGR (%))
Figure 96 France Lithium-ion Battery Recycling Market by Value, 2024-2034 (US$ Bn, AGR (%))
Figure 97 Hungary Lithium-ion Battery Recycling Market by Value, 2024-2034 (US$ Bn, AGR (%))
Figure 98 Poland Lithium-ion Battery Recycling Market by Value, 2024-2034 (US$ Bn, AGR (%))
Figure 99 Rest of Europe Lithium-ion Battery Recycling Market by Value, 2024-2034 (US$ Bn, AGR (%))
Figure 100 Asia-Pacific Lithium-ion Battery Recycling Market Attractiveness Index
Figure 101 Asia-Pacific Lithium-ion Battery Recycling Market by Region, 2024, 2029 & 2034 (US$ Billion)
Figure 102 Asia-Pacific Lithium-ion Battery Recycling Market by Value, 2024-2034 (US$ Bn, AGR (%))
Figure 103 Asia-Pacific Lithium-ion Battery Recycling Market by Country, 2024-2034 (US$ Bn, AGR (%))
Figure 104 Asia-Pacific Lithium-ion Battery Recycling Market Share Forecast by Country, 2024 & 2034 (%)
Figure 105 Asia-Pacific Lithium-ion Battery Recycling Market by Source, 2024-2034 (US$ Bn, AGR (%))
Figure 106 Asia-Pacific Lithium-ion Battery Recycling Market Share Forecast Battery Source, 2024 & 2034 (%)
Figure 107 Asia-Pacific Lithium-ion Battery Recycling Market by Recycling Process, 2024-2034 (US$ Bn, AGR (%))
Figure 108 Asia-Pacific Lithium-ion Battery Recycling Market Share Forecast by Recycling Process, 2024 & 2034 (%)
Figure 109 Asia-Pacific Lithium-ion Battery Recycling Market by Industry Vertical, 2024-2034 (US$ Bn, AGR (%))
Figure 110 Asia-Pacific Lithium-ion Battery Recycling Market Share Forecast by Industry Vertical, 2024 & 2034 (%)
Figure 111 Asia-Pacific Lithium-ion Battery Recycling Market by Type, 2024-2034 (US$ Bn, AGR (%))
Figure 112 Asia-Pacific Lithium-ion Battery Recycling Market Share Forecast by Type, 2024 & 2034 (%)
Figure 113 China Lithium-ion Battery Recycling Market by Value, 2024-2034 (US$ Bn, AGR (%))
Figure 114 India Lithium-ion Battery Recycling Market by Value, 2024-2034 (US$ Bn, AGR (%))
Figure 115 Japan Lithium-ion Battery Recycling Market by Value, 2024-2034 (US$ Bn, AGR (%))
Figure 116 South Korea Lithium-ion Battery Recycling Market by Value, 2024-2034 (US$ Bn, AGR (%))
Figure 117 Australia Lithium-ion Battery Recycling Market by Value, 2024-2034 (US$ Bn, AGR (%))
Figure 118 Rest of Asia-Pacific Lithium-ion Battery Recycling Market by Value, 2024-2034 (US$ Bn, AGR (%))
Figure 119 Middle East and Africa Lithium-ion Battery Recycling Market Attractiveness Index
Figure 120 Middle East and Africa Lithium-ion Battery Recycling Market by Region, 2024, 2029 & 2034 (US$ Billion)
Figure 121 Middle East & Africa Lithium-ion Battery Recycling Market by Value, 2024-2034 (US$ Bn, AGR (%))
Figure 122 Middle East & Africa Lithium-ion Battery Recycling Market by Country, 2024-2034 (US$ Bn, AGR (%))
Figure 123 Middle East and Africa Lithium-ion Battery Recycling Market Share Forecast by Country, 2024 & 2034 (%)
Figure 124 Middle East & Africa Lithium-ion Battery Recycling Market by Source, 2024-2034 (US$ Bn, AGR (%))
Figure 125 Middle East and Africa Lithium-ion Battery Recycling Market Share Forecast Battery Source, 2024 & 2034 (%)
Figure 126 Middle East & Africa Lithium-ion Battery Recycling Market by Recycling Process, 2024-2034 (US$ Bn, AGR (%))
Figure 127 Middle East and Africa Lithium-ion Battery Recycling Market Share Forecast by Recycling Process, 2024 & 2034 (%)
Figure 128 Middle East & Africa Lithium-ion Battery Recycling Market by Industry Vertical, 2024-2034 (US$ Bn, AGR (%))
Figure 129 Middle East and Africa Lithium-ion Battery Recycling Market Share Forecast by Industry Vertical, 2024 & 2034 (%)
Figure 130 Middle East & Africa Lithium-ion Battery Recycling Market by Type, 2024-2034 (US$ Bn, AGR (%))
Figure 131 Middle East and Africa Lithium-ion Battery Recycling Market Share Forecast by Type, 2024 & 2034 (%)
Figure 132 GCC Lithium-ion Battery Recycling Market by Value, 2024-2034 (US$ Bn, AGR (%))
Figure 133 South Africa Lithium-ion Battery Recycling Market by Value, 2024-2034 (US$ Bn, AGR (%))
Figure 134 Rest of Middle East & Africa Lithium-ion Battery Recycling Market by Value, 2024-2034 (US$ Bn, AGR (%))
Figure 135 Latin America Lithium-ion Battery Recycling Market Attractiveness Index
Figure 136 Latin America Lithium-ion Battery Recycling Market by Region, 2024, 2029 & 2034 (US$ Billion)
Figure 137 Latin America Lithium-ion Battery Recycling Market by Value, 2024-2034 (US$ Bn, AGR (%))
Figure 138 Latin America Lithium-ion Battery Recycling Market by Country, 2024-2034 (US$ Bn, AGR (%))
Figure 139 Latin America Lithium-ion Battery Recycling Market Share Forecast by Country, 2024 & 2034 (%)
Figure 140 Latin America Lithium-ion Battery Recycling Market by Source, 2024-2034 (US$ Bn, AGR (%))
Figure 141 Latin America Lithium-ion Battery Recycling Market Share Forecast Battery Source, 2024 & 2034 (%)
Figure 142 Latin America Lithium-ion Battery Recycling Market by Recycling Process, 2024-2034 (US$ Bn, AGR (%))
Figure 143 Latin America Lithium-ion Battery Recycling Market Share Forecast by Recycling Process, 2024 & 2034 (%)
Figure 144 Latin America Lithium-ion Battery Recycling Market by Industry Vertical, 2024-2034 (US$ Bn, AGR (%))
Figure 145 Latin America Lithium-ion Battery Recycling Market Share Forecast by Industry Vertical, 2024 & 2034 (%)
Figure 146 Latin America Lithium-ion Battery Recycling Market by Type, 2024-2034 (US$ Bn, AGR (%))
Figure 147 Latin America Lithium-ion Battery Recycling Market Share Forecast by Type, 2024 & 2034 (%)
Figure 148 Brazil Lithium-ion Battery Recycling Market by Value, 2024-2034 (US$ Bn, AGR (%))
Figure 149 Mexico Lithium-ion Battery Recycling Market by Value, 2024-2034 (US$ Bn, AGR (%))
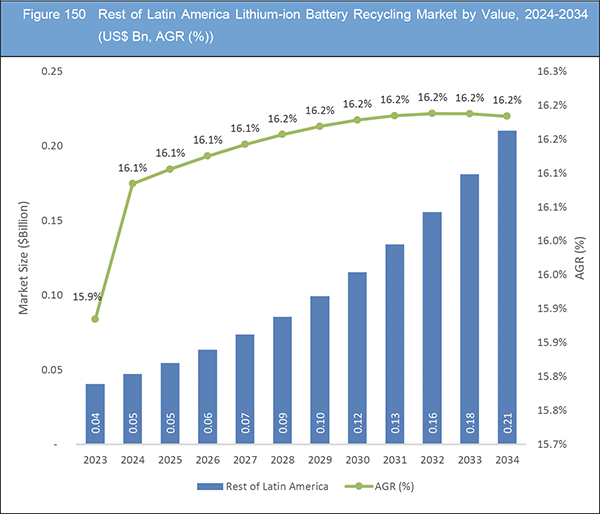
Figure 150 Rest of Latin America Lithium-ion Battery Recycling Market by Value, 2024-2034 (US$ Bn, AGR (%))
Figure 151 Glencore plc.: Net Revenue, 2018-2022 (US$ Million, AGR%)
Figure 152 Glencore plc.: Regional Revenue Share, 2022 (%)
Figure 153 Glencore plc.: Business Segment Revenue Share, 2022 (%)
Figure 154 Li-Cycle Corp.: Net Revenue, 2018-2022 (US$ Million, AGR%)
Figure 155 Li-Cycle Corp.: R&D, 2018-2022 (US$ Million, AGR%)
ページTOPに戻る
Summary
Report Details
The Lithium-ion Battery Recycling Market Report 2024-2034: This report will prove invaluable to leading firms striving for new revenue pockets if they wish to better understand the industry and its underlying dynamics. It will be useful for companies that would like to expand into different industries or to expand their existing operations in a new region.
Growing Environmental Concerns and Regulatory Pressure
Environmental concerns related to the disposal and recycling of lithium-ion batteries have prompted governments and regulatory bodies to implement stricter regulations and policies to promote battery recycling and reduce environmental pollution. In regions with stringent environmental regulations, such as the European Union and North America, manufacturers and recyclers are required to adhere to recycling targets and standards for lithium-ion batteries. Additionally, initiatives such as the European Battery Directive and the U.S. Battery Recycling Act incentivize battery recycling and impose responsibilities on stakeholders across the battery value chain to ensure proper disposal and recycling of end-of-life batteries.
Safety Issue Related to Storage and Transportation of Spent Batteries
An important market restraining factor in the lithium-ion battery recycling industry revolves around safety concerns associated with the storage and transportation of spent batteries. As the demand for lithium-ion batteries continues to escalate, driven by the surge in electric vehicles and portable electronic devices, the volume of spent batteries requiring recycling also increases. The safety challenges arise primarily due to the chemical composition of lithium-ion batteries and the potential risks they pose if mishandled.
Lithium-ion batteries contain volatile materials, and when not properly handled during storage and transportation, they can pose serious safety risks such as fire or leakage of hazardous substances. The electrolytes within these batteries are flammable, and if the structural integrity of the battery is compromised, it can lead to thermal runaway, a chain reaction that can result in overheating and combustion.
What Questions Should You Ask before Buying a Market Research Report?
-
How is the lithium-ion battery recycling market evolving?
-
What is driving and restraining the lithium-ion battery recycling market?
-
How will each lithium-ion battery recycling submarket segment grow over the forecast period and how much revenue will these submarkets account for in 2034?
-
How will the market shares for each lithium-ion battery recycling submarket develop from 2024 to 2034?
-
What will be the main driver for the overall market from 2024 to 2034?
-
Will leading lithium-ion battery recycling markets broadly follow the macroeconomic dynamics, or will individual national markets outperform others?
-
How will the market shares of the national markets change by 2034 and which geographical region will lead the market in 2034?
-
Who are the leading players and what are their prospects over the forecast period?
-
What are the lithium-ion battery recycling projects for these leading companies?
-
How will the industry evolve during the period between 2024 and 2034? What are the implications of lithium-ion battery recycling projects taking place now and over the next 10 years?
-
Is there a greater need for product commercialisation to further scale the lithium-ion battery recycling market?
-
Where is the lithium-ion battery recycling market heading and how can you ensure you are at the forefront of the market?
-
What are the best investment options for new product and service lines?
-
What are the key prospects for moving companies into a new growth path and C-suite?
You need to discover how this will impact the lithium-ion battery recycling market today, and over the next 10 years:
-
Our 364-page report provides 119 tables and 155 charts/graphs exclusively to you.
-
The report highlights key lucrative areas in the industry so you can target them – NOW.
-
It contains in-depth analysis of global, regional and national sales and growth.
-
It highlights for you the key successful trends, changes and revenue projections made by your competitors.
This report tells you TODAY how the lithium-ion battery recycling market will develop in the next 10 years, and in line with the variations in COVID-19 economic recession and bounce. This market is more critical now than at any point over the last 10 years.
The report delivers exclusive COVID-19 variations and economic data specific to your market.
-
In addition to revenue forecasting to 2034, our new study provides you with recent results, growth rates, and market shares.
-
You will find original analyses, with business outlooks and developments.
-
Discover qualitative analyses (including market dynamics, drivers, opportunities, restraints and challenges), cost structure, impact of rising lithium-ion battery recycling prices and recent developments.
This report includes data analysis and invaluable insight into how COVID-19 will affect the industry and your company. Four COVID-19 recovery patterns and their impact, namely, “V”, “L”, “W” and “U” are discussed in this report.
Segments Covered in the Report
Market Segment by Source
-
Consumer Electronics
-
Electric Vehicles
-
Industrial
Market Segment by Recycling Process
-
Mechanical
-
Pyrometallurgical
-
Hydrometallurgical
-
Direct Recovery
Market Segment by Industry Vertical
-
Automotive
-
Electronics
-
Industrial
-
Power
-
Other Industry Vertical
Market Segment by Type
-
Lithium-nickel Manganese Cobalt (Li-NMC)
-
Lithium-iron Phosphate (LFP)
-
Lithium-manganese Oxide (LMO)
-
Lithium-titanate Oxide (LTO)
-
Lithium-nickel Cobalt Aluminium Oxide (NCA)
-
Other Types
In addition to the revenue predictions for the overall world market and segments, you will also find revenue forecasts for four regional and 20 leading national markets:
North America
Europe
-
Germany
-
UK
-
France
-
Hungary
-
Poland
-
Rest of Europe
Asia Pacific
-
China
-
Japan
-
India
-
Australia
-
South Korea
-
Rest of Asia Pacific
Latin America
-
Brazil
-
Mexico
-
Rest of Latin America
Middle East & Africa
-
GCC
-
South Africa
-
Rest of Middle East & Africa
The report also includes profiles and for some of the leading companies in the Lithium-ion Battery Recycling Market, 2024 to 2034, with a focus on this segment of these companies’ operations.
Leading companies profiled in the report
-
Accurec Recycling GmbH
-
American Battery Technology Company
-
Battery Recycling Made Easy
-
Contemporary Amperex Technology Co. Limited (CATL)
-
Duesenfeld Gmbh
-
Ecobat
-
Envirostream Australia Pty Ltd
-
Fortum Oyj
-
Glencore plc
-
Li-Cycle Corp.
-
RecycLiCo Battery Materials Inc
-
Redwood Materials, Inc.
-
SMC Recycling Inc.
-
Stena Recycling
-
The International Metals Reclamation Company
Overall world revenue for Lithium-ion Battery Recycling Market, 2024 to 2034 in terms of value the market will surpass US$3.0 billion in 2024, our work calculates. We predict strong revenue growth through to 2034. Our work identifies which organizations hold the greatest potential. Discover their capabilities, progress, and commercial prospects, helping you stay ahead.
How will the Lithium-ion Battery Recycling Market, 2024 to 2034 report help you?
In summary, our 360+ page report provides you with the following knowledge:
-
Revenue forecasts to 2034 for Lithium-ion Battery Recycling Market, 2024 to 2034 Market, with forecasts for source, recycling process, industry vertical and type, each forecast at a global and regional level – discover the industry’s prospects, finding the most lucrative places for investments and revenues.
-
Revenue forecasts to 2034 for four regional and 20 key national markets – See forecasts for the Lithium-ion Battery Recycling Market, 2024 to 2034 market in North America, Europe, Asia-Pacific, Latin America and Middle East & Africa. Also forecasted is the market in the US, Canada, Brazil, Germany, France, UK, Italy, China, India, Japan, and Australia among other prominent economies.
-
Prospects for established firms and those seeking to enter the market – including company profiles for 15 of the major companies involved in the Lithium-ion Battery Recycling Market, 2024 to 2034.
Find quantitative and qualitative analyses with independent predictions. Receive information that only our report contains, staying informed with invaluable business intelligence.
Information found nowhere else
With our new report, you are less likely to fall behind in knowledge or miss out on opportunities. See how our work could benefit your research, analyses, and decisions. Visiongain’s study is for everybody needing commercial analyses for the Lithium-ion Battery Recycling Market, 2024 to 2034, market-leading companies. You will find data, trends and predictions.
ページTOPに戻る
Table of Contents
Table of Contents
1 Report Overview
1.1 Objectives of the Study
1.2 Introduction to Lithium-ion Battery Recycling Market
1.3 What This Report Delivers
1.4 Why You Should Read This Report
1.5 Key Questions Answered by This Analytical Report
1.6 Who Is This Report for?
1.7 Methodology
1.7.1 Market Definitions
1.7.2 Market Evaluation & Forecasting Methodology
1.7.3 Data Validation
1.7.3.1 Primary Research
1.7.3.2 Secondary Research
1.8 Frequently Asked Questions (FAQs)
1.9 Associated Visiongain Reports
1.10 About Visiongain
2 Executive Summary
3 Market Overview
3.1 Key Findings
3.2 Market Dynamics
3.2.1 Market Driving Factors
3.2.1.1 Rising Demand for Electric Vehicles to unlock New Potential for the Lithium-ion Battery Recycling Industry
3.2.1.2 Rising Demand for Recycled Products and Materials
3.2.1.3 Geographical Expansion to Emerging Markets with Increasing Industrialization and Consumer Demand Contributes to the Market's Overall Growth
3.2.2 Market Restraining Factors
3.2.2.1 Safety Issue Related to Storage and Transportation of Spent Batteries
3.2.2.2 High Cost of Recycling and Dearth of Technologies
3.2.2.3 Environmental and Safety Concerns Hinder the Market Growth
3.2.3 Market Opportunities
3.2.3.1 Subsidies to Encourage Battery Recycling
3.2.3.2 Rising Adoption of Lithium-ion Battery Due to Declining Prices
3.2.3.3 New Government Rules and Incentives has Enhanced the Production in the Lithium-ion Battery Recycling Industry
3.3 Porter’s Five Forces Analysis
3.3.1 Bargaining Power of Suppliers (Medium to High)
3.3.2 Bargaining Power of Buyers (High)
3.3.3 Competitive Rivalry (Medium to High)
3.3.4 Threat from Substitutes (Medium)
3.3.5 Threat of New Entrants (Low)
3.4 COVID-19 Impact Analysis
3.4.1 “V-Shaped Recovery”
3.4.2 “U-Shaped Recovery”
3.4.3 “W-Shaped Recovery”
3.4.4 “L-Shaped Recovery”
3.5 PEST Analysis
4 Lithium-ion Battery Recycling Market Analysis by Battery Source
4.1 Key Findings
4.2 Battery Source Segment: Market Attractiveness Index
4.3 Lithium-ion Battery Recycling Market Size Estimation and Forecast by Battery Source
4.4 Consumer Electronics
4.4.1 Market Size by Region, 2024-2034 (US$ Billion)
4.4.2 Market Share by Region, 2024 & 2034 (%)
4.5 Electric Vehicles
4.5.1 Market Size by Region, 2024-2034 (US$ Billion)
4.5.2 Market Share by Region, 2024 & 2034 (%)
4.6 Industrial
4.6.1 Market Size by Region, 2024-2034 (US$ Billion)
4.6.2 Market Share by Region, 2024 & 2034 (%)
5 Lithium-ion Battery Recycling Market Analysis by Recycling Process
5.1 Key Findings
5.2 Recycling Process Segment: Market Attractiveness Index
5.3 Lithium-ion Battery Recycling Market Size Estimation and Forecast by Recycling Process
5.4 Mechanical
5.4.1 Market Size by Region, 2024-2034 (US$ Billion)
5.4.2 Market Share by Region, 2024 & 2034 (%)
5.5 Pyrometallurgical
5.5.1 Market Size by Region, 2024-2034 (US$ Billion)
5.5.2 Market Share by Region, 2024 & 2034 (%)
5.6 Hydrometallurgical
5.6.1 Market Size by Region, 2024-2034 (US$ Billion)
5.6.2 Market Share by Region, 2024 & 2034 (%)
5.7 Direct Recovery
5.7.1 Market Size by Region, 2024-2034 (US$ Billion)
5.7.2 Market Share by Region, 2024 & 2034 (%)
6 Lithium-ion Battery Recycling Market Analysis by Industry Vertical
6.1 Key Findings
6.2 Industry Vertical Segment: Market Attractiveness Index
6.3 Lithium-ion Battery Recycling Market Size Estimation and Forecast by Industry Vertical
6.4 Automotive
6.4.1 Market Size by Region, 2024-2034 (US$ Billion)
6.4.2 Market Share by Region, 2024 & 2034 (%)
6.5 Electronics
6.5.1 Market Size by Region, 2024-2034 (US$ Billion)
6.5.2 Market Share by Region, 2024 & 2034 (%)
6.6 Industrial
6.6.1 Market Size by Region, 2024-2034 (US$ Billion)
6.6.2 Market Share by Region, 2024 & 2034 (%)
6.7 Power
6.7.1 Market Size by Region, 2024-2034 (US$ Billion)
6.7.2 Market Share by Region, 2024 & 2034 (%)
6.8 Other Industry Vertical
6.8.1 Market Size by Region, 2024-2034 (US$ Billion)
6.8.2 Market Share by Region, 2024 & 2034 (%)
7 Lithium-ion Battery Recycling Market Analysis by Type
7.1 Key Findings
7.2 Type Segment: Market Attractiveness Index
7.3 Lithium-ion Battery Recycling Market Size Estimation and Forecast by Type
7.4 Lithium-nickel Manganese Cobalt (Li-NMC)
7.4.1 Market Size by Region, 2024-2034 (US$ Billion)
7.4.2 Market Share by Region, 2024 & 2034 (%)
7.5 Lithium-iron Phosphate (LFP)
7.5.1 Market Size by Region, 2024-2034 (US$ Billion)
7.5.2 Market Share by Region, 2024 & 2034 (%)
7.6 Lithium-manganese Oxide (LMO)
7.6.1 Market Size by Region, 2024-2034 (US$ Billion)
7.6.2 Market Share by Region, 2024 & 2034 (%)
7.7 Lithium-titanate Oxide (LTO)
7.7.1 Market Size by Region, 2024-2034 (US$ Billion)
7.7.2 Market Share by Region, 2024 & 2034 (%)
7.8 Lithium-nickel Cobalt Aluminum Oxide (NCA)
7.8.1 Market Size by Region, 2024-2034 (US$ Billion)
7.8.2 Market Share by Region, 2024 & 2034 (%)
7.9 Other Types
7.9.1 Market Size by Region, 2024-2034 (US$ Billion)
7.9.2 Market Share by Region, 2024 & 2034 (%)
8 Lithium-ion Battery Recycling Market Analysis by Region
8.1 Key Findings
8.2 Regional Market Size Estimation and Forecast
9 North America Lithium-ion Battery Recycling Market Analysis
9.1 Key Findings
9.2 North America Lithium-ion Battery Recycling Market Attractiveness Index
9.3 North America Lithium-ion Battery Recycling Market by Country, 2024, 2029 & 2034 (US$ Billion)
9.4 North America Lithium-ion Battery Recycling Market Size Estimation and Forecast
9.5 North America Lithium-ion Battery Recycling Market Size Estimation and Forecast by Country
9.6 North America Lithium-ion Battery Recycling Market Size Estimation and Forecast by Battery Source
9.7 North America Lithium-ion Battery Recycling Market Size Estimation and Forecast by Recycling Process
9.8 North America Lithium-ion Battery Recycling Market Size Estimation and Forecast by Industry Vertical
9.9 North America Lithium-ion Battery Recycling Market Size Estimation and Forecast by Type
9.10 U.S. Lithium-ion Battery Recycling Market Analysis
9.11 Canada Lithium-ion Battery Recycling Market Analysis
10 Europe Lithium-ion Battery Recycling Market Analysis
10.1 Key Findings
10.2 Europe Lithium-ion Battery Recycling Market Attractiveness Index
10.3 Europe Lithium-ion Battery Recycling Market by Country, 2024, 2029 & 2034 (US$ Billion)
10.4 Europe Lithium-ion Battery Recycling Market Size Estimation and Forecast
10.5 Europe Lithium-ion Battery Recycling Market Size Estimation and Forecast by Country
10.6 Europe Lithium-ion Battery Recycling Market Size Estimation and Forecast by Battery Source
10.7 Europe Lithium-ion Battery Recycling Market Size Estimation and Forecast by Recycling Process
10.8 Europe Lithium-ion Battery Recycling Market Size Estimation and Forecast by Industry Vertical
10.9 Europe Lithium-ion Battery Recycling Market Size Estimation and Forecast by Type
10.10 Germany Lithium-ion Battery Recycling Market Analysis
10.11 UK Lithium-ion Battery Recycling Market Analysis
10.12 France Lithium-ion Battery Recycling Market Analysis
10.13 Hungary Lithium-ion Battery Recycling Market Analysis
10.14 Poland Lithium-ion Battery Recycling Market Analysis
10.15 Rest of Europe Lithium-ion Battery Recycling Market Analysis
11 Asia-Pacific Lithium-ion Battery Recycling Market Analysis
11.1 Key Findings
11.2 Asia-Pacific Lithium-ion Battery Recycling Market Attractiveness Index
11.3 Asia-Pacific Lithium-ion Battery Recycling Market by Country, 2024, 2029 & 2034 (US$ Billion)
11.4 Asia-Pacific Lithium-ion Battery Recycling Market Size Estimation and Forecast
11.5 Asia-Pacific Lithium-ion Battery Recycling Market Size Estimation and Forecast by Country
11.6 Asia-Pacific Lithium-ion Battery Recycling Market Size Estimation and Forecast by Battery Source
11.7 Asia-Pacific Lithium-ion Battery Recycling Market Size Estimation and Forecast by Recycling Process
11.8 Asia-Pacific Lithium-ion Battery Recycling Market Size Estimation and Forecast by Industry Vertical
11.9 Asia-Pacific Lithium-ion Battery Recycling Market Size Estimation and Forecast by Type
11.10 China Lithium-ion Battery Recycling Market Analysis
11.11 India Lithium-ion Battery Recycling Market Analysis
11.12 Japan Lithium-ion Battery Recycling Market Analysis
11.13 South Korea Lithium-ion Battery Recycling Market Analysis
11.14 Australia Lithium-ion Battery Recycling Market Analysis
11.15 Rest of Asia-Pacific Lithium-ion Battery Recycling Market Analysis
12 Middle East and Africa Lithium-ion Battery Recycling Market Analysis
12.1 Key Findings
12.2 Middle East and Africa Lithium-ion Battery Recycling Market Attractiveness Index
12.3 Middle East and Africa Lithium-ion Battery Recycling Market by Country, 2024, 2029 & 2034 (US$ Billion)
12.4 Middle East and Africa Lithium-ion Battery Recycling Market Size Estimation and Forecast
12.5 Middle East and Africa Lithium-ion Battery Recycling Market Size Estimation and Forecast by Country
12.6 Middle East and Africa Lithium-ion Battery Recycling Market Size Estimation and Forecast by Battery Source
12.7 Middle East and Africa Lithium-ion Battery Recycling Market Size Estimation and Forecast by Recycling Process
12.8 Middle East and Africa Lithium-ion Battery Recycling Market Size Estimation and Forecast by Industry Vertical
12.9 Middle East and Africa Lithium-ion Battery Recycling Market Size Estimation and Forecast by Type
12.10 GCC Lithium-ion Battery Recycling Market Analysis
12.11 South Africa Lithium-ion Battery Recycling Market Analysis
12.12 Rest of Middle East & Africa Lithium-ion Battery Recycling Market Analysis
13 Latin America Lithium-ion Battery Recycling Market Analysis
13.1 Key Findings
13.2 Latin America Lithium-ion Battery Recycling Market Attractiveness Index
13.3 Latin America Lithium-ion Battery Recycling Market by Country, 2024, 2029 & 2034 (US$ Billion)
13.4 Latin America Lithium-ion Battery Recycling Market Size Estimation and Forecast
13.5 Latin America Lithium-ion Battery Recycling Market Size Estimation and Forecast by Country
13.6 Latin America Lithium-ion Battery Recycling Market Size Estimation and Forecast by Battery Source
13.7 Latin America Lithium-ion Battery Recycling Market Size Estimation and Forecast by Recycling Process
13.8 Latin America Lithium-ion Battery Recycling Market Size Estimation and Forecast by Industry Vertical
13.9 Latin America Lithium-ion Battery Recycling Market Size Estimation and Forecast by Type
13.10 Brazil Lithium-ion Battery Recycling Market Analysis
13.11 Mexico Lithium-ion Battery Recycling Market Analysis
13.12 Rest of Latin America Lithium-ion Battery Recycling Market Analysis
14 Company Profiles
14.1 Competitive Landscape, 2023
14.2 Strategic Outlook
14.3 Glencore plc
14.3.1 Company Snapshot
14.3.2 Company Overview
14.3.3 Financial Analysis
14.3.3.1 Net Revenue, 2018-2022
14.3.3.2 Regional Revenue Share, 2022 (%)
14.3.3.3 Business Segment Revenue Share, 2022 (%)
14.3.4 Product Benchmarking
14.3.5 Strategic Outlook
14.4 Contemporary Amperex Technology Co. Limited (CATL)
14.4.1 Company Snapshot
14.4.2 Company Overview
14.4.3 Product Benchmarking
14.4.4 Strategic Outlook
14.5 RecycLiCo Battery Materials Inc
14.5.1 Company Snapshot
14.5.2 Company Overview
14.5.3 Product Benchmarking
14.5.4 Strategic Outlook
14.6 American Battery Technology Company
14.6.1 Company Snapshot
14.6.2 Company Overview
14.6.3 Product Benchmarking
14.6.4 Strategic Outlook
14.7 ACCUREC RECYCLING GMBH
14.7.1 Company Snapshot
14.7.2 Company Overview
14.7.3 Product Benchmarking
14.8 Ecobat
14.8.1 Company Snapshot
14.8.2 Company Overview
14.8.3 Product Benchmarking
14.8.4 Strategic Outlook
14.9 Fortum Oyj
14.9.1 Company Snapshot
14.9.2 Company Overview
14.9.3 Product Benchmarking
14.9.4 Strategic Outlook
14.10 The International Metals Reclamation Company
14.10.1 Company Snapshot
14.10.2 Company Overview
14.10.3 Product Benchmarking
14.11 Redwood Materials, Inc.
14.11.1 Company Snapshot
14.11.2 Company Overview
14.11.3 Product Benchmarking
14.11.4 Strategic Outlook
14.12 Stena Recycling
14.12.1 Company Snapshot
14.12.2 Company Overview
14.12.3 Product Benchmarking
14.12.4 Strategic Outlook
14.13 Envirostream Australia Pty Ltd
14.13.1 Company Snapshot
14.13.2 Company Overview
14.13.3 Product Benchmarking
14.13.4 Strategic Outlook
14.14 Battery Recycling Made Easy
14.14.1 Company Snapshot
14.14.2 Company Overview
14.14.3 Product Benchmarking
14.15 Duesenfeld Gmbh
14.15.1 Company Snapshot
14.15.2 Company Overview
14.15.3 Product Benchmarking
14.16 SMC Recycling Inc
14.16.1 Company Snapshot
14.16.2 Company Overview
14.16.3 Product Benchmarking
14.17 Li-Cycle Corp.
14.17.1 Company Snapshot
14.17.2 Company Overview
14.17.3 Financial Analysis
14.17.3.1 Net Revenue, 2018-2022
14.17.3.2 R&D, 2018-2022
14.17.4 Product Benchmarking
14.17.5 Strategic Outlook
15 Conclusion and Recommendations
15.1 Concluding Remarks from Visiongain
15.2 Recommendations for Market Players
ページTOPに戻る
List of Tables/Graphs
List of Tables
Table 1 Lithium-ion Battery Recycling Market Snapshot, 2024 & 2034 (US$ Billion, CAGR %)
Table 2 Lithium Battery Price
Table 3 Global Lithium-ion Battery Recycling Market by Region, 2024-2034 (US$ Bn, AGR (%), CAGR (%)) (V-Shaped Recovery Scenario)
Table 4 Global Lithium-ion Battery Recycling Market by Region, 2024-2034 (US$ Bn, AGR (%), CAGR (%)) (U-Shaped Recovery Scenario)
Table 5 Global Lithium-ion Battery Recycling Market by Region, 2024-2034 (US$ Bn, AGR (%), CAGR (%)) (W-Shaped Recovery Scenario)
Table 6 Global Lithium-ion Battery Recycling Market by Region, 2024-2034 (US$ Bn, AGR (%), CAGR (%)) (L-Shaped Recovery Scenario)
Table 7 Global Lithium-ion Battery Recycling Market by Source, 2024-2034 (US$ Bn, AGR (%), CAGR (%))
Table 8 Consumer Electronics Market by Region, 2024-2034 (US$ Bn, AGR (%), CAGR (%))
Table 9 Electric Vehicles Market by Region, 2024-2034 (US$ Bn, AGR (%), CAGR (%))
Table 10 Industrial Market by Region, 2024-2034 (US$ Bn, AGR (%), CAGR (%))
Table 11 Global Lithium-ion Battery Recycling Market by Recycling Process, 2024-2034 (US$ Bn, AGR (%), CAGR (%))
Table 12 Mechanical Market by Region, 2024-2034 (US$ Bn, AGR (%), CAGR (%))
Table 13 Pyrometallurgical Market by Region, 2024-2034 (US$ Bn, AGR (%), CAGR (%))
Table 14 Hydrometallurgical Market by Region, 2024-2034 (US$ Bn, AGR (%), CAGR (%))
Table 15 Direct Recovery Market by Region, 2024-2034 (US$ Bn, AGR (%), CAGR (%))
Table 16 Global Lithium-ion Battery Recycling Market by Industry Vertical, 2024-2034 (US$ Bn, AGR (%), CAGR (%))
Table 17 Automotive Market by Region, 2024-2034 (US$ Bn, AGR (%), CAGR (%))
Table 18 Electronics Market by Region, 2024-2034 (US$ Bn, AGR (%), CAGR (%))
Table 19 Industrial Market by Region, 2024-2034 (US$ Bn, AGR (%), CAGR (%))
Table 20 Power Market by Region, 2024-2034 (US$ Bn, AGR (%), CAGR (%))
Table 21 Other Industry Vertical Market by Region, 2024-2034 (US$ Bn, AGR (%), CAGR (%))
Table 22 Global Lithium-ion Battery Recycling Market by Type, 2024-2034 (US$ Bn, AGR (%), CAGR (%))
Table 23 Lithium-nickel Manganese Cobalt (Li-NMC) Market by Region, 2024-2034 (US$ Bn, AGR (%), CAGR (%))
Table 24 Lithium-iron Phosphate (LFP) Market by Region, 2024-2034 (US$ Bn, AGR (%), CAGR (%))
Table 25 Lithium-manganese Oxide (LMO) Market by Region, 2024-2034 (US$ Bn, AGR (%), CAGR (%))
Table 26 Lithium-titanate Oxide (LTO) Market by Region, 2024-2034 (US$ Bn, AGR (%), CAGR (%))
Table 27 Lithium-nickel Cobalt Aluminum Oxide (NCA) Market by Region, 2024-2034 (US$ Bn, AGR (%), CAGR (%))
Table 28 Other Types Market by Region, 2024-2034 (US$ Bn, AGR (%), CAGR (%))
Table 29 Global Lithium-ion Battery Recycling Market by Region, 2024-2034 (US$ Bn, AGR (%), CAGR (%))
Table 30 North America Lithium-ion Battery Recycling Market by Value, 2024-2034 (US$ Bn, AGR (%), CAGR (%))
Table 31 North America Lithium-ion Battery Recycling Market by Country, 2024-2034 (US$ Bn, AGR (%), CAGR (%))
Table 32 North America Lithium-ion Battery Recycling Market by Source, 2024-2034 (US$ Bn, AGR (%), CAGR (%))
Table 33 North America Lithium-ion Battery Recycling Market by Recycling Process, 2024-2034 (US$ Bn, AGR (%), CAGR (%))
Table 34 North America Lithium-ion Battery Recycling Market by Industry Vertical, 2024-2034 (US$ Bn, AGR (%), CAGR (%))
Table 35 North America Lithium-ion Battery Recycling Market by Type, 2024-2034 (US$ Bn, AGR (%), CAGR (%))
Table 36 US Lithium-ion Battery Recycling Market by Value, 2024-2034 (US$ Bn, AGR (%), CAGR (%))
Table 37 Canada Lithium-ion Battery Recycling Market by Value, 2024-2034 (US$ Bn, AGR (%), CAGR (%))
Table 38 Europe Lithium-ion Battery Recycling Market by Value, 2024-2034 (US$ Bn, AGR (%), CAGR (%))
Table 39 Europe Lithium-ion Battery Recycling Market by Country, 2024-2034 (US$ Bn, AGR (%), CAGR (%))
Table 40 Europe Lithium-ion Battery Recycling Market by Source, 2024-2034 (US$ Bn, AGR (%), CAGR (%))
Table 41 Europe Lithium-ion Battery Recycling Market by Recycling Process, 2024-2034 (US$ Bn, AGR (%), CAGR (%))
Table 42 Europe Lithium-ion Battery Recycling Market by Industry Vertical, 2024-2034 (US$ Bn, AGR (%), CAGR (%))
Table 43 Europe Lithium-ion Battery Recycling Market by Type, 2024-2034 (US$ Bn, AGR (%), CAGR (%))
Table 44 Germany Lithium-ion Battery Recycling Market by Value, 2024-2034 (US$ Bn, AGR (%), CAGR (%))
Table 45 UK Lithium-ion Battery Recycling Market by Value, 2024-2034 (US$ Bn, AGR (%), CAGR (%))
Table 46 France Lithium-ion Battery Recycling Market by Value, 2024-2034 (US$ Bn, AGR (%), CAGR (%))
Table 47 Hungary Lithium-ion Battery Recycling Market by Value, 2024-2034 (US$ Bn, AGR (%), CAGR (%))
Table 48 Poland Lithium-ion Battery Recycling Market by Value, 2024-2034 (US$ Bn, AGR (%), CAGR (%))
Table 49 Rest of Europe Lithium-ion Battery Recycling Market by Value, 2024-2034 (US$ Bn, AGR (%), CAGR (%))
Table 50 Asia-Pacific Lithium-ion Battery Recycling Market by Value, 2024-2034 (US$ Bn, AGR (%), CAGR (%))
Table 51 Asia-Pacific Lithium-ion Battery Recycling Market by Country, 2024-2034 (US$ Bn, AGR (%), CAGR (%))
Table 52 Asia-Pacific Lithium-ion Battery Recycling Market by Source, 2024-2034 (US$ Bn, AGR (%), CAGR (%))
Table 53 Asia-Pacific Lithium-ion Battery Recycling Market by Recycling Process, 2024-2034 (US$ Bn, AGR (%), CAGR (%))
Table 54 Asia-Pacific Lithium-ion Battery Recycling Market by Industry Vertical, 2024-2034 (US$ Bn, AGR (%), CAGR (%))
Table 55 Asia-Pacific Lithium-ion Battery Recycling Market by Type, 2024-2034 (US$ Bn, AGR (%), CAGR (%))
Table 56 China Lithium-ion Battery Recycling Market by Value, 2024-2034 (US$ Bn, AGR (%), CAGR (%))
Table 57 India Lithium-ion Battery Recycling Market by Value, 2024-2034 (US$ Bn, AGR (%), CAGR (%))
Table 58 Japan Lithium-ion Battery Recycling Market by Value, 2024-2034 (US$ Bn, AGR (%), CAGR (%))
Table 59 South Korea Lithium-ion Battery Recycling Market by Value, 2024-2034 (US$ Bn, AGR (%), CAGR (%))
Table 60 Australia Lithium-ion Battery Recycling Market by Value, 2024-2034 (US$ Bn, AGR (%), CAGR (%))
Table 61 Rest of Asia-Pacific Lithium-ion Battery Recycling Market by Value, 2024-2034 (US$ Bn, AGR (%), CAGR (%))
Table 62 Middle East & Africa Lithium-ion Battery Recycling Market by Value, 2024-2034 (US$ Bn, AGR (%), CAGR (%))
Table 63 Middle East & Africa Lithium-ion Battery Recycling Market by Country, 2024-2034 (US$ Bn, AGR (%), CAGR (%))
Table 64 Middle East & Africa Lithium-ion Battery Recycling Market by Source, 2024-2034 (US$ Bn, AGR (%), CAGR (%))
Table 65 Middle East & Africa Lithium-ion Battery Recycling Market by Recycling Process, 2024-2034 (US$ Bn, AGR (%), CAGR (%))
Table 66 Middle East & Africa Lithium-ion Battery Recycling Market by Industry Vertical, 2024-2034 (US$ Bn, AGR (%), CAGR (%))
Table 67 Middle East & Africa Lithium-ion Battery Recycling Market by Type, 2024-2034 (US$ Bn, AGR (%), CAGR (%))
Table 68 GCC Lithium-ion Battery Recycling Market by Value, 2024-2034 (US$ Bn, AGR (%), CAGR (%))
Table 69 South Africa Lithium-ion Battery Recycling Market by Value, 2024-2034 (US$ Bn, AGR (%), CAGR (%))
Table 70 Rest of Middle East & Africa Lithium-ion Battery Recycling Market by Value, 2024-2034 (US$ Bn, AGR (%), CAGR (%))
Table 71 Latin America Lithium-ion Battery Recycling Market by Value, 2024-2034 (US$ Bn, AGR (%), CAGR (%))
Table 72 Latin America Lithium-ion Battery Recycling Market by Country, 2024-2034 (US$ Bn, AGR (%), CAGR (%))
Table 73 Latin America Lithium-ion Battery Recycling Market by Source, 2024-2034 (US$ Bn, AGR (%), CAGR (%))
Table 74 Latin America Lithium-ion Battery Recycling Market by Recycling Process, 2024-2034 (US$ Bn, AGR (%), CAGR (%))
Table 75 Latin America Lithium-ion Battery Recycling Market by Industry Vertical, 2024-2034 (US$ Bn, AGR (%), CAGR (%))
Table 76 Latin America Lithium-ion Battery Recycling Market by Type, 2024-2034 (US$ Bn, AGR (%), CAGR (%))
Table 77 Brazil Lithium-ion Battery Recycling Market by Value, 2024-2034 (US$ Bn, AGR (%), CAGR (%))
Table 78 Mexico Lithium-ion Battery Recycling Market by Value, 2024-2034 (US$ Bn, AGR (%), CAGR (%))
Table 79 Rest of Latin America Lithium-ion Battery Recycling Market by Value, 2024-2034 (US$ Bn, AGR (%), CAGR (%))
Table 80 Ranking on bases of Number of Employee, 2023
Table 81 Strategic Outlook - Contract
Table 82 Glencore plc: Key Details, (CEO, HQ, Revenue, Founded, No. of Employees, Company Type, Website, Business Segment)
Table 83 Glencore plc: Product Benchmarking
Table 84 Glencore plc: Strategic Outlook
Table 85 Contemporary Amperex Technology Co. Limited (CATL): Key Details, (CEO, HQ, Revenue, Founded, No. of Employees, Company Type, Website, Business Segment)
Table 86 Contemporary Amperex Technology Co. Limited (CATL): Product Benchmarking
Table 87 Contemporary Amperex Technology Co. Limited (CATL): Strategic Outlook
Table 88 Recycles Battery Materials Inc: Key Details, (CEO, HQ, Revenue, Founded, No. of Employees, Company Type, Website, Business Segment)
Table 89 RecycLiCo Battery Materials Inc: Product Benchmarking
Table 90 RecycLiCo Battery Materials Inc: Strategic Outlook
Table 91 American Battery Technology Company: Key Details, (CEO, HQ, Revenue, Founded, No. of Employees, Company Type, Website, Business Segment)
Table 92 American Battery Technology Company: Product Benchmarking
Table 93 American Battery Technology Company: Strategic Outlook
Table 94 ACCUREC RECYCLING GMBH: Key Details, (CEO, HQ, Revenue, Founded, No. of Employees, Company Type, Website, Business Segment)
Table 95 ACCUREC RECYCLING GMBH: Product Benchmarking
Table 96 Ecobat: Key Details, (CEO, HQ, Revenue, Founded, No. of Employees, Company Type, Website, Business Segment)
Table 97 Ecobat: Product Benchmarking
Table 98 Ecobat: Strategic Outlook
Table 99 Fortum Oyj: Key Details, (CEO, HQ, Revenue, Founded, No. of Employees, Company Type, Website, Business Segment)
Table 100 Fortum Oyj: Product Benchmarking
Table 101 Fortum Oyj: Strategic Outlook
Table 102 The International Metals Reclamation Company: Key Details, (CEO, HQ, Revenue, Founded, No. of Employees, Company Type, Website, Business Segment)
Table 103 The International Metals Reclamation Company: Product Benchmarking
Table 104 Redwood Materials, Inc.: Key Details, (CEO, HQ, Revenue, Founded, No. of Employees, Company Type, Website, Business Segment)
Table 105 Redwood Materials, Inc.: Product Benchmarking
Table 106 Redwood Materials, Inc.: Strategic Outlook
Table 107 Stena Recycling: Key Details, (CEO, HQ, Revenue, Founded, No. of Employees, Company Type, Website, Business Segment)
Table 108 Stena Recycling: Product Benchmarking
Table 109 Stena Recycling: Strategic Outlook
Table 110 Envirostream Australia Pty Ltd: Key Details, (CEO, HQ, Revenue, Founded, No. of Employees, Company Type, Website, Business Segment)
Table 111 Envirostream Australia Pty Ltd: Product Benchmarking
Table 112 Envirostream Australia Pty Ltd: Strategic Outlook
Table 113 Battery Recycling Made Easy: Key Details, (CEO, HQ, Revenue, Founded, No. of Employees, Company Type, Website, Business Segment)
Table 114 Battery Recycling Made Easy: Product Benchmarking
Table 115 Duesenfeld Gmbh: Key Details, (CEO, HQ, Revenue, Founded, No. of Employees, Company Type, Website, Business Segment)
Table 116 Duesenfeld Gmbh: Product Benchmarking
Table 117 SMC Recycling Inc: Key Details, (CEO, HQ, Revenue, Founded, No. of Employees, Company Type, Website, Business Segment)
Table 118 SMC Recycling Inc: Product Benchmarking
Table 119 Li-Cycle Corp: Key Details, (CEO, HQ, Revenue, Founded, No. of Employees, Company Type, Website, Business Segment)
Table 120 Li-Cycle Corp: Product Benchmarking
Table 121 Li-Cycle Corp: Strategic Outlook
List of Figures
Figure 1 Lithium-ion Battery Recycling Market Segmentation
Figure 2 Lithium-ion Battery Recycling Market by Battery Source: Market Attractiveness Index
Figure 3 Lithium-ion Battery Recycling Market by Recycling Process: Market Attractiveness Index
Figure 4 Lithium-ion Battery Recycling Market by Industry Vertical: Market Attractiveness Index
Figure 5 Lithium-ion Battery Recycling Market by Type: Market Attractiveness Index
Figure 6 Lithium-ion Battery Recycling Market Attractiveness Index by Region
Figure 7 Lithium-ion Battery Recycling Market: Market Dynamics
Figure 8 Lithium-ion Battery Recycling Market: Porter’s Five Forces Analysis
Figure 9 Global Lithium-ion Battery Recycling Market Share Forecast by COVID, 2024-2034 (%)
Figure 10 Global Lithium-ion Battery Recycling Market by Region, 2024-2034 (US$ Bn, AGR (%)) (V-Shaped Recovery Scenario)
Figure 11 Global Lithium-ion Battery Recycling Market by Region, 2024-2034 (US$ Bn, AGR (%)) (U-Shaped Recovery Scenario)
Figure 12 Global Lithium-ion Battery Recycling Market by Region, 2024-2034 (US$ Bn, AGR (%)) (W-Shaped Recovery Scenario)
Figure 13 Global Lithium-ion Battery Recycling Market by Region, 2024-2034 (US$ Bn, AGR (%)) (L-Shaped Recovery Scenario)
Figure 14 Lithium-ion Battery Recycling Market: PEST Analysis
Figure 15 Lithium-ion Battery Recycling Market by Battery Source: Market Attractiveness Index
Figure 16 Global Lithium-ion Battery Recycling Market by Source, 2024-2034 (US$ Bn, AGR (%))
Figure 17 Lithium-ion Battery Recycling Market Share Forecast by Battery Source, 2024, 2029, 2034 (%)
Figure 18 Consumer Electronics Market by Region, 2024-2034 (US$ Bn, AGR (%))
Figure 19 Consumer Electronics Market Share Forecast by Region, 2024 & 2034 (%)
Figure 20 Electric Vehicles Market by Region, 2024-2034 (US$ Bn, AGR (%))
Figure 21 Electric Vehicles Market Share Forecast by Region, 2024 & 2034 (%)
Figure 22 Industrial Market by Region, 2024-2034 (US$ Bn, AGR (%))
Figure 23 Industrial Market Share Forecast by Region, 2024 & 2034 (%)
Figure 24 Lithium-ion Battery Recycling Market by Recycling Process: Market Attractiveness Index
Figure 25 Global Lithium-ion Battery Recycling Market by Recycling Process, 2024-2034 (US$ Bn, AGR (%))
Figure 26 Lithium-ion Battery Recycling Market Share Forecast by Recycling Process, 2024, 2029, 2034 (%)
Figure 27 Mechanical Market by Region, 2024-2034 (US$ Bn, AGR (%))
Figure 28 Mechanical Market Share Forecast by Region, 2024 & 2034 (%)
Figure 29 Pyrometallurgical Market by Region, 2024-2034 (US$ Bn, AGR (%))
Figure 30 Pyrometallurgical Market Share Forecast by Region, 2024 & 2034 (%)
Figure 31 Hydrometallurgical Market by Region, 2024-2034 (US$ Bn, AGR (%))
Figure 32 Hydrometallurgical Market Share Forecast by Region, 2024 & 2034 (%)
Figure 33 Direct Recovery Market by Region, 2024-2034 (US$ Bn, AGR (%))
Figure 34 Direct Recovery Market Share Forecast by Region, 2024 & 2034 (%)
Figure 35 Lithium-ion Battery Recycling Market by Industry Vertical: Market Attractiveness Index
Figure 36 Global Lithium-ion Battery Recycling Market by Industry Vertical, 2024-2034 (US$ Bn, AGR (%))
Figure 37 Lithium-ion Battery Recycling Market Share Forecast by Industry Vertical, 2024, 2029, 2034 (%)
Figure 38 Automotive Market by Region, 2024-2034 (US$ Bn, AGR (%))
Figure 39 Automotive Market Share Forecast by Region, 2024 & 2034 (%)
Figure 40 Electronics Market by Region, 2024-2034 (US$ Bn, AGR (%))
Figure 41 Electronics Market Share Forecast by Region, 2024 & 2034 (%)
Figure 42 Industrial Market by Region, 2024-2034 (US$ Bn, AGR (%))
Figure 43 Industrial Market Share Forecast by Region, 2024 & 2034 (%)
Figure 44 Power Market by Region, 2024-2034 (US$ Bn, AGR (%))
Figure 45 Power Market Share Forecast by Region, 2024 & 2034 (%)
Figure 46 Other Industry Vertical Market by Region, 2024-2034 (US$ Bn, AGR (%))
Figure 47 Other Industry Vertical Market Share Forecast by Region, 2024 & 2034 (%)
Figure 48 Lithium-ion Battery Recycling Market by Type: Market Attractiveness Index
Figure 49 Global Lithium-ion Battery Recycling Market by Type, 2024-2034 (US$ Bn, AGR (%))
Figure 50 Lithium-ion Battery Recycling Market Share Forecast by Type, 2024, 2029, 2034 (%)
Figure 51 Lithium-nickel Manganese Cobalt (Li-NMC) Market by Region, 2024-2034 (US$ Bn, AGR (%))
Figure 52 Lithium-nickel Manganese Cobalt (Li-NMC) Market Share Forecast by Region, 2024 & 2034 (%)
Figure 53 Lithium-iron Phosphate (LFP) Market by Region, 2024-2034 (US$ Bn, AGR (%))
Figure 54 Lithium-iron Phosphate (LFP) Market Share Forecast by Region, 2024 & 2034 (%)
Figure 55 Lithium-manganese Oxide (LMO) Market by Region, 2024-2034 (US$ Bn, AGR (%))
Figure 56 Lithium-manganese Oxide (LMO) Market Share Forecast by Region, 2024 & 2034 (%)
Figure 57 Lithium-titanate Oxide (LTO) Market by Region, 2024-2034 (US$ Bn, AGR (%))
Figure 58 Lithium-titanate Oxide (LTO) Market Share Forecast by Region, 2024 & 2034 (%)
Figure 59 Lithium-nickel Cobalt Aluminum Oxide (NCA) Market by Region, 2024-2034 (US$ Bn, AGR (%))
Figure 60 Lithium-nickel Cobalt Aluminum Oxide (NCA) Market Share Forecast by Region, 2024 & 2034 (%)
Figure 61 Other Types Market by Region, 2024-2034 (US$ Bn, AGR (%))
Figure 62 Other Types Market Share Forecast by Region, 2024 & 2034 (%)
Figure 63 Lithium-ion Battery Recycling Market Forecast by Region 2024 and 2034 (Revenue, CAGR%)
Figure 64 Lithium-ion Battery Recycling Market Share Forecast by Region 2024, 2029, 2034 (%)
Figure 65 Global Lithium-ion Battery Recycling Market by Region, 2024-2034 (US$ Bn, AGR (%))
Figure 66 North America Lithium-ion Battery Recycling Market Attractiveness Index
Figure 67 North America Lithium-ion Battery Recycling Market by Region, 2024, 2029 & 2034 (US$ Billion)
Figure 68 North America Lithium-ion Battery Recycling Market by Value, 2024-2034 (US$ Bn, AGR (%))
Figure 69 North America Lithium-ion Battery Recycling Market by Country, 2024-2034 (US$ Bn, AGR (%))
Figure 70 North America Lithium-ion Battery Recycling Market Share Forecast by Country, 2024 & 2034 (%)
Figure 71 North America Lithium-ion Battery Recycling Market by Source, 2024-2034 (US$ Bn, AGR (%))
Figure 72 North America Lithium-ion Battery Recycling Market Share Forecast Battery Source, 2024 & 2034 (%)
Figure 73 North America Lithium-ion Battery Recycling Market by Recycling Process, 2024-2034 (US$ Bn, AGR (%))
Figure 74 North America Lithium-ion Battery Recycling Market Share Forecast by Recycling Process, 2024 & 2034 (%)
Figure 75 North America Lithium-ion Battery Recycling Market by Industry Vertical, 2024-2034 (US$ Bn, AGR (%))
Figure 76 North America Lithium-ion Battery Recycling Market Share Forecast by Industry Vertical, 2024 & 2034 (%)
Figure 77 North America Lithium-ion Battery Recycling Market by Type, 2024-2034 (US$ Bn, AGR (%))
Figure 78 North America Lithium-ion Battery Recycling Market Share Forecast by Type, 2024 & 2034 (%)
Figure 79 US Lithium-ion Battery Recycling Market by Value, 2024-2034 (US$ Bn, AGR (%))
Figure 80 Canada Lithium-ion Battery Recycling Market by Value, 2024-2034 (US$ Bn, AGR (%))
Figure 81 Europe Lithium-ion Battery Recycling Market Attractiveness Index
Figure 82 Europe Lithium-ion Battery Recycling Market by Region, 2024, 2029 & 2034 (US$ Billion)
Figure 83 Europe Lithium-ion Battery Recycling Market by Value, 2024-2034 (US$ Bn, AGR (%))
Figure 84 Europe Lithium-ion Battery Recycling Market by Country, 2024-2034 (US$ Bn, AGR (%))
Figure 85 Europe Lithium-ion Battery Recycling Market Share Forecast by Country, 2024 & 2034 (%)
Figure 86 Europe Lithium-ion Battery Recycling Market by Source, 2024-2034 (US$ Bn, AGR (%))
Figure 87 Europe Lithium-ion Battery Recycling Market Share Forecast Battery Source, 2024 & 2034 (%)
Figure 88 Europe Lithium-ion Battery Recycling Market by Recycling Process, 2024-2034 (US$ Bn, AGR (%))
Figure 89 Europe Lithium-ion Battery Recycling Market Share Forecast by Recycling Process, 2024 & 2034 (%)
Figure 90 Europe Lithium-ion Battery Recycling Market by Industry Vertical, 2024-2034 (US$ Bn, AGR (%))
Figure 91 Europe Lithium-ion Battery Recycling Market Share Forecast by Industry Vertical, 2024 & 2034 (%)
Figure 92 Europe Lithium-ion Battery Recycling Market by Type, 2024-2034 (US$ Bn, AGR (%))
Figure 93 Europe Lithium-ion Battery Recycling Market Share Forecast by Type, 2024 & 2034 (%)
Figure 94 Germany Lithium-ion Battery Recycling Market by Value, 2024-2034 (US$ Bn, AGR (%))
Figure 95 UK Lithium-ion Battery Recycling Market by Value, 2024-2034 (US$ Bn, AGR (%))
Figure 96 France Lithium-ion Battery Recycling Market by Value, 2024-2034 (US$ Bn, AGR (%))
Figure 97 Hungary Lithium-ion Battery Recycling Market by Value, 2024-2034 (US$ Bn, AGR (%))
Figure 98 Poland Lithium-ion Battery Recycling Market by Value, 2024-2034 (US$ Bn, AGR (%))
Figure 99 Rest of Europe Lithium-ion Battery Recycling Market by Value, 2024-2034 (US$ Bn, AGR (%))
Figure 100 Asia-Pacific Lithium-ion Battery Recycling Market Attractiveness Index
Figure 101 Asia-Pacific Lithium-ion Battery Recycling Market by Region, 2024, 2029 & 2034 (US$ Billion)
Figure 102 Asia-Pacific Lithium-ion Battery Recycling Market by Value, 2024-2034 (US$ Bn, AGR (%))
Figure 103 Asia-Pacific Lithium-ion Battery Recycling Market by Country, 2024-2034 (US$ Bn, AGR (%))
Figure 104 Asia-Pacific Lithium-ion Battery Recycling Market Share Forecast by Country, 2024 & 2034 (%)
Figure 105 Asia-Pacific Lithium-ion Battery Recycling Market by Source, 2024-2034 (US$ Bn, AGR (%))
Figure 106 Asia-Pacific Lithium-ion Battery Recycling Market Share Forecast Battery Source, 2024 & 2034 (%)
Figure 107 Asia-Pacific Lithium-ion Battery Recycling Market by Recycling Process, 2024-2034 (US$ Bn, AGR (%))
Figure 108 Asia-Pacific Lithium-ion Battery Recycling Market Share Forecast by Recycling Process, 2024 & 2034 (%)
Figure 109 Asia-Pacific Lithium-ion Battery Recycling Market by Industry Vertical, 2024-2034 (US$ Bn, AGR (%))
Figure 110 Asia-Pacific Lithium-ion Battery Recycling Market Share Forecast by Industry Vertical, 2024 & 2034 (%)
Figure 111 Asia-Pacific Lithium-ion Battery Recycling Market by Type, 2024-2034 (US$ Bn, AGR (%))
Figure 112 Asia-Pacific Lithium-ion Battery Recycling Market Share Forecast by Type, 2024 & 2034 (%)
Figure 113 China Lithium-ion Battery Recycling Market by Value, 2024-2034 (US$ Bn, AGR (%))
Figure 114 India Lithium-ion Battery Recycling Market by Value, 2024-2034 (US$ Bn, AGR (%))
Figure 115 Japan Lithium-ion Battery Recycling Market by Value, 2024-2034 (US$ Bn, AGR (%))
Figure 116 South Korea Lithium-ion Battery Recycling Market by Value, 2024-2034 (US$ Bn, AGR (%))
Figure 117 Australia Lithium-ion Battery Recycling Market by Value, 2024-2034 (US$ Bn, AGR (%))
Figure 118 Rest of Asia-Pacific Lithium-ion Battery Recycling Market by Value, 2024-2034 (US$ Bn, AGR (%))
Figure 119 Middle East and Africa Lithium-ion Battery Recycling Market Attractiveness Index
Figure 120 Middle East and Africa Lithium-ion Battery Recycling Market by Region, 2024, 2029 & 2034 (US$ Billion)
Figure 121 Middle East & Africa Lithium-ion Battery Recycling Market by Value, 2024-2034 (US$ Bn, AGR (%))
Figure 122 Middle East & Africa Lithium-ion Battery Recycling Market by Country, 2024-2034 (US$ Bn, AGR (%))
Figure 123 Middle East and Africa Lithium-ion Battery Recycling Market Share Forecast by Country, 2024 & 2034 (%)
Figure 124 Middle East & Africa Lithium-ion Battery Recycling Market by Source, 2024-2034 (US$ Bn, AGR (%))
Figure 125 Middle East and Africa Lithium-ion Battery Recycling Market Share Forecast Battery Source, 2024 & 2034 (%)
Figure 126 Middle East & Africa Lithium-ion Battery Recycling Market by Recycling Process, 2024-2034 (US$ Bn, AGR (%))
Figure 127 Middle East and Africa Lithium-ion Battery Recycling Market Share Forecast by Recycling Process, 2024 & 2034 (%)
Figure 128 Middle East & Africa Lithium-ion Battery Recycling Market by Industry Vertical, 2024-2034 (US$ Bn, AGR (%))
Figure 129 Middle East and Africa Lithium-ion Battery Recycling Market Share Forecast by Industry Vertical, 2024 & 2034 (%)
Figure 130 Middle East & Africa Lithium-ion Battery Recycling Market by Type, 2024-2034 (US$ Bn, AGR (%))
Figure 131 Middle East and Africa Lithium-ion Battery Recycling Market Share Forecast by Type, 2024 & 2034 (%)
Figure 132 GCC Lithium-ion Battery Recycling Market by Value, 2024-2034 (US$ Bn, AGR (%))
Figure 133 South Africa Lithium-ion Battery Recycling Market by Value, 2024-2034 (US$ Bn, AGR (%))
Figure 134 Rest of Middle East & Africa Lithium-ion Battery Recycling Market by Value, 2024-2034 (US$ Bn, AGR (%))
Figure 135 Latin America Lithium-ion Battery Recycling Market Attractiveness Index
Figure 136 Latin America Lithium-ion Battery Recycling Market by Region, 2024, 2029 & 2034 (US$ Billion)
Figure 137 Latin America Lithium-ion Battery Recycling Market by Value, 2024-2034 (US$ Bn, AGR (%))
Figure 138 Latin America Lithium-ion Battery Recycling Market by Country, 2024-2034 (US$ Bn, AGR (%))
Figure 139 Latin America Lithium-ion Battery Recycling Market Share Forecast by Country, 2024 & 2034 (%)
Figure 140 Latin America Lithium-ion Battery Recycling Market by Source, 2024-2034 (US$ Bn, AGR (%))
Figure 141 Latin America Lithium-ion Battery Recycling Market Share Forecast Battery Source, 2024 & 2034 (%)
Figure 142 Latin America Lithium-ion Battery Recycling Market by Recycling Process, 2024-2034 (US$ Bn, AGR (%))
Figure 143 Latin America Lithium-ion Battery Recycling Market Share Forecast by Recycling Process, 2024 & 2034 (%)
Figure 144 Latin America Lithium-ion Battery Recycling Market by Industry Vertical, 2024-2034 (US$ Bn, AGR (%))
Figure 145 Latin America Lithium-ion Battery Recycling Market Share Forecast by Industry Vertical, 2024 & 2034 (%)
Figure 146 Latin America Lithium-ion Battery Recycling Market by Type, 2024-2034 (US$ Bn, AGR (%))
Figure 147 Latin America Lithium-ion Battery Recycling Market Share Forecast by Type, 2024 & 2034 (%)
Figure 148 Brazil Lithium-ion Battery Recycling Market by Value, 2024-2034 (US$ Bn, AGR (%))
Figure 149 Mexico Lithium-ion Battery Recycling Market by Value, 2024-2034 (US$ Bn, AGR (%))
Figure 150 Rest of Latin America Lithium-ion Battery Recycling Market by Value, 2024-2034 (US$ Bn, AGR (%))
Figure 151 Glencore plc.: Net Revenue, 2018-2022 (US$ Million, AGR%)
Figure 152 Glencore plc.: Regional Revenue Share, 2022 (%)
Figure 153 Glencore plc.: Business Segment Revenue Share, 2022 (%)
Figure 154 Li-Cycle Corp.: Net Revenue, 2018-2022 (US$ Million, AGR%)
Figure 155 Li-Cycle Corp.: R&D, 2018-2022 (US$ Million, AGR%)
ページTOPに戻る
Visiongain社のエネルギーと資源分野での最新刊レポート
本レポートと同じKEY WORD(battery)の最新刊レポート
よくあるご質問
Visiongain社はどのような調査会社ですか?
英国の調査会社ヴィジョンゲイン社(Visiongain)は、通信とエネルギーのほか、自動車や化学・医薬品、金属など、広範な市場を対象に調査を行っています。自動車市場については、市場全般に関する調査のほ... もっと見る
調査レポートの納品までの日数はどの程度ですか?
在庫のあるものは速納となりますが、平均的には 3-4日と見て下さい。
但し、一部の調査レポートでは、発注を受けた段階で内容更新をして納品をする場合もあります。
発注をする前のお問合せをお願いします。
注文の手続きはどのようになっていますか?
1)お客様からの御問い合わせをいただきます。
2)見積書やサンプルの提示をいたします。
3)お客様指定、もしくは弊社の発注書をメール添付にて発送してください。
4)データリソース社からレポート発行元の調査会社へ納品手配します。
5) 調査会社からお客様へ納品されます。最近は、pdfにてのメール納品が大半です。
お支払方法の方法はどのようになっていますか?
納品と同時にデータリソース社よりお客様へ請求書(必要に応じて納品書も)を発送いたします。
お客様よりデータリソース社へ(通常は円払い)の御振り込みをお願いします。
請求書は、納品日の日付で発行しますので、翌月最終営業日までの当社指定口座への振込みをお願いします。振込み手数料は御社負担にてお願いします。
お客様の御支払い条件が60日以上の場合は御相談ください。
尚、初めてのお取引先や個人の場合、前払いをお願いすることもあります。ご了承のほど、お願いします。
データリソース社はどのような会社ですか?
当社は、世界各国の主要調査会社・レポート出版社と提携し、世界各国の市場調査レポートや技術動向レポートなどを日本国内の企業・公官庁及び教育研究機関に提供しております。
世界各国の「市場・技術・法規制などの」実情を調査・収集される時には、データリソース社にご相談ください。
お客様の御要望にあったデータや情報を抽出する為のレポート紹介や調査のアドバイスも致します。
|
|

