ネットワークオートメーション市場レポート:2023-2033
Network Automation Market Report 2023-2033
レポート詳細
ネットワークオートメーション市場レポート 2023-2033 :本レポートは、新たな収益の柱を目指すリーディングカンパニーが、業界とその背景にあるダイナミクスをより深く理解する上で、非... もっと見る
※上記価格は部署ライセンス(Departmental licence)価格です。
その他の価格についてはデータリソースまでお問合せください。
日本語のページは自動翻訳を利用し作成しています。
実際のレポートは英文のみでご納品いたします。

|

|
サマリー
レポート詳細
ネットワークオートメーション市場レポート 2023-2033:本レポートは、新たな収益の柱を目指すリーディングカンパニーが、業界とその背景にあるダイナミクスをより深く理解する上で、非常に有益なものとなるでしょう。また、異業種への進出や新地域での既存事業の拡大を目指す企業にとっても有用なレポートです。
ソフトウェア定義ネットワーク(SDN)技術の広範な採用
ネットワークオートメーション市場は、IT業界の中でも急速に成長している分野であり、さまざまなネットワークタスクやプロセスを管理・自動化するためのソリューションを提供しています。現代のネットワークはますます複雑化しており、運用の合理化や手作業によるミスの削減が求められていることから、ネットワークオートメーションの成長が加速しています。市場規模は数十億ドルと推定され、今後数年間は上昇基調が続くと予想されています。
ネットワーク自動化の主要な推進要因の 1 つに、ソフトウェア定義ネットワーク(SDN) 技術の普及が挙げられます。SDN はネットワークの一元的なビューを提供し、API を通じてネットワーク動作をプログラム的に制御することで自動化を可能にします。これにより、企業はネットワークを動的に管理・設定できるようになり、俊敏性の向上とサービス提供の迅速化を実現できます。
ネットワーク・セキュリティに対する需要の高まり
ネットワークオートメーションの成長を促進する重要な要因の1つは、ネットワークセキュリティに対する需要の増加です。サイバー脅威の増加に伴い、企業はネットワークセキュリティ体制を改善し、データ侵害のリスクを低減するためのソリューションを求めています。ネットワークの自動化は、ファイアウォール、侵入検知、データ暗号化などのセキュリティタスクを自動化することで、セキュリティチームを解放し、より戦略的な取り組みに集中させることができます。
マーケットリサーチレポートを購入する前に、どのような質問をすべきでしょうか?
- ネットワークオートメーション市場はどのように進化しているのか?
- ネットワークオートメーション市場の推進要因と抑制要因は何か?
- 各ネットワークオートメーションサブマーケットセグメントは予測期間中にどのように成長し、2033年にこれらのサブマーケットが占める収益はどの程度になるのか?
- 2023年から2033年にかけて、各ネットワークオートメーションサブマーケットの市場シェアはどのように推移するのか?
- 2023年から2033年にかけて、市場全体の主な牽引役は何になるのか?
- ネットワークオートメーションの主要市場はマクロ経済のダイナミクスに広く追随するのか、それとも個々の国内市場が他を凌駕するのか?
- 2033年までに各国市場のシェアはどのように変化し、どの地域が2033年の市場をリードするのか?
- 主要プレイヤーは誰か、また予測期間中の見通しは?
- これらの主要企業のネットワーク自動化プロジェクトはどのようなものですか?
- 2023年から2033年の間に、業界はどのように進化するのか?現在および今後10年間に実施されるネットワーク自動化プロジェクトにはどのような意味があるのか?
- ネットワークオートメーション市場をさらに拡大するために、製品の商業化の必要性は高まっているのか?
- ネットワークオートメーション市場の方向性と、市場の最前線にいることを保証する方法とは?
- 新製品やサービスラインに対する最適な投資オプションは何か?
- 企業を新たな成長軌道に乗せ、C-suiteに移行させるための重要な展望とは?
このことが、現在、そして今後10年間のネットワークオートメーション市場にどのような影響を与えるかを知る必要があります。
- 381ページにわたる本レポートでは、131の表と186のグラフを独占的に提供します。
- このレポートでは、業界における主要な収益性の高い分野をハイライトしているため、今すぐターゲットを絞ることができます。
- 世界、地域、国別の売上高と成長率を詳細に分析しています。
- 競合他社が成功した主なトレンド、変化、収益予測をハイライトしています。
このレポートは、ネットワークオートメーション市場が今後10年間にどのように発展していくのか、またCOVID-19の景気後退と回復の変動に伴ってどのように変化していくのかを教えてくれます。この市場は、過去10年間のどの時点よりも、今がより重要なのです。
2033年までの予測やその他の分析により、商業的な展望が見えてきた
- 2033年までの収益予測に加え、直近の実績、成長率、市場シェアもご覧いただけます。
- ビジネスの展望や展開など、独自の分析もご覧いただけます。
- 定性的分析(市場力学、促進要因、機会、阻害要因、課題など)、コスト構造、ネットワークオートメーションの価格上昇の影響、最近の動向などをご覧いただけます。
本レポートでは、COVID-19が業界と貴社にどのような影響を与えるかについて、データ分析と貴重な洞察を掲載しています。本レポートでは、COVID-19の4つの回収パターンとその影響、すなわち「V」、「L」、「W」、「U」について論じています。
報告書の対象セグメント
エンドユーザー別市場セグメント
- 企業
- サービスプロバイダー
ネットワークタイプ別市場セグメント
- 物理ネットワーク
- 仮想ネットワーク
- ハイブリッドネットワーク
コンポーネント別市場セグメント
- ネットワーク自動化ツール
- インテンションベースネットワーキング
- デプロイメントと統合
- その他のコンポーネント
タイプ別市場セグメント
- ローカルエリアネットワーク(LAN)
- ワイドエリアネットワーク (WAN)
- データセンターネットワーク
- クラウドネットワーク
- ワイヤレスネットワーク
業種別市場セグメント
- 情報技術 (IT)
- 銀行・金融サービス・保険 (BFSI)
- 製造業
- ヘルスケア
- エネルギー・公共事業
- その他の業種
世界市場全体とセグメントの収益予測に加え、4地域と主要20カ国市場の収益予測も掲載しています。
北米
- アメリカ
- カナダ
欧州
- ドイツ
- スペイン
- イギリス
- フランス
- イタリア
- その他の地域
アジア太平洋地域
- 中国
- 日本
- インド
- オーストラリア
- 韓国
- その他のアジア太平洋地域
ラテンアメリカ
- ブラジル
- メキシコ
- その他のラテンアメリカ地域
中東・アフリカ
- GCC
- 南アフリカ
- その他の中東・アフリカ
ネットワークオートメーション市場の2023年から2033年にかけての主要企業のプロファイルと、これらの企業のこのセグメントに焦点をあてた情報も掲載しています。
主要企業と市場成長の可能性
・ Anuta Networks
・ BlueCat Networks
・ BMC Software, Inc.
・ Cisco Systems, Inc.
・ Forward Networks, Inc.
・ IBM Corporation
・ Itential
・ Juniper Networks, Inc.
・ Kentik
・ Micro Focus International plc
・ NetBrain Technologies Inc.
・ Riverbed Technology LLC
・ SolarWinds Corporation
・ Versa Networks
・ VMware, Inc.
ネットワークオートメーション市場の世界全体の収益、2023年から2033年まで、金額ベースで2023年に40億9200万米ドルを突破すると、我々の仕事は計算しています。2033年まで収益が大きく伸びると予測しています。このレポートでは、どの企業が最も大きな可能性を持っているのかを明らかにします。彼らの能力、進歩、商業的展望を知ることで、一歩先を行くことができます。
ネットワークオートメーション市場、2023年から2033年までのレポートはどのように役立つのでしょうか?
380ページを超えるレポートでは、要約すると以下のような知識を得ることができます。
- ネットワークオートメーション市場の2023年から2033年までの収益予測、エンドユーザー、ネットワークタイプ、コンポーネント、タイプ、業種、企業規模の各予測を世界と地域レベルで掲載 - 業界の展望を見出し、投資と収益に最も有利な場所を見つけることができます。
- 4つの地域と20の主要国市場の2033年までの収益予測 - ネットワークオートメーション市場、2023年から2033年までの北米、ヨーロッパ、アジア太平洋、ラテンアメリカ、中東&アフリカの市場予測を参照してください。また、米国、カナダ、ブラジル、ドイツ、フランス、英国、イタリア、中国、インド、日本、オーストラリアなど、著名な経済圏の市場も予測しています。
- ネットワークオートメーション市場に関与する主要企業15社の企業プロファイルを含む、既存企業および市場参入を目指す企業の展望(2023年~2033年)を掲載しています。
定量的・定性的な分析と独自の予測をご覧いただけます。私たちのレポートだけが持つ情報を入手し、貴重なビジネスインテリジェンスを得ることができます。
他にはない情報
私たちの新しいレポートがあれば、知識の遅れを取り戻し、チャンスを逃す可能性が低くなります。私たちの研究が貴社の調査、分析、意思決定にどのように役立つかをご覧ください。Visiongainの研究は、ネットワークオートメーション市場、2023年から2033年、市場をリードする企業のための商業分析を必要とするすべての人のためのものです。データ、トレンド、予測をご覧いただけます。
ページTOPに戻る
目次
目次
1 レポートの概要
1.1 調査の目的
1.2 ネットワークオートメーション市場の紹介
1.3 本レポートが提供するもの
1.4 なぜ本レポートを読むべきなのか
1.5 本分析レポートが回答する主な疑問点
1.6 本レポートは誰のためのものか?
1.7 調査方法論
1.7.1 市場の定義
1.7.2 市場評価・予測手法
1.7.3 データの検証
1.7.3.1 一次調査
1.7.3.2 セカンダリーリサーチ
1.8 よくある質問と回答(FAQ)
1.9 関連するVisiongainのレポート
1.10 Visiongainについて
2 エグゼクティブサマリー
2.1 セグメント分析
2.1.1 エンドユーザーセグメント市場魅力度指標
2.1.2 ネットワークタイプセグメント市場魅力度指標
2.1.3 コンポーネントセグメント市場魅力度指標
2.1.4 タイプセグメント市場魅力度指標
2.1.5 バーティカルセグメント市場魅力度指数
2.2 地域別分析
2.2.1 ネットワークオートメーションの地域別市場魅力度指数
3 市場の概要
3.1 主要な調査結果
3.2 構造の概要
3.3 マーケットダイナミクス
3.3.1 市場の推進要因
3.3.1.1 クラウド技術の採用の増加
3.3.1.2 仮想化需要の高まり
3.3.1.3 ネットワークセキュリティのニーズの高まり
3.3.1.4 デジタルトランスフォーメーションへの要求の高まり
3.3.2 市場抑制要因
3.3.2.1 ネットワーク自動化ソリューションの実装の複雑さ
3.3.2.2 相互運用性の欠如
3.3.2.3 変化への抵抗
3.3.2.4 セキュリティに関する懸念
3.3.3 市場機会
3.3.3.1 クラウドベースのネットワークオートメーションソリューション
3.3.3.2 ネットワーク・オートメーションにおける人工知能と機械学習
3.3.3.3 5G技術の採用の増加
3.3.3.4 ソフトウェア定義ネットワーキング(SDN)に対する需要の高まり
3.4 COVID-19の影響度分析
3.4.1 V字回復シナリオ
3.4.2 W字型回復シナリオ
3.4.3 U字回復シナリオ
3.4.4 L字回復シナリオ
3.5 SWOT分析
3.5.1 ネットワークオートメーション市場の強み
3.5.2 ネットワークオートメーション市場の弱み
3.5.3 ネットワークオートメーション市場の機会
3.5.4 ネットワークオートメーション市場の脅威
3.6 ポーターのファイブフォース分析
3.6.1 新規参入の脅威 - 中程度
3.6.2 供給者の交渉力 - 低い
3.6.3 買い手のバーゲニングパワー - 高
3.6.4 代替製品・サービスの脅威 - 低い
3.6.5 既存の競合企業間の競争 - 高
3.7 PESTLE分析
3.7.1 政治的要因
3.7.2 経済的要因
3.7.3 社会的要因
3.7.4 技術的要因
3.7.5 法的要因
3.7.6 環境要因
4 ネットワークオートメーション市場分析:エンドユーザー別
4.1 主な調査結果
4.2 エンドユーザーセグメント市場魅力度指数
4.3 ネットワークオートメーション市場:エンドユーザー別
4.4 エンタープライズバーティカル
4.4.1 地域別市場規模、2023年~2033年 (US$ Mn)
4.4.2 地域別市場シェア、2023年&2033年(%)
4.5 サービスプロバイダー
4.5.1 地域別市場規模、2023年~2033年 (US$ Mn)
4.5.2 地域別市場シェア、2023年&2033年(%)
5 ネットワークオートメーション市場分析:ネットワークタイプ別
5.1 主な調査結果
5.2 ネットワークタイプセグメント市場魅力度指数
5.3 ネットワーク自動化市場:ネットワークタイプ別
5.4 物理ネットワーク
5.4.1 地域別市場規模、2023年~2033年 (US$ Mn)
5.4.2 地域別市場シェア、2023年&2033年(%)
5.5 仮想ネットワーク
5.5.1 地域別市場規模、2023年~2033年 (US$ Mn)
5.5.2 地域別市場シェア、2023年&2033年(%)
5.6 ハイブリッドネットワーク
5.6.1 地域別市場規模、2023年~2033年 (US$ Mn)
5.6.2 地域別市場シェア、2023年&2033年(%)
6 ネットワークオートメーション市場分析:コンポーネント別
6.1 主な調査結果
6.2 コンポーネントセグメント市場魅力度指数
6.3 コンポーネント別ネットワーク自動化市場
6.4 ネットワークオートメーションツール
6.4.1 地域別市場、2023年~2033年 (US$ Mn)
6.4.2 地域別市場シェア、2023年&2033年(%)
6.5 インテントベースネットワーキング
6.5.1 地域別市場規模、2023年~2033年 (US$ Mn)
6.5.2 地域別市場シェア、2023年&2033年(%)
6.6 デプロイメントとインテグレーション
6.6.1 地域別市場規模、2023年~2033年(US$ Mn)
6.6.2 地域別市場シェア、2023年&2033年(%)
6.7 その他のコンポーネント
6.7.1 地域別市場規模、2023年~2033年 (US$ Mn)
6.7.2 地域別市場シェア、2023年&2033年(%)
7 ネットワークオートメーション市場分析:タイプ別
7.1 主な調査結果
7.2 タイプ別セグメント市場魅力度指数
7.3 ネットワークオートメーション市場:タイプ別
7.4 ローカルエリアネットワーク(LAN)
7.4.1 地域別市場規模、2023年~2033年 (US$ Mn)
7.4.2 地域別市場シェア、2023年&2033年(%)
7.5 ワイドエリアネットワーク(WAN)
7.5.1 地域別市場規模、2023年~2033年 (US$ Mn)
7.5.2 地域別市場シェア、2023年&2033年(%)
7.6 データセンターネットワーク
7.6.1 地域別市場規模、2023年~2033年 (US$ Mn)
7.6.2 地域別市場シェア、2023年&2033年(%)
7.7 クラウドネットワーク
7.7.1 地域別市場規模、2023年~2033年 (US$ Mn)
7.7.2 地域別市場シェア、2023年&2033年(%)
7.8 ワイヤレスネットワーク
7.8.1 地域別市場規模、2023年~2033年 (US$ Mn)
7.8.2 地域別市場シェア、2023年&2033年(%)
8 ネットワークオートメーション市場分析:業種別
8.1 主な調査結果
8.2 業種別セグメント市場魅力度指数
8.3 ネットワークオートメーションの業種別市場
8.4 情報技術(IT)
8.4.1 地域別市場規模、2023年~2033年 (US$ Mn)
8.4.2 地域別市場シェア、2023年&2033年(%)
8.5 銀行・金融サービス・保険(BFSI)
8.5.1 地域別市場規模、2023年~2033年 (US$ Mn)
8.5.2 地域別市場シェア、2023年&2033年(%)
8.6 製造業
8.6.1 地域別市場規模、2023年~2033年 (US$ Mn)
8.6.2 地域別市場シェア、2023年&2033年(%)
8.7 ヘルスケア
8.7.1 地域別市場規模、2023年〜2033年 (US$ Mn)
8.7.2 地域別市場シェア、2023年&2033年(%)
8.8 エネルギー・公益事業
8.8.1 地域別市場規模、2023年〜2033年 (US$ Mn)
8.8.2 地域別市場シェア、2023年&2033年(%)
8.9 その他の業種
8.9.1 地域別市場規模、2023年~2033年 (US$ Mn)
8.9.2 地域別市場シェア、2023年&2033年(%)
9 ネットワークオートメーション市場分析:地域別
9.1 主な調査結果
9.2 ネットワークオートメーション市場:地域別
10 北米のネットワークオートメーション市場分析
10.1 主要な調査結果
10.1.1 Anuta Networks、北米初のクラウドネイティブ、Open-RAN対応5Gモバイルネットワークを自動化
10.2 北米ネットワークオートメーション市場の魅力度指数
10.3 北米ネットワークオートメーション市場:金額別
10.4 北米ネットワークオートメーション市場:国別
10.5 北米ネットワークオートメーション市場:エンドユーザー別
10.6 北米ネットワークオートメーション市場:ネットワークタイプ別
10.7 北米ネットワークオートメーション市場:コンポーネント別
10.8 北米ネットワークオートメーション市場:タイプ別
10.9 北米ネットワークオートメーション市場:業種別
10.10 米国ネットワークオートメーション市場分析
10.10.1 Dell TechnologiesとWind Riverがテレコム・クラウド・デプロイメントを変革する
10.11 カナダのネットワークオートメーション市場の分析
10.11.1 TELUSによるネットワークオートメーションの推進
11 欧州のネットワークオートメーション市場の分析
11.1 主要な調査結果
11.1.1 Vodafone、ヨーロッパ全域のコアネットワークの自動化でVMWAREと提携
11.2 欧州ネットワークオートメーション市場の魅力度指数
11.3 欧州ネットワークオートメーション市場:金額別
11.4 欧州ネットワークオートメーション市場:国別
11.5 欧州ネットワークオートメーション市場:エンドユーザー別
11.6 欧州ネットワークオートメーション市場:ネットワークタイプ別
11.7 欧州ネットワークオートメーション市場:コンポーネント別
11.8 欧州ネットワークオートメーション市場:タイプ別
11.9 欧州のネットワークオートメーション市場:業種別
11.10 ドイツのネットワークオートメーション市場分析
11.10.1 ドイツの1&1はオープンRANの目標から大きく遅れている。
11.11 イギリスのネットワークオートメーション市場の分析
11.11.1 自動化の推進がイギリスの経済成長に拍車をかける
11.12 フランスのネットワークオートメーション市場の分析
11.12.1 MavenirとNECがフランスのOrangeの5G SA実験ネットワークにマッシブMIMOを導入し、オープンRANを推進する
11.12.2 フランスの5G回線は413万回線で第1四半期を終了
11.13 イタリアのネットワークオートメーション市場分析
11.13.1 テレコム・イタリア、Itentialによるネットワーク自動化&オーケストレーションで効率アップと市場投入までの時間短縮を実現
11.14 スペイン ネットワークオートメーション市場の分析
11.14.1 シスコがテレフォニカネットワークにインテントベースネットワーキング技術を導入し、5G世界に向けた運用の最適化と簡素化を実現
11.15 その他の欧州のネットワークオートメーション市場の分析
11.15.1 KeysightとIBM、覚書締結により欧州でのオープンRAN展開の加速を目指す
12 アジア太平洋地域のネットワークオートメーション市場分析
12.1 主要な調査結果
12.1.1 ネットワークオートメーションは、オンデマンドサービスと最適化された顧客体験をもたらす
12.2 アジア太平洋地域のネットワークオートメーション市場の魅力度指数
12.3 アジア太平洋地域のネットワークオートメーション市場:金額別
12.4 アジア太平洋地域のネットワークオートメーション市場:国別
12.5 アジア太平洋地域のネットワークオートメーション市場:エンドユーザー別
12.6 アジア太平洋地域のネットワークオートメーション市場:ネットワークタイプ別
12.7 アジア太平洋地域のネットワークオートメーション市場:コンポーネント別
12.8 アジア太平洋地域のネットワークオートメーション市場:タイプ別
12.9 アジア太平洋地域のネットワークオートメーション市場:業種別
12.10 中国ネットワークオートメーション市場分析
12.10.1 チャイナモバイルとファーウェイが自律コアネットワークにおける革新と実践のため Glotel Automation Initiative Of The Year 賞を受賞
12.11 インドのネットワークオートメーション市場の分析
12.11.1 Genieがネットワークオートメーションでトラフィック分析ソリューションを展示
12.12 日本のネットワーク・オートメーション市場の分析
12.12.1 楽天モバイルの再建は急がない
12.13 韓国ネットワークオートメーション市場の分析
12.13.1 韓国は2026年に通信用6Gプロトタイプの打ち上げを目指している。
12.14 オーストラリアのネットワークオートメーション市場分析
12.14.1 Telstraは自動化と顧客体験を強化するためにオーケストレーションでチューンアップ
12.14.2 クラウド時代の成功のために SDN を採用するオーストラリアの企業
12.15 アジア太平洋地域の残りのネットワークオートメーション市場の分析
12.15.1 SKテレコムはSkylightでキャパシティプランニングを強化し、運用効率を向上させる。
13 中東・アフリカのネットワークオートメーション市場分析
13.1 主な調査結果
13.2 MEAネットワークオートメーション市場の魅力度指数
13.3 中東・アフリカのネットワークオートメーション市場:金額別
13.4 中東・アフリカの地域ネットワークオートメーション市場:国別
13.5 中東・アフリカの地域ネットワークオートメーション市場:エンドユーザー別
13.6 中東・アフリカのネットワークオートメーション市場:ネットワークタイプ別
13.7 中東・アフリカのネットワークオートメーション市場:コンポーネント別
13.8 中東・アフリカのネットワークオートメーション市場:タイプ別
13.9 中東・アフリカ地域ネットワークオートメーション市場:業種別
13.10 GCCネットワークオートメーションの市場分析
13.10.1 オマーン
13.10.1.1 オマーンではボーダフォンとエリクソンがAIでデータドリブンな意思決定を推進
13.10.2 サウジアラビア
13.10.2.1 サウジアラビアのSTCがエリクソンと提携し、AIベースのソリューションでネットワークの強化を図る。
13.10.3 アラブ首長国連邦
13.10.3.1 ノキアとduがSDANでゼロタッチアクセスを実現
13.11 南アフリカのネットワークオートメーション市場分析
13.11.1 Telkomが南アフリカ向けに5Gをスピンアップ
13.11.2 アフリカ
13.11.2.1 超自動化・自律型ネットワークでアフリカを繋ぐ
13.12 その他の中東地域のネットワークオートメーション市場の分析
13.12.1 カタール
13.12.1.1 カタールにおけるIoTと自動化に関する専門家の議論
14 ラテンアメリカのネットワークオートメーション市場分析
14.1 主要な調査結果
14.1.1 Ericsson、ラテンアメリカでオートメーションとクラウドコンピューティングの研究を拡大
14.2 ラテンアメリカのネットワークオートメーション市場の魅力度指数
14.3 ラテンアメリカのネットワークオートメーション市場:金額別
14.4 ラテンアメリカのネットワークオートメーション市場:国別
14.5 ラテンアメリカのネットワークオートメーション市場:エンドユーザー別
14.6 ラテンアメリカのネットワークオートメーション市場:ネットワークタイプ別
14.7 ラテンアメリカのネットワークオートメーション市場:コンポーネント別
14.8 ラテンアメリカのネットワークオートメーション市場:タイプ別
14.9 ラテンアメリカのネットワークオートメーション市場:業種別
14.10 ブラジルのネットワークオートメーション市場分析
14.10.1 TelefónicaとWiproがドイツとブラジルでCI/CD/CT採用のネットワークオートメーション提供のために提携
14.11 メキシコのネットワークオートメーション市場の分析
14.11.1 メキシコは2023年に5G向けに最大7,750メガヘルツを利用可能にする予定
14.12 その他のラテンアメリカのネットワークオートメーション市場分析
15 主要企業のプロフィール
15.1 競合他社の状況、2023年
15.2 戦略的な展望
15.2.1 買収に関する主な進展
15.2.2 提携における主要な進展
15.2.3 エクスパンションにおける主要な展開
15.2.4 新製品上市における主要な進展
15.2.5 パートナーシップにおける主要な開発
15.3 Cisco Systems, Inc
15.3.1 会社概要
15.3.2 会社概要
15.3.3 財務分析
15.3.3.1 純収益、2018年~2022年
15.3.3.2 売上総利益、2018年-2022年
15.3.3.3 R&D、2018年~2022年
15.3.3.4 地域別レヴェニューシェア、2022年
15.3.3.5 事業セグメント別売上高シェア、2022年
15.3.4 製品ベンチマーク
15.3.5 戦略的な展望
15.4 Juniper Networks, Inc.
15.4.1 企業スナップショット
15.4.2 会社概要
15.4.3 財務分析
15.4.3.1 純収益、2018年-2022年
15.4.3.2 売上総利益、2018年~2022年
15.4.3.3 R&D、2018年~2022年
15.4.3.4 地域別レヴェニューシェア、2022年
15.4.3.5 事業セグメント別売上高シェア、2022年
15.4.4 製品ベンチマーク
15.4.5 戦略的な展望
15.5 IBM Corporation
15.5.1 企業スナップショット
15.5.2 会社概要
15.5.3 財務分析
15.5.3.1 純収益、2018年-2022年
15.5.3.2 売上総利益、2018年-2022年
15.5.3.3 R&D、2018年~2022年
15.5.3.4 地域別レヴェニューシェア、2022年
15.5.3.5 事業セグメント別売上高シェア、2022年
15.5.4 製品ベンチマーク
15.5.5 戦略的な展望
15.6 Micro Focus International plc
15.6.1 企業スナップショット
15.6.2 会社概要
15.6.3 財務分析
15.6.3.1 純収益、2017年-2021年
15.6.3.2 売上総利益、2017年-2021年
15.6.3.3 R&D、2017年-2021年
15.6.3.4 地域別レヴェニューシェア、2022年
15.6.3.5 事業セグメント別収益シェア、2022年
15.6.4 製品ベンチマーク
15.6.5 戦略的な展望
15.7 NetBrain Technologies Inc.
15.7.1 企業スナップショット
15.7.2 会社概要
15.7.3 ベンチマーキング製品
15.7.4 戦略的展望
15.8 Forward Networks, Inc.
15.8.1 企業スナップショット
15.8.2 会社概要
15.8.3 製品ベンチマーク
15.8.4 戦略的展望
15.9 SolarWinds Corporation
15.9.1 企業スナップショット
15.9.2 会社概要
15.9.3 財務分析
15.9.3.1 純収益、2017年-2021年
15.9.3.2 売上総利益、2017年-2021年
15.9.3.3 R&D、2017年-2021年
15.9.3.4 地域別売上高シェア、2022年
15.9.4 製品ベンチマーク
15.9.5 戦略的な展望
15.10 VMware, Inc
15.10.1 企業スナップショット
15.10.2 会社概要
15.10.3 財務分析
15.10.3.1 純収益、2018年-2022年
15.10.3.2 売上総利益、2018年-2022年
15.10.3.3 R&D、2018年-2022年
15.10.3.4 地域別売上高シェア、2022年
15.10.3.5 事業セグメント別収益シェア、2022年
15.10.4 製品ベンチマーク
15.10.5 戦略的な展望
15.11 BMC Software, Inc.
15.11.1 企業スナップショット
15.11.2 会社概要
15.11.3 ベンチマーキング製品
15.11.4 戦略的展望
15.12 BlueCat Networks
15.12.1 企業スナップショット
15.12.2 会社概要
15.12.3 製品ベンチマーク
15.12.4 戦略的展望
15.13 Anuta Networks
15.13.1 企業スナップショット
15.13.2 会社概要
15.13.3 製品ベンチマーク
15.13.4 戦略的展望
15.14 Riverbed Technology LLC
15.14.1 企業スナップショット
15.14.2 会社概要
15.14.3 製品ベンチマーク
15.14.4 戦略的展望
15.15 Itential
15.15.1 企業スナップショット
15.15.2 会社概要
15.15.3 製品ベンチマーク
15.15.4 戦略的展望
15.16 Kentik
15.16.1 企業スナップショット
15.16.2 会社概要
15.16.3 ベンチマーキング
15.16.4 戦略的展望
15.17 Versa Networks
15.17.1 企業スナップショット
15.17.2 会社概要
15.17.3 ベンチマーキング
15.17.4 戦略的展望
16 結論と提言
16.1 ヴィジョンゲインからの結論
16.2 市場関係者への提言
表の一覧
Table 1 Network Automation Market Snapshot, 2023 & 2033 (US$ million, CAGR %)
Table 2 Network Automation Market by Region, 2023-2033 (US$ Mn, AGR (%), CAGR (%)) (V-Shaped Recovery Scenario)
Table 3 Network Automation Market by Region, 2023-2033 (US$ Mn, AGR (%), CAGR (%)) (W-Shaped Recovery Scenario)
Table 4 Network Automation Market by Region, 2023-2033 (US$ Mn, AGR (%), CAGR (%)) (U-Shaped Recovery Scenario)
Table 5 Network Automation Market by Region, 2023-2033 (US$ Mn, AGR (%), CAGR (%)) (L-Shaped Recovery Scenario)
Table 6 Network Automation Market by End-User, 2023-2033 (US$ Mn, AGR (%), CAGR (%))
Table 7 Enterprise Vertical Market by Region, 2023-2033 (US$ Mn, AGR (%), CAGR (%))
Table 8 Service Providers Market by Region, 2023-2033 (US$ Mn, AGR (%), CAGR (%))
Table 9 Network Automation Market by Network Type, 2023-2033 (US$ Mn, AGR (%), CAGR (%))
Table 10 Physical Network Market by Region, 2023-2033 (US$ Mn, AGR (%), CAGR (%))
Table 11 Virtual Network Market by Region, 2023-2033 (US$ Mn, AGR (%), CAGR (%))
Table 12 Hybrid Network Market by Region, 2023-2033 (US$ Mn, AGR (%), CAGR (%))
Table 13 Network Automation Market by Component, 2023-2033 (US$ Mn, AGR (%), CAGR (%))
Table 14 Network Automation Tools Market by Region, 2023-2033 (US$ Mn, AGR (%), CAGR (%))
Table 15 Intent-based Networking Market by Region, 2023-2033 (US$ Mn, AGR (%), CAGR (%))
Table 16 Deployment and Integration Market by Region, 2023-2033 (US$ Mn, AGR (%), CAGR (%))
Table 17 Other Components Market by Region, 2023-2033 (US$ Mn, AGR (%), CAGR (%))
Table 18 Network Automation Market by Type, 2023-2033 (US$ Mn, AGR (%), CAGR (%))
Table 19 Local Area Network (LAN) Market by Region, 2023-2033 (US$ Mn, AGR (%), CAGR (%))
Table 20 Wide Area Network (WAN) Market by Region, 2023-2033 (US$ Mn, AGR (%), CAGR (%))
Table 21 Data Centre Networks Market by Region, 2023-2033 (US$ Mn, AGR (%), CAGR (%))
Table 22 Cloud Networks Market by Region, 2023-2033 (US$ Mn, AGR (%), CAGR (%))
Table 23 Wireless Networks Market by Region, 2023-2033 (US$ Mn, AGR (%), CAGR (%))
Table 24 Network Automation Market by Vertical, 2023-2033 (US$ Mn, AGR (%), CAGR (%))
Table 25 Information Technology (IT) Market by Region, 2023-2033 (US$ Mn, AGR (%), CAGR (%))
Table 26 Banking, Financial Services, and Insurance (BFSI) Market by Region, 2023-2033 (US$ Mn, AGR (%), CAGR (%))
Table 27 Manufacturing Market by Region, 2023-2033 (US$ Mn, AGR (%), CAGR (%))
Table 28 Healthcare Market by Region, 2023-2033 (US$ Mn, AGR (%), CAGR (%))
Table 29 Energy and Utilities Market by Region, 2023-2033 (US$ Mn, AGR (%), CAGR (%))
Table 30 Other Vertical Market by Region, 2023-2033 (US$ Mn, AGR (%), CAGR (%))
Table 31 Network Automation Market by Region, 2023-2033 (US$ Mn, AGR (%), CAGR (%))
Table 32 North America Network Automation Market by Value, 2023-2033 (US$ Mn, AGR (%), CAGR (%))
Table 33 North America Network Automation Market by Country, 2023-2033 (US$ Mn, AGR (%), CAGR (%))
Table 34 North America Network Automation Market by End-User, 2023-2033 (US$ Mn, AGR (%), CAGR (%))
Table 35 North America Network Automation Market by Network Type, 2023-2033 (US$ Mn, AGR (%), CAGR (%))
Table 36 North America Network Automation Market by Component, 2023-2033 (US$ Mn, AGR (%), CAGR (%))
Table 37 North America Network Automation Market by Type, 2023-2033 (US$ Mn, AGR (%), CAGR (%))
Table 38 North America Network Automation Market by Vertical, 2023-2033 (US$ Mn, AGR (%), CAGR (%))
Table 39 US Network Automation Market by Value, 2023-2033 (US$ Mn, AGR (%), CAGR (%))
Table 40 Canada Network Automation Market by Value, 2023-2033 (US$ Mn, AGR (%), CAGR (%))
Table 41 Europe Network Automation Market by Value, 2023-2033 (US$ Mn, AGR (%), CAGR (%))
Table 42 Europe Network Automation Market by Country, 2023-2033 (US$ Mn, AGR (%), CAGR (%))
Table 43 Europe Network Automation Market by End-User, 2023-2033 (US$ Mn, AGR (%), CAGR (%))
Table 44 Europe Network Automation Market by Network Type, 2023-2033 (US$ Mn, AGR (%), CAGR (%))
Table 45 Europe Network Automation Market by Component, 2023-2033 (US$ Mn, AGR (%), CAGR (%))
Table 46 Europe Network Automation Market by Type, 2023-2033 (US$ Mn, AGR (%), CAGR (%))
Table 47 Europe Network Automation Market by Vertical, 2023-2033 (US$ Mn, AGR (%), CAGR (%))
Table 48 Germany Network Automation Market by Value, 2023-2033 (US$ Mn, AGR (%), CAGR (%))
Table 49 UK Network Automation Market by Value, 2023-2033 (US$ Mn, AGR (%), CAGR (%))
Table 50 France Network Automation Market by Value, 2023-2033 (US$ Mn, AGR (%), CAGR (%))
Table 51 Italy Network Automation Market by Value, 2023-2033 (US$ Mn, AGR (%), CAGR (%))
Table 52 Spain Network Automation Market by Value, 2023-2033 (US$ Mn, AGR (%), CAGR (%))
Table 53 Rest of Europe Network Automation Market by Value, 2023-2033 (US$ Mn, AGR (%), CAGR (%))
Table 54 Asia-Pacific Network Automation Market by Value, 2023-2033 (US$ Mn, AGR (%), CAGR (%))
Table 55 Asia-Pacific Network Automation Market by Country, 2023-2033 (US$ Mn, AGR (%), CAGR (%))
Table 56 Asia-Pacific Network Automation Market by End-User, 2023-2033 (US$ Mn, AGR (%), CAGR (%))
Table 57 Asia-Pacific Network Automation Market by Network Type, 2023-2033 (US$ Mn, AGR (%), CAGR (%))
Table 58 Asia-Pacific Network Automation Market by Component, 2023-2033 (US$ Mn, AGR (%), CAGR (%))
Table 59 Asia-Pacific Network Automation Market by Type, 2023-2033 (US$ Mn, AGR (%), CAGR (%))
Table 60 Asia-Pacific Network Automation Market by Vertical, 2023-2033 (US$ Mn, AGR (%), CAGR (%))
Table 61 China Network Automation Market by Value, 2023-2033 (US$ Mn, AGR (%), CAGR (%))
Table 62 India Network Automation Market by Value, 2023-2033 (US$ Mn, AGR (%), CAGR (%))
Table 63 Japan Network Automation Market by Value, 2023-2033 (US$ Mn, AGR (%), CAGR (%))
Table 64 South Korea Network Automation Market by Value, 2023-2033 (US$ Mn, AGR (%), CAGR (%))
Table 65 Australia Network Automation Market by Value, 2023-2033 (US$ Mn, AGR (%), CAGR (%))
Table 66 Rest of Asia-Pacific Network Automation Market by Value, 2023-2033 (US$ Mn, AGR (%), CAGR (%))
Table 67 Middle East & Africa Network Automation Market by Value, 2023-2033 (US$ Mn, AGR (%), CAGR (%))
Table 68 Middle East & Africa Network Automation Market by Country, 2023-2033 (US$ Mn, AGR (%), CAGR (%))
Table 69 Middle East & Africa Network Automation Market by End-User, 2023-2033 (US$ Mn, AGR (%), CAGR (%))
Table 70 Middle East & Africa Network Automation Market by Network Type, 2023-2033 (US$ Mn, AGR (%), CAGR (%))
Table 71 Middle East & Africa Network Automation Market by Component, 2023-2033 (US$ Mn, AGR (%), CAGR (%))
Table 72 Middle East & Africa Network Automation Market by Type, 2023-2033 (US$ Mn, AGR (%), CAGR (%))
Table 73 Middle East & Africa Network Automation Market by Vertical, 2023-2033 (US$ Mn, AGR (%), CAGR (%))
Table 74 GCC Network Automation Market by Value, 2023-2033 (US$ Mn, AGR (%), CAGR (%))
Table 75 South Africa Network Automation Market by Value, 2023-2033 (US$ Mn, AGR (%), CAGR (%))
Table 76 Rest of Middle East & Africa Network Automation Market by Value, 2023-2033 (US$ Mn, AGR (%), CAGR (%))
Table 77 Latin America Network Automation Market by Value, 2023-2033 (US$ Mn, AGR (%), CAGR (%))
Table 78 Latin America Network Automation Market by Country, 2023-2033 (US$ Mn, AGR (%), CAGR (%))
Table 79 Latin America Network Automation Market by End-User, 2023-2033 (US$ Mn, AGR (%), CAGR (%))
Table 80 Latin America Network Automation Market by Network Type, 2023-2033 (US$ Mn, AGR (%), CAGR (%))
Table 81 Latin America Network Automation Market by Component, 2023-2033 (US$ Mn, AGR (%), CAGR (%))
Table 82 Latin America Network Automation Market by Type, 2023-2033 (US$ Mn, AGR (%), CAGR (%))
Table 83 Latin America Network Automation Market by Vertical, 2023-2033 (US$ Mn, AGR (%), CAGR (%))
Table 84 Brazil Network Automation Market by Value, 2023-2033 (US$ Mn, AGR (%), CAGR (%))
Table 85 Mexico Network Automation Market by Value, 2023-2033 (US$ Mn, AGR (%), CAGR (%))
Table 86 Rest of Latin America Network Automation Market by Value, 2023-2033 (US$ Mn, AGR (%), CAGR (%))
Table 87 Cisco Systems, Inc: Key Details, (CEO, HQ, Revenue, Founded, No. of Employees, Company Type, Website, Business Segment)
Table 88 Cisco Systems, Inc: Product Benchmarking
Table 89 Cisco Systems, Inc: Strategic Outlook
Table 90 Juniper Networks, Inc.: Key Details, (CEO, HQ, Revenue, Founded, No. of Employees, Company Type, Website, Business Segment)
Table 91 Juniper Networks, Inc.: Product Benchmarking
Table 92 Juniper Networks, Inc.: Strategic Outlook
Table 93 IBM Corporation: Key Details, (CEO, HQ, Revenue, Founded, No. of Employees, Company Type, Website, Business Segment)
Table 94 IBM Corporation: Product Benchmarking
Table 95 IBM Corporation: Strategic Outlook
Table 96 Micro Focus International plc: Key Details, (CEO, HQ, Revenue, Founded, No. of Employees, Company Type, Website, Business Segment)
Table 97 Micro Focus International plc: Product Benchmarking
Table 98 Micro Focus International plc: Strategic Outlook
Table 99 NetBrain Technologies Inc.: Key Details, (CEO, HQ, Revenue, Founded, No. of Employees, Company Type, Website, Business Segment)
Table 100 NetBrain Technologies Inc.: Product Benchmarking
Table 101 NetBrain Technologies Inc.: Strategic Outlook
Table 102 Forward Networks, Inc.: Key Details, (CEO, HQ, Revenue, Founded, No. of Employees, Company Type, Website, Business Segment)
Table 103 Forward Networks, Inc.: Product Benchmarking
Table 104 Forward Networks, Inc.: Strategic Outlook
Table 105 SolarWinds Corporation: Key Details, (CEO, HQ, Revenue, Founded, No. of Employees, Company Type, Website, Business Segment)
Table 106 SolarWinds Corporation: Product Benchmarking
Table 107 SolarWinds Corporation: Strategic Outlook
Table 108 VMware, Inc: Key Details, (CEO, HQ, Revenue, Founded, No. of Employees, Company Type, Website, Business Segment)
Table 109 VMware, Inc: Product Benchmarking
Table 110 VMware, Inc: Strategic Outlook
Table 111 BMC Software, Inc.: Key Details, (CEO, HQ, Revenue, Founded, No. of Employees, Company Type, Website, Business Segment)
Table 112 BMC Software, Inc.: Product Benchmarking
Table 113 BMC Software, Inc.: Strategic Outlook
Table 114 BlueCat Networks: Key Details, (CEO, HQ, Revenue, Founded, No. of Employees, Company Type, Website, Business Segment)
Table 115 BlueCat Networks: Product Benchmarking
Table 116 BlueCat Networks: Strategic Outlook
Table 117 Anuta Networks: Key Details, (CEO, HQ, Revenue, Founded, No. of Employees, Company Type, Website, Business Segment)
Table 118 Anuta Networks: Product Benchmarking
Table 119 Anuta Networks: Strategic Outlook
Table 120 Riverbed Technology LLC: Key Details, (CEO, HQ, Revenue, Founded, No. of Employees, Company Type, Website, Business Segment)
Table 121 Riverbed Technology LLC: Product Benchmarking
Table 122 Riverbed Technology LLC: Strategic Outlook
Table 123 Network Automation: Key Details, (CEO, HQ, Revenue, Founded, No. of Employees, Company Type, Website, Business Segment)
Table 124 Itential: Product Benchmarking
Table 125 Itential: Strategic Outlook
Table 126 Kentik: Key Details, (CEO, HQ, Revenue, Founded, No. of Employees, Company Type, Website, Business Segment)
Table 127 Kentik: Product Benchmarking
Table 128 Kentik: Strategic Outlook
Table 129 Versa Networks: Key Details, (CEO, HQ, Revenue, Founded, No. of Employees, Company Type, Website, Business Segment)
Table 130 Versa Networks: Product Benchmarking
Table 131 Versa Networks: Strategic Outlook
図の一覧
Figure 1 Network Automation Market Segmentation
Figure 2 Network Automation Market by End-Users: Market Attractiveness Index
Figure 3 Network Automation Market by Network Type: Market Attractiveness Index
Figure 4 Network Automation Market by Component: Market Attractiveness Index
Figure 5 Network Automation Market by Type: Market Attractiveness Index
Figure 6 Network Automation Market by Vertical Market Attractiveness Index
Figure 7 Network Automation Market Attractiveness Index by Region
Figure 8 Network Automation Market: Market Dynamics
Figure 9 COVID Impact Analysis: Network Automation Market Recovery Scenarios
Figure 10 Network Automation Market by Region, 2023-2033 (US$ Mn, AGR (%)) (V-Shaped Recovery Scenario)
Figure 11 Network Automation Market by Region, 2023-2033 (US$ Mn, AGR (%)) (W-Shaped Recovery Scenario)
Figure 12 Network Automation Market by Region, 2023-2033 (US$ Mn, AGR (%)) (U-Shaped Recovery Scenario)
Figure 13 Network Automation Market by Region, 2023-2033 (US$ Mn, AGR (%)) (L-Shaped Recovery Scenario)
Figure 14 Network Automation Market: Porter’s Five Forces Analysis
Figure 15 Network Automation Market: PEST Analysis
Figure 16 Network Automation Market by End-Users: Market Attractiveness Index
Figure 17 Network Automation Market by End-User, 2023-2033 (US$ Mn, AGR (%))
Figure 18 Enterprise Vertical Market by Region, 2023-2033 (US$ Mn, AGR (%))
Figure 19 Enterprise Vertical Market Share Forecast by Region, 2023 & 2033 (%)
Figure 20 Service Providers Market by Region, 2023-2033 (US$ Mn, AGR (%))
Figure 21 Service Providers Market Share Forecast by Region, 2023 & 2033 (%)
Figure 22 Network Automation Market by Network Type: Market Attractiveness Index
Figure 23 Network Automation Market by Network Type, 2023-2033 (US$ Mn, AGR (%))
Figure 24 Physical Network Market by Region, 2023-2033 (US$ Mn, AGR (%))
Figure 25 Physical Network Market Share Forecast by Region, 2023 & 2033 (%)
Figure 26 Virtual Network Market by Region, 2023-2033 (US$ Mn, AGR (%))
Figure 27 Virtual Network Market Share Forecast by Region, 2023 & 2033 (%)
Figure 28 Hybrid Network Market by Region, 2023-2033 (US$ Mn, AGR (%))
Figure 29 Hybrid Network Market Share Forecast by Region, 2023 & 2033 (%)
Figure 30 Network Automation Market by Components: Market Attractiveness Index
Figure 31 Network Automation Market by Component, 2023-2033 (US$ Mn, AGR (%))
Figure 32 Network Automation Tools Market by Region, 2023-2033 (US$ Mn, AGR (%))
Figure 33 Network Automation Tools Market Share Forecast by Region, 2023 & 2033 (%)
Figure 34 Intent-based Networking Market by Region, 2023-2033 (US$ Mn, AGR (%))
Figure 35 Intent-Based Networking Market Share Forecast by Region, 2023 & 2033 (%)
Figure 36 Deployment and Integration Market by Region, 2023-2033 (US$ Mn, AGR (%))
Figure 37 Deployment and Integration Market Share Forecast by Region, 2023 & 2033 (%)
Figure 38 Other Components Market by Region, 2023-2033 (US$ Mn, AGR (%))
Figure 39 Other Components Market Share Forecast by Region, 2023 & 2033 (%)
Figure 40 Network Automation Market by Type: Market Attractiveness Index
Figure 41 Network Automation Market by Type, 2023-2033 (US$ Mn, AGR (%))
Figure 42 Local Area Network (LAN) Market by Region, 2023-2033 (US$ Mn, AGR (%))
Figure 43 Local Area Network (LAN) Market Share Forecast by Region, 2023 & 2033 (%)
Figure 44 Wide Area Network (WAN) Market by Region, 2023-2033 (US$ Mn, AGR (%))
Figure 45 Wide Area Network (WAN) Market Share Forecast by Region, 2023 & 2033 (%)
Figure 46 Data Centre Networks Market by Region, 2023-2033 (US$ Mn, AGR (%))
Figure 47 Data Centre Networks Market Share Forecast by Region, 2023 & 2033 (%)
Figure 48 Cloud Networks Market by Region, 2023-2033 (US$ Mn, AGR (%))
Figure 49 Cloud Networks Market Share Forecast by Region, 2023 & 2033 (%)
Figure 50 Wireless Networks Market by Region, 2023-2033 (US$ Mn, AGR (%))
Figure 51 Wireless Networks Market Share Forecast by Region, 2023 & 2033 (%)
Figure 52 Network Automation Market by Vertical: Market Attractiveness Index
Figure 53 Network Automation Market by Vertical, 2023-2033 (US$ Mn, AGR (%))
Figure 54 Information Technology (IT) Market by Region, 2023-2033 (US$ Mn, AGR (%))
Figure 55 Information Technology (IT) Market Share Forecast by Region, 2023 & 2033 (%)
Figure 56 Banking, Financial Services, and Insurance (BFSI) Market by Region, 2023-2033 (US$ Mn, AGR (%))
Figure 57 Banking, Financial Services, and Insurance (BFSI) Market Share Forecast by Region, 2023 & 2033 (%)
Figure 58 Manufacturing Market by Region, 2023-2033 (US$ Mn, AGR (%))
Figure 59 Manufacturing Market Share Forecast by Region, 2023 & 2033 (%)
Figure 60 Healthcare Market by Region, 2023-2033 (US$ Mn, AGR (%))
Figure 61 Healthcare Market Share Forecast by Region, 2023 & 2033 (%)
Figure 62 Energy and Utilities Market by Region, 2023-2033 (US$ Mn, AGR (%))
Figure 63 Energy and Utilities Market Share Forecast by Region, 2023 & 2033 (%)
Figure 64 Other Vertical Market by Region, 2023-2033 (US$ Mn, AGR (%))
Figure 65 Other Vertical Market Share Forecast by Region, 2023 & 2033 (%)
Figure 66 Network Automation Market Forecast by Region 2023, 2033 (Revenue, CAGR%)
Figure 67 Network Automation Market by Region, 2023-2033 (US$ Mn, AGR (%))
Figure 68 North America Network Automation Market Attractiveness Index
Figure 69 North America Network Automation Market by Value, 2023-2033 (US$ Mn, AGR (%))
Figure 70 North America Network Automation Market by Country, 2023-2033 (US$ Mn, AGR (%))
Figure 71 North America Network Automation Market Share Forecast by Country, 2023-2033 (%)
Figure 72 North America Network Automation Market by End-User, 2023-2033 (US$ Mn, AGR (%))
Figure 73 North America Network Automation Market Share Forecast by End-Users, 2023-2033 (%)
Figure 74 North America Network Automation Market by Network Type, 2023-2033 (US$ Mn, AGR (%))
Figure 75 North America Network Automation Market Share Forecast by Network Type, 2023-2033 (%)
Figure 76 North America Network Automation Market by Component, 2023-2033 (US$ Mn, AGR (%))
Figure 77 North America Network Automation Market Share Forecast by Components, 2023-2033 (%)
Figure 78 North America Network Automation Market by Type, 2023-2033 (US$ Mn, AGR (%))
Figure 79 North America Network Automation Market Share Forecast by Type, 2023-2033 (%)
Figure 80 North America Network Automation Market by Vertical, 2023-2033 (US$ Mn, AGR (%))
Figure 81 North America Network Automation Market Share Forecast by Vertical, 2023-2033 (%)
Figure 82 US Network Automation Market by Value, 2023-2033 (US$ Mn, AGR (%))
Figure 83 Canada Network Automation Market by Value, 2023-2033 (US$ Mn, AGR (%))
Figure 84 Europe Network Automation Market Attractiveness Index
Figure 85 Europe Network Automation Market by Value, 2023-2033 (US$ Mn, AGR (%))
Figure 86 Europe Network Automation Market by Country, 2023-2033 (US$ Mn, AGR (%))
Figure 87 Network Automation Market Share Forecast by Country, 2023-2033 (%)
Figure 88 Europe Network Automation Market by End-User, 2023-2033 (US$ Mn, AGR (%))
Figure 89 Network Automation Market Share Forecast by End-Users, 2023-2033 (%)
Figure 90 Europe Network Automation Market by Network Type, 2023-2033 (US$ Mn, AGR (%))
Figure 91 Network Automation Market Share Forecast by Network Type, 2023-2033 (%)
Figure 92 Europe Network Automation Market by Component, 2023-2033 (US$ Mn, AGR (%))
Figure 93 Network Automation Market Share Forecast by Components, 2023-2033 (%)
Figure 94 Europe Network Automation Market by Type, 2023-2033 (US$ Mn, AGR (%))
Figure 95 Network Automation Market Share Forecast by Type, 2023-2033 (%)
Figure 96 Europe Network Automation Market by Vertical, 2023-2033 (US$ Mn, AGR (%))
Figure 97 Network Automation Market Share Forecast by Vertical, 2023-2033 (%)
Figure 98 Germany Network Automation Market by Value, 2023-2033 (US$ Mn, AGR (%))
Figure 99 UK Network Automation Market by Value, 2023-2033 (US$ Mn, AGR (%))
Figure 100 France Network Automation Market by Value, 2023-2033 (US$ Mn, AGR (%))
Figure 101 Italy Network Automation Market by Value, 2023-2033 (US$ Mn, AGR (%))
Figure 102 Spain Network Automation Market by Value, 2023-2033 (US$ Mn, AGR (%))
Figure 103 Rest of Europe Network Automation Market by Value, 2023-2033 (US$ Mn, AGR (%))
Figure 1 Asia-Pacific Network Automation Market Attractiveness Index
Figure 104 Asia-Pacific Network Automation Market by Value, 2023-2033 (US$ Mn, AGR (%))
Figure 105 Asia-Pacific Network Automation Market by Country, 2023-2033 (US$ Mn, AGR (%))
Figure 106 Network Automation Market Share Forecast by Country, 2023-2033 (%)
Figure 107 Asia-Pacific Network Automation Market by End-User, 2023-2033 (US$ Mn, AGR (%))
Figure 108 Network Automation Market Share Forecast by End-Users, 2023-2033 (%)
Figure 109 Asia-Pacific Network Automation Market by Network Type, 2023-2033 (US$ Mn, AGR (%))
Figure 110 Network Automation Market Share Forecast by Network Type, 2023-2033 (%)
Figure 111 Asia-Pacific Network Automation Market by Component, 2023-2033 (US$ Mn, AGR (%))
Figure 112 Network Automation Market Share Forecast by Components, 2023-2033 (%)
Figure 113 Asia-Pacific Network Automation Market by Type, 2023-2033 (US$ Mn, AGR (%))
Figure 114 Network Automation Market Share Forecast by Type, 2023-2033 (%)
Figure 115 Asia-Pacific Network Automation Market by Vertical, 2023-2033 (US$ Mn, AGR (%))
Figure 116 Network Automation Market Share Forecast by Vertical, 2023-2033 (%)
Figure 117 China Network Automation Market by Value, 2023-2033 (US$ Mn, AGR (%))
Figure 118 India Network Automation Market by Value, 2023-2033 (US$ Mn, AGR (%))
Figure 119 Japan Network Automation Market by Value, 2023-2033 (US$ Mn, AGR (%))
Figure 120 South Korea Network Automation Market by Value, 2023-2033 (US$ Mn, AGR (%))
Figure 121 Australia Network Automation Market by Value, 2023-2033 (US$ Mn, AGR (%))
Figure 122 Rest of Asia-Pacific Network Automation Market by Value, 2023-2033 (US$ Mn, AGR (%))
Figure 123 MEA Network Automation Market Attractiveness Index
Figure 124 Middle East & Africa Network Automation Market by Value, 2023-2033 (US$ Mn, AGR (%))
Figure 125 Middle East & Africa Network Automation Market by Country, 2023-2033 (US$ Mn, AGR (%))
Figure 126 Network Automation Market Share Forecast by Country, 2023-2033 (%)
Figure 127 Middle East & Africa Network Automation Market by End-User, 2023-2033 (US$ Mn, AGR (%))
Figure 128 Network Automation Market Share Forecast by End-Users, 2023-2033 (%)
Figure 129 Middle East & Africa Network Automation Market by Network Type, 2023-2033 (US$ Mn, AGR (%))
Figure 130 Network Automation Market Share Forecast by Network Type, 2023-2033 (%)
Figure 131 Middle East & Africa Network Automation Market by Component, 2023-2033 (US$ Mn, AGR (%))
Figure 132 Network Automation Market Share Forecast by Components, 2023-2033 (%)
Figure 133 Middle East & Africa Network Automation Market by Type, 2023-2033 (US$ Mn, AGR (%))
Figure 134 Network Automation Market Share Forecast by Type, 2023-2033 (%)
Figure 135 Middle East & Africa Network Automation Market by Vertical, 2023-2033 (US$ Mn, AGR (%))
Figure 136 Network Automation Market Share Forecast by Vertical, 2023-2033 (%)
Figure 137 GCC Network Automation Market by Value, 2023-2033 (US$ Mn, AGR (%))
Figure 138 South Africa Network Automation Market by Value, 2023-2033 (US$ Mn, AGR (%))
Figure 139 Rest of Middle East & Africa Network Automation Market by Value, 2023-2033 (US$ Mn, AGR (%))
Figure 140 Network Automation Latin America Market Attractiveness Index
Figure 141 Latin America Network Automation Market by Value, 2023-2033 (US$ Mn, AGR (%))
Figure 142 Latin America Network Automation Market by Country, 2023-2033 (US$ Mn, AGR (%))
Figure 143 Network Automation Market Share Forecast by Country, 2023-2033 (%)
Figure 144 Latin America Network Automation Market by End-User, 2023-2033 (US$ Mn, AGR (%))
Figure 145 Network Automation Market Share Forecast by End-Users, 2023-2033 (%)
Figure 146 Latin America Network Automation Market by Network Type, 2023-2033 (US$ Mn, AGR (%))
Figure 147 Network Automation Market Share Forecast by Network Type, 2023-2033 (%)
Figure 148 Latin America Network Automation Market by Component, 2023-2033 (US$ Mn, AGR (%))
Figure 149 Network Automation Market Share Forecast by Components, 2023-2033 (%)
Figure 150 Latin America Network Automation Market by Type, 2023-2033 (US$ Mn, AGR (%))
Figure 151 Network Automation Market Share Forecast by Type, 2023-2033 (%)
Figure 152 Latin America Network Automation Market by Vertical, 2023-2033 (US$ Mn, AGR (%))
Figure 153 Network Automation Market Share Forecast by Vertical, 2023-2033 (%)
Figure 154 Brazil Network Automation Market by Value, 2023-2033 (US$ Mn, AGR (%))
Figure 155 Mexico Network Automation Market by Value, 2023-2033 (US$ Mn, AGR (%))
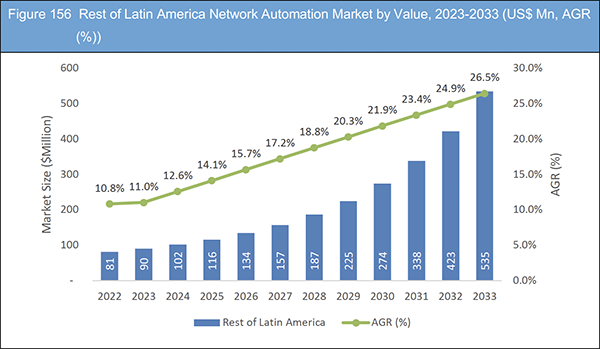
Figure 156 Rest of Latin America Network Automation Market by Value, 2023-2033 (US$ Mn, AGR (%))
Figure 157 Network Automation Market: Company Share/Ranking, 2021
Figure 158 Cisco Systems, Inc: Net Revenue, 2018-2022 (US$ million, AGR%)
Figure 159 Cisco Systems, Inc: Gross Profit, 2018-2022 (US$ million, AGR%)
Figure 160 Cisco Systems, Inc: R&D, 2018-2022 (US$ million, AGR%)
Figure 161 Cisco Systems, Inc: Regional Revenue Share, 2022 (%)
Figure 162 Cisco Systems, Inc: Business Segment Revenue Share, 2022 (%)
Figure 163 Juniper Networks, Inc.: Net Revenue, 2018-2022 (US$ million, AGR%)
Figure 164 Juniper Networks, Inc.: Gross Profit, 2018-2022 (US$ million, AGR%)
Figure 165 Juniper Networks, Inc.: R&D, 2018-2022 (US$ million, AGR%)
Figure 166 Juniper Networks, Inc: Regional Revenue Share, 2022 (%)
Figure 167 Juniper Networks, Inc: Business Segment Revenue Share, 2022 (%)
Figure 168 IBM Corporation: Net Revenue, 2018-2022 (US$ million, AGR%)
Figure 169 IBM Corporation: Gross Profit, 2018-2022 (US$ million, AGR%)
Figure 170 IBM Corporation: R&D, 2018-2022 (US$ million, AGR%)
Figure 171 IBM Corporation: Regional Revenue Share, 2022 (%)
Figure 172 IBM Corporation: Business Segment Revenue Share, 2022 (%)
Figure 173 Micro Focus International plc: Net Revenue, 2017-2021 (US$ million, AGR%)
Figure 174 Micro Focus International plc: Gross Profit, 2017-2021 (US$ million, AGR%)
Figure 175 Micro Focus International plc: R&D, 2017-2021 (US$ million, AGR%)
Figure 176 Micro Focus International plc: Regional Revenue Share, 2022 (%)
Figure 177 Micro Focus International plc: Business Segment Revenue Share, 2022 (%)
Figure 178 SolarWinds Corporation: Net Revenue, 2017-2021 (US$ million, AGR%)
Figure 179 SolarWinds Corporation: Gross Profit, 2017-2021 (US$ million, AGR%)
Figure 180 SolarWinds Corporation: R&D, 2017-2021 (US$ million, AGR%)
Figure 181 SolarWinds Corporation: Regional Revenue Share, 2022 (%)
Figure 182 VMware, Inc: Net Revenue, 2018-2022 (US$ million, AGR%)
Figure 183 VMware, Inc: Gross Profit, 2018-2022 (US$ million, AGR%)
Figure 184 VMware, Inc: R&D, 2018-2022 (US$ million, AGR%)
Figure 185 VMware, Inc: Regional Revenue Share, 2022 (%)
Figure 186 VMware, Inc: Business Segment Revenue Share, 2022 (%)
ページTOPに戻る
Summary
Report Details
The Network Automation Market Report 2023-2033: This report will prove invaluable to leading firms striving for new revenue pockets if they wish to better understand the industry and its underlying dynamics. It will be useful for companies that would like to expand into different industries or to expand their existing operations in a new region.
Widespread Adoption of Software-Defined Networking (SDN) Technologies
The network automation market is a rapidly growing segment of the IT industry that provides solutions to manage and automate various networking tasks and processes. The increasing complexity of modern networks, coupled with the need to streamline operations and reduce manual errors, has driven the growth of network automation. The market is estimated to be worth several billion dollars and is expected to continue its upward trajectory in the coming years.
One of the key drivers of network automation is the widespread adoption of software-defined networking (SDN) technologies. SDN provides a centralized view of the network and enables automation by programmatically controlling network behaviour through APIs. This allows organizations to dynamically manage and configure their networks, resulting in improved agility and faster service delivery.
The Increasing Demand for Network Security
One of the important factors driving the growth of network automation is the increasing demand for network security. With the rise of cyber threats, organizations are seeking solutions to improve their network security posture and reduce the risk of data breaches. Network automation can help by automating security tasks such as firewalls, intrusion detection, and data encryption, freeing up security teams to focus on more strategic initiatives.
What Questions Should You Ask before Buying a Market Research Report?
• How is the network automation market evolving?
• What is driving and restraining the network automation market?
• How will each network automation submarket segment grow over the forecast period and how much revenue will these submarkets account for in 2033?
• How will the market shares for each network automation submarket develop from 2023 to 2033?
• What will be the main driver for the overall market from 2023 to 2033?
• Will leading network automation markets broadly follow the macroeconomic dynamics, or will individual national markets outperform others?
• How will the market shares of the national markets change by 2033 and which geographical region will lead the market in 2033?
• Who are the leading players and what are their prospects over the forecast period?
• What are the network automation projects for these leading companies?
• How will the industry evolve during the period between 2023 and 2033? What are the implications of network automation projects taking place now and over the next 10 years?
• Is there a greater need for product commercialisation to further scale the network automation market?
• Where is the network automation market heading and how can you ensure you are at the forefront of the market?
• What are the best investment options for new product and service lines?
• What are the key prospects for moving companies into a new growth path and C-suite?
You need to discover how this will impact the network automation market today, and over the next 10 years:
• Our 381-page report provides 131 tables and 186 charts/graphs exclusively to you.
• The report highlights key lucrative areas in the industry so you can target them – NOW.
• It contains in-depth analysis of global, regional and national sales and growth.
• It highlights for you the key successful trends, changes and revenue projections made by your competitors.
This report tells you TODAY how the network automation market will develop in the next 10 years, and in line with the variations in COVID-19 economic recession and bounce. This market is more critical now than at any point over the last 10 years.
Forecasts to 2033 and other analyses reveal commercial prospects
• In addition to revenue forecasting to 2033, our new study provides you with recent results, growth rates, and market shares.
• You will find original analyses, with business outlooks and developments.
• Discover qualitative analyses (including market dynamics, drivers, opportunities, restraints and challenges), cost structure, impact of rising network automation prices and recent developments.
This report includes data analysis and invaluable insight into how COVID-19 will affect the industry and your company. Four COVID-19 recovery patterns and their impact, namely, “V”, “L”, “W” and “U” are discussed in this report.
Segments Covered in the Report
Market Segment by End-User
• Enterprise Vertical
• Service Providers
Market Segment by Network Type
• Physical Network
• Virtual Network
• Hybrid Network
Market Segment by Component
• Network Automation Tools
• Intent-based Networking
• Deployment and Integration
• Other Components
Market Segment by Type
• Local Area Network (LAN)
• Wide Area Network (WAN)
• Data Center Networks
• Cloud Networks
• Wireless Networks
Market Segment by Vertical
• Information Technology (IT)
• Banking, Financial Services, and Insurance (BFSI)
• Manufacturing
• Healthcare
• Energy and Utilities
• Other Vertical
In addition to the revenue predictions for the overall world market and segments, you will also find revenue forecasts for four regional and 20 leading national markets:
North America
• U.S.
• Canada
Europe
• Germany
• Spain
• United Kingdom
• France
• Italy
• Rest of Europe
Asia Pacific
• China
• Japan
• India
• Australia
• South Korea
• Rest of Asia Pacific
Latin America
• Brazil
• Mexico
• Rest of Latin America
Middle East & Africa
• GCC
• South Africa
• Rest of Middle East & Africa
The report also includes profiles and for some of the leading companies in the Network Automation Market, 2023 to 2033, with a focus on this segment of these companies’ operations.
Leading companies and the potential for market growth
• Anuta Networks
• BlueCat Networks
• BMC Software, Inc.
• Cisco Systems, Inc.
• Forward Networks, Inc.
• IBM Corporation
• Itential
• Juniper Networks, Inc.
• Kentik
• Micro Focus International plc
• NetBrain Technologies Inc.
• Riverbed Technology LLC
• SolarWinds Corporation
• Versa Networks
• VMware, Inc.
Overall world revenue for Network Automation Market, 2023 to 2033 in terms of value the market will surpass US$4,092 million in 2023, our work calculates. We predict strong revenue growth through to 2033. Our work identifies which organizations hold the greatest potential. Discover their capabilities, progress, and commercial prospects, helping you stay ahead.
How will the Network Automation Market, 2023 to 2033 report help you?
In summary, our 380+ page report provides you with the following knowledge:
• Revenue forecasts to 2033 for Network Automation Market, 2023 to 2033 Market, with forecasts for end-user, network type, component, type, vertical and company size, each forecast at a global and regional level – discover the industry’s prospects, finding the most lucrative places for investments and revenues.
• Revenue forecasts to 2033 for four regional and 20 key national markets – See forecasts for the Network Automation Market, 2023 to 2033 market in North America, Europe, Asia-Pacific, Latin America and Middle East & Africa. Also forecasted is the market in the US, Canada, Brazil, Germany, France, UK, Italy, China, India, Japan, and Australia among other prominent economies.
• Prospects for established firms and those seeking to enter the market – including company profiles for 15 of the major companies involved in the Network Automation Market, 2023 to 2033.
Find quantitative and qualitative analyses with independent predictions. Receive information that only our report contains, staying informed with invaluable business intelligence.
Information found nowhere else
With our new report, you are less likely to fall behind in knowledge or miss out on opportunities. See how our work could benefit your research, analyses, and decisions. Visiongain’s study is for everybody needing commercial analyses for the Network Automation Market, 2023 to 2033, market-leading companies. You will find data, trends and predictions.
ページTOPに戻る
Table of Contents
Table of Contents
1 Report Overview
1.1 Objectives of the Study
1.2 Introduction to Network Automation Market
1.3 What This Report Delivers
1.4 Why You Should Read This Report
1.5 Key Questions Answered by This Analytical Report
1.6 Who is This Report for?
1.7 Research Methodology
1.7.1 Market Definitions
1.7.2 Market Evaluation & Forecasting Methodology
1.7.3 Data Validation
1.7.3.1 Primary Research
1.7.3.2 Secondary Research
1.8 Frequently Asked Questions (FAQs)
1.9 Associated Visiongain Reports
1.10 About Visiongain
2 Executive Summary
2.1 Segment analysis
2.1.1 End User Segment: Market Attractiveness Index
2.1.2 Network Type Segment: Market Attractiveness Index
2.1.3 Components segment: Market Attractiveness Index
2.1.4 Type Segment: Market Attractiveness Index
2.1.5 Vertical Segment: Market Attractiveness Index
2.2 Regional analysis
2.2.1 Network Automation Market Attractiveness Index by Region
3 Market Overview
3.1 Key Findings
3.2 Structure Overview
3.3 Market Dynamics
3.3.1 Market Driving Factors
3.3.1.1 Increasing Adoption of Cloud Technology
3.3.1.2 Growing Demand for Virtualization
3.3.1.3 Increasing Need for Network Security
3.3.1.4 Growing Demand for Digital Transformation
3.3.2 Market Restraining Factors
3.3.2.1 Complexity of Implementing Network Automation Solutions
3.3.2.2 Lack of Interoperability
3.3.2.3 Resistance to Change
3.3.2.4 Security Concerns
3.3.3 Market Opportunities
3.3.3.1 Cloud-Based Network Automation Solutions
3.3.3.2 Artificial Intelligence and Machine Learning in Network Automation
3.3.3.3 Increased Adoption of 5G Technology
3.3.3.4 Growing Demand for Software-Defined Networking (SDN)
3.4 COVID-19 Impact Analysis
3.4.1 V-Shaped Recovery Scenario
3.4.2 W-Shaped Recovery Scenario
3.4.3 U-Shaped Recovery Scenario
3.4.4 L-Shaped Recovery Scenario
3.5 SWOT Analysis
3.5.1 Strengths of the Network Automation Market
3.5.2 Weaknesses of the Network Automation Market:
3.5.3 Opportunities in the Network Automation Market:
3.5.4 Threats to the Network Automation Market:
3.6 Porter’s Five Forces Analysis
3.6.1 Threat of New Entrants - Moderate
3.6.2 Bargaining Power of Suppliers - Low
3.6.3 Bargaining Power of Buyers - High
3.6.4 Threat of Substitute Products or Services - Low
3.6.5 Rivalry Among Existing Competitors - High
3.7 PESTLE Analysis
3.7.1 Political Factors:
3.7.2 Economic Factors:
3.7.3 Social Factors:
3.7.4 Technological Factors:
3.7.5 Legal Factors:
3.7.6 Environmental Factors:
4 Network Automation Market Analysis by End-Users
4.1 Key Findings
4.2 End-Users Segment: Market Attractiveness Index
4.3 Network Automation Market by End-User
4.4 Enterprise Vertical
4.4.1 Market Size by Region, 2023-2033 (US$ Mn)
4.4.2 Market Share by Region, 2023 & 2033 (%)
4.5 Service Providers
4.5.1 Market Size by Region, 2023-2033 (US$ Mn)
4.5.2 Market Share by Region, 2023 & 2033 (%)
5 Network Automation Market Analysis by Network Type
5.1 Key Findings
5.2 Network Type Segment: Market Attractiveness Index
5.3 Network Automation Market by Network Type
5.4 Physical Network
5.4.1 Market Size by Region, 2023-2033 (US$ Mn)
5.4.2 Market Share by Region, 2023 & 2033 (%)
5.5 Virtual Network
5.5.1 Market Size by Region, 2023-2033 (US$ Mn)
5.5.2 Market Share by Region, 2023 & 2033 (%)
5.6 Hybrid Network
5.6.1 Market Size by Region, 2023-2033 (US$ Mn)
5.6.2 Market Share by Region, 2023 & 2033 (%)
6 Network Automation Market Analysis by Component
6.1 Key Findings
6.2 Components Segment: Market Attractiveness Index
6.3 Network Automation Market by Component
6.4 Network Automation Tools
6.4.1 Market by Region, 2023-2033 (US$ Mn)
6.4.2 Market Share by Region, 2023 & 2033 (%)
6.5 Intent-based Networking
6.5.1 Market Size by Region, 2023-2033 (US$ Mn)
6.5.2 Market Share by Region, 2023 & 2033 (%)
6.6 Deployment and Integration
6.6.1 Market Size by Region, 2023-2033 (US$ Mn)
6.6.2 Market Share by Region, 2023 & 2033 (%)
6.7 Other Components
6.7.1 Market Size by Region, 2023-2033 (US$ Mn)
6.7.2 Market Share by Region, 2023 & 2033 (%)
7 Network Automation Market Analysis by Type
7.1 Key Findings
7.2 Type Segment: Market Attractiveness Index
7.3 Network Automation Market by Type
7.4 Local Area Network (LAN)
7.4.1 Market Size by Region, 2023-2033 (US$ Mn)
7.4.2 Market Share by Region, 2023 & 2033 (%)
7.5 Wide Area Network (WAN)
7.5.1 Market Size by Region, 2023-2033 (US$ Mn)
7.5.2 Market Share by Region, 2023 & 2033 (%)
7.6 Data Centre Networks
7.6.1 Market Size by Region, 2023-2033 (US$ Mn)
7.6.2 Market Share by Region, 2023 & 2033 (%)
7.7 Cloud Networks
7.7.1 Market Size by Region, 2023-2033 (US$ Mn)
7.7.2 Market Share by Region, 2023 & 2033 (%)
7.8 Wireless Networks
7.8.1 Market by Region, 2023-2033 (US$ Mn)
7.8.2 Market Share by Region, 2023 & 2033 (%)
8 Network Automation Market Analysis by Vertical
8.1 Key Findings
8.2 Vertical Segment: Market Attractiveness Index
8.3 Network Automation Market by Vertical
8.4 Information Technology (IT)
8.4.1 Market Size by Region, 2023-2033 (US$ Mn)
8.4.2 Market Share by Region, 2023 & 2033 (%)
8.5 Banking, Financial Services, and Insurance (BFSI)
8.5.1 Market Size by Region, 2023-2033 (US$ Mn)
8.5.2 Market Share by Region, 2023 & 2033 (%)
8.6 Manufacturing
8.6.1 Market Size by Region, 2023-2033 (US$ Mn)
8.6.2 Market Share by Region, 2023 & 2033 (%)
8.7 Healthcare
8.7.1 Market Size by Region, 2023-2033 (US$ Mn)
8.7.2 Market Share by Region, 2023 & 2033 (%)
8.8 Energy and Utilities
8.8.1 Market Size by Region, 2023-2033 (US$ Mn)
8.8.2 Market Share by Region, 2023 & 2033 (%)
8.9 Others Vertical
8.9.1 Market Size by Region, 2023-2033 (US$ Mn)
8.9.2 Market Share by Region, 2023 & 2033 (%)
9 Network Automation Market Analysis by Region
9.1 Key Findings
9.2 Network Automation Market by Region
10 North America Network Automation Market Analysis
10.1 Key Findings
10.1.1 Anuta Networks Automates the First Cloud-Native, Open-RAN Enabled 5G Mobile Network in North America
10.2 North America Network Automation Market Attractiveness Index
10.3 North America Network Automation Market by Value
10.4 North America Network Automation Market by Country
10.5 North America Network Automation Market by End-User
10.6 North America Network Automation Market by Network Type
10.7 North America Network Automation Market by Component
10.8 North America Network Automation Market by Type
10.9 North America Network Automation Market by Vertical
10.10 U.S. Network Automation Market Analysis
10.10.1 Dell Technologies and Wind River Transform Telecom Cloud Deployments
10.11 Canada Network Automation Market Analysis
10.11.1 Driving network automation with TELUS
11 Europe Network Automation Market Analysis
11.1 Key Findings
11.1.1 Vodafone Partners VMWARE For Core Network Automation Throughout Europe
11.2 Europe Network Automation Market Attractiveness Index
11.3 Europe Network Automation Market by Value
11.4 Europe Network Automation Market by Country
11.5 Europe Network Automation Market by End-User
11.6 Europe Network Automation Market by Network Type
11.7 Europe Network Automation Market by Component
11.8 Europe Network Automation Market by Type
11.9 Europe Network Automation Market by Vertical
11.10 Germany Network Automation Market Analysis
11.10.1 Germany's 1&1 is way behind its open RAN targets.
11.11 UK Network Automation Market Analysis
11.11.1 Putting Automation into Motion Will Put the Wheels on UK Economic Growth
11.12 France Network Automation Market Analysis
11.12.1 Mavenir and NEC drive Open RAN forward with deployment of massive MIMO on Orange’s 5G SA experimental network in France
11.12.2 France ends Q1 with 4.13 million 5G lines
11.13 Italy Network Automation Market Analysis
11.13.1 Telecom Italia Increases Efficiencies, Reduces Time to Market Through Network Automation & Orchestration with Itential
11.14 Spain Network Automation Market Analysis
11.14.1 Cisco Deploys Intent-Based Networking Technology into the Telefonica Network to Optimize and Simplify its Operations for a 5G World
11.15 Rest of Europe Network Automation Market Analysis
11.15.1 Keysight and IBM Aim to Accelerate Open RAN Deployments in Europe with Memorandum of Understanding
12 Asia-Pacific Network Automation Market Analysis
12.1 Key Findings
12.1.1 Network Automation to Yield On-Demand Services and Optimized Customer Experiences
12.2 Asia-Pacific Network Automation Market Attractiveness Index
12.3 Asia-Pacific Network Automation Market by Value
12.4 Asia-Pacific Network Automation Market by Country
12.5 Asia-Pacific Network Automation Market by End-User
12.6 Asia-Pacific Network Automation Market by Network Type
12.7 Asia-Pacific Network Automation Market by Component
12.8 Asia-Pacific Network Automation Market by Type
12.9 Asia-Pacific Network Automation Market by Vertical
12.10 China Network Automation Market Analysis
12.10.1 China Mobile And Huawei Win Glotel Automation Initiative Of The Year Award For Innovation And Practice In Autonomous Core Networks
12.11 India Network Automation Market Analysis
12.11.1 Genie Showcases Traffic Analytics Solution at Network Automation
12.12 Japan Network Automation Market Analysis
12.12.1 Rakuten Mobile turnaround cannot happen fast enough
12.13 South Korea Network Automation Market Analysis
12.13.1 South Korea aims to launch a communications 6G prototype in 2026.
12.14 Australia Network Automation Market Analysis
12.14.1 Telstra tunes up with orchestration to enhance automation, customer experience
12.14.2 Australian Enterprises Adopting SDN for Cloud-Era Success
12.15 Rest of Asia-Pacific Network Automation Market Analysis
12.15.1 SK Telecom boosts capacity planning and improves operational efficiency with Skylight.
13 Middle East & Africa Network Automation Market Analysis
13.1 Key Findings
13.2 MEA Network Automation Market Attractiveness Index
13.3 Middle East & Africa Network Automation Market by Value
13.4 Middle East & Africa Network Automation Market by Country
13.5 Middle East & Africa Network Automation Market by End-User
13.6 Middle East & Africa Network Automation Market by Network Type
13.7 Middle East & Africa Network Automation Market by Component
13.8 Middle East & Africa Network Automation Market by Type
13.9 Middle East & Africa Network Automation Market by Vertical
13.10 GCC Network Automation Market Analysis
13.10.1 Oman.
13.10.1.1 Vodafone and Ericsson drive data-driven decisions with AI in Oman
13.10.2 Saudi Arabia.
13.10.2.1 Saudi's STC partners with Ericsson for AI-based solutions to enhance networks.
13.10.3 United Arab Emirates
13.10.3.1 Nokia and du enable Zero-Touch Access with SDAN
13.11 South Africa Network Automation Market Analysis
13.11.1 Telkom spins up 5G for South Africa
13.11.2 Africa
13.11.2.1 Connecting Africa With Ultra-Automation And Autonomous Networks
13.12 Rest of Middle East Network Automation Market Analysis
13.12.1 Qatar
13.12.1.1 Experts discuss IoT and automation in Qatar
14 Latin America Network Automation Market Analysis
14.1 Key Findings
14.1.1 Ericsson Expands Automation, Cloud Computing Research in LATAM
14.2 Latin America Network Automation Market Attractiveness Index
14.3 Latin America Network Automation Market by Value
14.4 Latin America Network Automation Market by Country
14.5 Latin America Network Automation Market by End-Use
14.6 Latin America Network Automation Market by Network Type
14.7 Latin America Network Automation Market by Component
14.8 Latin America Network Automation Market by Type
14.9 Latin America Network Automation Market by Vertical
14.10 Brazil Network Automation Market Analysis
14.10.1 Telefónica and Wipro Engage to Offer Network Automation Through CI/CD/CT Adoption in Germany and Brazil
14.11 Mexico Network Automation Market Analysis
14.11.1 Mexico to make available up to 7,750 megahertz for 5G in 2023
14.12 Rest of Latin America Network Automation Market Analysis
15 Company Profiles
15.1 Competitive Landscape, 2023
15.2 Strategic Outlook
15.2.1 Key Developments in Acquisition
15.2.2 Key Developments in Collaboration
15.2.3 Key Development in Expansion
15.2.4 Key Development in New Product Launch
15.2.5 Key Development in Partnership
15.3 Cisco Systems, Inc
15.3.1 Company Snapshot
15.3.2 Company Overview
15.3.3 Financial Analysis
15.3.3.1 Net Revenue, 2018-2022
15.3.3.2 Gross Profit, 2018-2022
15.3.3.3 R&D, 2018-2022
15.3.3.4 Regional Revenue Share, 2022
15.3.3.5 Business Segment Revenue Share, 2022
15.3.4 Product Benchmarking
15.3.5 Strategic Outlook
15.4 Juniper Networks, Inc.
15.4.1 Company Snapshot
15.4.2 Company Overview
15.4.3 Financial Analysis
15.4.3.1 Net Revenue, 2018-2022
15.4.3.2 Gross Profit, 2018-2022
15.4.3.3 R&D, 2018-2022
15.4.3.4 Regional Revenue Share, 2022
15.4.3.5 Business Segment Revenue Share, 2022
15.4.4 Product Benchmarking
15.4.5 Strategic Outlook
15.5 IBM Corporation
15.5.1 Company Snapshot
15.5.2 Company Overview
15.5.3 Financial Analysis
15.5.3.1 Net Revenue, 2018-2022
15.5.3.2 Gross Profit, 2018-2022
15.5.3.3 R&D, 2018-2022
15.5.3.4 Regional Revenue Share, 2022
15.5.3.5 Business Segment Revenue Share, 2022
15.5.4 Product Benchmarking
15.5.5 Strategic Outlook
15.6 Micro Focus International plc
15.6.1 Company Snapshot
15.6.2 Company Overview
15.6.3 Financial Analysis
15.6.3.1 Net Revenue, 2017-2021
15.6.3.2 Gross Profit, 2017-2021
15.6.3.3 R&D, 2017-2021
15.6.3.4 Regional Revenue Share, 2022
15.6.3.5 Business Segment Revenue Share, 2022
15.6.4 Product Benchmarking
15.6.5 Strategic Outlook
15.7 NetBrain Technologies Inc.
15.7.1 Company Snapshot
15.7.2 Company Overview
15.7.3 Product Benchmarking
15.7.4 Strategic Outlook
15.8 Forward Networks, Inc.
15.8.1 Company Snapshot
15.8.2 Company Overview
15.8.3 Product Benchmarking
15.8.4 Strategic Outlook
15.9 SolarWinds Corporation
15.9.1 Company Snapshot
15.9.2 Company Overview
15.9.3 Financial Analysis
15.9.3.1 Net Revenue, 2017-2021
15.9.3.2 Gross Profit, 2017-2021
15.9.3.3 R&D, 2017-2021
15.9.3.4 Regional Revenue Share, 2022
15.9.4 Product Benchmarking
15.9.5 Strategic Outlook
15.10 VMware, Inc
15.10.1 Company Snapshot
15.10.2 Company Overview
15.10.3 Financial Analysis
15.10.3.1 Net Revenue, 2018-2022
15.10.3.2 Gross Profit, 2018-2022
15.10.3.3 R&D, 2018-2022
15.10.3.4 Regional Revenue Share, 2022
15.10.3.5 Business Segment Revenue Share, 2022
15.10.4 Product Benchmarking
15.10.5 Strategic Outlook
15.11 BMC Software, Inc.
15.11.1 Company Snapshot
15.11.2 Company Overview
15.11.3 Product Benchmarking
15.11.4 Strategic Outlook
15.12 BlueCat Networks
15.12.1 Company Snapshot
15.12.2 Company Overview
15.12.3 Product Benchmarking
15.12.4 Strategic Outlook
15.13 Anuta Networks
15.13.1 Company Snapshot
15.13.2 Company Overview
15.13.3 Product Benchmarking
15.13.4 Strategic Outlook
15.14 Riverbed Technology LLC
15.14.1 Company Snapshot
15.14.2 Company Overview
15.14.3 Product Benchmarking
15.14.4 Strategic Outlook
15.15 Itential
15.15.1 Company Snapshot
15.15.2 Company Overview
15.15.3 Product Benchmarking
15.15.4 Strategic Outlook
15.16 Kentik
15.16.1 Company Snapshot
15.16.2 Company Overview
15.16.3 Product Benchmarking
15.16.4 Strategic Outlook
15.17 Versa Networks
15.17.1 Company Snapshot
15.17.2 Company Overview
15.17.3 Product Benchmarking
15.17.4 Strategic Outlook
16 Conclusion and Recommendations
16.1 Concluding Remarks from Visiongain
16.2 Recommendations for Market Players
List of Tables
Table 1 Network Automation Market Snapshot, 2023 & 2033 (US$ million, CAGR %)
Table 2 Network Automation Market by Region, 2023-2033 (US$ Mn, AGR (%), CAGR (%)) (V-Shaped Recovery Scenario)
Table 3 Network Automation Market by Region, 2023-2033 (US$ Mn, AGR (%), CAGR (%)) (W-Shaped Recovery Scenario)
Table 4 Network Automation Market by Region, 2023-2033 (US$ Mn, AGR (%), CAGR (%)) (U-Shaped Recovery Scenario)
Table 5 Network Automation Market by Region, 2023-2033 (US$ Mn, AGR (%), CAGR (%)) (L-Shaped Recovery Scenario)
Table 6 Network Automation Market by End-User, 2023-2033 (US$ Mn, AGR (%), CAGR (%))
Table 7 Enterprise Vertical Market by Region, 2023-2033 (US$ Mn, AGR (%), CAGR (%))
Table 8 Service Providers Market by Region, 2023-2033 (US$ Mn, AGR (%), CAGR (%))
Table 9 Network Automation Market by Network Type, 2023-2033 (US$ Mn, AGR (%), CAGR (%))
Table 10 Physical Network Market by Region, 2023-2033 (US$ Mn, AGR (%), CAGR (%))
Table 11 Virtual Network Market by Region, 2023-2033 (US$ Mn, AGR (%), CAGR (%))
Table 12 Hybrid Network Market by Region, 2023-2033 (US$ Mn, AGR (%), CAGR (%))
Table 13 Network Automation Market by Component, 2023-2033 (US$ Mn, AGR (%), CAGR (%))
Table 14 Network Automation Tools Market by Region, 2023-2033 (US$ Mn, AGR (%), CAGR (%))
Table 15 Intent-based Networking Market by Region, 2023-2033 (US$ Mn, AGR (%), CAGR (%))
Table 16 Deployment and Integration Market by Region, 2023-2033 (US$ Mn, AGR (%), CAGR (%))
Table 17 Other Components Market by Region, 2023-2033 (US$ Mn, AGR (%), CAGR (%))
Table 18 Network Automation Market by Type, 2023-2033 (US$ Mn, AGR (%), CAGR (%))
Table 19 Local Area Network (LAN) Market by Region, 2023-2033 (US$ Mn, AGR (%), CAGR (%))
Table 20 Wide Area Network (WAN) Market by Region, 2023-2033 (US$ Mn, AGR (%), CAGR (%))
Table 21 Data Centre Networks Market by Region, 2023-2033 (US$ Mn, AGR (%), CAGR (%))
Table 22 Cloud Networks Market by Region, 2023-2033 (US$ Mn, AGR (%), CAGR (%))
Table 23 Wireless Networks Market by Region, 2023-2033 (US$ Mn, AGR (%), CAGR (%))
Table 24 Network Automation Market by Vertical, 2023-2033 (US$ Mn, AGR (%), CAGR (%))
Table 25 Information Technology (IT) Market by Region, 2023-2033 (US$ Mn, AGR (%), CAGR (%))
Table 26 Banking, Financial Services, and Insurance (BFSI) Market by Region, 2023-2033 (US$ Mn, AGR (%), CAGR (%))
Table 27 Manufacturing Market by Region, 2023-2033 (US$ Mn, AGR (%), CAGR (%))
Table 28 Healthcare Market by Region, 2023-2033 (US$ Mn, AGR (%), CAGR (%))
Table 29 Energy and Utilities Market by Region, 2023-2033 (US$ Mn, AGR (%), CAGR (%))
Table 30 Other Vertical Market by Region, 2023-2033 (US$ Mn, AGR (%), CAGR (%))
Table 31 Network Automation Market by Region, 2023-2033 (US$ Mn, AGR (%), CAGR (%))
Table 32 North America Network Automation Market by Value, 2023-2033 (US$ Mn, AGR (%), CAGR (%))
Table 33 North America Network Automation Market by Country, 2023-2033 (US$ Mn, AGR (%), CAGR (%))
Table 34 North America Network Automation Market by End-User, 2023-2033 (US$ Mn, AGR (%), CAGR (%))
Table 35 North America Network Automation Market by Network Type, 2023-2033 (US$ Mn, AGR (%), CAGR (%))
Table 36 North America Network Automation Market by Component, 2023-2033 (US$ Mn, AGR (%), CAGR (%))
Table 37 North America Network Automation Market by Type, 2023-2033 (US$ Mn, AGR (%), CAGR (%))
Table 38 North America Network Automation Market by Vertical, 2023-2033 (US$ Mn, AGR (%), CAGR (%))
Table 39 US Network Automation Market by Value, 2023-2033 (US$ Mn, AGR (%), CAGR (%))
Table 40 Canada Network Automation Market by Value, 2023-2033 (US$ Mn, AGR (%), CAGR (%))
Table 41 Europe Network Automation Market by Value, 2023-2033 (US$ Mn, AGR (%), CAGR (%))
Table 42 Europe Network Automation Market by Country, 2023-2033 (US$ Mn, AGR (%), CAGR (%))
Table 43 Europe Network Automation Market by End-User, 2023-2033 (US$ Mn, AGR (%), CAGR (%))
Table 44 Europe Network Automation Market by Network Type, 2023-2033 (US$ Mn, AGR (%), CAGR (%))
Table 45 Europe Network Automation Market by Component, 2023-2033 (US$ Mn, AGR (%), CAGR (%))
Table 46 Europe Network Automation Market by Type, 2023-2033 (US$ Mn, AGR (%), CAGR (%))
Table 47 Europe Network Automation Market by Vertical, 2023-2033 (US$ Mn, AGR (%), CAGR (%))
Table 48 Germany Network Automation Market by Value, 2023-2033 (US$ Mn, AGR (%), CAGR (%))
Table 49 UK Network Automation Market by Value, 2023-2033 (US$ Mn, AGR (%), CAGR (%))
Table 50 France Network Automation Market by Value, 2023-2033 (US$ Mn, AGR (%), CAGR (%))
Table 51 Italy Network Automation Market by Value, 2023-2033 (US$ Mn, AGR (%), CAGR (%))
Table 52 Spain Network Automation Market by Value, 2023-2033 (US$ Mn, AGR (%), CAGR (%))
Table 53 Rest of Europe Network Automation Market by Value, 2023-2033 (US$ Mn, AGR (%), CAGR (%))
Table 54 Asia-Pacific Network Automation Market by Value, 2023-2033 (US$ Mn, AGR (%), CAGR (%))
Table 55 Asia-Pacific Network Automation Market by Country, 2023-2033 (US$ Mn, AGR (%), CAGR (%))
Table 56 Asia-Pacific Network Automation Market by End-User, 2023-2033 (US$ Mn, AGR (%), CAGR (%))
Table 57 Asia-Pacific Network Automation Market by Network Type, 2023-2033 (US$ Mn, AGR (%), CAGR (%))
Table 58 Asia-Pacific Network Automation Market by Component, 2023-2033 (US$ Mn, AGR (%), CAGR (%))
Table 59 Asia-Pacific Network Automation Market by Type, 2023-2033 (US$ Mn, AGR (%), CAGR (%))
Table 60 Asia-Pacific Network Automation Market by Vertical, 2023-2033 (US$ Mn, AGR (%), CAGR (%))
Table 61 China Network Automation Market by Value, 2023-2033 (US$ Mn, AGR (%), CAGR (%))
Table 62 India Network Automation Market by Value, 2023-2033 (US$ Mn, AGR (%), CAGR (%))
Table 63 Japan Network Automation Market by Value, 2023-2033 (US$ Mn, AGR (%), CAGR (%))
Table 64 South Korea Network Automation Market by Value, 2023-2033 (US$ Mn, AGR (%), CAGR (%))
Table 65 Australia Network Automation Market by Value, 2023-2033 (US$ Mn, AGR (%), CAGR (%))
Table 66 Rest of Asia-Pacific Network Automation Market by Value, 2023-2033 (US$ Mn, AGR (%), CAGR (%))
Table 67 Middle East & Africa Network Automation Market by Value, 2023-2033 (US$ Mn, AGR (%), CAGR (%))
Table 68 Middle East & Africa Network Automation Market by Country, 2023-2033 (US$ Mn, AGR (%), CAGR (%))
Table 69 Middle East & Africa Network Automation Market by End-User, 2023-2033 (US$ Mn, AGR (%), CAGR (%))
Table 70 Middle East & Africa Network Automation Market by Network Type, 2023-2033 (US$ Mn, AGR (%), CAGR (%))
Table 71 Middle East & Africa Network Automation Market by Component, 2023-2033 (US$ Mn, AGR (%), CAGR (%))
Table 72 Middle East & Africa Network Automation Market by Type, 2023-2033 (US$ Mn, AGR (%), CAGR (%))
Table 73 Middle East & Africa Network Automation Market by Vertical, 2023-2033 (US$ Mn, AGR (%), CAGR (%))
Table 74 GCC Network Automation Market by Value, 2023-2033 (US$ Mn, AGR (%), CAGR (%))
Table 75 South Africa Network Automation Market by Value, 2023-2033 (US$ Mn, AGR (%), CAGR (%))
Table 76 Rest of Middle East & Africa Network Automation Market by Value, 2023-2033 (US$ Mn, AGR (%), CAGR (%))
Table 77 Latin America Network Automation Market by Value, 2023-2033 (US$ Mn, AGR (%), CAGR (%))
Table 78 Latin America Network Automation Market by Country, 2023-2033 (US$ Mn, AGR (%), CAGR (%))
Table 79 Latin America Network Automation Market by End-User, 2023-2033 (US$ Mn, AGR (%), CAGR (%))
Table 80 Latin America Network Automation Market by Network Type, 2023-2033 (US$ Mn, AGR (%), CAGR (%))
Table 81 Latin America Network Automation Market by Component, 2023-2033 (US$ Mn, AGR (%), CAGR (%))
Table 82 Latin America Network Automation Market by Type, 2023-2033 (US$ Mn, AGR (%), CAGR (%))
Table 83 Latin America Network Automation Market by Vertical, 2023-2033 (US$ Mn, AGR (%), CAGR (%))
Table 84 Brazil Network Automation Market by Value, 2023-2033 (US$ Mn, AGR (%), CAGR (%))
Table 85 Mexico Network Automation Market by Value, 2023-2033 (US$ Mn, AGR (%), CAGR (%))
Table 86 Rest of Latin America Network Automation Market by Value, 2023-2033 (US$ Mn, AGR (%), CAGR (%))
Table 87 Cisco Systems, Inc: Key Details, (CEO, HQ, Revenue, Founded, No. of Employees, Company Type, Website, Business Segment)
Table 88 Cisco Systems, Inc: Product Benchmarking
Table 89 Cisco Systems, Inc: Strategic Outlook
Table 90 Juniper Networks, Inc.: Key Details, (CEO, HQ, Revenue, Founded, No. of Employees, Company Type, Website, Business Segment)
Table 91 Juniper Networks, Inc.: Product Benchmarking
Table 92 Juniper Networks, Inc.: Strategic Outlook
Table 93 IBM Corporation: Key Details, (CEO, HQ, Revenue, Founded, No. of Employees, Company Type, Website, Business Segment)
Table 94 IBM Corporation: Product Benchmarking
Table 95 IBM Corporation: Strategic Outlook
Table 96 Micro Focus International plc: Key Details, (CEO, HQ, Revenue, Founded, No. of Employees, Company Type, Website, Business Segment)
Table 97 Micro Focus International plc: Product Benchmarking
Table 98 Micro Focus International plc: Strategic Outlook
Table 99 NetBrain Technologies Inc.: Key Details, (CEO, HQ, Revenue, Founded, No. of Employees, Company Type, Website, Business Segment)
Table 100 NetBrain Technologies Inc.: Product Benchmarking
Table 101 NetBrain Technologies Inc.: Strategic Outlook
Table 102 Forward Networks, Inc.: Key Details, (CEO, HQ, Revenue, Founded, No. of Employees, Company Type, Website, Business Segment)
Table 103 Forward Networks, Inc.: Product Benchmarking
Table 104 Forward Networks, Inc.: Strategic Outlook
Table 105 SolarWinds Corporation: Key Details, (CEO, HQ, Revenue, Founded, No. of Employees, Company Type, Website, Business Segment)
Table 106 SolarWinds Corporation: Product Benchmarking
Table 107 SolarWinds Corporation: Strategic Outlook
Table 108 VMware, Inc: Key Details, (CEO, HQ, Revenue, Founded, No. of Employees, Company Type, Website, Business Segment)
Table 109 VMware, Inc: Product Benchmarking
Table 110 VMware, Inc: Strategic Outlook
Table 111 BMC Software, Inc.: Key Details, (CEO, HQ, Revenue, Founded, No. of Employees, Company Type, Website, Business Segment)
Table 112 BMC Software, Inc.: Product Benchmarking
Table 113 BMC Software, Inc.: Strategic Outlook
Table 114 BlueCat Networks: Key Details, (CEO, HQ, Revenue, Founded, No. of Employees, Company Type, Website, Business Segment)
Table 115 BlueCat Networks: Product Benchmarking
Table 116 BlueCat Networks: Strategic Outlook
Table 117 Anuta Networks: Key Details, (CEO, HQ, Revenue, Founded, No. of Employees, Company Type, Website, Business Segment)
Table 118 Anuta Networks: Product Benchmarking
Table 119 Anuta Networks: Strategic Outlook
Table 120 Riverbed Technology LLC: Key Details, (CEO, HQ, Revenue, Founded, No. of Employees, Company Type, Website, Business Segment)
Table 121 Riverbed Technology LLC: Product Benchmarking
Table 122 Riverbed Technology LLC: Strategic Outlook
Table 123 Network Automation: Key Details, (CEO, HQ, Revenue, Founded, No. of Employees, Company Type, Website, Business Segment)
Table 124 Itential: Product Benchmarking
Table 125 Itential: Strategic Outlook
Table 126 Kentik: Key Details, (CEO, HQ, Revenue, Founded, No. of Employees, Company Type, Website, Business Segment)
Table 127 Kentik: Product Benchmarking
Table 128 Kentik: Strategic Outlook
Table 129 Versa Networks: Key Details, (CEO, HQ, Revenue, Founded, No. of Employees, Company Type, Website, Business Segment)
Table 130 Versa Networks: Product Benchmarking
Table 131 Versa Networks: Strategic Outlook
List of Figures
Figure 1 Network Automation Market Segmentation
Figure 2 Network Automation Market by End-Users: Market Attractiveness Index
Figure 3 Network Automation Market by Network Type: Market Attractiveness Index
Figure 4 Network Automation Market by Component: Market Attractiveness Index
Figure 5 Network Automation Market by Type: Market Attractiveness Index
Figure 6 Network Automation Market by Vertical Market Attractiveness Index
Figure 7 Network Automation Market Attractiveness Index by Region
Figure 8 Network Automation Market: Market Dynamics
Figure 9 COVID Impact Analysis: Network Automation Market Recovery Scenarios
Figure 10 Network Automation Market by Region, 2023-2033 (US$ Mn, AGR (%)) (V-Shaped Recovery Scenario)
Figure 11 Network Automation Market by Region, 2023-2033 (US$ Mn, AGR (%)) (W-Shaped Recovery Scenario)
Figure 12 Network Automation Market by Region, 2023-2033 (US$ Mn, AGR (%)) (U-Shaped Recovery Scenario)
Figure 13 Network Automation Market by Region, 2023-2033 (US$ Mn, AGR (%)) (L-Shaped Recovery Scenario)
Figure 14 Network Automation Market: Porter’s Five Forces Analysis
Figure 15 Network Automation Market: PEST Analysis
Figure 16 Network Automation Market by End-Users: Market Attractiveness Index
Figure 17 Network Automation Market by End-User, 2023-2033 (US$ Mn, AGR (%))
Figure 18 Enterprise Vertical Market by Region, 2023-2033 (US$ Mn, AGR (%))
Figure 19 Enterprise Vertical Market Share Forecast by Region, 2023 & 2033 (%)
Figure 20 Service Providers Market by Region, 2023-2033 (US$ Mn, AGR (%))
Figure 21 Service Providers Market Share Forecast by Region, 2023 & 2033 (%)
Figure 22 Network Automation Market by Network Type: Market Attractiveness Index
Figure 23 Network Automation Market by Network Type, 2023-2033 (US$ Mn, AGR (%))
Figure 24 Physical Network Market by Region, 2023-2033 (US$ Mn, AGR (%))
Figure 25 Physical Network Market Share Forecast by Region, 2023 & 2033 (%)
Figure 26 Virtual Network Market by Region, 2023-2033 (US$ Mn, AGR (%))
Figure 27 Virtual Network Market Share Forecast by Region, 2023 & 2033 (%)
Figure 28 Hybrid Network Market by Region, 2023-2033 (US$ Mn, AGR (%))
Figure 29 Hybrid Network Market Share Forecast by Region, 2023 & 2033 (%)
Figure 30 Network Automation Market by Components: Market Attractiveness Index
Figure 31 Network Automation Market by Component, 2023-2033 (US$ Mn, AGR (%))
Figure 32 Network Automation Tools Market by Region, 2023-2033 (US$ Mn, AGR (%))
Figure 33 Network Automation Tools Market Share Forecast by Region, 2023 & 2033 (%)
Figure 34 Intent-based Networking Market by Region, 2023-2033 (US$ Mn, AGR (%))
Figure 35 Intent-Based Networking Market Share Forecast by Region, 2023 & 2033 (%)
Figure 36 Deployment and Integration Market by Region, 2023-2033 (US$ Mn, AGR (%))
Figure 37 Deployment and Integration Market Share Forecast by Region, 2023 & 2033 (%)
Figure 38 Other Components Market by Region, 2023-2033 (US$ Mn, AGR (%))
Figure 39 Other Components Market Share Forecast by Region, 2023 & 2033 (%)
Figure 40 Network Automation Market by Type: Market Attractiveness Index
Figure 41 Network Automation Market by Type, 2023-2033 (US$ Mn, AGR (%))
Figure 42 Local Area Network (LAN) Market by Region, 2023-2033 (US$ Mn, AGR (%))
Figure 43 Local Area Network (LAN) Market Share Forecast by Region, 2023 & 2033 (%)
Figure 44 Wide Area Network (WAN) Market by Region, 2023-2033 (US$ Mn, AGR (%))
Figure 45 Wide Area Network (WAN) Market Share Forecast by Region, 2023 & 2033 (%)
Figure 46 Data Centre Networks Market by Region, 2023-2033 (US$ Mn, AGR (%))
Figure 47 Data Centre Networks Market Share Forecast by Region, 2023 & 2033 (%)
Figure 48 Cloud Networks Market by Region, 2023-2033 (US$ Mn, AGR (%))
Figure 49 Cloud Networks Market Share Forecast by Region, 2023 & 2033 (%)
Figure 50 Wireless Networks Market by Region, 2023-2033 (US$ Mn, AGR (%))
Figure 51 Wireless Networks Market Share Forecast by Region, 2023 & 2033 (%)
Figure 52 Network Automation Market by Vertical: Market Attractiveness Index
Figure 53 Network Automation Market by Vertical, 2023-2033 (US$ Mn, AGR (%))
Figure 54 Information Technology (IT) Market by Region, 2023-2033 (US$ Mn, AGR (%))
Figure 55 Information Technology (IT) Market Share Forecast by Region, 2023 & 2033 (%)
Figure 56 Banking, Financial Services, and Insurance (BFSI) Market by Region, 2023-2033 (US$ Mn, AGR (%))
Figure 57 Banking, Financial Services, and Insurance (BFSI) Market Share Forecast by Region, 2023 & 2033 (%)
Figure 58 Manufacturing Market by Region, 2023-2033 (US$ Mn, AGR (%))
Figure 59 Manufacturing Market Share Forecast by Region, 2023 & 2033 (%)
Figure 60 Healthcare Market by Region, 2023-2033 (US$ Mn, AGR (%))
Figure 61 Healthcare Market Share Forecast by Region, 2023 & 2033 (%)
Figure 62 Energy and Utilities Market by Region, 2023-2033 (US$ Mn, AGR (%))
Figure 63 Energy and Utilities Market Share Forecast by Region, 2023 & 2033 (%)
Figure 64 Other Vertical Market by Region, 2023-2033 (US$ Mn, AGR (%))
Figure 65 Other Vertical Market Share Forecast by Region, 2023 & 2033 (%)
Figure 66 Network Automation Market Forecast by Region 2023, 2033 (Revenue, CAGR%)
Figure 67 Network Automation Market by Region, 2023-2033 (US$ Mn, AGR (%))
Figure 68 North America Network Automation Market Attractiveness Index
Figure 69 North America Network Automation Market by Value, 2023-2033 (US$ Mn, AGR (%))
Figure 70 North America Network Automation Market by Country, 2023-2033 (US$ Mn, AGR (%))
Figure 71 North America Network Automation Market Share Forecast by Country, 2023-2033 (%)
Figure 72 North America Network Automation Market by End-User, 2023-2033 (US$ Mn, AGR (%))
Figure 73 North America Network Automation Market Share Forecast by End-Users, 2023-2033 (%)
Figure 74 North America Network Automation Market by Network Type, 2023-2033 (US$ Mn, AGR (%))
Figure 75 North America Network Automation Market Share Forecast by Network Type, 2023-2033 (%)
Figure 76 North America Network Automation Market by Component, 2023-2033 (US$ Mn, AGR (%))
Figure 77 North America Network Automation Market Share Forecast by Components, 2023-2033 (%)
Figure 78 North America Network Automation Market by Type, 2023-2033 (US$ Mn, AGR (%))
Figure 79 North America Network Automation Market Share Forecast by Type, 2023-2033 (%)
Figure 80 North America Network Automation Market by Vertical, 2023-2033 (US$ Mn, AGR (%))
Figure 81 North America Network Automation Market Share Forecast by Vertical, 2023-2033 (%)
Figure 82 US Network Automation Market by Value, 2023-2033 (US$ Mn, AGR (%))
Figure 83 Canada Network Automation Market by Value, 2023-2033 (US$ Mn, AGR (%))
Figure 84 Europe Network Automation Market Attractiveness Index
Figure 85 Europe Network Automation Market by Value, 2023-2033 (US$ Mn, AGR (%))
Figure 86 Europe Network Automation Market by Country, 2023-2033 (US$ Mn, AGR (%))
Figure 87 Network Automation Market Share Forecast by Country, 2023-2033 (%)
Figure 88 Europe Network Automation Market by End-User, 2023-2033 (US$ Mn, AGR (%))
Figure 89 Network Automation Market Share Forecast by End-Users, 2023-2033 (%)
Figure 90 Europe Network Automation Market by Network Type, 2023-2033 (US$ Mn, AGR (%))
Figure 91 Network Automation Market Share Forecast by Network Type, 2023-2033 (%)
Figure 92 Europe Network Automation Market by Component, 2023-2033 (US$ Mn, AGR (%))
Figure 93 Network Automation Market Share Forecast by Components, 2023-2033 (%)
Figure 94 Europe Network Automation Market by Type, 2023-2033 (US$ Mn, AGR (%))
Figure 95 Network Automation Market Share Forecast by Type, 2023-2033 (%)
Figure 96 Europe Network Automation Market by Vertical, 2023-2033 (US$ Mn, AGR (%))
Figure 97 Network Automation Market Share Forecast by Vertical, 2023-2033 (%)
Figure 98 Germany Network Automation Market by Value, 2023-2033 (US$ Mn, AGR (%))
Figure 99 UK Network Automation Market by Value, 2023-2033 (US$ Mn, AGR (%))
Figure 100 France Network Automation Market by Value, 2023-2033 (US$ Mn, AGR (%))
Figure 101 Italy Network Automation Market by Value, 2023-2033 (US$ Mn, AGR (%))
Figure 102 Spain Network Automation Market by Value, 2023-2033 (US$ Mn, AGR (%))
Figure 103 Rest of Europe Network Automation Market by Value, 2023-2033 (US$ Mn, AGR (%))
Figure 1 Asia-Pacific Network Automation Market Attractiveness Index
Figure 104 Asia-Pacific Network Automation Market by Value, 2023-2033 (US$ Mn, AGR (%))
Figure 105 Asia-Pacific Network Automation Market by Country, 2023-2033 (US$ Mn, AGR (%))
Figure 106 Network Automation Market Share Forecast by Country, 2023-2033 (%)
Figure 107 Asia-Pacific Network Automation Market by End-User, 2023-2033 (US$ Mn, AGR (%))
Figure 108 Network Automation Market Share Forecast by End-Users, 2023-2033 (%)
Figure 109 Asia-Pacific Network Automation Market by Network Type, 2023-2033 (US$ Mn, AGR (%))
Figure 110 Network Automation Market Share Forecast by Network Type, 2023-2033 (%)
Figure 111 Asia-Pacific Network Automation Market by Component, 2023-2033 (US$ Mn, AGR (%))
Figure 112 Network Automation Market Share Forecast by Components, 2023-2033 (%)
Figure 113 Asia-Pacific Network Automation Market by Type, 2023-2033 (US$ Mn, AGR (%))
Figure 114 Network Automation Market Share Forecast by Type, 2023-2033 (%)
Figure 115 Asia-Pacific Network Automation Market by Vertical, 2023-2033 (US$ Mn, AGR (%))
Figure 116 Network Automation Market Share Forecast by Vertical, 2023-2033 (%)
Figure 117 China Network Automation Market by Value, 2023-2033 (US$ Mn, AGR (%))
Figure 118 India Network Automation Market by Value, 2023-2033 (US$ Mn, AGR (%))
Figure 119 Japan Network Automation Market by Value, 2023-2033 (US$ Mn, AGR (%))
Figure 120 South Korea Network Automation Market by Value, 2023-2033 (US$ Mn, AGR (%))
Figure 121 Australia Network Automation Market by Value, 2023-2033 (US$ Mn, AGR (%))
Figure 122 Rest of Asia-Pacific Network Automation Market by Value, 2023-2033 (US$ Mn, AGR (%))
Figure 123 MEA Network Automation Market Attractiveness Index
Figure 124 Middle East & Africa Network Automation Market by Value, 2023-2033 (US$ Mn, AGR (%))
Figure 125 Middle East & Africa Network Automation Market by Country, 2023-2033 (US$ Mn, AGR (%))
Figure 126 Network Automation Market Share Forecast by Country, 2023-2033 (%)
Figure 127 Middle East & Africa Network Automation Market by End-User, 2023-2033 (US$ Mn, AGR (%))
Figure 128 Network Automation Market Share Forecast by End-Users, 2023-2033 (%)
Figure 129 Middle East & Africa Network Automation Market by Network Type, 2023-2033 (US$ Mn, AGR (%))
Figure 130 Network Automation Market Share Forecast by Network Type, 2023-2033 (%)
Figure 131 Middle East & Africa Network Automation Market by Component, 2023-2033 (US$ Mn, AGR (%))
Figure 132 Network Automation Market Share Forecast by Components, 2023-2033 (%)
Figure 133 Middle East & Africa Network Automation Market by Type, 2023-2033 (US$ Mn, AGR (%))
Figure 134 Network Automation Market Share Forecast by Type, 2023-2033 (%)
Figure 135 Middle East & Africa Network Automation Market by Vertical, 2023-2033 (US$ Mn, AGR (%))
Figure 136 Network Automation Market Share Forecast by Vertical, 2023-2033 (%)
Figure 137 GCC Network Automation Market by Value, 2023-2033 (US$ Mn, AGR (%))
Figure 138 South Africa Network Automation Market by Value, 2023-2033 (US$ Mn, AGR (%))
Figure 139 Rest of Middle East & Africa Network Automation Market by Value, 2023-2033 (US$ Mn, AGR (%))
Figure 140 Network Automation Latin America Market Attractiveness Index
Figure 141 Latin America Network Automation Market by Value, 2023-2033 (US$ Mn, AGR (%))
Figure 142 Latin America Network Automation Market by Country, 2023-2033 (US$ Mn, AGR (%))
Figure 143 Network Automation Market Share Forecast by Country, 2023-2033 (%)
Figure 144 Latin America Network Automation Market by End-User, 2023-2033 (US$ Mn, AGR (%))
Figure 145 Network Automation Market Share Forecast by End-Users, 2023-2033 (%)
Figure 146 Latin America Network Automation Market by Network Type, 2023-2033 (US$ Mn, AGR (%))
Figure 147 Network Automation Market Share Forecast by Network Type, 2023-2033 (%)
Figure 148 Latin America Network Automation Market by Component, 2023-2033 (US$ Mn, AGR (%))
Figure 149 Network Automation Market Share Forecast by Components, 2023-2033 (%)
Figure 150 Latin America Network Automation Market by Type, 2023-2033 (US$ Mn, AGR (%))
Figure 151 Network Automation Market Share Forecast by Type, 2023-2033 (%)
Figure 152 Latin America Network Automation Market by Vertical, 2023-2033 (US$ Mn, AGR (%))
Figure 153 Network Automation Market Share Forecast by Vertical, 2023-2033 (%)
Figure 154 Brazil Network Automation Market by Value, 2023-2033 (US$ Mn, AGR (%))
Figure 155 Mexico Network Automation Market by Value, 2023-2033 (US$ Mn, AGR (%))
Figure 156 Rest of Latin America Network Automation Market by Value, 2023-2033 (US$ Mn, AGR (%))
Figure 157 Network Automation Market: Company Share/Ranking, 2021
Figure 158 Cisco Systems, Inc: Net Revenue, 2018-2022 (US$ million, AGR%)
Figure 159 Cisco Systems, Inc: Gross Profit, 2018-2022 (US$ million, AGR%)
Figure 160 Cisco Systems, Inc: R&D, 2018-2022 (US$ million, AGR%)
Figure 161 Cisco Systems, Inc: Regional Revenue Share, 2022 (%)
Figure 162 Cisco Systems, Inc: Business Segment Revenue Share, 2022 (%)
Figure 163 Juniper Networks, Inc.: Net Revenue, 2018-2022 (US$ million, AGR%)
Figure 164 Juniper Networks, Inc.: Gross Profit, 2018-2022 (US$ million, AGR%)
Figure 165 Juniper Networks, Inc.: R&D, 2018-2022 (US$ million, AGR%)
Figure 166 Juniper Networks, Inc: Regional Revenue Share, 2022 (%)
Figure 167 Juniper Networks, Inc: Business Segment Revenue Share, 2022 (%)
Figure 168 IBM Corporation: Net Revenue, 2018-2022 (US$ million, AGR%)
Figure 169 IBM Corporation: Gross Profit, 2018-2022 (US$ million, AGR%)
Figure 170 IBM Corporation: R&D, 2018-2022 (US$ million, AGR%)
Figure 171 IBM Corporation: Regional Revenue Share, 2022 (%)
Figure 172 IBM Corporation: Business Segment Revenue Share, 2022 (%)
Figure 173 Micro Focus International plc: Net Revenue, 2017-2021 (US$ million, AGR%)
Figure 174 Micro Focus International plc: Gross Profit, 2017-2021 (US$ million, AGR%)
Figure 175 Micro Focus International plc: R&D, 2017-2021 (US$ million, AGR%)
Figure 176 Micro Focus International plc: Regional Revenue Share, 2022 (%)
Figure 177 Micro Focus International plc: Business Segment Revenue Share, 2022 (%)
Figure 178 SolarWinds Corporation: Net Revenue, 2017-2021 (US$ million, AGR%)
Figure 179 SolarWinds Corporation: Gross Profit, 2017-2021 (US$ million, AGR%)
Figure 180 SolarWinds Corporation: R&D, 2017-2021 (US$ million, AGR%)
Figure 181 SolarWinds Corporation: Regional Revenue Share, 2022 (%)
Figure 182 VMware, Inc: Net Revenue, 2018-2022 (US$ million, AGR%)
Figure 183 VMware, Inc: Gross Profit, 2018-2022 (US$ million, AGR%)
Figure 184 VMware, Inc: R&D, 2018-2022 (US$ million, AGR%)
Figure 185 VMware, Inc: Regional Revenue Share, 2022 (%)
Figure 186 VMware, Inc: Business Segment Revenue Share, 2022 (%)
ページTOPに戻る
よくあるご質問
Visiongain社はどのような調査会社ですか?
英国の調査会社ヴィジョンゲイン社(Visiongain)は、通信とエネルギーのほか、自動車や化学・医薬品、金属など、広範な市場を対象に調査を行っています。自動車市場については、市場全般に関する調査のほ... もっと見る
調査レポートの納品までの日数はどの程度ですか?
在庫のあるものは速納となりますが、平均的には 3-4日と見て下さい。
但し、一部の調査レポートでは、発注を受けた段階で内容更新をして納品をする場合もあります。
発注をする前のお問合せをお願いします。
注文の手続きはどのようになっていますか?
1)お客様からの御問い合わせをいただきます。
2)見積書やサンプルの提示をいたします。
3)お客様指定、もしくは弊社の発注書をメール添付にて発送してください。
4)データリソース社からレポート発行元の調査会社へ納品手配します。
5) 調査会社からお客様へ納品されます。最近は、pdfにてのメール納品が大半です。
お支払方法の方法はどのようになっていますか?
納品と同時にデータリソース社よりお客様へ請求書(必要に応じて納品書も)を発送いたします。
お客様よりデータリソース社へ(通常は円払い)の御振り込みをお願いします。
請求書は、納品日の日付で発行しますので、翌月最終営業日までの当社指定口座への振込みをお願いします。振込み手数料は御社負担にてお願いします。
お客様の御支払い条件が60日以上の場合は御相談ください。
尚、初めてのお取引先や個人の場合、前払いをお願いすることもあります。ご了承のほど、お願いします。
データリソース社はどのような会社ですか?
当社は、世界各国の主要調査会社・レポート出版社と提携し、世界各国の市場調査レポートや技術動向レポートなどを日本国内の企業・公官庁及び教育研究機関に提供しております。
世界各国の「市場・技術・法規制などの」実情を調査・収集される時には、データリソース社にご相談ください。
お客様の御要望にあったデータや情報を抽出する為のレポート紹介や調査のアドバイスも致します。
|
|

