アレルギー性鼻炎治療薬市場レポート:2023-2033
Allergic Rhinitis Drugs Market Report 2023-2033
レポート詳細
アレルギー性鼻炎治療薬市場レポート 2023-2033 :本レポートは、新たな収益の柱を目指すリーディングカンパニーが、業界とその背景にあるダイナミクスをより深く理解する上で、非常に有... もっと見る
※上記価格は部署ライセンス(Departmental licence)価格です。
その他の価格についてはデータリソースまでお問合せください。
日本語のページは自動翻訳を利用し作成しています。
実際のレポートは英文のみでご納品いたします。
サマリー
レポート詳細
アレルギー性鼻炎治療薬市場レポート 2023-2033:本レポートは、新たな収益の柱を目指すリーディングカンパニーが、業界とその背景にあるダイナミクスをより深く理解する上で、非常に有益なものとなるでしょう。また、異業種への進出や新地域での既存事業の拡大を目指す企業にとっても有用なレポートです。
アレルギー性鼻炎の治療における革新的な経鼻治療の登場
鼻腔内投与は、その安全性と有効性により、広く受け入れられるようになってきています。この投与経路は、全身性の副作用がなく、鼻粘膜の受容体側で十分な濃度を得ることができるため、医師やアレルギー専門医にも推奨されています。副作用は、鼻粘膜の乾燥、くしゃみ、しみる程度です。他の投与経路よりも優れているため、いくつかの企業が革新的な鼻腔内投与薬を開発しています。例えば、Dr. Ferrer BioPharmaが開発したClorNasal™は、世界最高の鼻腔内薬理学的製剤として認知されています。これは、アレルギー性鼻炎、呼吸器系合胞体ウイルス(RSV)感染症、COVID-19などの病気の治療に使用されています。同様に、Altamira Therapeutics Ltd.も、鼻腔用スプレー「ベントナイト」を開発しました。は、鼻腔用スプレー「Bentrino」を開発しました。ダニや花粉などの空気中のアレルゲンによるアレルギー症状の発現を抑制します。
他の病気との症状の類似性
アレルギー性鼻炎は、アレルゲンに対する免疫系のアレルギー反応によって引き起こされる感染症です。アレルギー性鼻炎の主な症状は、鼻づまり、目のかゆみ、口のかゆみ、くしゃみ、鼻汁、のどの痛み、顔の痛みや圧迫感、聴覚・嗅覚・味覚の低下、倦怠感などです。この症状は、風邪や咳と非常によく似ていますが、これはウイルスによるもので、アレルギーの原因物質によるものではありません。アレルギーは、治療が間に合わなければ、喘息、副鼻腔炎、中耳炎、湿疹など他の症状を引き起こす可能性もあります。正確な診断ができない場合、適切な薬剤候補を選択することが大きな問題となります。免疫療法やアレルギー注射は、じんましんや発疹などの重篤な副作用を伴うことがあります。また、アナフィラキシーなどの危険な副作用が出ることもあり、その場合は何年もの治療が必要になることもあります。
アレルギー性鼻炎治療薬の副作用について
アレルギー性疾患治療薬は、環境中のさまざまな種類のアレルゲンに影響されない生活習慣を保つために、主に長期にわたって使用されます。抗ヒスタミン薬は、アレルギー性感染症の治療に最も広く使用されている薬物タイプです。抗ヒスタミン剤の短期的な副作用には、便秘、尿閉、口渇、食欲増進、狭角緑内障の悪化などがあります。鼻腔充血除去剤の副作用には、高血圧、神経過敏、頭痛、不眠などがあります。局所用コルチコステロイドは、薬剤の全身循環への吸収を引き起こし、体内の正常なホルモンレベルの障害を引き起こす可能性があります。コルチコステロイド点眼液は、緑内障、白内障、その他の眼感染症を引き起こす可能性があります。副腎皮質ホルモン経鼻剤は、鼻粘膜を刺激し、口やのどの粘膜に影響を与え、乾燥させ、高騰させます。経口コルチコステロイドは、骨粗しょう症、胃潰瘍、高血糖、血圧上昇、筋力低下などの副作用を伴います。
マーケットリサーチレポートを購入する前に、どのような質問をすべきでしょうか?
- アレルギー性鼻炎治療薬市場はどのように進化しているのか?
- アレルギー性鼻炎薬市場の促進要因と抑制要因は?
- アレルギー性鼻炎薬の各サブマーケットは予測期間中にどのように成長し、2033年にはどの程度の売上を占めるようになるのか?
- 2023年から2033年にかけて、各アレルギー性鼻炎薬サブマーケットの市場シェアはどのように推移するのか?
- 2023年から2033年にかけて、市場全体の主なドライバーは何になるのでしょうか?
- アレルギー性鼻炎治療薬の主要市場はマクロ経済ダイナミクスに概ね追随するのか、それとも個々の国市場が他を凌駕するのか?
- 2033年までに各国市場のシェアはどのように変化し、どの地域が2033年の市場をリードするのか?
- リーディングプレイヤーは誰か、また予測期間中の見通しは?
- これらの主要企業のアレルギー性鼻炎治療薬開発プロジェクトは何か?
- 2023年から2033年の間に、業界はどのように進化していくのでしょうか?現在および今後10年間に実施されるアレルギー性鼻炎治療薬の開発プロジェクトにはどのような意味があるのか?
- アレルギー性鼻炎薬市場をさらに拡大させるために、製品の商業化の必要性は高いか?
- アレルギー性鼻炎薬市場の方向性と、市場の最前線に立つためにはどうすればよいか?
- 新製品・サービスラインに対する最適な投資オプションは?
- 企業を新たな成長軌道に乗せ、C-suiteに移行させるための重要な展望とは?
このことがアレルギー性鼻炎薬市場に現在、そして今後10年間、どのような影響を与えるかを知る必要があります。
- 269ページにわたる本レポートでは、105の表と173のグラフを独占的に提供します。
- このレポートでは、業界における主要な収益性の高い分野をハイライトしているため、今すぐターゲットを絞ることができます。
- 世界、地域、国別の売上高と成長率を詳細に分析しています。
- 競合他社が成功した主なトレンド、変化、収益予測をハイライトしています。
本レポートは、アレルギー性鼻炎薬市場が今後10年間にどのように発展するか、またCOVID-19の景気後退とバウンスの変動に即して、今日あなたにお伝えします。この市場は、過去10年間のどの時点よりも今が重要なのです。
2033年までの予測やその他の分析により、商業的な展望が見えてきた
- 2033年までの収益予測に加え、直近の実績、成長率、市場シェアもご覧いただけます。
- ビジネスの展望や展開など、独自の分析もご覧いただけます。
- 定性的分析(市場力学、促進要因、機会、阻害要因、課題など)、コスト構造、アレルギー性鼻炎薬の価格上昇の影響、最近の開発状況などをご覧いただけます。
本レポートでは、COVID-19が業界と貴社にどのような影響を及ぼすかについて、データ分析と貴重な洞察を掲載しています。本レポートでは、COVID-19の4つの回収パターンとその影響、すなわち「V」、「L」、「W」、「U」について論じています。
報告書の対象セグメント
治療薬タイプ
・ 抗ヒスタミン剤
・ 免疫療法
- 皮下免疫療法(SCIT)
- 舌下免疫療法(SLIT)
・ 副腎皮質ステロイド
・ 充血除去剤
・ その他
疾患タイプ
- 季節性アレルギー性鼻炎
- 通年性アレルギー性鼻炎
- 職業性アレルギー性鼻炎
投与経路
- 経口
- 鼻腔内
- 眼内投与
- 静脈内
流通チ ャネル
- 小売薬局
- 病院薬局
- オンラインチャネル
世界市場全体とセグメントの収益予測に加え、5つの地域と16の主要国市場の収益予測も掲載しています。
北米
- アメリカ
- カナダ
欧州
- ドイツ
- 英国
- フランス
- スペイン
- イタリア
- ロシア
- その他の欧州地域
アジア太平洋地域
- 中国
- 日本
- インド
- オーストラリア
- 韓国
- その他のアジア太平洋地域
ラテンアメリカ
- ブラジル
- メキシコ
- その他のラテンアメリカ地域
MEA
- GCC
- 南アフリカ
- その他のMEA地域
アレルギー性鼻炎薬市場の2023年から2033年までの主要企業のプロファイルと、これらの企業の事業のこのセグメントに焦点を当てたものも含まれています。
主要企業と市場成長の可能性
・ Alcon
・ AstraZeneca
・ Bayer AG
・ Dr Reddy’s Laboratories
・ GlaxoSmithKline PLC
・ Johnson & Johnson
・ Merck & Co
・ Sanofi S.A.
・ Sun Pharmaceuticals
・ Teva Pharmaceutical Industries Ltd
アレルギー性鼻炎薬市場の世界全体収益、金額ベースで2023年から2033年まで、市場は2023年に124億1000万米ドルを突破すると当研究所は算出しています。2033年まで力強い収益成長が予測される。本調査では、最も大きな可能性を秘めた企業を特定します。彼らの能力、進歩、商業的展望を発見することで、一歩先を行くことができます。
アレルギー性鼻炎薬市場、2023年から2033年までのレポートはどのように役立つのでしょうか?
260ページを超えるレポートでは、要約すると以下のような知識を得ることができます。
- アレルギー性鼻炎薬市場の2033年までの収益予測、世界および地域レベルでの治療タイプ、疾患、投与経路、流通経路の予測 - 投資と収益に最も有利な場所を見つけ、業界の展望を発見することができます。
- 5地域と16主要国市場の2033年までの収益予測 - アレルギー性鼻炎薬市場、北米、欧州、アジア太平洋、中南米、中東・アフリカの2023年から2033年までの市場予測をご覧ください。また、米国、カナダ、メキシコ、ブラジル、ドイツ、フランス、英国、イタリア、中国、インド、日本、オーストラリアなどの主要経済圏の市場も予測されています。
- 既存企業や市場参入を目指す企業の展望 - アレルギー性鼻炎薬市場に関わる主要企業の企業プロファイルを含む、2023年から2033年までの展望を掲載しています。
定量的・定性的な分析と独自の予測をご覧いただけます。私たちのレポートだけが持つ情報を入手し、貴重なビジネスインテリジェンスを得ることができます。
他にはない情報
私たちの新しいレポートがあれば、知識の遅れを取り戻し、チャンスを逃す可能性が低くなります。私たちの研究が貴社の調査、分析、意思決定にどのように役立つかをご覧ください。Visiongainの研究は、アレルギー性鼻炎薬市場、2023年から2033年、市場をリードする企業のための商業分析を必要とするすべての人のためのものです。データ、トレンド、予測を見つけることができます。
ページTOPに戻る
目次
目次
1.レポートの概要
1.1 研究の目的
1.2 アレルギー性鼻炎治療薬市場の紹介
1.3 本レポートが提供するもの
1.4 なぜ本レポートを読むべきなのか
1.5 本分析報告書が回答する主な質問事項
1.6 本レポートは誰のためのものなのか?
1.7 方法論
1.7.1 市場の定義
1.7.2 市場評価・予測手法
1.7.3 データの検証
1.7.3.1 一次調査
1.7.3.2 セカンダリーリサーチ
1.8 よくある質問(FAQ)
1.9 関連するVisiongainのレポート
1.10 Visiongainについて
2 エグゼクティブサマリー
3 市場の概要
3.1 主要な調査結果
3.2 マーケットダイナミクス
3.2.1 市場の推進要因
3.2.1.1 アレルギーに対する意識の高まりと治療オプションの増加
3.2.1.2 呼吸器疾患の有病率の増加
3.2.1.3 効果的で新しいドラッグデリバリーシステムの発売
3.2.2 市場抑制要因
3.2.2.1 アレルギー性鼻炎の治療に使用される薬剤の副作用
3.2.2.2 他の疾患との症状の類似性
3.2.3 市場機会
3.2.3.1 アレルゲン免疫療法(AIT)の進歩の増加
3.2.3.2 アレルギー性鼻炎に関する認知度向上のための政府の積極的な取り組み
3.3 COVID-19影響度分析
3.4 ポーターのファイブフォース分析
3.4.1 供給者のバーゲニングパワー
3.4.2 バイヤーのバーゲニングパワー
3.4.3 競争相手のライバル関係
3.4.4 代替品による脅威
3.4.5 新規参入の脅威
3.5 PEST分析
4 アレルギー性鼻炎治療薬市場分析:治療タイプ別
4.1 主要な調査結果
4.2 製品セグメント市場魅力度指数
4.3 アレルギー性鼻炎治療薬の治療タイプ別市場規模の推定と予測
4.4 抗ヒスタミン剤
4.4.1 地域別市場規模、2023-2033年 (US$ Mn)
4.4.2 地域別市場シェア、2023年&2033年(%)
4.5 免疫療法
4.5.1 地域別市場規模、2023年~2033年 (US$ Mn)
4.5.2 地域別市場シェア、2023年&2033年(%)
4.5.3 舌下免疫療法(SLIT)
4.5.3.1 地域別市場規模、2023年~2033年 (US$ Mn)
4.5.3.2 地域別市場シェア、2023年&2033年(%)
4.5.4 舌下免疫療法(SLIT)
4.5.4.1 地域別市場規模、2023年~2033年 (US$ Mn)
4.5.4.2 地域別市場シェア、2023年&2033年(%)
4.6 副腎皮質ホルモン剤
4.6.1 地域別市場規模、2023年〜2033年 (US$ Mn)
4.6.2 地域別市場シェア、2023年&2033年(%)
4.7 充血除去剤
4.7.1 地域別市場規模、2023年〜2033年 (US$ Mn)
4.7.2 地域別市場シェア、2023年&2033年(%)
4.8 その他
4.8.1 地域別市場規模、2023年〜2033年 (US$ Mn)
4.8.2 地域別市場シェア、2023年&2033年(%)
5 アレルギー性鼻炎治療薬市場分析:疾患タイプ別
5.1 主要な調査結果
5.2 製品セグメント市場魅力度指数
5.3 アレルギー性鼻炎薬の疾患タイプ別市場規模の推定と予測
5.4 季節性アレルギー性鼻炎
5.4.1 地域別市場規模、2023-2033 (US$ Mn)
5.4.2 地域別市場シェア、2023年&2033年(%)
5.5 通年性アレルギー性鼻炎
5.5.1 地域別市場規模、2023年〜2033年 (US$ Mn)
5.5.2 地域別市場シェア、2023年&2033年(%)
5.6 職業性アレルギー性鼻炎
5.6.1 地域別市場規模、2023年〜2033年 (US$ Mn)
5.6.2 地域別市場シェア、2023年&2033年(%)
6 アレルギー性鼻炎治療薬市場分析:投与経路別
6.1 主要な調査結果
6.2 製品セグメント市場魅力度指数
6.3 アレルギー性鼻炎治療薬の投与経路別市場規模の推定と予測
6.4 経口剤
6.4.1 地域別市場規模、2023年〜2033年 (US$ Mn)
6.4.2 地域別市場シェア、2023年&2033年(%)
6.5 鼻腔
6.5.1 地域別市場規模、2023年〜2033年 (US$ Mn)
6.5.2 地域別市場シェア、2023年&2033年(%)
6.6 眼内
6.6.1 地域別市場規模、2023年~2033年 (US$ Mn)
6.6.2 地域別市場シェア、2023年&2033年(%)
6.7 静脈注射器
6.7.1 地域別市場規模、2023年~2033年 (US$ Mn)
6.7.2 地域別市場シェア、2023年&2033年(%)
7 アレルギー性鼻炎治療薬市場分析:流通チャネル別
7.1 主要な調査結果
7.2 製品セグメント市場魅力度指数
7.3 アレルギー性鼻炎薬の流通チャネル別市場規模推定・予測
7.4 小売薬局
7.4.1 地域別市場規模、2023年〜2033年 (US$ Mn)
7.4.2 地域別市場シェア、2023年&2033年(%)
7.5 病院内薬局
7.5.1 地域別市場規模、2023年~2033年 (US$ Mn)
7.5.2 地域別市場シェア、2023年&2033年(%)
7.6 オンライン薬局
7.6.1 地域別市場規模、2023年~2033年 (US$ Mn)
7.6.2 地域別市場シェア、2023年&2033年(%)
8 アレルギー性鼻炎治療薬市場分析:地域別
8.1 主な調査結果
8.2 地域別セグメント市場魅力度指数
8.3 アレルギー性鼻炎治療薬の市場規模推定と予測
9 北米のアレルギー性鼻炎治療薬市場分析
9.1 主な調査結果
9.2 北米アレルギー性鼻炎薬市場魅力度指数
9.3 北米アレルギー性鼻炎薬国別市場 2023年、2028年&2033年 (US$ Mn)
9.4 北米アレルギー性鼻炎薬国別市場規模推計・予測
9.5 北米アレルギー性鼻炎薬市場 治療タイプ別市場規模予測・予測
9.6 北米アレルギー性鼻炎薬市場の疾患タイプ別市場規模予測・予想
9.7 北米アレルギー性鼻炎薬市場 投与経路別市場規模予測・予測
9.8 北米アレルギー性鼻炎薬市場流通経路別市場規模予測・予測
9.9 米国アレルギー性鼻炎薬市場分析
9.10 カナダのアレルギー性鼻炎薬の市場分析
10 欧州のアレルギー性鼻炎治療薬市場分析
10.1 主な調査結果
10.2 欧州アレルギー性鼻炎治療薬市場魅力度指数
10.3 欧州アレルギー性鼻炎薬国別市場 2023年、2028年&2033年 (US$ Mn)
10.4 欧州アレルギー性鼻炎薬国別市場規模推計・予測
10.5 欧州アレルギー性鼻炎治療薬市場 治療タイプ別市場規模予測・予測
10.6 欧州アレルギー性鼻炎治療薬の市場規模予測・疾病タイプ別予測
10.7 欧州アレルギー性鼻炎薬市場投与経路別市場規模予測・予測
10.8 欧州アレルギー性鼻炎薬市場流通チャネル別市場規模予測・予測
10.9 ドイツのアレルギー性鼻炎薬市場分析
10.10 フランス アレルギー性鼻炎薬市場の分析
10.11 イギリス アレルギー性鼻炎薬の市場分析
10.12 イタリア アレルギー性鼻炎薬の市場分析
10.13 スペイン アレルギー性鼻炎薬の市場分析
10.14 ロシア アレルギー性鼻炎薬の市場分析
10.15 その他の欧州アレルギー性鼻炎薬市場の分析
11 アジア太平洋地域のアレルギー性鼻炎治療薬市場分析
11.1 主な調査結果
11.2 アジア太平洋地域のアレルギー性鼻炎薬市場魅力度指数
11.3 アジア太平洋地域のアレルギー性鼻炎薬国別市場:2023年、2028年&2033年(US$ Mn)
11.4 アジア太平洋地域のアレルギー性鼻炎薬国別市場規模推定・予測
11.5 アジア太平洋地域のアレルギー性鼻炎治療薬市場規模予測・治療タイプ別予測
11.6 アジア太平洋地域のアレルギー性鼻炎薬市場規模予測・疾患タイプ別予測
11.7 アジア太平洋地域のアレルギー性鼻炎薬市場の投与経路別市場規模予測・予想
11.8 アジア太平洋地域のアレルギー性鼻炎薬市場流通経路別市場規模予測・予測
11.9 日本 アレルギー性鼻炎薬市場分析
11.10 中国 アレルギー性鼻炎薬の市場分析
11.11 インド アレルギー性鼻炎薬の市場分析
11.12 オーストラリア アレルギー性鼻炎薬市場の分析
11.13 韓国 アレルギー性鼻炎薬市場の分析
11.14 その他のアジア太平洋地域のアレルギー性鼻炎薬市場分析
12 ラテンアメリカのアレルギー性鼻炎薬市場の分析
12.1 主な調査結果
12.2 ラテンアメリカのアレルギー性鼻炎薬市場魅力度指数
12.3 ラテンアメリカのアレルギー性鼻炎薬国別市場:2023年、2028年&2033年(US$ Mn)
12.4 ラテンアメリカのアレルギー性鼻炎薬国別市場規模予測・予測
12.5 ラテンアメリカのアレルギー性鼻炎薬市場規模予測・予測:治療タイプ別
12.6 ラテンアメリカのアレルギー性鼻炎薬市場規模予測・疾病タイプ別予測
12.7 ラテンアメリカのアレルギー性鼻炎薬市場規模予測・予測:投与経路別
12.8 ラテンアメリカのアレルギー性鼻炎薬市場流通経路別市場規模予測・予測
12.9 ブラジル アレルギー性鼻炎薬市場分析
12.10 メキシコのアレルギー性鼻炎薬市場の分析
12.11 その他のラテンアメリカ地域のアレルギー性鼻炎薬市場分析
13 MEAのアレルギー性鼻炎治療薬市場分析
13.1 主な調査結果
13.2 MEAアレルギー性鼻炎治療薬市場魅力度指数
13.3 MEAアレルギー性鼻炎薬国別市場:2023年、2028年&2033年(US$ Mn)
13.4 MEAアレルギー性鼻炎薬国別市場規模推計・予測
13.5 MEAアレルギー性鼻炎薬の治療タイプ別市場規模予測・予想
13.6 MEAアレルギー性鼻炎薬の疾患タイプ別市場規模予測・予想
13.7 MEAアレルギー性鼻炎薬市場の投与経路別市場規模予測・予想
13.8 MEAアレルギー性鼻炎薬の市場規模予測・流通経路別予測
13.9 GCC アレルギー性鼻炎薬の市場分析
13.10 南アフリカのアレルギー性鼻炎薬市場分析
13.11 その他のMEAアレルギー性鼻炎薬市場の分析
14 主要企業のプロフィール
14.1 競合他社の状況、2021年
14.2 ALCON AG
14.2.1 会社概要
14.2.2 会社概要
14.2.3 財務分析
14.2.3.1 純収益、2017-2021年
14.2.3.2 R&D、2017年~2021年
14.2.3.3 地域別市場シェア、2021年
14.2.4 製品ベンチマーク
14.2.5 戦略的な展望
14.3 AstraZeneca plc
14.3.1 企業スナップショット
14.3.2 会社概要
14.3.3 財務分析
14.3.3.1 純収益、2017-2021年
14.3.3.2 R&D、2017年-2021年
14.3.3.3 地域別市場シェア、2021年
14.3.4 製品ベンチマーク
14.3.5 戦略的な展望
14.4 Bayer AG
14.4.1 企業スナップショット
14.4.2 会社概要
14.4.3 財務分析
14.4.3.1 純収益、2017-2021年
14.4.3.2 R&D、2017-2021年
14.4.3.3 地域別市場シェア、2021年
14.4.4 製品ベンチマーク
14.4.5 戦略的な展望
14.5 Dr Reddy's Laboratories Ltd.
14.5.1 企業スナップショット
14.5.2 会社概要
14.5.3 財務分析
14.5.3.1 純収益、2017-2021年
14.5.3.2 R&D、2017年-2021年
14.5.3.3 地域別市場シェア、2021年
14.5.4 製品ベンチマーク
14.5.5 戦略的な展望
14.6 GlaxoSmithKline plc
14.6.1 企業スナップショット
14.6.2 会社概要
14.6.3 財務分析
14.6.3.1 純収益、2017-2021年
14.6.3.2 R&D、2017年-2021年
14.6.3.3 地域別市場シェア、2021年
14.6.4 製品ベンチマーク
14.6.5 戦略的な展望
14.7 Johnson & Johnson
14.7.1 企業スナップショット
14.7.2 会社概要
14.7.3 財務分析
14.7.3.1 純収益、2017-2021年
14.7.3.2 R&D、2017-2021年
14.7.3.3 地域別市場シェア、2021年
14.7.4 製品ベンチマーク
14.7.5 戦略的展望
14.8 Merck & Co.
14.8.1 企業スナップショット
14.8.2 会社概要
14.8.3 財務分析
14.8.3.1 純収益、2017-2021年
14.8.3.2 R&D、2017年-2021年
14.8.3.3 地域別市場シェア、2021年
14.8.4 製品ベンチマーク
14.8.5 戦略的な展望
14.9 Sanofi SA
14.9.1 企業スナップショット
14.9.2 会社概要
14.9.3 財務分析
14.9.3.1 純収益、2017-2021年
14.9.3.2 R&D、2017年-2021年
14.9.3.3 地域別市場シェア、2021年
14.9.4 製品ベンチマーク
14.9.5 戦略的な展望
14.10 Sun Pharmaceutical Industries Limited
14.10.1 企業スナップショット
14.10.2 会社概要
14.10.3 財務分析
14.10.3.1 純収益、2017-2021年
14.10.3.2 R&D、2017年-2021年
14.10.3.3 地域別市場シェア、2021年
14.10.4 製品ベンチマーク
14.10.5 戦略的展望
14.11 Teva Pharmaceutical Industries Ltd.
14.11.1 企業スナップショット
14.11.2 会社概要
14.11.3 財務分析
14.11.3.1 純収益、2017-2021年
14.11.3.2 R&D、2017年-2021年
14.11.3.3 地域別市場シェア、2021年
14.11.4 製品ベンチマーク
14.11.5 戦略的展望
15 結論と提言
15.1 ビジョンゲインからの結論
15.2 市場関係者への提言
表の一覧
Table 1 Allergic Rhinitis Drugs Market Snapshot, 2023 & 2033 (US$ million, CAGR %)
Table 2 Allergic Rhinitis Drugs Market by Region, 2023-2033 (US$ Mn, AGR (%), CAGR (%)): “V” Shaped Recovery Scenario
Table 3 Allergic Rhinitis Drugs Market by Region, 2023-2033 (US$ Mn, AGR (%), CAGR (%)): “U” Shaped Recovery Scenario
Table 4 Allergic Rhinitis Drugs Market by Region, 2023-2033 (US$ Mn, AGR (%), CAGR (%)): “W” Shaped Recovery Scenario
Table 5 Allergic Rhinitis Drugs Market by Region, 2023-2033 (US$ Mn, AGR (%), CAGR (%)): “L” Shaped Recovery Scenario
Table 6 Allergic Rhinitis Drugs Market Forecast by Treatment Type, 2023-2033 (US$ Mn, AGR (%), CAGR (%))
Table 7 Antihistamines Market Forecast by Region, 2023-2033 (US$ Mn, AGR%, CAGR%)
Table 8 Immunotherapy Market Forecast by Region, 2023-2033 (US$ Mn, AGR%, CAGR%)
Table 9 SCIT Market Forecast by Region, 2023-2033 (US$ Mn, AGR%, CAGR%)
Table 10 SLIT Market Forecast by Region, 2023-2033 (US$ Mn, AGR%, CAGR%)
Table 11 Corticosteroids Market Forecast by Region, 2023-2033 (US$ Mn, AGR%, CAGR%)
Table 12 Decongestants Market Forecast by Region, 2023-2033 (US$ Mn, AGR%, CAGR%)
Table 13 Others Market Forecast by Region, 2023-2033 (US$ Mn, AGR%, CAGR%)
Table 14 Allergic Rhinitis Drugs Market Forecast by Disease type, 2023-2033 (US$ Mn, AGR (%), CAGR (%))
Table 15 Allergic Rhinitis Drugs Market Forecast by Disease Type , 2023-2033 (US$ million)
Table 16 Seasonal Allergic Rhinitis Market Forecast by Region, 2023-2033 (US$ Mn, AGR%, CAGR%)
Table 17 Perennial Allergic Rhinitis Market Forecast by Region, 2023-2033 (US$ Mn, AGR%, CAGR%)
Table 18 Occupational Allergic Rhinitis Market Forecast by Region, 2023-2033 (US$ Mn, AGR%, CAGR%)
Table 19 Allergic Rhinitis Drugs Market Forecast by Route of Administration, 2023-2033 (US$ Mn, AGR (%), CAGR (%))
Table 20 Allergic Rhinitis Drugs Market Forecast by Route of Route of Administration, 2023-2033 (US$ million)
Table 21 Oral Allergic Rhinitis Market Forecast by Region, 2023-2033 (US$ Mn, AGR%, CAGR%)
Table 22 Nasal Allergic Rhinitis Market Forecast by Region, 2023-2033 (US$ Mn, AGR%, CAGR%)
Table 23 Intraocular Allergic Rhinitis Market Forecast by Region, 2023-2033 (US$ Mn, AGR%, CAGR%)
Table 24 Intravenous Allergic Rhinitis Market Forecast by Region, 2023-2033 (US$ Mn, AGR%, CAGR%)
Table 25 Allergic Rhinitis Drugs Market Forecast by Distribution Channel, 2023-2033 (US$ Mn, AGR (%), CAGR (%))
Table 26 Retail Pharmacies Allergic Rhinitis Market Forecast by Region, 2023-2033 (US$ Mn, AGR%, CAGR%)
Table 27 Hospital Pharmacies Allergic Rhinitis Market Forecast by Region, 2023-2033 (US$ Mn, AGR%, CAGR%)
Table 28 Online Pharmacies Allergic Rhinitis Market Forecast by Region, 2023-2033 (US$ Mn, AGR%, CAGR%)
Table 29 Allergic Rhinitis Drugs Market by Region, 2023-2033 (US$ Mn, AGR (%), CAGR (%))
Table 30 North America Allergic Rhinitis Drugs Market Forecast by Country
Table 31 North America Allergic Rhinitis Drugs Market Forecast by Treatment Type, 2023-2033 (US$ Mn, AGR (%), CAGR (%))
Table 32 North America Allergic Rhinitis Drugs Market Forecast by Disease type, 2023-2033 (US$ Mn, AGR (%), CAGR (%))
Table 33 North America Allergic Rhinitis Drugs Market Forecast by Route of Administration, 2023-2033 (US$ Mn, AGR (%), CAGR (%))
Table 34 North America Allergic Rhinitis Drugs Market Forecast by Distribution Channel, 2023-2033 (US$ Mn, AGR (%), CAGR (%))
Table 35 U.S. Allergic Rhinitis Drugs Market Forecast, 2023-2033 (US$ Mn, AGR %, CAGR %)
Table 36 Canada Allergic Rhinitis Drugs Market Forecast, 2023-2033 (US$ mn, AGR %, CAGR %)
Table 37 Europe Allergic Rhinitis Drugs Market Forecast by Country, 2023-2033 (US$ Mn, AGR%, CAGR%)
Table 38 Europe Allergic Rhinitis Drugs Market Forecast by Treatment Type, 2023-2033 (US$ Mn, AGR (%), CAGR (%))
Table 39 Europe Allergic Rhinitis Drugs Market Forecast by Disease type, 2023-2033 (US$ Mn, AGR (%), CAGR (%))
Table 40 Europe Allergic Rhinitis Drugs Market Forecast by Route of Administration, 2023-2033 (US$ Mn, AGR (%), CAGR (%))
Table 41 Europe Allergic Rhinitis Drugs Market Forecast by Distribution Channel, 2023-2033 (US$ Mn, AGR (%), CAGR (%))
Table 42 Germany Allergic Rhinitis Drugs Market Forecast, 2023-2033 (US$ mn, AGR%, CAGR%)
Table 43 France Allergic Rhinitis Drugs Market Forecast, 2023-2033 (US$ mn, AGR%, CAGR%)
Table 44 UK Allergic Rhinitis Drugs Market Forecast, 2023-2033 (US$ mn, AGR%, CAGR%)
Table 45 Italy Allergic Rhinitis Drugs Market Forecast, 2023-2033 (US$ mn, AGR%, CAGR%)
Table 46 Spain Allergic Rhinitis Drugs Market Forecast, 2023-2033 (US$ mn, AGR%, CAGR%)
Table 47 Russia Allergic Rhinitis Drugs Market Forecast, 2023-2033 (US$ mn, AGR%, CAGR%)
Table 48 Rest of Europe Allergic Rhinitis Drugs Market Forecast, 2023-2033 (US$ mn, AGR%, CAGR%)
Table 49 Asia Pacific Allergic Rhinitis Drugs Market forecast by Country 2023-2033 (US$ Mn, AGR%, CAGR%)
Table 50 Asia Pacific Allergic Rhinitis Drugs Market Forecast by Treatment Type, 2023-2033 (US$ Mn, AGR (%), CAGR (%))
Table 51 Asia Pacific Allergic Rhinitis Drugs Market Forecast by Disease type, 2023-2033 (US$ Mn, AGR (%), CAGR (%))
Table 52 Asia Pacific Allergic Rhinitis Drugs Market Forecast by Route of Administration, 2023-2033 (US$ Mn, AGR (%), CAGR (%))
Table 53 Asia Pacific Allergic Rhinitis Drugs Market Forecast by Distribution Channel, 2023-2033 (US$ Mn, AGR (%), CAGR (%))
Table 54 Japan Allergic Rhinitis Drugs Market Forecast, 2023-2033 (US$ million, AGR %)
Table 55 China Allergic Rhinitis Drugs Market Forecast, 2023-2033 (US$ mn, AGR%, CAGR%)
Table 56 India Allergic Rhinitis Drugs Market Forecast, 2023-2033 (US$ mn, AGR%, CAGR%)
Table 57 Australia Allergic Rhinitis Drugs Market Forecast, 2023-2033 (US$ mn, AGR%, CAGR%)
Table 58 South Korea Allergic Rhinitis Drugs Market Forecast, 2023-2033 (US$ million, AGR %)
Table 59 Rest of Asia Pacific Allergic Rhinitis Drugs Market Forecast, 2023-2033 (US$ mn, AGR%, CAGR%)
Table 60 Latin America Allergic Rhinitis Drugs Forecast, 2023-2033 (US$ mn, AGR%, CAGR%)
Table 61 Latin America Allergic Rhinitis Drugs Market Forecast by Treatment Type, 2023-2033 (US$ Mn, AGR (%), CAGR (%))
Table 62 Latin America Allergic Rhinitis Drugs Market Forecast by Disease type, 2023-2033 (US$ Mn, AGR (%), CAGR (%))
Table 63 Latin America Allergic Rhinitis Drugs Market Forecast by Route of Administration, 2023-2033 (US$ Mn, AGR (%), CAGR (%))
Table 64 Latin America Allergic Rhinitis Drugs Market Forecast by Distribution Channel, 2023-2033 (US$ Mn, AGR (%), CAGR (%))
Table 65 Brazil Allergic Rhinitis Drugs Market Forecast, 2023-2033 (US$ mn, AGR%, CAGR%)
Table 66 Mexico Allergic Rhinitis Drugs Market Forecast, 2023-2033 (US$ mn, AGR%, CAGR%)
Table 67 Rest of Latin America Allergic Rhinitis Drugs Forecast, 2023-2033 (US$ mn, AGR%, CAGR%)
Table 68 MEA Allergic Rhinitis Drugs forecast by Country 2023-2033 (US$ Mn, AGR%, CAGR%)
Table 69 MEA Allergic Rhinitis Drugs Market Forecast by Treatment Type, 2023-2033 (US$ Mn, AGR (%), CAGR (%))
Table 70 MEA Allergic Rhinitis Drugs Market Forecast by Disease type, 2023-2033 (US$ Mn, AGR (%), CAGR (%))
Table 71 MEA Allergic Rhinitis Drugs Market Forecast by Route of Administration, 2023-2033 (US$ Mn, AGR (%), CAGR (%))
Table 72 MEA Allergic Rhinitis Drugs Market Forecast by Distribution Channel, 2023-2033 (US$ Mn, AGR (%), CAGR (%))
Table 73 GCC Allergic Rhinitis Drugs Market Forecast, 2023-2033 (US$ Mn, AGR%, CAGR%)
Table 74 South Africa Allergic Rhinitis Drugs Market Forecast, 2023-2033 (US$ Mn, AGR%, CAGR%)
Table 75 Rest of MEA Allergic Rhinitis Drugs Market Forecast, 2023-2033 (US$ Mn, AGR%, CAGR%)
Table 76 Alcon AG: Key Details, (CEO, HQ, Revenue, Founded, No. of Employees, Company Type, Website, Business Segment)
Table 77 Alcon AG: Product Benchmarking
Table 78 Alcon AG.: Strategic Outlook
Table 79 AstraZeneca plc: Key Details, (CEO, HQ, Revenue, Founded, No. of Employees, Company Type, Website, Business Segment)
Table 80 AstraZeneca plc: Product Benchmarking
Table 81 AstraZeneca plc: Strategic Outlook
Table 82 Bayer AG: Key Details, (CEO, HQ, Revenue, Founded, No. of Employees, Company Type, Website, Business Segment)
Table 83 Bayer AG.: Product Benchmarking
Table 84 Bayer AG: Strategic Outlook
Table 85 Dr. Reddy’s Laboratories Ltd.: Key Details, (CEO, HQ, Revenue, Founded, No. of Employees, Company Type, Website, Business Segment)
Table 86 Dr. Reddy’s Laboratories Ltd.: Product Benchmarking
Table 87 Dr. Reddy’s Laboratories Ltd.: Strategic Outlook
Table 88 GlaxoSmithKline plc: Key Details, (CEO, HQ, Revenue, Founded, No. of Employees, Company Type, Website, Business Segment)
Table 89 GlaxoSmithKline plc.: Product Benchmarking
Table 90 GlaxoSmithKline plc: Strategic Outlook
Table 91 Johnson & Johnson: Key Details, (CEO, HQ, Revenue, Founded, No. of Employees, Company Type, Website, Business Segment)
Table 92 Johnson & Johnson: Product Benchmarking
Table 93 Johnson & Johnson: Strategic Outlook
Table 94 Merck & Co.: Key Details, (CEO, HQ, Revenue, Founded, No. of Employees, Company Type, Website, Business Segment)
Table 95 Merck & Co.: Product Benchmarking
Table 96 Merck & Co.: Strategic Outlook
Table 97 Sanofi SA.: Key Details, (CEO, HQ, Revenue, Founded, No. of Employees, Company Type, Website, Business Segment)
Table 98 Sanofi SA: Product Benchmarking
Table 99 Sanofi SA : Strategic Outlook
Table 100 Sun Pharmaceutical Industries Limited: Key Details, (CEO, HQ, Revenue, Founded, No. of Employees, Company Type, Website, Business Segment)
Table 101 Sun Pharmaceutical Industries Limited: Product Benchmarking
Table 102 Sun Pharmaceutical Industries Limited: Strategic Outlook
Table 103 Teva Pharmaceutical Industries Ltd.: (CEO, HQ, Revenue, Founded, No. of Employees, Company Type, Website, Business Segment)
Table 104 Teva Pharmaceutical Industries Ltd.: Product Benchmarking
Table 105 Teva Pharmaceutical Industries Ltd.: Strategic Outlook
図の一覧
Figure 1 Allergic Rhinitis Drugs Market Segmentation
Figure 2 Allergic Rhinitis Drugs Market by Treatment type: Market Attractiveness Index
Figure 3 Allergic Rhinitis Drugs Market Attractiveness Index by Disease type
Figure 4 Allergic Rhinitis Drugs Market Attractiveness Index by Route of Administration
Figure 5 Allergic Rhinitis Drugs Market Attractiveness Index by Distribution Channel
Figure 6 Allergic Rhinitis Drugs Market Attractiveness Index by Region
Figure 7 Allergic Rhinitis Drugs Market: Market Dynamics
Figure 8 COVID Impact Analysis: Allergic Rhinitis Drugs Market Recovery Scenarios
Figure 9 Allergic Rhinitis Drugs Market by Region, 2023-2033 (US$ Mn, AGR (%), CAGR (%)): “V” Shaped Recovery
Figure 10 Allergic Rhinitis Drugs Market by Region, 2023-2033 (US$ Mn, AGR (%), CAGR (%)): “U” Shaped Recovery
Figure 11 Allergic Rhinitis Drugs Market by Region, 2023-2033 (US$ Mn, AGR (%), CAGR (%)): “W” Shaped Recovery
Figure 12 Allergic Rhinitis Drugs Market by Region, 2023-2033 (US$ Mn, AGR (%), CAGR (%)): “L” Shaped Recovery
Figure 13 Allergic Rhinitis Drugs Market: Porter’s Five Forces Analysis
Figure 14 Allergic Rhinitis Drugs Market: PEST Analysis
Figure 15 Allergic Rhinitis Drugs Market by Treatment Type: Market Attractiveness Index
Figure 16 Allergic Rhinitis Drugs Market Forecast by Treatment Type, 2023-2033 (US$ million)
Figure 17 Allergic Rhinitis Drugs Market Share Forecast by Treatment Type, 2023-2033 (%)
Figure 18 Antihistamines Market Forecast by Region, 2023-2033 (US$ million)
Figure 19 Antihistamines Market Share Forecast by Region, 2023 & 2033 (%)
Figure 20 Immunotherapy Market Forecast by Region, 2023-2033 (US$ million)
Figure 21 Immunotherapy Market Share Forecast by Region, 2023 & 2033 (%)
Figure 22 SCIT Market Forecast by Region, 2023-2033 (US$ million)
Figure 23 SCIT Market Share Forecast by Region, 2023 & 2033 (%)
Figure 24 SLIT Market Forecast by Region, 2023-2033 (US$ million)
Figure 25 SLIT Market Share Forecast by Region, 2023 & 2033 (%)
Figure 26 Corticosteroids Market Forecast by Region, 2023-2033 (US$ million)
Figure 27 Corticosteroids Market Share Forecast by Region, 2023 & 2033 (%)
Figure 28 Decongestants Market Forecast by Region, 2023-2033 (US$ million)
Figure 29 Decongestants Market Share Forecast by Region, 2023 & 2033 (%)
Figure 30 Others Market Forecast by Region, 2023-2033 (US$ million)
Figure 31 Others Market Share Forecast by Region, 2023 & 2033 (%)
Figure 32 Allergic Rhinitis Drugs Market by Disease Type: Market Attractiveness Index
Figure 33 Allergic Rhinitis Drugs Market Share Forecast by Disease Type, 2023-2033 (%)
Figure 34 Seasonal Allergic Rhinitis Market Forecast by Region, 2023-2033 (US$ million)
Figure 35 Seasonal Allergic Rhinitis Market Share Forecast by Region, 2023 & 2033 (%)
Figure 36 Perennial Allergic Rhinitis Market Forecast by Region, 2023-2033 (US$ million)
Figure 37 Perennial Allergic Rhinitis Market Share Forecast by Region, 2023 & 2033 (%)
Figure 38 Occupational Allergic Rhinitis Market Forecast by Region, 2023-2033 (US$ million)
Figure 39 Occupational Allergic Rhinitis Market Share Forecast by Region, 2023 & 2033 (%)
Figure 40 Allergic Rhinitis Drugs Market by Route of Administration: Market Attractiveness Index
Figure 41 Allergic Rhinitis Drugs Market Share Forecast by Route of Administration, 2023-2033 (%)
Figure 42 Oral Allergic Rhinitis Market Forecast by Region, 2023-2033 (US$ million)
Figure 43 Oral Allergic Rhinitis Market Share Forecast by Region, 2023 & 2033 (%)
Figure 44 Nasal Allergic Rhinitis Market Forecast by Region, 2023-2033 (US$ million)
Figure 45 Nasal Allergic Rhinitis Market Share Forecast by Region, 2023 & 2033 (%)
Figure 46 Intraocular Allergic Rhinitis Market Forecast by Region, 2023-2033 (US$ million)
Figure 47 Intraocular Allergic Rhinitis Market Share Forecast by Region, 2023 & 2033 (%)
Figure 48 Intravenous Allergic Rhinitis Market Forecast by Region, 2023-2033 (US$ million)
Figure 49 Intravenous Allergic Rhinitis Market Share Forecast by Region, 2023 & 2033 (%)
Figure 50 Allergic Rhinitis Drugs Market by Distribution Channel: Market Attractiveness Index
Figure 51 Allergic Rhinitis Drugs Market Forecast by Distribution Channel, 2023-2033 (US$ million)
Figure 52 Allergic Rhinitis Drugs Market Share Forecast by Distribution Channel, 2023-2033 (%)
Figure 53 Retail Pharmacies Allergic Rhinitis Market Forecast by Region, 2023-2033 (US$ million)
Figure 54 Retail Pharmacies Allergic Rhinitis Market Share Forecast by Region, 2023 & 2033 (%)
Figure 55 Hospital Pharmacies Allergic Rhinitis Market Forecast by Region, 2023-2033 (US$ million)
Figure 56 Hospital Pharmacies Allergic Rhinitis Market Share Forecast by Region, 2023 & 2033 (%)
Figure 57 Online Pharmacies Allergic Rhinitis Market Forecast by Region, 2023-2033 (US$ million)
Figure 58 Online Pharmacies Allergic Rhinitis Market Share Forecast by Region, 2023 & 2033 (%)
Figure 59 Allergic Rhinitis Drugs Market by Region: Market Attractiveness Index
Figure 60 Allergic Rhinitis Drugs Market by Region, 2023-2033 (US$ Mn)
Figure 61 Allergic Rhinitis Drugs Market Share Forecast by Region 2023, 2033(%)
Figure 62 North America Allergic Rhinitis Drugs Market Attractiveness Index
Figure 63 North America Allergic Rhinitis Drugs Market by Region, 2023, 2028 & 2033 (US$ million)
Figure 64 North America Allergic Rhinitis Drugs Market Forecast by Country, 2023-2033 (US$ million)
Figure 65 North America Allergic Rhinitis Drugs Market Share Forecast by Country, 2023 & 2033 (%)
Figure 66 North America Allergic Rhinitis Drugs Market Forecast by Treatment Type, 2023-2033 (US$ million)
Figure 67 North America Allergic Rhinitis Drugs Market Share Forecast by Treatment Type, 2023 & 2033 (%)
Figure 68 North America Allergic Rhinitis Drugs Market Forecast by Disease type, 2023-2033 (US$ million)
Figure 69 North America Allergic Rhinitis Drugs Market Share Forecast by Disease type, 2023 & 2033 (%)
Figure 70 North America Allergic Rhinitis Drugs Market Forecast by Route of Administration, 2023-2033 (US$ million)
Figure 71 North America Allergic Rhinitis Drugs Market Share Forecast by Route of Administration, 2023 & 2033 (%)
Figure 72 North America Allergic Rhinitis Drugs Market Forecast by Distribution Channel, 2023-2033 (US$ million)
Figure 73 North America Allergic Rhinitis Drugs Market Share Forecast by Distribution Channel, 2023 & 2033 (%)
Figure 74 U.S. Allergic Rhinitis Drugs Market Forecast, 2023-2033 (US$ million, AGR %)
Figure 75 Canada Allergic Rhinitis Drugs Market Forecast, 2023-2033 (US$ million, AGR %)
Figure 76 Europe Allergic Rhinitis Drugs Market Attractiveness Index
Figure 77 Europe Allergic Rhinitis Drugs Market by Region, 2023, 2028 & 2033 (US$ million)
Figure 78 Europe Allergic Rhinitis Drugs Market Forecast by Country, 2023-2033 (US$ million)
Figure 79 Europe Allergic Rhinitis Drugs Market Share Forecast by Country, 2023 & 2033 (%)
Figure 80 Europe Allergic Rhinitis Drugs Market Forecast by Treatment Type, 2023-2033 (US$ million)
Figure 81 Europe Allergic Rhinitis Drugs Market Share Forecast by Treatment Type, 2023 & 2033 (%)
Figure 82 Europe Allergic Rhinitis Drugs Market Forecast by Disease type, 2023-2033 (US$ million)
Figure 83 Europe Allergic Rhinitis Drugs Market Share Forecast by Disease type, 2023 & 2033 (%)
Figure 84 Europe Allergic Rhinitis Drugs Market Forecast by Route of Administration, 2023-2033 (US$ million)
Figure 85 Europe Allergic Rhinitis Drugs Market Share Forecast by Route of Administration, 2023 & 2033 (%)
Figure 86 Europe Allergic Rhinitis Drugs Market Forecast by Distribution Channel, 2023-2033 (US$ million)
Figure 87 Europe Allergic Rhinitis Drugs Market Share Forecast by Distribution Channel, 2023 & 2033 (%)
Figure 88 Germany Allergic Rhinitis Drugs Market Forecast, 2023-2033 (US$ million, AGR %)
Figure 89 France Allergic Rhinitis Drugs Market Forecast, 2023-2033 (US$ million, AGR %)
Figure 90 UK Allergic Rhinitis Drugs Market Forecast, 2023-2033 (US$ million, AGR %)
Figure 91 Italy Allergic Rhinitis Drugs Market Forecast, 2023-2033 (US$ million, AGR %)
Figure 92 Spain Allergic Rhinitis Drugs Market Forecast, 2023-2033 (US$ million, AGR %)
Figure 93 Russia Allergic Rhinitis Drugs Market Forecast, 2023-2033 (US$ million, AGR %)
Figure 94 Rest of Europe Allergic Rhinitis Drugs Market Forecast, 2023-2033 (US$ million, AGR %)
Figure 95 Asia Pacific Allergic Rhinitis Drugs Market Attractiveness Index
Figure 96 Asia Pacific Allergic Rhinitis Drugs Market by Region, 2023, 2028 & 2033 (US$ million)
Figure 97 Asia Pacific Allergic Rhinitis Drugs Market Forecast, 2023-2033 (US$ million, AGR %)
Figure 98 Asia Pacific Allergic Rhinitis Drugs Market Share Forecast by Country, 2023 & 2033 (%)
Figure 99 Asia Pacific Allergic Rhinitis Drugs Market Forecast by Treatment Type, 2023-2033 (US$ million)
Figure 100 Asia Pacific Allergic Rhinitis Drugs Market Share Forecast by Treatment Type, 2023 & 2033 (%)
Figure 101 Asia Pacific Allergic Rhinitis Drugs Market Forecast by Disease type, 2023-2033 (US$ million)
Figure 102 Asia Pacific Allergic Rhinitis Drugs Market Share Forecast by Disease type, 2023 & 2033 (%)
Figure 103 Asia Pacific Allergic Rhinitis Drugs Market Forecast by Route of Administration, 2023-2033 (US$ million)
Figure 104 Asia Pacific Allergic Rhinitis Drugs Market Share Forecast by Route of Administration, 2023 & 2033 (%)
Figure 105 Asia Pacific Allergic Rhinitis Drugs Market Forecast by Distribution Channel, 2023-2033 (US$ million)
Figure 106 Asia Pacific Allergic Rhinitis Drugs Market Share Forecast by Distribution Channel, 2023 & 2033 (%)
Figure 107 Japan Allergic Rhinitis Drugs Market Forecast, 2023-2033 (US$ million, AGR %)
Figure 108 China Allergic Rhinitis Drugs Market Forecast, 2023-2033 (US$ million, AGR %)
Figure 109 India Allergic Rhinitis Drugs Market Forecast, 2023-2033 (US$ million, AGR %)
Figure 110 Australia Allergic Rhinitis Drugs Market Forecast, 2023-2033 (US$ million, AGR %)
Figure 111 South Korea Allergic Rhinitis Drugs Market Forecast, 2023-2033 (US$ million, AGR %)
Figure 112 Rest of Asia Pacific Allergic Rhinitis Drugs Market Forecast, 2023-2033 (US$ million, AGR %)
Figure 113 Latin America Allergic Rhinitis Drugs Market Attractiveness Index
Figure 114 Latin America Allergic Rhinitis Drugs Market by Country, 2023, 2028 & 2033 (US$ million)
Figure 115 Latin America Allergic Rhinitis Drugs Market Forecast by Country, 2023-2033 (US$ million)
Figure 116 Latin America Allergic Rhinitis Drugs Market Share Forecast by Country, 2023 & 2033 (%)
Figure 117 Latin America Allergic Rhinitis Drugs Market Forecast by Treatment Type, 2023-2033 (US$ million)
Figure 118 Latin America Allergic Rhinitis Drugs Market Share Forecast by Treatment Type, 2023 & 2033 (%)
Figure 119 Latin America Allergic Rhinitis Drugs Market Forecast by Disease type, 2023-2033 (US$ million)
Figure 120 Latin America Allergic Rhinitis Drugs Market Share Forecast by Disease type, 2023 & 2033 (%)
Figure 121 Latin America Allergic Rhinitis Drugs Market Forecast by Route of Administration, 2023-2033 (US$ million)
Figure 122 Latin America Allergic Rhinitis Drugs Market Share Forecast by Route of Administration, 2023 & 2033 (%)
Figure 123 Latin America Allergic Rhinitis Drugs Market Forecast by Distribution Channel, 2023-2033 (US$ million)
Figure 124 Latin America Allergic Rhinitis Drugs Market Share Forecast by Distribution Channel, 2023 & 2033 (%)
Figure 125 Brazil Allergic Rhinitis Drugs Market Forecast, 2023-2033 (US$ million, AGR %)
Figure 126 Mexico Allergic Rhinitis Drugs Market Forecast, 2023-2033 (US$ million, AGR %)
Figure 127 Rest of Latin America Allergic Rhinitis Drugs Market Forecast, 2023-2033 (US$ million, AGR %)
Figure 128 MEA Allergic Rhinitis Drugs Market Attractiveness Index
Figure 129 MEA Allergic Rhinitis Drugs Market by Country, 2023, 2028 & 2033 (US$ million)
Figure 130 MEA Allergic Rhinitis Drugs Market Forecast by Country, 2023-2033 (US$ million)
Figure 131 MEA Allergic Rhinitis Drugs Market Share Forecast by Country, 2023 & 2033 (%)
Figure 132 MEA Allergic Rhinitis Drugs Market Forecast by Treatment Type, 2023-2033 (US$ million)
Figure 133 MEA Allergic Rhinitis Drugs Market Share Forecast by Treatment Type, 2023 & 2033 (%)
Figure 134 MEA Allergic Rhinitis Drugs Market Forecast by Disease type, 2023-2033 (US$ million)
Figure 135 MEA Allergic Rhinitis Drugs Market Share Forecast by Disease type, 2023 & 2033 (%)
Figure 136 MEA Allergic Rhinitis Drugs Market Forecast by Route of Administration, 2023-2033 (US$ million)
Figure 137 MEA Allergic Rhinitis Drugs Market Share Forecast by Route of Administration, 2023 & 2033 (%)
Figure 138 MEA Allergic Rhinitis Drugs Market Forecast by Distribution Channel, 2023-2033 (US$ million)
Figure 139 MEA Allergic Rhinitis Drugs Market Share Forecast by Distribution Channel, 2023 & 2033 (%)
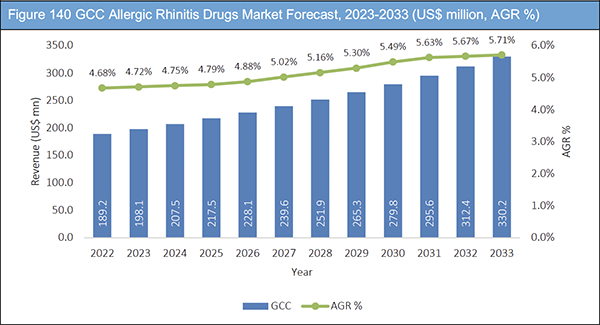
Figure 140 GCC Allergic Rhinitis Drugs Market Forecast, 2023-2033 (US$ million, AGR %)
Figure 141 South Africa Allergic Rhinitis Drugs Market Forecast, 2023-2033 (US$ million, AGR %)
Figure 142 Rest of MEA Allergic Rhinitis Drugs Market Forecast, 2023-2033 (US$ million, AGR %)
Figure 143 Company Share Analysis, 2021
Figure 144 Alcon AG: Net Revenue, 2017-2021 (US$ million, AGR%)
Figure 145 Alcon AG: R&D, 2017-2021 (US$ million, AGR%)
Figure 146 Alcon AG: Regional Market Shares, 2021
Figure 147 AstraZeneca plc: Net Revenue, 2017-2021 (US$ million, AGR%)
Figure 148 AstraZeneca plc; R&D, 2017-2021 (US$ million, AGR%)
Figure 149 AstraZeneca plc: Regional Market Shares, 2021
Figure 150 Bayer AG: Net Revenue, 2017-2021 (US$ million, AGR%)
Figure 151 Bayer AG.: R&D, 2017-2021 (US$ million, AGR%)
Figure 152 Bayer AG.: Regional Market Shares, 2021
Figure 153 Dr. Reddy’s Laboratories Ltd.: Net Revenue, 2017-2021 (US$ million, AGR%)
Figure 154 Dr. Reddy’s Laboratories Ltd.; R&D, 2017-2021 (US$ million, AGR%)
Figure 155 Dr. Reddy’s Laboratories Ltd.: Regional Market Shares, 2021
Figure 156 GlaxoSmithKline plc: Net Revenue, 2017-2021 (US$ million, AGR%)
Figure 157 GlaxoSmithKline plc: R&D, 2017-2021 (US$ million, AGR%)
Figure 158 GlaxoSmithKline plc: Regional Market Shares, 2021
Figure 159 Johnson & Johnson: Net Revenue, 2017-2021 (US$ million, AGR%)
Figure 160 Johnson & Johnson.: R&D, 2017-2021 (US$ million, AGR%)
Figure 161 Johnson & Johnson.: Regional Market Shares, 2021
Figure 162 Merck & Co.: Net Revenue, 2017-2021 (US$ million, AGR%)
Figure 163 Merck & Co.: R&D, 2017-2021 (US$ million, AGR%)
Figure 164 Merck & Co.: Regional Market Shares, 2021
Figure 165 Sanofi SA: Net Revenue, 2017-2021 (US$ million, AGR%)
Figure 166 Sanofi SA.: R&D, 2017-2021 (US$ million, AGR%)
Figure 167 Sanofi.: Regional Market Shares, 2021
Figure 168 Sun Pharmaceutical Industries Limited: Net Revenue, 2017-2021 (US$ million, AGR%)
Figure 169 Sun Pharmaceutical Industries Limited.: R&D, 2017-2021 (US$ million, AGR%)
Figure 170 Sun Pharmaceutical Industries Limited.: Regional Market Shares, 2021
Figure 171 Teva Pharmaceutical Industries Ltd.: Net Revenue, 2017-2021 (US$ million, AGR%)
Figure 172 Teva Pharmaceutical Industries Ltd.: R&D, 2017-2021 (US$ million, AGR%)
Figure 173 Teva Pharmaceutical Industries Ltd.: Regional Market Shares, 2021
ページTOPに戻る
Summary
Report Details
The Allergic Rhinitis Drugs Market Report 2023-2033: This report will prove invaluable to leading firms striving for new revenue pockets if they wish to better understand the industry and its underlying dynamics. It will be useful for companies that would like to expand into different industries or to expand their existing operations in a new region.
Advent of Innovative Intranasal Therapies for Treatment of Allergic Rhinitis
Intranasal therapies are gaining acceptance owing to their better safety and efficacy. This route of administration is also recommended by physicians and allergists since they do not have any systemic side-effects and their adequate concentrations can be achieved at receptor sides in nasal mucosa. Their adverse effects are limited to dryness, sneezing and stinging of nasal mucosa. Several companies are developing innovative intranasal drugs owing to their inherent advantages over other routes of administration. For instance, ClorNasal™ developed by Dr. Ferrer BioPharma is recognized as the best intranasal pharmacological formulation in the world. It is used in the treatment of several ailments including allergic rhinitis, Respiratory Syncytial Virus (RSV) Infection and COVID-19. Similarly, Altamira Therapeutics Ltd. Developed the nasal spray Bentrino. It prevents the onset of allergic symptoms by airborne allergens such as dust mites, and pollens.
Similarity of Symptoms With Other Diseases
Allergic rhinitis is an infection caused due to allergic reaction of immune system to an allergen. Some of the most common symptoms of allergic rhinitis include stuffy nose, watery eyes, itchy mouth, sneezing, post-nasal drip, sore throat, facial pain or pressure, partial loss of hearing, smell, and taste, and fatigue among others. The symptoms are very similar to cold and cough which might be caused by virus and not by any of the agents that cause allergies. The allergies can also trigger other conditions such as asthma, sinusitis, otitis media or eczema if not treatment well in time. Selection of the right drug candidate remains a major problem in the absence of accurate diagnosis. Administration of immunotherapy or allergy shots may have serious side effects such as hives and rash. It may sometimes have dangerous side effects such as anaphylaxis which may require years of treatment.
Adverse Effects of Drugs Used in Allergic Rhinitis Treatment
Allergic medications are mostly used over a long period of time to keep the lifestyle unaffected by different types of allergens in the environment. Antihistamines are the most widely used drug type for treatment of allergic infections. Some of the short-term side-effects of antihistamines include constipation, urinary retention, dry mouth, enhanced appetite, and worsen narrow-angle glaucoma. Several side-effects of nasal decongestants include high blood pressure, irritability, headache, and sleeplessness. Topical corticosteroids cause absorption of the drug into the systemic circulation which has potential to cause disturbance to the normal hormonal levels in the body. Corticosteroid ocular solutions can cause glaucoma, cataract and other eye infections. Intranasal corticosteroids can irritate nasal mucosa and also affect the cell lining of mouth and throat make them dry and soar. Oral corticosteroids are associated with side-effects such as osteoporosis, stomach ulceration, hyperglycaemia, increased blood pressure and muscle weakness.
What Questions Should You Ask before Buying a Market Research Report?
• How is the Allergic Rhinitis Drugs Market evolving?
• What is driving and restraining the Allergic Rhinitis Drugs Market?
• How will each Allergic Rhinitis Drugs submarket grow over the forecast period and how much revenue will these submarkets account for in 2033?
• How will the market shares for each Allergic Rhinitis Drugs submarket develop from 2023 to 2033?
• What will be the main driver for the overall market from 2023 to 2033?
• Will leading Allergic Rhinitis Drugs Markets broadly follow the macroeconomic dynamics, or will individual national markets outperform others?
• How will the market shares of the national markets change by 2033 and which geographical region will lead the market in 2033?
• Who are the leading players and what are their prospects over the forecast period?
• What are the Allergic Rhinitis Drugs development projects for these leading companies?
• How will the industry evolve during the period between 2023 and 2033? What are the implications of Allergic Rhinitis Drugs development projects taking place now and over the next 10 years?
• Is there a greater need for product commercialisation to further scale the Allergic Rhinitis Drugs Market?
• Where is the Allergic Rhinitis Drugs Market heading and how can you ensure you are at the forefront of the market?
• What are the best investment options for new product and service lines?
• What are the key prospects for moving companies into a new growth path and C-suite?
You need to discover how this will impact the Allergic Rhinitis Drugs Market today, and over the next 10 years:
• Our 269-page report provides 105 tables and 173 charts/graphs exclusively to you.
• The report highlights key lucrative areas in the industry so you can target them – NOW.
• It contains in-depth analysis of global, regional and national sales and growth.
• It highlights for you the key successful trends, changes and revenue projections made by your competitors.
This report tells you TODAY how the Allergic Rhinitis Drugs Market will develop in the next 10 years, and in line with the variations in COVID-19 economic recession and bounce. This market is more critical now than at any point over the last 10 years.
Forecasts to 2033 and other analyses reveal commercial prospects
• In addition to revenue forecasting to 2033, our new study provides you with recent results, growth rates, and market shares.
• You will find original analyses, with business outlooks and developments.
• Discover qualitative analyses (including market dynamics, drivers, opportunities, restraints and challenges), cost structure, impact of rising prices of allergic rhinitis drugs and recent developments.
This report includes data analysis and invaluable insight into how COVID-19 will affect the industry and your company. Four COVID-19 recovery patterns and their impact, namely, “V”, “L”, “W” and “U” are discussed in this report.
Segments Covered in the Report
Treatment Type
• Antihistamines
• Immunotherapy
– Subcutaneous Immunotherapy (SCIT)
– Sublingual Immunotherapy (SLIT)
• Corticosteroids
• Decongestants
• Others
Disease Type
• Seasonal Allergic Rhinitis
• Perennial Allergic Rhinitis
• Occupational Allergic Rhinitis
Route of Administration
• Oral
• Nasal
• Intraocular
• Intravenous
Distribution Channel
• Retail Pharmacies
• Hospital Pharmacies
• Online channels
In addition to the revenue predictions for the overall world market and segments, you will also find revenue forecasts for five regional and 16 leading national markets:
North America
• U.S.
• Canada
Europe
• Germany
• UK
• France
• Spain
• Italy
• Russia
• Rest of Europe
Asia Pacific
• China
• Japan
• India
• Australia
• South Korea
• Rest of Asia Pacific
Latin America
• Brazil
• Mexico
• Rest of Latin America
MEA
• GCC
• South Africa
• Rest of MEA
The report also includes profiles and for some of the leading companies in the Allergic Rhinitis Drugs Market, 2023 to 2033, with a focus on this segment of these companies’ operations.
Leading companies and the potential for market growth
• Alcon
• AstraZeneca
• Bayer AG
• Dr Reddy’s Laboratories
• GlaxoSmithKline PLC
• Johnson & Johnson
• Merck & Co
• Sanofi S.A.
• Sun Pharmaceuticals
• Teva Pharmaceutical Industries Ltd
Overall world revenue for Allergic Rhinitis Drugs Market, 2023 to 2033 in terms of value the market will surpass US$12,410 million in 2023, our work calculates. We predict strong revenue growth through to 2033. Our work identifies which organizations hold the greatest potential. Discover their capabilities, progress, and commercial prospects, helping you stay ahead.
How will the Allergic Rhinitis Drugs Market, 2023 to 2033 report help you?
In summary, our 260+ page report provides you with the following knowledge:
• Revenue forecasts to 2033 for Allergic Rhinitis Drugs Market, 2023 to 2033 Market, with forecasts for Type of Treatment, Disease, Route of Administration and Distribution channel at a global and regional level – discover the industry’s prospects, finding the most lucrative places for investments and revenues.
• Revenue forecasts to 2033 for five regional and 16 key national markets – See forecasts for the Allergic Rhinitis Drugs Market, 2023 to 2033 market in North America, Europe, Asia-Pacific and Latin America and Middle East and Africa. Also forecasted is the market in the US, Canada, Mexico, Brazil, Germany, France, UK, Italy, China, India, Japan, and Australia among other prominent economies.
• Prospects for established firms and those seeking to enter the market – including company profiles of the major companies involved in the Allergic Rhinitis Drugs Market, 2023 to 2033.
Find quantitative and qualitative analyses with independent predictions. Receive information that only our report contains, staying informed with invaluable business intelligence.
Information found nowhere else
With our new report, you are less likely to fall behind in knowledge or miss out on opportunities. See how our work could benefit your research, analyses, and decisions. Visiongain’s study is for everybody needing commercial analyses for the Allergic Rhinitis Drugs Market, 2023 to 2033, market-leading companies. You will find data, trends and predictions.
ページTOPに戻る
Table of Contents
Table of Contents
1. Report Overview
1.1 Objectives of the Study
1.2 Introduction to Allergic Rhinitis Drugs Market
1.3 What This Report Delivers
1.4 Why You Should Read This Report
1.5 Key Questions Answered by This Analytical Report
1.6 Who is This Report for?
1.7 Methodology
1.7.1 Market Definitions
1.7.2 Market Evaluation & Forecasting Methodology
1.7.3 Data Validation
1.7.3.1 Primary Research
1.7.3.2 Secondary Research
1.8 Frequently Asked Questions (FAQs)
1.9 Associated Visiongain Reports
1.10 About Visiongain
2 Executive Summary
3 Market Overview
3.1 Key Findings
3.2 Market Dynamics
3.2.1 Market Driving Factors
3.2.1.1 Growing Awareness About Allergies and Available Treatment Options
3.2.1.2 Increasing Prevalence of Respiratory Disorders
3.2.1.3 Launch of Effective and Novel Drug Delivery Systems
3.2.2 Market Restraining Factors
3.2.2.1 Adverse Effects of Drugs Used in Treatment of Allergic Rhinitis
3.2.2.2 Similarity of Symptoms with Other Diseases
3.2.3 Market Opportunities
3.2.3.1 Increasing Advancements in Allergen Immunotherapy (AIT)
3.2.3.2 Favourable Government Initiatives to Promote Awareness Regarding Allergic Rhinitis
3.3 COVID-19 Impact Analysis
3.4 Porter’s Five Forces Analysis
3.4.1 Bargaining Power of Suppliers
3.4.2 Bargaining Power of Buyers
3.4.3 Competitive Rivalry
3.4.4 Threat from Substitutes
3.4.5 Threat of New Entrants
3.5 PEST Analysis
4 Allergic Rhinitis Drugs Market Analysis by Treatment Type
4.1 Key Findings
4.2 Product Segment: Market Attractiveness Index
4.3 Allergic Rhinitis Drugs Market Size Estimation and Forecast by Treatment Type
4.4 Antihistamines
4.4.1 Market Size by Region, 2023-2033 (US$ Mn)
4.4.2 Market Share by Region, 2023 & 2033 (%)
4.5 Immunotherapy
4.5.1 Market Size by Region, 2023-2033 (US$ Mn)
4.5.2 Market Share by Region, 2023 & 2033 (%)
4.5.3 Sublingual immunotherapy (SLIT)
4.5.3.1 Market Size by Region, 2023-2033 (US$ Mn)
4.5.3.2 Market Share by Region, 2023 & 2033 (%)
4.5.4 Sublingual immunotherapy (SLIT)
4.5.4.1 Market Size by Region, 2023-2033 (US$ Mn)
4.5.4.2 Market Share by Region, 2023 & 2033 (%)
4.6 Corticosteroids
4.6.1 Market Size by Region, 2023-2033 (US$ Mn)
4.6.2 Market Share by Region, 2023 & 2033 (%)
4.7 Decongestants
4.7.1 Market Size by Region, 2023-2033 (US$ Mn)
4.7.2 Market Share by Region, 2023 & 2033 (%)
4.8 Others
4.8.1 Market Size by Region, 2023-2033 (US$ Mn)
4.8.2 Market Share by Region, 2023 & 2033 (%)
5 Allergic Rhinitis Drugs Market Analysis by Disease Type
5.1 Key Findings
5.2 Product Segment: Market Attractiveness Index
5.3 Allergic Rhinitis Drugs Market Size Estimation and Forecast by Disease Type
5.4 Seasonal Allergic Rhinitis
5.4.1 Market Size by Region, 2023-2033 (US$ Mn)
5.4.2 Market Share by Region, 2023 & 2033 (%)
5.5 Perennial Allergic Rhinitis
5.5.1 Market Size by Region, 2023-2033 (US$ Mn)
5.5.2 Market Share by Region, 2023 & 2033 (%)
5.6 Occupational Allergic Rhinitis
5.6.1 Market Size by Region, 2023-2033 (US$ Mn)
5.6.2 Market Share by Region, 2023 & 2033 (%)
6 Allergic Rhinitis Drugs Market Analysis by Route of Administration
6.1 Key Findings
6.2 Product Segment: Market Attractiveness Index
6.3 Allergic Rhinitis Drugs Market Size Estimation and Forecast by Route of Administration
6.4 Oral
6.4.1 Market Size by Region, 2023-2033 (US$ Mn)
6.4.2 Market Share by Region, 2023 & 2033 (%)
6.5 Nasal
6.5.1 Market Size by Region, 2023-2033 (US$ Mn)
6.5.2 Market Share by Region, 2023 & 2033 (%)
6.6 Intraocular
6.6.1 Market Size by Region, 2023-2033 (US$ Mn)
6.6.2 Market Share by Region, 2023 & 2033 (%)
6.7 Intravenous
6.7.1 Market Size by Region, 2023-2033 (US$ Mn)
6.7.2 Market Share by Region, 2023 & 2033 (%)
7 Allergic Rhinitis Drugs Market Analysis by Distribution Channel
7.1 Key Findings
7.2 Product Segment: Market Attractiveness Index
7.3 Allergic Rhinitis Drugs Market Size Estimation and Forecast by Distribution Channel
7.4 Retail Pharmacies
7.4.1 Market Size by Region, 2023-2033 (US$ Mn)
7.4.2 Market Share by Region, 2023 & 2033 (%)
7.5 Hospital Pharmacies
7.5.1 Market Size by Region, 2023-2033 (US$ Mn)
7.5.2 Market Share by Region, 2023 & 2033 (%)
7.6 Online Pharmacies
7.6.1 Market Size by Region, 2023-2033 (US$ Mn)
7.6.2 Market Share by Region, 2023 & 2033 (%)
8 Allergic Rhinitis Drugs Market Analysis by Region
8.1 Key Findings
8.2 Regional Segment: Market Attractiveness Index
8.3 Allergic Rhinitis Drugs Market Size Estimation and Forecast
9 North America Allergic Rhinitis Drugs Market Analysis
9.1 Key Findings
9.2 North America Allergic Rhinitis Drugs Market Attractiveness Index
9.3 North America Allergic Rhinitis Drugs Market by Country, 2023, 2028 & 2033 (US$ Mn)
9.4 North America Allergic Rhinitis Drugs Market Size Estimation and Forecast by Country
9.5 North America Allergic Rhinitis Drugs Market Size Estimation and Forecast by Treatment Type
9.6 North America Allergic Rhinitis Drugs Market Size Estimation and Forecast by Disease type
9.7 North America Allergic Rhinitis Drugs Market Size Estimation and Forecast by Route of Administration
9.8 North America Allergic Rhinitis Drugs Market Size Estimation and Forecast by Distribution Channel
9.9 U.S. Allergic Rhinitis Drugs Market Analysis
9.10 Canada Allergic Rhinitis Drugs Market Analysis
10 Europe Allergic Rhinitis Drugs Market Analysis
10.1 Key Findings
10.2 Europe Allergic Rhinitis Drugs Market Attractiveness Index
10.3 Europe Allergic Rhinitis Drugs Market by Country, 2023, 2028 & 2033 (US$ Mn)
10.4 Europe Allergic Rhinitis Drugs Market Size Estimation and Forecast by Country
10.5 Europe Allergic Rhinitis Drugs Market Size Estimation and Forecast by Treatment Type
10.6 Europe Allergic Rhinitis Drugs Market Size Estimation and Forecast by Disease type
10.7 Europe Allergic Rhinitis Drugs Market Size Estimation and Forecast by Route of Administration
10.8 Europe Allergic Rhinitis Drugs Market Size Estimation and Forecast by Distribution Channel
10.9 Germany Allergic Rhinitis Drugs Market Analysis
10.10 France Allergic Rhinitis Drugs Market Analysis
10.11 UK Allergic Rhinitis Drugs Market Analysis
10.12 Italy Allergic Rhinitis Drugs Market Analysis
10.13 Spain Allergic Rhinitis Drugs Market Analysis
10.14 Russia Allergic Rhinitis Drugs Market Analysis
10.15 Rest of Europe Allergic Rhinitis Drugs Market Analysis
11 Asia Pacific Allergic Rhinitis Drugs Market Analysis
11.1 Key Findings
11.2 Asia Pacific Allergic Rhinitis Drugs Market Attractiveness Index
11.3 Asia Pacific Allergic Rhinitis Drugs Market by Country, 2023, 2028 & 2033 (US$ Mn)
11.4 Asia Pacific Allergic Rhinitis Drugs Market Size Estimation and Forecast by Country
11.5 Asia Pacific Allergic Rhinitis Drugs Market Size Estimation and Forecast by Treatment Type
11.6 Asia Pacific Allergic Rhinitis Drugs Market Size Estimation and Forecast by Disease type
11.7 Asia Pacific Allergic Rhinitis Drugs Market Size Estimation and Forecast by Route of Administration
11.8 Asia Pacific Allergic Rhinitis Drugs Market Size Estimation and Forecast by Distribution Channel
11.9 Japan Allergic Rhinitis Drugs Market Analysis
11.10 China Allergic Rhinitis Drugs Market Analysis
11.11 India Allergic Rhinitis Drugs Market Analysis
11.12 Australia Allergic Rhinitis Drugs Market Analysis
11.13 South Korea Allergic Rhinitis Drugs Market Analysis
11.14 Rest of Asia Pacific Allergic Rhinitis Drugs Market Analysis
12 Latin America Allergic Rhinitis Drugs Market Analysis
12.1 Key Findings
12.2 Latin America Allergic Rhinitis Drugs Market Attractiveness Index
12.3 Latin America Allergic Rhinitis Drugs Market by Country, 2023, 2028 & 2033 (US$ Mn)
12.4 Latin America Allergic Rhinitis Drugs Market Size Estimation and Forecast by Country
12.5 Latin America Allergic Rhinitis Drugs Market Size Estimation and Forecast by Treatment Type
12.6 Latin America Allergic Rhinitis Drugs Market Size Estimation and Forecast by Disease type
12.7 Latin America Allergic Rhinitis Drugs Market Size Estimation and Forecast by Route of Administration
12.8 Latin America Allergic Rhinitis Drugs Market Size Estimation and Forecast by Distribution Channel
12.9 Brazil Allergic Rhinitis Drugs Market Analysis
12.10 Mexico Allergic Rhinitis Drugs Market Analysis
12.11 Rest of Latin America Allergic Rhinitis Drugs Market Analysis
13 MEA Allergic Rhinitis Drugs Market Analysis
13.1 Key Findings
13.2 MEA Allergic Rhinitis Drugs Market Attractiveness Index
13.3 MEA Allergic Rhinitis Drugs Market by Country, 2023, 2028 & 2033 (US$ Mn)
13.4 MEA Allergic Rhinitis Drugs Market Size Estimation and Forecast by Country
13.5 MEA Allergic Rhinitis Drugs Market Size Estimation and Forecast by Treatment Type
13.6 MEA Allergic Rhinitis Drugs Market Size Estimation and Forecast by Disease type
13.7 MEA Allergic Rhinitis Drugs Market Size Estimation and Forecast by Route of Administration
13.8 MEA Allergic Rhinitis Drugs Market Size Estimation and Forecast by Distribution Channel
13.9 GCC Allergic Rhinitis Drugs Market Analysis
13.10 South Africa Allergic Rhinitis Drugs Market Analysis
13.11 Rest of MEA Allergic Rhinitis Drugs Market Analysis
14 Company Profiles
14.1 Competitive Landscape, 2021
14.2 ALCON AG
14.2.1 Company Snapshot
14.2.2 Company Overview
14.2.3 Financial Analysis
14.2.3.1 Net Revenue, 2017-2021
14.2.3.2 R&D, 2017-2021
14.2.3.3 Regional Market Shares, 2021
14.2.4 Product Benchmarking
14.2.5 Strategic Outlook
14.3 AstraZeneca plc
14.3.1 Company Snapshot
14.3.2 Company Overview
14.3.3 Financial Analysis
14.3.3.1 Net Revenue, 2017-2021
14.3.3.2 R&D, 2017-2021
14.3.3.3 Regional Market Shares, 2021
14.3.4 Product Benchmarking
14.3.5 Strategic Outlook
14.4 Bayer AG
14.4.1 Company Snapshot
14.4.2 Company Overview
14.4.3 Financial Analysis
14.4.3.1 Net Revenue, 2017-2021
14.4.3.2 R&D, 2017-2021
14.4.3.3 Regional Market Shares, 2021
14.4.4 Product Benchmarking
14.4.5 Strategic Outlook
14.5 Dr Reddy's Laboratories Ltd.
14.5.1 Company Snapshot
14.5.2 Company Overview
14.5.3 Financial Analysis
14.5.3.1 Net Revenue, 2017-2021
14.5.3.2 R&D, 2017-2021
14.5.3.3 Regional Market Shares, 2021
14.5.4 Product Benchmarking
14.5.5 Strategic Outlook
14.6 GlaxoSmithKline plc
14.6.1 Company Snapshot
14.6.2 Company Overview
14.6.3 Financial Analysis
14.6.3.1 Net Revenue, 2017-2021
14.6.3.2 R&D, 2017-2021
14.6.3.3 Regional Market Shares, 2021
14.6.4 Product Benchmarking
14.6.5 Strategic Outlook
14.7 Johnson & Johnson
14.7.1 Company Snapshot
14.7.2 Company Overview
14.7.3 Financial Analysis
14.7.3.1 Net Revenue, 2017-2021
14.7.3.2 R&D, 2017-2021
14.7.3.3 Regional Market Shares, 2021
14.7.4 Product Benchmarking
14.7.5 Strategic Outlook
14.8 Merck & Co.
14.8.1 Company Snapshot
14.8.2 Company Overview
14.8.3 Financial Analysis
14.8.3.1 Net Revenue, 2017-2021
14.8.3.2 R&D, 2017-2021
14.8.3.3 Regional Market Shares, 2021
14.8.4 Product Benchmarking
14.8.5 Strategic Outlook
14.9 Sanofi SA
14.9.1 Company Snapshot
14.9.2 Company Overview
14.9.3 Financial Analysis
14.9.3.1 Net Revenue, 2017-2021
14.9.3.2 R&D, 2017-2021
14.9.3.3 Regional Market Shares, 2021
14.9.4 Product Benchmarking
14.9.5 Strategic Outlook
14.10 Sun Pharmaceutical Industries Limited
14.10.1 Company Snapshot
14.10.2 Company Overview
14.10.3 Financial Analysis
14.10.3.1 Net Revenue, 2017-2021
14.10.3.2 R&D, 2017-2021
14.10.3.3 Regional Market Shares, 2021
14.10.4 Product Benchmarking
14.10.5 Strategic Outlook
14.11 Teva Pharmaceutical Industries Ltd.
14.11.1 Company Snapshot
14.11.2 Company Overview
14.11.3 Financial Analysis
14.11.3.1 Net Revenue, 2017-2021
14.11.3.2 R&D, 2017-2021
14.11.3.3 Regional Market Shares, 2021
14.11.4 Product Benchmarking
14.11.5 Strategic Outlook
15 Conclusion and Recommendations
15.1 Concluding Remarks from Visiongain
15.2 Recommendations for Market Players
List of Tables
Table 1 Allergic Rhinitis Drugs Market Snapshot, 2023 & 2033 (US$ million, CAGR %)
Table 2 Allergic Rhinitis Drugs Market by Region, 2023-2033 (US$ Mn, AGR (%), CAGR (%)): “V” Shaped Recovery Scenario
Table 3 Allergic Rhinitis Drugs Market by Region, 2023-2033 (US$ Mn, AGR (%), CAGR (%)): “U” Shaped Recovery Scenario
Table 4 Allergic Rhinitis Drugs Market by Region, 2023-2033 (US$ Mn, AGR (%), CAGR (%)): “W” Shaped Recovery Scenario
Table 5 Allergic Rhinitis Drugs Market by Region, 2023-2033 (US$ Mn, AGR (%), CAGR (%)): “L” Shaped Recovery Scenario
Table 6 Allergic Rhinitis Drugs Market Forecast by Treatment Type, 2023-2033 (US$ Mn, AGR (%), CAGR (%))
Table 7 Antihistamines Market Forecast by Region, 2023-2033 (US$ Mn, AGR%, CAGR%)
Table 8 Immunotherapy Market Forecast by Region, 2023-2033 (US$ Mn, AGR%, CAGR%)
Table 9 SCIT Market Forecast by Region, 2023-2033 (US$ Mn, AGR%, CAGR%)
Table 10 SLIT Market Forecast by Region, 2023-2033 (US$ Mn, AGR%, CAGR%)
Table 11 Corticosteroids Market Forecast by Region, 2023-2033 (US$ Mn, AGR%, CAGR%)
Table 12 Decongestants Market Forecast by Region, 2023-2033 (US$ Mn, AGR%, CAGR%)
Table 13 Others Market Forecast by Region, 2023-2033 (US$ Mn, AGR%, CAGR%)
Table 14 Allergic Rhinitis Drugs Market Forecast by Disease type, 2023-2033 (US$ Mn, AGR (%), CAGR (%))
Table 15 Allergic Rhinitis Drugs Market Forecast by Disease Type , 2023-2033 (US$ million)
Table 16 Seasonal Allergic Rhinitis Market Forecast by Region, 2023-2033 (US$ Mn, AGR%, CAGR%)
Table 17 Perennial Allergic Rhinitis Market Forecast by Region, 2023-2033 (US$ Mn, AGR%, CAGR%)
Table 18 Occupational Allergic Rhinitis Market Forecast by Region, 2023-2033 (US$ Mn, AGR%, CAGR%)
Table 19 Allergic Rhinitis Drugs Market Forecast by Route of Administration, 2023-2033 (US$ Mn, AGR (%), CAGR (%))
Table 20 Allergic Rhinitis Drugs Market Forecast by Route of Route of Administration, 2023-2033 (US$ million)
Table 21 Oral Allergic Rhinitis Market Forecast by Region, 2023-2033 (US$ Mn, AGR%, CAGR%)
Table 22 Nasal Allergic Rhinitis Market Forecast by Region, 2023-2033 (US$ Mn, AGR%, CAGR%)
Table 23 Intraocular Allergic Rhinitis Market Forecast by Region, 2023-2033 (US$ Mn, AGR%, CAGR%)
Table 24 Intravenous Allergic Rhinitis Market Forecast by Region, 2023-2033 (US$ Mn, AGR%, CAGR%)
Table 25 Allergic Rhinitis Drugs Market Forecast by Distribution Channel, 2023-2033 (US$ Mn, AGR (%), CAGR (%))
Table 26 Retail Pharmacies Allergic Rhinitis Market Forecast by Region, 2023-2033 (US$ Mn, AGR%, CAGR%)
Table 27 Hospital Pharmacies Allergic Rhinitis Market Forecast by Region, 2023-2033 (US$ Mn, AGR%, CAGR%)
Table 28 Online Pharmacies Allergic Rhinitis Market Forecast by Region, 2023-2033 (US$ Mn, AGR%, CAGR%)
Table 29 Allergic Rhinitis Drugs Market by Region, 2023-2033 (US$ Mn, AGR (%), CAGR (%))
Table 30 North America Allergic Rhinitis Drugs Market Forecast by Country
Table 31 North America Allergic Rhinitis Drugs Market Forecast by Treatment Type, 2023-2033 (US$ Mn, AGR (%), CAGR (%))
Table 32 North America Allergic Rhinitis Drugs Market Forecast by Disease type, 2023-2033 (US$ Mn, AGR (%), CAGR (%))
Table 33 North America Allergic Rhinitis Drugs Market Forecast by Route of Administration, 2023-2033 (US$ Mn, AGR (%), CAGR (%))
Table 34 North America Allergic Rhinitis Drugs Market Forecast by Distribution Channel, 2023-2033 (US$ Mn, AGR (%), CAGR (%))
Table 35 U.S. Allergic Rhinitis Drugs Market Forecast, 2023-2033 (US$ Mn, AGR %, CAGR %)
Table 36 Canada Allergic Rhinitis Drugs Market Forecast, 2023-2033 (US$ mn, AGR %, CAGR %)
Table 37 Europe Allergic Rhinitis Drugs Market Forecast by Country, 2023-2033 (US$ Mn, AGR%, CAGR%)
Table 38 Europe Allergic Rhinitis Drugs Market Forecast by Treatment Type, 2023-2033 (US$ Mn, AGR (%), CAGR (%))
Table 39 Europe Allergic Rhinitis Drugs Market Forecast by Disease type, 2023-2033 (US$ Mn, AGR (%), CAGR (%))
Table 40 Europe Allergic Rhinitis Drugs Market Forecast by Route of Administration, 2023-2033 (US$ Mn, AGR (%), CAGR (%))
Table 41 Europe Allergic Rhinitis Drugs Market Forecast by Distribution Channel, 2023-2033 (US$ Mn, AGR (%), CAGR (%))
Table 42 Germany Allergic Rhinitis Drugs Market Forecast, 2023-2033 (US$ mn, AGR%, CAGR%)
Table 43 France Allergic Rhinitis Drugs Market Forecast, 2023-2033 (US$ mn, AGR%, CAGR%)
Table 44 UK Allergic Rhinitis Drugs Market Forecast, 2023-2033 (US$ mn, AGR%, CAGR%)
Table 45 Italy Allergic Rhinitis Drugs Market Forecast, 2023-2033 (US$ mn, AGR%, CAGR%)
Table 46 Spain Allergic Rhinitis Drugs Market Forecast, 2023-2033 (US$ mn, AGR%, CAGR%)
Table 47 Russia Allergic Rhinitis Drugs Market Forecast, 2023-2033 (US$ mn, AGR%, CAGR%)
Table 48 Rest of Europe Allergic Rhinitis Drugs Market Forecast, 2023-2033 (US$ mn, AGR%, CAGR%)
Table 49 Asia Pacific Allergic Rhinitis Drugs Market forecast by Country 2023-2033 (US$ Mn, AGR%, CAGR%)
Table 50 Asia Pacific Allergic Rhinitis Drugs Market Forecast by Treatment Type, 2023-2033 (US$ Mn, AGR (%), CAGR (%))
Table 51 Asia Pacific Allergic Rhinitis Drugs Market Forecast by Disease type, 2023-2033 (US$ Mn, AGR (%), CAGR (%))
Table 52 Asia Pacific Allergic Rhinitis Drugs Market Forecast by Route of Administration, 2023-2033 (US$ Mn, AGR (%), CAGR (%))
Table 53 Asia Pacific Allergic Rhinitis Drugs Market Forecast by Distribution Channel, 2023-2033 (US$ Mn, AGR (%), CAGR (%))
Table 54 Japan Allergic Rhinitis Drugs Market Forecast, 2023-2033 (US$ million, AGR %)
Table 55 China Allergic Rhinitis Drugs Market Forecast, 2023-2033 (US$ mn, AGR%, CAGR%)
Table 56 India Allergic Rhinitis Drugs Market Forecast, 2023-2033 (US$ mn, AGR%, CAGR%)
Table 57 Australia Allergic Rhinitis Drugs Market Forecast, 2023-2033 (US$ mn, AGR%, CAGR%)
Table 58 South Korea Allergic Rhinitis Drugs Market Forecast, 2023-2033 (US$ million, AGR %)
Table 59 Rest of Asia Pacific Allergic Rhinitis Drugs Market Forecast, 2023-2033 (US$ mn, AGR%, CAGR%)
Table 60 Latin America Allergic Rhinitis Drugs Forecast, 2023-2033 (US$ mn, AGR%, CAGR%)
Table 61 Latin America Allergic Rhinitis Drugs Market Forecast by Treatment Type, 2023-2033 (US$ Mn, AGR (%), CAGR (%))
Table 62 Latin America Allergic Rhinitis Drugs Market Forecast by Disease type, 2023-2033 (US$ Mn, AGR (%), CAGR (%))
Table 63 Latin America Allergic Rhinitis Drugs Market Forecast by Route of Administration, 2023-2033 (US$ Mn, AGR (%), CAGR (%))
Table 64 Latin America Allergic Rhinitis Drugs Market Forecast by Distribution Channel, 2023-2033 (US$ Mn, AGR (%), CAGR (%))
Table 65 Brazil Allergic Rhinitis Drugs Market Forecast, 2023-2033 (US$ mn, AGR%, CAGR%)
Table 66 Mexico Allergic Rhinitis Drugs Market Forecast, 2023-2033 (US$ mn, AGR%, CAGR%)
Table 67 Rest of Latin America Allergic Rhinitis Drugs Forecast, 2023-2033 (US$ mn, AGR%, CAGR%)
Table 68 MEA Allergic Rhinitis Drugs forecast by Country 2023-2033 (US$ Mn, AGR%, CAGR%)
Table 69 MEA Allergic Rhinitis Drugs Market Forecast by Treatment Type, 2023-2033 (US$ Mn, AGR (%), CAGR (%))
Table 70 MEA Allergic Rhinitis Drugs Market Forecast by Disease type, 2023-2033 (US$ Mn, AGR (%), CAGR (%))
Table 71 MEA Allergic Rhinitis Drugs Market Forecast by Route of Administration, 2023-2033 (US$ Mn, AGR (%), CAGR (%))
Table 72 MEA Allergic Rhinitis Drugs Market Forecast by Distribution Channel, 2023-2033 (US$ Mn, AGR (%), CAGR (%))
Table 73 GCC Allergic Rhinitis Drugs Market Forecast, 2023-2033 (US$ Mn, AGR%, CAGR%)
Table 74 South Africa Allergic Rhinitis Drugs Market Forecast, 2023-2033 (US$ Mn, AGR%, CAGR%)
Table 75 Rest of MEA Allergic Rhinitis Drugs Market Forecast, 2023-2033 (US$ Mn, AGR%, CAGR%)
Table 76 Alcon AG: Key Details, (CEO, HQ, Revenue, Founded, No. of Employees, Company Type, Website, Business Segment)
Table 77 Alcon AG: Product Benchmarking
Table 78 Alcon AG.: Strategic Outlook
Table 79 AstraZeneca plc: Key Details, (CEO, HQ, Revenue, Founded, No. of Employees, Company Type, Website, Business Segment)
Table 80 AstraZeneca plc: Product Benchmarking
Table 81 AstraZeneca plc: Strategic Outlook
Table 82 Bayer AG: Key Details, (CEO, HQ, Revenue, Founded, No. of Employees, Company Type, Website, Business Segment)
Table 83 Bayer AG.: Product Benchmarking
Table 84 Bayer AG: Strategic Outlook
Table 85 Dr. Reddy’s Laboratories Ltd.: Key Details, (CEO, HQ, Revenue, Founded, No. of Employees, Company Type, Website, Business Segment)
Table 86 Dr. Reddy’s Laboratories Ltd.: Product Benchmarking
Table 87 Dr. Reddy’s Laboratories Ltd.: Strategic Outlook
Table 88 GlaxoSmithKline plc: Key Details, (CEO, HQ, Revenue, Founded, No. of Employees, Company Type, Website, Business Segment)
Table 89 GlaxoSmithKline plc.: Product Benchmarking
Table 90 GlaxoSmithKline plc: Strategic Outlook
Table 91 Johnson & Johnson: Key Details, (CEO, HQ, Revenue, Founded, No. of Employees, Company Type, Website, Business Segment)
Table 92 Johnson & Johnson: Product Benchmarking
Table 93 Johnson & Johnson: Strategic Outlook
Table 94 Merck & Co.: Key Details, (CEO, HQ, Revenue, Founded, No. of Employees, Company Type, Website, Business Segment)
Table 95 Merck & Co.: Product Benchmarking
Table 96 Merck & Co.: Strategic Outlook
Table 97 Sanofi SA.: Key Details, (CEO, HQ, Revenue, Founded, No. of Employees, Company Type, Website, Business Segment)
Table 98 Sanofi SA: Product Benchmarking
Table 99 Sanofi SA : Strategic Outlook
Table 100 Sun Pharmaceutical Industries Limited: Key Details, (CEO, HQ, Revenue, Founded, No. of Employees, Company Type, Website, Business Segment)
Table 101 Sun Pharmaceutical Industries Limited: Product Benchmarking
Table 102 Sun Pharmaceutical Industries Limited: Strategic Outlook
Table 103 Teva Pharmaceutical Industries Ltd.: (CEO, HQ, Revenue, Founded, No. of Employees, Company Type, Website, Business Segment)
Table 104 Teva Pharmaceutical Industries Ltd.: Product Benchmarking
Table 105 Teva Pharmaceutical Industries Ltd.: Strategic Outlook
List of Figures
Figure 1 Allergic Rhinitis Drugs Market Segmentation
Figure 2 Allergic Rhinitis Drugs Market by Treatment type: Market Attractiveness Index
Figure 3 Allergic Rhinitis Drugs Market Attractiveness Index by Disease type
Figure 4 Allergic Rhinitis Drugs Market Attractiveness Index by Route of Administration
Figure 5 Allergic Rhinitis Drugs Market Attractiveness Index by Distribution Channel
Figure 6 Allergic Rhinitis Drugs Market Attractiveness Index by Region
Figure 7 Allergic Rhinitis Drugs Market: Market Dynamics
Figure 8 COVID Impact Analysis: Allergic Rhinitis Drugs Market Recovery Scenarios
Figure 9 Allergic Rhinitis Drugs Market by Region, 2023-2033 (US$ Mn, AGR (%), CAGR (%)): “V” Shaped Recovery
Figure 10 Allergic Rhinitis Drugs Market by Region, 2023-2033 (US$ Mn, AGR (%), CAGR (%)): “U” Shaped Recovery
Figure 11 Allergic Rhinitis Drugs Market by Region, 2023-2033 (US$ Mn, AGR (%), CAGR (%)): “W” Shaped Recovery
Figure 12 Allergic Rhinitis Drugs Market by Region, 2023-2033 (US$ Mn, AGR (%), CAGR (%)): “L” Shaped Recovery
Figure 13 Allergic Rhinitis Drugs Market: Porter’s Five Forces Analysis
Figure 14 Allergic Rhinitis Drugs Market: PEST Analysis
Figure 15 Allergic Rhinitis Drugs Market by Treatment Type: Market Attractiveness Index
Figure 16 Allergic Rhinitis Drugs Market Forecast by Treatment Type, 2023-2033 (US$ million)
Figure 17 Allergic Rhinitis Drugs Market Share Forecast by Treatment Type, 2023-2033 (%)
Figure 18 Antihistamines Market Forecast by Region, 2023-2033 (US$ million)
Figure 19 Antihistamines Market Share Forecast by Region, 2023 & 2033 (%)
Figure 20 Immunotherapy Market Forecast by Region, 2023-2033 (US$ million)
Figure 21 Immunotherapy Market Share Forecast by Region, 2023 & 2033 (%)
Figure 22 SCIT Market Forecast by Region, 2023-2033 (US$ million)
Figure 23 SCIT Market Share Forecast by Region, 2023 & 2033 (%)
Figure 24 SLIT Market Forecast by Region, 2023-2033 (US$ million)
Figure 25 SLIT Market Share Forecast by Region, 2023 & 2033 (%)
Figure 26 Corticosteroids Market Forecast by Region, 2023-2033 (US$ million)
Figure 27 Corticosteroids Market Share Forecast by Region, 2023 & 2033 (%)
Figure 28 Decongestants Market Forecast by Region, 2023-2033 (US$ million)
Figure 29 Decongestants Market Share Forecast by Region, 2023 & 2033 (%)
Figure 30 Others Market Forecast by Region, 2023-2033 (US$ million)
Figure 31 Others Market Share Forecast by Region, 2023 & 2033 (%)
Figure 32 Allergic Rhinitis Drugs Market by Disease Type: Market Attractiveness Index
Figure 33 Allergic Rhinitis Drugs Market Share Forecast by Disease Type, 2023-2033 (%)
Figure 34 Seasonal Allergic Rhinitis Market Forecast by Region, 2023-2033 (US$ million)
Figure 35 Seasonal Allergic Rhinitis Market Share Forecast by Region, 2023 & 2033 (%)
Figure 36 Perennial Allergic Rhinitis Market Forecast by Region, 2023-2033 (US$ million)
Figure 37 Perennial Allergic Rhinitis Market Share Forecast by Region, 2023 & 2033 (%)
Figure 38 Occupational Allergic Rhinitis Market Forecast by Region, 2023-2033 (US$ million)
Figure 39 Occupational Allergic Rhinitis Market Share Forecast by Region, 2023 & 2033 (%)
Figure 40 Allergic Rhinitis Drugs Market by Route of Administration: Market Attractiveness Index
Figure 41 Allergic Rhinitis Drugs Market Share Forecast by Route of Administration, 2023-2033 (%)
Figure 42 Oral Allergic Rhinitis Market Forecast by Region, 2023-2033 (US$ million)
Figure 43 Oral Allergic Rhinitis Market Share Forecast by Region, 2023 & 2033 (%)
Figure 44 Nasal Allergic Rhinitis Market Forecast by Region, 2023-2033 (US$ million)
Figure 45 Nasal Allergic Rhinitis Market Share Forecast by Region, 2023 & 2033 (%)
Figure 46 Intraocular Allergic Rhinitis Market Forecast by Region, 2023-2033 (US$ million)
Figure 47 Intraocular Allergic Rhinitis Market Share Forecast by Region, 2023 & 2033 (%)
Figure 48 Intravenous Allergic Rhinitis Market Forecast by Region, 2023-2033 (US$ million)
Figure 49 Intravenous Allergic Rhinitis Market Share Forecast by Region, 2023 & 2033 (%)
Figure 50 Allergic Rhinitis Drugs Market by Distribution Channel: Market Attractiveness Index
Figure 51 Allergic Rhinitis Drugs Market Forecast by Distribution Channel, 2023-2033 (US$ million)
Figure 52 Allergic Rhinitis Drugs Market Share Forecast by Distribution Channel, 2023-2033 (%)
Figure 53 Retail Pharmacies Allergic Rhinitis Market Forecast by Region, 2023-2033 (US$ million)
Figure 54 Retail Pharmacies Allergic Rhinitis Market Share Forecast by Region, 2023 & 2033 (%)
Figure 55 Hospital Pharmacies Allergic Rhinitis Market Forecast by Region, 2023-2033 (US$ million)
Figure 56 Hospital Pharmacies Allergic Rhinitis Market Share Forecast by Region, 2023 & 2033 (%)
Figure 57 Online Pharmacies Allergic Rhinitis Market Forecast by Region, 2023-2033 (US$ million)
Figure 58 Online Pharmacies Allergic Rhinitis Market Share Forecast by Region, 2023 & 2033 (%)
Figure 59 Allergic Rhinitis Drugs Market by Region: Market Attractiveness Index
Figure 60 Allergic Rhinitis Drugs Market by Region, 2023-2033 (US$ Mn)
Figure 61 Allergic Rhinitis Drugs Market Share Forecast by Region 2023, 2033(%)
Figure 62 North America Allergic Rhinitis Drugs Market Attractiveness Index
Figure 63 North America Allergic Rhinitis Drugs Market by Region, 2023, 2028 & 2033 (US$ million)
Figure 64 North America Allergic Rhinitis Drugs Market Forecast by Country, 2023-2033 (US$ million)
Figure 65 North America Allergic Rhinitis Drugs Market Share Forecast by Country, 2023 & 2033 (%)
Figure 66 North America Allergic Rhinitis Drugs Market Forecast by Treatment Type, 2023-2033 (US$ million)
Figure 67 North America Allergic Rhinitis Drugs Market Share Forecast by Treatment Type, 2023 & 2033 (%)
Figure 68 North America Allergic Rhinitis Drugs Market Forecast by Disease type, 2023-2033 (US$ million)
Figure 69 North America Allergic Rhinitis Drugs Market Share Forecast by Disease type, 2023 & 2033 (%)
Figure 70 North America Allergic Rhinitis Drugs Market Forecast by Route of Administration, 2023-2033 (US$ million)
Figure 71 North America Allergic Rhinitis Drugs Market Share Forecast by Route of Administration, 2023 & 2033 (%)
Figure 72 North America Allergic Rhinitis Drugs Market Forecast by Distribution Channel, 2023-2033 (US$ million)
Figure 73 North America Allergic Rhinitis Drugs Market Share Forecast by Distribution Channel, 2023 & 2033 (%)
Figure 74 U.S. Allergic Rhinitis Drugs Market Forecast, 2023-2033 (US$ million, AGR %)
Figure 75 Canada Allergic Rhinitis Drugs Market Forecast, 2023-2033 (US$ million, AGR %)
Figure 76 Europe Allergic Rhinitis Drugs Market Attractiveness Index
Figure 77 Europe Allergic Rhinitis Drugs Market by Region, 2023, 2028 & 2033 (US$ million)
Figure 78 Europe Allergic Rhinitis Drugs Market Forecast by Country, 2023-2033 (US$ million)
Figure 79 Europe Allergic Rhinitis Drugs Market Share Forecast by Country, 2023 & 2033 (%)
Figure 80 Europe Allergic Rhinitis Drugs Market Forecast by Treatment Type, 2023-2033 (US$ million)
Figure 81 Europe Allergic Rhinitis Drugs Market Share Forecast by Treatment Type, 2023 & 2033 (%)
Figure 82 Europe Allergic Rhinitis Drugs Market Forecast by Disease type, 2023-2033 (US$ million)
Figure 83 Europe Allergic Rhinitis Drugs Market Share Forecast by Disease type, 2023 & 2033 (%)
Figure 84 Europe Allergic Rhinitis Drugs Market Forecast by Route of Administration, 2023-2033 (US$ million)
Figure 85 Europe Allergic Rhinitis Drugs Market Share Forecast by Route of Administration, 2023 & 2033 (%)
Figure 86 Europe Allergic Rhinitis Drugs Market Forecast by Distribution Channel, 2023-2033 (US$ million)
Figure 87 Europe Allergic Rhinitis Drugs Market Share Forecast by Distribution Channel, 2023 & 2033 (%)
Figure 88 Germany Allergic Rhinitis Drugs Market Forecast, 2023-2033 (US$ million, AGR %)
Figure 89 France Allergic Rhinitis Drugs Market Forecast, 2023-2033 (US$ million, AGR %)
Figure 90 UK Allergic Rhinitis Drugs Market Forecast, 2023-2033 (US$ million, AGR %)
Figure 91 Italy Allergic Rhinitis Drugs Market Forecast, 2023-2033 (US$ million, AGR %)
Figure 92 Spain Allergic Rhinitis Drugs Market Forecast, 2023-2033 (US$ million, AGR %)
Figure 93 Russia Allergic Rhinitis Drugs Market Forecast, 2023-2033 (US$ million, AGR %)
Figure 94 Rest of Europe Allergic Rhinitis Drugs Market Forecast, 2023-2033 (US$ million, AGR %)
Figure 95 Asia Pacific Allergic Rhinitis Drugs Market Attractiveness Index
Figure 96 Asia Pacific Allergic Rhinitis Drugs Market by Region, 2023, 2028 & 2033 (US$ million)
Figure 97 Asia Pacific Allergic Rhinitis Drugs Market Forecast, 2023-2033 (US$ million, AGR %)
Figure 98 Asia Pacific Allergic Rhinitis Drugs Market Share Forecast by Country, 2023 & 2033 (%)
Figure 99 Asia Pacific Allergic Rhinitis Drugs Market Forecast by Treatment Type, 2023-2033 (US$ million)
Figure 100 Asia Pacific Allergic Rhinitis Drugs Market Share Forecast by Treatment Type, 2023 & 2033 (%)
Figure 101 Asia Pacific Allergic Rhinitis Drugs Market Forecast by Disease type, 2023-2033 (US$ million)
Figure 102 Asia Pacific Allergic Rhinitis Drugs Market Share Forecast by Disease type, 2023 & 2033 (%)
Figure 103 Asia Pacific Allergic Rhinitis Drugs Market Forecast by Route of Administration, 2023-2033 (US$ million)
Figure 104 Asia Pacific Allergic Rhinitis Drugs Market Share Forecast by Route of Administration, 2023 & 2033 (%)
Figure 105 Asia Pacific Allergic Rhinitis Drugs Market Forecast by Distribution Channel, 2023-2033 (US$ million)
Figure 106 Asia Pacific Allergic Rhinitis Drugs Market Share Forecast by Distribution Channel, 2023 & 2033 (%)
Figure 107 Japan Allergic Rhinitis Drugs Market Forecast, 2023-2033 (US$ million, AGR %)
Figure 108 China Allergic Rhinitis Drugs Market Forecast, 2023-2033 (US$ million, AGR %)
Figure 109 India Allergic Rhinitis Drugs Market Forecast, 2023-2033 (US$ million, AGR %)
Figure 110 Australia Allergic Rhinitis Drugs Market Forecast, 2023-2033 (US$ million, AGR %)
Figure 111 South Korea Allergic Rhinitis Drugs Market Forecast, 2023-2033 (US$ million, AGR %)
Figure 112 Rest of Asia Pacific Allergic Rhinitis Drugs Market Forecast, 2023-2033 (US$ million, AGR %)
Figure 113 Latin America Allergic Rhinitis Drugs Market Attractiveness Index
Figure 114 Latin America Allergic Rhinitis Drugs Market by Country, 2023, 2028 & 2033 (US$ million)
Figure 115 Latin America Allergic Rhinitis Drugs Market Forecast by Country, 2023-2033 (US$ million)
Figure 116 Latin America Allergic Rhinitis Drugs Market Share Forecast by Country, 2023 & 2033 (%)
Figure 117 Latin America Allergic Rhinitis Drugs Market Forecast by Treatment Type, 2023-2033 (US$ million)
Figure 118 Latin America Allergic Rhinitis Drugs Market Share Forecast by Treatment Type, 2023 & 2033 (%)
Figure 119 Latin America Allergic Rhinitis Drugs Market Forecast by Disease type, 2023-2033 (US$ million)
Figure 120 Latin America Allergic Rhinitis Drugs Market Share Forecast by Disease type, 2023 & 2033 (%)
Figure 121 Latin America Allergic Rhinitis Drugs Market Forecast by Route of Administration, 2023-2033 (US$ million)
Figure 122 Latin America Allergic Rhinitis Drugs Market Share Forecast by Route of Administration, 2023 & 2033 (%)
Figure 123 Latin America Allergic Rhinitis Drugs Market Forecast by Distribution Channel, 2023-2033 (US$ million)
Figure 124 Latin America Allergic Rhinitis Drugs Market Share Forecast by Distribution Channel, 2023 & 2033 (%)
Figure 125 Brazil Allergic Rhinitis Drugs Market Forecast, 2023-2033 (US$ million, AGR %)
Figure 126 Mexico Allergic Rhinitis Drugs Market Forecast, 2023-2033 (US$ million, AGR %)
Figure 127 Rest of Latin America Allergic Rhinitis Drugs Market Forecast, 2023-2033 (US$ million, AGR %)
Figure 128 MEA Allergic Rhinitis Drugs Market Attractiveness Index
Figure 129 MEA Allergic Rhinitis Drugs Market by Country, 2023, 2028 & 2033 (US$ million)
Figure 130 MEA Allergic Rhinitis Drugs Market Forecast by Country, 2023-2033 (US$ million)
Figure 131 MEA Allergic Rhinitis Drugs Market Share Forecast by Country, 2023 & 2033 (%)
Figure 132 MEA Allergic Rhinitis Drugs Market Forecast by Treatment Type, 2023-2033 (US$ million)
Figure 133 MEA Allergic Rhinitis Drugs Market Share Forecast by Treatment Type, 2023 & 2033 (%)
Figure 134 MEA Allergic Rhinitis Drugs Market Forecast by Disease type, 2023-2033 (US$ million)
Figure 135 MEA Allergic Rhinitis Drugs Market Share Forecast by Disease type, 2023 & 2033 (%)
Figure 136 MEA Allergic Rhinitis Drugs Market Forecast by Route of Administration, 2023-2033 (US$ million)
Figure 137 MEA Allergic Rhinitis Drugs Market Share Forecast by Route of Administration, 2023 & 2033 (%)
Figure 138 MEA Allergic Rhinitis Drugs Market Forecast by Distribution Channel, 2023-2033 (US$ million)
Figure 139 MEA Allergic Rhinitis Drugs Market Share Forecast by Distribution Channel, 2023 & 2033 (%)
Figure 140 GCC Allergic Rhinitis Drugs Market Forecast, 2023-2033 (US$ million, AGR %)
Figure 141 South Africa Allergic Rhinitis Drugs Market Forecast, 2023-2033 (US$ million, AGR %)
Figure 142 Rest of MEA Allergic Rhinitis Drugs Market Forecast, 2023-2033 (US$ million, AGR %)
Figure 143 Company Share Analysis, 2021
Figure 144 Alcon AG: Net Revenue, 2017-2021 (US$ million, AGR%)
Figure 145 Alcon AG: R&D, 2017-2021 (US$ million, AGR%)
Figure 146 Alcon AG: Regional Market Shares, 2021
Figure 147 AstraZeneca plc: Net Revenue, 2017-2021 (US$ million, AGR%)
Figure 148 AstraZeneca plc; R&D, 2017-2021 (US$ million, AGR%)
Figure 149 AstraZeneca plc: Regional Market Shares, 2021
Figure 150 Bayer AG: Net Revenue, 2017-2021 (US$ million, AGR%)
Figure 151 Bayer AG.: R&D, 2017-2021 (US$ million, AGR%)
Figure 152 Bayer AG.: Regional Market Shares, 2021
Figure 153 Dr. Reddy’s Laboratories Ltd.: Net Revenue, 2017-2021 (US$ million, AGR%)
Figure 154 Dr. Reddy’s Laboratories Ltd.; R&D, 2017-2021 (US$ million, AGR%)
Figure 155 Dr. Reddy’s Laboratories Ltd.: Regional Market Shares, 2021
Figure 156 GlaxoSmithKline plc: Net Revenue, 2017-2021 (US$ million, AGR%)
Figure 157 GlaxoSmithKline plc: R&D, 2017-2021 (US$ million, AGR%)
Figure 158 GlaxoSmithKline plc: Regional Market Shares, 2021
Figure 159 Johnson & Johnson: Net Revenue, 2017-2021 (US$ million, AGR%)
Figure 160 Johnson & Johnson.: R&D, 2017-2021 (US$ million, AGR%)
Figure 161 Johnson & Johnson.: Regional Market Shares, 2021
Figure 162 Merck & Co.: Net Revenue, 2017-2021 (US$ million, AGR%)
Figure 163 Merck & Co.: R&D, 2017-2021 (US$ million, AGR%)
Figure 164 Merck & Co.: Regional Market Shares, 2021
Figure 165 Sanofi SA: Net Revenue, 2017-2021 (US$ million, AGR%)
Figure 166 Sanofi SA.: R&D, 2017-2021 (US$ million, AGR%)
Figure 167 Sanofi.: Regional Market Shares, 2021
Figure 168 Sun Pharmaceutical Industries Limited: Net Revenue, 2017-2021 (US$ million, AGR%)
Figure 169 Sun Pharmaceutical Industries Limited.: R&D, 2017-2021 (US$ million, AGR%)
Figure 170 Sun Pharmaceutical Industries Limited.: Regional Market Shares, 2021
Figure 171 Teva Pharmaceutical Industries Ltd.: Net Revenue, 2017-2021 (US$ million, AGR%)
Figure 172 Teva Pharmaceutical Industries Ltd.: R&D, 2017-2021 (US$ million, AGR%)
Figure 173 Teva Pharmaceutical Industries Ltd.: Regional Market Shares, 2021
ページTOPに戻る
本レポートと同分野(アレルギー用薬)の最新刊レポート
Visiongain社のヘルスケアと医薬・化学品分野での最新刊レポート
本レポートと同じKEY WORD()の最新刊レポート
- 本レポートと同じKEY WORDの最新刊レポートはありません。
よくあるご質問
Visiongain社はどのような調査会社ですか?
英国の調査会社ヴィジョンゲイン社(Visiongain)は、通信とエネルギーのほか、自動車や化学・医薬品、金属など、広範な市場を対象に調査を行っています。自動車市場については、市場全般に関する調査のほ... もっと見る
調査レポートの納品までの日数はどの程度ですか?
在庫のあるものは速納となりますが、平均的には 3-4日と見て下さい。
但し、一部の調査レポートでは、発注を受けた段階で内容更新をして納品をする場合もあります。
発注をする前のお問合せをお願いします。
注文の手続きはどのようになっていますか?
1)お客様からの御問い合わせをいただきます。
2)見積書やサンプルの提示をいたします。
3)お客様指定、もしくは弊社の発注書をメール添付にて発送してください。
4)データリソース社からレポート発行元の調査会社へ納品手配します。
5) 調査会社からお客様へ納品されます。最近は、pdfにてのメール納品が大半です。
お支払方法の方法はどのようになっていますか?
納品と同時にデータリソース社よりお客様へ請求書(必要に応じて納品書も)を発送いたします。
お客様よりデータリソース社へ(通常は円払い)の御振り込みをお願いします。
請求書は、納品日の日付で発行しますので、翌月最終営業日までの当社指定口座への振込みをお願いします。振込み手数料は御社負担にてお願いします。
お客様の御支払い条件が60日以上の場合は御相談ください。
尚、初めてのお取引先や個人の場合、前払いをお願いすることもあります。ご了承のほど、お願いします。
データリソース社はどのような会社ですか?
当社は、世界各国の主要調査会社・レポート出版社と提携し、世界各国の市場調査レポートや技術動向レポートなどを日本国内の企業・公官庁及び教育研究機関に提供しております。
世界各国の「市場・技術・法規制などの」実情を調査・収集される時には、データリソース社にご相談ください。
お客様の御要望にあったデータや情報を抽出する為のレポート紹介や調査のアドバイスも致します。
|
|

