アレルギー性鼻炎治療薬市場レポート:2024-2034
Allergic Rhinitis Drugs Market Report 2024-2034
レポート詳細
アレルギー性鼻炎治療薬市場レポート 2024-2034年 :本レポートは、業界とその基礎となる原動力をより良く理解したい場合、新たな収益ポケットを目指す大手企業にとって貴重なものとな... もっと見る
※上記価格は部署ライセンス(Departmental licence)価格です。
その他の価格についてはデータリソースまでお問合せください。
日本語のページは自動翻訳を利用し作成しています。
実際のレポートは英文のみでご納品いたします。

|

|
サマリー
レポート詳細
アレルギー性鼻炎治療薬市場レポート 2024-2034年:本レポートは、業界とその基礎となる原動力をより良く理解したい場合、新たな収益ポケットを目指す大手企業にとって貴重なものとなるでしょう。異業種への進出や新規地域での既存事業の拡大を目指す企業にも有用です。
アレルギー性鼻炎の増加
アレルギー性鼻炎は、しばしば花粉症とも呼ばれ、何百万人もの人々に影響を与え、生活の質全体に大きな影響を与える世界的な問題として増加している。アレルギー性鼻炎の有病率の増加は、医療費の急増につながっているだけでなく、重要な市場促進要因としても浮上している。
アレルギー性鼻炎に関連する症状の緩和を目的とした医薬品に対する製薬業界の需要が顕著に増加している。抗ヒスタミン薬、充血除去薬、副腎皮質ステロイド薬、アレルギー免疫療法などが広く処方されており、アレルギー治療薬市場の活況に貢献している。アレルギー性鼻炎の症状を緩和するために設計された点鼻薬やその他の医療機器が人気を博している。これらの器具は、症状管理のための非薬理学的方法を提供し、最先端技術の市場拡大を生み出している。
アレルギー性鼻炎の有病率の増加により、アレルギー検査や免疫療法を含む医療サービスへの需要が高まっている。アレルギー専門医、免疫専門医、耳鼻咽喉科専門医は、患者訪問の増加を目の当たりにしており、これらの医療分野の成長を牽引している。遠隔医療の台頭は、アレルギー性鼻炎患者が遠隔で医療専門家に相談できる便利なプラットフォームを提供している。この傾向は、医療へのアクセスを改善しただけでなく、バーチャル医療サービスの拡大にも寄与している。
アレルギー性鼻炎治療薬の認知度向上と診断が市場を牽引
情報が入手しやすくなるにつれて、患者は自分の健康のために積極的に行動するようになりつつある。インターネット、ソーシャルメディア、ヘルスケアアプリは、様々な健康状態、症状、予防策に関する知識を広める上で極めて重要な役割を果たしている。このようなエンパワーメントにより、患者集団はより多くの情報を得るようになり、医療の決定に積極的に参加するようになった。意識の高まりにより、医療の焦点は反応的なものから積極的なものへと変化している。定期的な健康診断や検診、生活習慣の改善など、予防的な対策への関心が高まっている。この変化は、医療制度の負担を軽減するだけでなく、予防医療サービスや製品の新たな市場機会をも生み出している。人々が健康への全体的なアプローチをますます優先するようになり、健康・ウェルネス産業は活況を呈している。フィットネストラッカーや栄養アプリから、ウェルネス・リトリートや個別化された健康プランまで、市場はかつてない成長を遂げている。
個人は、総合的な幸福と生活の質を高める製品やサービスに投資する用意がある。診断技術の急速な進歩は、疾患の特定における精度と効率を一変させた。
遺伝子検査から高度な画像診断技術に至るまで、これらの技術は早期発見と個別化された治療計画を可能にし、診断サービスと機器に対する需要を牽引している。
疾患の遺伝的・分子的側面に対する理解が深まるにつれ、精密医療への扉が開かれた。個々の遺伝子プロファイルに基づいて治療をカスタマイズすることで、より効率的で的を絞った介入が可能になる。このパラダイムの変化は、個別化治療を重視する医薬品開発を形成している。意識が高まるにつれ、定期的な検診や早期発見プログラムに対する需要が高まっている。
市場調査レポートを購入する前にすべき質問とは?
-
アレルギー性鼻炎治療薬市場はどのように発展しているのか?
-
アレルギー性鼻炎治療薬市場の促進要因と抑制要因は?
-
アレルギー性鼻炎治療薬の各サブマーケットは予測期間中にどのように成長し、2034年にはどれくらいの売上を占めるようになるのか?
-
2024年から2034年にかけて、アレルギー性鼻炎治療薬の各サブマーケットの市場シェアはどのように推移するのか?
-
2024年から2034年にかけて、市場全体を牽引する主な要因は何か?
-
主要なアレルギー性鼻炎治療薬市場はマクロ経済力学に幅広く追随するのか、それとも個々の国市場が他を凌駕するのか?
-
2034年までに各国市場のシェアはどのように変化し、どの地域が2034年の市場をリードするのか。
-
主要プレーヤーと予測期間中の見通しは?
-
これらの主要企業におけるアレルギー性鼻炎治療薬のプロジェクトとは?
-
2024年から2034年の間に、業界はどのように発展するのか?アレルギー性鼻炎の影響は?
-
現在、そして今後10年の間に行われる薬物プロジェクトは?
-
アレルギー性鼻炎治療薬市場をさらに拡大するために、製品化の必要性は高まっているか?
-
アレルギー性鼻炎治療薬市場はどこへ向かっているのか?
-
新商品や新サービスに最適な投資方法とは?
-
企業を新たな成長軌道に乗せ、C-suiteに移行させるための重要な展望とは?
このことがアレルギー性鼻炎治療薬市場に現在、そして今後10年間どのような影響を与えるかを知る必要がある:
-
322ページにわたるレポートでは、120の表と200の図表を掲載している。
-
について本レポートでは、業界の主要な有利分野を取り上げている。今すぐ
-
世界、地域、国の売上高と成長に関する詳細な分析が含まれている。
-
競合他社が成功した主なトレンド、変化、収益予測をハイライトします。
本レポートは、アレルギー性鼻炎治療薬市場が今後10年間でどのように発展していくのか、またCOVID-19の景気後退と好転の変動に合わせてどのように発展していくのかをお伝えします。この市場は過去10年間のどの時点よりも今が重要である。
2034年までの予測やその他の分析から、商業的な展望が明らかになる
-
2034年までの収益予測に加え、最近の実績、成長率、市場シェアも提供している。
-
ビジネスの展望や展開など、独自の分析が掲載されている。
-
定性的分析(市場ダイナミクス、促進要因、機会、阻害要因、課題を含む)と最近の動向をご覧いただけます。
本レポートには、COVID-19が業界と貴社にどのような影響を与えるかについてのデータ分析と貴重な洞察が含まれている。本レポートでは、COVID-19の4つの回収パターンとその影響、すなわち「V」、「L」、「W」、「U」について論じている。
レポート対象セグメント
治療タイプ別
-
抗ヒスタミン薬
-
免疫療法皮下免疫療法(SCIT)、舌下免疫療法(SLIT)
-
コルチコステロイド
-
鬱血除去薬
-
その他
疾患タイプ別
-
季節性アレルギー性鼻炎
-
通年性アレルギー性鼻炎
-
職業性アレルギー性鼻炎
薬剤別
投与経路別
流通チャネル別
世界市場全体と各分野の売上予測に加え、5つの地域と26の主要国市場の売上予測も掲載しています:
北米
欧州
-
ドイツ
-
英国
-
フランス
-
スペイン
-
イタリア
-
ロシア
-
ポーランド
-
ベルギー
-
その他の欧州
アジア太平洋
-
中国
-
日本
-
インド
-
オーストラリア
-
韓国
-
シンガポール
-
台湾
-
その他のアジア太平洋
ラテンアメリカ
-
ブラジル
-
メキシコ
-
アルゼンチン
-
その他のラテンアメリカ
MEA
また、アレルギー性鼻炎治療薬市場2024年から2034年にかけての主要企業のプロファイルと、これらの企業の事業のこのセグメントに焦点を当てています。
報告書に掲載されている主要企業
-
Alcon
-
AstraZeneca
-
Bayer AG
-
Boehringer Ingelheim International GmbH
-
Dr. Reddy’s Laboratories Ltd.
-
GSK plc
-
Johnson & Johnson Services, Inc.
-
Merck & Co., Inc.
-
Sanofi
-
Sun Pharmaceutical Industries Ltd.
-
Teva Pharmaceutical Industries Ltd.
アレルギー性鼻炎治療薬市場全体の世界売上高は、金額ベースで2024年から2034年にかけて、2024年に168億米ドルを突破する。2034年まで力強い収益成長を予測。当研究所では、最も大きな可能性を秘めた組織を特定しています。彼らの能力、進歩、商業的展望を発見し、一歩先を行くお手伝いをします。
アレルギー性鼻炎治療薬市場2024-2034年レポートはどのようにお役に立ちますか?
要約すると、320ページを超えるこのレポートは、以下の知識を提供する:
-
アレルギー性鼻炎治療薬市場の2024年から2034年までの収益予測 世界および地域レベルでの製品別、用途別の予測 - 業界の将来性を発見し、投資と収益に最も有利な場所を見つけることができます。
-
5つの地域と26の主要国市場の2034年までの収益予測 - 北米、ヨーロッパ、アジア太平洋、ラテンアメリカ、MEAのアレルギー性鼻炎治療薬市場の2024年から2034年までの予測をご覧ください。また、米国、カナダ、メキシコ、ブラジル、ドイツ、フランス、英国、イタリア、中国、インド、日本、オーストラリアなどの主要国の市場も予測しています。
-
2024年から2034年までのアレルギー性鼻炎治療薬市場に関わる主要企業11社の企業プロファイルを含む。
独自の予測による定量的・定性的分析をご覧ください。私たちのレポートだけに含まれる情報を入手し、貴重なビジネスインテリジェンスで情報を得ることができます。
他にはない情報
私たちの新しいレポートがあれば、知識に遅れをとったり、チャンスを逃したりする可能性が低くなります。弊社のレポートが貴社の調査、分析、意思決定にどのように役立つかをご覧ください。Visiongainの調査は、アレルギー性鼻炎薬市場2024年から2034年、市場をリードする企業の商業分析を必要とするすべての人のためのものです。データ、トレンド、予測をご覧いただけます。
ページTOPに戻る
目次
目次
1 レポート概要
1.1 研究の目的
1.2 アレルギー性鼻炎治療薬の紹介
1.3 本レポートの内容
1.4 本レポートを読むべき理由
1.5 本分析レポートが回答する主な質問
1.6 本レポートは誰のためのものか?
1.7 方法論
1.7.1 市場の定義
1.7.2 市場評価・予測手法
1.7.3 データの検証
1.7.3.1 一次調査
1.7.3.2 セカンダリーリサーチ
1.8 よくある質問(FAQ)
1.9 Visiongainの関連レポート
1.10 Visiongainについて
2 エグゼクティブ・サマリー
3 市場概要
3.1 主要な調査結果
3.2 市場ダイナミクス
3.2.1 市場促進要因
3.2.1.1 アレルギーに対する意識の高まりと利用可能な治療オプション
3.2.1.2 呼吸器疾患の有病率の増加
3.2.1.3 効果的で新しい薬物送達システムの発売
3.2.1.4 技術的進歩
3.2.1.5 呼吸器疾患の増加と相まって増加する汚染レベル
3.2.2 市場抑制要因
3.2.2.1 アレルギー性鼻炎の治療に使用される薬剤の副作用
3.2.2.2 他の疾患との症状の類似性
3.2.3 市場機会
3.2.3.1 アレルゲン免疫療法(AIT)の進歩の増加
3.2.3.2 アレルギー性鼻炎に関する認識を促進するための好ましい政府の取り組み
3.3 COVID-19の影響分析
3.4 ポーターのファイブフォース分析
3.4.1 サプライヤーの交渉力
3.4.2 買い手の交渉力
3.4.3 競争相手のライバル関係
3.4.4 代替品による脅威
3.4.5 新規参入企業の脅威
3.5 PEST分析
4 アレルギー性鼻炎治療薬分析:治療タイプ別
4.1 主要な調査結果
4.2 治療タイプ別セグメント 市場魅力度指数
4.3 治療タイプ別アレルギー性鼻炎治療薬の市場規模推定と予測
4.4 抗ヒスタミン薬
4.4.1 2024〜2034年の地域別市場規模(US$ Million)
4.4.2 地域別市場シェア、2024年・2034年 (%)
4.5 免疫療法
4.5.1 2024〜2034年の地域別市場規模(US$ Million)
4.5.2 地域別市場シェア、2024年・2034年 (%)
4.5.2.1 皮下免疫療法(SCIT)
4.5.2.2 舌下免疫療法(SLIT)
4.6 副腎皮質ステロイド
4.6.1 2024〜2034年の地域別市場規模(US$ Million)
4.6.2 地域別市場シェア、2024年・2034年 (%)
4.7 充血除去薬
4.7.1 2024〜2034年の地域別市場規模(US$ Million)
4.7.2 地域別市場シェア、2024年・2034年 (%)
4.8 その他
4.8.1 2024〜2034年の地域別市場規模(US$ Million)
4.8.2 地域別市場シェア、2024年・2034年 (%)
5 アレルギー性鼻炎治療薬分析:疾患タイプ別
5.1 主要な調査結果
5.2 疾患タイプ別セグメント 市場魅力度指数
5.3 疾患タイプ別アレルギー性鼻炎治療薬の市場規模推定と予測
5.4 季節性アレルギー性鼻炎
5.4.1 2024〜2034年の地域別市場規模(US$ Million)
5.4.2 地域別市場シェア、2024年・2034年 (%)
5.5 通年性アレルギー性鼻炎
5.5.1 2024〜2034年の地域別市場規模(US$ Million)
5.5.2 地域別市場シェア、2024年・2034年 (%)
5.6 職業性アレルギー性鼻炎
5.6.1 2024〜2034年の地域別市場規模(US$ Million)
5.6.2 地域別市場シェア、2024年・2034年 (%)
6 アレルギー性鼻炎治療薬分析:薬剤タイプ別
6.1 主要調査結果
6.2 薬剤タイプ別セグメント 市場魅力度指数
6.3 薬剤タイプ別アレルギー性鼻炎治療薬の市場規模推定と予測
6.4 処方薬
6.4.1 2024〜2034年の地域別市場規模(US$ Million)
6.4.2 地域別市場シェア、2024年・2034年 (%)
6.5 OTC
6.5.1 2024年~2034年の地域別市場規模(US$ Million)
6.5.2 地域別市場シェア、2024年・2034年 (%)
7 アレルギー性鼻炎治療薬分析:投与経路別
7.1 主要な調査結果
7.2 投与経路セグメント 市場魅力度指数
7.3 アレルギー性鼻炎治療薬の投与経路別市場規模推定と予測
7.4 経口剤
7.4.1 2024〜2034年の地域別市場規模(US$ Million)
7.4.2 地域別市場シェア、2024年・2034年(%)
7.5 経鼻
7.5.1 2024-2034年地域別市場規模(US$ Million)
7.5.2 地域別市場シェア、2024年・2034年(%)
7.6 眼内
7.6.1 2024~2034年の地域別市場規模(US$ Million)
7.6.2 地域別市場シェア、2024年・2034年(%)
7.7 静注
7.7.1 2024~2034年の地域別市場規模(US$ Million)
7.7.2 地域別市場シェア、2024年・2034年(%)
8 アレルギー性鼻炎治療薬分析:流通チャネル別
8.1 主要調査結果
8.2 流通チャネルセグメント 市場魅力度指数
8.3 アレルギー性鼻炎治療薬の流通チャネル別市場規模推定と予測
8.4 小売薬局
8.4.1 2024〜2034年の地域別市場規模(US$ Million)
8.4.2 地域別市場シェア、2024年・2034年(%)
8.5 病院薬局
8.5.1 2024〜2034年の地域別市場規模(US$ Million)
8.5.2 地域別市場シェア、2024年・2034年(%)
8.6 オンラインチャネル
8.6.1 2024~2034年地域別市場規模(US$ Million)
8.6.2 地域別市場シェア、2024年・2034年(%)
9 アレルギー性鼻炎治療薬分析:地域別
9.1 主要な調査結果
9.2 地域別市場規模の推定と予測
10 北米のアレルギー性鼻炎治療薬分析
10.1 主要な調査結果
10.2 北米のアレルギー性鼻炎治療薬の魅力度指数
10.3 北米のアレルギー性鼻炎治療薬国別市場規模、2024年、2029年、2034年 (US$ Million)
10.4 北米のアレルギー性鼻炎治療薬市場規模推定と予測:国別
10.5 北米のアレルギー性鼻炎治療薬市場規模推定と予測:治療タイプ別
10.6 北米のアレルギー性鼻炎治療薬市場規模推定と予測:疾患タイプ別
10.7 北米のアレルギー性鼻炎治療薬市場規模推定と予測:薬剤タイプ別
10.8 北米のアレルギー性鼻炎治療薬市場規模推定と予測:投与経路別
10.9 北米のアレルギー性鼻炎治療薬市場規模推定と予測:流通経路別
10.10 米国のアレルギー性鼻炎治療薬分析
10.11 カナダのアレルギー性鼻炎治療薬分析
11 欧州のアレルギー性鼻炎治療薬分析
11.1 主要な調査結果
11.2 欧州のアレルギー性鼻炎治療薬の魅力度指数
11.3 欧州のアレルギー性鼻炎治療薬の国別市場規模、2024年、2029年、2034年(US$ Million)
11.4 欧州のアレルギー性鼻炎治療薬市場規模推定と予測:国別
11.5 欧州のアレルギー性鼻炎治療薬市場規模推定と予測:治療タイプ別
11.6 欧州のアレルギー性鼻炎治療薬市場規模推定と予測:疾患タイプ別
11.7 欧州のアレルギー性鼻炎治療薬市場規模推定と予測:薬剤タイプ別
11.8 欧州のアレルギー性鼻炎治療薬市場規模推定と予測:投与経路別
11.9 欧州のアレルギー性鼻炎治療薬市場規模推定と予測:流通経路別
11.10 ドイツのアレルギー性鼻炎治療薬分析
11.11 フランスのアレルギー性鼻炎治療薬分析
11.12 イギリスのアレルギー性鼻炎治療薬分析
11.13 イタリアのアレルギー性鼻炎治療薬分析
11.14 スペインのアレルギー性鼻炎薬分析
11.15 ロシアのアレルギー性鼻炎治療薬分析
11.16 ポーランドのアレルギー性鼻炎治療薬分析
11.17 ベルギーのアレルギー性鼻炎治療薬分析
11.18 その他の欧州のアレルギー性鼻炎薬分析
12 アジア太平洋地域のアレルギー性鼻炎治療薬分析
12.1 主要な調査結果
12.2 アジア太平洋地域のアレルギー性鼻炎治療薬の魅力度指数
12.3 アジア太平洋地域のアレルギー性鼻炎治療薬国別市場規模、2024年、2029年、2034年(US$ Million)
12.4 アジア太平洋地域のアレルギー性鼻炎治療薬市場規模推定と予測:国別
12.5 アジア太平洋地域のアレルギー性鼻炎治療薬市場規模推定と予測:治療タイプ別
12.6 アジア太平洋地域のアレルギー性鼻炎治療薬市場規模推定と予測:疾患タイプ別
12.7 アジア太平洋地域のアレルギー性鼻炎治療薬市場規模推定と予測:薬剤タイプ別
12.8 アジア太平洋地域のアレルギー性鼻炎治療薬市場規模推定と予測:投与経路別
12.9 アジア太平洋地域のアレルギー性鼻炎治療薬市場規模推定と予測:流通経路別
12.10 日本のアレルギー性鼻炎治療薬分析
12.11 中国のアレルギー性鼻炎薬分析
12.12 インドのアレルギー性鼻炎治療薬分析
12.13 オーストラリアのアレルギー性鼻炎薬分析
12.14 韓国のアレルギー性鼻炎薬の分析
12.15 シンガポールのアレルギー性鼻炎薬分析
12.16 台湾のアレルギー性鼻炎薬分析
12.17 その他のアジア太平洋地域のアレルギー性鼻炎治療薬分析
13 ラテンアメリカのアレルギー性鼻炎治療薬分析
13.1 主要な調査結果
13.2 ラテンアメリカのアレルギー性鼻炎治療薬の魅力度指数
13.3 ラテンアメリカのアレルギー性鼻炎治療薬国別市場規模、2024年、2029年、2034年(US$ Million)
13.4 ラテンアメリカのアレルギー性鼻炎治療薬市場規模推定と予測:国別
13.5 ラテンアメリカのアレルギー性鼻炎治療薬市場規模推定と予測:治療タイプ別
13.6 ラテンアメリカのアレルギー性鼻炎治療薬市場規模推定と予測:疾患タイプ別
13.7 ラテンアメリカのアレルギー性鼻炎治療薬市場規模推定と予測:薬剤タイプ別
13.8 ラテンアメリカのアレルギー性鼻炎治療薬市場規模推定と予測:投与経路別
13.9 ラテンアメリカのアレルギー性鼻炎治療薬市場規模推定と予測:流通経路別
13.10 ブラジルのアレルギー性鼻炎治療薬分析
13.11 メキシコのアレルギー性鼻炎治療薬分析
13.12 アルゼンチンのアレルギー性鼻炎治療薬分析
13.13 その他のラテンアメリカアレルギー性鼻炎治療薬分析
14 MEAのアレルギー性鼻炎治療薬分析
14.1 主要な調査結果
14.2 MEAアレルギー性鼻炎治療薬の魅力度指数
14.3 MEAアレルギー性鼻炎治療薬の国別市場規模、2024年、2029年、2034年(US$ Million)
14.4 MEAアレルギー性鼻炎治療薬市場規模推定と予測:国別
14.5 MEAアレルギー性鼻炎治療薬市場規模推定と予測:治療タイプ別
14.6 MEAアレルギー性鼻炎治療薬市場規模推定と予測:疾患タイプ別
14.7 MEAアレルギー性鼻炎治療薬市場規模推定と予測:薬剤タイプ別
14.8 MEAアレルギー性鼻炎治療薬市場規模推定と予測:投与経路別
14.9 MEAアレルギー性鼻炎治療薬市場規模推定と予測:流通経路別
14.10 GCCのアレルギー性鼻炎治療薬分析
14.11 南アフリカのアレルギー性鼻炎治療薬分析
14.12 その他のMEAアレルギー性鼻炎治療薬分析
15 会社概要
15.1 競争環境、2023年
15.2 戦略的展望
15.3 Alcon
15.3.1 会社概要
15.3.2 会社概要
15.3.3 財務分析
15.3.3.1 純収入、2017-2022年
15.3.3.2 R&D、2017-2022年
15.3.3.3 地域市場シェア、2022年
15.3.4 製品ベンチマーク
15.3.5 戦略的展望
15.4 AstraZeneca
15.4.1 会社概要
15.4.2 会社概要
15.4.3 財務分析
15.4.3.1 純収入、2017-2022年
15.4.3.2 R&D、2017-2022年
15.4.3.3 地域市場シェア、2022年
15.4.4 製品ベンチマーク
15.4.5 戦略的展望
15.5 Bayer AG
15.5.1 会社概要
15.5.2 会社概要
15.5.3 財務分析
15.5.3.1 純収入、2017-2022年
15.5.3.2 売上高、2017-2022年
15.5.3.3 地域市場シェア、2022年
15.5.4 製品ベンチマーク
15.5.5 戦略的展望
15.6 Boehringer Ingelheim International GmbH
15.6.1 会社概要
15.6.2 会社概要
15.6.3 財務分析
15.6.3.1 純収入、2017-2022年
15.6.3.2 R&D、2017年〜2022年
15.6.3.3 地域市場シェア、2022年
15.6.4 製品ベンチマーク
15.7 Dr. Reddy’s Laboratories Ltd.
15.7.1 会社概要
15.7.2 会社概要
15.7.3 財務分析
15.7.3.1 純収入、2017-2022年
15.7.3.2 R&D、2017-2022年
15.7.3.3 地域市場シェア、2022年
15.7.4 製品ベンチマーク
15.7.5 戦略的展望
15.8 GSK plc
15.8.1 会社概要
15.8.2 会社概要
15.8.3 財務分析
15.8.3.1 純収入、2017-2022年
15.8.3.2 R&D、2017-2022年
15.8.3.3 地域市場シェア、2022年
15.8.4 製品ベンチマーク
15.8.5 戦略的展望
15.9 Johnson & Johnson Services, Inc.
15.9.1 会社概要
15.9.2 会社概要
15.9.3 財務分析
15.9.3.1 純収入(2017-2022年
15.9.3.2 売上高、2017-2022年
15.9.3.3 地域市場シェア、2022年
15.9.4 製品ベンチマーク
15.9.5 戦略的展望
15.10 Merck & Co., Inc.
15.10.1 会社概要
15.10.2 会社概要
15.10.3 財務分析
15.10.3.1 純収入、2017-2022年
15.10.3.2 売上高、2017-2022年
15.10.3.3 地域市場シェア、2022年
15.10.4 製品ベンチマーク
15.10.5 戦略的展望
15.11 Sanofi
15.11.1 会社概要
15.11.2 会社概要
15.11.3 財務分析
15.11.3.1 純収入、2017-2022年
15.11.3.2 R&D、2017-2022年
15.11.3.3 地域市場シェア、2022年
15.11.4 製品ベンチマーク
15.11.5 戦略的展望
15.12 Sun Pharmaceutical Industries Ltd.
15.12.1 会社概要
15.12.2 会社概要
15.12.3 財務分析
15.12.3.1 純収入、2017-2022年
15.12.3.2 R&D、2017-2022年
15.12.3.3 地域市場シェア、2022年
15.12.4 製品ベンチマーク
15.12.5 戦略的展望
15.13 Teva Pharmaceutical Industries Ltd.
15.13.1 会社概要
15.13.2 会社概要
15.13.3 財務分析
15.13.3.1 純収入、2017-2022年
15.13.3.2 R&D、2017年〜2022年
15.13.3.3 地域市場シェア、2022年
15.13.4 製品ベンチマーク
15.13.5 戦略的展望
16 結論と提言
16.1 Visiongainからの結びの言葉
16.2 市場プレイヤーへの提言
ページTOPに戻る
図表リスト
表の一覧
Table 1 Allergic Rhinitis Drugs Snapshot, 2024 & 2034 (US$ Million, CAGR %)
Table 2 Increasing Prevalence of Respiratory Disorders
Table 3 Allergic Rhinitis Drugs Forecast by Region, 2024-2034 (US$ Million, AGR%, CAGR%): “V” Shaped Recovery
Table 4 Allergic Rhinitis Drugs Forecast by Region, 2024-2034 (US$ Million, AGR%, CAGR%): “U” Shaped Recovery
Table 5 Allergic Rhinitis Drugs Forecast by Region, 2024-2034 (US$ Million, AGR%, CAGR%): “W” Shaped Recovery
Table 6 Allergic Rhinitis Drugs Forecast by Region, 2024-2034 (US$ Million, AGR%, CAGR%): “L” Shaped Recovery
Table 7 Allergic Rhinitis Drugs Forecast by Treatment Type, 2024-2034 (US$ Million, AGR%, CAGR %)
Table 8 Antihistamines Segment Market Forecast by Region, 2024-2034 (US$ Million, AGR%, CAGR %)
Table 9 Immunotherapy Segment Market Forecast by Region, 2024-2034 (US$ Million, AGR%, CAGR %)
Table 10 Subcutaneous Immunotherapy (SCIT) Segment Market Forecast by Region, 2024-2034 (US$ Million, AGR%, CAGR %)
Table 11 Sublingual Immunotherapy (SLIT) Segment Market Forecast by Region, 2024-2034 (US$ Million, AGR%, CAGR %)
Table 12 Corticosteroids Segment Market Forecast by Region, 2024-2034 (US$ Million, AGR%, CAGR %)
Table 13 Decongestants Segment Market Forecast by Region, 2024-2034 (US$ Million, AGR%, CAGR %)
Table 14 Others Segment Market Forecast by Region, 2024-2034 (US$ Million, AGR%, CAGR %)
Table 15 Allergic Rhinitis Drugs Forecast by Disease Type, 2024-2034 (US$ Million, AGR%, CAGR %)
Table 16 Seasonal Allergic Rhinitis Segment Market Forecast by Region, 2024-2034 (US$ Million, AGR%, CAGR%)
Table 17 Perennial Allergic Rhinitis Segment Market Forecast by Region, 2024-2034 (US$ Million, AGR%, CAGR %)
Table 18 Occupational Allergic Rhinitis Segment Market Forecast by Region, 2024-2034 (US$ Million, AGR%, CAGR%)
Table 19 Allergic Rhinitis Drugs Drug Type, 2024-2034 (US$ Million, AGR%, CAGR %)
Table 20 Prescription Market Forecast by Region, 2024-2034 (US$ Million, AGR%, CAGR %)
Table 21 OTC Market Forecast by Region, 2024-2034 (US$ Million, AGR%, CAGR %)
Table 22 Allergic Rhinitis Drugs by Route of Administration 2024-2034 (US$ Million, AGR%, CAGR%)
Table 23 Oral Market Forecast by Region, 2024-2034 (US$ Million, AGR%, CAGR%)
Table 24 Nasal Market Forecast by Region, 2024-2034 (US$ Million, AGR%, CAGR %)
Table 25 Intraocular Market Forecast by Region, 2024-2034 (US$ Million, AGR%, CAGR%)
Table 26 Intravenous Market Forecast by Region, 2024-2034 (US$ Million, AGR%, CAGR%)
Table 27 Allergic Rhinitis Drugs Distribution Channel, 2024-2034 (US$ Million, AGR%, CAGR%)
Table 28 Retail Pharmacies Market Forecast by Region, 2024-2034 (US$ Million, AGR%, CAGR%)
Table 29 Hospital Pharmacies Market Forecast by Region, 2024-2034 (US$ Million, AGR%, CAGR %)
Table 30 Online Channels Market Forecast by Region, 2024-2034 (US$ Million, AGR%, CAGR%)
Table 31 Allergic Rhinitis Drugs Forecast by Region, 2024-2034 (US$ Million, AGR%, CAGR %)
Table 32 North America Allergic Rhinitis Drugs Forecast by Country, 2024-2034 (US$ Million, AGR%, CAGR %)
Table 33 North America Allergic Rhinitis Drugs Forecast by Treatment Type, 2024-2034 (US$ Million, AGR%, CAGR %)
Table 34 North America Allergic Rhinitis Drugs Forecast by Disease Type, 2024-2034 (US$ Million, AGR%, CAGR%)
Table 35 Allergic Rhinitis Drug, 2024-2034 (US$ Million, AGR%, CAGR%)
Table 36 North America Allergic Rhinitis Drugs by Route of Administration, 2024-2034 (US$ Million, AGR%, CAGR%)
Table 37 North America Allergic Rhinitis Drugs by Distribution Channel, 2024-2034 (US$ Million, AGR%, CAGR%)
Table 38 U.S. Allergic Rhinitis Drugs Forecast, 2024-2034 (US$ Million, AGR%, CAGR%)
Table 39 Canada Allergic Rhinitis Drugs Forecast, 2024-2034 (US$ Million, AGR%, CAGR %)
Table 40 Europe Allergic Rhinitis Drugs Forecast by Country, 2024-2034 (US$ Million, AGR%, CAGR%)
Table 41 Europe Allergic Rhinitis Drugs Forecast by Treatment Type, 2024-2034 (US$ Million, AGR%, CAGR %)
Table 42 North America Allergic Rhinitis Drugs Forecast by Disease Type, 2024-2034 (US$ Million, AGR%, CAGR%)
Table 43 Allergic Rhinitis Drugs by Drug Type, 2024-2034 (US$ Million, AGR%, CAGR%)
Table 44 North America Allergic Rhinitis Drugs by Route of Administration, 2024-2034 (US$ Million, AGR%, CAGR%)
Table 45 North America Allergic Rhinitis Drugs by Distribution Channel, 2024-2034 (US$ Million, AGR%, CAGR%)
Table 46 Germany Allergic Rhinitis Drugs Forecast, 2024-2034 (US$ Million, AGR%, CAGR %)
Table 47 France Allergic Rhinitis Drugs Forecast, 2024-2034 (US$ Million, AGR%, CAGR %)
Table 48 UK Allergic Rhinitis Drugs Forecast, 2024-2034 (US$ Million, AGR%, CAGR%)
Table 49 Italy Allergic Rhinitis Drugs Forecast, 2024-2034 (US$ Million, AGR%, CAGR %)
Table 50 Spain Allergic Rhinitis Drugs Forecast, 2024-2034 (US$ Million, AGR%, CAGR %)
Table 51 Russia Allergic Rhinitis Drugs Forecast, 2024-2034 (US$ Million, AGR%, CAGR%)
Table 52 Poland Allergic Rhinitis Drugs Forecast, 2024-2034 (US$ Million, AGR%, CAGR%)
Table 53 Belgium Allergic Rhinitis Drugs Forecast, 2024-2034 (US$ Million, AGR%, CAGR%)
Table 54 Rest of Europe Allergic Rhinitis Drugs Forecast, 2024-2034 (US$ Million, AGR%, CAGR%)
Table 55 Asia Pacific Allergic Rhinitis Drugs Forecast by Country, 2024-2034 (US$ Million, AGR%, CAGR%)
Table 56 Allergic Rhinitis Drugs Forecast by Treatment Type, 2024-2034 (US$ Million, AGR%, CAGR %)
Table 57 North America Allergic Rhinitis Drugs Forecast by Disease Type, 2024-2034 (US$ Million, AGR%, CAGR%)
Table 58 Allergic Rhinitis Drugs by Drug Type, 2024-2034 (US$ Million, AGR%, CAGR%)
Table 59 North America Allergic Rhinitis Drugs by Route of Administration, 2024-2034 (US$ Million, AGR%, CAGR%)
Table 60 North America Allergic Rhinitis Drugs by Distribution Channel, 2024-2034 (US$ Million, AGR%, CAGR%)
Table 61 Japan Allergic Rhinitis Drugs Forecast, 2024-2034 (US$ Million, AGR%, CAGR%)
Table 62 China Allergic Rhinitis Drugs Forecast, 2024-2034 (US$ Million, AGR%, CAGR%)
Table 63 India Allergic Rhinitis Drugs Forecast, 2024-2034 (US$ Million, AGR%, CAGR %)
Table 64 Australia Allergic Rhinitis Drugs Forecast, 2024-2034 (US$ Million, AGR%, CAGR %)
Table 65 South Korea Allergic Rhinitis Drugs Forecast, 2024-2034 (US$ Million, AGR%, CAGR%)
Table 66 Singapore Allergic Rhinitis Drugs Forecast, 2024-2034 (US$ Million, AGR%, CAGR %)
Table 67 Taiwan Allergic Rhinitis Drugs Forecast, 2024-2034 (US$ Million, AGR%, CAGR%)
Table 68 Rest of Asia Pacific Allergic Rhinitis Drugs Forecast, 2024-2034 (US$ Million, AGR%, CAGR %)
Table 69 Latin America Allergic Rhinitis Drugs Forecast by Country, 2024-2034 (US$ Million, AGR%, CAGR%)
Table 70 Allergic Rhinitis Drugs Forecast by Treatment Type, 2024-2034 (US$ Million, AGR%, CAGR %)
Table 71 North America Allergic Rhinitis Drugs Forecast by Disease Type, 2024-2034 (US$ Million, AGR%, CAGR%)
Table 72 Allergic Rhinitis Drugs by Drug Type, 2024-2034 (US$ Million, AGR%, CAGR%)
Table 73 North America Allergic Rhinitis Drugs by Route of Administration, 2024-2034 (US$ Million, AGR%, CAGR%)
Table 74 North America Allergic Rhinitis Drugs by Distribution Channel, 2024-2034 (US$ Million, AGR%, CAGR%)
Table 75 Brazil Allergic Rhinitis Drugs Forecast, 2024-2034 (US$ Million, AGR%, CAGR %)
Table 76 Mexico Allergic Rhinitis Drugs Forecast, 2024-2034 (US$ Million, AGR%, CAGR%)
Table 77 Argentina Allergic Rhinitis Drugs Forecast, 2024-2034 (US$ Million, AGR%, CAGR%)
Table 78 Rest of Latin America Allergic Rhinitis Drugs Forecast, 2024-2034 (US$ Million, AGR%, CAGR%)
Table 79 MEA Allergic Rhinitis Drugs Forecast by Country, 2024-2034 (US$ Million, AGR%, CAGR%)
Table 80 Allergic Rhinitis Drugs Forecast by Treatment Type, 2024-2034 (US$ Million, AGR%, CAGR %)
Table 81 North America Allergic Rhinitis Drugs Forecast by Disease Type, 2024-2034 (US$ Million, AGR%, CAGR%)
Table 82 Allergic Rhinitis Drugs by Drug Type, 2024-2034 (US$ Million, AGR%, CAGR%)
Table 83 North America Allergic Rhinitis Drugs by Route of Administration, 2024-2034 (US$ Million, AGR%, CAGR%)
Table 84 North America Allergic Rhinitis Drugs by Distribution Channel, 2024-2034 (US$ Million, AGR%, CAGR%)
Table 85 GCC Allergic Rhinitis Drugs Forecast, 2024-2034 (US$ Million, AGR%, CAGR%)
Table 86 South Africa Allergic Rhinitis Drugs Forecast, 2024-2034 (US$ Million, AGR%, CAGR%)
Table 87 Rest of MEA Allergic Rhinitis Drugs Forecast, 2024-2034 (US$ Million, AGR%, CAGR %)
Table 88 Strategic Outlook
Table 89 Alcon: Key Details, (CEO, HQ, Revenue, Founded, No. of Employees, Company Type, Website, Business Segment)
Table 90 Alcon: Product Benchmarking
Table 91 Alcon: Strategic Outlook
Table 92 AstraZeneca: Key Details, (CEO, HQ, Revenue, Founded, No. of Employees, Company Type, Website, Business Segment)
Table 93 AstraZeneca: Product Benchmarking
Table 94 AstraZeneca: Strategic Outlook
Table 95 Bayer AG: Key Details, (CEO, HQ, Revenue, Founded, No. of Employees, Company Type, Website, Business Segment)
Table 96 Bayer AG: Product Benchmarking
Table 97 Bayer AG: Strategic Outlook
Table 98 Boehringer Ingelheim International GmbH: Key Details, (CEO, HQ, Revenue, Founded, No. of Employees, Company Type, Website, Business Segment)
Table 99 Boehringer Ingelheim International GmbH: Product Benchmarking
Table 100 Dr. Reddy’s Laboratories Ltd: Key Details, (CEO, HQ, Revenue, Founded, No. of Employees, Company Type, Website, Business Segment)
Table 101 Dr. Reddy’s Laboratories Ltd: Product Benchmarking
Table 102 Dr. Reddy’s Laboratories Ltd: Strategic Outlook
Table 103 GSK plc: Key Details, (CEO, HQ, Revenue, Founded, No. of Employees, Company Type, Website, Business Segment)
Table 104 GSK plc: Product Benchmarking
Table 105 GSK plc: Strategic Outlook
Table 106 Johnson & Johnson Services, Inc.: Key Details, (CEO, HQ, Revenue, Founded, No. of Employees, Company Type, Website, Business Segment)
Table 107 Johnson & Johnson Services, Inc.: Product Benchmarking
Table 108 Johnson & Johnson Services, Inc.: Strategic Outlook
Table 109 Merck & Co., Inc.: Key Details, (CEO, HQ, Revenue, Founded, No. of Employees, Company Type, Website, Business Segment)
Table 110 Merck & Co., Inc.: Product Benchmarking
Table 111 Merck & Co., Inc.: Strategic Outlook
Table 112 Sanofi: Key Details, (CEO, HQ, Revenue, Founded, No. of Employees, Company Type, Website, Business Segment)
Table 113 Sanofi: Product Benchmarking
Table 114 Sanofi: Strategic Outlook
Table 115 Sun Pharmaceutical Industries Ltd.: Key Details, (CEO, HQ, Revenue, Founded, No. of Employees, Company Type, Website, Business Segment)
Table 116 Sun Pharmaceutical Industries Ltd.: Product Benchmarking
Table 117 Sun Pharmaceutical Industries Ltd.: Strategic Outlook
Table 118 Teva Pharmaceutical Industries Ltd.: Key Details, (CEO, HQ, Revenue, Founded, No. of Employees, Company Type, Website, Business Segment)
Table 119 Teva Pharmaceutical Industries Ltd.: Product Benchmarking
Table 120 Teva Pharmaceutical Industries Ltd.: Strategic Outlook
図の一覧
Figure 1 Allergic Rhinitis Drugs Segmentation
Figure 2 Allergic Rhinitis Drugs Market by Treatment Type: Market Attractiveness Index
Figure 3 Allergic Rhinitis Drugs by Disease Type: Market Attractiveness Index
Figure 4 Allergic Rhinitis Drugs by Drug Type: Market Attractiveness Index
Figure 5 Allergic Rhinitis Drugs by Route of Administration: Market Attractiveness Index
Figure 6 Allergic Rhinitis Drugs by Distribution Channel: Market Attractiveness Index
Figure 7 Allergic Rhinitis Drugs Attractiveness Index by Region
Figure 8 Allergic Rhinitis Drugs: Market Dynamics
Figure 9 Allergic Rhinitis Drugs by Region, 2024-2034 (US$ Million, AGR %): “V” Shaped Recovery
Figure 10 Allergic Rhinitis Drugs by Region, 2024-2034 (US$ Million, AGR %): “U” Shaped Recovery
Figure 11 Allergic Rhinitis Drugs by Region, 2024-2034 (US$ Million, AGR %): “W” Shaped Recovery
Figure 12 Allergic Rhinitis Drugs by Region, 2024-2034 (US$ Million, AGR %): “L” Shaped Recovery
Figure 13 Allergic Rhinitis Drugs Market: Porter’s Five Forces Analysis
Figure 14 Allergic Rhinitis Drugs: PEST Analysis
Figure 15 Allergic Rhinitis Drugs by Treatment Type: Market Attractiveness Index
Figure 16 Allergic Rhinitis Drugs Forecast by Treatment Type, 2024-2034 (US$ Million, AGR %)
Figure 17 Allergic Rhinitis Drugs Share Forecast by Treatment Type, 2024, 2029, 2034 (%)
Figure 18 Antihistamines Segment Market Forecast by Region, 2024-2034 (US$ Million, AGR %)
Figure 19 Antihistamines Segment Market Share Forecast by Region, 2024 & 2034 (%)
Figure 20 Immunotherapy Segment Market Forecast by Region, 2024-2034 (US$ Million, AGR %)
Figure 21 Immunotherapy Segment Market Share Forecast by Region, 2024 & 2034 (%)
Figure 22 Subcutaneous Immunotherapy (SCIT) Segment Market Forecast by Region, 2024-2034 (US$ Million, AGR %)
Figure 23 Subcutaneous Immunotherapy (SCIT) Segment Market Share Forecast by Region, 2024 & 2034 (%)
Figure 24 Sublingual Immunotherapy (SLIT) Segment Market Forecast by Region, 2024-2034 (US$ Million, AGR %)
Figure 25 Sublingual Immunotherapy (SLIT) Segment Market Share Forecast by Region, 2024 & 2034 (%)
Figure 26 Corticosteroids Segment Market Forecast by Region, 2024-2034 (US$ Million, AGR %)
Figure 27 Corticosteroids Segment Market Share Forecast by Region, 2024 & 2034 (%)
Figure 28 Decongestants Segment Market Forecast by Region, 2024-2034 (US$ Million, AGR %)
Figure 29 Decongestants Segment Market Share Forecast by Region, 2024 & 2034 (%)
Figure 30 Others Segment Market Forecast by Region, 2024-2034 (US$ Million, AGR %)
Figure 31 Others Segment Market Share Forecast by Region, 2024 & 2034 (%)
Figure 32 Allergic Rhinitis Drugs by Disease Type: Market Attractiveness Index
Figure 33 Allergic Rhinitis Drugs Forecast by Disease Type, 2024-2034 (US$ Million, AGR %)
Figure 34 Allergic Rhinitis Drugs Share Forecast by Disease Type, 2024, 2029, 2034 (%)
Figure 35 Seasonal Allergic Rhinitis Segment Market Forecast by Region, 2024-2034 (US$ Million, AGR %)
Figure 36 Seasonal Allergic Rhinitis Segment Market Share Forecast by Region, 2024 & 2034 (%)
Figure 37 Perennial Allergic Rhinitis Segment Market Forecast by Region, 2024-2034 (US$ Million, AGR %)
Figure 38 Perennial Allergic Rhinitis Segment Market Share Forecast by Region, 2024 & 2034 (%)
Figure 39 Occupational Allergic Rhinitis Segment Market Forecast by Region, 2024-2034 (US$ Million, AGR %)
Figure 40 Occupational Allergic Rhinitis Segment Market Share Forecast by Region, 2024 & 2034 (%)
Figure 41 Allergic Rhinitis Drugs by Drug Type: Market Attractiveness Index
Figure 42 Allergic Rhinitis Drugs Forecast by Drug Type, 2024-2034 (US$ Million, AGR %)
Figure 43 Allergic Rhinitis Drugs Share Forecast by Drug Type, 2024, 2029, 2034 (%)
Figure 44 Prescription Segment Market Forecast by Region, 2024-2034 (US$ Million, AGR %)
Figure 45 Prescription Segment Market Share Forecast by Region, 2024 & 2034 (%)
Figure 46 OTC Market Forecast by Region, 2024-2034 (US$ Million, AGR %)
Figure 47 OTC Market Share Forecast by Region, 2024 & 2034 (%)
Figure 48 Allergic Rhinitis Drugs by Route of Administration: Market Attractiveness Index
Figure 49 Allergic Rhinitis Drugs Forecast by Route of Admistration 2024-2034 (US$ Million, AGR %)
Figure 50 Allergic Rhinitis Drugs Market Share Forecast by Route of Administration, 2024, 2029, 2034 (%)
Figure 51 Oral Market Forecast by Region, 2024-2034 (US$ Million, AGR %)
Figure 52 Oral Market Share Forecast by Region, 2024 & 2034 (%)
Figure 53 Nasal Market Forecast by Region, 2024-2034 (US$ Million, AGR %)
Figure 54 Nasal Market Share Forecast by Region, 2024 & 2034 (%)
Figure 55 Intraocular Market Forecast by Region, 2024-2034 (US$ Million, AGR %)
Figure 56 Intraocular Market Share Forecast by Region, 2024 & 2034 (%)
Figure 57 Intravenous Market Forecast by Region, 2024-2034 (US$ Million, AGR %)
Figure 58 Intravenous Segment Market Share Forecast by Region, 2024 & 2034 (%)
Figure 59 Allergic Rhinitis Drugs by Distribution Channel: Market Attractiveness Index
Figure 60 Allergic Rhinitis Drugs Forecast by Distribution Channel, 2024-2034 (US$ Million, AGR %)
Figure 61 Allergic Rhinitis Drugs Market Share Forecast by Distribution Channel, 2024, 2029, 2034 (%)
Figure 62 Retail Pharmacies Segment Market Forecast by Region, 2024-2034 (US$ Million, AGR %)
Figure 63 Retail Pharmacies Segment Market Share Forecast by Region, 2024 & 2034 (%)
Figure 64 Hospital Pharmacies Market Forecast by Region, 2024-2034 (US$ Million, AGR %)
Figure 65 Retail Pharmacies Market Share Forecast by Region, 2024 & 2034 (%)
Figure 66 Online Channels Segment Market Forecast by Region, 2024-2034 (US$ Million, AGR %)
Figure 67 Online Channels Segment Market Share Forecast by Region, 2024 & 2034 (%)
Figure 68 Allergic Rhinitis Drugs Forecast by Region 2023 and 2033 (Revenue, CAGR %)
Figure 69 Allergic Rhinitis Drugs Market Share Forecast by Region 2024, 2029, 2034 (%)
Figure 70 Allergic Rhinitis Drugs by Region, 2024-2034 (US$ Million, AGR %)
Figure 71 North America Allergic Rhinitis Drugs Attractiveness Index
Figure 72 North America Allergic Rhinitis Drugs by Region, 2024, 2029 & 2034 (US$ Million)
Figure 73 North America Allergic Rhinitis Drugs Forecast by Country, 2024-2034 (US$ Million, AGR %)
Figure 74 North America Allergic Rhinitis Drugs Share Forecast by Country, 2024 & 2034 (%)
Figure 75 North America Allergic Rhinitis Drugs Forecast by Treatment Type, 2024-2034 (US$ Million, AGR %)
Figure 76 North America Allergic Rhinitis Drugs Share Forecast by Treatment Type, 2024 & 2034 (%)
Figure 77 North America Allergic Rhinitis Drugs Forecast by Disease Type, 2024-2034 (US$ Million, AGR %)
Figure 78 North America Allergic Rhinitis Drugs Share Forecast by Disease Type, 2024 & 2034 (%)
Figure 79 North America Allergic Rhinitis Drugs Forecast by Drug, 2024-2034 (US$ Million, AGR %)
Figure 80 North America Allergic Rhinitis Drugs Share Forecast by Drug, 2024 & 2034 (%)
Figure 81 North America Allergic Rhinitis Drugs Forecast by Route of Administration, 2024-2034 (US$ Million, AGR %)
Figure 82 North America Allergic Rhinitis Drugs Share Forecast by Route of Administration, 2024 & 2034 (%)
Figure 83 North America Allergic Rhinitis Drugs Forecast by Distribution Channel, 2024-2034 (US$ Million, AGR %)
Figure 84 North America Allergic Rhinitis Drugs Share Forecast by Distribution Channel, 2024 & 2034 (%)
Figure 85 U.S. Allergic Rhinitis Drugs Forecast, 2024-2034 (US$ Million, AGR %)
Figure 86 Canada Allergic Rhinitis Drugs Forecast, 2024-2034 (US$ Million, AGR %)
Figure 87 Europe Allergic Rhinitis Drugs Attractiveness Index
Figure 88 Europe Allergic Rhinitis Drugs by Region, 2024, 2029 & 2034 (US$ Million)
Figure 89 Europe Allergic Rhinitis Drugs Forecast by Country, 2024-2034 (US$ Million, AGR %)
Figure 90 Europe Allergic Rhinitis Drugs Share Forecast by Country, 2024 & 2034 (%)
Figure 91 Europe Allergic Rhinitis Drugs Forecast by Treatment Type, 2024-2034 (US$ Million, AGR %)
Figure 92 Europe Allergic Rhinitis Drugs Share Forecast by Treatment Type, 2024 & 2034 (%)
Figure 93 Europe Allergic Rhinitis Drugs Forecast by Disease Type, 2024-2034 (US$ Million, AGR %)
Figure 94 Europe Allergic Rhinitis Drugs Share Forecast by Disease Type, 2024 & 2034 (%)
Figure 95 Europe Allergic Rhinitis Drugs Forecast by Drug Type, 2024-2034 (US$ Million, AGR %)
Figure 96 Europe Allergic Rhinitis Drugs Share Forecast by Drug Type, 2024 & 2034 (%)
Figure 97 Europe Allergic Rhinitis Drugs Forecast by Route of Administration, 2024-2034 (US$ Million, AGR %)
Figure 98 Europe Allergic Rhinitis Drugs Share Forecast by Route of Administration, 2024 & 2034 (%)
Figure 99 Europe Allergic Rhinitis Drugs Forecast by Distribution Channel, 2024-2034 (US$ Million, AGR %)
Figure 100 Europe Allergic Rhinitis Drugs Share Forecast by Distribution Channel, 2024 & 2034 (%)
Figure 101 Germany Allergic Rhinitis Drugs Forecast, 2024-2034 (US$ Million, AGR %)
Figure 102 France Allergic Rhinitis Drugs Forecast, 2024-2034 (US$ Million, AGR %)
Figure 103 UK Allergic Rhinitis Drugs Forecast, 2024-2034 (US$ Million, AGR %)
Figure 104 Italy Allergic Rhinitis Drugs Forecast, 2024-2034 (US$ Million, AGR %)
Figure 105 Spain Allergic Rhinitis Drugs Forecast, 2024-2034 (US$ Million, AGR %)
Figure 106 Russia Allergic Rhinitis Drugs Forecast, 2024-2034 (US$ Million, AGR %)
Figure 107 Poland Allergic Rhinitis Drugs Forecast, 2024-2034 (US$ Million, AGR %)
Figure 108 Belgium Allergic Rhinitis Drugs Forecast, 2024-2034 (US$ Million, AGR %)
Figure 109 Rest of Europe Allergic Rhinitis Drugs Forecast, 2024-2034 (US$ Million, AGR %)
Figure 110 Asia Pacific Allergic Rhinitis Drugs Attractiveness Index
Figure 111 Asia Pacific Allergic Rhinitis Drugs by Region, 2024, 2029 & 2034 (US$ Million)
Figure 112 Asia Pacific Allergic Rhinitis Drugs Forecast by Country, 2024-2034 (US$ Million, AGR %)
Figure 113 Asia Pacific Allergic Rhinitis Drugs Share Forecast by Country, 2024 & 2034 (%)
Figure 114 Asia Pacific Allergic Rhinitis Drugs Forecast by Treatment Type, 2024-2034 (US$ Million, AGR %)
Figure 115 Asia Pacific Allergic Rhinitis Drugs Share Forecast by Treatment Type, 2024 & 2034 (%)
Figure 116 Asia Pacific Allergic Rhinitis Drugs Forecast by Disease Type, 2024-2034 (US$ Million, AGR %)
Figure 117 Asia Pacific Allergic Rhinitis Drugs Share Forecast by Disease Type, 2024 & 2034 (%)
Figure 118 Asia Pacific Allergic Rhinitis Drugs Forecast by Drug Type, 2024-2034 (US$ Million, AGR %)
Figure 119 Asia Pacific Allergic Rhinitis Drugs Share Forecast by Drug Type, 2024 & 2034 (%)
Figure 120 Asia Pacific Allergic Rhinitis Drugs Forecast by Route of Administration, 2024-2034 (US$ Million, AGR %)
Figure 121 Asia Pacific Allergic Rhinitis Drugs Share Forecast by Route of Administration, 2024 & 2034 (%)
Figure 122 Asia Pacific Allergic Rhinitis Drugs Forecast by Distribution Channel, 2024-2034 (US$ Million, AGR %)
Figure 123 Asia Pacific Allergic Rhinitis Drugs Share Forecast by Distribution Channel, 2024 & 2034 (%)
Figure 124 Japan Allergic Rhinitis Drugs Forecast, 2024-2034 (US$ Million, AGR %)
Figure 125 China Allergic Rhinitis Drugs Forecast, 2024-2034 (US$ Million, AGR %)
Figure 126 India Allergic Rhinitis Drugs Forecast, 2024-2034 (US$ Million, AGR %)
Figure 127 Australia Allergic Rhinitis Drugs Forecast, 2024-2034 (US$ Million, AGR %)
Figure 128 South Korea Allergic Rhinitis Drugs Forecast, 2024-2034 (US$ Million, AGR %)
Figure 129 Singapore Allergic Rhinitis Drugs Forecast, 2024-2034 (US$ Million, AGR %)
Figure 130 Taiwan Allergic Rhinitis Drugs Forecast, 2024-2034 (US$ Million, AGR %)
Figure 131 Rest of Asia Pacific Allergic Rhinitis Drugs Forecast, 2024-2034 (US$ Million, AGR %)
Figure 132 Latin America Allergic Rhinitis Drugs Attractiveness Index
Figure 133 Latin America Allergic Rhinitis Drugs by Region, 2024, 2029 & 2034 (US$ Million)
Figure 134 Latin America Allergic Rhinitis Drugs Forecast by Country, 2024-2034 (US$ Million, AGR %)
Figure 135 Latin America Allergic Rhinitis Drugs Share Forecast by Country, 2024 & 2034 (%)
Figure 136 Latin America Allergic Rhinitis Drugs Forecast by Treatment Type, 2024-2034 (US$ Million, AGR %)
Figure 137 Latin America Allergic Rhinitis Drugs Share Forecast by Treatment Type, 2024 & 2034 (%)
Figure 138 Latin America Allergic Rhinitis Drugs Forecast by Disease Type, 2024-2034 (US$ Million, AGR %)
Figure 139 Latin America Allergic Rhinitis Drugs Share Forecast by Disease Type, 2024 & 2034 (%)
Figure 140 Latin America Allergic Rhinitis Drugs Forecast by Drug Type, 2024-2034 (US$ Million, AGR %)
Figure 141 Latin America Allergic Rhinitis Drugs Share Forecast by Drug Type, 2024 & 2034 (%)
Figure 142 Latin America Allergic Rhinitis Drugs Forecast by Route of Administration, 2024-2034 (US$ Million, AGR %)
Figure 143 Latin America Allergic Rhinitis Drugs Share Forecast by Route of Administration, 2024 & 2034 (%)
Figure 144 Latin America Allergic Rhinitis Drugs Forecast by Distribution Channel, 2024-2034 (US$ Million, AGR %)
Figure 145 Latin America Allergic Rhinitis Drugs Share Forecast by Distribution Channel, 2024 & 2034 (%)
Figure 146 Brazil Allergic Rhinitis Drugs Forecast, 2024-2034 (US$ Million, AGR %)
Figure 147 Mexico Allergic Rhinitis Drugs Forecast, 2024-2034 (US$ Million, AGR %)
Figure 148 Argentina Allergic Rhinitis Drugs Forecast, 2024-2034 (US$ Million, AGR %)
Figure 149 Rest of Latin America Allergic Rhinitis Drugs Forecast, 2024-2034 (US$ Million, AGR %)
Figure 150 MEA Allergic Rhinitis Drugs Attractiveness Index
Figure 151 MEA Allergic Rhinitis Drugs by Region, 2024, 2029 & 2034 (US$ Million)
Figure 152 MEA Allergic Rhinitis Drugs Forecast by Country, 2024-2034 (US$ Million, AGR %)
Figure 153 MEA Allergic Rhinitis Drugs Share Forecast by Country, 2024 & 2034 (%)
Figure 154 MEA Allergic Rhinitis Drugs Forecast by Treatment Type, 2024-2034 (US$ Million, AGR %)
Figure 155 MEA Allergic Rhinitis Drugs Share Forecast by Treatment Type, 2024 & 2034 (%)
Figure 156 MEA Allergic Rhinitis Drugs Forecast by Disease Type, 2024-2034 (US$ Million, AGR %)
Figure 157 MEA Allergic Rhinitis Drugs Share Forecast by Disease Type, 2024 & 2034 (%)
Figure 158 MEA Allergic Rhinitis Drugs Forecast by Drug Type, 2024-2034 (US$ Million, AGR %)
Figure 159 MEA Allergic Rhinitis Drugs Share Forecast by Drug Type, 2024 & 2034 (%)
Figure 160 MEA Allergic Rhinitis Drugs Forecast by Route of Administration, 2024-2034 (US$ Million, AGR %)
Figure 161 MEA Allergic Rhinitis Drugs Share Forecast by Route of Administration, 2024 & 2034 (%)
Figure 162 MEA Allergic Rhinitis Drugs Forecast by Distribution Channel, 2024-2034 (US$ Million, AGR %)
Figure 163 MEA Allergic Rhinitis Drugs Share Forecast by Distribution Channel, 2024 & 2034 (%)
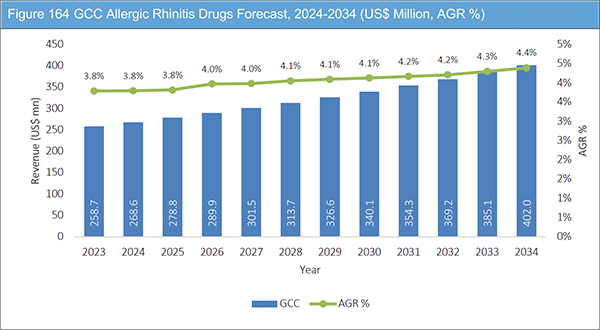
Figure 164 GCC Allergic Rhinitis Drugs Forecast, 2024-2034 (US$ Million, AGR %)
Figure 165 South Africa Allergic Rhinitis Drugs Forecast, 2024-2034 (US$ Million, AGR %)
Figure 166 Rest of MEA Allergic Rhinitis Drugs Forecast, 2024-2034 (US$ Million, AGR %)
Figure 167 Allergic Rhinitis Drugs Market: Company Share, 2023
Figure 168 Alcon: Net Revenue, 2017-2022 (US$ Million, AGR %)
Figure 169 Alcon: R&D, 2017-2022 (US$ Million, AGR%)
Figure 170 Alcon: Regional Market Shares, 2022
Figure 171 AstraZeneca: Net Revenue, 2017-2022 (US$ Million, AGR %)
Figure 172 AstraZeneca: R&D, 2017-2022 (US$ Million, AGR%)
Figure 173 AstraZeneca: Regional Market Shares, 2022
Figure 174 Bayer AG: Net Revenue, 2017-2022 (US$ Million, AGR %)
Figure 175 Bayer AG: R&D, 2017-2022 (US$ Million, AGR%)
Figure 176 Bayer AG: Regional Market Shares, 2022
Figure 177 Boehringer Ingelheim International GmbH: Net Revenue, 2017-2022 (US$ Million, AGR %)
Figure 178 Boehringer Ingelheim International GmbH: R&D, 2017-2022 (US$ Million, AGR%)
Figure 179 Boehringer Ingelheim International GmbH: Regional Market Shares, 2022
Figure 180 Dr. Reddy’s Laboratories Ltd: Net Revenue, 2017-2022 (US$ Million, AGR%)
Figure 181 Dr. Reddy’s Laboratories Ltd: R&D, 2017-2022 (US$ Million, AGR%)
Figure 182 Dr. Reddy’s Laboratories Ltd: Regional Market Shares, 2022
Figure 183 GSK plc: Net Revenue, 2017-2022 (US$ Million, AGR%)
Figure 184 GSK plc: R&D, 2017-2022 (US$ Million, AGR%)
Figure 185 GSK plc: Regional Market Shares, 2022
Figure 186 Johnson & Johnson Services, Inc.: Net Revenue, 2017-2022 (US$ Million, AGR%)
Figure 187 Johnson & Johnson Services, Inc.: R&D, 2017-2022 (US$ Million, AGR%)
Figure 188 Johnson & Johnson Services, Inc.: Regional Market Shares, 2022
Figure 189 Merck & Co., Inc.: Net Revenue, 2017-2022 (US$ Million, AGR %)
Figure 190 Merck & Co., Inc.: R&D, 2017-2022 (US$ Million, AGR %)
Figure 191 Merck & Co., Inc.: Regional Market Shares, 2022
Figure 192 Sanofi: Net Revenue, 2017-2022 (US$ Million, AGR%)
Figure 193 Sanofi: R&D, 2017-2022 (US$ Million, AGR%)
Figure 194 Sanofi: Regional Market Shares, 2022
Figure 195 Sun Pharmaceutical Industries Ltd.: Net Revenue, 2017-2022 (US$ Million, AGR %)
Figure 196 Sun Pharmaceutical Industries Ltd.: R&D, 2017-2022 (US$ Million, AGR%)
Figure 197 Sun Pharmaceutical Industries Ltd.: Regional Market Shares, 2022
Figure 198 Teva Pharmaceutical Industries Ltd.: Net Revenue, 2017-2022 (US$ Million, AGR %)
Figure 199 Teva Pharmaceutical Industries Ltd.: R&D, 2017-2022 (US$ Million, AGR%)
Figure 200 Teva Pharmaceutical Industries Ltd.: Regional Market Shares, 2022
ページTOPに戻る
Summary
Report Details
The Allergic Rhinitis Drugs Market Report 2024-2034: This report will prove invaluable to leading firms striving for new revenue pockets if they wish to better understand the industry and its underlying dynamics. It will be useful for companies that would like to expand into different industries or to expand their existing operations in a new region.
Increasing Prevalence of Allergic Rhinitis
Allergic rhinitis, often referred to as hay fever, is an increasing global issue that impacts millions of individuals, significantly influencing their overall quality of life. The increasing prevalence of allergic rhinitis has not only led to a surge in healthcare costs but has also emerged as a significant market driver.
There has been a notable increase in the pharmaceutical industry’s demand for medications aimed at relieving symptoms associated with allergic rhinitis. Antihistamines, decongestants, corticosteroids, and allergy immunotherapy are among the widely prescribed drugs, contributing to a booming market for allergy medications. Nasal sprays and other medical devices designed to provide relief from allergic rhinitis symptoms have gained popularity. These devices provide a non-pharmacological method for symptom management, creating an expanding market for cutting-edge technologies.
The increasing prevalence of allergic rhinitis has led to a higher demand for healthcare services, including allergy testing and immunotherapy. Allergists, immunologists, and ENT specialists are witnessing an uptick in patient visits, driving growth in these medical fields. The rise of telemedicine has provided a convenient platform for allergic rhinitis patients to consult healthcare professionals remotely. This trend has not only improved access to care but has also contributed to the expansion of virtual healthcare services.
Growing Awareness and Diagnosis Driving Allergic Rhinitis Drugs Market
As information becomes more accessible, patients are increasingly becoming proactive advocates for their health. The internet, social media, and healthcare apps play a pivotal role in disseminating knowledge about various health conditions, symptoms, and preventive measures. This empowerment has led to a more informed patient population, actively participating in their healthcare decisions. Growing awareness has shifted the focus from reactive to proactive healthcare. Individuals are now more inclined towards preventive measures, including regular health check-ups, screenings, and lifestyle modifications. This shift has not only reduced the burden on healthcare systems but has also created new market opportunities for preventive healthcare services and products. The health and wellness industry is booming as people increasingly prioritize a holistic approach to well-being. From fitness trackers and nutrition apps to wellness retreats and personalized health plans, the market is witnessing unprecedented growth.
Individuals are prepared to invest in products and services that enhance their overall well-being and quality of life. The swift progress of diagnostic technologies has transformed the precision and efficiency of disease identification.
From genetic testing to advanced imaging techniques, these technologies enable early detection and personalized treatment plans, driving demand for diagnostic services and equipment.
The increasing comprehension of the genetic and molecular dimensions of diseases has opened the door to precision medicine. Customizing treatments based on individual genetic profiles enables more efficient and targeted interventions. This shift in paradigm is shaping pharmaceutical development, emphasizing personalized therapies. Greater awareness has resulted in a rise in the demand for regular screenings and early detection programs.
What Questions Should You Ask before Buying a Market Research Report?
-
How is the Allergic Rhinitis Drugs Market evolving?
-
What is driving and restraining the Allergic Rhinitis Drugs Market?
-
How will each Allergic Rhinitis Drugs submarket segment grow over the forecast period and how much revenue will these submarkets account for in 2034?
-
How will the market shares for each Allergic Rhinitis Drugs submarket develop from 2024 to 2034?
-
What will be the main driver for the overall market from 2024 to 2034?
-
Will leading Allergic Rhinitis Drugs Markets broadly follow the macroeconomic dynamics, or will individual national markets outperform others?
-
How will the market shares of the national markets change by 2034 and which geographical region will lead the market in 2034?
-
Who are the leading players and what are their prospects over the forecast period?
-
What are the Allergic Rhinitis Drugs projects for these leading companies?
-
How will the industry evolve during the period between 2024 and 2034? What are the implications of Allergic Rhinitis
-
Drugs projects taking place now and over the next 10 years?
-
Is there a greater need for product commercialisation to further scale the Allergic Rhinitis Drugs Market?
-
Where is the Allergic Rhinitis Drugs Market heading and how can you ensure you are at the forefront of the market?
-
What are the best investment options for new product and service lines?
-
What are the key prospects for moving companies into a new growth path and C-suite?
You need to discover how this will impact the Allergic Rhinitis Drugs Market today, and over the next 10 years:
-
Our 322-page report provides 120 tables and 200 charts/graphs exclusively to you.
-
The report highlights key lucrative areas in the industry so you can target them – NOW.
-
It contains in-depth analysis of global, regional and national sales and growth.
-
It highlights for you the key successful trends, changes and revenue projections made by your competitors.
This report tells you TODAY how the Allergic Rhinitis Drugs Market will develop in the next 10 years, and in line with the variations in COVID-19 economic recession and bounce. This market is more critical now than at any point over the last 10 years.
Forecasts to 2034 and other analyses reveal commercial prospects
-
In addition to revenue forecasting to 2034, our new study provides you with recent results, growth rates, and market shares.
-
You will find original analyses, with business outlooks and developments.
-
Discover qualitative analyses (including market dynamics, drivers, opportunities, restraints and challenges) and recent developments.
This report includes data analysis and invaluable insight into how COVID-19 will affect the industry and your company. Four COVID-19 recovery patterns and their impact, namely, “V”, “L”, “W” and “U” are discussed in this report.
Segments Covered in the Report
By Treatment Type
-
Antihistamines
-
Immunotherapy: Subcutaneous Immunotherapy (SCIT), Sublingual Immunotherapy (SLIT)
-
Corticosteroids
-
Decongestants
-
Others
By Disease Type
-
Seasonal Allergic Rhinitis
-
Perennial Allergic Rhinitis
-
Occupational Allergic Rhinitis
By Drug
By Route of Administration
-
Oral
-
Nasal
-
Intraocular
-
Intravenous
By Distribution channel
-
Hospital Pharmacies
-
Retail Pharmacies
-
Online channels
In addition to the revenue predictions for the overall world market and segments, you will also find revenue forecasts for five regional and 26 leading national markets:
North America
Europe
-
Germany
-
UK
-
France
-
Spain
-
Italy
-
Russia
-
Poland
-
Belgium
-
Rest of Europe
Asia Pacific
-
China
-
Japan
-
India
-
Australia
-
South Korea
-
Singapore
-
Taiwan
-
Rest of Asia Pacific
Latin America
-
Brazil
-
Mexico
-
Argentina
-
Rest of Latin America
MEA
-
GCC
-
South Africa
-
Rest of MEA
The report also includes profiles and for some of the leading companies in the Allergic Rhinitis Drugs Market 2024 to 2034, with a focus on this segment of these companies’ operations.
Leading companies profiled in the report
-
Alcon
-
AstraZeneca
-
Bayer AG
-
Boehringer Ingelheim International GmbH
-
Dr. Reddy’s Laboratories Ltd.
-
GSK plc
-
Johnson & Johnson Services, Inc.
-
Merck & Co., Inc.
-
Sanofi
-
Sun Pharmaceutical Industries Ltd.
-
Teva Pharmaceutical Industries Ltd.
Overall world revenue for Allergic Rhinitis Drugs Market, 2024 to 2034 in terms of value the market will surpass US$16,800.0 million in 2024, our work calculates. We predict strong revenue growth through to 2034. Our work identifies which organizations hold the greatest potential. Discover their capabilities, progress, and commercial prospects, helping you stay ahead.
How will the Allergic Rhinitis Drugs Market 2024 to 2034 report help you?
In summary, our 320+ page report provides you with the following knowledge:
-
Revenue forecasts to 2034 for Allergic Rhinitis Drugs Market 2024 to 2034 Market, with forecasts for product and application each forecast at a global and regional level – discover the industry’s prospects, finding the most lucrative places for investments and revenues.
-
Revenue forecasts to 2034 for five regional and 26 key national markets – See forecasts for the Allergic Rhinitis Drugs Market, 2024 to 2034 in North America, Europe, Asia-Pacific, Latin America, and MEA. Also forecasted is the market in the US, Canada, Mexico, Brazil, Germany, France, UK, Italy, China, India, Japan, and Australia among other prominent economies.
-
Prospects for established firms and those seeking to enter the market – including company profiles for 11 of the major companies involved in the Allergic Rhinitis Drugs Market, 2024 to 2034.
Find quantitative and qualitative analyses with independent predictions. Receive information that only our report contains, staying informed with invaluable business intelligence.
Information found nowhere else
With our new report, you are less likely to fall behind in knowledge or miss out on opportunities. See how our work could benefit your research, analyses, and decisions. Visiongain’s study is for everybody needing commercial analyses for the Allergic Rhinitis Drugs Market 2024 to 2034, market-leading companies. You will find data, trends and predictions.
ページTOPに戻る
Table of Contents
Table of Contents
1 Report Overview
1.1 Objectives of the Study
1.2 Introduction to Allergic Rhinitis Drugs
1.3 What This Report Delivers
1.4 Why You Should Read This Report
1.5 Key Questions Answered by This Analytical Report
1.6 Who is This Report for?
1.7 Methodology
1.7.1 Market Definitions
1.7.2 Market Evaluation & Forecasting Methodology
1.7.3 Data Validation
1.7.3.1 Primary Research
1.7.3.2 Secondary Research
1.8 Frequently Asked Questions (FAQs)
1.9 Associated Visiongain Reports
1.10 About Visiongain
2 Executive Summary
3 Market Overview
3.1 Key Findings
3.2 Market Dynamics
3.2.1 Market Driving Factors
3.2.1.1 Growing Awareness About Allergies and Available Treatment Options
3.2.1.2 Increasing Prevalence of Respiratory Disorders
3.2.1.3 Launch of Effective and Novel Drug Delivery Systems
3.2.1.4 Technological Advancements
3.2.1.5 Growing Pollution Levels Coupled with Rise in Respiratory Disorders
3.2.2 Market Restraining Factors
3.2.2.1 Adverse Effects of Drugs Used in Treatment of Allergic Rhinitis
3.2.2.2 Similarity of Symptoms with Other Diseases
3.2.3 Market Opportunities
3.2.3.1 Increasing Advancements in Allergen Immunotherapy (AIT)
3.2.3.2 Favourable Government Initiatives to Promote Awareness Regarding Allergic Rhinitis
3.3 COVID-19 Impact Analysis
3.4 Porter’s Five Forces Analysis
3.4.1 Bargaining Power of Suppliers
3.4.2 Bargaining Power of Buyers
3.4.3 Competitive Rivalry
3.4.4 Threat from Substitutes
3.4.5 Threat of New Entrants
3.5 PEST Analysis
4 Allergic Rhinitis Drugs Analysis by Treatment Type
4.1 Key Findings
4.2 Treatment Type Segment: Market Attractiveness Index
4.3 Allergic Rhinitis Drugs Size Estimation and Forecast by Treatment Type
4.4 Antihistamines
4.4.1 Market Size by Region, 2024-2034 (US$ Million)
4.4.2 Market Share by Region, 2024 & 2034 (%)
4.5 Immunotherapy
4.5.1 Market Size by Region, 2024-2034 (US$ Million)
4.5.2 Market Share by Region, 2024 & 2034 (%)
4.5.2.1 Subcutaneous Immunotherapy (SCIT)
4.5.2.2 Sublingual Immunotherapy (SLIT)
4.6 Corticosteroids
4.6.1 Market Size by Region, 2024-2034 (US$ Million)
4.6.2 Market Share by Region, 2024 & 2034 (%)
4.7 Decongestants
4.7.1 Market Size by Region, 2024-2034 (US$ Million)
4.7.2 Market Share by Region, 2024 & 2034 (%)
4.8 Others
4.8.1 Market Size by Region, 2024-2034 (US$ Million)
4.8.2 Market Share by Region, 2024 & 2034 (%)
5 Allergic Rhinitis Drugs Analysis by Disease Type
5.1 Key Findings
5.2 Disease Type Segment: Market Attractiveness Index
5.3 Allergic Rhinitis Drugs Size Estimation and Forecast by Disease Type
5.4 Seasonal Allergic Rhinitis
5.4.1 Market Size by Region, 2024-2034 (US$ Million)
5.4.2 Market Share by Region, 2024 & 2034 (%)
5.5 Perennial Allergic Rhinitis
5.5.1 Market Size by Region, 2024-2034 (US$ Million)
5.5.2 Market Share by Region, 2024 & 2034 (%)
5.6 Occupational Allergic Rhinitis
5.6.1 Market Size by Region, 2024-2034 (US$ Million)
5.6.2 Market Share by Region, 2024 & 2034 (%)
6 Allergic Rhinitis Drugs Analysis by Drug Type
6.1 Key Findings
6.2 Drug Type Segment: Market Attractiveness Index
6.3 Allergic Rhinitis Drugs Size Estimation and Forecast by Drug Type
6.4 Prescription
6.4.1 Market Size by Region, 2024-2034 (US$ Million)
6.4.2 Market Share by Region, 2024 & 2034 (%)
6.5 OTC
6.5.1 Market Size by Region, 2024-2034 (US$ Million)
6.5.2 Market Share by Region, 2024 & 2034 (%)
7 Allergic Rhinitis Drugs Analysis by Route of Administration
7.1 Key Findings
7.2 Route of Administration Segment: Market Attractiveness Index
7.3 Allergic Rhinitis Drugs Size Estimation and Forecast by Route of Administration
7.4 Oral
7.4.1 Market Size by Region, 2024-2034 (US$ Million)
7.4.2 Market Share by Region, 2024 & 2034 (%)
7.5 Nasal
7.5.1 Market Size by Region, 2024-2034 (US$ Million)
7.5.2 Market Share by Region, 2024 & 2034 (%)
7.6 Intraocular
7.6.1 Market Size by Region, 2024-2034 (US$ Million)
7.6.2 Market Share by Region, 2024 & 2034 (%)
7.7 Intravenous
7.7.1 Market Size by Region, 2024-2034 (US$ Million)
7.7.2 Market Share by Region, 2024 & 2034 (%)
8 Allergic Rhinitis Drugs Analysis by Distribution Channel
8.1 Key Findings
8.2 Distribution Channel Segment: Market Attractiveness Index
8.3 Allergic Rhinitis Drugs Size Estimation and Forecast by Distribution Channel
8.4 Retail Pharmacies
8.4.1 Market Size by Region, 2024-2034 (US$ Million)
8.4.2 Market Share by Region, 2024 & 2034 (%)
8.5 Hospital Pharmacies
8.5.1 Market Size by Region, 2024-2034 (US$ Million)
8.5.2 Market Share by Region, 2024 & 2034 (%)
8.6 Online Channels
8.6.1 Market Size by Region, 2024-2034 (US$ Million)
8.6.2 Market Share by Region, 2024 & 2034 (%)
9 Allergic Rhinitis Drugs Analysis by Region
9.1 Key Findings
9.2 Regional Market Size Estimation and Forecast
10 North America Allergic Rhinitis Drugs Analysis
10.1 Key Findings
10.2 North America Allergic Rhinitis Drugs Attractiveness Index
10.3 North America Allergic Rhinitis Drugs by Country, 2024, 2029 & 2034 (US$ Million)
10.4 North America Allergic Rhinitis Drugs Size Estimation and Forecast by Country
10.5 North America Allergic Rhinitis Drugs Size Estimation and Forecast by Treatment Type
10.6 North America Allergic Rhinitis Drugs Size Estimation and Forecast by Disease Type
10.7 North America Allergic Rhinitis Drugs Size Estimation and Forecast by Drug
10.8 North America Allergic Rhinitis Drugs Size Estimation and Forecast by Route of Administration
10.9 North America Allergic Rhinitis Drugs Size Estimation and Forecast by Distribution Channel
10.10 U.S. Allergic Rhinitis Drugs Analysis
10.11 Canada Allergic Rhinitis Drugs Analysis
11 Europe Allergic Rhinitis Drugs Analysis
11.1 Key Findings
11.2 Europe Allergic Rhinitis Drugs Attractiveness Index
11.3 Europe Allergic Rhinitis Drugs by Country, 2024, 2029 & 2034 (US$ Million)
11.4 Europe Allergic Rhinitis Drugs Size Estimation and Forecast by Country
11.5 Europe Allergic Rhinitis Drugs Size Estimation and Forecast by Treatment Type
11.6 Europe Allergic Rhinitis Drugs Size Estimation and Forecast by Disease Type
11.7 Europe Allergic Rhinitis Drugs Size Estimation and Forecast by Drug Type
11.8 Europe Allergic Rhinitis Drugs Size Estimation and Forecast by Route of Administration
11.9 Europe Allergic Rhinitis Drugs Size Estimation and Forecast by Distribution Channel
11.10 Germany Allergic Rhinitis Drugs Analysis
11.11 France Allergic Rhinitis Drugs Analysis
11.12 UK Allergic Rhinitis Drugs Analysis
11.13 Italy Allergic Rhinitis Drugs Analysis
11.14 Spain Allergic Rhinitis Drugs Analysis
11.15 Russia Allergic Rhinitis Drugs Analysis
11.16 Poland Allergic Rhinitis Drugs Analysis
11.17 Belgium Allergic Rhinitis Drugs Analysis
11.18 Rest of Europe Allergic Rhinitis Drugs Analysis
12 Asia Pacific Allergic Rhinitis Drugs Analysis
12.1 Key Findings
12.2 Asia Pacific Allergic Rhinitis Drugs Attractiveness Index
12.3 Asia Pacific Allergic Rhinitis Drugs by Country, 2024, 2029 & 2034 (US$ Million)
12.4 Asia Pacific Allergic Rhinitis Drugs Size Estimation and Forecast by Country
12.5 Asia Pacific Allergic Rhinitis Drugs Size Estimation and Forecast by Treatment Type
12.6 Asia Pacific Allergic Rhinitis Drugs Size Estimation and Forecast by Disease Type
12.7 Asia Pacific Allergic Rhinitis Drugs Size Estimation and Forecast by Drug Type
12.8 Asia Pacific Allergic Rhinitis Drugs Size Estimation and Forecast by Route of Administration
12.9 Asia Pacific Allergic Rhinitis Drugs Size Estimation and Forecast by Distribution Channel
12.10 Japan Allergic Rhinitis Drugs Analysis
12.11 China Allergic Rhinitis Drugs Analysis
12.12 India Allergic Rhinitis Drugs Analysis
12.13 Australia Allergic Rhinitis Drugs Analysis
12.14 South Korea Allergic Rhinitis Drugs Analysis
12.15 Singapore Allergic Rhinitis Drugs Analysis
12.16 Taiwan Allergic Rhinitis Drugs Analysis
12.17 Rest of Asia Pacific Allergic Rhinitis Drugs Analysis
13 Latin America Allergic Rhinitis Drugs Analysis
13.1 Key Findings
13.2 Latin America Allergic Rhinitis Drugs Attractiveness Index
13.3 Latin America Allergic Rhinitis Drugs by Country, 2024, 2029 & 2034 (US$ Million)
13.4 Latin America Allergic Rhinitis Drugs Size Estimation and Forecast by Country
13.5 Latin America Allergic Rhinitis Drugs Size Estimation and Forecast by Treatment Type
13.6 Latin America Allergic Rhinitis Drugs Size Estimation and Forecast by Disease Type
13.7 Latin America Allergic Rhinitis Drugs Size Estimation and Forecast by Drug Type
13.8 Latin America Allergic Rhinitis Drugs Size Estimation and Forecast by Route of Administration
13.9 Latin America Allergic Rhinitis Drugs Size Estimation and Forecast by Distribution Channel
13.10 Brazil Allergic Rhinitis Drugs Analysis
13.11 Mexico Allergic Rhinitis Drugs Analysis
13.12 Argentina Allergic Rhinitis Drugs Analysis
13.13 Rest of Latin America Allergic Rhinitis Drugs Analysis
14 MEA Allergic Rhinitis Drugs Analysis
14.1 Key Findings
14.2 MEA Allergic Rhinitis Drugs Attractiveness Index
14.3 MEA Allergic Rhinitis Drugs by Country, 2024, 2029 & 2034 (US$ Million)
14.4 MEA Allergic Rhinitis Drugs Size Estimation and Forecast by Country
14.5 MEA Allergic Rhinitis Drugs Size Estimation and Forecast by Treatment Type
14.6 MEA Allergic Rhinitis Drugs Size Estimation and Forecast by Disease Type
14.7 MEA Allergic Rhinitis Drugs Size Estimation and Forecast by Drug Type
14.8 MEA Allergic Rhinitis Drugs Size Estimation and Forecast by Route of Administration
14.9 MEA Allergic Rhinitis Drugs Size Estimation and Forecast by Distribution Channel
14.10 GCC Allergic Rhinitis Drugs Analysis
14.11 South Africa Allergic Rhinitis Drugs Analysis
14.12 Rest of MEA Allergic Rhinitis Drugs Analysis
15 Company Profiles
15.1 Competitive Landscape, 2023
15.2 Strategic Outlook
15.3 Alcon
15.3.1 Company Snapshot
15.3.2 Company Overview
15.3.3 Financial Analysis
15.3.3.1 Net Revenue, 2017-2022
15.3.3.2 R&D, 2017-2022
15.3.3.3 Regional Market Shares, 2022
15.3.4 Product Benchmarking
15.3.5 Strategic Outlook
15.4 AstraZeneca
15.4.1 Company Snapshot
15.4.2 Company Overview
15.4.3 Financial Analysis
15.4.3.1 Net Revenue, 2017-2022
15.4.3.2 R&D, 2017-2022
15.4.3.3 Regional Market Shares, 2022
15.4.4 Product Benchmarking
15.4.5 Strategic Outlook
15.5 Bayer AG
15.5.1 Company Snapshot
15.5.2 Company Overview
15.5.3 Financial Analysis
15.5.3.1 Net Revenue, 2017-2022
15.5.3.2 R&D, 2017-2022
15.5.3.3 Regional Market Shares, 2022
15.5.4 Product Benchmarking
15.5.5 Strategic Outlook
15.6 Boehringer Ingelheim International GmbH
15.6.1 Company Snapshot
15.6.2 Company Overview
15.6.3 Financial Analysis
15.6.3.1 Net Revenue, 2017-2022
15.6.3.2 R&D, 2017-2022
15.6.3.3 Regional Market Shares, 2022
15.6.4 Product Benchmarking
15.7 Dr. Reddy’s Laboratories Ltd.
15.7.1 Company Snapshot
15.7.2 Company Overview
15.7.3 Financial Analysis
15.7.3.1 Net Revenue, 2017-2022
15.7.3.2 R&D, 2017-2022
15.7.3.3 Regional Market Shares, 2022
15.7.4 Product Benchmarking
15.7.5 Strategic Outlook
15.8 GSK plc
15.8.1 Company Snapshot
15.8.2 Company Overview
15.8.3 Financial Analysis
15.8.3.1 Net Revenue, 2017-2022
15.8.3.2 R&D, 2017-2022
15.8.3.3 Regional Market Shares, 2022
15.8.4 Product Benchmarking
15.8.5 Strategic Outlook
15.9 Johnson & Johnson Services, Inc.
15.9.1 Company Snapshot
15.9.2 Company Overview
15.9.3 Financial Analysis
15.9.3.1 Net Revenue, 2017-2022
15.9.3.2 R&D, 2017-2022
15.9.3.3 Regional Market Shares, 2022
15.9.4 Product Benchmarking
15.9.5 Strategic Outlook
15.10 Merck & Co., Inc.
15.10.1 Company Snapshot
15.10.2 Company Overview
15.10.3 Financial Analysis
15.10.3.1 Net Revenue, 2017-2022
15.10.3.2 R&D, 2017-2022
15.10.3.3 Regional Market Shares, 2022
15.10.4 Product Benchmarking
15.10.5 Strategic Outlook
15.11 Sanofi
15.11.1 Company Snapshot
15.11.2 Company Overview
15.11.3 Financial Analysis
15.11.3.1 Net Revenue, 2017-2022
15.11.3.2 R&D, 2017-2022
15.11.3.3 Regional Market Shares, 2022
15.11.4 Product Benchmarking
15.11.5 Strategic Outlook
15.12 Sun Pharmaceutical Industries Ltd.
15.12.1 Company Snapshot
15.12.2 Company Overview
15.12.3 Financial Analysis
15.12.3.1 Net Revenue, 2017-2022
15.12.3.2 R&D, 2017-2022
15.12.3.3 Regional Market Shares, 2022
15.12.4 Product Benchmarking
15.12.5 Strategic Outlook
15.13 Teva Pharmaceutical Industries Ltd.
15.13.1 Company Snapshot
15.13.2 Company Overview
15.13.3 Financial Analysis
15.13.3.1 Net Revenue, 2017-2022
15.13.3.2 R&D, 2017-2022
15.13.3.3 Regional Market Shares, 2022
15.13.4 Product Benchmarking
15.13.5 Strategic Outlook
16 Conclusion and Recommendations
16.1 Concluding Remarks from Visiongain
16.2 Recommendations for Market Players
ページTOPに戻る
List of Tables/Graphs
List of Tables
Table 1 Allergic Rhinitis Drugs Snapshot, 2024 & 2034 (US$ Million, CAGR %)
Table 2 Increasing Prevalence of Respiratory Disorders
Table 3 Allergic Rhinitis Drugs Forecast by Region, 2024-2034 (US$ Million, AGR%, CAGR%): “V” Shaped Recovery
Table 4 Allergic Rhinitis Drugs Forecast by Region, 2024-2034 (US$ Million, AGR%, CAGR%): “U” Shaped Recovery
Table 5 Allergic Rhinitis Drugs Forecast by Region, 2024-2034 (US$ Million, AGR%, CAGR%): “W” Shaped Recovery
Table 6 Allergic Rhinitis Drugs Forecast by Region, 2024-2034 (US$ Million, AGR%, CAGR%): “L” Shaped Recovery
Table 7 Allergic Rhinitis Drugs Forecast by Treatment Type, 2024-2034 (US$ Million, AGR%, CAGR %)
Table 8 Antihistamines Segment Market Forecast by Region, 2024-2034 (US$ Million, AGR%, CAGR %)
Table 9 Immunotherapy Segment Market Forecast by Region, 2024-2034 (US$ Million, AGR%, CAGR %)
Table 10 Subcutaneous Immunotherapy (SCIT) Segment Market Forecast by Region, 2024-2034 (US$ Million, AGR%, CAGR %)
Table 11 Sublingual Immunotherapy (SLIT) Segment Market Forecast by Region, 2024-2034 (US$ Million, AGR%, CAGR %)
Table 12 Corticosteroids Segment Market Forecast by Region, 2024-2034 (US$ Million, AGR%, CAGR %)
Table 13 Decongestants Segment Market Forecast by Region, 2024-2034 (US$ Million, AGR%, CAGR %)
Table 14 Others Segment Market Forecast by Region, 2024-2034 (US$ Million, AGR%, CAGR %)
Table 15 Allergic Rhinitis Drugs Forecast by Disease Type, 2024-2034 (US$ Million, AGR%, CAGR %)
Table 16 Seasonal Allergic Rhinitis Segment Market Forecast by Region, 2024-2034 (US$ Million, AGR%, CAGR%)
Table 17 Perennial Allergic Rhinitis Segment Market Forecast by Region, 2024-2034 (US$ Million, AGR%, CAGR %)
Table 18 Occupational Allergic Rhinitis Segment Market Forecast by Region, 2024-2034 (US$ Million, AGR%, CAGR%)
Table 19 Allergic Rhinitis Drugs Drug Type, 2024-2034 (US$ Million, AGR%, CAGR %)
Table 20 Prescription Market Forecast by Region, 2024-2034 (US$ Million, AGR%, CAGR %)
Table 21 OTC Market Forecast by Region, 2024-2034 (US$ Million, AGR%, CAGR %)
Table 22 Allergic Rhinitis Drugs by Route of Administration 2024-2034 (US$ Million, AGR%, CAGR%)
Table 23 Oral Market Forecast by Region, 2024-2034 (US$ Million, AGR%, CAGR%)
Table 24 Nasal Market Forecast by Region, 2024-2034 (US$ Million, AGR%, CAGR %)
Table 25 Intraocular Market Forecast by Region, 2024-2034 (US$ Million, AGR%, CAGR%)
Table 26 Intravenous Market Forecast by Region, 2024-2034 (US$ Million, AGR%, CAGR%)
Table 27 Allergic Rhinitis Drugs Distribution Channel, 2024-2034 (US$ Million, AGR%, CAGR%)
Table 28 Retail Pharmacies Market Forecast by Region, 2024-2034 (US$ Million, AGR%, CAGR%)
Table 29 Hospital Pharmacies Market Forecast by Region, 2024-2034 (US$ Million, AGR%, CAGR %)
Table 30 Online Channels Market Forecast by Region, 2024-2034 (US$ Million, AGR%, CAGR%)
Table 31 Allergic Rhinitis Drugs Forecast by Region, 2024-2034 (US$ Million, AGR%, CAGR %)
Table 32 North America Allergic Rhinitis Drugs Forecast by Country, 2024-2034 (US$ Million, AGR%, CAGR %)
Table 33 North America Allergic Rhinitis Drugs Forecast by Treatment Type, 2024-2034 (US$ Million, AGR%, CAGR %)
Table 34 North America Allergic Rhinitis Drugs Forecast by Disease Type, 2024-2034 (US$ Million, AGR%, CAGR%)
Table 35 Allergic Rhinitis Drug, 2024-2034 (US$ Million, AGR%, CAGR%)
Table 36 North America Allergic Rhinitis Drugs by Route of Administration, 2024-2034 (US$ Million, AGR%, CAGR%)
Table 37 North America Allergic Rhinitis Drugs by Distribution Channel, 2024-2034 (US$ Million, AGR%, CAGR%)
Table 38 U.S. Allergic Rhinitis Drugs Forecast, 2024-2034 (US$ Million, AGR%, CAGR%)
Table 39 Canada Allergic Rhinitis Drugs Forecast, 2024-2034 (US$ Million, AGR%, CAGR %)
Table 40 Europe Allergic Rhinitis Drugs Forecast by Country, 2024-2034 (US$ Million, AGR%, CAGR%)
Table 41 Europe Allergic Rhinitis Drugs Forecast by Treatment Type, 2024-2034 (US$ Million, AGR%, CAGR %)
Table 42 North America Allergic Rhinitis Drugs Forecast by Disease Type, 2024-2034 (US$ Million, AGR%, CAGR%)
Table 43 Allergic Rhinitis Drugs by Drug Type, 2024-2034 (US$ Million, AGR%, CAGR%)
Table 44 North America Allergic Rhinitis Drugs by Route of Administration, 2024-2034 (US$ Million, AGR%, CAGR%)
Table 45 North America Allergic Rhinitis Drugs by Distribution Channel, 2024-2034 (US$ Million, AGR%, CAGR%)
Table 46 Germany Allergic Rhinitis Drugs Forecast, 2024-2034 (US$ Million, AGR%, CAGR %)
Table 47 France Allergic Rhinitis Drugs Forecast, 2024-2034 (US$ Million, AGR%, CAGR %)
Table 48 UK Allergic Rhinitis Drugs Forecast, 2024-2034 (US$ Million, AGR%, CAGR%)
Table 49 Italy Allergic Rhinitis Drugs Forecast, 2024-2034 (US$ Million, AGR%, CAGR %)
Table 50 Spain Allergic Rhinitis Drugs Forecast, 2024-2034 (US$ Million, AGR%, CAGR %)
Table 51 Russia Allergic Rhinitis Drugs Forecast, 2024-2034 (US$ Million, AGR%, CAGR%)
Table 52 Poland Allergic Rhinitis Drugs Forecast, 2024-2034 (US$ Million, AGR%, CAGR%)
Table 53 Belgium Allergic Rhinitis Drugs Forecast, 2024-2034 (US$ Million, AGR%, CAGR%)
Table 54 Rest of Europe Allergic Rhinitis Drugs Forecast, 2024-2034 (US$ Million, AGR%, CAGR%)
Table 55 Asia Pacific Allergic Rhinitis Drugs Forecast by Country, 2024-2034 (US$ Million, AGR%, CAGR%)
Table 56 Allergic Rhinitis Drugs Forecast by Treatment Type, 2024-2034 (US$ Million, AGR%, CAGR %)
Table 57 North America Allergic Rhinitis Drugs Forecast by Disease Type, 2024-2034 (US$ Million, AGR%, CAGR%)
Table 58 Allergic Rhinitis Drugs by Drug Type, 2024-2034 (US$ Million, AGR%, CAGR%)
Table 59 North America Allergic Rhinitis Drugs by Route of Administration, 2024-2034 (US$ Million, AGR%, CAGR%)
Table 60 North America Allergic Rhinitis Drugs by Distribution Channel, 2024-2034 (US$ Million, AGR%, CAGR%)
Table 61 Japan Allergic Rhinitis Drugs Forecast, 2024-2034 (US$ Million, AGR%, CAGR%)
Table 62 China Allergic Rhinitis Drugs Forecast, 2024-2034 (US$ Million, AGR%, CAGR%)
Table 63 India Allergic Rhinitis Drugs Forecast, 2024-2034 (US$ Million, AGR%, CAGR %)
Table 64 Australia Allergic Rhinitis Drugs Forecast, 2024-2034 (US$ Million, AGR%, CAGR %)
Table 65 South Korea Allergic Rhinitis Drugs Forecast, 2024-2034 (US$ Million, AGR%, CAGR%)
Table 66 Singapore Allergic Rhinitis Drugs Forecast, 2024-2034 (US$ Million, AGR%, CAGR %)
Table 67 Taiwan Allergic Rhinitis Drugs Forecast, 2024-2034 (US$ Million, AGR%, CAGR%)
Table 68 Rest of Asia Pacific Allergic Rhinitis Drugs Forecast, 2024-2034 (US$ Million, AGR%, CAGR %)
Table 69 Latin America Allergic Rhinitis Drugs Forecast by Country, 2024-2034 (US$ Million, AGR%, CAGR%)
Table 70 Allergic Rhinitis Drugs Forecast by Treatment Type, 2024-2034 (US$ Million, AGR%, CAGR %)
Table 71 North America Allergic Rhinitis Drugs Forecast by Disease Type, 2024-2034 (US$ Million, AGR%, CAGR%)
Table 72 Allergic Rhinitis Drugs by Drug Type, 2024-2034 (US$ Million, AGR%, CAGR%)
Table 73 North America Allergic Rhinitis Drugs by Route of Administration, 2024-2034 (US$ Million, AGR%, CAGR%)
Table 74 North America Allergic Rhinitis Drugs by Distribution Channel, 2024-2034 (US$ Million, AGR%, CAGR%)
Table 75 Brazil Allergic Rhinitis Drugs Forecast, 2024-2034 (US$ Million, AGR%, CAGR %)
Table 76 Mexico Allergic Rhinitis Drugs Forecast, 2024-2034 (US$ Million, AGR%, CAGR%)
Table 77 Argentina Allergic Rhinitis Drugs Forecast, 2024-2034 (US$ Million, AGR%, CAGR%)
Table 78 Rest of Latin America Allergic Rhinitis Drugs Forecast, 2024-2034 (US$ Million, AGR%, CAGR%)
Table 79 MEA Allergic Rhinitis Drugs Forecast by Country, 2024-2034 (US$ Million, AGR%, CAGR%)
Table 80 Allergic Rhinitis Drugs Forecast by Treatment Type, 2024-2034 (US$ Million, AGR%, CAGR %)
Table 81 North America Allergic Rhinitis Drugs Forecast by Disease Type, 2024-2034 (US$ Million, AGR%, CAGR%)
Table 82 Allergic Rhinitis Drugs by Drug Type, 2024-2034 (US$ Million, AGR%, CAGR%)
Table 83 North America Allergic Rhinitis Drugs by Route of Administration, 2024-2034 (US$ Million, AGR%, CAGR%)
Table 84 North America Allergic Rhinitis Drugs by Distribution Channel, 2024-2034 (US$ Million, AGR%, CAGR%)
Table 85 GCC Allergic Rhinitis Drugs Forecast, 2024-2034 (US$ Million, AGR%, CAGR%)
Table 86 South Africa Allergic Rhinitis Drugs Forecast, 2024-2034 (US$ Million, AGR%, CAGR%)
Table 87 Rest of MEA Allergic Rhinitis Drugs Forecast, 2024-2034 (US$ Million, AGR%, CAGR %)
Table 88 Strategic Outlook
Table 89 Alcon: Key Details, (CEO, HQ, Revenue, Founded, No. of Employees, Company Type, Website, Business Segment)
Table 90 Alcon: Product Benchmarking
Table 91 Alcon: Strategic Outlook
Table 92 AstraZeneca: Key Details, (CEO, HQ, Revenue, Founded, No. of Employees, Company Type, Website, Business Segment)
Table 93 AstraZeneca: Product Benchmarking
Table 94 AstraZeneca: Strategic Outlook
Table 95 Bayer AG: Key Details, (CEO, HQ, Revenue, Founded, No. of Employees, Company Type, Website, Business Segment)
Table 96 Bayer AG: Product Benchmarking
Table 97 Bayer AG: Strategic Outlook
Table 98 Boehringer Ingelheim International GmbH: Key Details, (CEO, HQ, Revenue, Founded, No. of Employees, Company Type, Website, Business Segment)
Table 99 Boehringer Ingelheim International GmbH: Product Benchmarking
Table 100 Dr. Reddy’s Laboratories Ltd: Key Details, (CEO, HQ, Revenue, Founded, No. of Employees, Company Type, Website, Business Segment)
Table 101 Dr. Reddy’s Laboratories Ltd: Product Benchmarking
Table 102 Dr. Reddy’s Laboratories Ltd: Strategic Outlook
Table 103 GSK plc: Key Details, (CEO, HQ, Revenue, Founded, No. of Employees, Company Type, Website, Business Segment)
Table 104 GSK plc: Product Benchmarking
Table 105 GSK plc: Strategic Outlook
Table 106 Johnson & Johnson Services, Inc.: Key Details, (CEO, HQ, Revenue, Founded, No. of Employees, Company Type, Website, Business Segment)
Table 107 Johnson & Johnson Services, Inc.: Product Benchmarking
Table 108 Johnson & Johnson Services, Inc.: Strategic Outlook
Table 109 Merck & Co., Inc.: Key Details, (CEO, HQ, Revenue, Founded, No. of Employees, Company Type, Website, Business Segment)
Table 110 Merck & Co., Inc.: Product Benchmarking
Table 111 Merck & Co., Inc.: Strategic Outlook
Table 112 Sanofi: Key Details, (CEO, HQ, Revenue, Founded, No. of Employees, Company Type, Website, Business Segment)
Table 113 Sanofi: Product Benchmarking
Table 114 Sanofi: Strategic Outlook
Table 115 Sun Pharmaceutical Industries Ltd.: Key Details, (CEO, HQ, Revenue, Founded, No. of Employees, Company Type, Website, Business Segment)
Table 116 Sun Pharmaceutical Industries Ltd.: Product Benchmarking
Table 117 Sun Pharmaceutical Industries Ltd.: Strategic Outlook
Table 118 Teva Pharmaceutical Industries Ltd.: Key Details, (CEO, HQ, Revenue, Founded, No. of Employees, Company Type, Website, Business Segment)
Table 119 Teva Pharmaceutical Industries Ltd.: Product Benchmarking
Table 120 Teva Pharmaceutical Industries Ltd.: Strategic Outlook
List of Figures
Figure 1 Allergic Rhinitis Drugs Segmentation
Figure 2 Allergic Rhinitis Drugs Market by Treatment Type: Market Attractiveness Index
Figure 3 Allergic Rhinitis Drugs by Disease Type: Market Attractiveness Index
Figure 4 Allergic Rhinitis Drugs by Drug Type: Market Attractiveness Index
Figure 5 Allergic Rhinitis Drugs by Route of Administration: Market Attractiveness Index
Figure 6 Allergic Rhinitis Drugs by Distribution Channel: Market Attractiveness Index
Figure 7 Allergic Rhinitis Drugs Attractiveness Index by Region
Figure 8 Allergic Rhinitis Drugs: Market Dynamics
Figure 9 Allergic Rhinitis Drugs by Region, 2024-2034 (US$ Million, AGR %): “V” Shaped Recovery
Figure 10 Allergic Rhinitis Drugs by Region, 2024-2034 (US$ Million, AGR %): “U” Shaped Recovery
Figure 11 Allergic Rhinitis Drugs by Region, 2024-2034 (US$ Million, AGR %): “W” Shaped Recovery
Figure 12 Allergic Rhinitis Drugs by Region, 2024-2034 (US$ Million, AGR %): “L” Shaped Recovery
Figure 13 Allergic Rhinitis Drugs Market: Porter’s Five Forces Analysis
Figure 14 Allergic Rhinitis Drugs: PEST Analysis
Figure 15 Allergic Rhinitis Drugs by Treatment Type: Market Attractiveness Index
Figure 16 Allergic Rhinitis Drugs Forecast by Treatment Type, 2024-2034 (US$ Million, AGR %)
Figure 17 Allergic Rhinitis Drugs Share Forecast by Treatment Type, 2024, 2029, 2034 (%)
Figure 18 Antihistamines Segment Market Forecast by Region, 2024-2034 (US$ Million, AGR %)
Figure 19 Antihistamines Segment Market Share Forecast by Region, 2024 & 2034 (%)
Figure 20 Immunotherapy Segment Market Forecast by Region, 2024-2034 (US$ Million, AGR %)
Figure 21 Immunotherapy Segment Market Share Forecast by Region, 2024 & 2034 (%)
Figure 22 Subcutaneous Immunotherapy (SCIT) Segment Market Forecast by Region, 2024-2034 (US$ Million, AGR %)
Figure 23 Subcutaneous Immunotherapy (SCIT) Segment Market Share Forecast by Region, 2024 & 2034 (%)
Figure 24 Sublingual Immunotherapy (SLIT) Segment Market Forecast by Region, 2024-2034 (US$ Million, AGR %)
Figure 25 Sublingual Immunotherapy (SLIT) Segment Market Share Forecast by Region, 2024 & 2034 (%)
Figure 26 Corticosteroids Segment Market Forecast by Region, 2024-2034 (US$ Million, AGR %)
Figure 27 Corticosteroids Segment Market Share Forecast by Region, 2024 & 2034 (%)
Figure 28 Decongestants Segment Market Forecast by Region, 2024-2034 (US$ Million, AGR %)
Figure 29 Decongestants Segment Market Share Forecast by Region, 2024 & 2034 (%)
Figure 30 Others Segment Market Forecast by Region, 2024-2034 (US$ Million, AGR %)
Figure 31 Others Segment Market Share Forecast by Region, 2024 & 2034 (%)
Figure 32 Allergic Rhinitis Drugs by Disease Type: Market Attractiveness Index
Figure 33 Allergic Rhinitis Drugs Forecast by Disease Type, 2024-2034 (US$ Million, AGR %)
Figure 34 Allergic Rhinitis Drugs Share Forecast by Disease Type, 2024, 2029, 2034 (%)
Figure 35 Seasonal Allergic Rhinitis Segment Market Forecast by Region, 2024-2034 (US$ Million, AGR %)
Figure 36 Seasonal Allergic Rhinitis Segment Market Share Forecast by Region, 2024 & 2034 (%)
Figure 37 Perennial Allergic Rhinitis Segment Market Forecast by Region, 2024-2034 (US$ Million, AGR %)
Figure 38 Perennial Allergic Rhinitis Segment Market Share Forecast by Region, 2024 & 2034 (%)
Figure 39 Occupational Allergic Rhinitis Segment Market Forecast by Region, 2024-2034 (US$ Million, AGR %)
Figure 40 Occupational Allergic Rhinitis Segment Market Share Forecast by Region, 2024 & 2034 (%)
Figure 41 Allergic Rhinitis Drugs by Drug Type: Market Attractiveness Index
Figure 42 Allergic Rhinitis Drugs Forecast by Drug Type, 2024-2034 (US$ Million, AGR %)
Figure 43 Allergic Rhinitis Drugs Share Forecast by Drug Type, 2024, 2029, 2034 (%)
Figure 44 Prescription Segment Market Forecast by Region, 2024-2034 (US$ Million, AGR %)
Figure 45 Prescription Segment Market Share Forecast by Region, 2024 & 2034 (%)
Figure 46 OTC Market Forecast by Region, 2024-2034 (US$ Million, AGR %)
Figure 47 OTC Market Share Forecast by Region, 2024 & 2034 (%)
Figure 48 Allergic Rhinitis Drugs by Route of Administration: Market Attractiveness Index
Figure 49 Allergic Rhinitis Drugs Forecast by Route of Admistration 2024-2034 (US$ Million, AGR %)
Figure 50 Allergic Rhinitis Drugs Market Share Forecast by Route of Administration, 2024, 2029, 2034 (%)
Figure 51 Oral Market Forecast by Region, 2024-2034 (US$ Million, AGR %)
Figure 52 Oral Market Share Forecast by Region, 2024 & 2034 (%)
Figure 53 Nasal Market Forecast by Region, 2024-2034 (US$ Million, AGR %)
Figure 54 Nasal Market Share Forecast by Region, 2024 & 2034 (%)
Figure 55 Intraocular Market Forecast by Region, 2024-2034 (US$ Million, AGR %)
Figure 56 Intraocular Market Share Forecast by Region, 2024 & 2034 (%)
Figure 57 Intravenous Market Forecast by Region, 2024-2034 (US$ Million, AGR %)
Figure 58 Intravenous Segment Market Share Forecast by Region, 2024 & 2034 (%)
Figure 59 Allergic Rhinitis Drugs by Distribution Channel: Market Attractiveness Index
Figure 60 Allergic Rhinitis Drugs Forecast by Distribution Channel, 2024-2034 (US$ Million, AGR %)
Figure 61 Allergic Rhinitis Drugs Market Share Forecast by Distribution Channel, 2024, 2029, 2034 (%)
Figure 62 Retail Pharmacies Segment Market Forecast by Region, 2024-2034 (US$ Million, AGR %)
Figure 63 Retail Pharmacies Segment Market Share Forecast by Region, 2024 & 2034 (%)
Figure 64 Hospital Pharmacies Market Forecast by Region, 2024-2034 (US$ Million, AGR %)
Figure 65 Retail Pharmacies Market Share Forecast by Region, 2024 & 2034 (%)
Figure 66 Online Channels Segment Market Forecast by Region, 2024-2034 (US$ Million, AGR %)
Figure 67 Online Channels Segment Market Share Forecast by Region, 2024 & 2034 (%)
Figure 68 Allergic Rhinitis Drugs Forecast by Region 2023 and 2033 (Revenue, CAGR %)
Figure 69 Allergic Rhinitis Drugs Market Share Forecast by Region 2024, 2029, 2034 (%)
Figure 70 Allergic Rhinitis Drugs by Region, 2024-2034 (US$ Million, AGR %)
Figure 71 North America Allergic Rhinitis Drugs Attractiveness Index
Figure 72 North America Allergic Rhinitis Drugs by Region, 2024, 2029 & 2034 (US$ Million)
Figure 73 North America Allergic Rhinitis Drugs Forecast by Country, 2024-2034 (US$ Million, AGR %)
Figure 74 North America Allergic Rhinitis Drugs Share Forecast by Country, 2024 & 2034 (%)
Figure 75 North America Allergic Rhinitis Drugs Forecast by Treatment Type, 2024-2034 (US$ Million, AGR %)
Figure 76 North America Allergic Rhinitis Drugs Share Forecast by Treatment Type, 2024 & 2034 (%)
Figure 77 North America Allergic Rhinitis Drugs Forecast by Disease Type, 2024-2034 (US$ Million, AGR %)
Figure 78 North America Allergic Rhinitis Drugs Share Forecast by Disease Type, 2024 & 2034 (%)
Figure 79 North America Allergic Rhinitis Drugs Forecast by Drug, 2024-2034 (US$ Million, AGR %)
Figure 80 North America Allergic Rhinitis Drugs Share Forecast by Drug, 2024 & 2034 (%)
Figure 81 North America Allergic Rhinitis Drugs Forecast by Route of Administration, 2024-2034 (US$ Million, AGR %)
Figure 82 North America Allergic Rhinitis Drugs Share Forecast by Route of Administration, 2024 & 2034 (%)
Figure 83 North America Allergic Rhinitis Drugs Forecast by Distribution Channel, 2024-2034 (US$ Million, AGR %)
Figure 84 North America Allergic Rhinitis Drugs Share Forecast by Distribution Channel, 2024 & 2034 (%)
Figure 85 U.S. Allergic Rhinitis Drugs Forecast, 2024-2034 (US$ Million, AGR %)
Figure 86 Canada Allergic Rhinitis Drugs Forecast, 2024-2034 (US$ Million, AGR %)
Figure 87 Europe Allergic Rhinitis Drugs Attractiveness Index
Figure 88 Europe Allergic Rhinitis Drugs by Region, 2024, 2029 & 2034 (US$ Million)
Figure 89 Europe Allergic Rhinitis Drugs Forecast by Country, 2024-2034 (US$ Million, AGR %)
Figure 90 Europe Allergic Rhinitis Drugs Share Forecast by Country, 2024 & 2034 (%)
Figure 91 Europe Allergic Rhinitis Drugs Forecast by Treatment Type, 2024-2034 (US$ Million, AGR %)
Figure 92 Europe Allergic Rhinitis Drugs Share Forecast by Treatment Type, 2024 & 2034 (%)
Figure 93 Europe Allergic Rhinitis Drugs Forecast by Disease Type, 2024-2034 (US$ Million, AGR %)
Figure 94 Europe Allergic Rhinitis Drugs Share Forecast by Disease Type, 2024 & 2034 (%)
Figure 95 Europe Allergic Rhinitis Drugs Forecast by Drug Type, 2024-2034 (US$ Million, AGR %)
Figure 96 Europe Allergic Rhinitis Drugs Share Forecast by Drug Type, 2024 & 2034 (%)
Figure 97 Europe Allergic Rhinitis Drugs Forecast by Route of Administration, 2024-2034 (US$ Million, AGR %)
Figure 98 Europe Allergic Rhinitis Drugs Share Forecast by Route of Administration, 2024 & 2034 (%)
Figure 99 Europe Allergic Rhinitis Drugs Forecast by Distribution Channel, 2024-2034 (US$ Million, AGR %)
Figure 100 Europe Allergic Rhinitis Drugs Share Forecast by Distribution Channel, 2024 & 2034 (%)
Figure 101 Germany Allergic Rhinitis Drugs Forecast, 2024-2034 (US$ Million, AGR %)
Figure 102 France Allergic Rhinitis Drugs Forecast, 2024-2034 (US$ Million, AGR %)
Figure 103 UK Allergic Rhinitis Drugs Forecast, 2024-2034 (US$ Million, AGR %)
Figure 104 Italy Allergic Rhinitis Drugs Forecast, 2024-2034 (US$ Million, AGR %)
Figure 105 Spain Allergic Rhinitis Drugs Forecast, 2024-2034 (US$ Million, AGR %)
Figure 106 Russia Allergic Rhinitis Drugs Forecast, 2024-2034 (US$ Million, AGR %)
Figure 107 Poland Allergic Rhinitis Drugs Forecast, 2024-2034 (US$ Million, AGR %)
Figure 108 Belgium Allergic Rhinitis Drugs Forecast, 2024-2034 (US$ Million, AGR %)
Figure 109 Rest of Europe Allergic Rhinitis Drugs Forecast, 2024-2034 (US$ Million, AGR %)
Figure 110 Asia Pacific Allergic Rhinitis Drugs Attractiveness Index
Figure 111 Asia Pacific Allergic Rhinitis Drugs by Region, 2024, 2029 & 2034 (US$ Million)
Figure 112 Asia Pacific Allergic Rhinitis Drugs Forecast by Country, 2024-2034 (US$ Million, AGR %)
Figure 113 Asia Pacific Allergic Rhinitis Drugs Share Forecast by Country, 2024 & 2034 (%)
Figure 114 Asia Pacific Allergic Rhinitis Drugs Forecast by Treatment Type, 2024-2034 (US$ Million, AGR %)
Figure 115 Asia Pacific Allergic Rhinitis Drugs Share Forecast by Treatment Type, 2024 & 2034 (%)
Figure 116 Asia Pacific Allergic Rhinitis Drugs Forecast by Disease Type, 2024-2034 (US$ Million, AGR %)
Figure 117 Asia Pacific Allergic Rhinitis Drugs Share Forecast by Disease Type, 2024 & 2034 (%)
Figure 118 Asia Pacific Allergic Rhinitis Drugs Forecast by Drug Type, 2024-2034 (US$ Million, AGR %)
Figure 119 Asia Pacific Allergic Rhinitis Drugs Share Forecast by Drug Type, 2024 & 2034 (%)
Figure 120 Asia Pacific Allergic Rhinitis Drugs Forecast by Route of Administration, 2024-2034 (US$ Million, AGR %)
Figure 121 Asia Pacific Allergic Rhinitis Drugs Share Forecast by Route of Administration, 2024 & 2034 (%)
Figure 122 Asia Pacific Allergic Rhinitis Drugs Forecast by Distribution Channel, 2024-2034 (US$ Million, AGR %)
Figure 123 Asia Pacific Allergic Rhinitis Drugs Share Forecast by Distribution Channel, 2024 & 2034 (%)
Figure 124 Japan Allergic Rhinitis Drugs Forecast, 2024-2034 (US$ Million, AGR %)
Figure 125 China Allergic Rhinitis Drugs Forecast, 2024-2034 (US$ Million, AGR %)
Figure 126 India Allergic Rhinitis Drugs Forecast, 2024-2034 (US$ Million, AGR %)
Figure 127 Australia Allergic Rhinitis Drugs Forecast, 2024-2034 (US$ Million, AGR %)
Figure 128 South Korea Allergic Rhinitis Drugs Forecast, 2024-2034 (US$ Million, AGR %)
Figure 129 Singapore Allergic Rhinitis Drugs Forecast, 2024-2034 (US$ Million, AGR %)
Figure 130 Taiwan Allergic Rhinitis Drugs Forecast, 2024-2034 (US$ Million, AGR %)
Figure 131 Rest of Asia Pacific Allergic Rhinitis Drugs Forecast, 2024-2034 (US$ Million, AGR %)
Figure 132 Latin America Allergic Rhinitis Drugs Attractiveness Index
Figure 133 Latin America Allergic Rhinitis Drugs by Region, 2024, 2029 & 2034 (US$ Million)
Figure 134 Latin America Allergic Rhinitis Drugs Forecast by Country, 2024-2034 (US$ Million, AGR %)
Figure 135 Latin America Allergic Rhinitis Drugs Share Forecast by Country, 2024 & 2034 (%)
Figure 136 Latin America Allergic Rhinitis Drugs Forecast by Treatment Type, 2024-2034 (US$ Million, AGR %)
Figure 137 Latin America Allergic Rhinitis Drugs Share Forecast by Treatment Type, 2024 & 2034 (%)
Figure 138 Latin America Allergic Rhinitis Drugs Forecast by Disease Type, 2024-2034 (US$ Million, AGR %)
Figure 139 Latin America Allergic Rhinitis Drugs Share Forecast by Disease Type, 2024 & 2034 (%)
Figure 140 Latin America Allergic Rhinitis Drugs Forecast by Drug Type, 2024-2034 (US$ Million, AGR %)
Figure 141 Latin America Allergic Rhinitis Drugs Share Forecast by Drug Type, 2024 & 2034 (%)
Figure 142 Latin America Allergic Rhinitis Drugs Forecast by Route of Administration, 2024-2034 (US$ Million, AGR %)
Figure 143 Latin America Allergic Rhinitis Drugs Share Forecast by Route of Administration, 2024 & 2034 (%)
Figure 144 Latin America Allergic Rhinitis Drugs Forecast by Distribution Channel, 2024-2034 (US$ Million, AGR %)
Figure 145 Latin America Allergic Rhinitis Drugs Share Forecast by Distribution Channel, 2024 & 2034 (%)
Figure 146 Brazil Allergic Rhinitis Drugs Forecast, 2024-2034 (US$ Million, AGR %)
Figure 147 Mexico Allergic Rhinitis Drugs Forecast, 2024-2034 (US$ Million, AGR %)
Figure 148 Argentina Allergic Rhinitis Drugs Forecast, 2024-2034 (US$ Million, AGR %)
Figure 149 Rest of Latin America Allergic Rhinitis Drugs Forecast, 2024-2034 (US$ Million, AGR %)
Figure 150 MEA Allergic Rhinitis Drugs Attractiveness Index
Figure 151 MEA Allergic Rhinitis Drugs by Region, 2024, 2029 & 2034 (US$ Million)
Figure 152 MEA Allergic Rhinitis Drugs Forecast by Country, 2024-2034 (US$ Million, AGR %)
Figure 153 MEA Allergic Rhinitis Drugs Share Forecast by Country, 2024 & 2034 (%)
Figure 154 MEA Allergic Rhinitis Drugs Forecast by Treatment Type, 2024-2034 (US$ Million, AGR %)
Figure 155 MEA Allergic Rhinitis Drugs Share Forecast by Treatment Type, 2024 & 2034 (%)
Figure 156 MEA Allergic Rhinitis Drugs Forecast by Disease Type, 2024-2034 (US$ Million, AGR %)
Figure 157 MEA Allergic Rhinitis Drugs Share Forecast by Disease Type, 2024 & 2034 (%)
Figure 158 MEA Allergic Rhinitis Drugs Forecast by Drug Type, 2024-2034 (US$ Million, AGR %)
Figure 159 MEA Allergic Rhinitis Drugs Share Forecast by Drug Type, 2024 & 2034 (%)
Figure 160 MEA Allergic Rhinitis Drugs Forecast by Route of Administration, 2024-2034 (US$ Million, AGR %)
Figure 161 MEA Allergic Rhinitis Drugs Share Forecast by Route of Administration, 2024 & 2034 (%)
Figure 162 MEA Allergic Rhinitis Drugs Forecast by Distribution Channel, 2024-2034 (US$ Million, AGR %)
Figure 163 MEA Allergic Rhinitis Drugs Share Forecast by Distribution Channel, 2024 & 2034 (%)
Figure 164 GCC Allergic Rhinitis Drugs Forecast, 2024-2034 (US$ Million, AGR %)
Figure 165 South Africa Allergic Rhinitis Drugs Forecast, 2024-2034 (US$ Million, AGR %)
Figure 166 Rest of MEA Allergic Rhinitis Drugs Forecast, 2024-2034 (US$ Million, AGR %)
Figure 167 Allergic Rhinitis Drugs Market: Company Share, 2023
Figure 168 Alcon: Net Revenue, 2017-2022 (US$ Million, AGR %)
Figure 169 Alcon: R&D, 2017-2022 (US$ Million, AGR%)
Figure 170 Alcon: Regional Market Shares, 2022
Figure 171 AstraZeneca: Net Revenue, 2017-2022 (US$ Million, AGR %)
Figure 172 AstraZeneca: R&D, 2017-2022 (US$ Million, AGR%)
Figure 173 AstraZeneca: Regional Market Shares, 2022
Figure 174 Bayer AG: Net Revenue, 2017-2022 (US$ Million, AGR %)
Figure 175 Bayer AG: R&D, 2017-2022 (US$ Million, AGR%)
Figure 176 Bayer AG: Regional Market Shares, 2022
Figure 177 Boehringer Ingelheim International GmbH: Net Revenue, 2017-2022 (US$ Million, AGR %)
Figure 178 Boehringer Ingelheim International GmbH: R&D, 2017-2022 (US$ Million, AGR%)
Figure 179 Boehringer Ingelheim International GmbH: Regional Market Shares, 2022
Figure 180 Dr. Reddy’s Laboratories Ltd: Net Revenue, 2017-2022 (US$ Million, AGR%)
Figure 181 Dr. Reddy’s Laboratories Ltd: R&D, 2017-2022 (US$ Million, AGR%)
Figure 182 Dr. Reddy’s Laboratories Ltd: Regional Market Shares, 2022
Figure 183 GSK plc: Net Revenue, 2017-2022 (US$ Million, AGR%)
Figure 184 GSK plc: R&D, 2017-2022 (US$ Million, AGR%)
Figure 185 GSK plc: Regional Market Shares, 2022
Figure 186 Johnson & Johnson Services, Inc.: Net Revenue, 2017-2022 (US$ Million, AGR%)
Figure 187 Johnson & Johnson Services, Inc.: R&D, 2017-2022 (US$ Million, AGR%)
Figure 188 Johnson & Johnson Services, Inc.: Regional Market Shares, 2022
Figure 189 Merck & Co., Inc.: Net Revenue, 2017-2022 (US$ Million, AGR %)
Figure 190 Merck & Co., Inc.: R&D, 2017-2022 (US$ Million, AGR %)
Figure 191 Merck & Co., Inc.: Regional Market Shares, 2022
Figure 192 Sanofi: Net Revenue, 2017-2022 (US$ Million, AGR%)
Figure 193 Sanofi: R&D, 2017-2022 (US$ Million, AGR%)
Figure 194 Sanofi: Regional Market Shares, 2022
Figure 195 Sun Pharmaceutical Industries Ltd.: Net Revenue, 2017-2022 (US$ Million, AGR %)
Figure 196 Sun Pharmaceutical Industries Ltd.: R&D, 2017-2022 (US$ Million, AGR%)
Figure 197 Sun Pharmaceutical Industries Ltd.: Regional Market Shares, 2022
Figure 198 Teva Pharmaceutical Industries Ltd.: Net Revenue, 2017-2022 (US$ Million, AGR %)
Figure 199 Teva Pharmaceutical Industries Ltd.: R&D, 2017-2022 (US$ Million, AGR%)
Figure 200 Teva Pharmaceutical Industries Ltd.: Regional Market Shares, 2022
ページTOPに戻る
- 本レポートと同じKEY WORDの最新刊レポートはありません。
よくあるご質問
Visiongain社はどのような調査会社ですか?
英国の調査会社ヴィジョンゲイン社(Visiongain)は、通信とエネルギーのほか、自動車や化学・医薬品、金属など、広範な市場を対象に調査を行っています。自動車市場については、市場全般に関する調査のほ... もっと見る
調査レポートの納品までの日数はどの程度ですか?
在庫のあるものは速納となりますが、平均的には 3-4日と見て下さい。
但し、一部の調査レポートでは、発注を受けた段階で内容更新をして納品をする場合もあります。
発注をする前のお問合せをお願いします。
注文の手続きはどのようになっていますか?
1)お客様からの御問い合わせをいただきます。
2)見積書やサンプルの提示をいたします。
3)お客様指定、もしくは弊社の発注書をメール添付にて発送してください。
4)データリソース社からレポート発行元の調査会社へ納品手配します。
5) 調査会社からお客様へ納品されます。最近は、pdfにてのメール納品が大半です。
お支払方法の方法はどのようになっていますか?
納品と同時にデータリソース社よりお客様へ請求書(必要に応じて納品書も)を発送いたします。
お客様よりデータリソース社へ(通常は円払い)の御振り込みをお願いします。
請求書は、納品日の日付で発行しますので、翌月最終営業日までの当社指定口座への振込みをお願いします。振込み手数料は御社負担にてお願いします。
お客様の御支払い条件が60日以上の場合は御相談ください。
尚、初めてのお取引先や個人の場合、前払いをお願いすることもあります。ご了承のほど、お願いします。
データリソース社はどのような会社ですか?
当社は、世界各国の主要調査会社・レポート出版社と提携し、世界各国の市場調査レポートや技術動向レポートなどを日本国内の企業・公官庁及び教育研究機関に提供しております。
世界各国の「市場・技術・法規制などの」実情を調査・収集される時には、データリソース社にご相談ください。
お客様の御要望にあったデータや情報を抽出する為のレポート紹介や調査のアドバイスも致します。
|
|

